
Geomechanical Characterization of the Rock Mass along a Deep Vertical Borehole


Department of Civil Engineering, University of Salerno, Via Giovanni Paolo II, 132, 84084 Fisciano, SA, Italy
Geotechnics 2024, 4(1), 209-228; https://doi.org/10.3390/geotechnics4010011
Submission received: 22 November 2023
/
Revised: 25 January 2024
/
Accepted: 7 February 2024
/
Published: 20 February 2024
Abstract
:Deep vertical boreholes play a crucial role in underground exploration, resource extraction such as geothermal energy extraction, oil and gas exploration, underground waste storage and various underground engineering applications. The geomechanical properties of the rocks surrounding these boreholes are essential for designing safe, efficient drilling operations, for using adequate technologies and equipment and for providing mitigation measurements. Specifically, when the excavations are performed inside in-depth, extremely fractured and weathered rocks, the identification of zones more susceptible to crossing is a primary goal. This paper presents a thorough investigation into the rock masses surrounding a deep vertical borehole that involved the collection of core samples from the deep vertical borehole, laboratory testing, in situ tests and the application of geomechanical models to characterize the crossed rock masses. After a lithological and structural description of the rock masses and a description of the methodology used for their characterization, this paper focuses on the geomechanical parameterization of the rock mass using the uniaxial compressive strength of the intact rock (σci) and the Geological Strength Index (GSI). The obtained findings highlight the extreme variability in the depth of the geomechanical parameters of crossed rocks, which decreased with the depth. This methodology can be used to characterize rock masses along other deep boreholes, for which there is a lack of research, and to define the most problematic zones for underground crossing where different support works must be designed.
1. Introduction
The stability conditions of underground rock structures are strongly controlled by the geomechanical properties of the rock masses, which mostly depend on the rock mass strength and discontinuity conditions. The excavations inside in-depth, extremely altered and fractured rocks are very dangerous and problematic for personnel and for equipment to be used, and adequate mitigation measurements must be taken to reduce the related risks.
Regarding the importance of disaster risk reduction, recently, the Sendai Framework [1] has set specific priorities of action to prevent new, and reduce existing, disaster risks. The starting points for building a sustainable and resilient society are to prevent natural disasters and disasters associated with anthropogenic activities as well as to provide solutions through the use of mitigation measures for use in identified susceptible zones.
In this framework, the knowledge of the state of degradation and fracturing of a rock mass, which strongly controls the geomechanical behavior, is very relevant to identifying more susceptible zones to develop alert systems for the working drill operators or design primary support works. Understanding the mechanical properties of the rock mass helps in designing and implementing safe and efficient drilling and extraction processes. The key aspects of geomechanical characterization along a deep vertical borehole are the rock strength and the rock mass strength, to assess the rock’s ability to support the borehole walls, and rock deformation, to understand how the rock responds to applied stress and to design support systems to maintain borehole integrity.
The problem of assessing the quality of a rock mass has always been of interest to scientists all over the world. Many methods have been developed to describe the condition of the rock mass, in terms of both the conditions of maintaining underground workings and possible natural hazards. Progress in the field of technology allows the search for new techniques for the ongoing monitoring of rock masses, especially in the context of ensuring the stability of underground structures [2].
Several empirical methods such as the Rock Quality Designation (RQD) [3], the Rock Mass Rating (RMR) [4], the Rock Quality Index (Q) [5], the Rock Mass Index (RMI) [6] and the Geological Strength Index (GSI) [7] are available to provide an overall measure of rock mass quality. Moreover, when the rocks exhibit varying mechanical properties in different directions, an understanding of the anisotropy is also important for accurate modeling and prediction as well as the interpretation of the results of geomechanical rock property testing [8].
Geomechanical characterization typically involves a combination of laboratory testing on core samples, an in situ survey, well logging data analysis and numerical modeling. This information is then used to design strategies and to optimize the drilling to ensure the stability and safety of the borehole. Geomechanical models, such as the Mohr–Coulomb failure criterion and the Hoek–Brown criterion [9], are applied to analyze the stability of the rock mass. These models help to predict potential failure zones, design support structures and optimize drilling parameters.
While the methodology of laboratory tests is standardized and based on certain commonly used standards, the other aspects are still being improved, and new solutions are being investigated. Recently, Ref. [2] proposed a simplified theoretical model of a single rock mass discontinuity (strata separation), explaining the expected change (anomaly) in the characteristics when the drill rod passes through critical places.
A limited number of studies on deep boreholes carried out on very fractured rocks worldwide exist, and often stratigraphic logs of these surveys are not available to the scientific community. The geomechanical properties of the rock mass surrounding these boreholes are essential to identify susceptible zones to observe trends of variation in these properties with depth and for designing safe and efficient drilling operations.
This paper focuses on the geomechanical characterization of the rock masses along a deep vertical borehole based on the results of an analysis of core samples, laboratory tests and the use of geomechanical models to interpret the results. The paper fits into the key principle of the Sendai Framework of “Understanding Risk”, recognizing the zones along the investigated vertical that are susceptible to digging activities. The proposed methodology can be used to characterize other deep boreholes, and it can represent the starting point to obtain standardization of the procedure of drilling and support the development of robust engineering solutions for deep digging projects.
2. Materials and Methods
2.1. Study Area and Deep Borehole
The study area is located within the Costa Viola between the villages of Scilla and Bagnara Calabra (Sothern Italy). It extends for about 1 km2 and is bordered at the top by “Piano delle Aquile” (a flat area of marine origin) and at the bottom by a densely urbanized coastal plain including the Favazzina village. The area is interesting due to the crossing works of the methane pipeline from Calabria to Sicily (double three-phase power line at 380 kV). Accordingly, a detailed site investigation was carried out, including four deep boreholes.
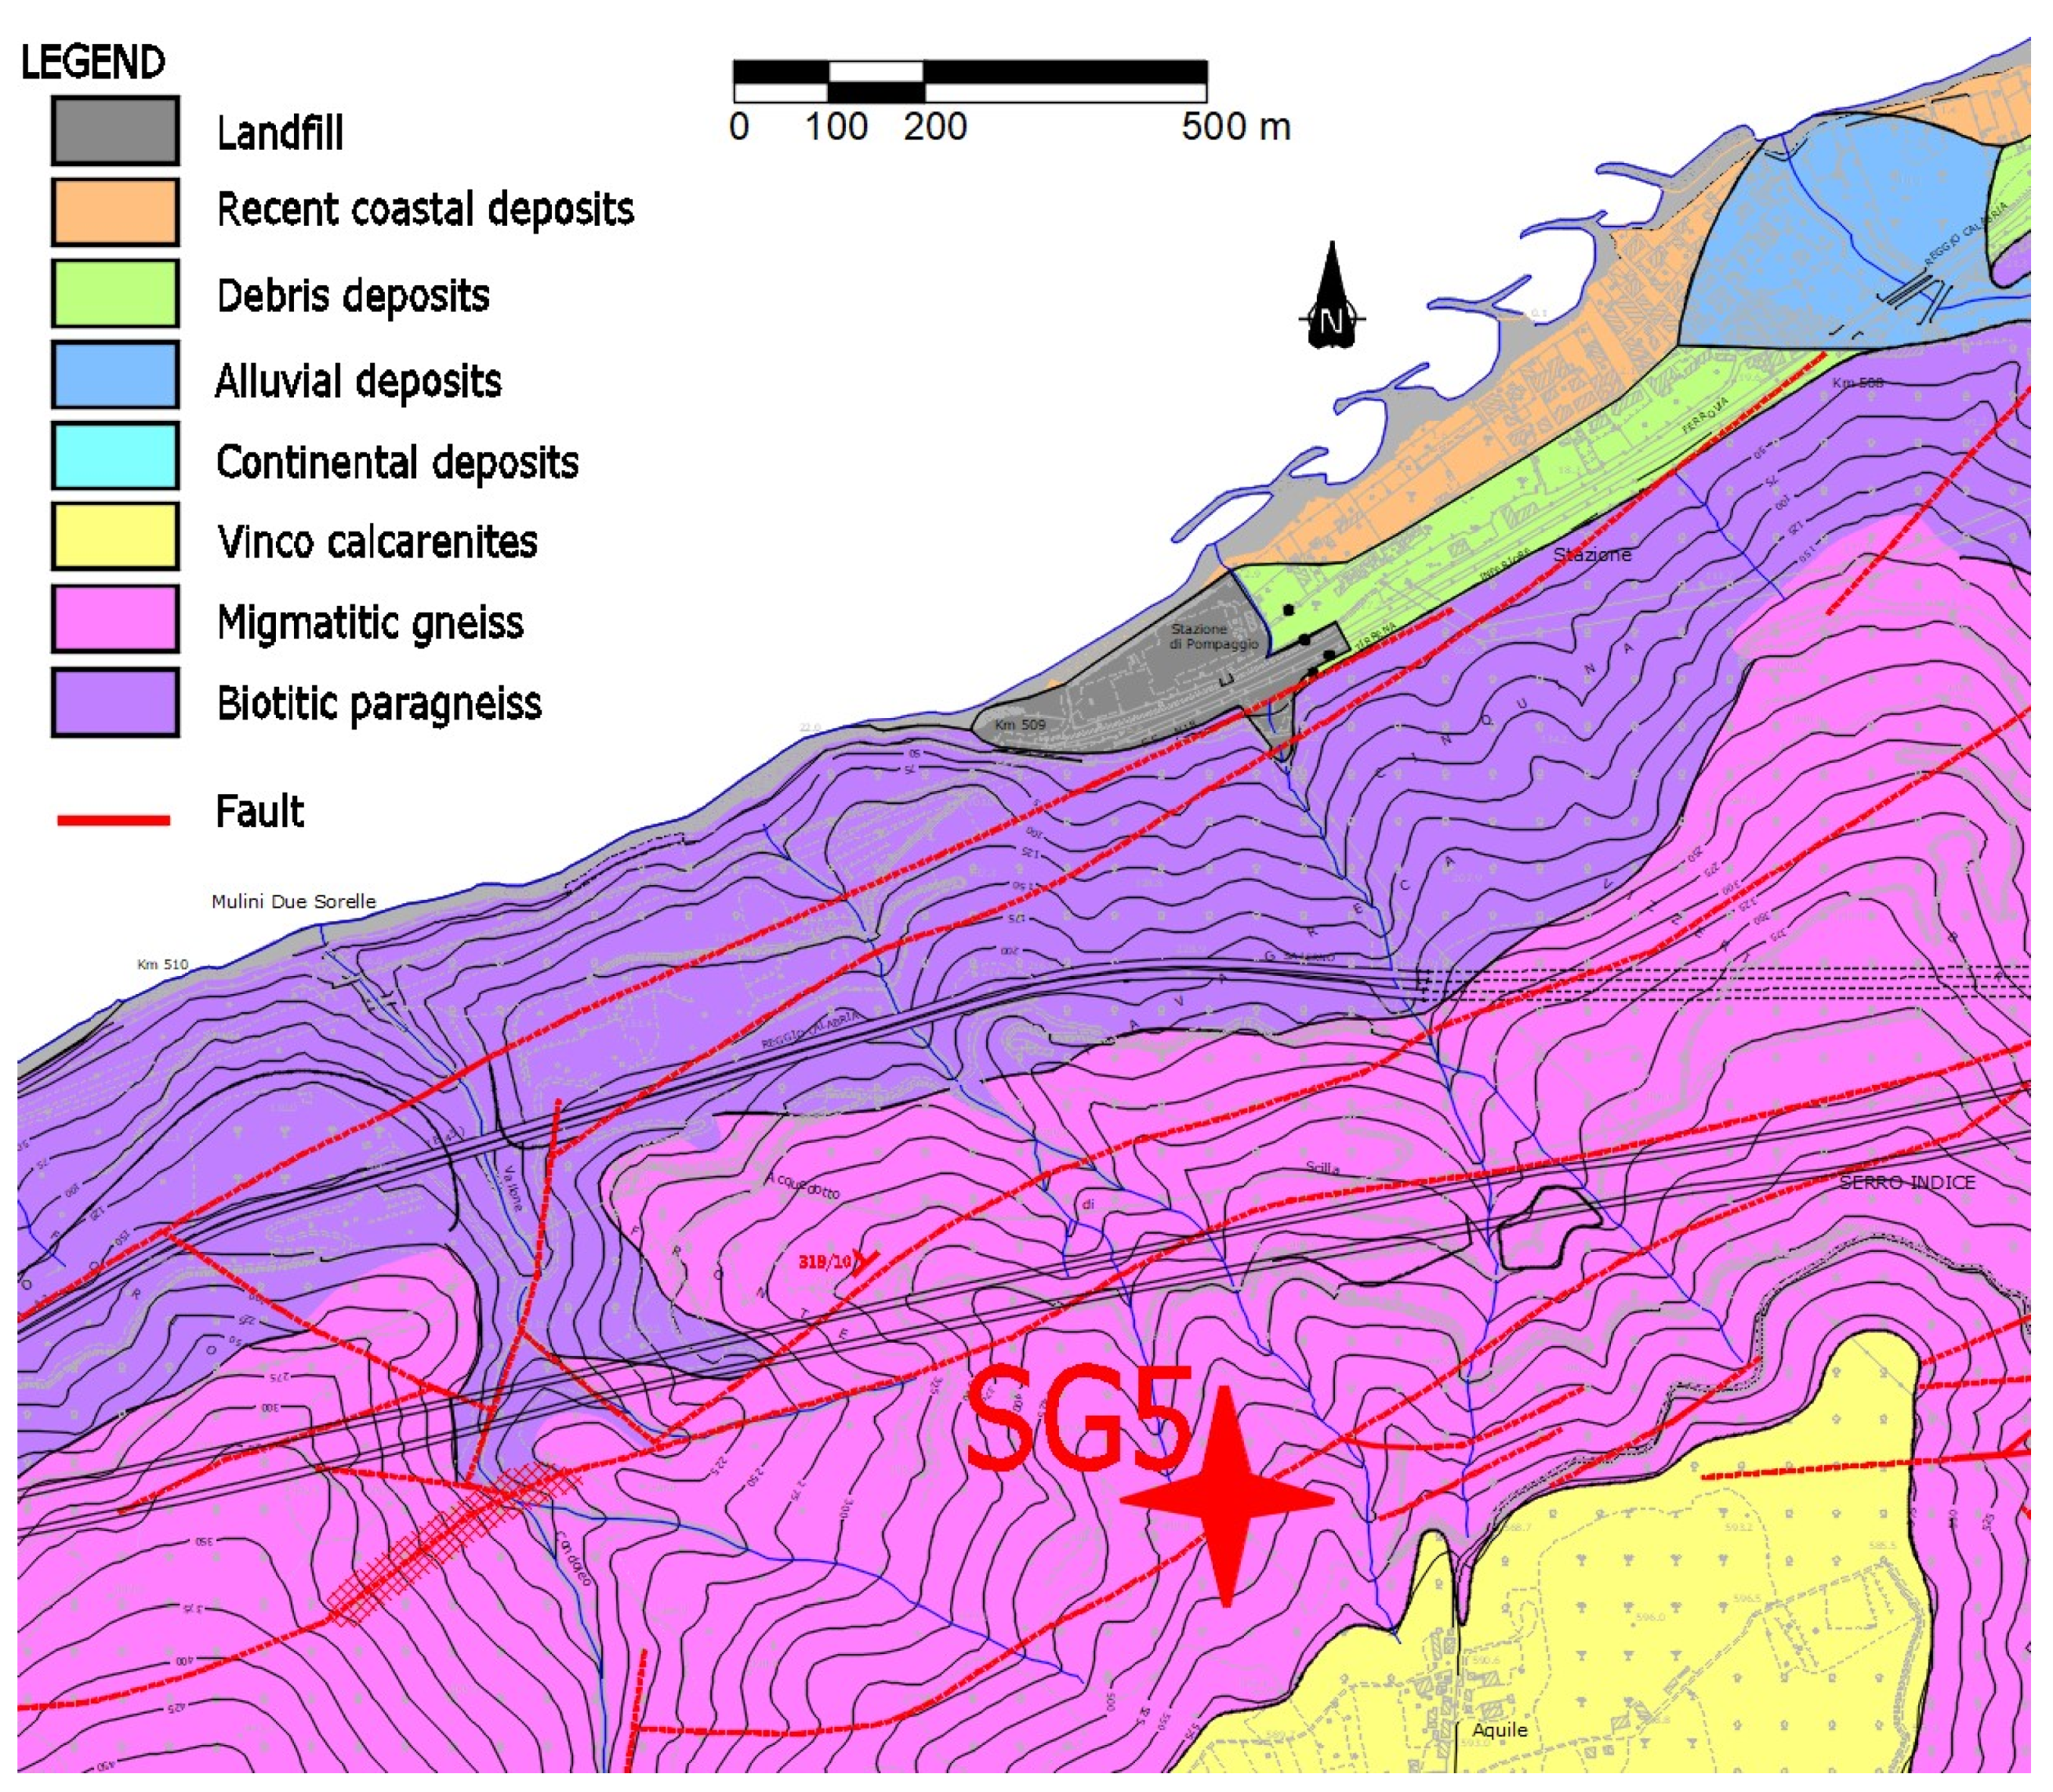
The area falls within a zone characterized by several tectonic structures that often intersect, crossing the rock masses that constitute the basement of the Aspromonte mountain [10]. From a geological point of view, the Paleozoic basement is mainly composed of high-grade metamorphic rocks (para- and orthogneiss), overlapped by Upper Pliocene to Holocene sedimentary deposits [11,12]. The crystalline basement of the area consists of the continental crust of the Aspromonte–Peloritani Unit, of the Hercynian age [13,14], formed by a migmatitic complex intruded by granites with biotitic paragneiss, often with traces of partial melting and migmatitic gneiss with high biotitic concentrations.
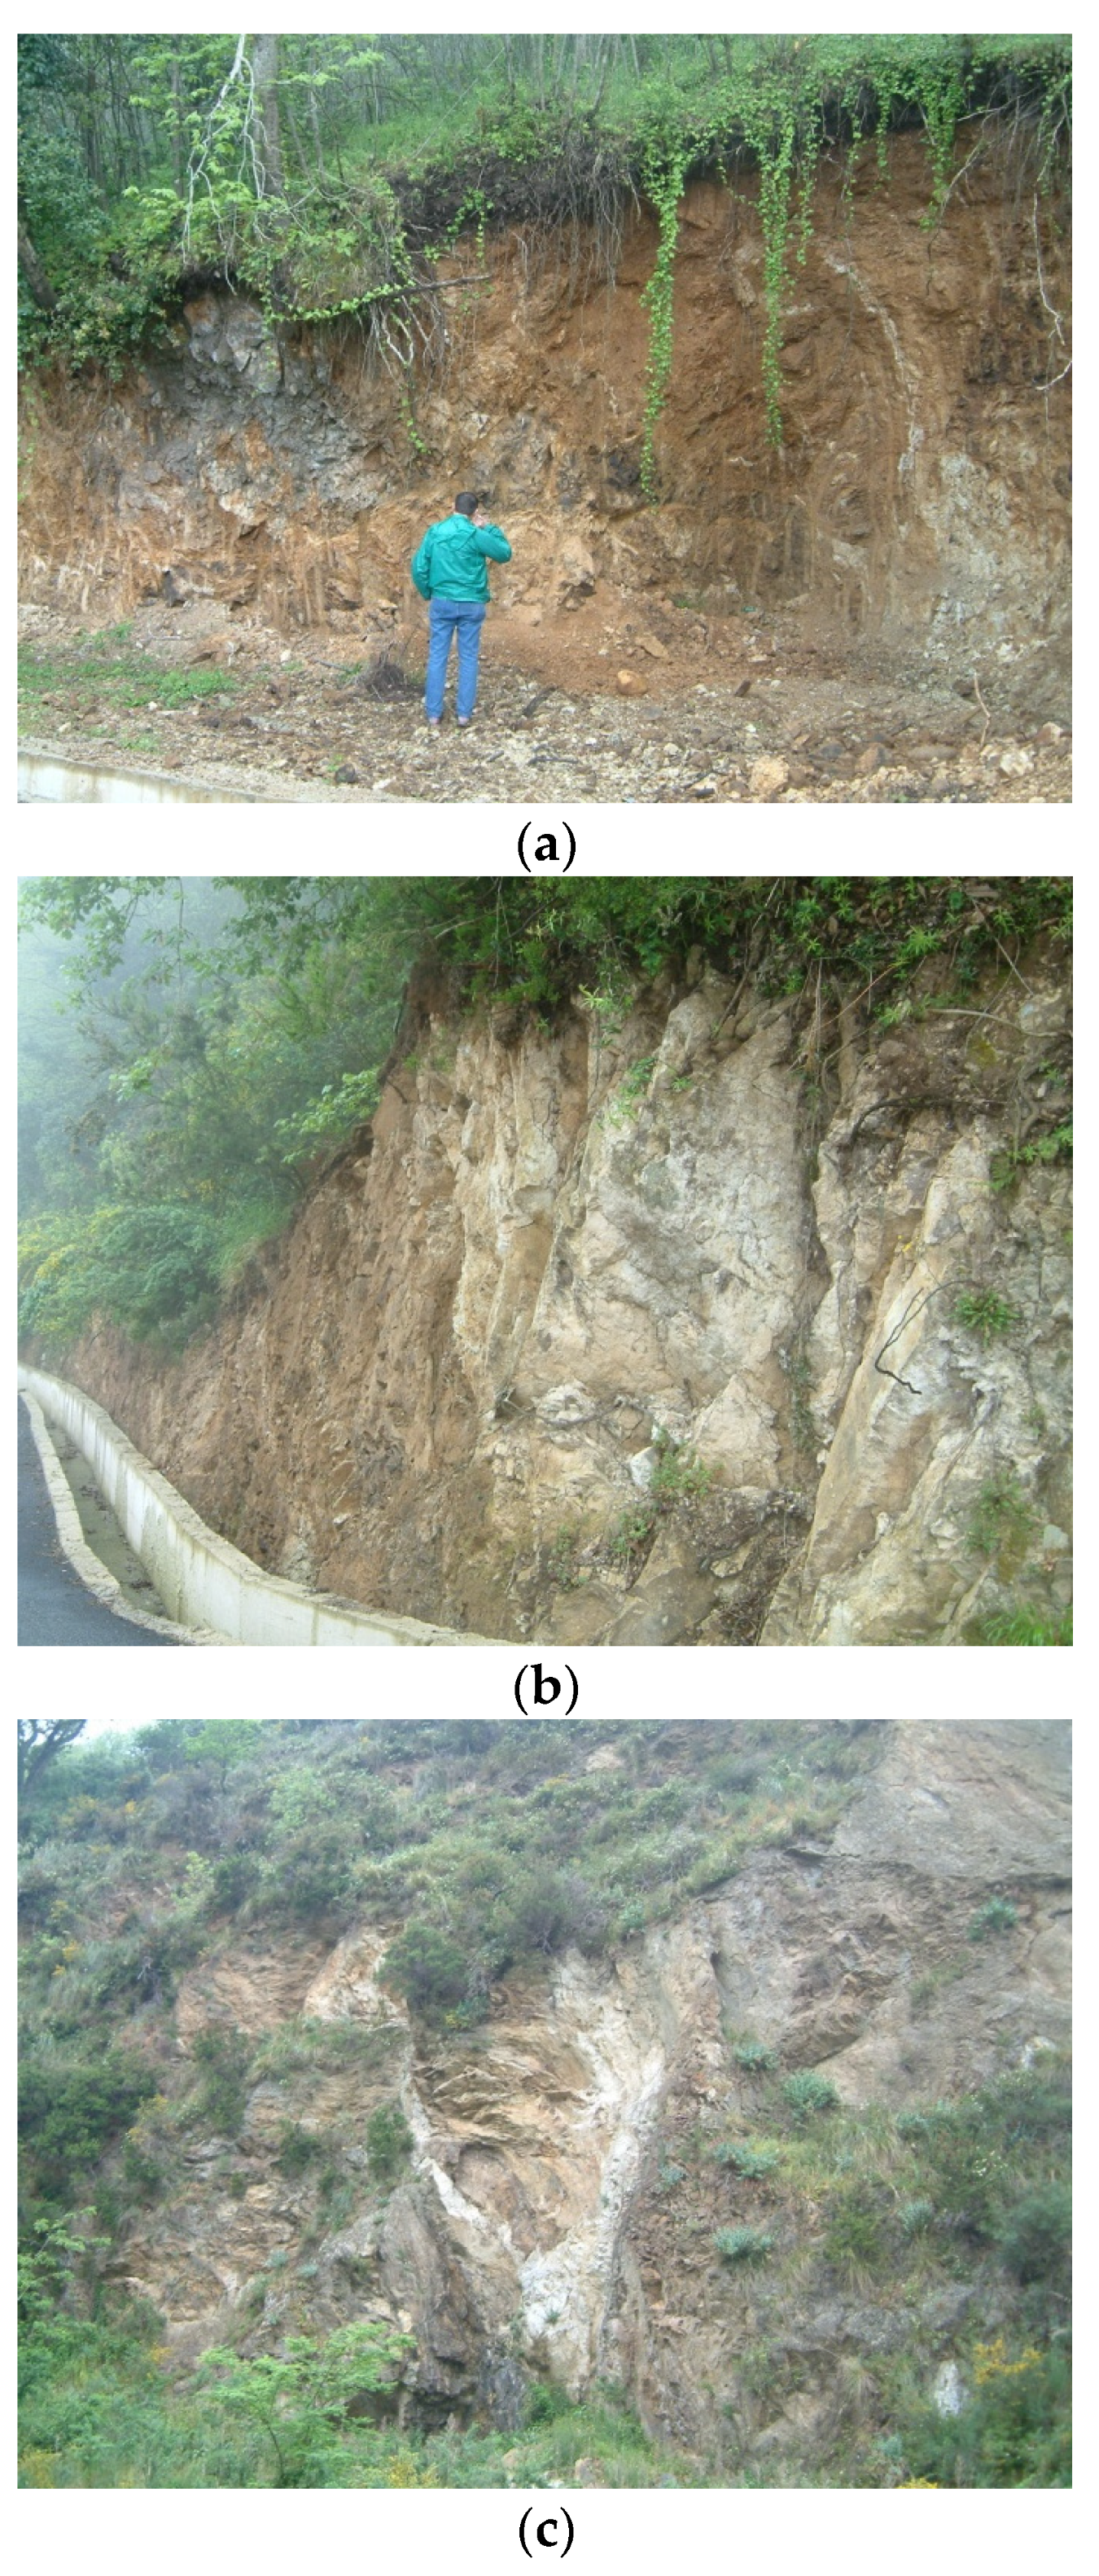
The Paleozoic crystalline basement shows strongly tectonized and intense, deeply weathered conditions [12]. The alteration in the basement changes considerably both at the surface and in depth. Residual soils (reddish-brown silty–sandy blankets encapsulating very degraded stone fragments) (Figure 1a) outcrop at the surface, and the rock masses are extremely degraded (Figure 1b) and affected by intense tectonic strains, with numerous and relevant faults and discontinuities (Figure 1c) in depth.
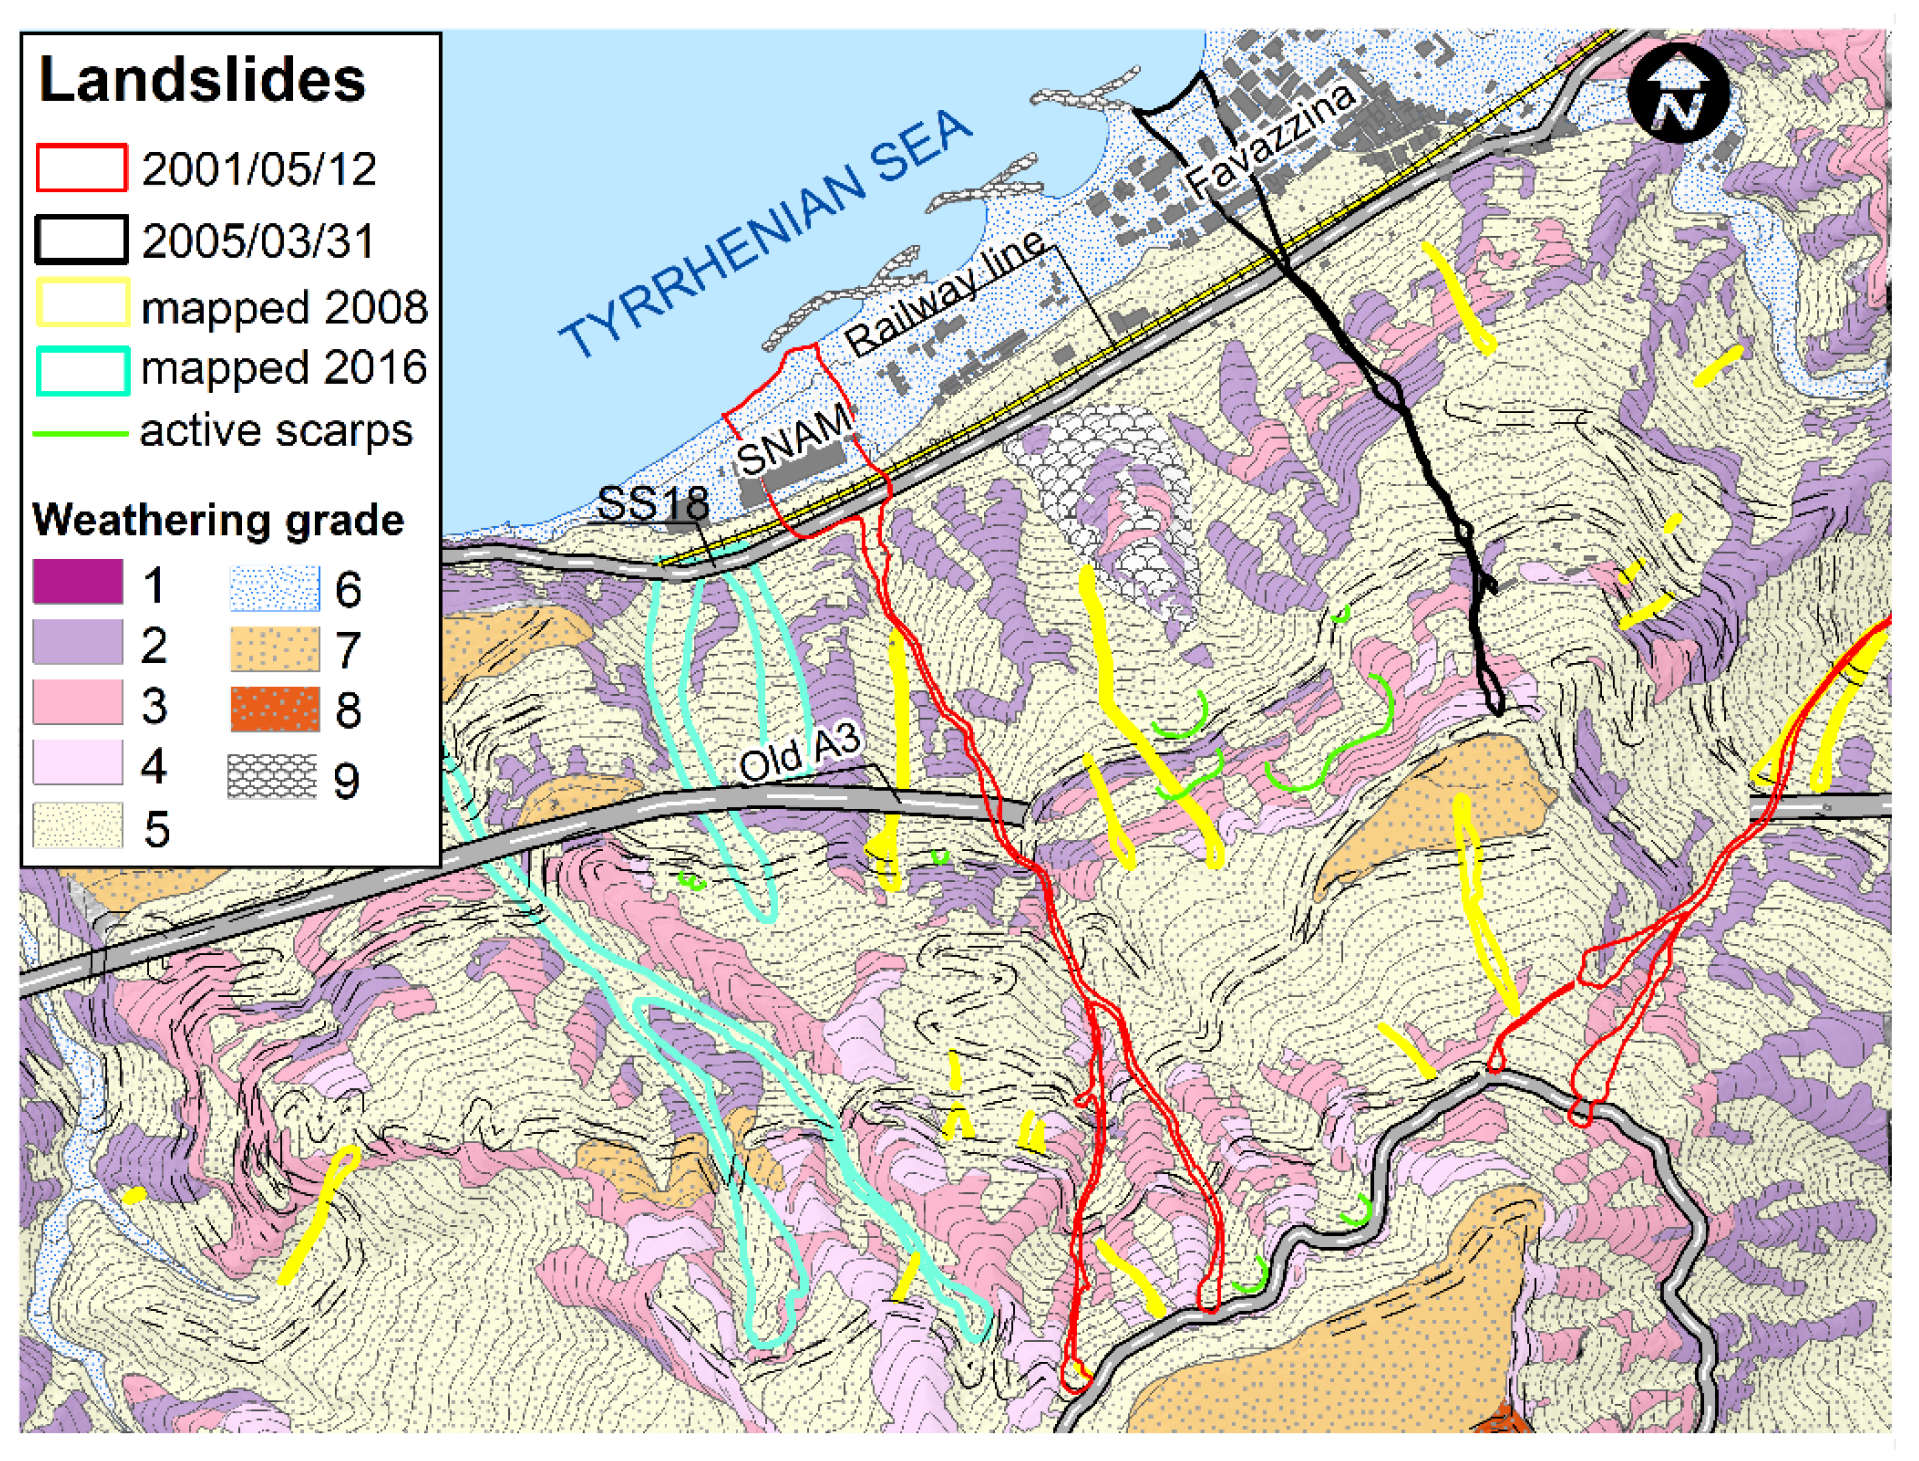
Six weathering classes have been recognized in the area [15]. From the bottom to the top, the weathering sequence consists of a slightly weathered rock (weathering class II) superimposed by a moderately weathered rock (weathering class III), which rarely outcrops, whereas a highly weathered rock (weathering class IV) outcrops in the middle-lower part of the slope. Completely weathered rock or saprolite (weathering class V) prevails in the upper part of the slopes along with residual, colluvial and detrital soils (weathering class VI), which cover most of the area (Figure 2).
The structural features of the joints of the rock basement range from a very large number of small fractures to very significant faults key to the regional tectonic evolution of the area. Thus, the rock is fractured and intensely fractured to completely cataclastic, with cases of clays and traces of sliding friction (slickensides).
The rock degradation is frequently accompanied by hydrolysis phenomena, characterized by a gray-greenish matrix. Mineralogical–petrographic investigations (thin sections and X-ray diffraction) of these zones have shown that the alteration consists of chloritization of phyllosilicates and sericitization of feldspars. In the granitite facies, the alteration is in an advanced stage (argillation of feldspars, with moderate amounts of montmorillonite).
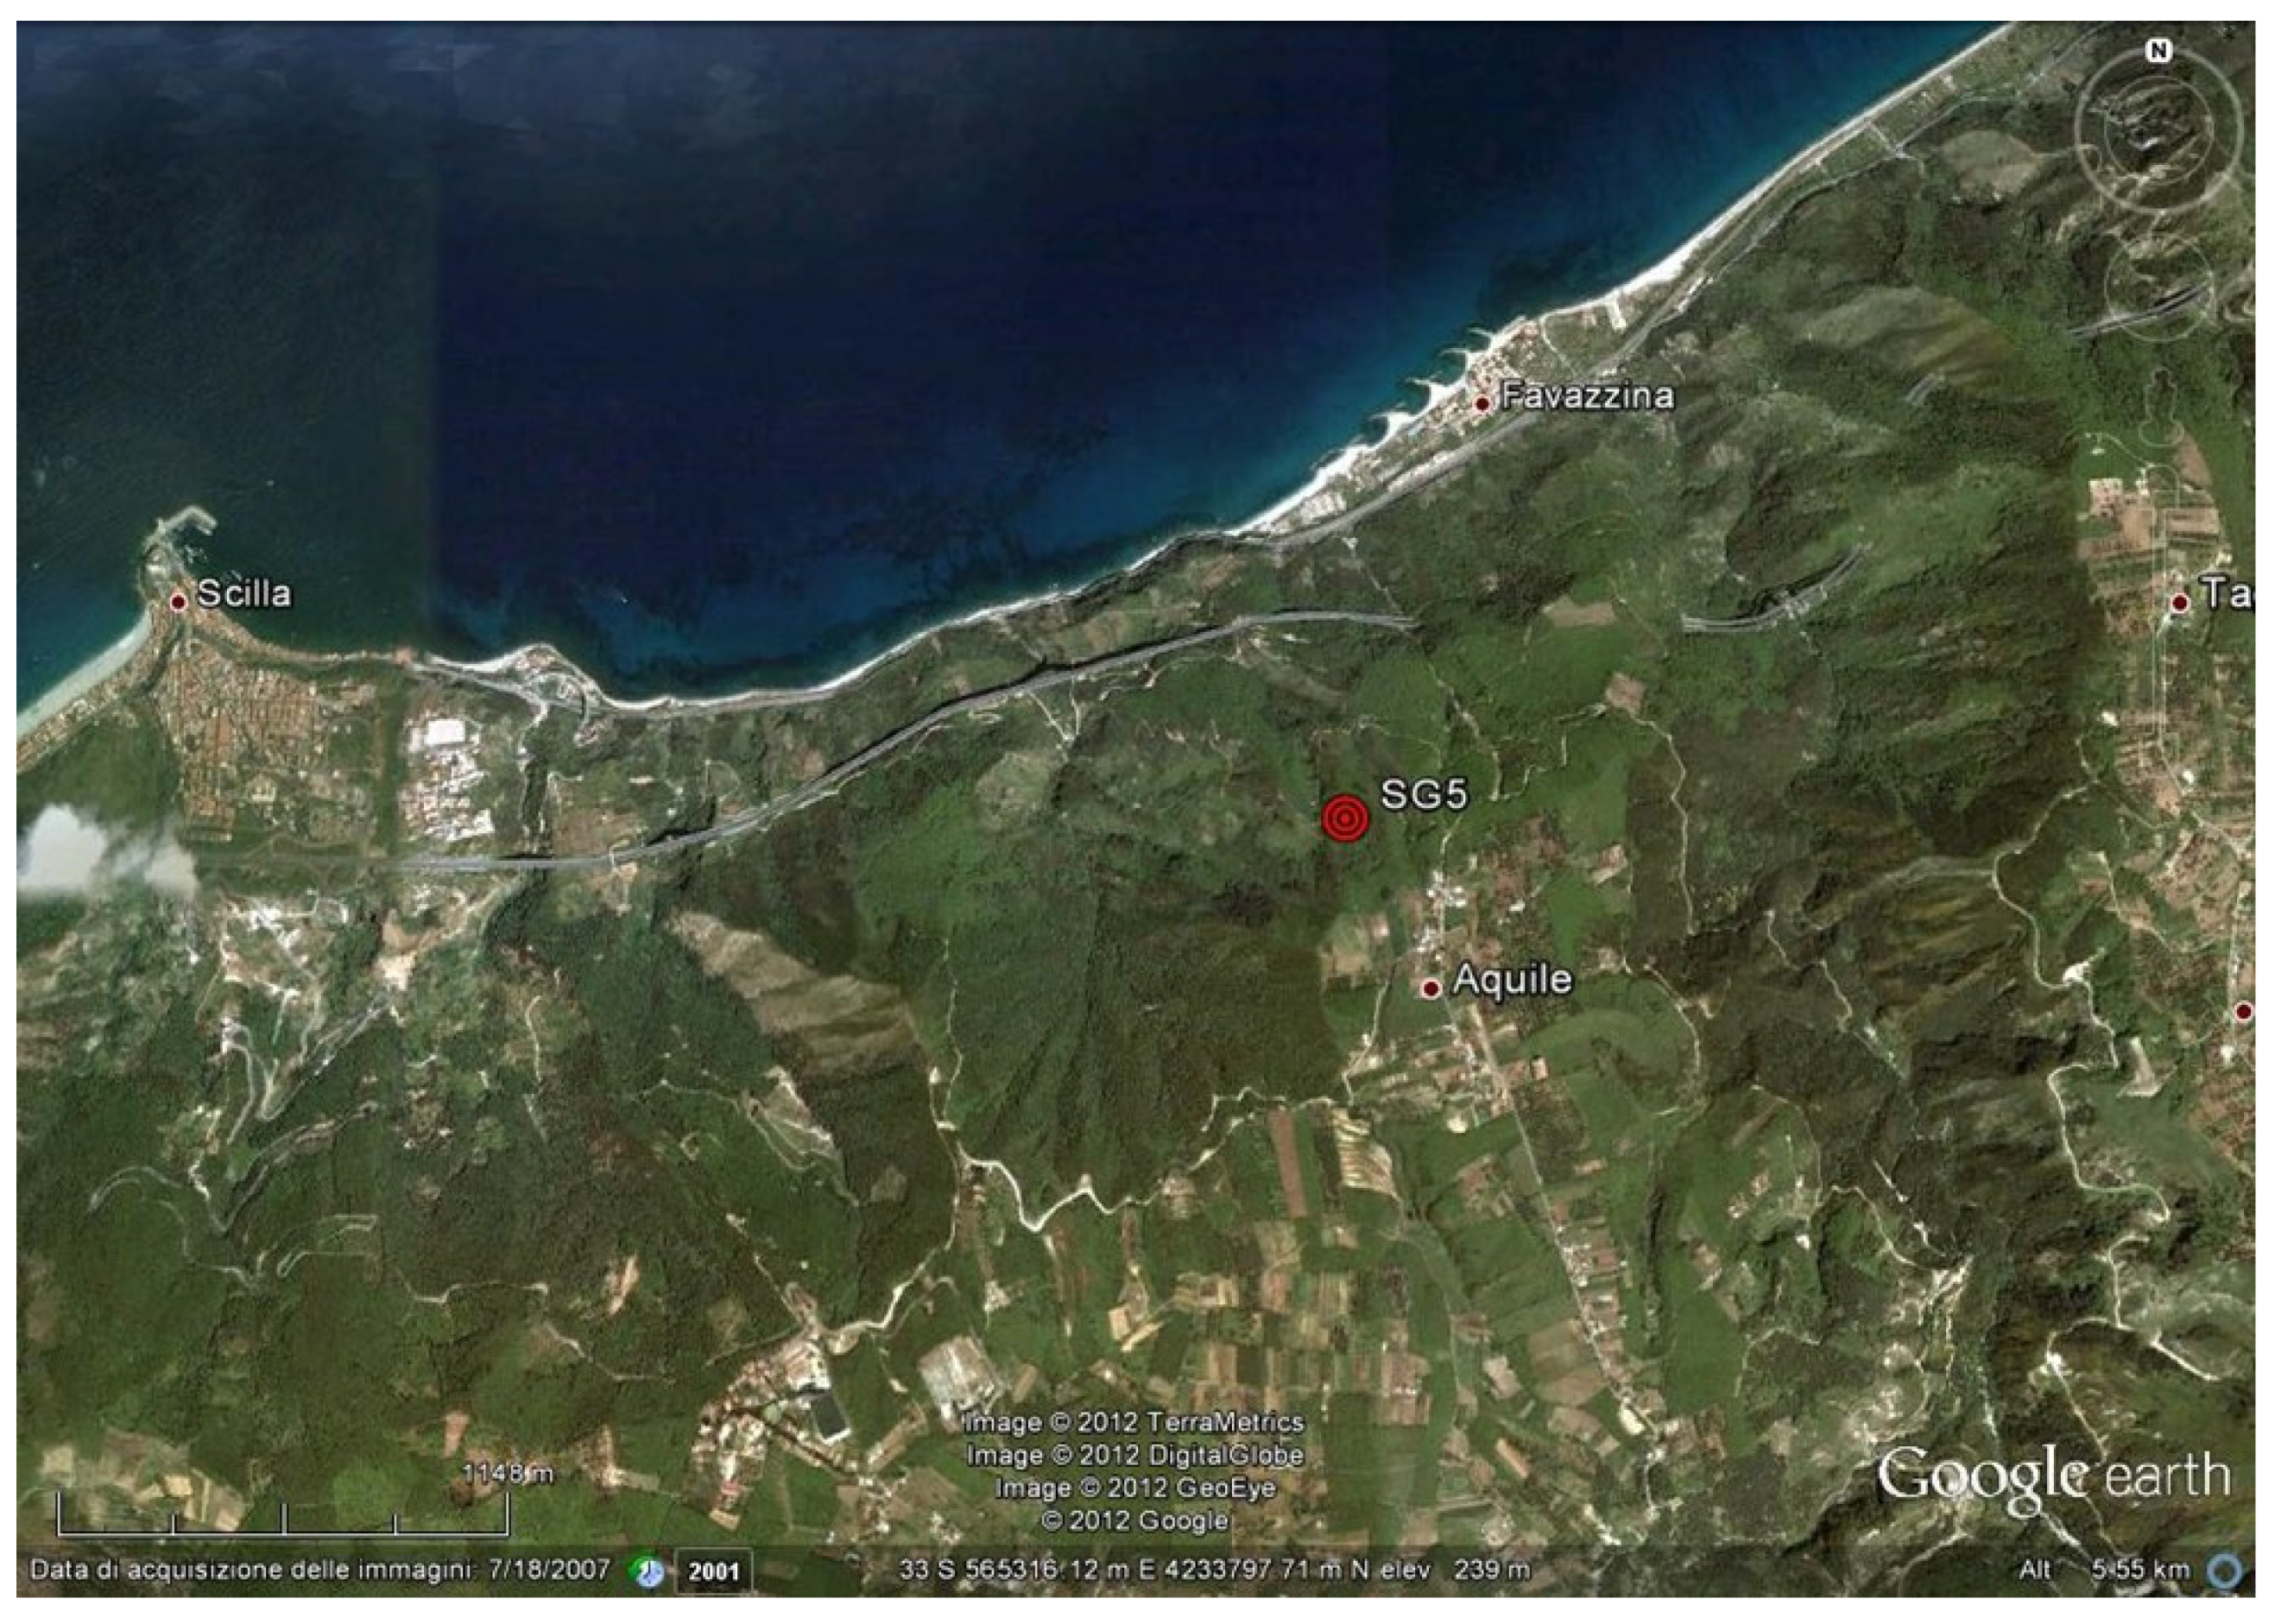
A borehole (named SG5) was drilled at 492.786 m above sea level (Figure 3) along the slope bordered at the top by a flat zone named “Aquile” and at the bottom by a densely urbanized coastal plain including the Favazzina village and has reached a depth equal to 410 m. Figure 4 shows the geological map of the area where the borehole (red star in figure) is located.
The borehole was drilled with the continuous coring method using the wire line technique. The drilling equipment had the following characteristics: torque 1205 kgm, maximum thrust 6500 kg, rotation speed 0–620 rpm and useful stroke 6000 mm. A 410 m long PVC tube for piezometer measurements was installed in the borehole slotted in the depth between 380 and 410 m.
The borehole crosses high tectonic disturbance zones, characterized by numerous tracts of cataclastic bands (at least 3 significant episodes). Cataclasite rocks have been crossed at the depths of 41 m (55.3 m thickness), 195 m (24.5 m thickness) and 277.4 m (6.23 m thickness).
The SG5 stratigraphy is summarized in Table 1 with some pictures of taken core samples.
Two Lugeon tests and surveys by means of a camera (BIPS) and ultrasonic sensors (BHTV) were carried out for the limited significant tracts at 357.0 m–407.5 m and 228–266 m, respectively, inside the internal wall of the hole.
2.2. Methodological Approach
In order to characterize the rock mass along the vertical sampling of the borehole, the methodology adopted was oriented toward classifying the rock mass according to the main parameters:
- -
- The rock degradation degree, which strongly affects the uniaxial compressive strength (σc) of the intact rock;
- -
In order to quantify these parameters, the rock quality and the rock jointing were evaluated.
Regarding the evaluation of σc, the weathering degree, varying from I to VI, and the manual index of compression strength, varying from R0 to R6, were used according to the tables proposed by ISRM [17]. This analysis enabled the evaluation of σc along the vertical of the borehole.
Regarding the rock mass fracturing level, the analyzed data for the description of the characteristics of the fracture state of the rock mass are the number and inclination of discontinuities with respect to the vertical; joint roughness; joint alteration and filling.
The GSI evaluation was carried out by means of qualitative and quantitative approaches. In the first one, the GSI was defined through an estimate based on the visual inspection of the structure of the rock mass and on the basis of the table proposed by [7]. The GSI was qualitatively estimated for homogeneous zones identified according to the level of fracturing and the lithology of the identified rocks along the borehole.
Regarding the quantitative approach, the parameters for the characterization of the rock mass were estimated, evaluating the GSI by means of analytical equations based on parameters measured and/or assessed directly on the cores of the borehole. The approach used for the quantitative GSI evaluation was performed by means of the equation proposed by [18]:
where JP is a joint parameter evaluated as follows:
where jC is a joint condition factor, Vb is the volume block and D is a parameter defined as follows:
where jC [6] is equal to
where jR, jA and jL describe the roughness, the alteration and the joint length, respectively. The evaluation of these parameters was performed using the tables proposed by [6]. According to these tables, a numerical value of these parameters was assigned to each piece of the borehole core.
The Vb evaluation was carried out as suggested by [19], using the following equation:
where β can be considered equal to 36. JV (volumetric joint count) is a parameter function of the joint number per volume unit, evaluated by means of wJd (≅JV) on the cores of the borehole:
where fi is a function of δ, the angle between the joint and the borehole vertical [19].
In this way, the GSI numerical value was evaluated using data (slope, roughness, alteration and filling of joints) provided for each joint crossed by the geomechanical log.
Moreover, laboratory tests (uniaxial and triaxial compression tests) were performed on rock samples taken at different depths along the survey, and the results were interpreted using the generalized Hoek–Brown failure criterion [9], Equation (7):
where mb is a reduced value of the material constant mi, and s and a are constants of the rock mass. They are given by the following:
FD is a factor depending on the degree of disturbance to which the rock mass has been subjected by blast damage and stress relaxation. It varies from 0 for undisturbed in situ rock masses to 1 for highly disturbed rock masses [9].
In the evaluations, mi and FD were considered equal to 32 and 0, respectively. In these conditions, the changes in mb, s and a depend only on the GSI.
By fitting an average linear relationship to the curve generated by solving Equation (7), for a range of minor principal stresses (function of in situ vertical stress), the equivalent angle of friction and cohesive strength were determined.
The elastic deformation modulus Erm of rock masses was evaluated according to [9] and considering the elastic deformation modulus of intact rock equal to Ei = 725 × σc,i [20].
The rock mass strength parameters were determined using RocLab 3 software (Rocscience, Toronto, ON, Canada), which uses as input parameters the unconfined compressive strength of intact rock σci; the Geological Strength Index, GSI; the intact rock parameter mi and the disturbance factor FD. The last ones are estimated from built-in charts and tables based on rock type, geological conditions, etc.
3. Results
3.1. Rock Mass Characterization along the Borehole
In order to assess the GSI, homogeneous zones for the fracturing level along the borehole were identified. In the evaluation, meters from 0 to 41 of the borehole were not taken into account because this area comprises highly altered rocks (silty sand, silty gravel, sandy silt and sandy gravel) that can be classified as soils. The geomechanical characterization was performed for the part of the borehole from 41 to 350 m because over this depth the recovery of core samples was low.
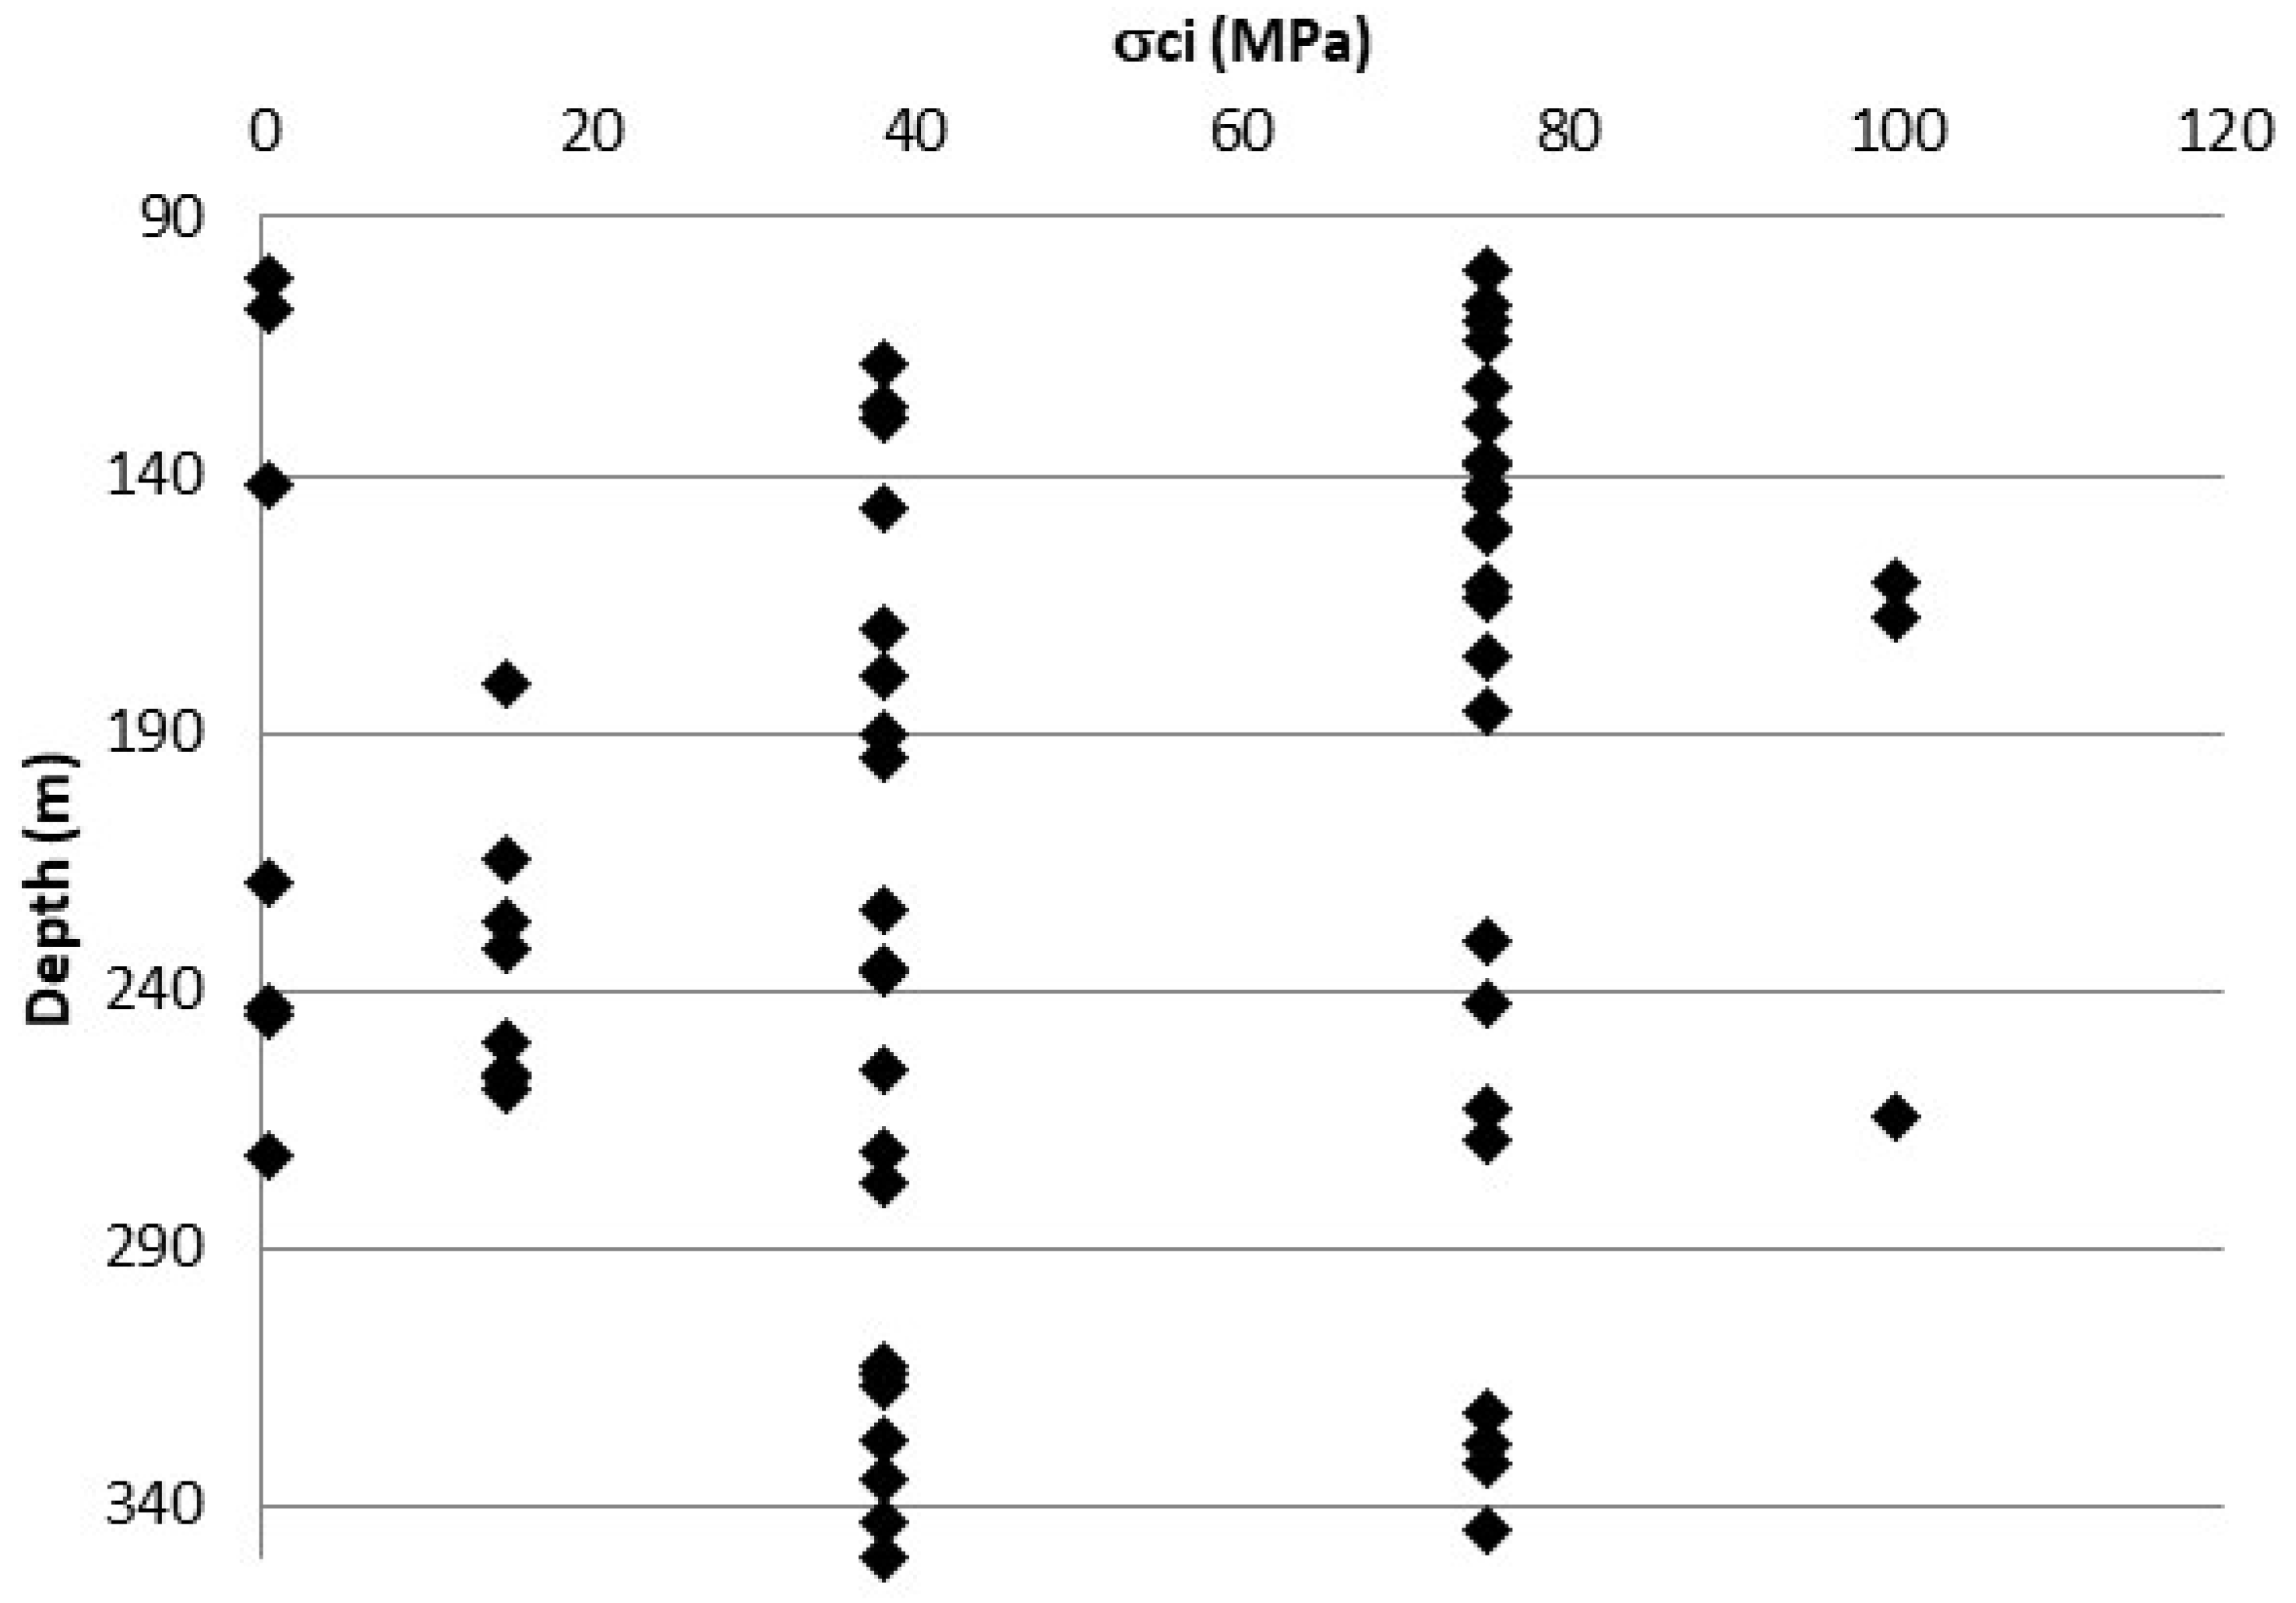
Figure 5 shows the trend in intact uniaxial compression strength (σci) with depths from 96.3 m to 350 m evaluated using the methodology described in the previous section.
It can be noticed that the intact uniaxial compression strength changes from 0.44 MPa (in the more altered zones) to 100 MPa (in the less altered zones). Five values were obtained: 0.44, 15, 38, 75 and 100 MPa.
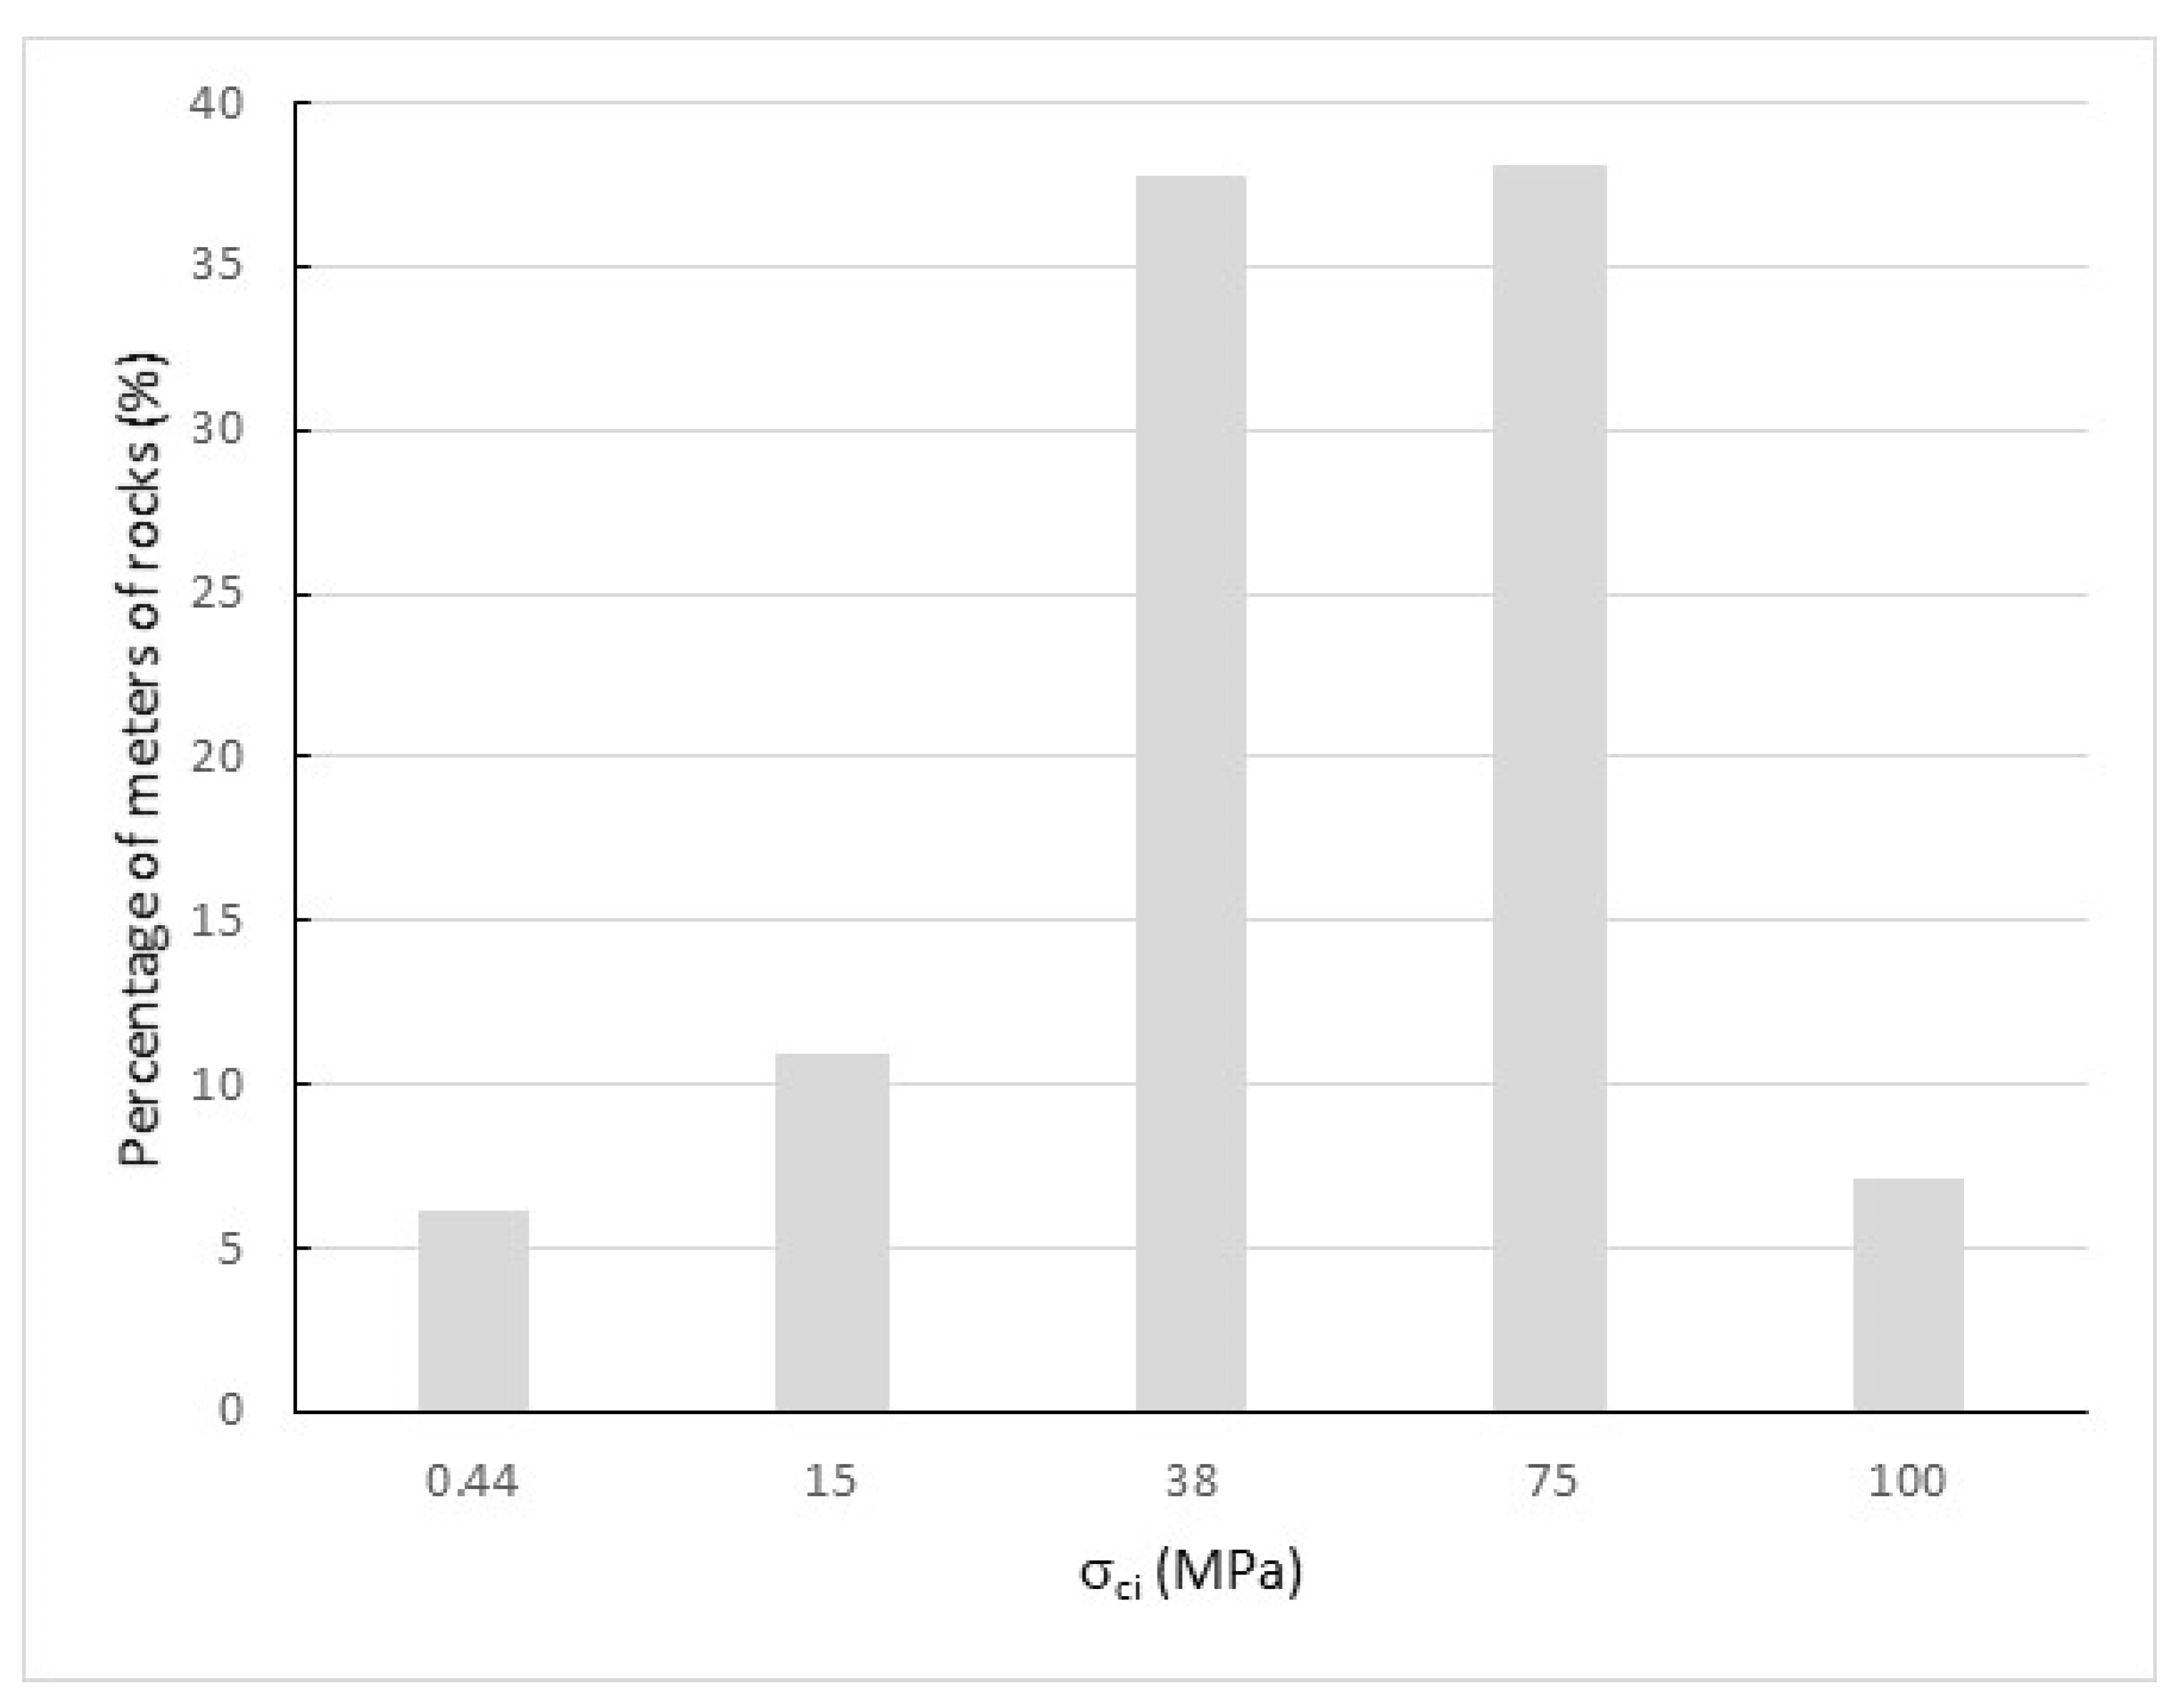
Figure 6 shows the percentage of meters of rocks crossed by the borehole with different intact uniaxial compression strengths (σci).
It can be seen that 76% of the whole length is characterized by rocks with σci from 38 MPa to 75 MPa, 11% by rocks with σci equal to 15 MPa, 7% by rocks with σci equal to 100 MPa and 6% by rocks with σci equal to 0.44 MPa.
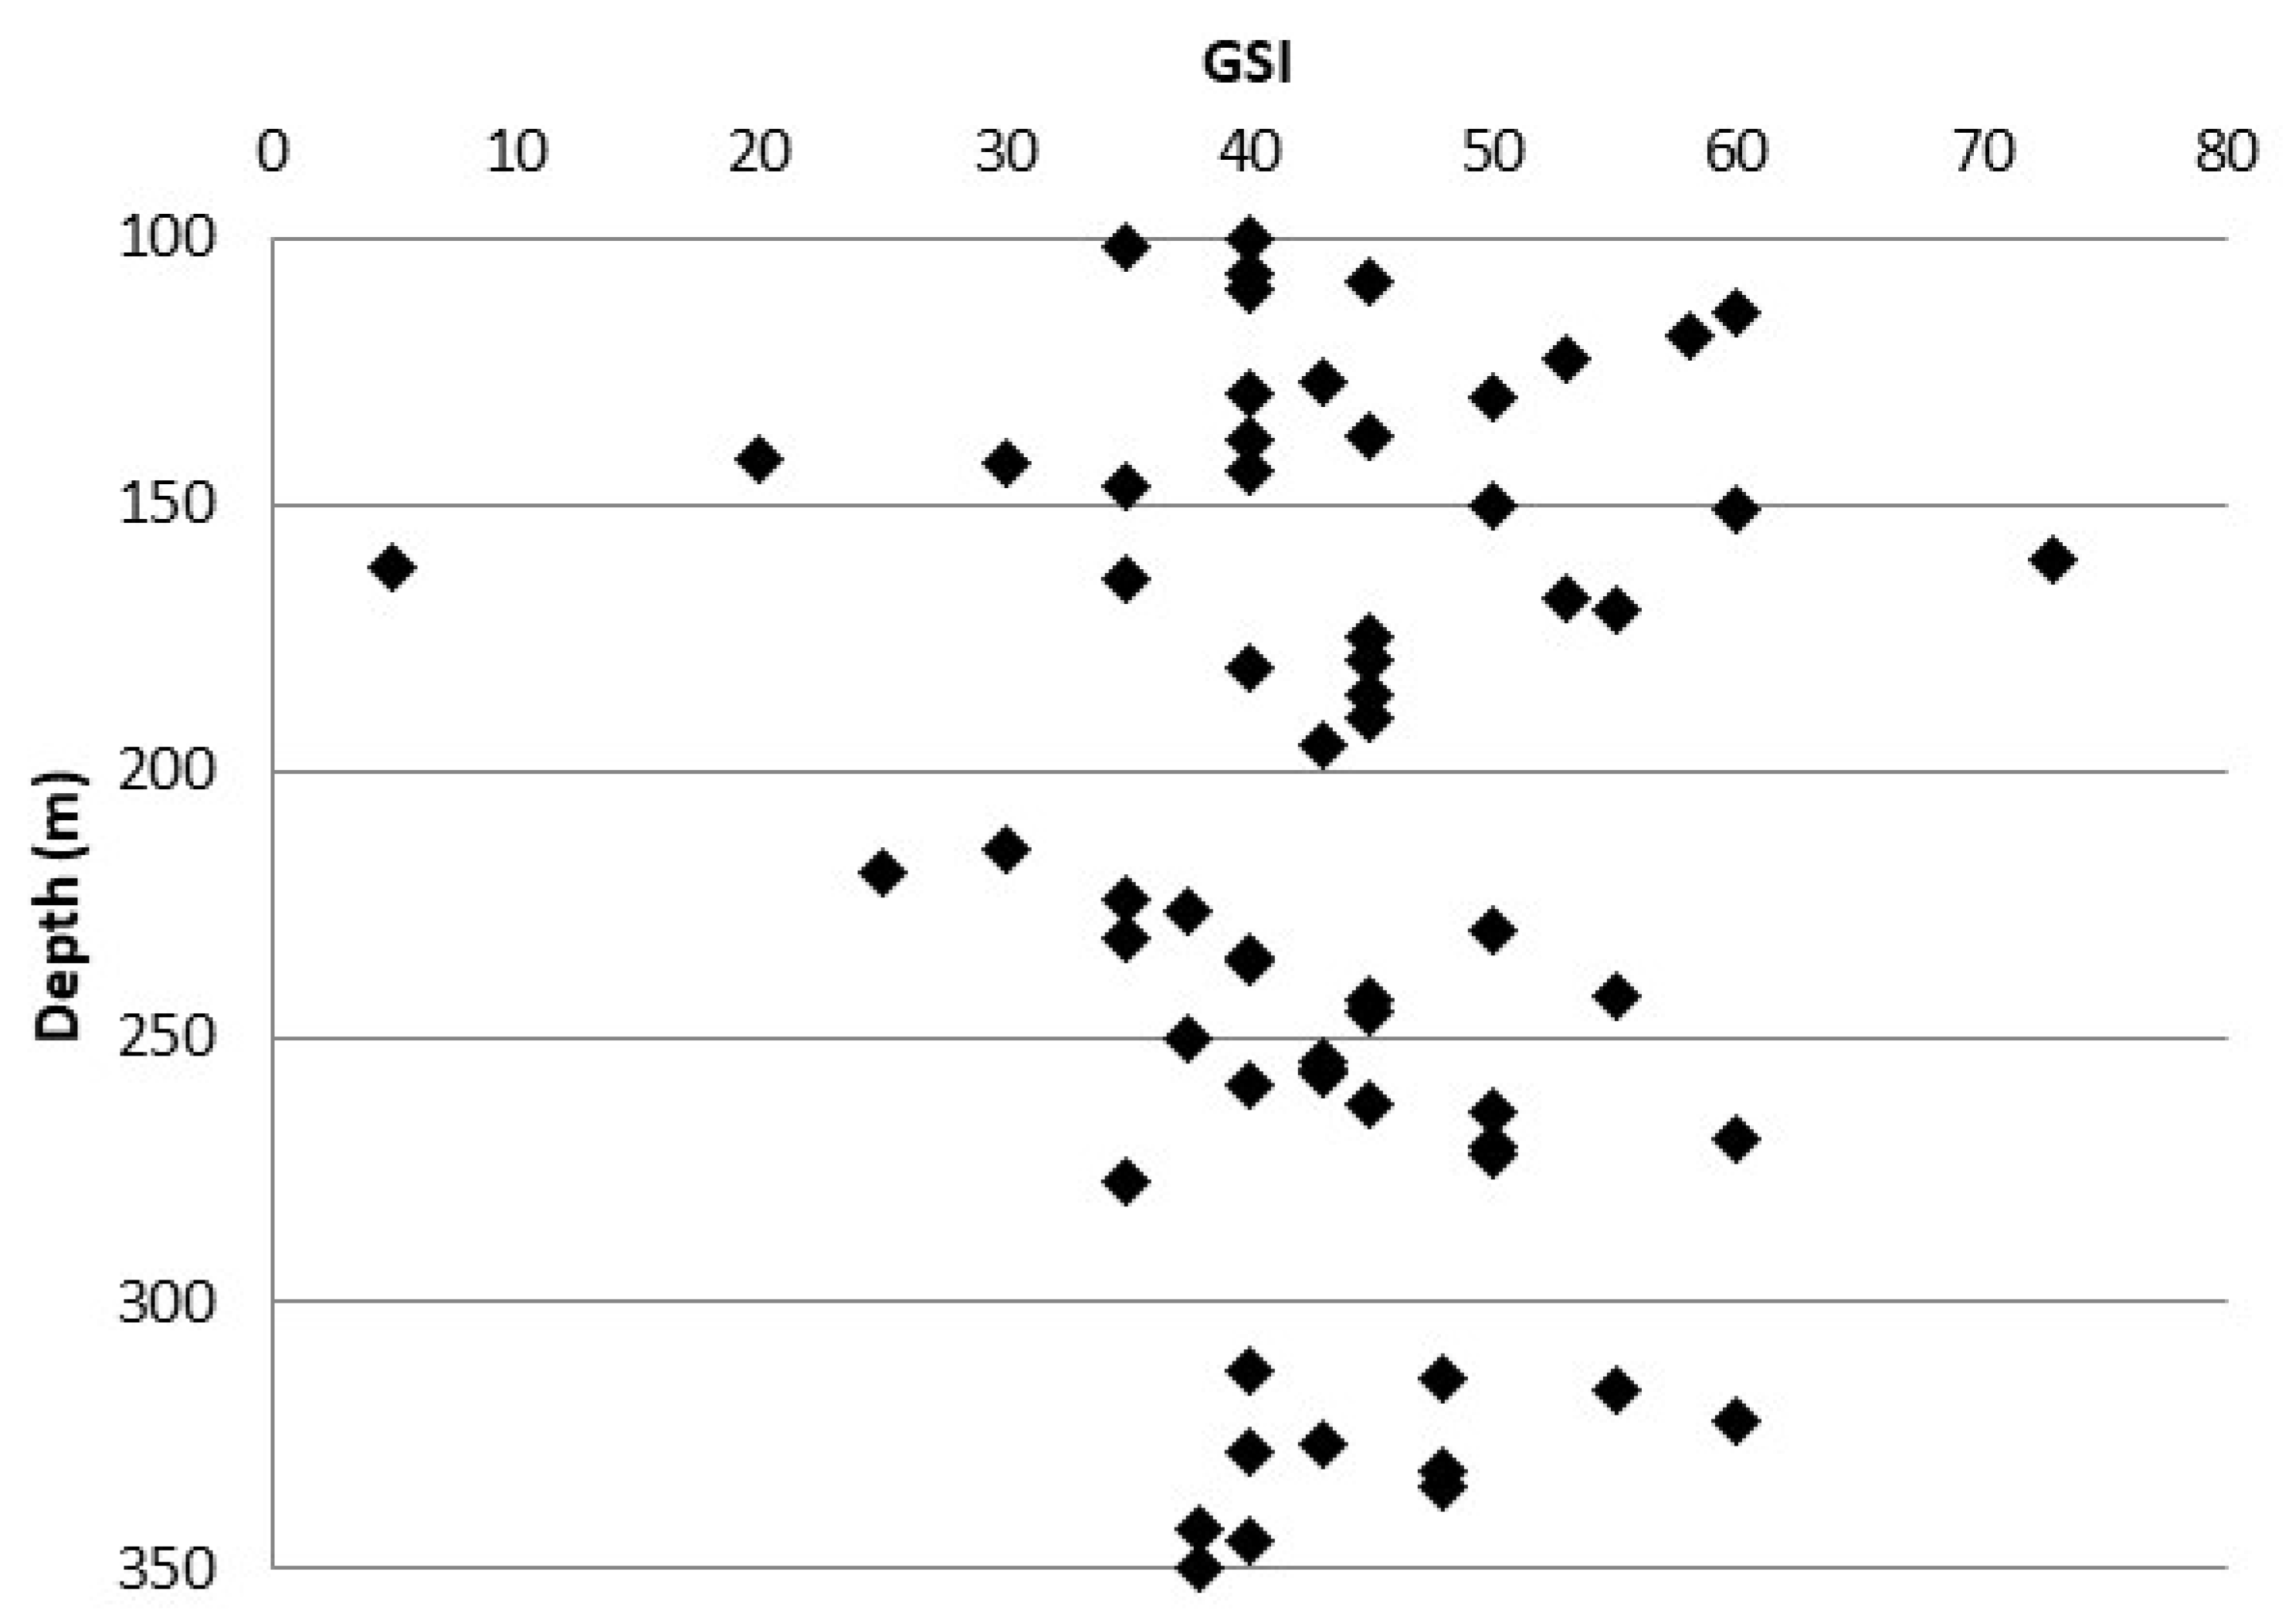
GSI values obtained using the previously outlined quantitative approach are shown in Figure 7.
It can be noticed that most GSI values are in the range 35–60, typical of rock masses from good to poor.
Table 2 shows the percentage of GSI values for the investigated meters (i.e., from 41 to 350 m) of the crossed rock masses in the borehole.
It can be observed that 71% of the investigated meters of the crossed rock masses have a value of the GSI less than or equal to 40 and so are characterized by surface conditions from poor to very poor and by a structure from blocky/disturbed/seamy to laminated/sheared.
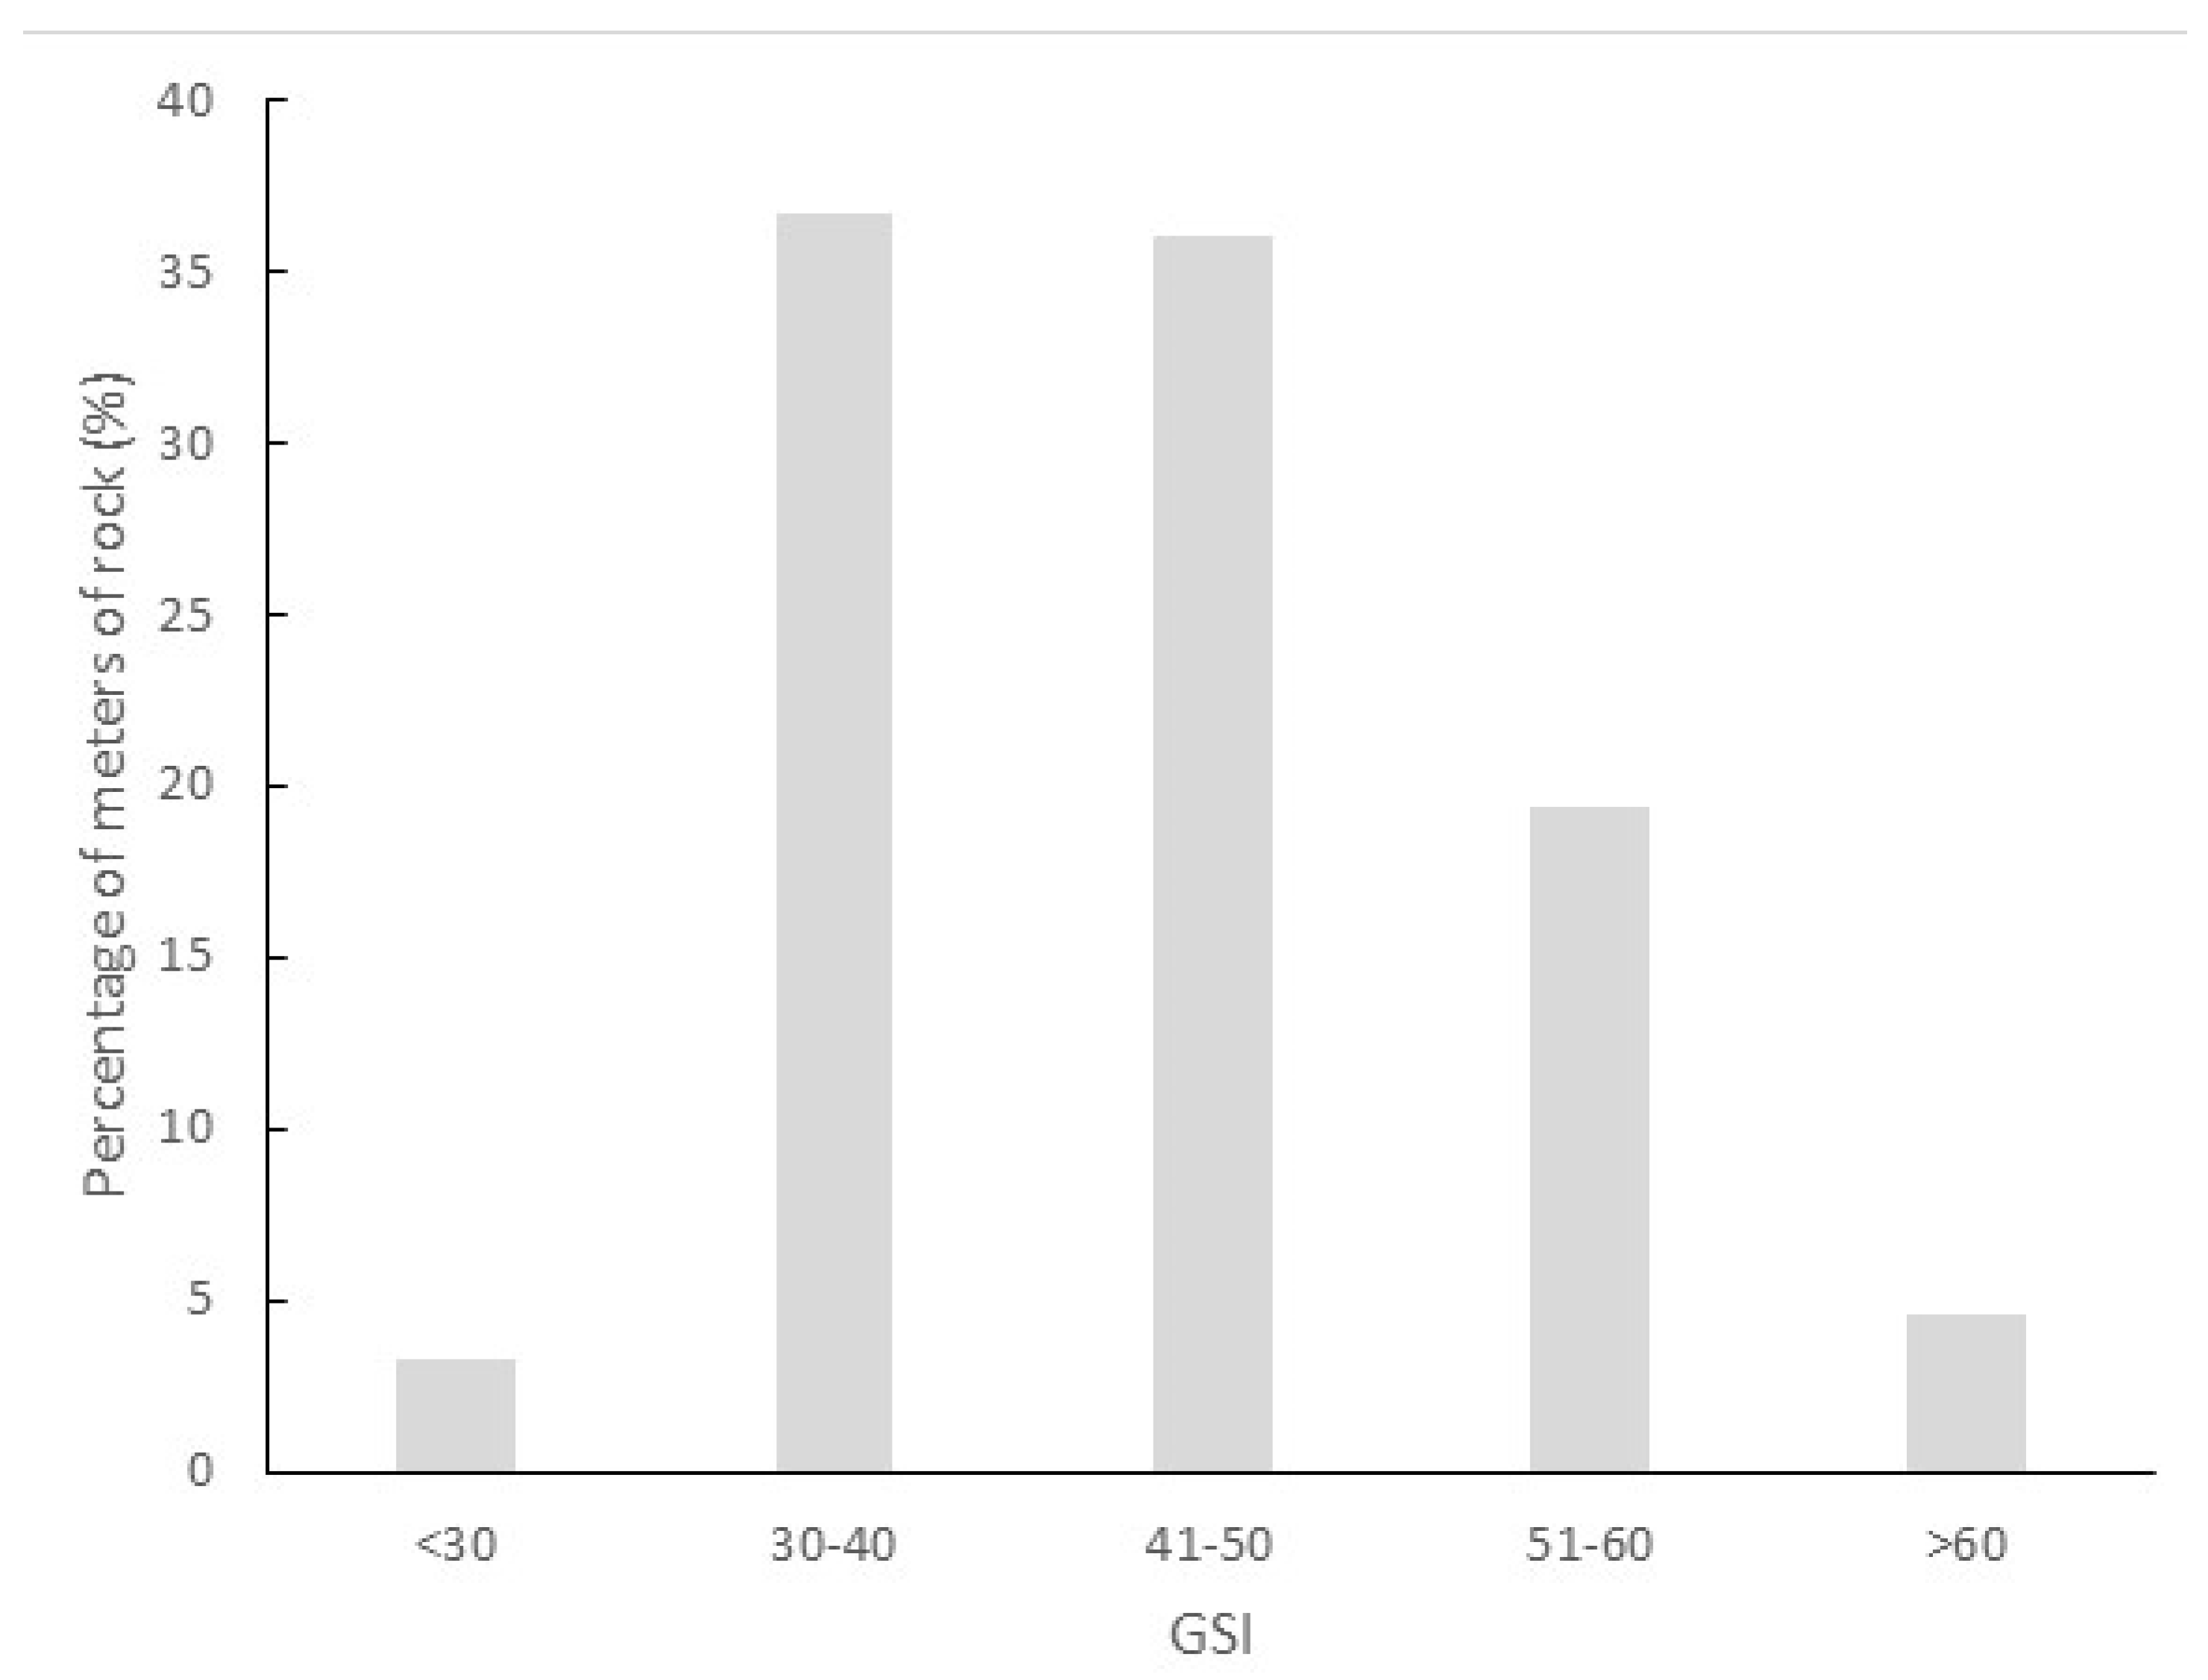
Figure 8 shows the percentage of meters of rocks crossed by the borehole with different values of the GSI.
It can be observed that 73% of the thickness of the rocks is characterized by rocks with a GSI between 30 and 50, and 19% is characterized by rocks with a GSI between 51 and 60, 5% by rocks with a GSI greater than 60 and 3% by rocks with a GSI less than 30.
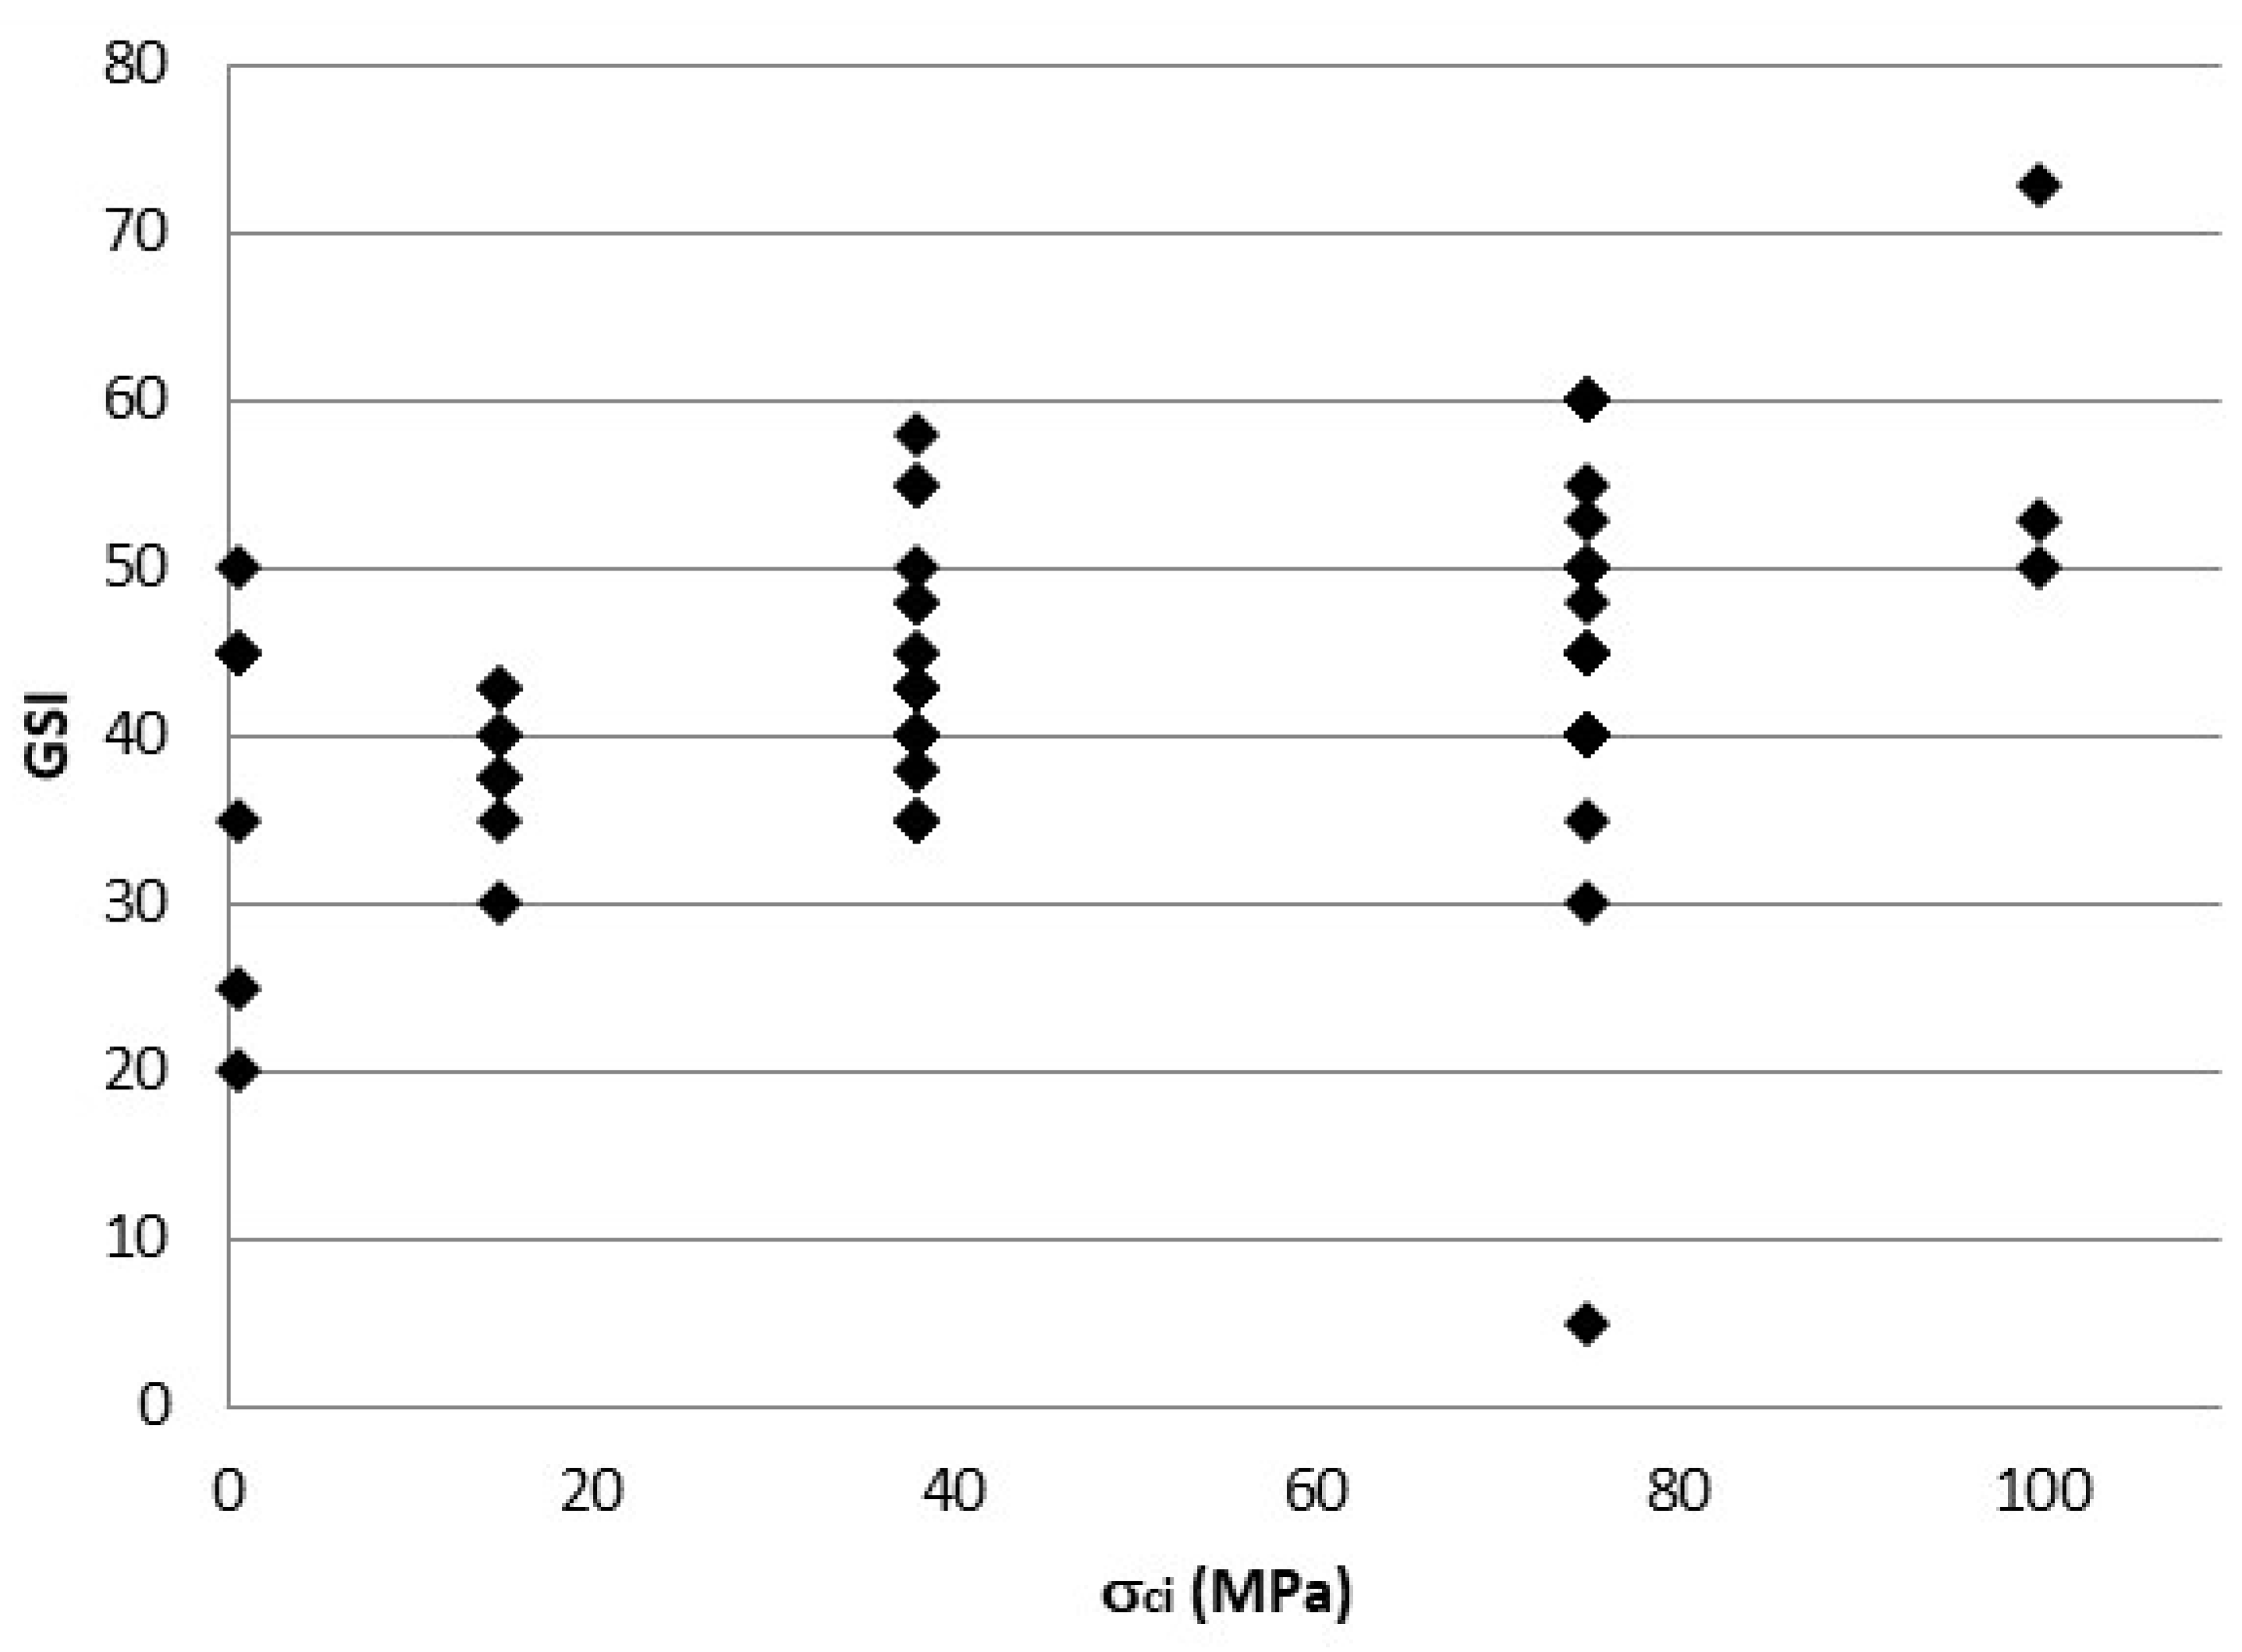
The trend in σci against the GSI is shown in Figure 9.
It can be observed that equal values of σci are characterized by highly variable values of the GSI.
The results in terms of the GSI reported in the chart proposed by [7] show that the rock masses have a structure from disintegrated to blocky, while the surface conditions range from good to fair.
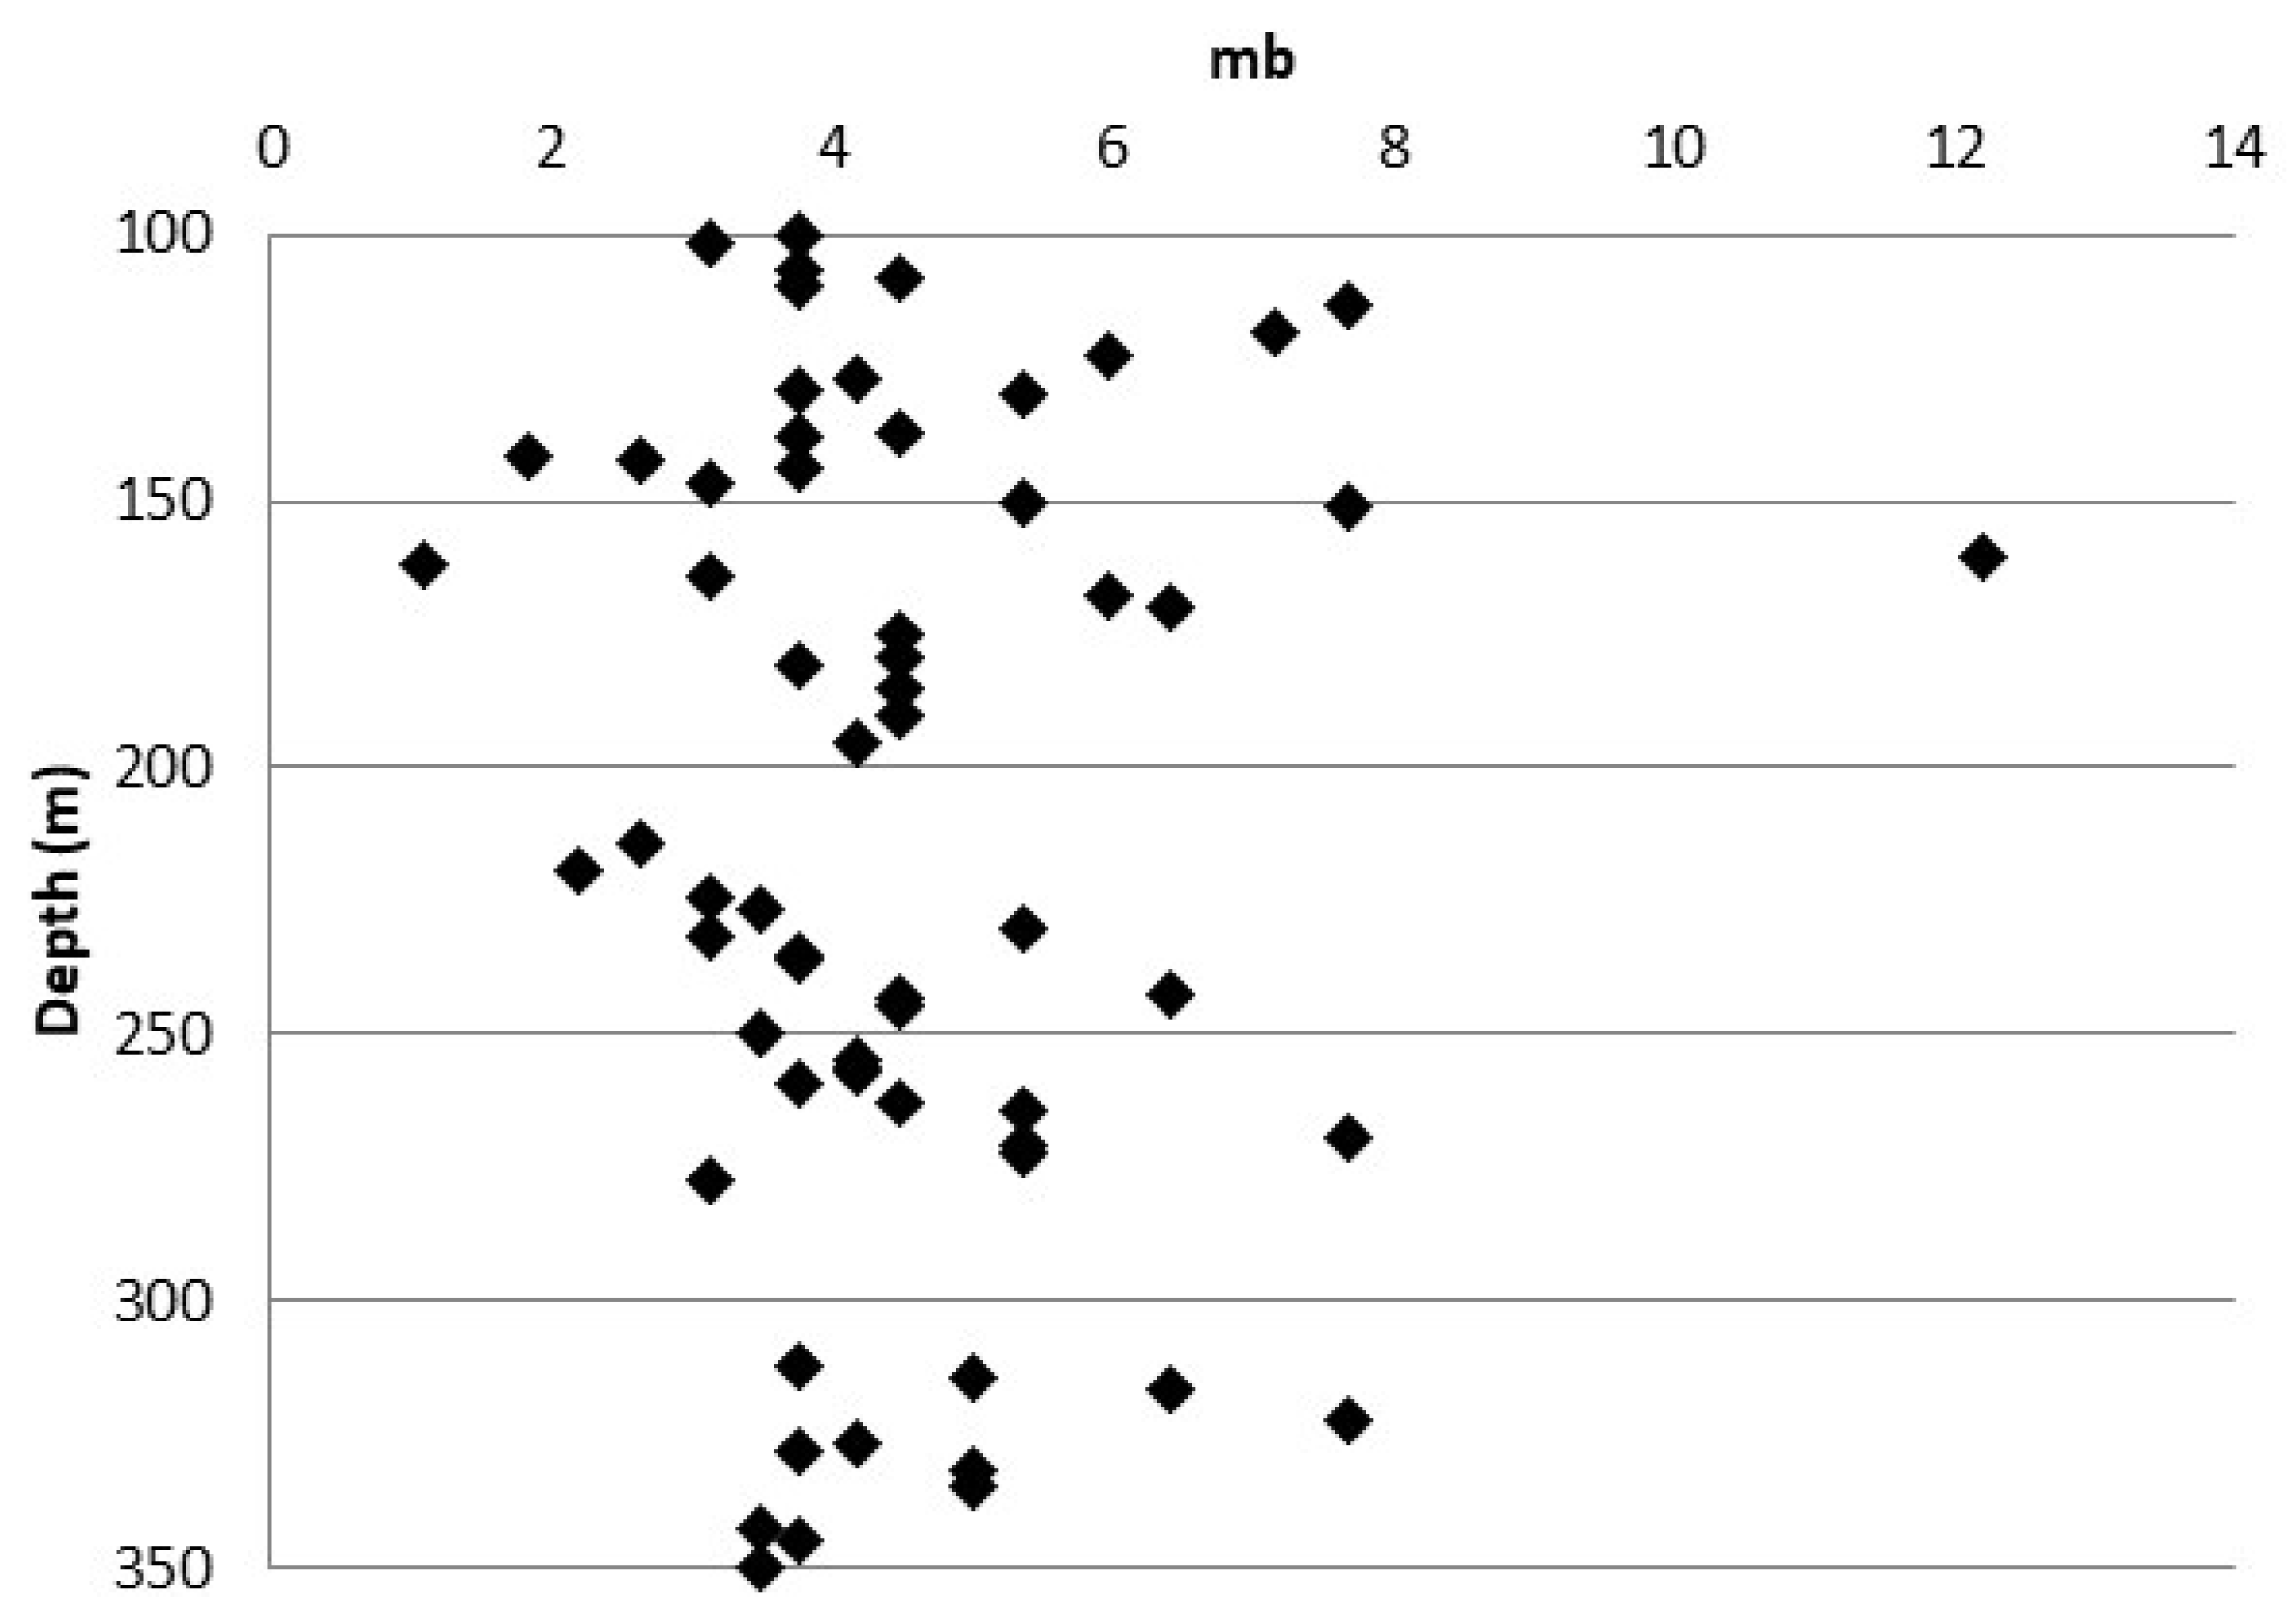
It can be observed that the mb values, reduced values of the material constant mi (assumed equal to 32), change from 1.1 to 12.2 along the borehole.
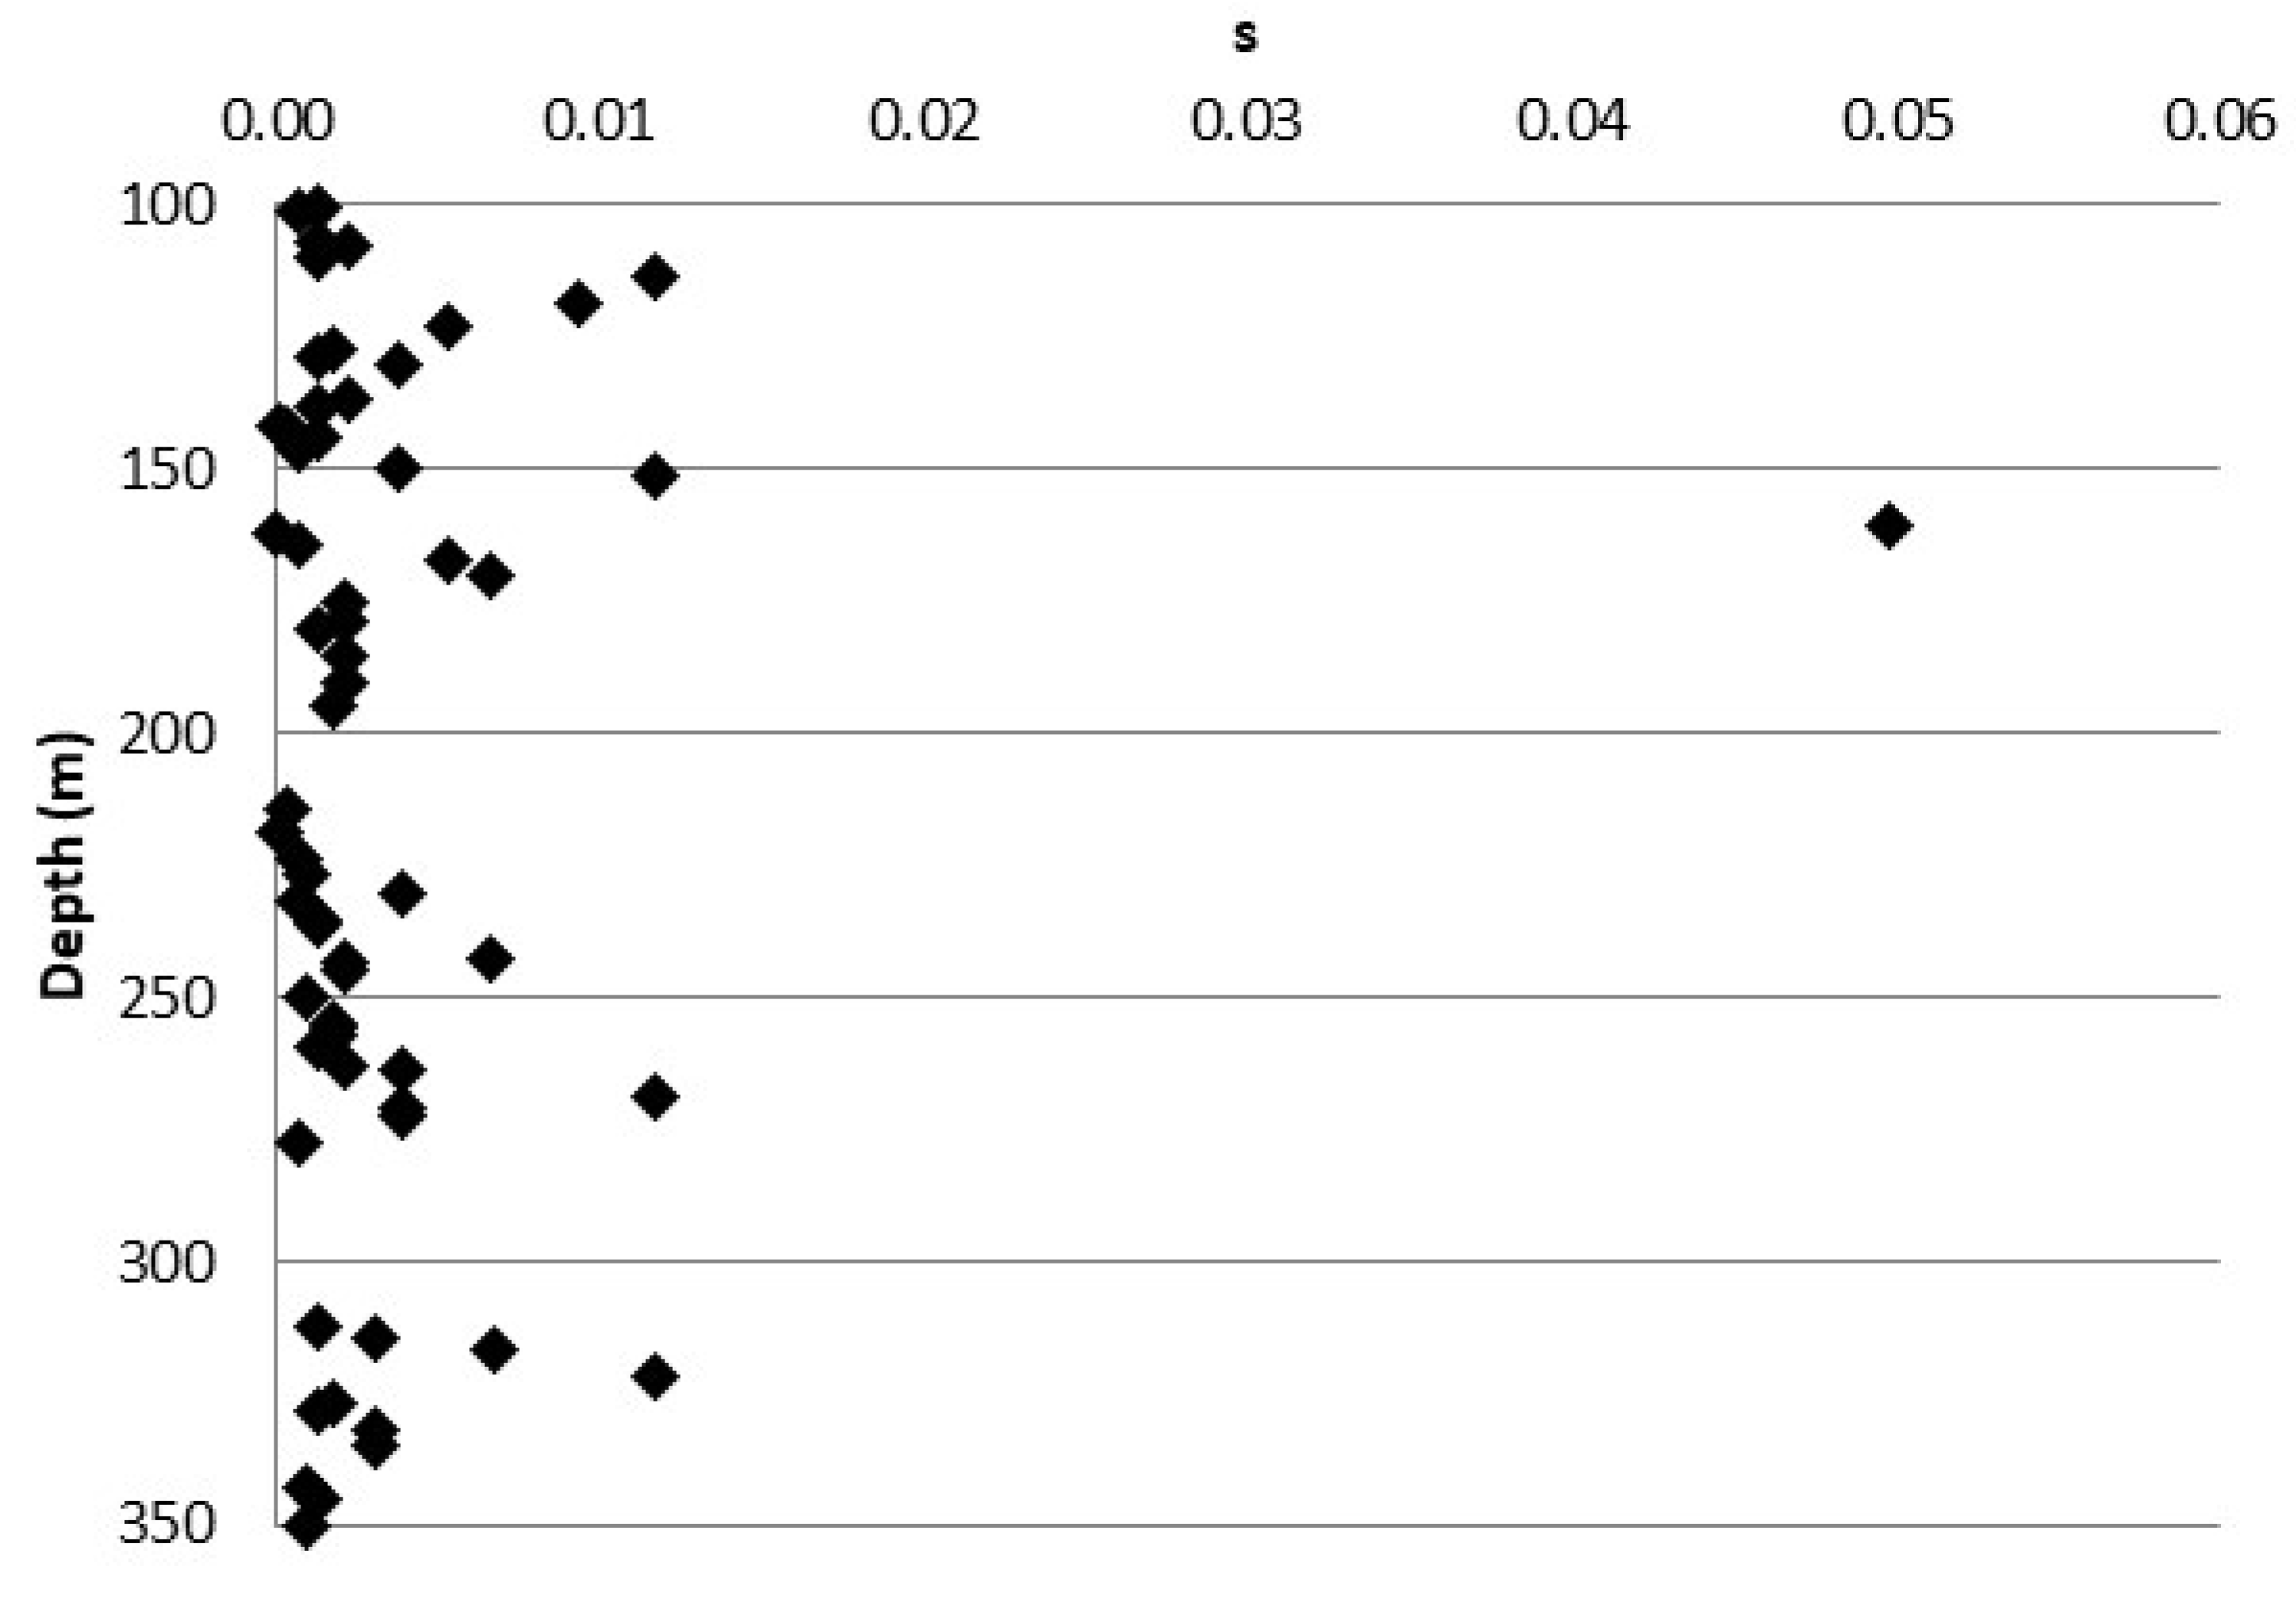
Figure 11 shows that the s values change especially from 0.000026 to 0.0498 along the borehole.
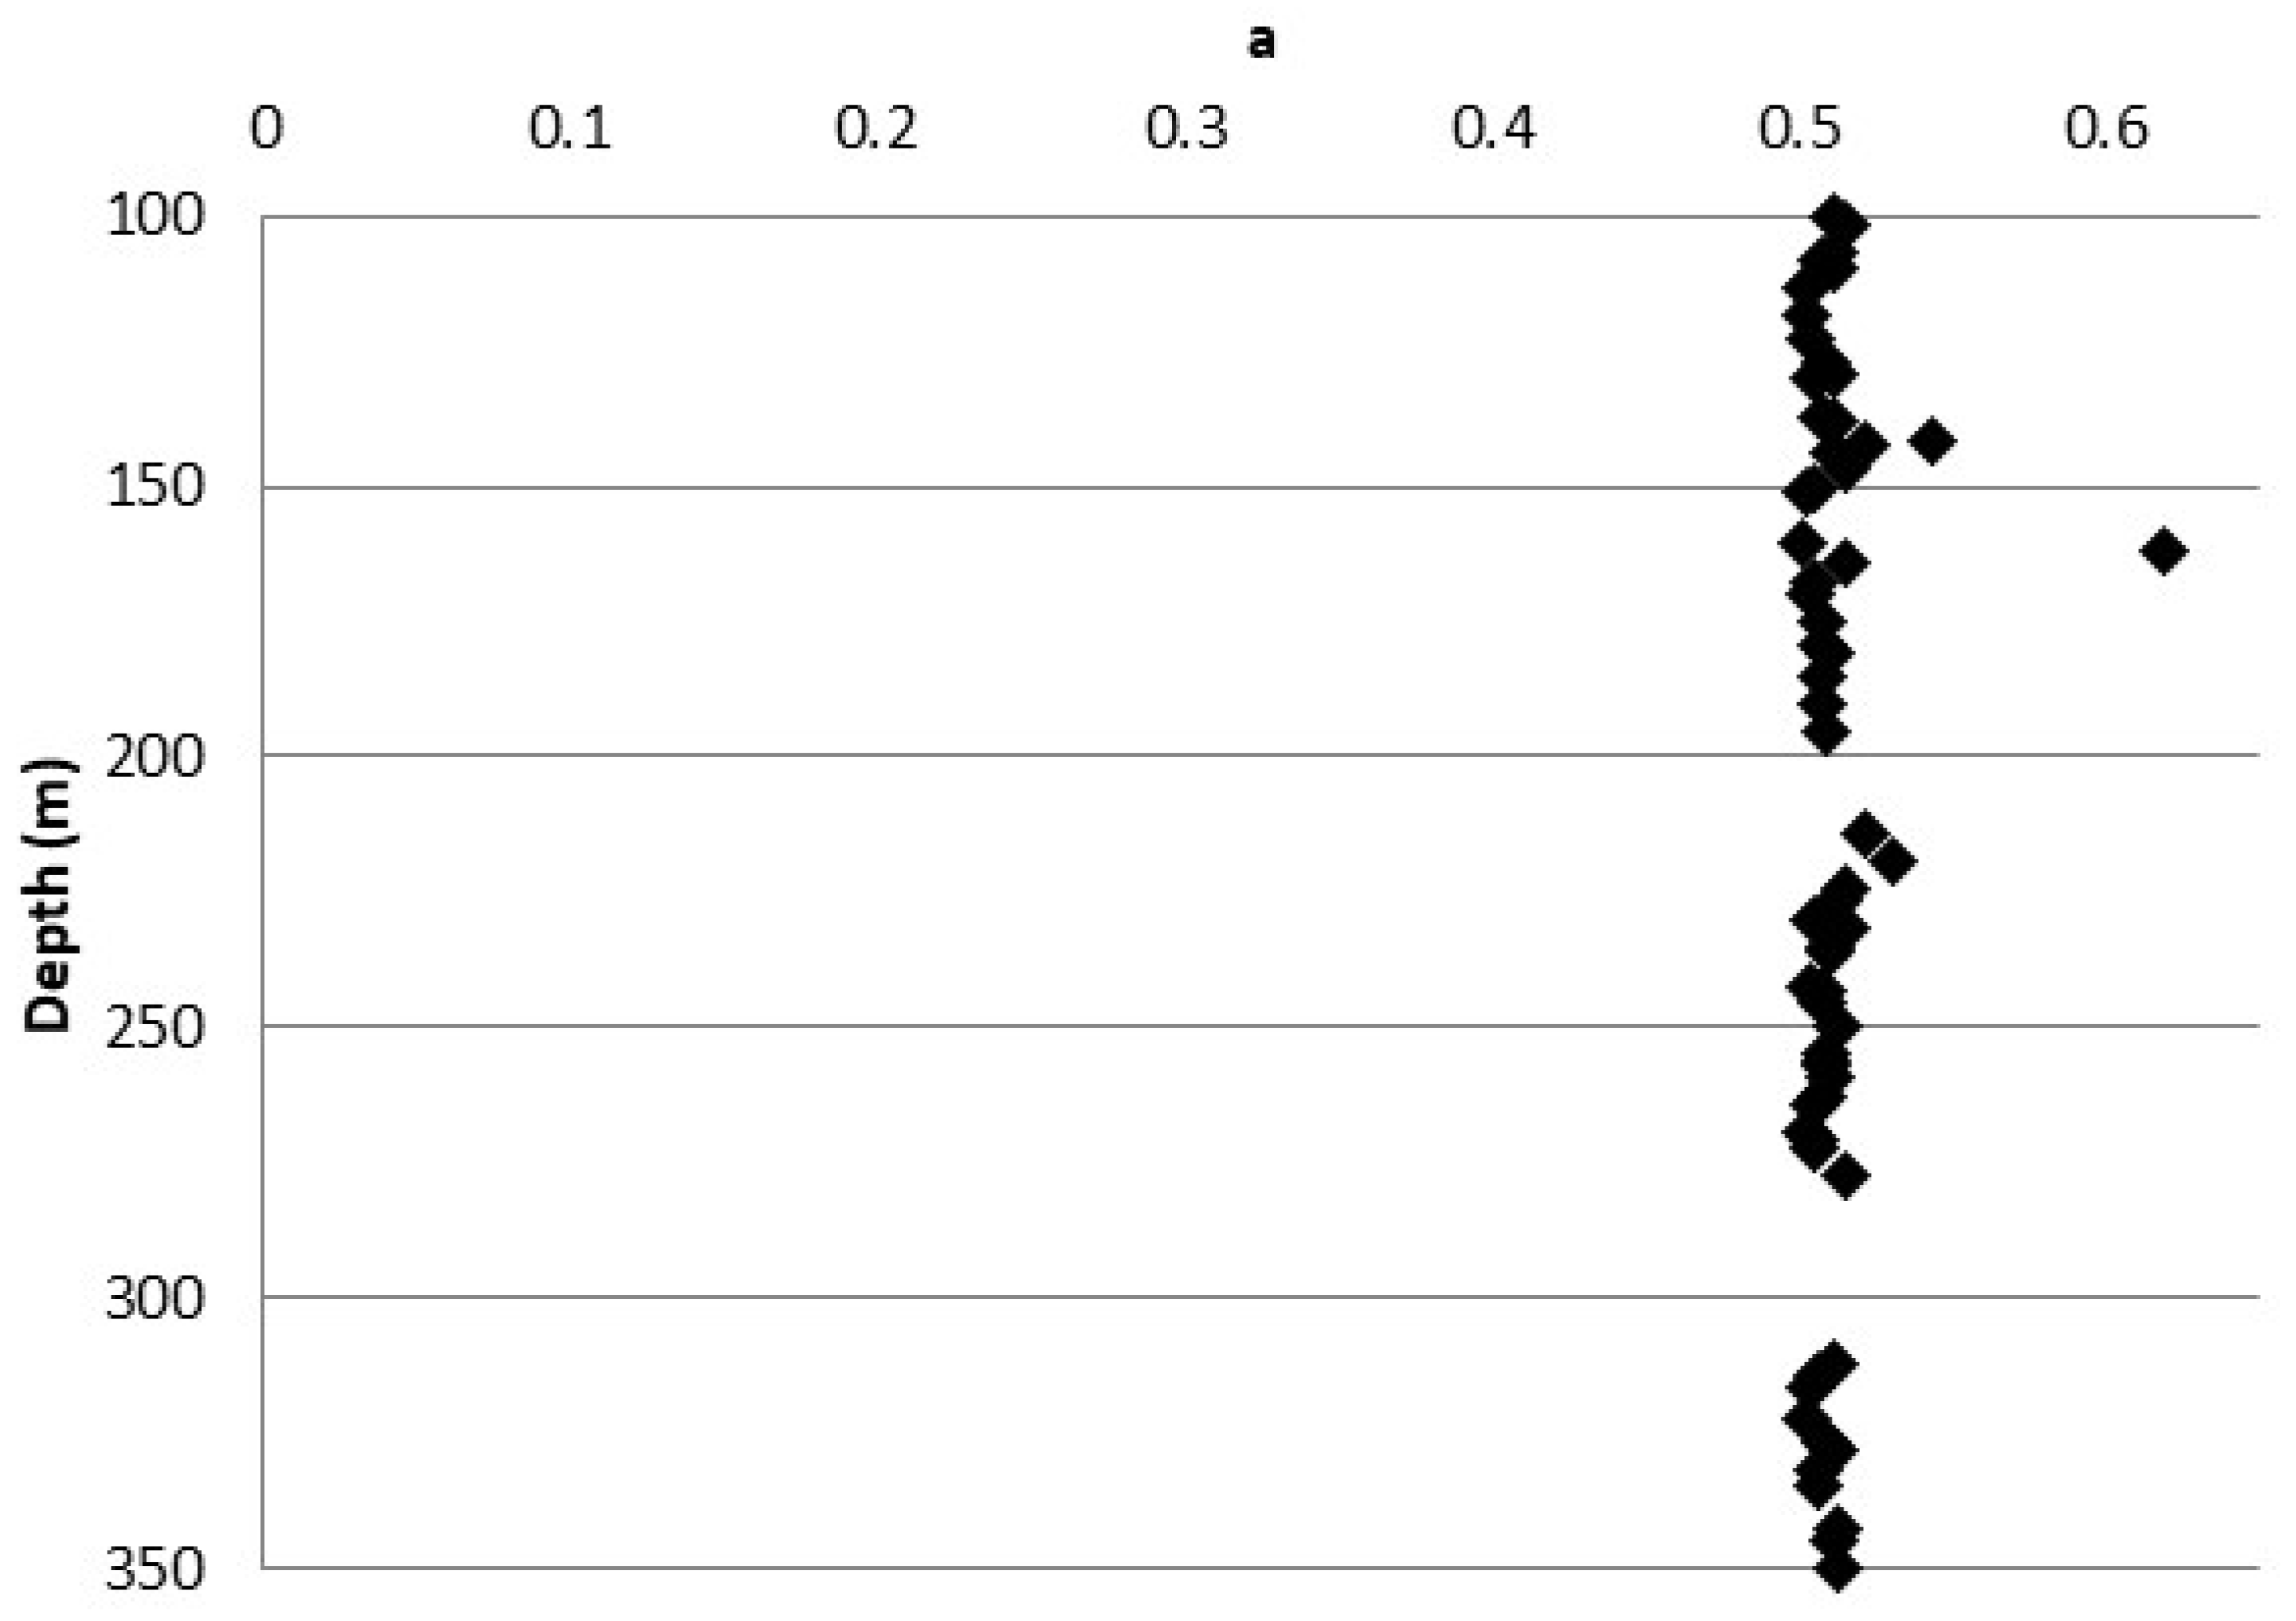
The trend shown in Figure 12 highlights that the values of a change from 0.501 to 0.619, although most values are equal to 0.501.
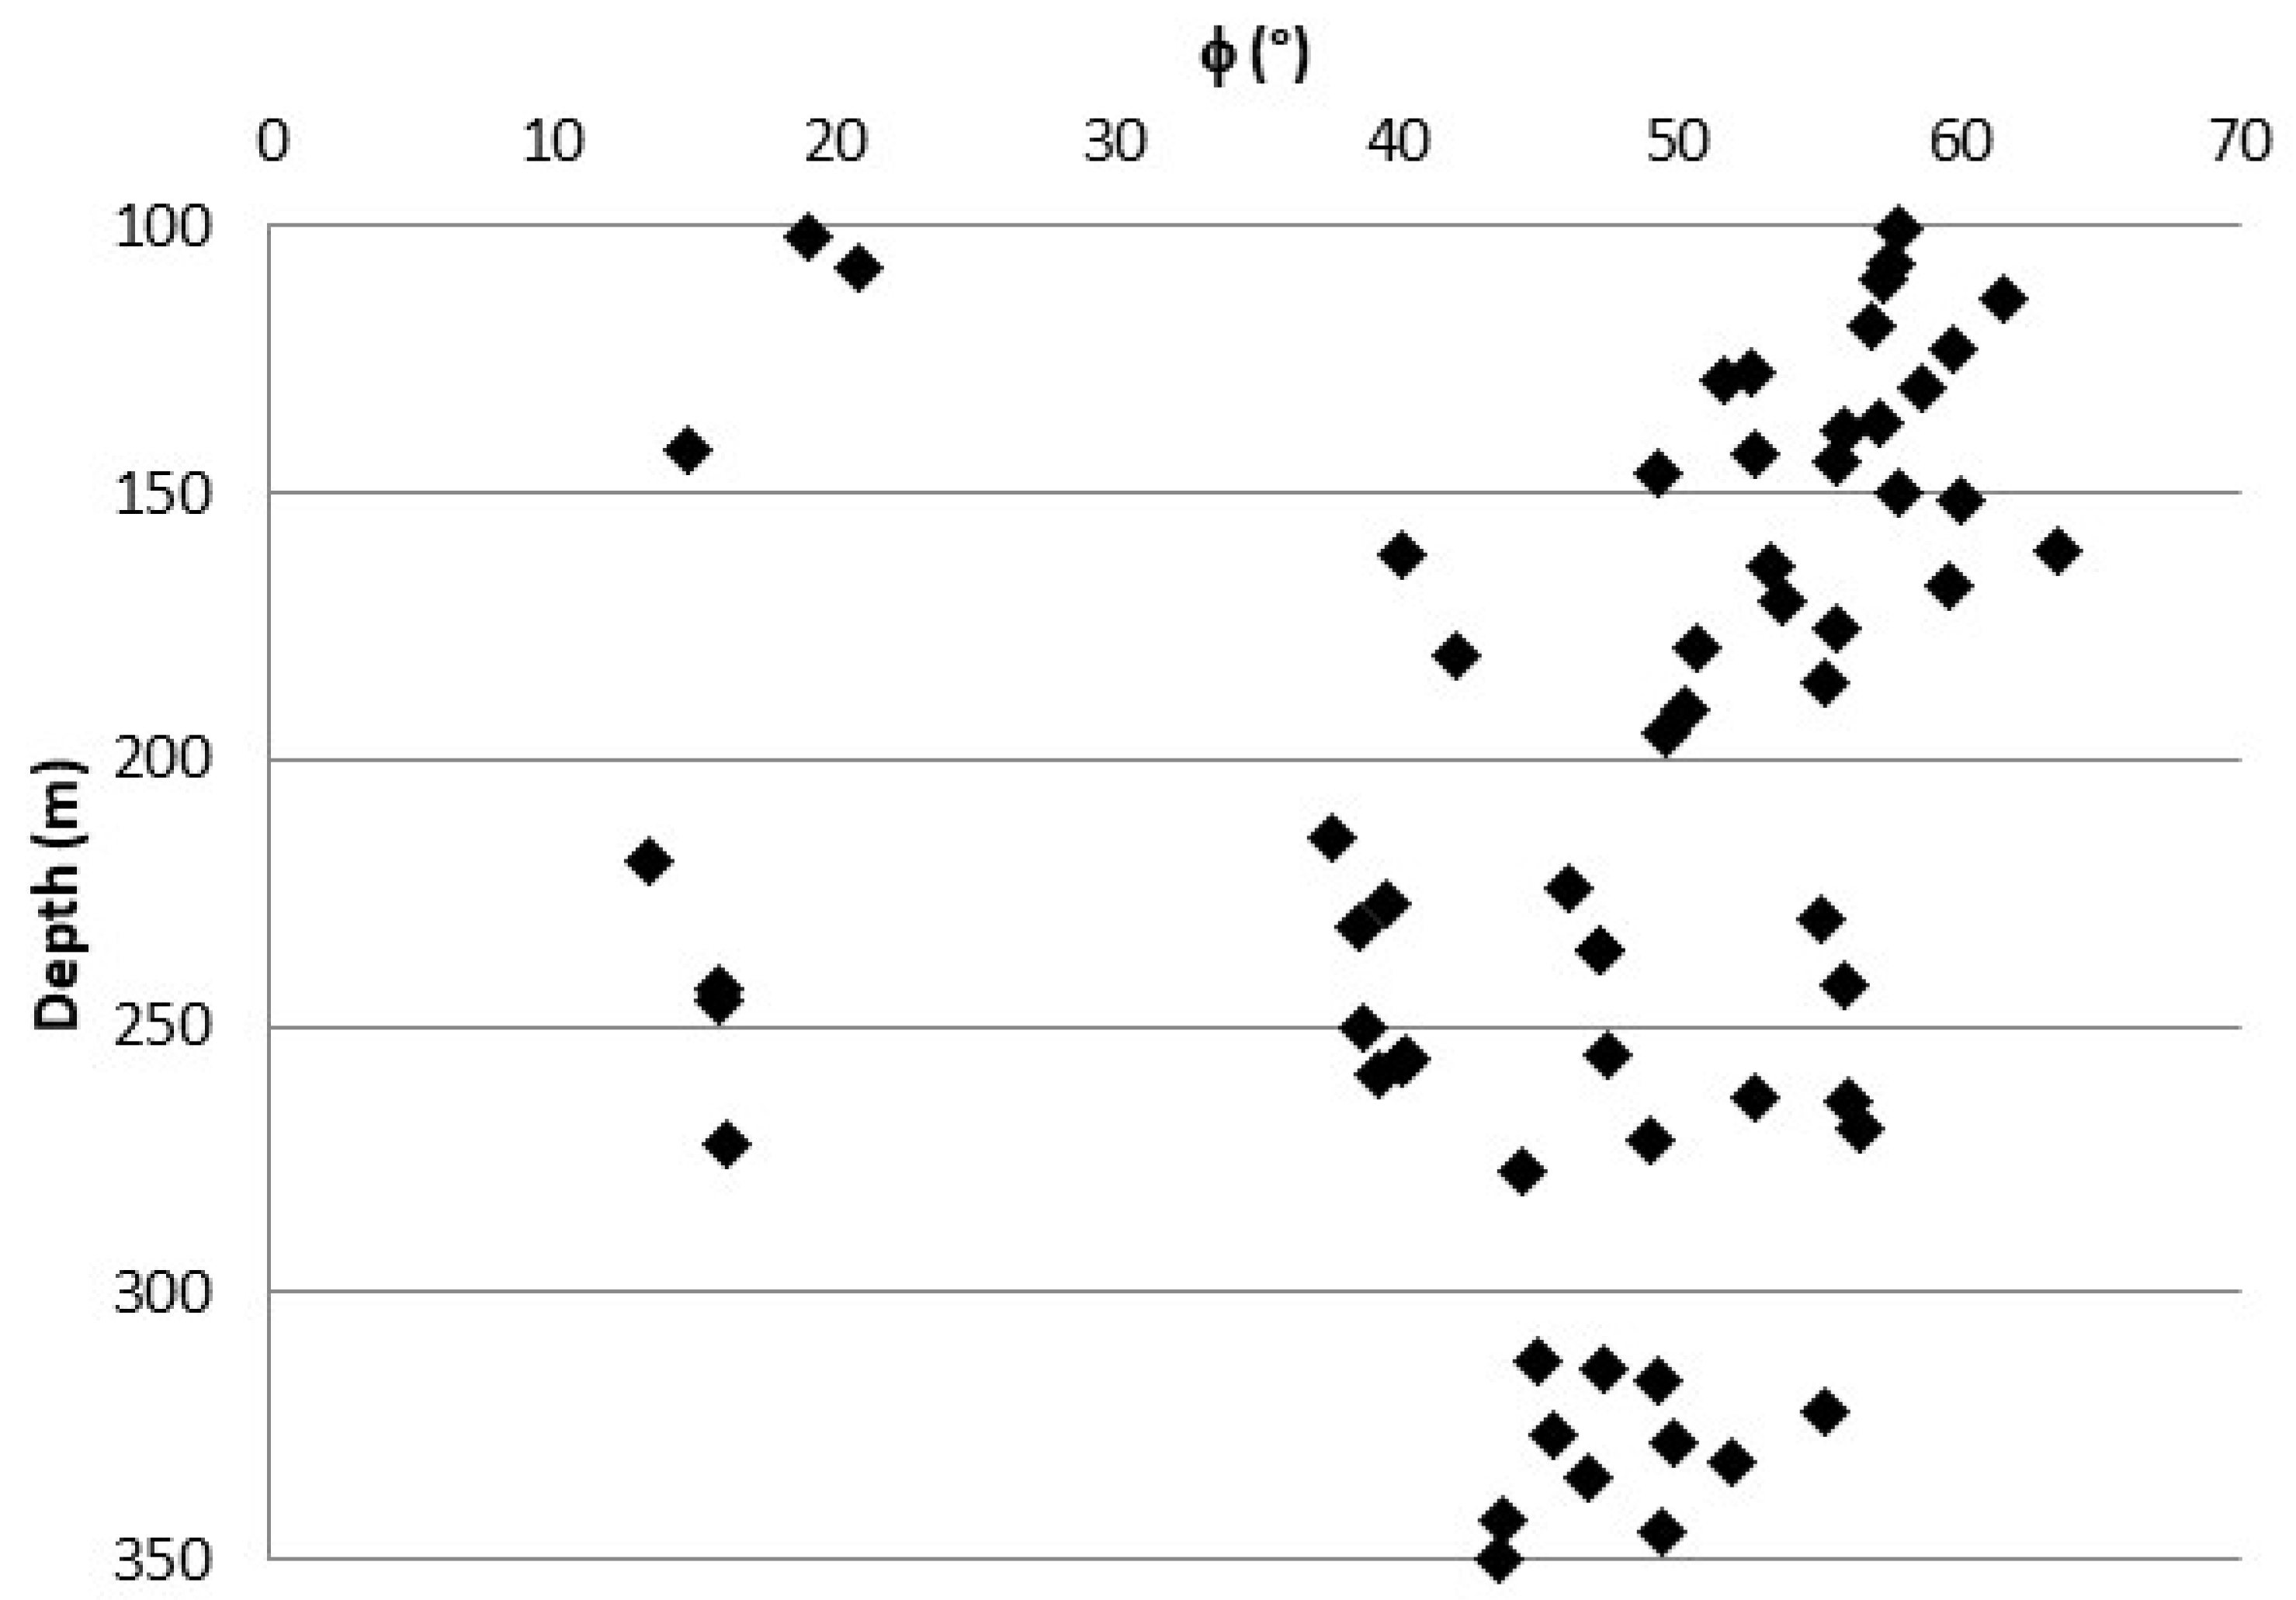
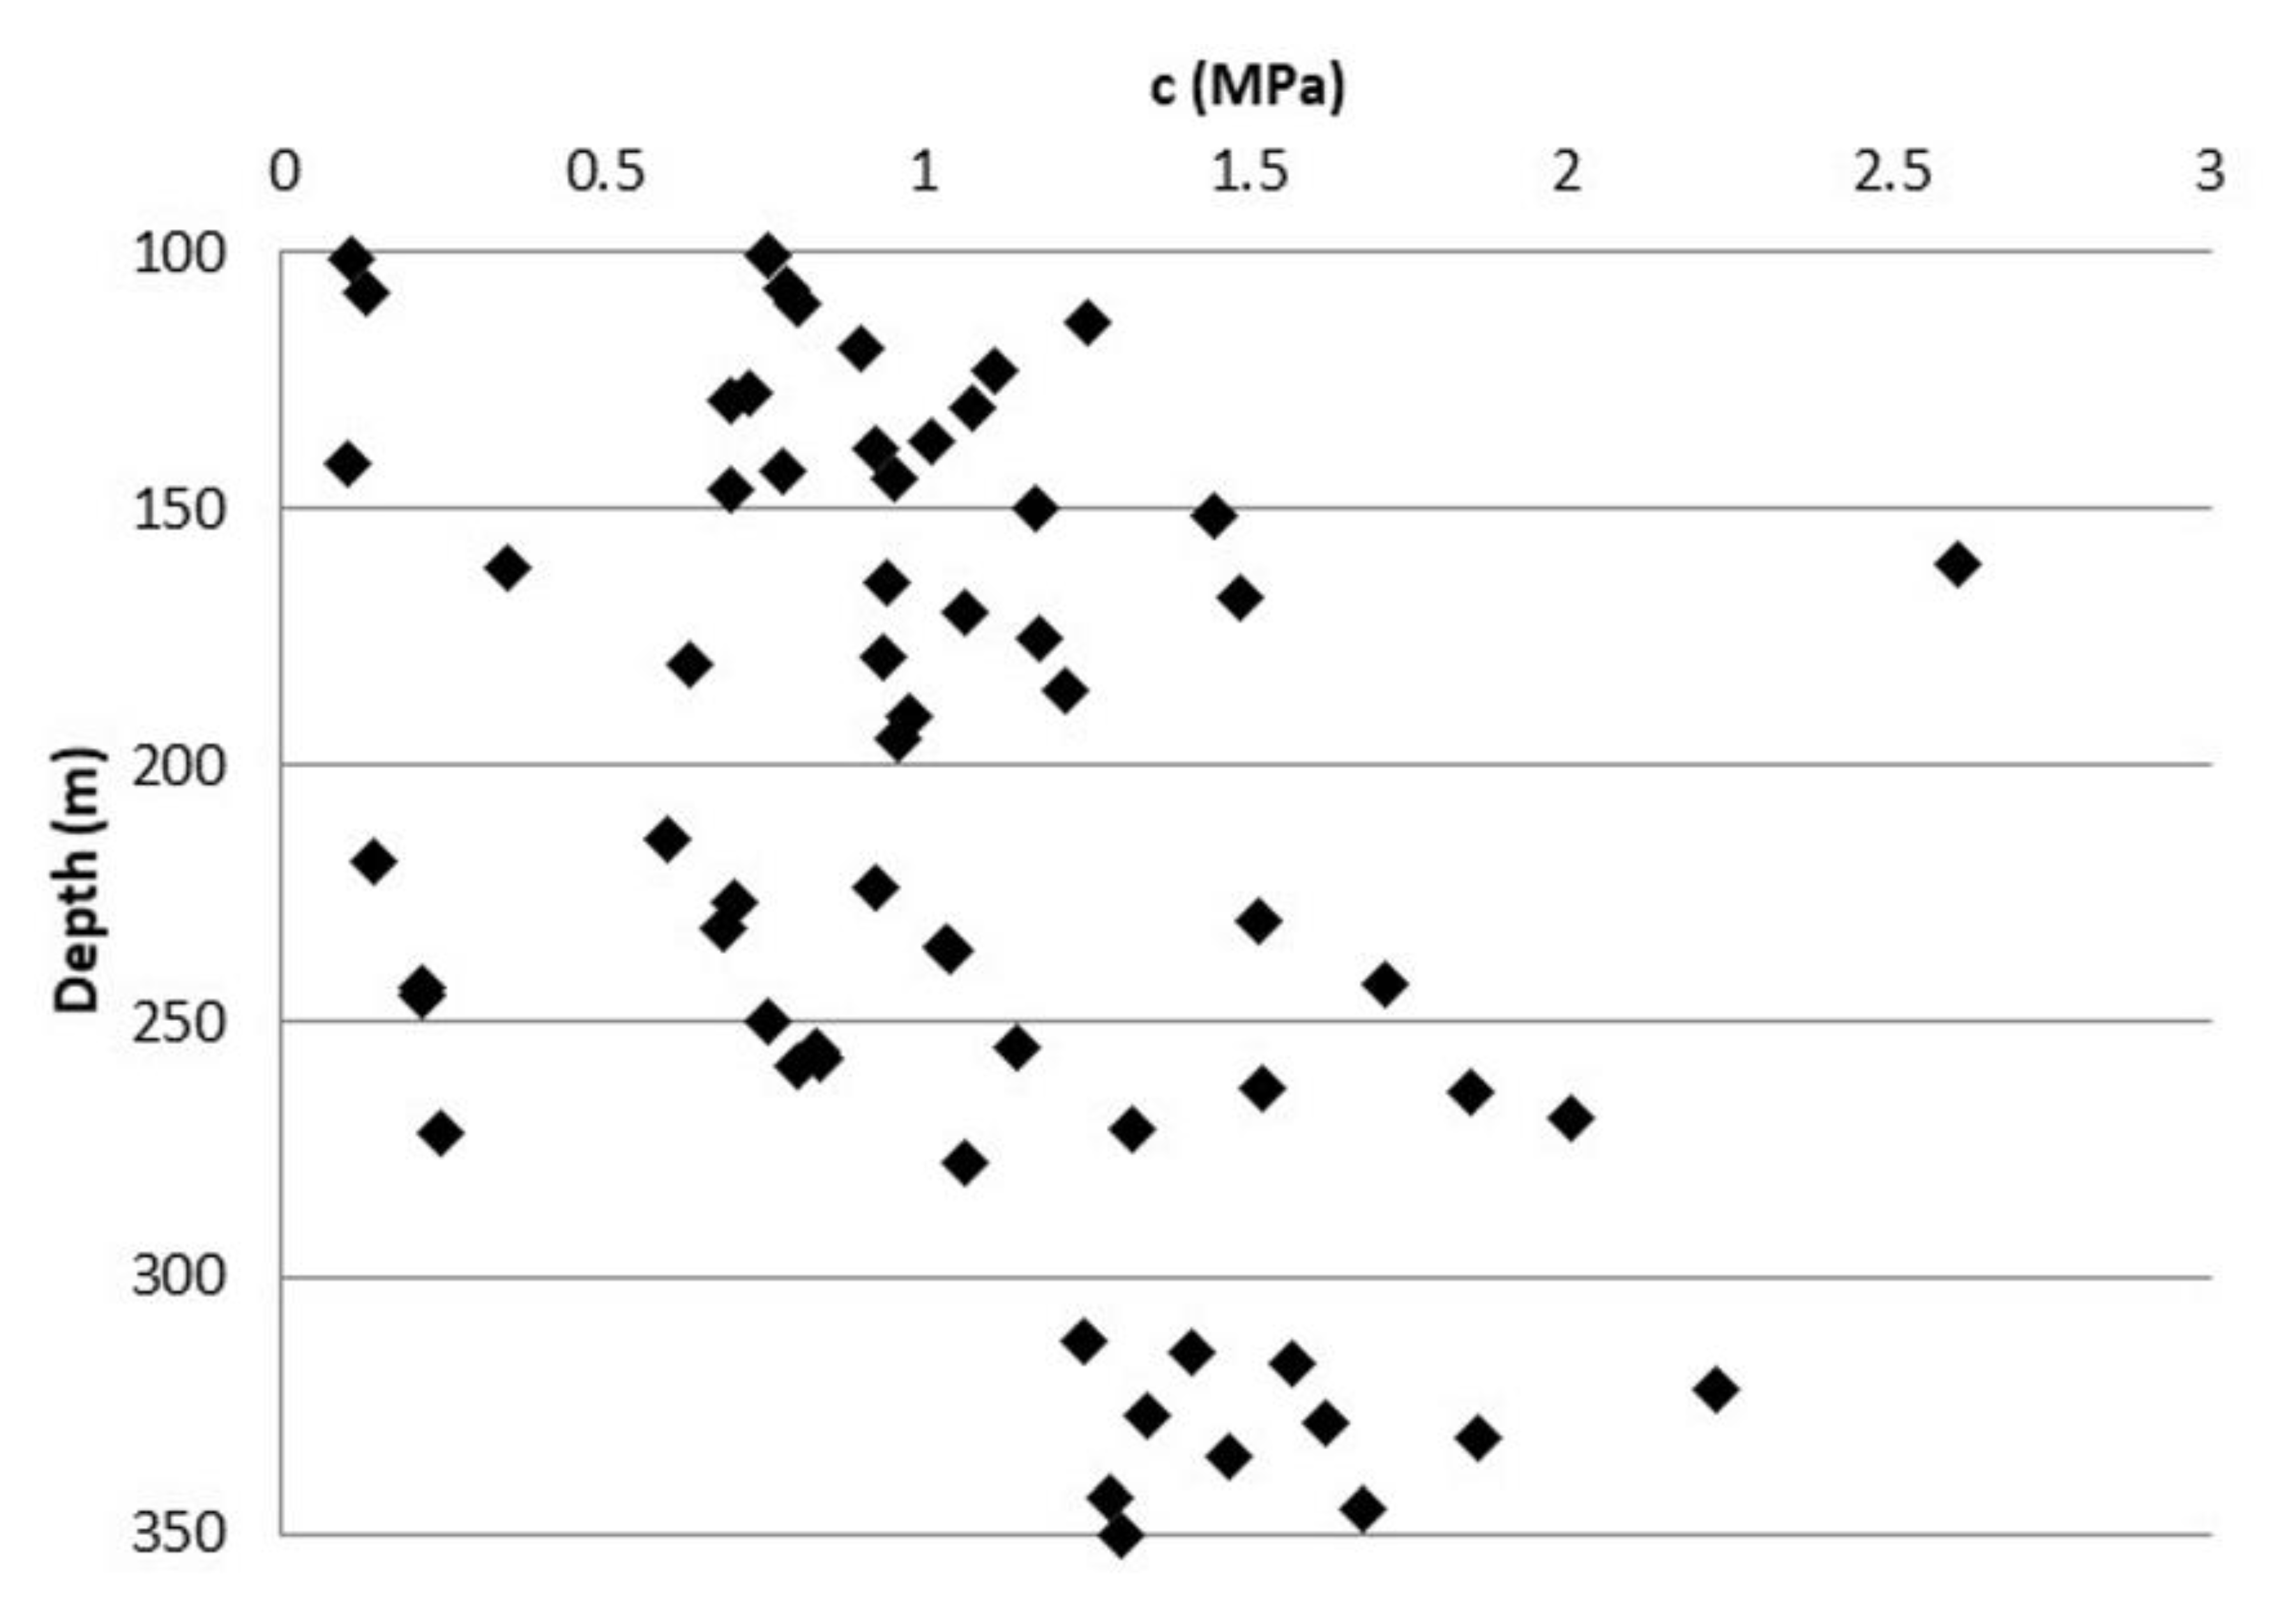
The values of the equivalent friction angles and the cohesive strengths for the crossed rock masses are shown in Figure 13 and Figure 14.
The friction angle values change from 13° to 64°, although most values are between 37° and 60°.
Regarding the cohesion, the values change from 0.10 to 2.61 MPa, and the trend shows a great variability with the depth.
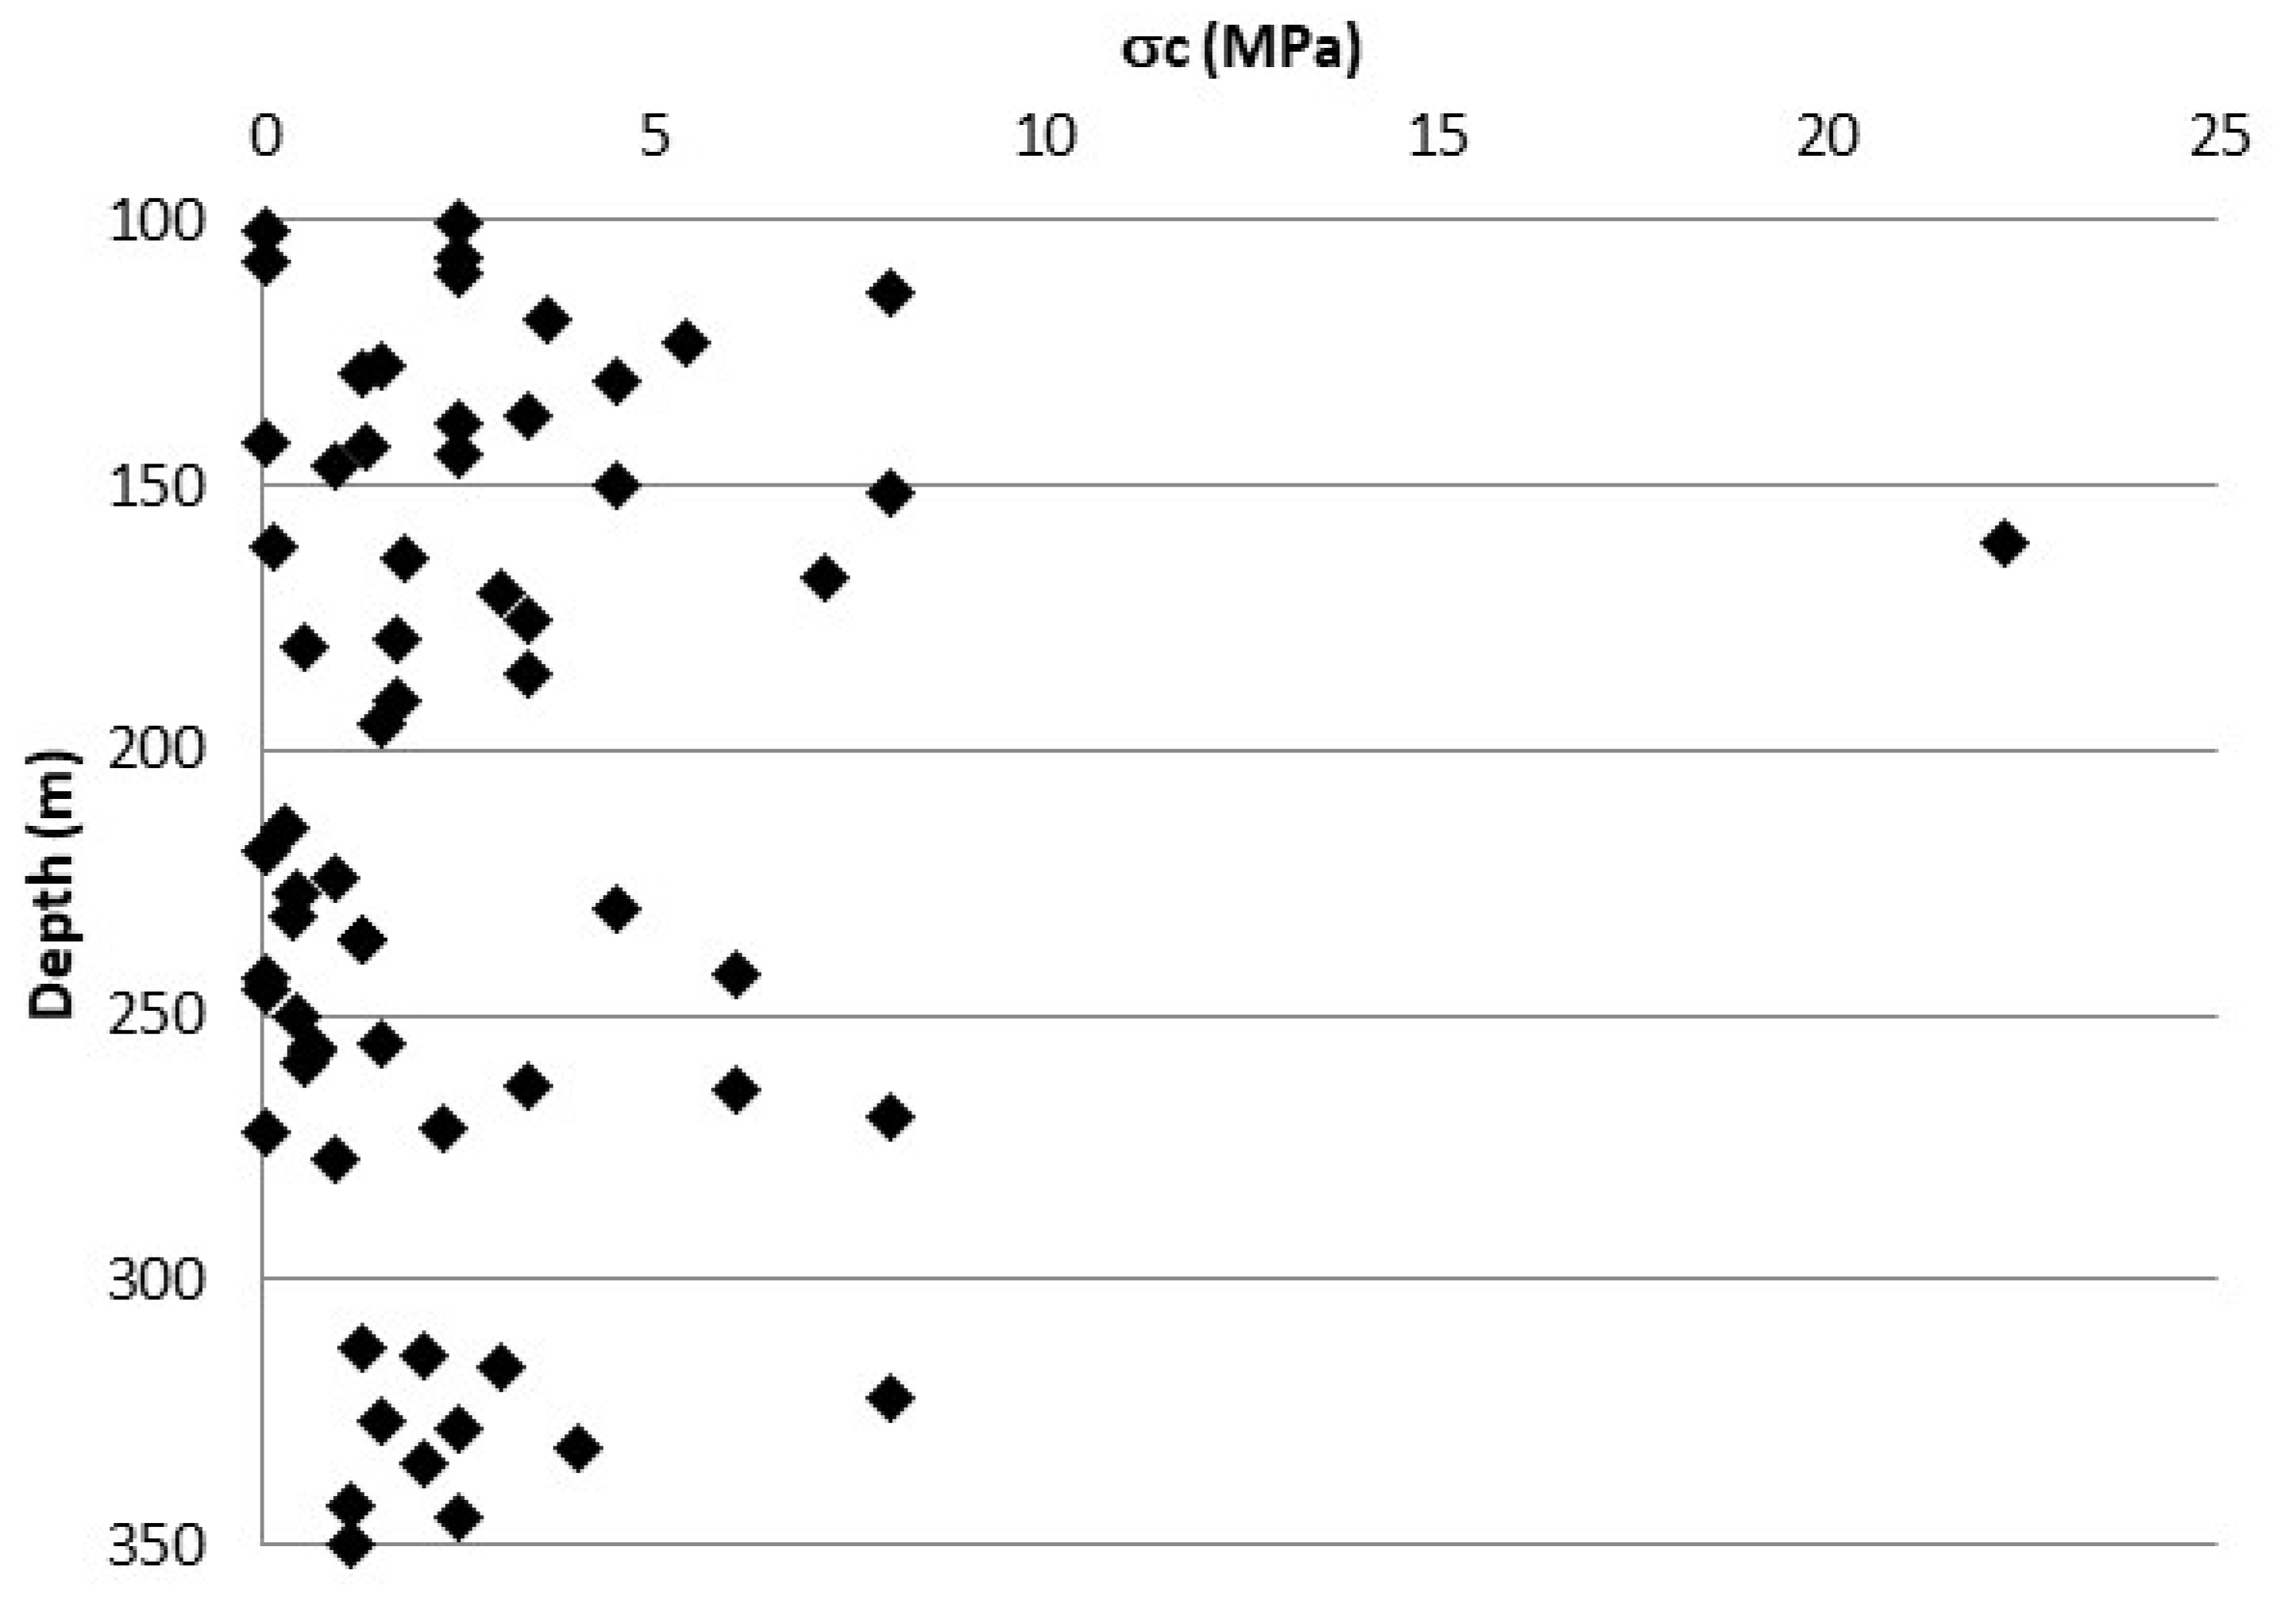
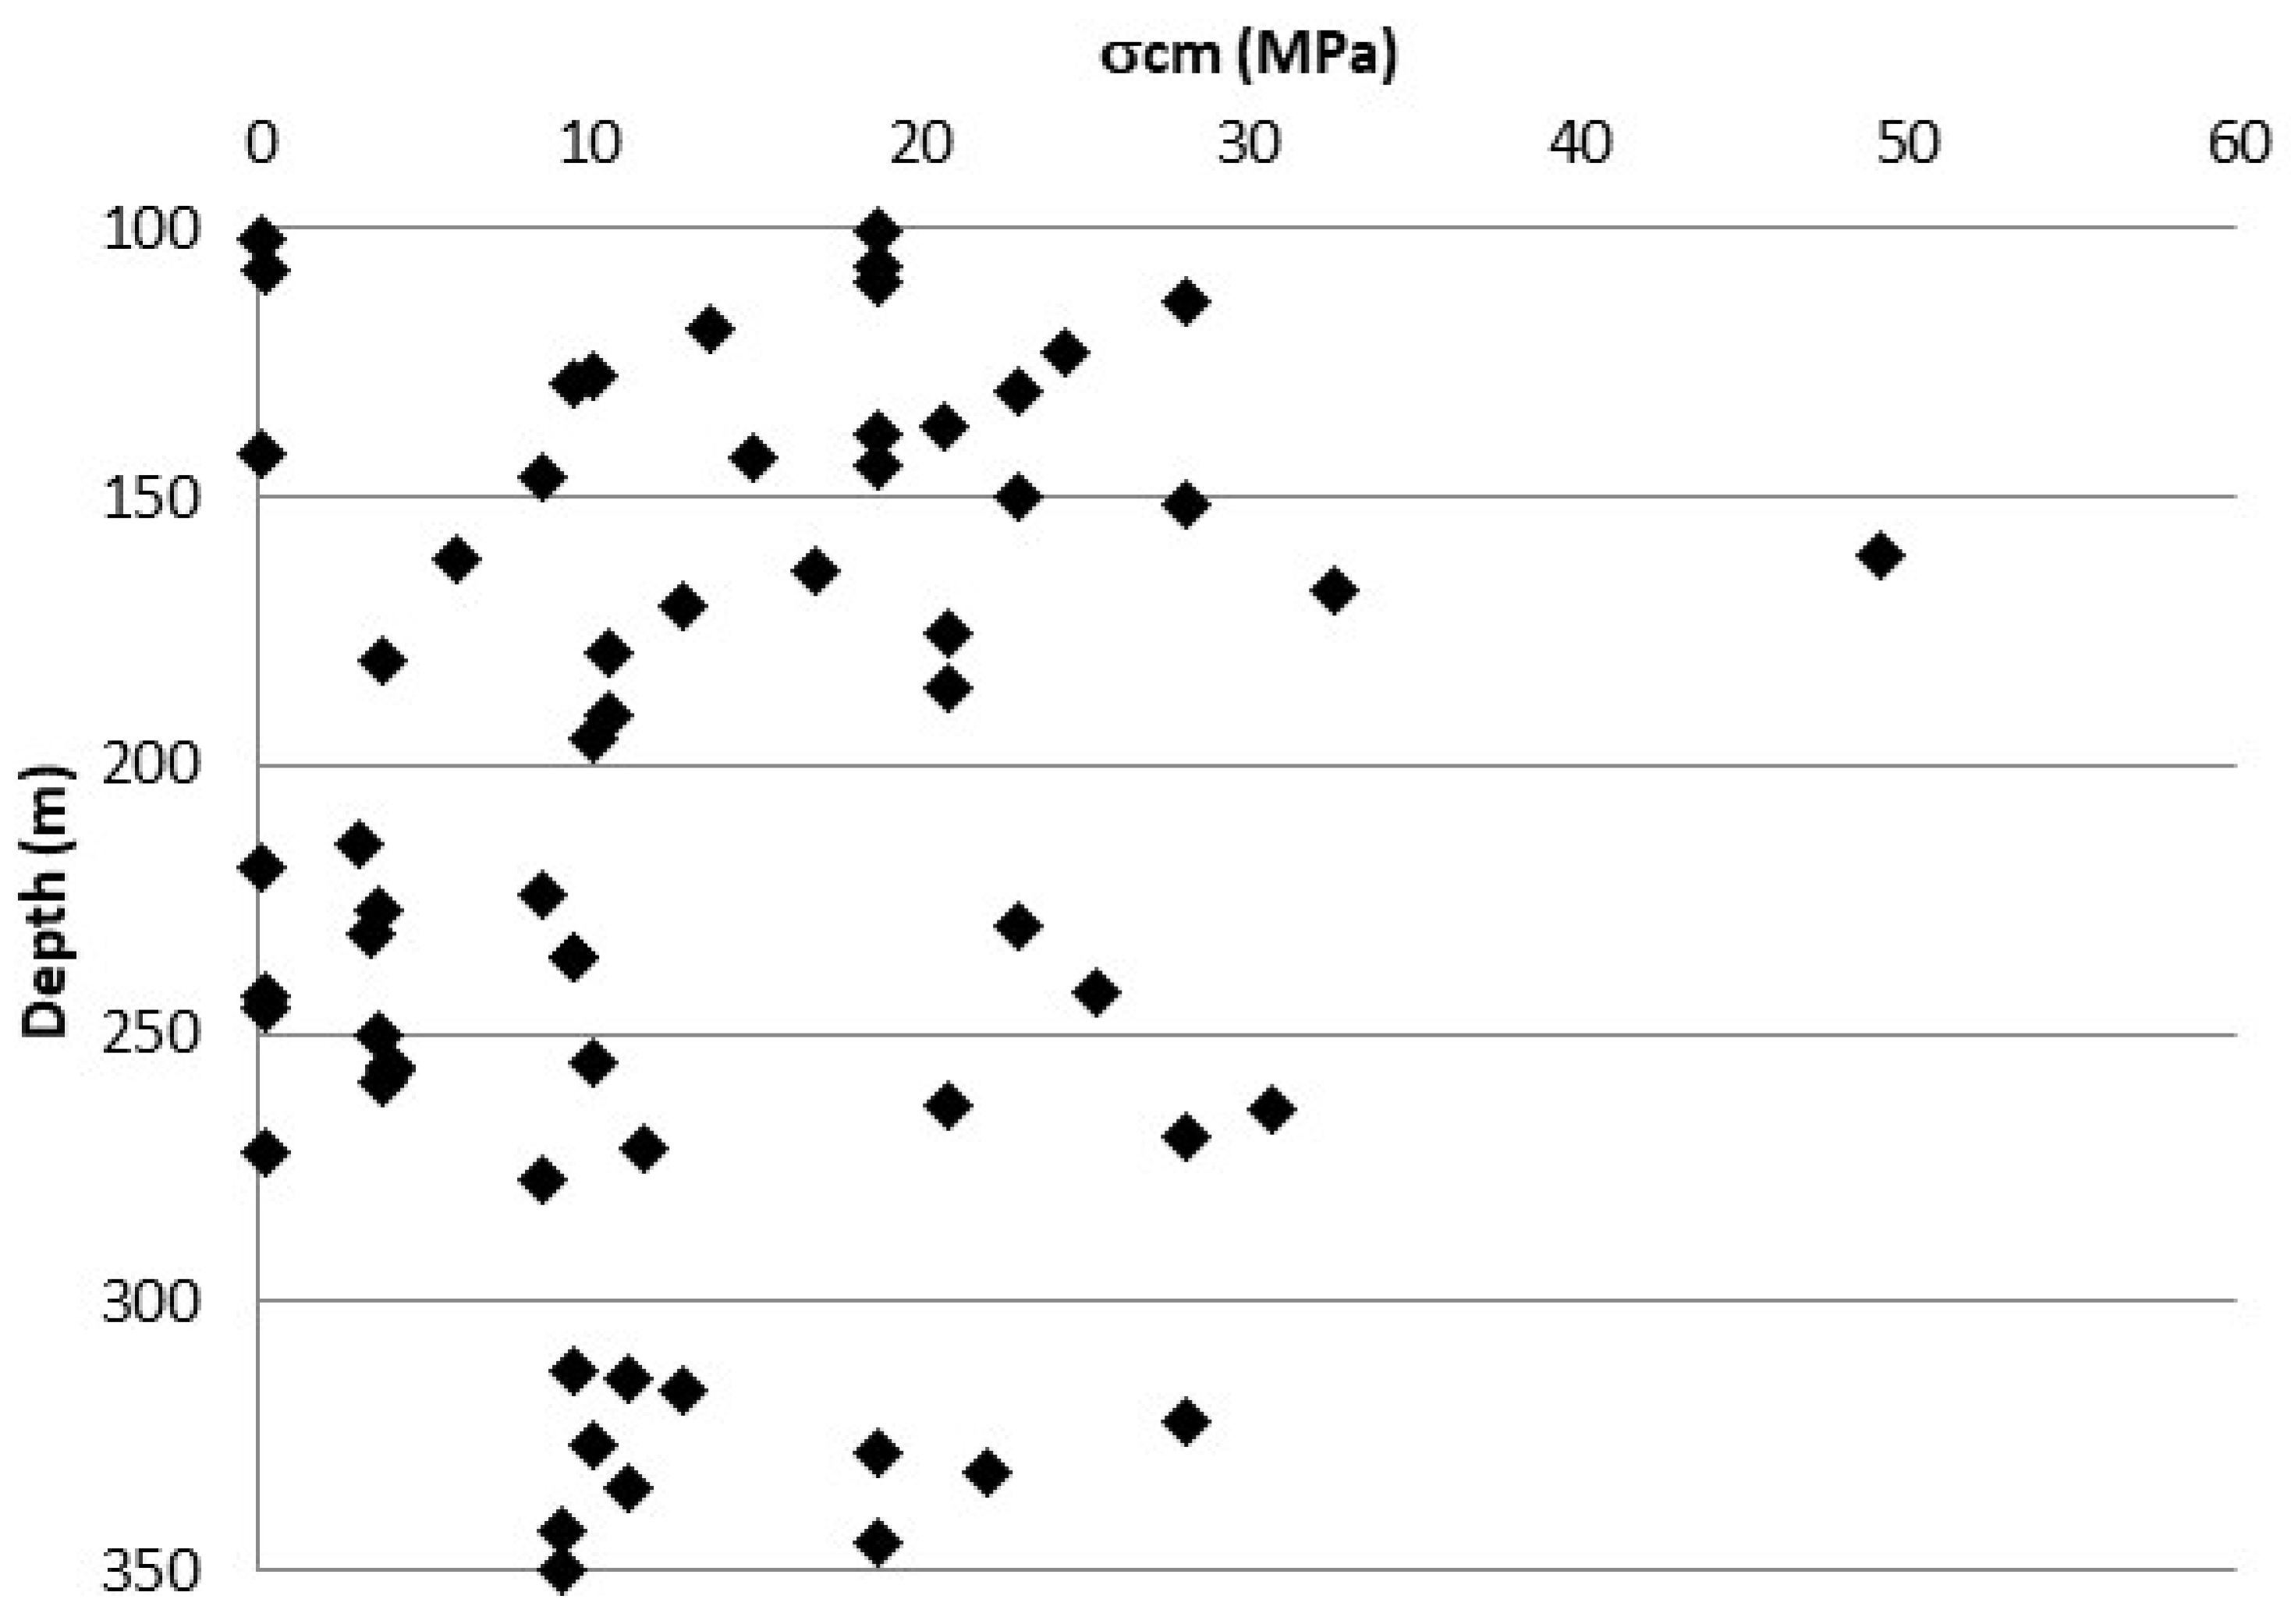
The trends in the rock mass parameters uniaxial compression strength σc and global strength σcm are shown in Figure 15 and Figure 16.
The uniaxial compression strength for the rock mass changes from 0.01 to 22.24 MPa. The global strength for the rock mass changes from 0.1 to 49 MPa.
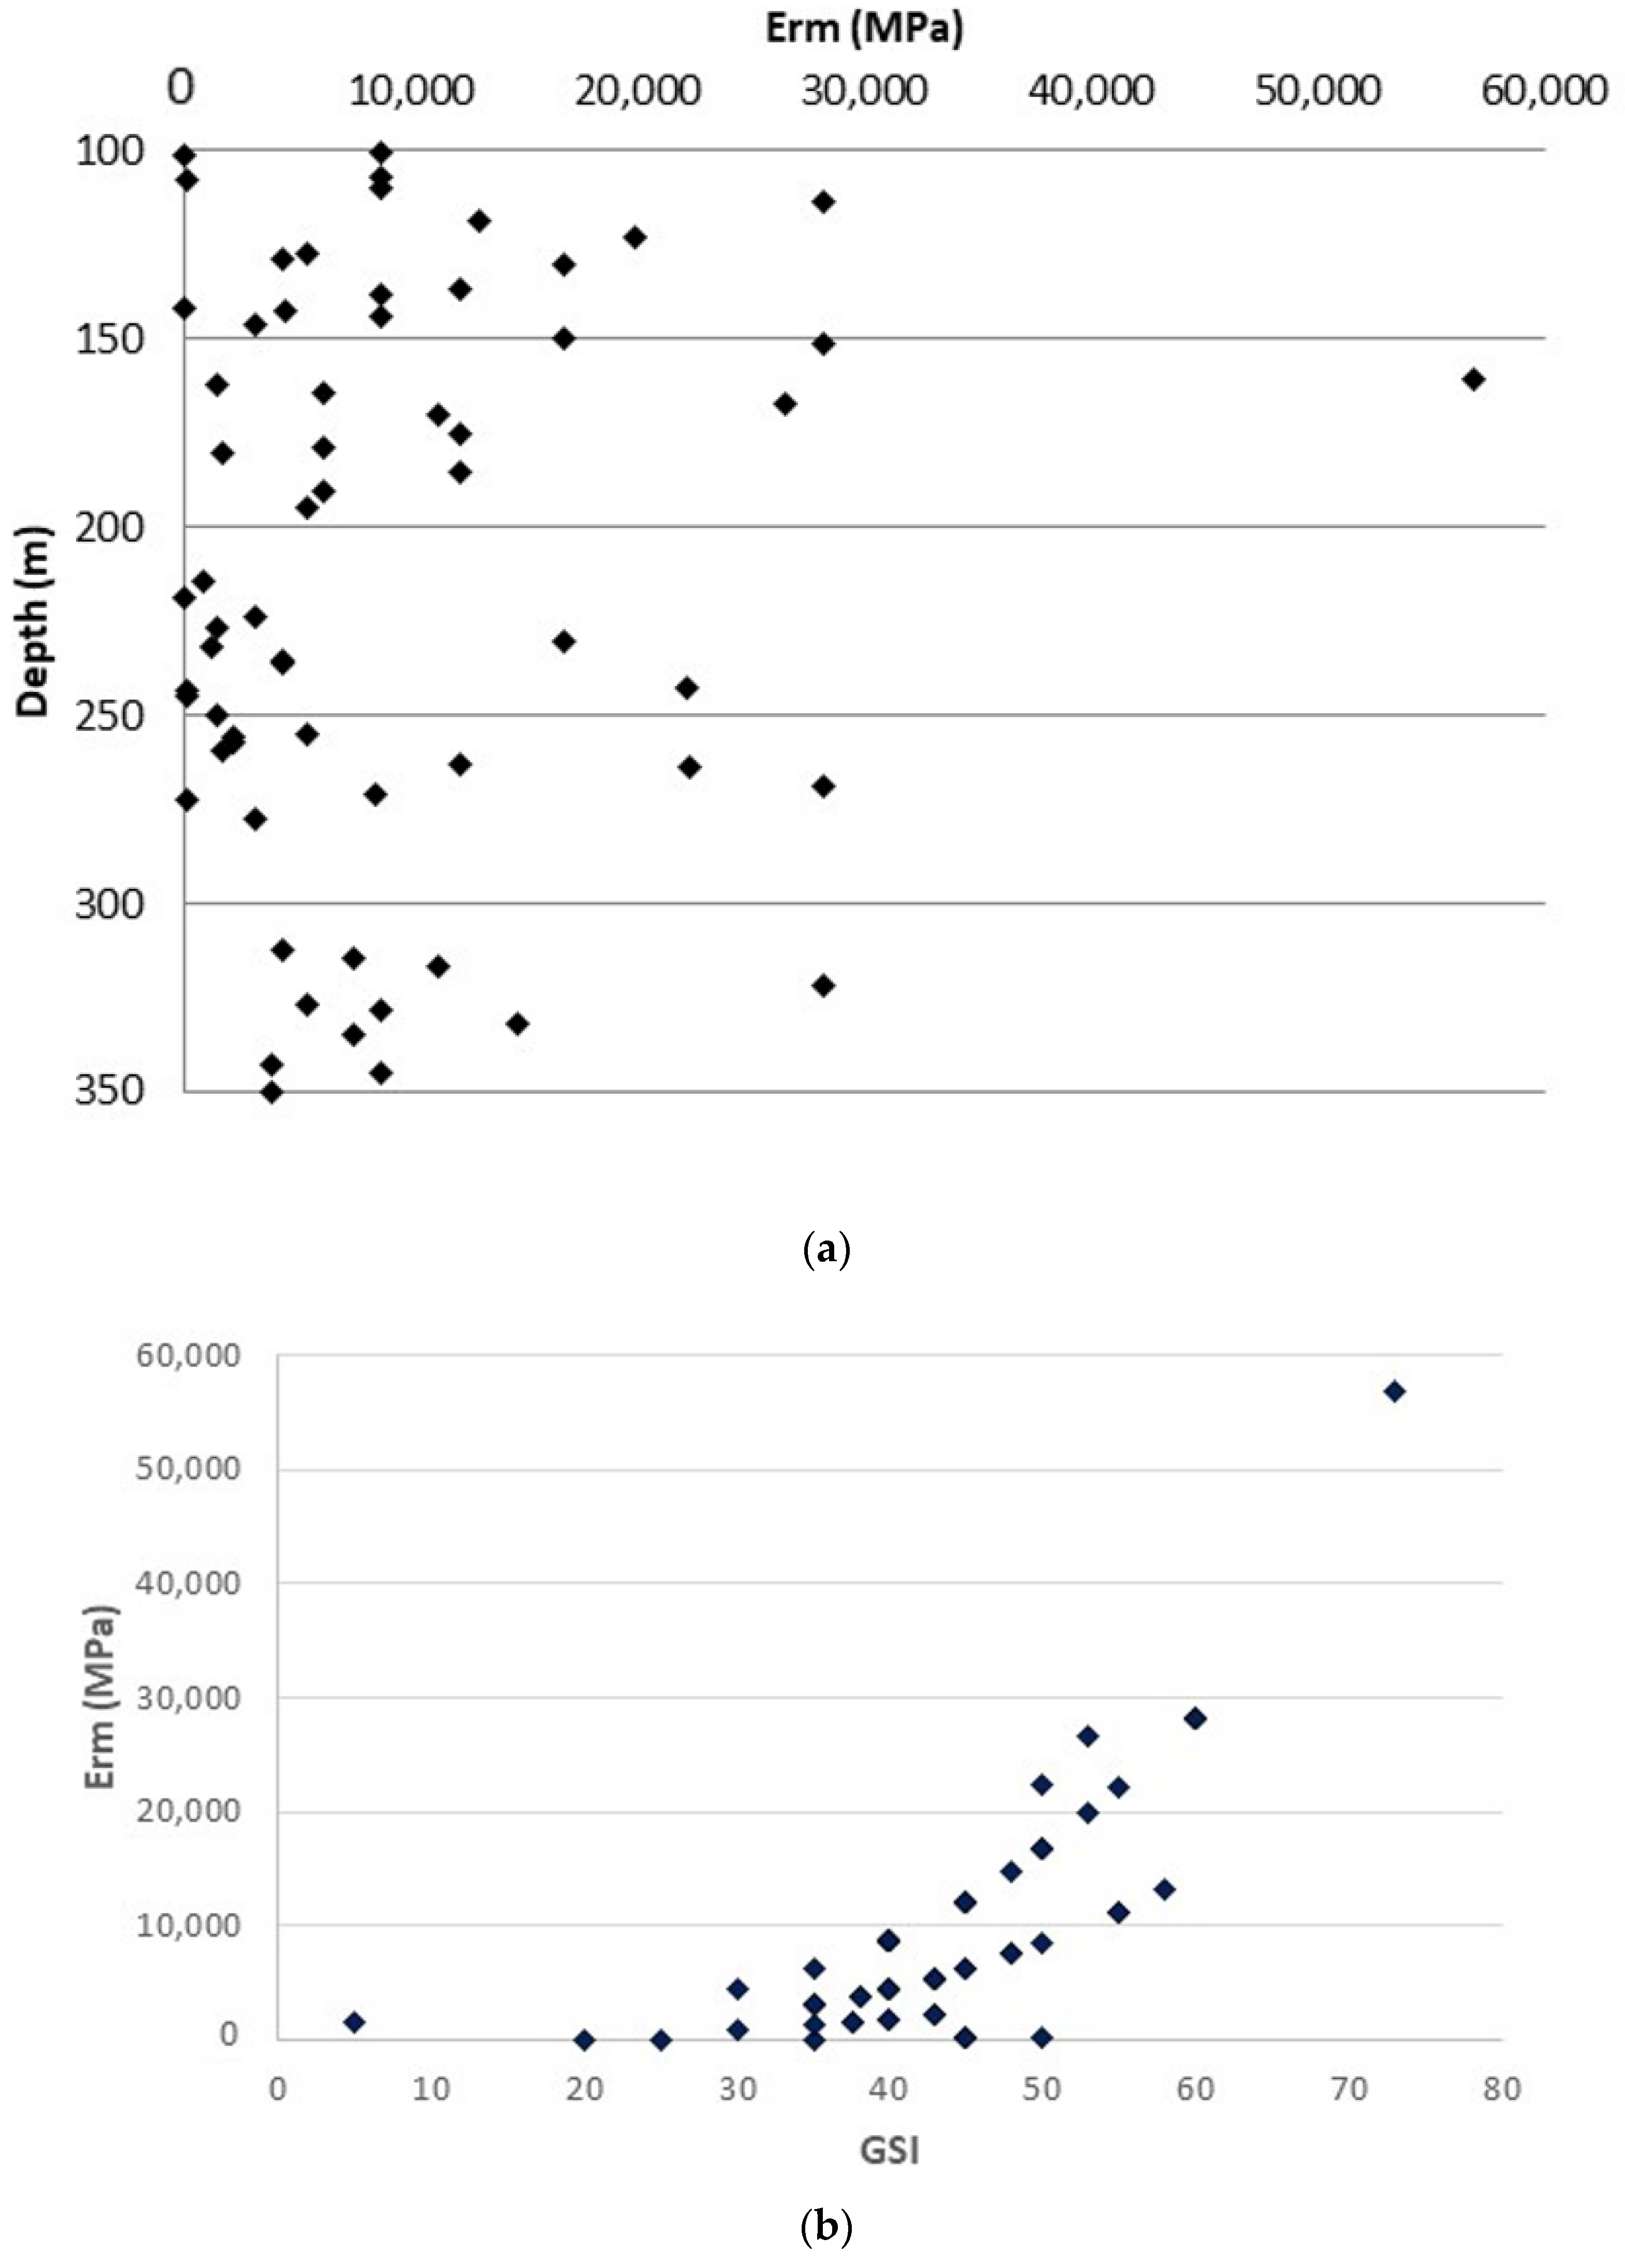
The trends in the rock mass deformation modulus Erm with depth and with the GSI are shown in Figure 17a,b, respectively.
The deformation modulus for the rock mass changes from 14.57 to 56,932 MPa. The trend in the modulus with the GSI shows that it assumes very different values at the same value of the GSI.
The range of mechanical characteristics of the crossed rock masses is summarized in Table 3.
Two Lugeon tests were performed in the borehole at depths of 357 m and 407.5 m where the gneiss showed intensely fractured provided values of the coefficient of permeability equal to 1.1 × 10⁻⁶ m/s (9.83 U.L.) and to 4.2 × 10⁻⁷ m/s (3.77 U.L.), respectively. The first one is a typical value of medium permeability of rocks with different open joints, whereas the second one is a typical value of low–medium permeability of rocks with thin open joints.
3.2. Conditions and Orientation of Main Joints
Surveys by means of camera (BIPS) and ultrasonic sensors (BHTV) for limited significant tracts (228–266 m) within the SG5 borehole were carried out. Such investigations, as well as providing useful information about the lithology and the state of the rock, enabled the identification of the orientation characteristics (dip and azimuth) of the main joints in the crossed rock masses.
Regarding the joint conditions, an alternation in closed and open fractures was encountered throughout the examined depth with joint aperture changing from 249.57 mm (less deep zones of the survey) to 4.49 mm (deepest zones of the survey).
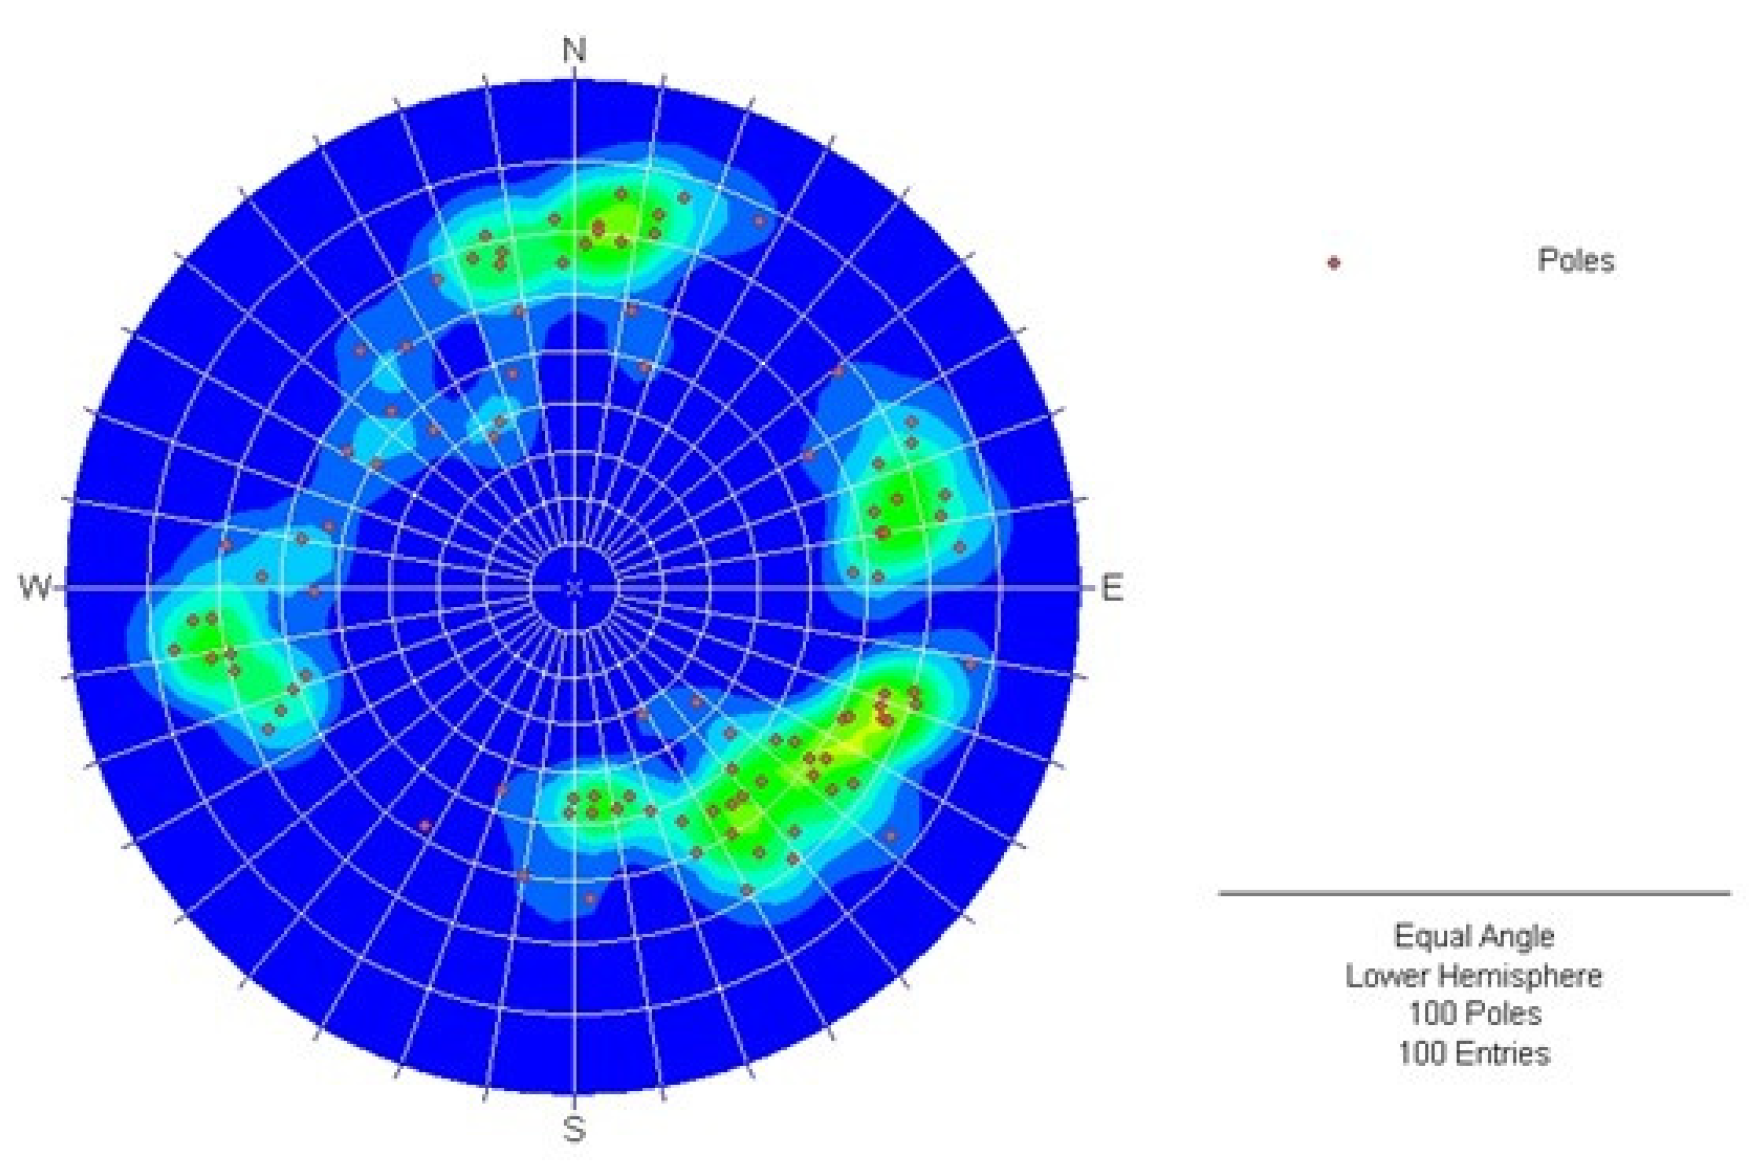
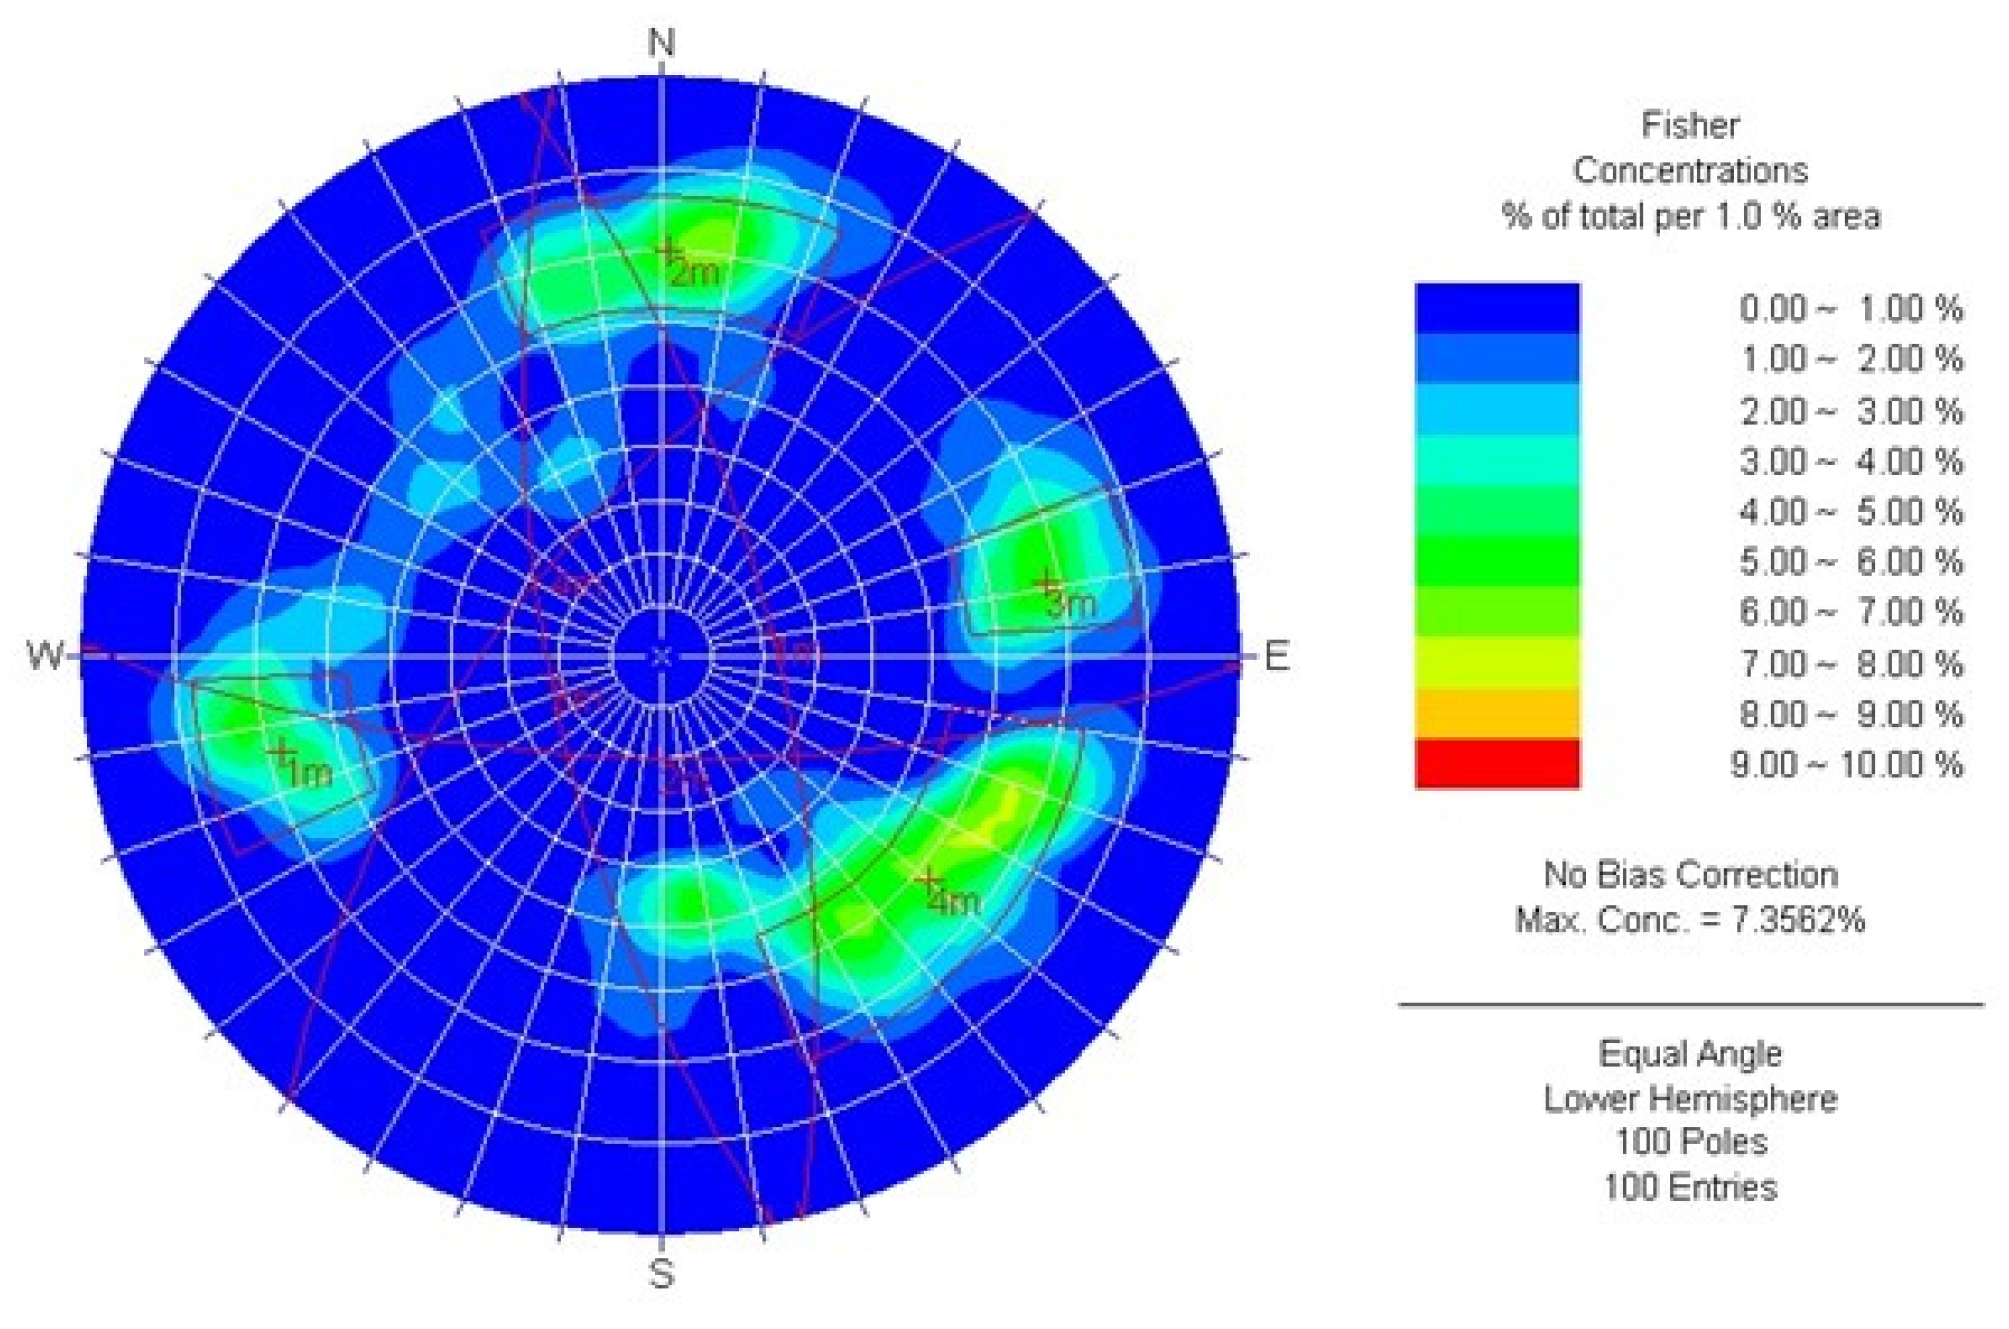
Moreover, in order to identify the main families of the joints, the values of dip and azimuth are represented in the specific stereogram (Figure 18), and the Fisher concentrations were identified (Figure 19) by means of Dips 5.108 software (Rocscience).
Four joint families were recognized, represented by the “average” discontinuity planes (Table 4).
The results of the surveys were interpreted, taking into account the geolithological characteristics of the areas surrounding the survey as well as the main fault structures, and reported in the geological map.
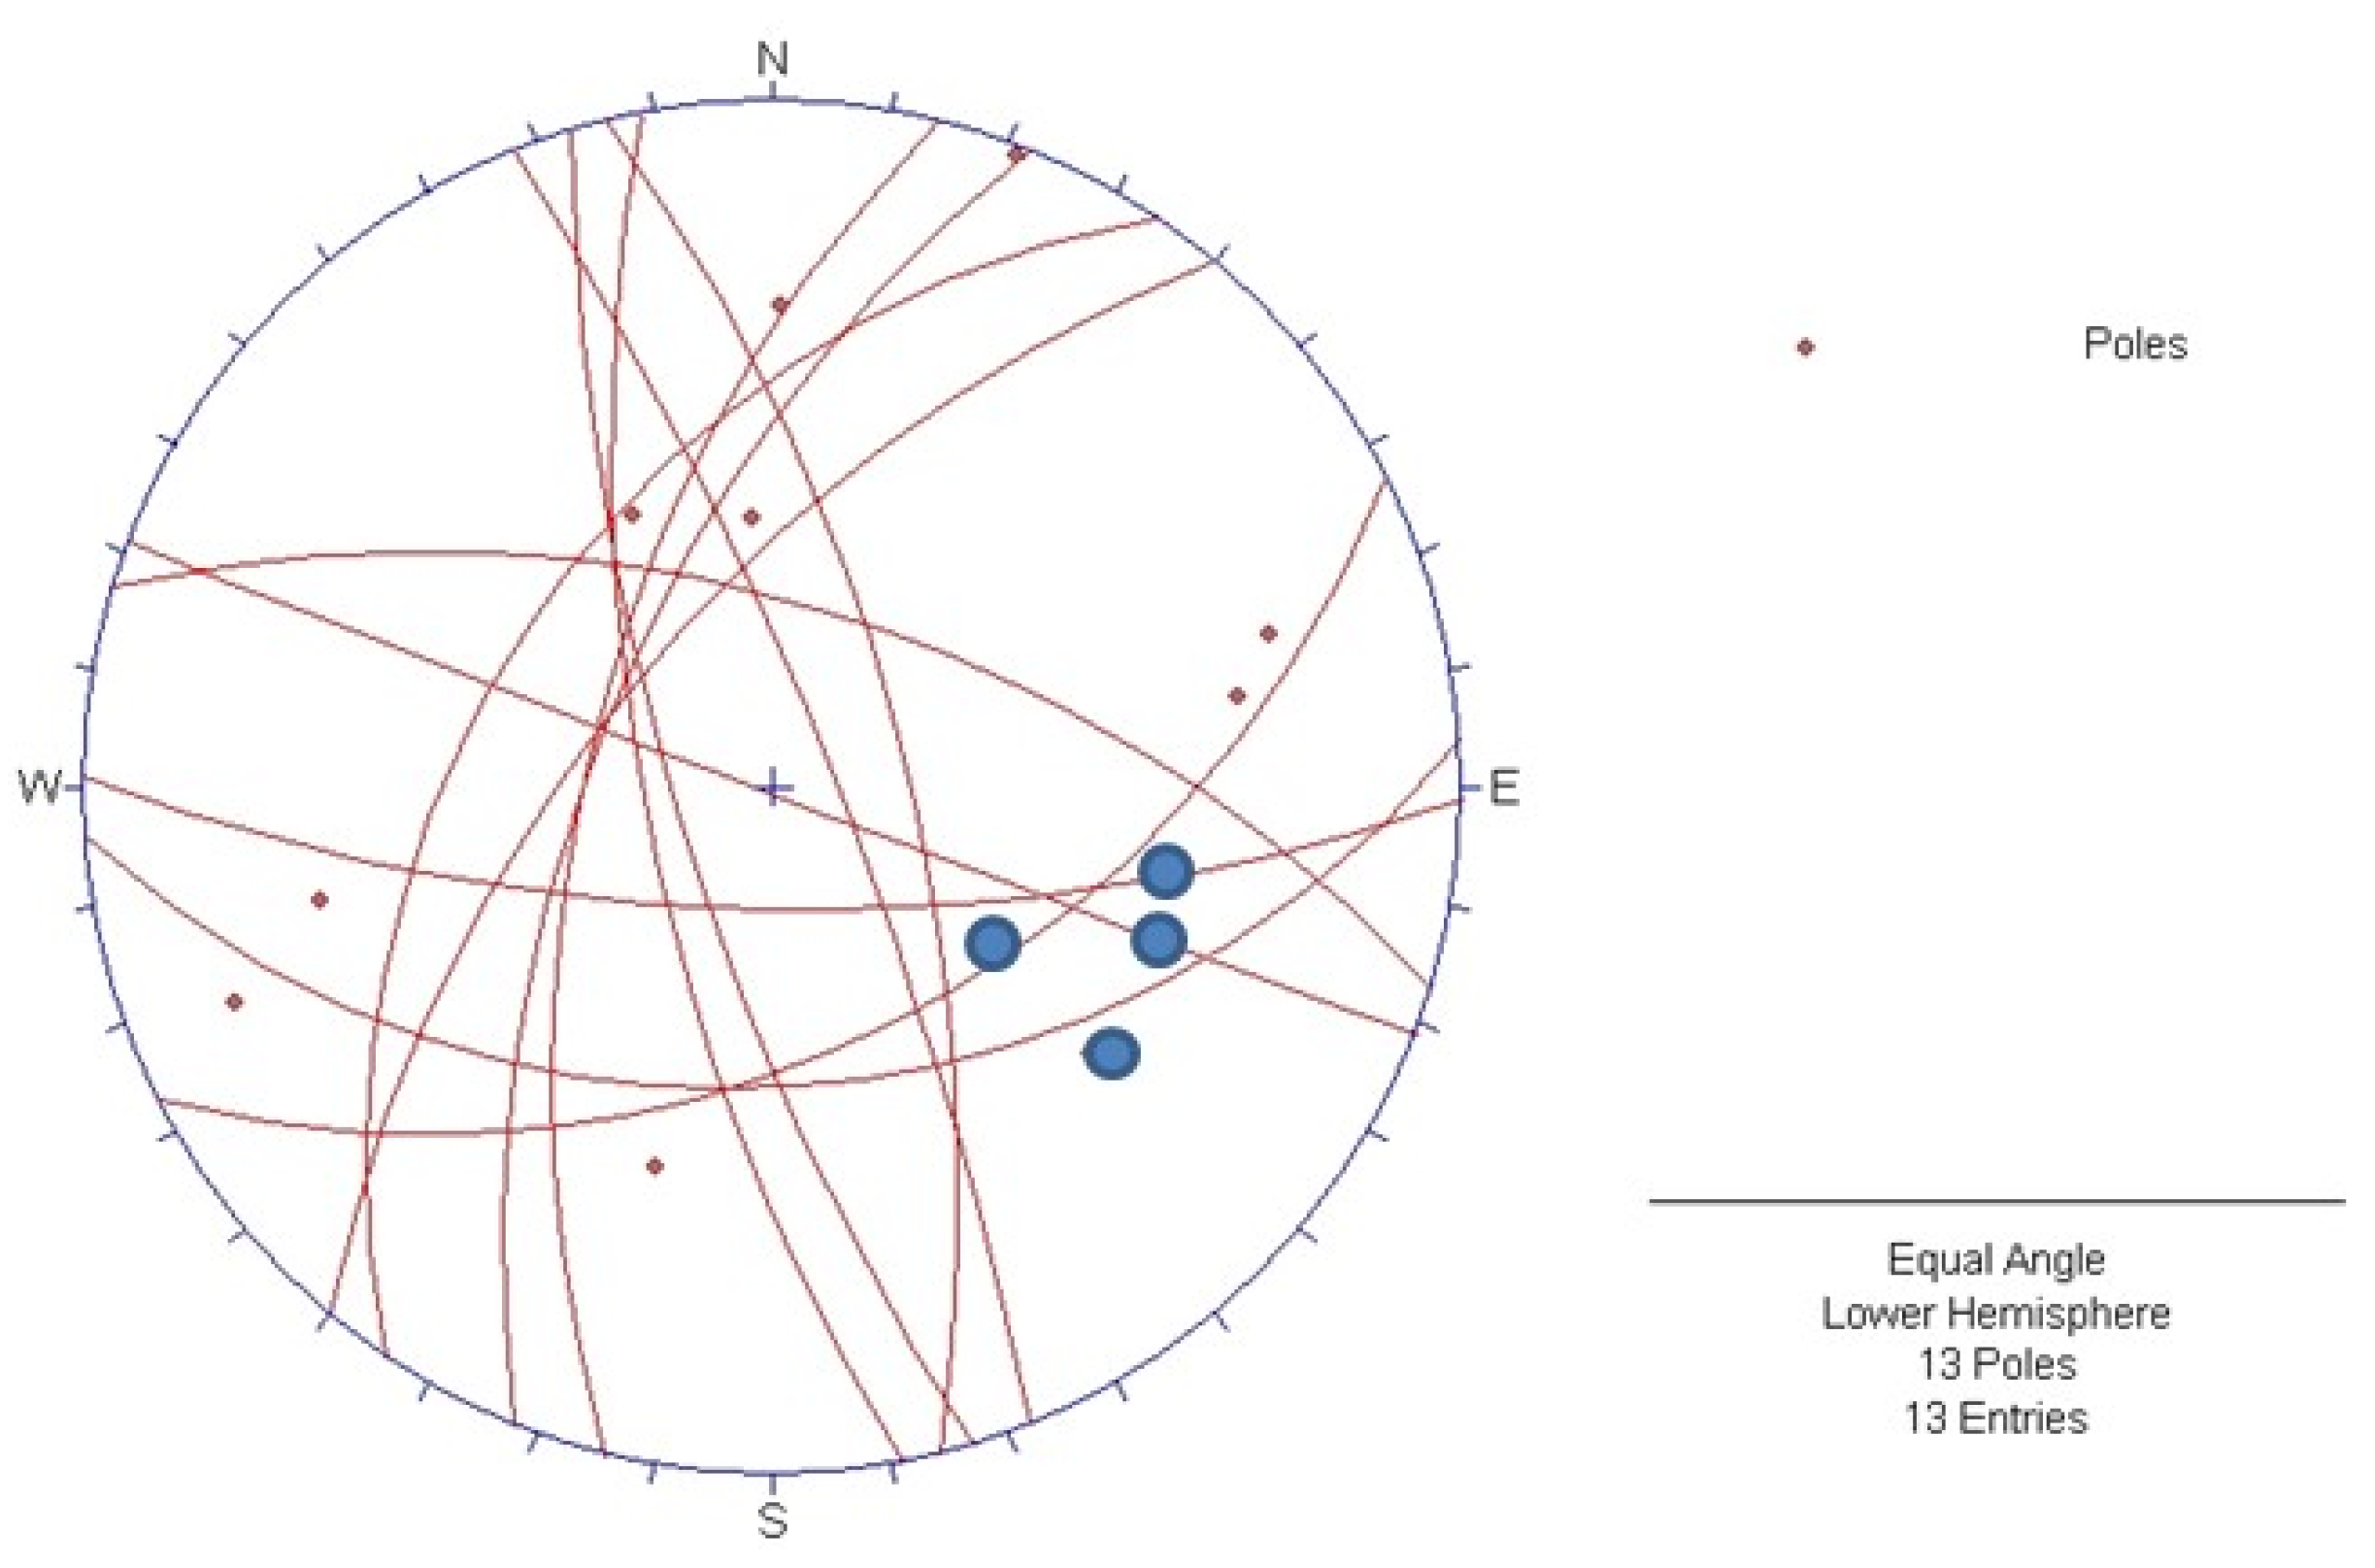
The identified families show a very complex geomechanical framework. In particular, a relevant fault for the area was certainly crossed, belonging to the family of the main faults. The families were inserted in the two most important systems of discontinuity of the area (Figure 20): the main one is oriented in the direction parallel to the coastline, which can be referred to as the family “4 m” (blue full circles in figure) and its conjugate “2 m”, and the other one is orthogonal to the previous one, identified by the family “1 m” and its conjugate “3 m”.
The azimuth of family “4 m”, equal to 62°, provides a useful indication of the angle of a major fault, slightly rotated with respect to the coastline.
4. Discussion
The obtained results highlighted that the crossed basement is characterized by an alteration and fracturing, which vary strongly and in a discontinuous way with the depth. The alteration observed at the surface also continues at various depths and with extreme variability as shown by the values of the uniaxial compressive strength (σci) of the intact rock, the “Geological Strength Index” (GSI, Figure 5, Figure 6 and Figure 7) and all evaluated parameters.
Regarding the uniaxial compressive strength of the intact rock (Figure 5), the variability (from 0.44 MPa to 100 MPa) in this value is reduced over 301 m, and it changes from 38 MPa to 75 MPa, showing that the strength of intact rock improves beyond this depth.
A similar trend was observed for the GSI (Figure 7). It shows values always greater than 38, typical of rock masses from good to poor over 301 m.
The comparison of the GSI versus σci (Figure 9) showed that different values of the GSI from poor to good match the same value of σci, but with the increase in σci (100 MPa) the corresponding values of the GSI are all greater than 50, values typical of good rock masses.
Regarding the graphs of mb, s and a values versus depth (Figure 10, Figure 11 and Figure 12), different trends were observed. Indeed, the mb trend is extremely variable with the depth, and this variability decreases over 301 m of depth; parameter s changes with the depth in a less marked way, while small variations in “a” are observable with depth.
The friction angle values change from 13° to 64°, and cohesion values (Figure 13 and Figure 14) change from 0.10 to 2.61 MPa, related to the state of alteration and jointing of the rock mass with the depth. Also, in these cases, the variability in both characteristics is reduced over 301 m, the friction angles change from 42° to 57° and the cohesion values change from 1.25 MPa to 2.25 MPa.
The uniaxial compression strength (Figure 15), a parameter important for the process of fracture propagation for stability of excavations and designing support systems, and global strength of the rock mass (Figure 16), a parameter important for overall strength, show extreme variability until 301 m; over this depth, their variability is also reduced, and the values change from 1.3 to 8 MPa for uniaxial compression strength and from 10 to 28 MPa for global strength.
The deformation modulus for the rock masses (Figure 17) varies extremely until 301 m; over this depth, its variability is reduced to between 5010 and 3010 MPa. Moreover, it was observed that the deformation modulus changes extremely for the GSI between 50 and 60 (Figure 17b).
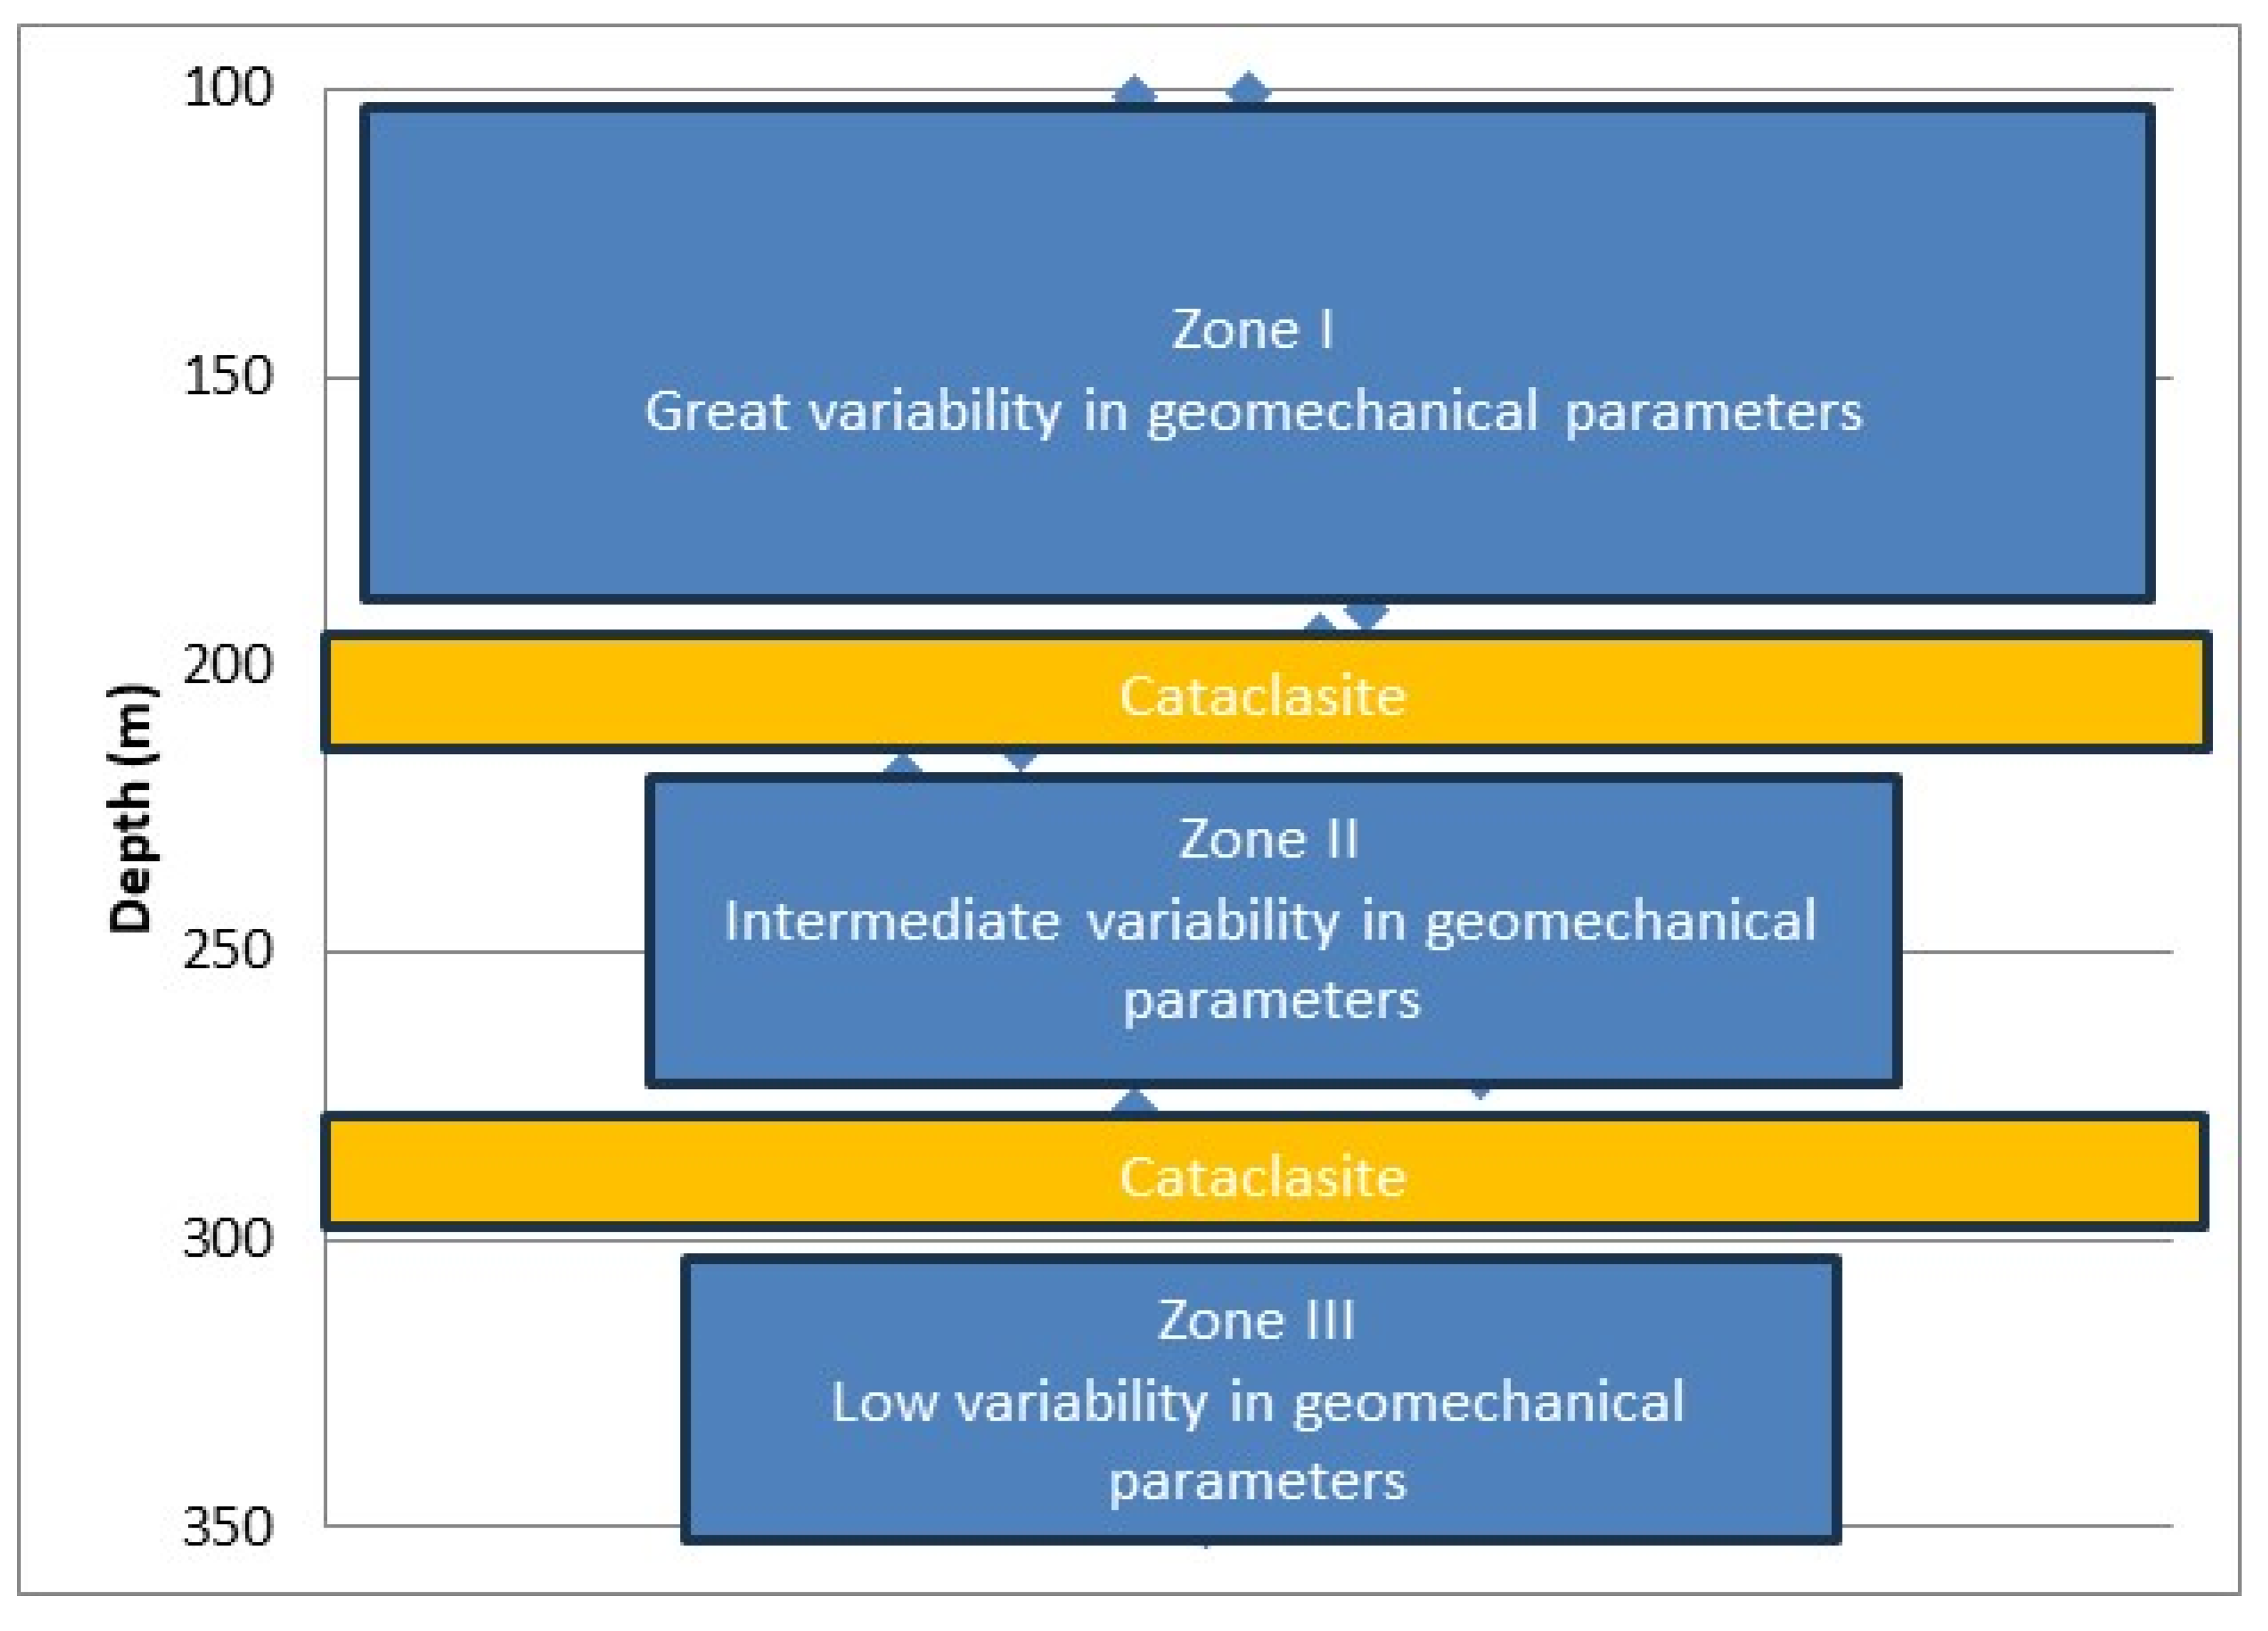
According to the geomechanical results, three zones have been identified along the vertical of the borehole divided by three cataclastic bands (Figure 21). In the first one (96.3–195 m), the alternation in fractured/slightly altered rock masses defines an extreme variability in geomechanical parameters. The second one (219.6–277.4 m) is characterized by a reduced presence of fractured rocks and slightly altered rock masses that provide an intermediate variability in geomechanical parameters. The last one (301–350 m) is characterized by an even smaller presence of fractured rocks that determines a reduced variability in geomechanical parameters. Table 5, Table 6 and Table 7 summarize the range of variation in geomechanical parameters of rock masses in the three zones.
In the second zone (219.6–277.4 m), the surveys by means of camera (BIPS) and ultrasonic sensors (BHTV), performed for limited significant tracts (228–266 m) within the SG5 borehole, show joint conditions with apertures ranging from extremely large (open) (249.57 mm) to moderately large (semi-open) (4.99 mm).
The results of Lugeon tests performed inside the borehole over 350 m show values of permeability from medium to low–medium typical of rocks with different open joints and of rocks with thin open joints. The zones of medium permeability can represent preferential areas of water ingress during the excavation works.
5. Conclusions
The stability assessment is important in underground works inside rock masses, and the use of a methodology to evaluate the critical zones to be crossed is crucial for the design and also for safe excavation and construction. Design procedures to account for current geomechanical conditions should be well defined, including the recognition of susceptible zones of more altered materials that need to be surveyed with more detail. The combination of laboratory testing and geomechanical modeling can provide valuable insights into the mechanical behavior of the rock mass, aiding in the development of robust engineering solutions for deep drilling projects.
In this paper, the performed analyses highlight the extreme variability in the geomechanical characteristics along the deep borehole. It was observed that it decreases with depth, and three zones with different dispersions of geomechanical parameters were identified, divided by as many cataclasite zones: the first zone from 96.3 to 195 m where the rock masses are more fractured with the greatest dispersion, the second one (219.6–277.4 m) where the rock masses are less fractured than the previous one with an intermediate dispersion of geomechanical parameters and the third one from 301 to 350 m where the zones with fractured rock masses are rare with the lowest dispersion of geomechanical parameters.
The variability in the rock masses found in the survey certainly affects the excavation of the underground works such as tunnels because the excavation machines dig in mixed front conditions, crossing zones of rock with very different resistances (zones 1 and 2). In these conditions, the crossing of the more fractured zones must be undertaken with particular caution, previewing consolidation works in advance. Cataclasite zones should be excavated via the immediate installation of supports.
Engineering knowledge combined with the use of geotechnical software tools made it possible to reach a simple and economic solution for the characterization of a deep borehole in a very fractured and altered rock mass.
Further research should focus on real-time monitoring of geomechanical parameters during drilling operations to enhance safety and optimize performance.
Funding
This research received no external funding.
Data Availability Statement
The original contributions presented in the study are included in the article, further inquiries can be directed to the corresponding author.
Acknowledgments
The author is grateful to TERNA SpA for material used for the characterization extracted from Executive Design for “Underground connection between the marine cables of Favazzina and the power station of Scilla”.
Conflicts of Interest
The author declares no conflicts of interest.
References
- Sendai Framework for Disaster Risk Reduction 2015–2030; United Nations: New York, NY, USA, 2015; 32p; Available online: https://www.undrr.org/publication/sendai-framework-disaster-risk-reduction-2015-2030 (accessed on 16 February 2024).
- Waloski, R.; Korzeniowski, W.; Bołoz, Ł.; Rączka, W. Identification of Rock Mass Critical Discontinuities While Borehole Drilling. Energies 2021, 14, 2748. [Google Scholar] [CrossRef]
- Deere, D.U. Technical description of rock cores for engineering purposes. Rock Mech. Eng. Geol. 1964, 1, 16–22. [Google Scholar]
- Bieniawski, Z. Engineering classification of jointed rock masses. Civ. Eng. S. Afr. 1973, 11, 244. [Google Scholar]
- Barton, N.; Lien, R.; Lunde, J. Engineering classification of rock masses for the design of tunnel support. Rock Mech. 1974, 6, 189–236. [Google Scholar] [CrossRef]
- Palmstrom, A. Characterizing Rock Masses by the RMi for Use in Practical Rock Engineering: Part 1: The Development of the Rock Mass Index (Rmi). Tunn. Undergr. Space Technol. 1996, 11, 175–188. [Google Scholar] [CrossRef]
- Marinos, P.; Hoek, E. GSI-a geologically friendly tool for rock mass strength estimation. In Proceedings of the GeoEng 2000 at the International Conference on Geotechnical and Geological Engineering, Melbourne, Australia, 19–24 November 2000; pp. 1422–1442. [Google Scholar]
- Bołoz, L. Interpretation of the results of mechanical rock properties testing with respect to mining methods. Acta Montan. Slovaca 2020, 25, 81–93. [Google Scholar]
- Hoek, E.; Carranza-Torres, C.; Corkum, B. Hoek-Brown failure criterion 2002 Edition. In Proceedings of the 5th North American Rock Mechanics Symposium, Toronto, ON, Canada, 7–10 July 2002; Volume 1, pp. 267–273. [Google Scholar]
- Aliperta, A.; Infantino, S.; La Torre, A.; Mandaglio, M.C.; Pellegrino, A. Rock slopes: From the analysis to the definition of the risk mitigation works. The Scilla Rupe case (RC, Italy). Rend. Online Soc. Geol. Ital. 2012, 21, 377–378. [Google Scholar]
- Borrelli, L.; Gioffrè, D.; Gullà, G.; Moraci, N. Suscettibilità alle frane superficiali e veloci in terreni di alterazione: Un possibile contributo della modellazione della propagazione. Rend. Online Soc. Geol. Ital. 2012, 21, 534–536. [Google Scholar]
- Gioffrè, D.; Moraci, N.; Borrelli, L.; Gullà, G. Numerical code calibration for the back analysis of debris flow runout in southern Italy. In Landslides and Engineered Slopes. Experience, Theory and Practice; CRC Press: Boca Raton, FL, USA, 2016; Volume 2, pp. 991–997. [Google Scholar]
- Pezzino, A.; Pannucci, S.; Puglisi, G.; Atzori, P.; Ioppolo, S.; Lo Giudice, A. Geometry and metamorphic environment of the contact between the Aspromonte-Peloritani Unit (Upper Unit) and Madonna dei Polsi Unit (Lower Unit) in the central Aspromonte area (Calabria). Boll. Della Soc. Geol. Ital. 1990, 109, 455–469. [Google Scholar]
- Ortolano, G.; Cirrincione, R.; Pezzino, A. P-T evolution of Alpine metamorphism in the southern Aspromonte Massif (Calabria-Italy). Schweiz. Mineral. Und Petrogr. Mitteilungen 2005, 85, 31–56. [Google Scholar]
- Moraci, N.; Mandaglio, M.C.; Ciurleo, M. A methodology for Debris Flow Risk Analysis. Climate Change Adaptation from Geotechnical Perspectives. In Proceedings of CREST 2023; Hazarika, H., Haigh, S.K., Chaudhary, B., Murai, M., Manandhar, S., Eds.; Lecture Notes in Civil Engineering (LNCE); Volume 447, Springer: Berlin/Heidelberg, Germany, 2023; in press; 380p, ISBN 978-981-99-9214-0. [Google Scholar]
- Hoek, E.; Marinos, P.G.; Marinos, V.P. Characterization and engineering properties of tectonically undisturbed but lithologically varied sedimentary rock masses. Int. J. Rock Mech. Min. Sci. 2005, 42, 277–285. [Google Scholar] [CrossRef]
- Bieniawski, Z.T.; Bernede, M.J. Suggested methods for determining the uniaxial compressive strength and deformability of rock materials. Int. J. Rock Mech. Min. Sci. Geomech. 1978, 16, 135–140. [Google Scholar]
- Russo, G. A new rational method for calculating the GSI. Tunn. Undergr. Space Technol. 2009, 24, 103–111. [Google Scholar] [CrossRef]
- Palmstrom, A. Measurements and Correlations between Block Size and Rock Quality Designation (RQD). Tunn. Undergr. Space Technol. 2005, 20, 362–377. [Google Scholar] [CrossRef]
- Hoek, E.; Diederichs, M.S. Empirical estimation of rock mass modulus. Int. J. Rock Mech. Min. Sci. 2006, 43, 203–215. [Google Scholar] [CrossRef]
Figure 1.
In situ state of degradation of outcropping crystalline basement. (a) Residual soils; (b) extremely degraded rock masses; (c) intensely tectonized rock masses.
Figure 1.
In situ state of degradation of outcropping crystalline basement. (a) Residual soils; (b) extremely degraded rock masses; (c) intensely tectonized rock masses.

Figure 2.
Weathering grade map of the area and landslides. Weathering grade map legend: (1) gneiss of class II; (2) gneiss of class III; (3) gneiss of class IV; (4) gneiss of class V; (5) gneiss of class VI; (6) coastal and alluvial deposits; (7) terraced marine deposits; (8) marine coarse sandstone deposits; (9) landslide debris.

Figure 3.
Borehole location.

Figure 4.
Geological map of the area.

Figure 5.
σci rock values against depth.

Figure 6.
Percentage of meters of rocks along the borehole with different σci values.

Figure 7.
GSI values of crossed rock mass against depth.

Figure 8.
Percentage of rocks along the borehole with different GSI values.

Figure 9.
GSI values against σci.

Figure 10.
Trend in mb versus depth.

Figure 11.
Trend in s for the rock mass versus depth.

Figure 12.
Trend in a of the rock mass versus depth.

Figure 13.
Trend in the equivalent angle of friction of the rock masses.

Figure 14.
Trend in the cohesive strength of the rock masses.

Figure 15.
Trend in the uniaxial compression strength of the rock mass.

Figure 16.
Trend in the global strength of the rock mass.

Figure 17.
Trends in the deformation modulus of rock masses with (a) depth and (b) GSI.

Figure 18.
Stereogram.

Figure 19.
Joint families.

Figure 20.
Average planes of all detected discontinuity families.

Figure 21.
Identified variability zones of geomechanical parameters.


Table 1.
SG5 stratigraphy and pictures of core samples.
| Depth (m) | Stratigraphy | |
|---|---|---|
| 0–41 | Silty and gravel sands | |
| 41.0–96.3 | Strongly altered cataclasite (cohesive and granular soils) |  |
| 96.3–140.6 | Fractured/slightly altered granite |  |
| 140.6–195 | Slightly fractured and altered gneiss |  |
| 195–219.6 | Strongly altered cataclasite (cohesive and granular soils) | |
| 219.6–230 | Fractured/slightly altered gneiss | |
| 230–243 | Slightly altered granite | |
| 243–258 | Fractured/slightly altered gneiss |  |
| 258–261.8 | Slightly fractured altered granite | |
| 261.8–277.4 | Slightly fractured and altered gneiss | |
| 277.4–301 | Strongly altered cataclasite (cohesive and granular soils) | |
| 301–304.5 | Fractured/slightly altered gneiss | |
| 304.5–307.1 | Slightly fractured and altered granite | |
| 307.1–319.7 | Slightly fractured altered gneiss | |
| 319.7–322.3 | Slightly fractured granite | |
| 322.3–410.0 | Fractured/slightly altered gneiss |
Table 2.
Range of GSI versus percentage (%) of borehole meters.
| GSI | % (from 41 to 350 m) |
|---|---|
| ≤20 | 42 |
| 21–40 | 29 |
| 41–60 | 27 |
| ≥61 | 2 |
Table 3.
Range of mechanical characteristics of the crossed rocks.
| σci (MPa) | 0.44–100 |
| GSI | 5––73 |
| mb | 1.1–12.2 |
| s | 0.000026–0.0498 |
| a | 0.501–0.619 |
| ϕ (°) | 13–64 |
| c (MPa) | 0.10–2.61 |
| σc (MPa) | 0.01–22.24 |
| σcm (MPa) | 0.1–49 |
| Erm (MPa) | 14.57–56,932 |
Table 4.
Orientation of average planes of main joint families.
| Average Planes | ||
|---|---|---|
| Joint family | Dip | Azimuth |
| 1 m | 76° | 68° |
| 2 m | 181° | 70° |
| 3 m | 259° | 69° |
| 4 m | 310° | 62° |
Table 5.
Zone 1.
| σci (MPa) | 0.44–100 |
| GSI | 5–73 |
| ϕ (°) | 15–64 |
| c (MPa) | 0.10–2.61 |
| σc (MPa) | 0.01–22.24 |
| σcm (MPa) | 0.1–49 |
| Erm (MPa) | 14.57–56,932 |
Table 6.
Zone 2.
| σci (MPa) | 0.44–100 |
| GSI | 25–60 |
| ϕ (°) | 13–56 |
| c (MPa) | 0.15–2.00 |
| σc (MPa) | 0.01–8.00 |
| σcm (MPa) | 0.1–31 |
| Erm (MPa) | 19–28,275 |
Table 7.
Zone 3.
| σci (MPa) | 38–75 |
| GSI | 38–60 |
| ϕ (°) | 44–55 |
| c (MPa) | 1.25–2.20 |
| σc (MPa) | 1.1–8.0 |
| σcm (MPa) | 9.2–28 |
| Erm (MPa) | 3835–28,275 |
Disclaimer/Publisher’s Note: The statements, opinions and data contained in all publications are solely those of the individual author(s) and contributor(s) and not of MDPI and/or the editor(s). MDPI and/or the editor(s) disclaim responsibility for any injury to people or property resulting from any ideas, methods, instructions or products referred to in the content. |
© 2024 by the author. Licensee MDPI, Basel, Switzerland. This article is an open access article distributed under the terms and conditions of the Creative Commons Attribution (CC BY) license (https://creativecommons.org/licenses/by/4.0/).
Share and Cite
MDPI and ACS Style
Mandaglio, M.C. Geomechanical Characterization of the Rock Mass along a Deep Vertical Borehole. Geotechnics 2024, 4, 209-228. https://doi.org/10.3390/geotechnics4010011
AMA Style
Mandaglio MC. Geomechanical Characterization of the Rock Mass along a Deep Vertical Borehole. Geotechnics. 2024; 4(1):209-228. https://doi.org/10.3390/geotechnics4010011
Chicago/Turabian StyleMandaglio, Maria Clorinda. 2024. "Geomechanical Characterization of the Rock Mass along a Deep Vertical Borehole" Geotechnics 4, no. 1: 209-228. https://doi.org/10.3390/geotechnics4010011