Article

Estimating Shear Strength Properties of the Surrounding Soils Based on the Execution Energies of Piles

by
Luan Carlos de Sena Monteiro Ozelim
1,*,
Darym Júnior Ferrari de Campos
1,
André Luís Brasil Cavalcante
1,
José Camapum de Carvalho
1 and
Carlos Medeiros Silva
2
1
Department of Civil and Environmental Engineering, University of Brasilia, Brasilia 70910-900, DF, Brazil
2
Faculty of Technology and Applied Social Sciences, Civil Engineering Section, University Center of Brasília, Brasília 70790-075, DF, Brazil
*
Author to whom correspondence should be addressed.
Geotechnics 2022, 2(2), 457-466; https://doi.org/10.3390/geotechnics2020022
Submission received: 18 May 2022 / Revised: 5 June 2022 / Accepted: 9 June 2022 / Published: 13 June 2022

Abstract

:
Historically, empirical relations are the basis of everyday foundation design. These relations, however, rely on specific datasets, which may not represent the true conditions observed in the field. Even in situ tests rely on empirical correlation formulas, which link observed phenomena to soil properties. These correlations should be updated according to the specific design conditions. Big data (BD) workflows enable the use of massive data available to update the correlations and to provide more accurate predictions of the parameters studied. Thus, in this paper, a BD approach is used to study the relation between the drilling process of continuous flight auger piles and the shear strength properties (SSPs) of the surrounding soils. Soil surveys were carried out to identify the soil strata in the site and to validate the estimates of the SSPs. The results show that indirect measurements are in accordance with typical undrained shear strength and friction angles of the materials considered.

1. Introduction

Saturated and unsaturated soil shear strength parameters are important to properly design geotechnical infrastructures as well as to accurately model soil erosion and management [1].
The literature indicates that measuring shear strength parameters at field scale is difficult, time consuming, and very costly [1]. In these cases, any available information can be used to perform estimations of these parameters of interest.
In the work of [1], the relationship between unsaturated shear strength parameters and soil properties was carried out, leading to the creation of prediction models of unsaturated shear strength parameters (effective cohesion and angle of effective internal friction) in terms of a series of soil properties (particle size distribution, organic matter content, calcium carbonate content, compactness indices, mean weight diameter of aggregates and structural stability indices). In a similar fashion, the surface soil shear strength was estimated from several soil properties (root density, moisture, gravel content, clay, organic matter and calcium carbonate contents, as well as bulk density) [2].
Normally, such soil properties are not readily available, which suggests that specific tests may be needed to accurately account for the soil’s true behavior. This is the case, for example, of cone penetration tests (CPTs). As pointed out in [3], some limitations of shear laboratory testing made researchers look for a better understanding of CPTs, allowing the estimation of shear strength parameters (such as internal friction angle and undrained soil shear strength) using CPT data [3].
In the context of soil liquefaction prediction, other authors have also considered CPTs data to predict shear strength parameters [4]. Similarly, variations of CPTs were studied as alternatives to estimate the undrained shear strength. This is the case, for example, of seismic piezocone tests, which have been used to assess in situ soil behavior and stratigraphy in geotechnical site investigation [5].
When soil–rock mixtures (SRMs) are considered, the complex compositions and structures of these materials combined with the rock sizes of natural SRMs make it difficult for laboratory or in situ tests. Therefore, robust models to indirectly estimate their shear strength characteristics are of great interest. This way, researchers considered the rock block proportion and component properties as proxies to predict the shear strength of SRMs [6].
Sometimes, geotechnical designers do not have the chance to require more tests. Normally, a small amount of testing data is available, and it is crucial to indirectly obtain new insights from it. This is also a major trend in the big data era, where it is paramount to take advantage of available data to indirectly obtain new information.
One of the most common in situ tests that is carried out prior to geotechnical interventions is the standard penetration test (SPT). Therefore, the literature has massively presented studies where the number of blows required for the penetration of the sampler (NSPT) is related to the cohesion and angle of internal friction [7,8].
In some cases, even when test data are not available, engineers can obtain data from unavoidable construction procedures and transform it into the parameters needed to model the soil behavior [9]. These parameter estimation procedures can be systematized as traditional workflows for big data (BD), which normally consist of the following stages: data mining from data sources, data management, data modeling and result analysis and visualization [10].
When foundation design is considered, engineers need access to parameters which characterize the underground medium. This is due to the dependency of constitutive models on some parameters related to the strength and deformability characteristics of the local soil.
A common unavoidable construction procedure is the drilling of piles. Using the drilling data of geomaterials to estimate strength parameters is a promising in situ method that has been studied by many researchers [11]. Mostly, economic interest has driven such studies. The drilling process of geomaterials (such as rock and soils) is considerably impacted by their strength properties [12]. For example, these properties impact the drilling speed, depreciation of drilling bits, machines, and overall drilling costs. Therefore, better knowing the drilling environment and the characteristics of the in situ rock/soil mass is crucial to properly select the machines and predict the execution schedules [12].
In the present paper, the main objective is to propose a BD analytics workflow to obtain the shear strength parameters of soils drilled during the execution of continuous flight auger piles (CFAPs). The following specific objectives are explored: assessing the use of BD in geotechnical engineering; building a new empirical model to relate strength parameters of soils to the energy required to drill them; and applying the new methodological workflow to a real construction site in Brasilia-DF, Brazil.
In the next section, the BD workflow and methods considered in the present paper are discussed.

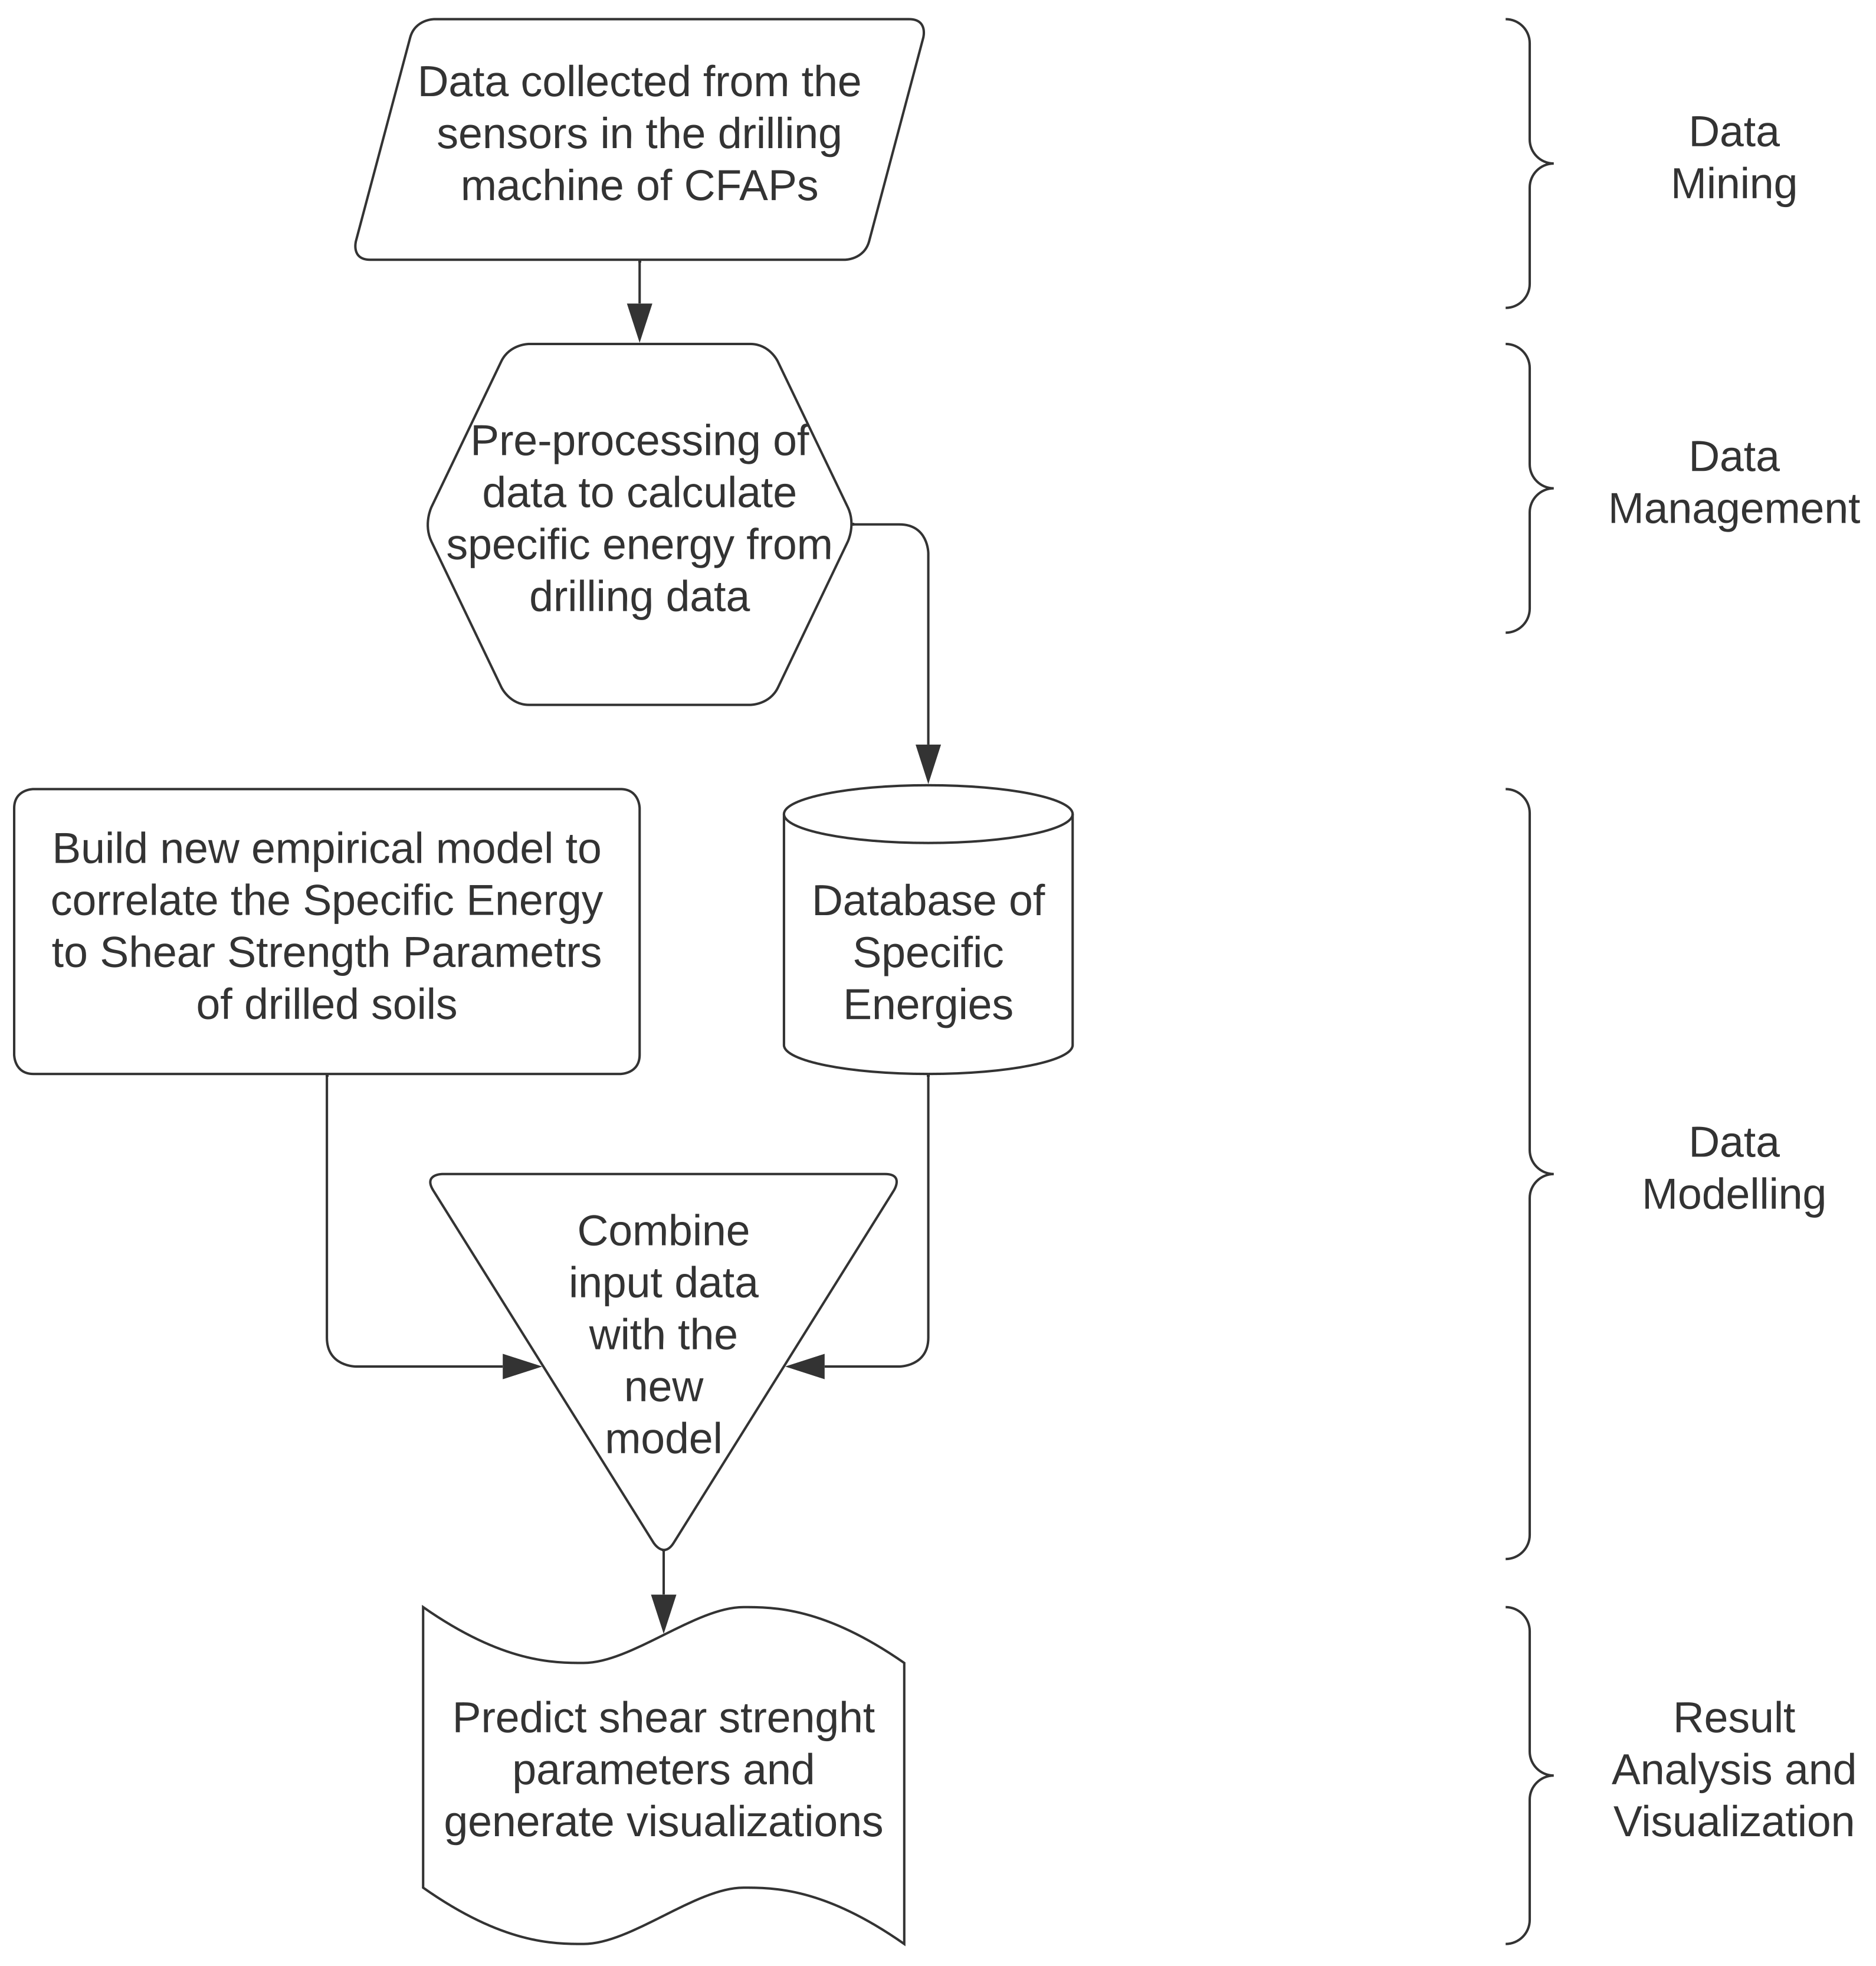
2. Big Data Workflow and Methods

According to [10], data from various sources are used to build models. In a BD environment, large and diverse datasets demand pre-processing tasks for data integration, cleaning and filtering. Prepared data are then used to train a model and to estimate its parameters [10]. Finally, prior to its utilization, model validation must be performed.
After validating the model, the step called scoring is carried out, which simply consists of applying the model to data as it arrives [10]. This scoring process generates predictions, prescriptions, and recommendations, which can be interpreted and aggregated to other tasks [10].
As previously indicated, the common phases of a traditional analytics workflow for big data are data mining from data sources, data management, data modeling and result analysis and visualization [10]. Therefore, each of the next subsections will explore these phases, which can be visualized as a chart in Figure 1.

2.1. Data Mining

Data mining in engineering depends on gathering data either from laboratory or in situ tests. When cost is a major issue, i -situ tests are good candidates, as they tend to be cheaper than laboratory tests. Additionally, since in situ tests have been extensively validated in the literature, this type of test is commonly chosen.
The building process (excavation and concreting) of CFAPs can be fully monitored by collecting data from sensors in the drilling machine. Therefore, gathering the data which were recorded by those sensors can be thought of as an in situ test, and is the main data mining process considered in this paper.

2.2. Data Management

In a big data workflow, the data management step is the process of transforming raw input data into pre-processed information. For example, data storage and manipulation are considered in this step.
In the present paper, the raw data collected during the execution of CFAPs are stored on simple database .mdb files, which are then combined and treated. The dataset collected contemplates the following items: depth, rotation speed, torque, vertical tilt of the drill and pressure of the injected concrete.
As a pre-processing step, the raw data mentioned are used to calculate the energy required to perform the drilling operation. This pre-processed information is modeled to predict some parameters of interest.

2.3. Data Modeling

The literature reveals that there exists a correlation between strength parameters and drilling data. For example, from a semi-empirical perspective, Warren [13] proposed a model to predict the penetration rate based on the properties of the drilling machine and rock strength. Later on, that author updated his model to account for the initial chip formation and cuttings removal processes [14].
Another empirical correlation was proposed in [15], indicating that for percussive blast hole drills, the net penetration rates of the drills can be related to strength parameters (uniaxial compressive strength, the Brazilian tensile strength and others) as well as to deformability parameters (Young’s modulus).
From a theoretical perspective, correlations were also discussed, reinforcing that information from the drilling process could be used to predict the compressive strength of rocks [11].
Normally, the methods developed tried to predict the penetration rate of the bits, which is key information to schedule drilling campaigns. On the other hand, instead of the penetration rate, other researchers explored models which could be used to predict the energy required for drilling a given volume of material. These models also explored how such energy can be correlated to the strength and deformability parameters of the drilled materials [16,17].
In order to compare and standardize energy measurements, instead of dealing with the actual energy required to drill some material, the concept of specific energy ( S e ) was introduced [16]. In short, S e is the work done per unit volume excavated, which mitigates the influence of the dimensions of the drilling machinery on the energy calculations. For rotary, percussive-rotary and roller-bit drilling, this S e value is correlated to the crushing strength of the medium drilled [16].
While executing continuous flight auger piles, a rotary non-percussive drilling is present. The energy calculation is quite straightforward in this case, as work is done both by the thrust, F [MLT 2 ], and the torque, T [ML 2 T 2 ]. By considering that the drill is being inserted into the soil with a penetration rate P r [LT 1 ] and that this equipment is performing N rotations in a given time interval [T 1 ], for a drilled pile with cross-sectional area A [L 2 ], the total work done is simply ( F P r + 2 π N T ) . To normalize this work by the volume of excavated material, it is clear that this volume is nothing but ( A P r ) , which leads to the following definition of the specific energy S e [ML 1 T 2 ] [16]:
S e = F F A A + 2 π 2 π A A N T N T P r P r
A similar rationale was used by Perko [17] to relate the energy spent during the installation of helical piles to the displacement behavior of the foundation or anchor once in place. Other authors preferred to build models relating the installation torque instead of installation energy to such displacement behavior of helical piles [18].
CFAPs have received less attention in this regard, mainly because no systematization of the drilling process was readily available. On the other hand, some researchers collected data from built-in sensors in the drilling machines and proposed a methodology for pile acceptance based the energy spent to drill a CFAP [19].
Since the energy spent to drill rocks and soils can be related to some strength and deformability parameters of the drilled strata, in the present paper, a semi-empirical model is proposed to relate the specific energy of the drilled materials to the shear strength parameters (friction angle and undrained shear strength). This way, a new physical model is derived and used to estimate these parameters of the stratum being drilled. This is the model chosen to be part of the BD workflow considered in the present paper.

2.4. Result Analysis and Visualization

Analyzing and visualizing the results is the last step in the BD workflow. In order to analyze the results presented, a real construction site in Brasília-DF, Brazil is studied.
The BD workflow is applied to this specific site, and the shear strength parameters indirectly obtained are compared to the values presented in the literature for the materials drilled. These materials were identified after soil surveys were carried out.
As a visualization technique, in the present paper, the results are presented as tables with color codes.

3. Shear Strength Parameters Behavior and Estimation

Shear strength parameters are stress dependent; therefore, this dependency must be accounted for when estimating these parameters along a soil profile with increasing confining pressures. Besides considering triaxial and shear tests, field engineers commonly estimate the shear strength parameters based on other information available.
Standard penetration tests (SPTs) are often performed to provide information for foundation designs. Therefore, relations between shear strength parameters and the number of NSPT blows are of interest. Thus, the angle of internal friction ϕ and the undrained shear strength c u can be related to the NSPT (hereby equivalent to N60) values as [8]:
ϕ = β tan 1 0.2 N S P T P a 0.2 N S P T P a K σ K σ 0.68 B
c u c u P a P a = α N S P T
where β , B and α are constants of proportionality, K is the coefficient of lateral earth pressure, P a is the atmospheric pressure (100 kPa) and σ is the overburden pressure (in kPa).
By considering that the SPT procedure is similar to driving a miniature open-ended “pipe pile”, the relations in (2) and (3) can be obtained [8]. The key aspect of such a model is the energetic balance of the driving process, where the energy that is transferred into the soil is dissipated at the soil–sampler interface (to overcome skin friction) and at the tip of the theoretical “pipe pile” (to penetrate the sampler into the soil). From an energetic point of view, the SPT blow count could be related to the shear strength properties of the soil at the depth of testing [8].
Regarding other strength parameter, the literature also indicates that the unconfined compressive strain, σ c , may be estimated in kPa for low plasticity clays and for clayey silts based on NSPT data as [20]
σ c = 107.3 N S P T 107.3 N S P T 13.5 13.5
The rationale behind the present paper is to extrapolate these intuitive procedures of relating in situ tests to the strength parameters. Thus, a BD approach is applied to the problem: use existing information continuously collected on the field to predict shear strength parameters.
In order to use the energetic data available from monitoring the execution of CFAPs (big data, as a huge number of piles are drilled everyday), either a good experimental relation should be found, or a consistent physical model should be built. The former approach is considered in the present paper. In the next section, the derivation of a simple, yet powerful, model for the drilling phenomena is presented.

Simplified Model for Shear Strength Parameters Prediction

The concepts introduced by Teale and further developed by other authors, such as [21], indicate that the specific energy, S e , can be correlated to the unconfined compressive stress, σ c , of a given rock by means of the following equation
S e = η σ c
in which η represents the efficiency of the drilling process. Greater values of η imply on less efficient drilling processes.
In this paper, that relation is extended to soils, thus, by combining (4) and (5), for S e given in kJ/m 3 ,
S e = 107.3 η N S P T 107.3 η N S P T 13.5 13.5
Finally, by the direct combination of (2), (3) and (6), the specific energy can be correlated to the shear strength parameters of the material being drilled (rocks) or excavated (soils). Mathematically, one can write for both σ and c u given in kPa
ϕ = β tan 1 2.516 S e 2.516 S e K η σ K η σ 0.68 B
c u = 12.581 α S e 12.581 α S e η η
One shall notice that the friction angle calculation in (7) incorporates some in situ characteristics, namely, depth dependence, degree of saturation, stress memory and so on. Additionally, both (7) and (8) are applicable to low plasticity clays and for clayey silts. The next section presents the results and discussions.

4. Results and Discussions

In the current section, the results and discussions are presented.

4.1. Application to a Real Construction Site in Brasília-DF, Brazil

As previously indicated, a real construction site is considered in the present paper to validate the new formulations. A local residential construction site was chosen, whose terrain had a mean inclination of about 5.50% with an average altitude of 1034.5 m above sea level. In this site, 320 juxtaposed CFAPs with 0.4 m of diameter and lengths varying between 10 m and 14 m were prescribed for the retaining wall structure. Additionally, 316 foundation piles were considered, all of which had a 0.5 m diameter with lengths varying between 8 m and 14 m.
Before the foundation piles were executed, two survey campaigns were carried out to assess the local soil profile. These campaigns were carried out in March of 2014 and of 2016, respectively.
The first campaign consisted of two sampling sites, encompassing both percussion and rotary sampling methodologies. After the retaining wall was built, an excavation was carried out until the quota to drill the foundation piles was achieved. In this moment, the second survey campaign began and consisted of four SPTs, which allowed the identification of the soil profile (color-coded later on this paper).
As the piles were executed in the whole terrain, the authors chose the closest pile to each of the surveys in order to characterize the pile’s installation soil profile.
The piles named P9CF, PR6, P9AF and P6AD are the closest piles to the soil surveys S1, S2, S3 and S4, respectively. After the piles are chosen, it is necessary to estimate the shear strength parameters of the soil layers drilled during their executions.
In order to use (7) and (8), it is important to firstly estimate the input parameters needed. According to [8], the calibration of (2) and (3) with experimental data provided β = 2.61 , K = 0.8 , B = 0.6 and α = 0.041 . Additionally, to obtain the vertical stress at a point, a linear varying stress with depth is considered. The specific weight of the soils is vastly reported in the literature. To the best of the authors’ knowledge, a mean value of 15 kN/m 3 is consistent and shall be considered. Therefore, the only parameter which still needs evaluation is η .
The efficiency parameter η is related to the energetic balance during drilling. Teale [16] indicates that there exists a minimum value of S e , which is the necessary amount to crush/excavate the materials. Anything greater than that indicates that some energy is being dissipated and not directly employed to increase the drilling performance. For example, energy may be spent to break the excavated material into smaller fragments than needed or may be dissipated as friction between drilling bits and drilled material. This unnecessary energetic expenditure becomes more prominent as the particle size is reduced [16].
Overall, since constituent particles are significantly smaller in soils than in rocks, soil excavation is not as efficient as rock excavation. This indicates that the energy spent to drill piles in soils is much bigger than the minimum amount that would be required for the particular material existing in the substratum.
Since the literature does not present a survey on the value of η , these values were calculated in the present paper. By (5), η can be estimated by fitting a line to the relation between S e and σ c . This last parameter can be estimated from NSPT data by using (4). For each of the soil surveys performed, a SPT test was carried out. Thus, it is possible to estimate the UCS of the soils drilled and, therefore, estimate η .
From Figure 2, it can be seen that different soils have different values of η . Greater values of this parameter imply less efficient drilling, as the energy needed to perform the drilling increases (considering that there is an optimal S e value). Soils with lower plasticity tend to have a more efficient drilling, as expected. Thus, based on the linear regressions presented, for the silty clay, clayey silt and silt, the values of η are 48.06, 41.04 and 33.86, respectively.
Being that all the parameters are obtained, one may proceed to use (7) and (8). Table 1 and Table 2 present the results, where the color codes follow the indications soil profile of the site.

4.2. Discussions

A comparison between Table 1 and Table 2 and common literature values for the parameters involved indicate that the results obtained are consistent with the soils drilled.
A major advance of the present model over existing studies is that no additional test is needed to perform the predictions. By considering only the data from the drilling machine, it was possible to obtain the parameters of interest in real time. This new approach also allows designers to know the parameters of exactly where the piles will be built, as no spatial interpolation is required (as is the case of other in situ and laboratory tests). This way, the new framework can be used as both the design and quality of execution assessment tools.
It is worth noticing that the model hereby developed is based on a semi-empirical approach, therefore, it could benefit from considering more data. Additionally, other studies need to be carried out in this direction, as the present paper is just a first step into the path of exploring drilling data to predict foundation behavior.

5. Conclusions

In the present paper, the relation between the execution energy of continuous flight auger piles and the strength parameters of the surrounding soil mass is studied. Based on two experimental models presented in the literature and a new physical model hereby derived, the collected data were analyzed, and it was possible to estimate the friction angle and the undrained shear strength of the excavated soil layers.
The simple method proposed provides consistent results, indicating its validity. Greater datasets, especially to better estimate η , could be used to enhance the applicability of the model.
Instant updating of designs can be achieved by using the methodology hereby proposed. This avoids common spatial interpolation errors, which would arise while using segregated test results.
Engineers need to make use of all the technological and theoretical aspects to enhance the capabilities of their models and designs. This is a key aspect in the big data era, where taking advantage of available information can be crucial to enhance the quality of designs. Overall, more laboratory and in situ tests need to be carried out to better calibrate the parameters of the model hereby developed, allowing a greater generalization of the predictions discussed.

Author Contributions

Conceptualization, D.J.F.d.C. and C.M.S.; data curation, D.J.F.d.C. and C.M.S.; methodology, L.C.d.S.M.O.; software, L.C.d.S.M.O.; validation, L.C.d.S.M.O. and D.J.F.d.C.; formal analysis, L.C.d.S.M.O. and D.J.F.d.C.; investigation, L.C.d.S.M.O. and D.J.F.d.C.; writing—original draft preparation, L.C.d.S.M.O.; writing—review and editing, J.C.d.C. and A.L.B.C.; supervision, J.C.d.C. and A.L.B.C. All authors have read and agreed to the published version of the manuscript.

Funding

This study was financed in part by the Coordination for the Improvement of Higher Education Personnel (CAPES)—Finance Code 001. The authors also acknowledge the support of the National Council for Scientific and Technological Development (CNPq Grant 305484/2020-6) and the University of Brasília. The authors also thank the Editorial Office of Geotechnics for waiving the APCs.

Institutional Review Board Statement

Not applicable.

Informed Consent Statement

Not applicable.

Data Availability Statement

The data used are available upon request to the corresponding author.

Acknowledgments

The authors acknowledge the support provided by the University of Brasilia (UnB).

Conflicts of Interest

The authors declare no conflict of interest.

References

  1. Amiri Khaboushan, E.; Emami, H.; Mosaddeghi, M.R.; Astaraei, A.R. Estimation of unsaturated shear strength parameters using easily-available soil properties. Soil Tillage Res. 2018, 184, 118–127. [Google Scholar] [CrossRef]
  2. Zhang, C.; Wang, X.; Zou, X.; Tian, J.; Liu, B.; Li, J.; Kang, L.; Chen, H.; Wu, Y. Estimation of surface shear strength of undisturbed soils in the eastern part of northern China’s wind erosion area. Soil Tillage Res. 2018, 178, 1–10. [Google Scholar] [CrossRef]
  3. Mola-Abasi, H.; Eslami, A. Prediction of drained soil shear strength parameters of marine deposit from CPTu data using GMDH-type neural network. Mar. Georesour. Geotechnol. 2019, 37, 180–189. [Google Scholar] [CrossRef]
  4. Zhang, Y.-G.; Qiu, J.; Zhang, Y.; Wei, Y. The adoption of ELM to the prediction of soil liquefaction based on CPT. Nat. Hazards 2021, 107, 539–549. [Google Scholar] [CrossRef]
  5. Duan, W.; Cai, G.; Liu, S.; Puppala, A.J.; Chen, R. In-situ evaluation of undrained shear strength from seismic piezocone penetration tests for soft marine clay in Jiangsu, China. Transp. Geotech. 2019, 20, 100253. [Google Scholar] [CrossRef]
  6. Zhang, Z.; Sheng, Q.; Fu, X.; Zhou, Y.; Huang, J.; Du, Y. An approach to predicting the shear strength of soil-rock mixture based on rock block proportion. Bull. Eng. Geol. Environ. 2020, 79, 2423–2437. [Google Scholar] [CrossRef]
  7. Puri, N.; Prasad, H.D.; Jain, A. Prediction of Geotechnical Parameters Using Machine Learning Techniques. Procedia Comput. Sci. 2018, 125, 509–517. [Google Scholar] [CrossRef]
  8. Hettiarachchi, H.; Brown, T. Use of SPT Blow Counts to Estimate Shear Strength Properties of Soils: Energy Balance Approach. J. Geotech. Geoenviron. Eng. 2009, 135, 830–834. [Google Scholar] [CrossRef]
  9. Ozelim, L.C.S.M.; de Campos, D.J.F.; de Carvalho, J.C.; Cavalcante, A.L.B. Indirect In-situ Tests During the Execution of Deep Foundations: Relating the Excavation Energies to the Young’s Moduli of the Surrounding Soils. In Sustainability Issues for the Deep Foundations. GeoMEast 2018. Sustainable Civil Infrastructures; El-Naggar, H., Abdel-Rahman, K., Fellenius, B., Shehata, H., Eds.; Springer: Berlin/Heidelberg, Germany, 2019; pp. 191–205. [Google Scholar]
  10. Assunção, M.; Calheiros, R.N.; Bianchi, S.; Netto, M.; Buyya, R. Big Data computing and clouds: Trends and future directions. J. Parallel Distrib. Comput. 2014, 75, 3–15. [Google Scholar] [CrossRef] [Green Version]
  11. Li, Z.; Itakura, K.I. An analytical drilling model of drag bits for evaluation of rock strength. Soils Found. 2012, 52, 216–227. [Google Scholar] [CrossRef] [Green Version]
  12. Behboud, M.M.; Ramezanzadeh, A.; Tokhmechi, B. Studying empirical correlation between drilling specific energy and geo-mechanical parameters in an oil field in SW Iran. J. Min. Environ. 2017, 8, 393–401. [Google Scholar] [CrossRef]
  13. Warren, T.M. Drilling Model for Soft-Formation Bits. Soc. Pet. Eng. 1981, 33, 963–970. [Google Scholar] [CrossRef]
  14. Warren, T.M. Penetration Rate Performance of Roller Cone Bits. Soc. Pet. Eng. 1987, 2, 9–18. [Google Scholar] [CrossRef]
  15. Kahraman, S.; Bilgin, N.; Feridunoglu, C. Dominant rock properties affecting the penetration rate of percussive drills. Int. J. Rock Mech. Min. Sci. 2003, 40, 711–723. [Google Scholar] [CrossRef]
  16. Teale, R. The concept of specific energy in rock drilling. Int. J. Rock Mech. Min. Sci. 1965, 2, 57–71. [Google Scholar] [CrossRef]
  17. Perko, H.A. Energy Method for Predicting the Installation Torque of Helical Foundations and Anchors. In New Technological and Design Developments in Deep Foundations; American Society of Civil Engineers: Reston, VA, USA, 2001; pp. 342–352. [Google Scholar]
  18. Tsuha, C.d.H.C.; Aoki, N. Relationship between installation torque and uplift capacity of deep helical piles in sand. Can. Geotech. J. 2010, 47, 635–647. [Google Scholar] [CrossRef]
  19. Silva, C.M.; Camapum de Carvalho, J.; Cavalcante, A.L.B. Energy and Reliability Applied to Continuous Flight Auger Pilings—The SCCAP Methodology. In Proceedings of the 18th International Conference on Soil Mechanics and Geotechnical Engineering, Paris, France, 2–6 September 2013; pp. 2807–2810. [Google Scholar]
  20. NAVFAC-DM7; Design Manual: Soil Mechanics, Foundations and Earth Structures. U.S. Department of the Navy: Washington, DC, USA, 1971.
  21. Hughes, H.M. Some Aspects of Rock Machining. Int. J. Rock Mech. Min. Sci. 1972, 9, 205–211. [Google Scholar] [CrossRef]
Figure 1. Methodological flowchart.
Geotechnics 02 00022 g001
Figure 2. Relation S e vs. σ c .
Geotechnics 02 00022 g002
Table 1. Friction angle estimation. Color code: silty clay (light gray), clayey silt (medium gray), silt (dark gray).
P9CFPR6P9AFP6AD
Layer S e (MJ/m 3 ) ϕ ( ° ) S e (MJ/m 3 ) ϕ ( ° ) S e (MJ/m 3 ) ϕ ( ° ) S e (MJ/m 3 ) ϕ ( ° )
0–1 m2.06372.07382.53414.3148
1–2 m4.45397.26458.55479.1648
2–3 m5.303411.024510.91459.9946
3–4 m7.71369.223910.70429.6442
4–5 m6.332612.024012.244010.3540
5–6 m7.282511.803713.203911.3942
6–7 m9.192713.653613.693710.5538
7–8 m9.372815.073613.143610.8336
8–9 m10.722918.183715.113712.5237
9–10 m10.3425 13.863315.5239
10–11 m10.9623 16.733510.3428
11–12 m10.1017 14.963011.1727
12–13 m8.908 18.053316.0634
13–14 m11.2615 14.072914.5530
Table 2. c u Estimation. Color code: Silty Clay (light gray) Clayey Silt (medium gray) Silt (dark gray).
P9CFPR6P9AFP6AD
Layer S e (MJ/m 3 ) c u (kPa) S e (MJ/m 3 ) c u (kPa) S e (MJ/m 3 ) c u (kPa) S e (MJ/m 3 ) c u (kPa)
0–1 m2.06222.07222.53274.3154
1–2 m4.45487.26788.55929.16115
2–3 m5.305711.0211810.911179.99126
3–4 m7.71839.229910.701159.64121
4–5 m6.336812.0212912.2413110.35130
5–6 m7.287811.8012713.2014211.39174
6–7 m9.199913.6514713.6914710.55161
7–8 m9.3711815.0716213.1416510.83165
8–9 m10.7213518.1819515.1119012.52191
9–10 m10.34130 13.8617415.52236
10–11 m10.96138 16.7321010.34158
11–12 m10.10127 14.9618811.17170
12–13 m8.90112 18.0522716.06245
13–14 m11.26142 14.0721414.55222
Publisher’s Note: MDPI stays neutral with regard to jurisdictional claims in published maps and institutional affiliations.

