Article

A Bibliometric Analysis of Studies on Plant Endemism during the Period of 1991–2022

1
Conservation Ecology Lab, Department of Botany, Baba Ghulam Shah Badshah University, Rajouri 185234, Jammu and Kashmir, India
2
Applied Ecology Lab, Department of Botany, Baba Ghulam Shah Badshah University, Rajouri 185234, Jammu and Kashmir, India
3
Department of Wood Technology Management, Faculty of Civil Technology, Technical and Vocational Training Institute (TVTI), Addis Ababa P.O. Box 190310, Ethiopia
4
Department of Plant Sciences, Quaid-i-Azam University, Islamabad 45320, Pakistan
5
Centre for Biodiversity Studies, Baba Ghulam Shah Badshah University, Rajouri 185234, Jammu and Kashmir, India
*
Authors to whom correspondence should be addressed.
J. Zool. Bot. Gard. 2023, 4(4), 692-710; https://doi.org/10.3390/jzbg4040049
Submission received: 13 July 2023 / Revised: 16 October 2023 / Accepted: 2 November 2023 / Published: 8 November 2023

Abstract

:
A bibliometric analysis of 349 scholarly documents published on the topic plant nativity and endemism from 1991–2022 was carried out using the ‘bibliometrix’ tool, developed through the R programming language. The results revealed a significant increase in the number of publications on plant nativity and endemism research since 1991. Of the total of 349 documents that were analyzed, 38 are single authored documents, and the average number of documents per author is 0.278. Each document has received an average of 33.67 citations, with 3.18 citations per year per document. The relationship between the number of authors and the number of articles that they have published follows a power-law distribution. Based on Bradford’s law, only eight were found to be the core sources. Mexico, followed by the USA, has produced the highest number of documents on plant nativity and endemism. The present study suggests that it is necessary to categorize data on endemism by floristic provinces, not by political subdivisions. Synecological studies are also needed, since endemic plants exist within communities. Models that accurately predict levels of endemism on the basis of easily measurable environmental variables should be useful for the rapid identification of endemic-rich areas. Recognition of the importance of plant endemism and the implementation of conservation measures is crucial for preserving biodiversity hotspots. Both in situ and ex situ conservation efforts are essential for protecting endemic species and preventing their extinction. By integrating these approaches, we can contribute to the long-term conservation and management of endemic plant species.

1. Introduction

Endemism is important when the history and origin of a flora are considered [1]. According to Braun-Blanquet (1923), who studied the origin and development of the flora of the Massif Central in France, “the study and precise interpretation of endemism of a region constitute the absolute criterion for the consideration of the origin and evolution of its flora and fauna. It enables us better to understand the past and the transformations that have taken place. It also provides us with a means for evaluating the extent and approximate timing of these transformations and the effects they produced on the development of the flora vegetation”. Plant endemism forms the principal criterion for the determination of biodiversity hotspots because endemic species are the most vulnerable species due to their restricted distributions [2]. The presence of various significant eco-regions and ecosystems with a global significance in France is suggested by the high endemism in the region [3]. A species is endemic if it is confined to a particular area through historical, ecological, or physiological reasons. Topography, climate, and altitude are the major barriers which restrict species’ gene flow and thus allow speciation to occur [4]. Increased isolation at higher elevations promotes speciation and, if the mountain areas are large enough to allow for population persistence and divergence, they may be rich in endemic elements [5].
The nativity of a species signifies its origin or first record, and the species which have their origin in a particular region are considered natives of that region, whereas the remaining species are considered as non-natives of that region. Mountain ecosystems are traditionally considered to be at a low risk for plant invasions [6]. However, increasing evidence shows that climate change and changing human land use, from agriculture to recreation and tourism, have facilitated the spread of non-natives to higher elevations [7,8]. The decreasing population of native and endemic species globally due to invasion of non-native species is negatively affecting ecosystems. Further, owing to their competitive and negative effects on native species, leading even to their extinction, this trend is a global concern [9]. Non-native species having a high ecological amplitude may displace native and endemic plant species by creating more competition for local resources, resulting in their loss [10]. Thus, as a result of habitat degradation, plant species, more often native species with specific habitat preferences, may suffer and the whole community structure may be altered due to more and more invasion by alien species [11,12].
In 1969, Pritchard introduced the idea of bibliometric analysis to analyze the scientific research trends qualitatively and quantitatively [13]. It involves advanced techniques to find out the impact and contribution of scientific publications and authors and investigates the effectiveness of works, frequency of terms, research trends, location of research, and knowledge gaps [14]. Bibliometric studies are becoming more and more popular across different scientific domains in order to develop a thorough understanding of any research topic and to better comprehend its trends and patterns [15,16,17]. Bibliometrics is a statistical method used to analyze the published literature both quantitatively and qualitatively [18]. Therefore, to summarize and synthesize substantial amounts of scientific data that have been published in the literature, bibliometric analysis is regarded as a basic searching technique, which is often done utilizing both competitive and world-class citation databases such as Web of Science (WoS), Scopus, and Google Scholar [19,20]. It helps in tracking the progress of a particular research field and generates crucial information about the quickly developing topics of that field [21,22]. Bibliometric parameters and indexes may be increasingly used by grant funding sources to measure research success [23]. Universities and institutions may build bench-marking standards from bibliometric data to determine academic achievements for promotion and tenure guidelines in the future. Bibliometric analyses have been carried out on various topics and themes such as biological invasions research [24,25], diabetes [26], biomass energy research [27], food web research [28], human resources training [29], forest carbon sequestration [30], microplastics research [31], industrial wastewater treatments [32], piosphere research [13], and endangered plants [33]. In the present study, a bibliometric analysis has been carried out to understand the global research trends on plant nativity and endemism. The objective of this study was to critically assess scholarly studies that have been published on topics connected to plant nativity and endemism from both a qualitative and a quantitative perspective. Research gaps and future directions are provided. The findings of the present study will help researchers, managers, and agencies in identifying future research priorities and collaborators in the relevant field. Moreover, this study can also contribute to a better understanding of the state of knowledge on plant nativity and endemism and promote the development of more effective strategies for managing and conserving plant biodiversity.

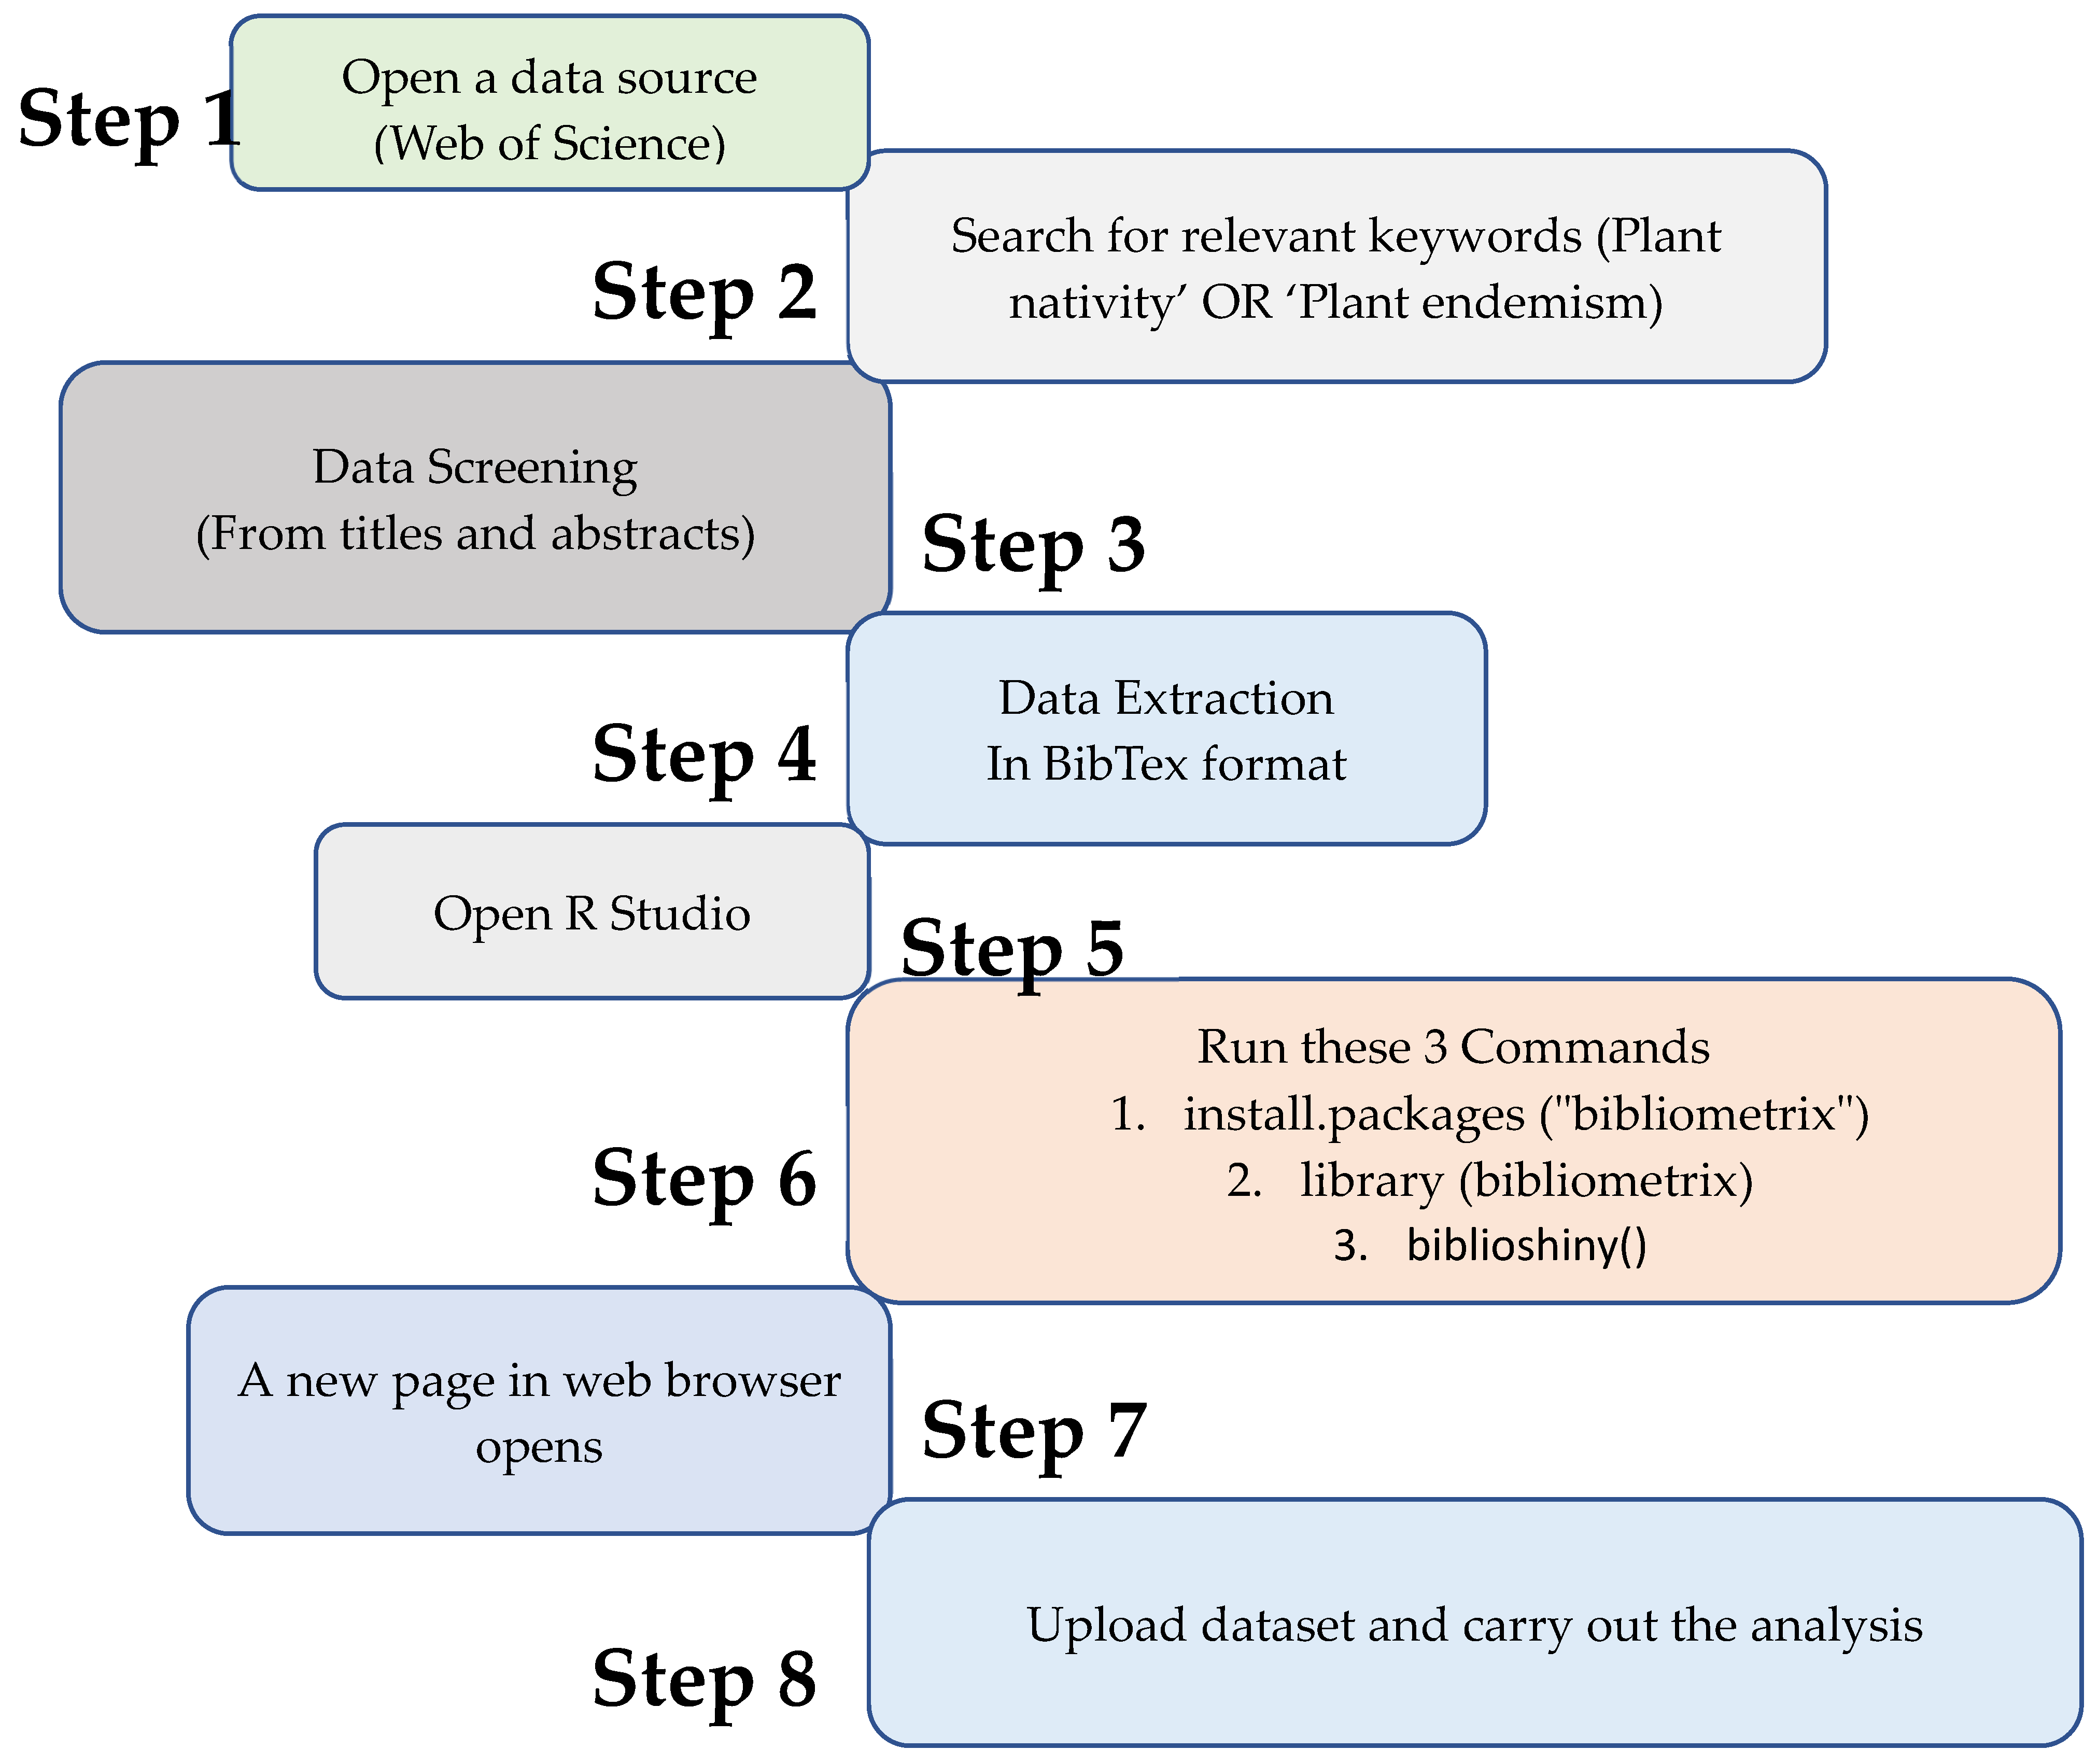
2. Materials and Methods

A search was made using the WoS database, as it is the most authentic and popular database among academics [34]. However, WoS has a limitation that we can only export up to 500 documents at a time; if the number of documents exceeds 500, we have to download separate files (500 each). These exported files are later merged or zipped before uploading for analysis. A total of 2806 documents were generated after searching for the relevant keywords, ‘Plant nativity’ OR ‘Plant endemism’. Out of these, only 349 relevant documents were selected for further analysis; irrelevant documents were excluded after screening of titles and abstracts. A full record and cited references of the final dataset were extracted in the ‘BibTeX’ format, as this format is preferable. For carrying out the bibliometric analysis of the final dataset, the ‘bibliometrix’ tool, developed through the R programming language, was used [31]. It is a state-of-the-art tool that follows the classical bibliometric workflow [35]. Within this bibliometrix R package, ‘biblioshiny’, an app developed for non-coders, was used. Biblioshiny runs within the default web browser and, from there, the dataset is uploaded and analyzed [36]. A step-by-step methodology has been presented in Figure 1, which makes the study reproducible. Data were analyzed for most relevant sources, authors, affiliations and countries, total author and country citations, author production, country production, countries’ collaborations, keyword analysis, and source and keyword growth trends.

3. Results and Discussion

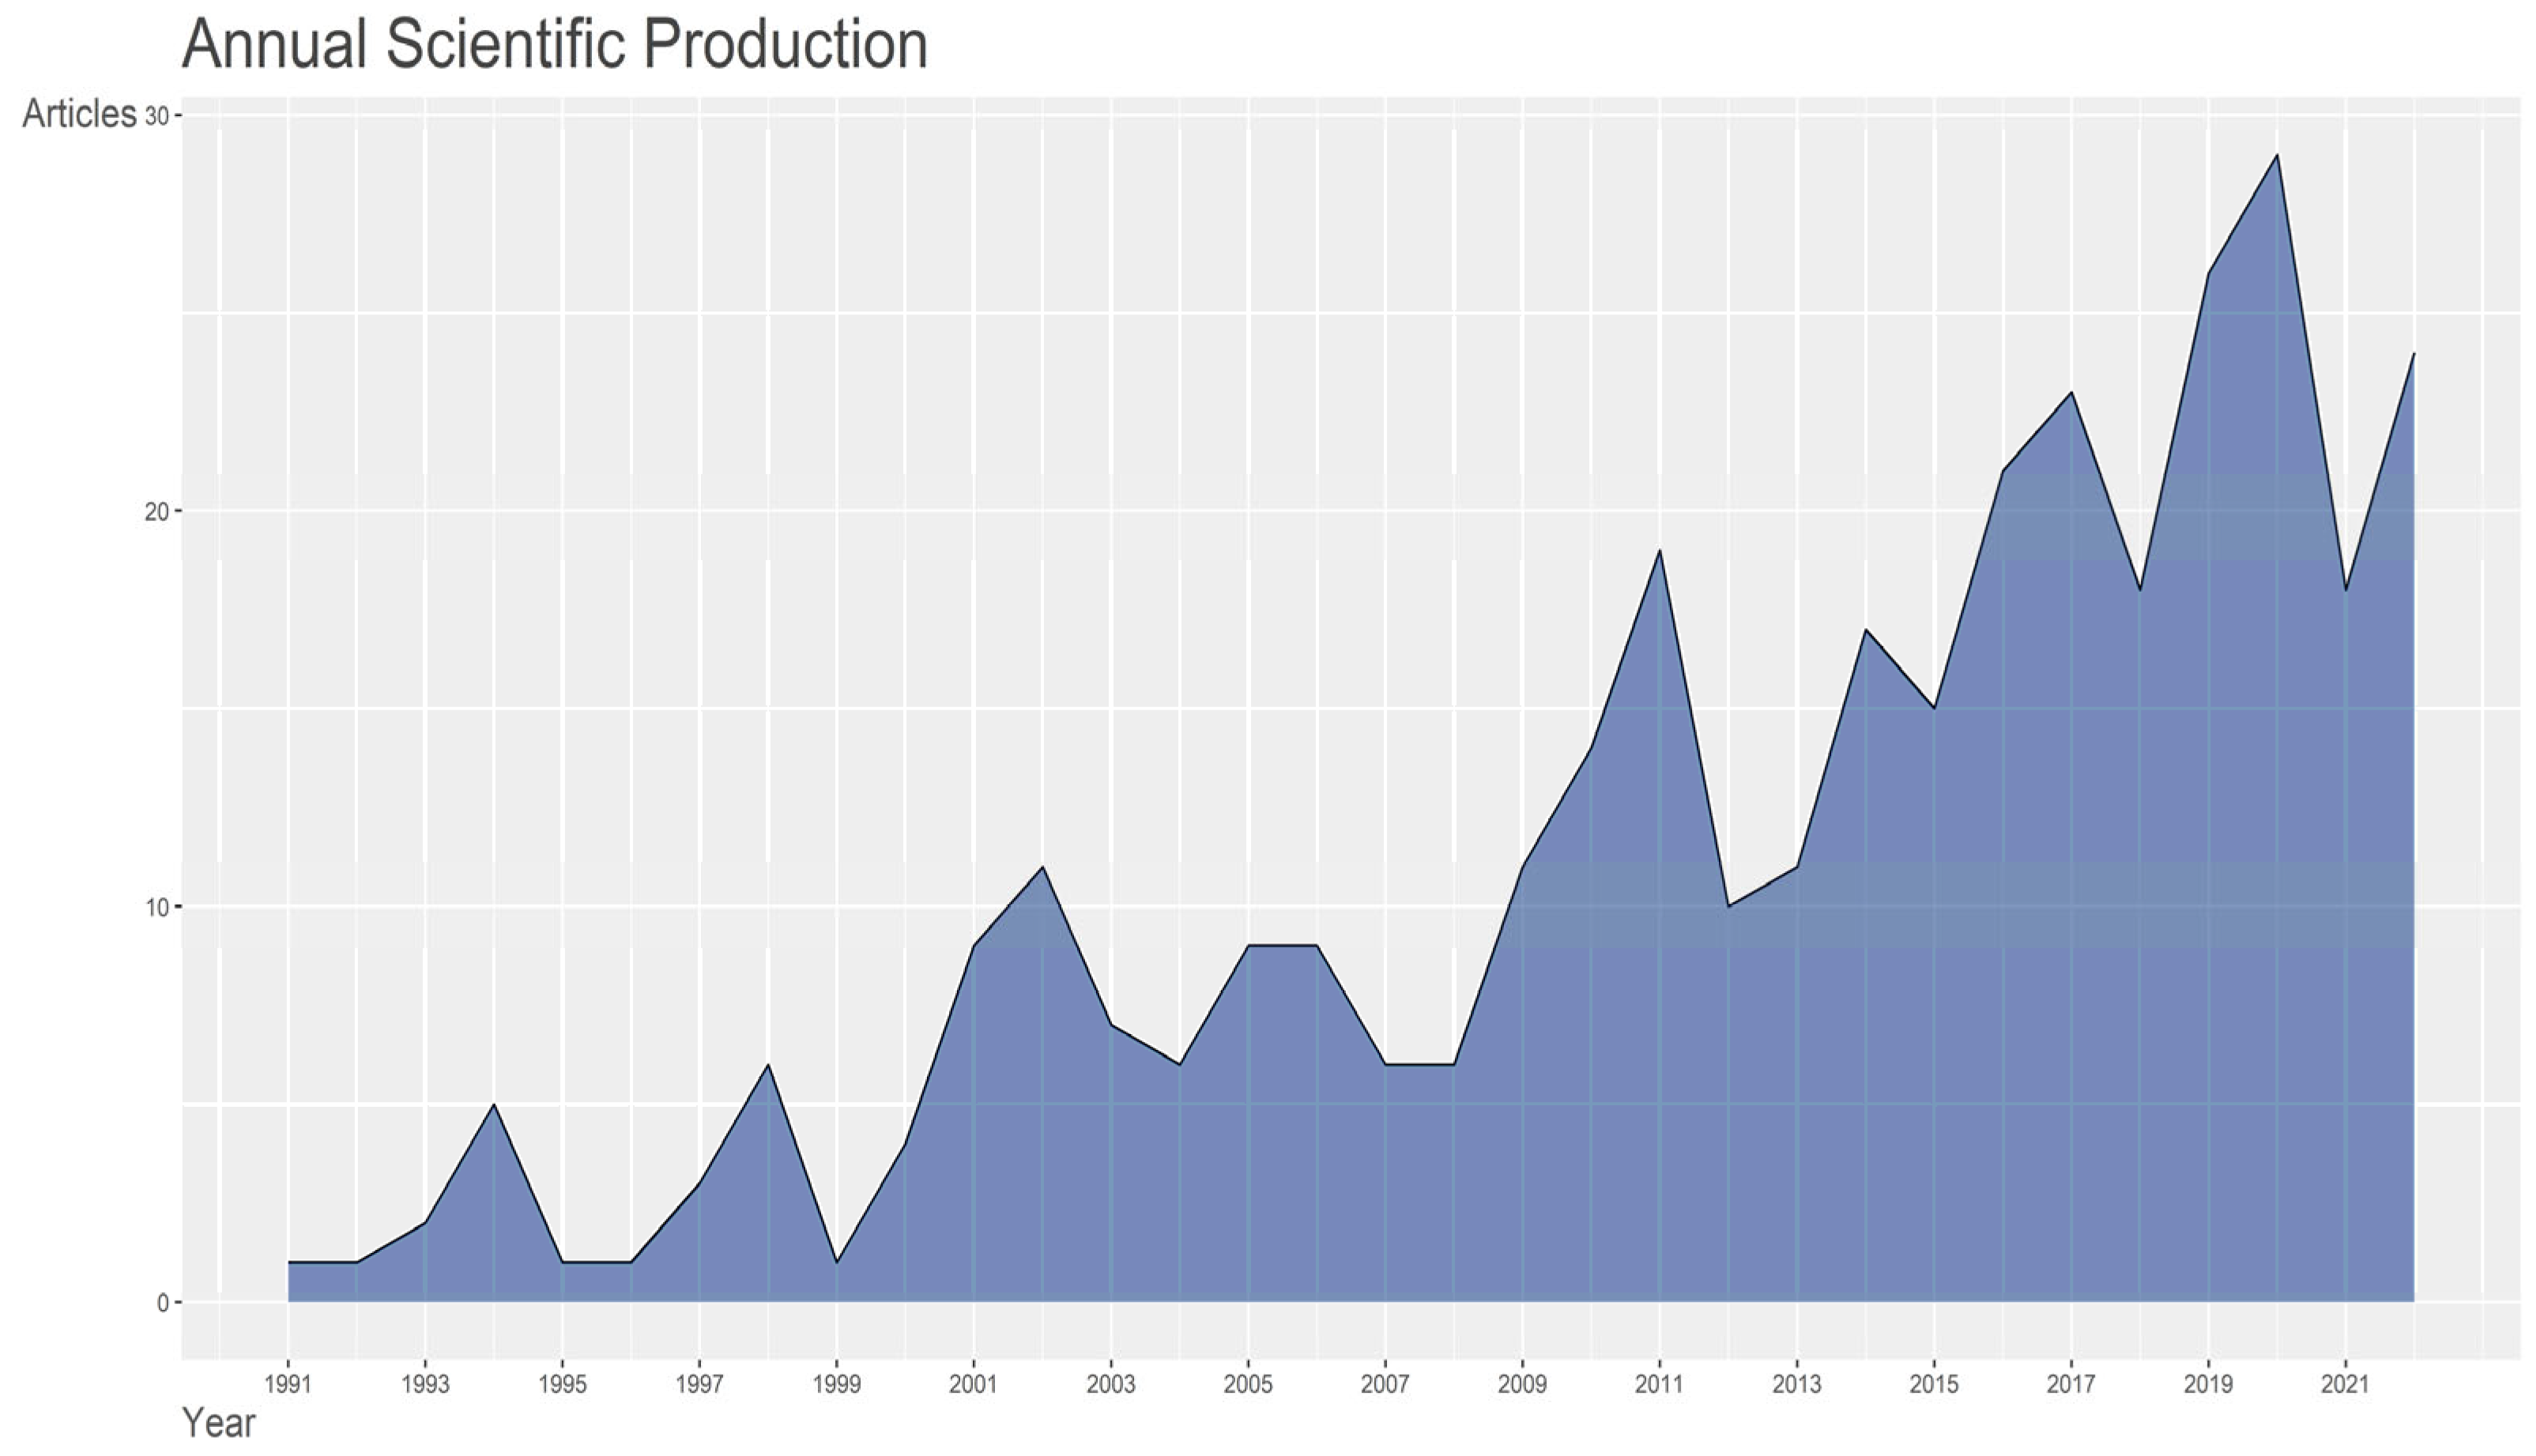
3.1. Publication Output and Annual Trends on the Topic of Plant Nativity and Endemism

During the present study, it was revealed that, from 1991 to 2022, a total of 349 scholarly documents were published on the topic of plant nativity and endemism, and these documents were retrieved from 123 sources like books, journals, proceedings, etc., from the WoS database. These scholarly documents include research articles (308), review articles (17), proceeding papers (8), data papers (5), editorials (4), and others. The publication output is an important indicator of the research progression of any field of study. It is measured by the number of articles published in journals, books, conference proceedings, etc. The number of publications does reflect the research output of an author or a research group; however, it does not address the quality of the publications [37]. The data also revealed a significant increase in the number of publications on the topic since 1991, with only 1 publication in 1991 and 24 publications in 2022. The highest number of publications on plant nativity and endemism was published in the year 2020 (29 publications) (Figure 2). This increasing trend in the number of publications on the topic of plant nativity and endemism reflects a growing interest of researchers and the broader public in this important topic. One of the reasons for the increase in publication output on plant nativity and endemism may be the growing recognition of the importance of plant diversity for ecosystem health and human wellbeing. Further, the need to better understand the distribution of plant species in response to climate change and other environmental challenges has led to increased funding for research in this area and greater collaboration among researchers from different countries and fields of study. Another factor contributing to the rise in publication output is the availability of modern data sources and analytical tools such as remote sensing and geographic information systems (GISs) which have made it easier to visualize spatial data, and which are particularly important in the study of plant nativity and endemism [38]. Researchers also use various species distribution modelling (SDM) tools that help in predicting the potential and future distribution patterns of a particular target species in a particular region [39]. As new data sources and analytical tools become available, it is likely that our understanding of plant distribution patterns will continue to improve, which in turn will aid in conservation efforts and the preservation of plant diversity.

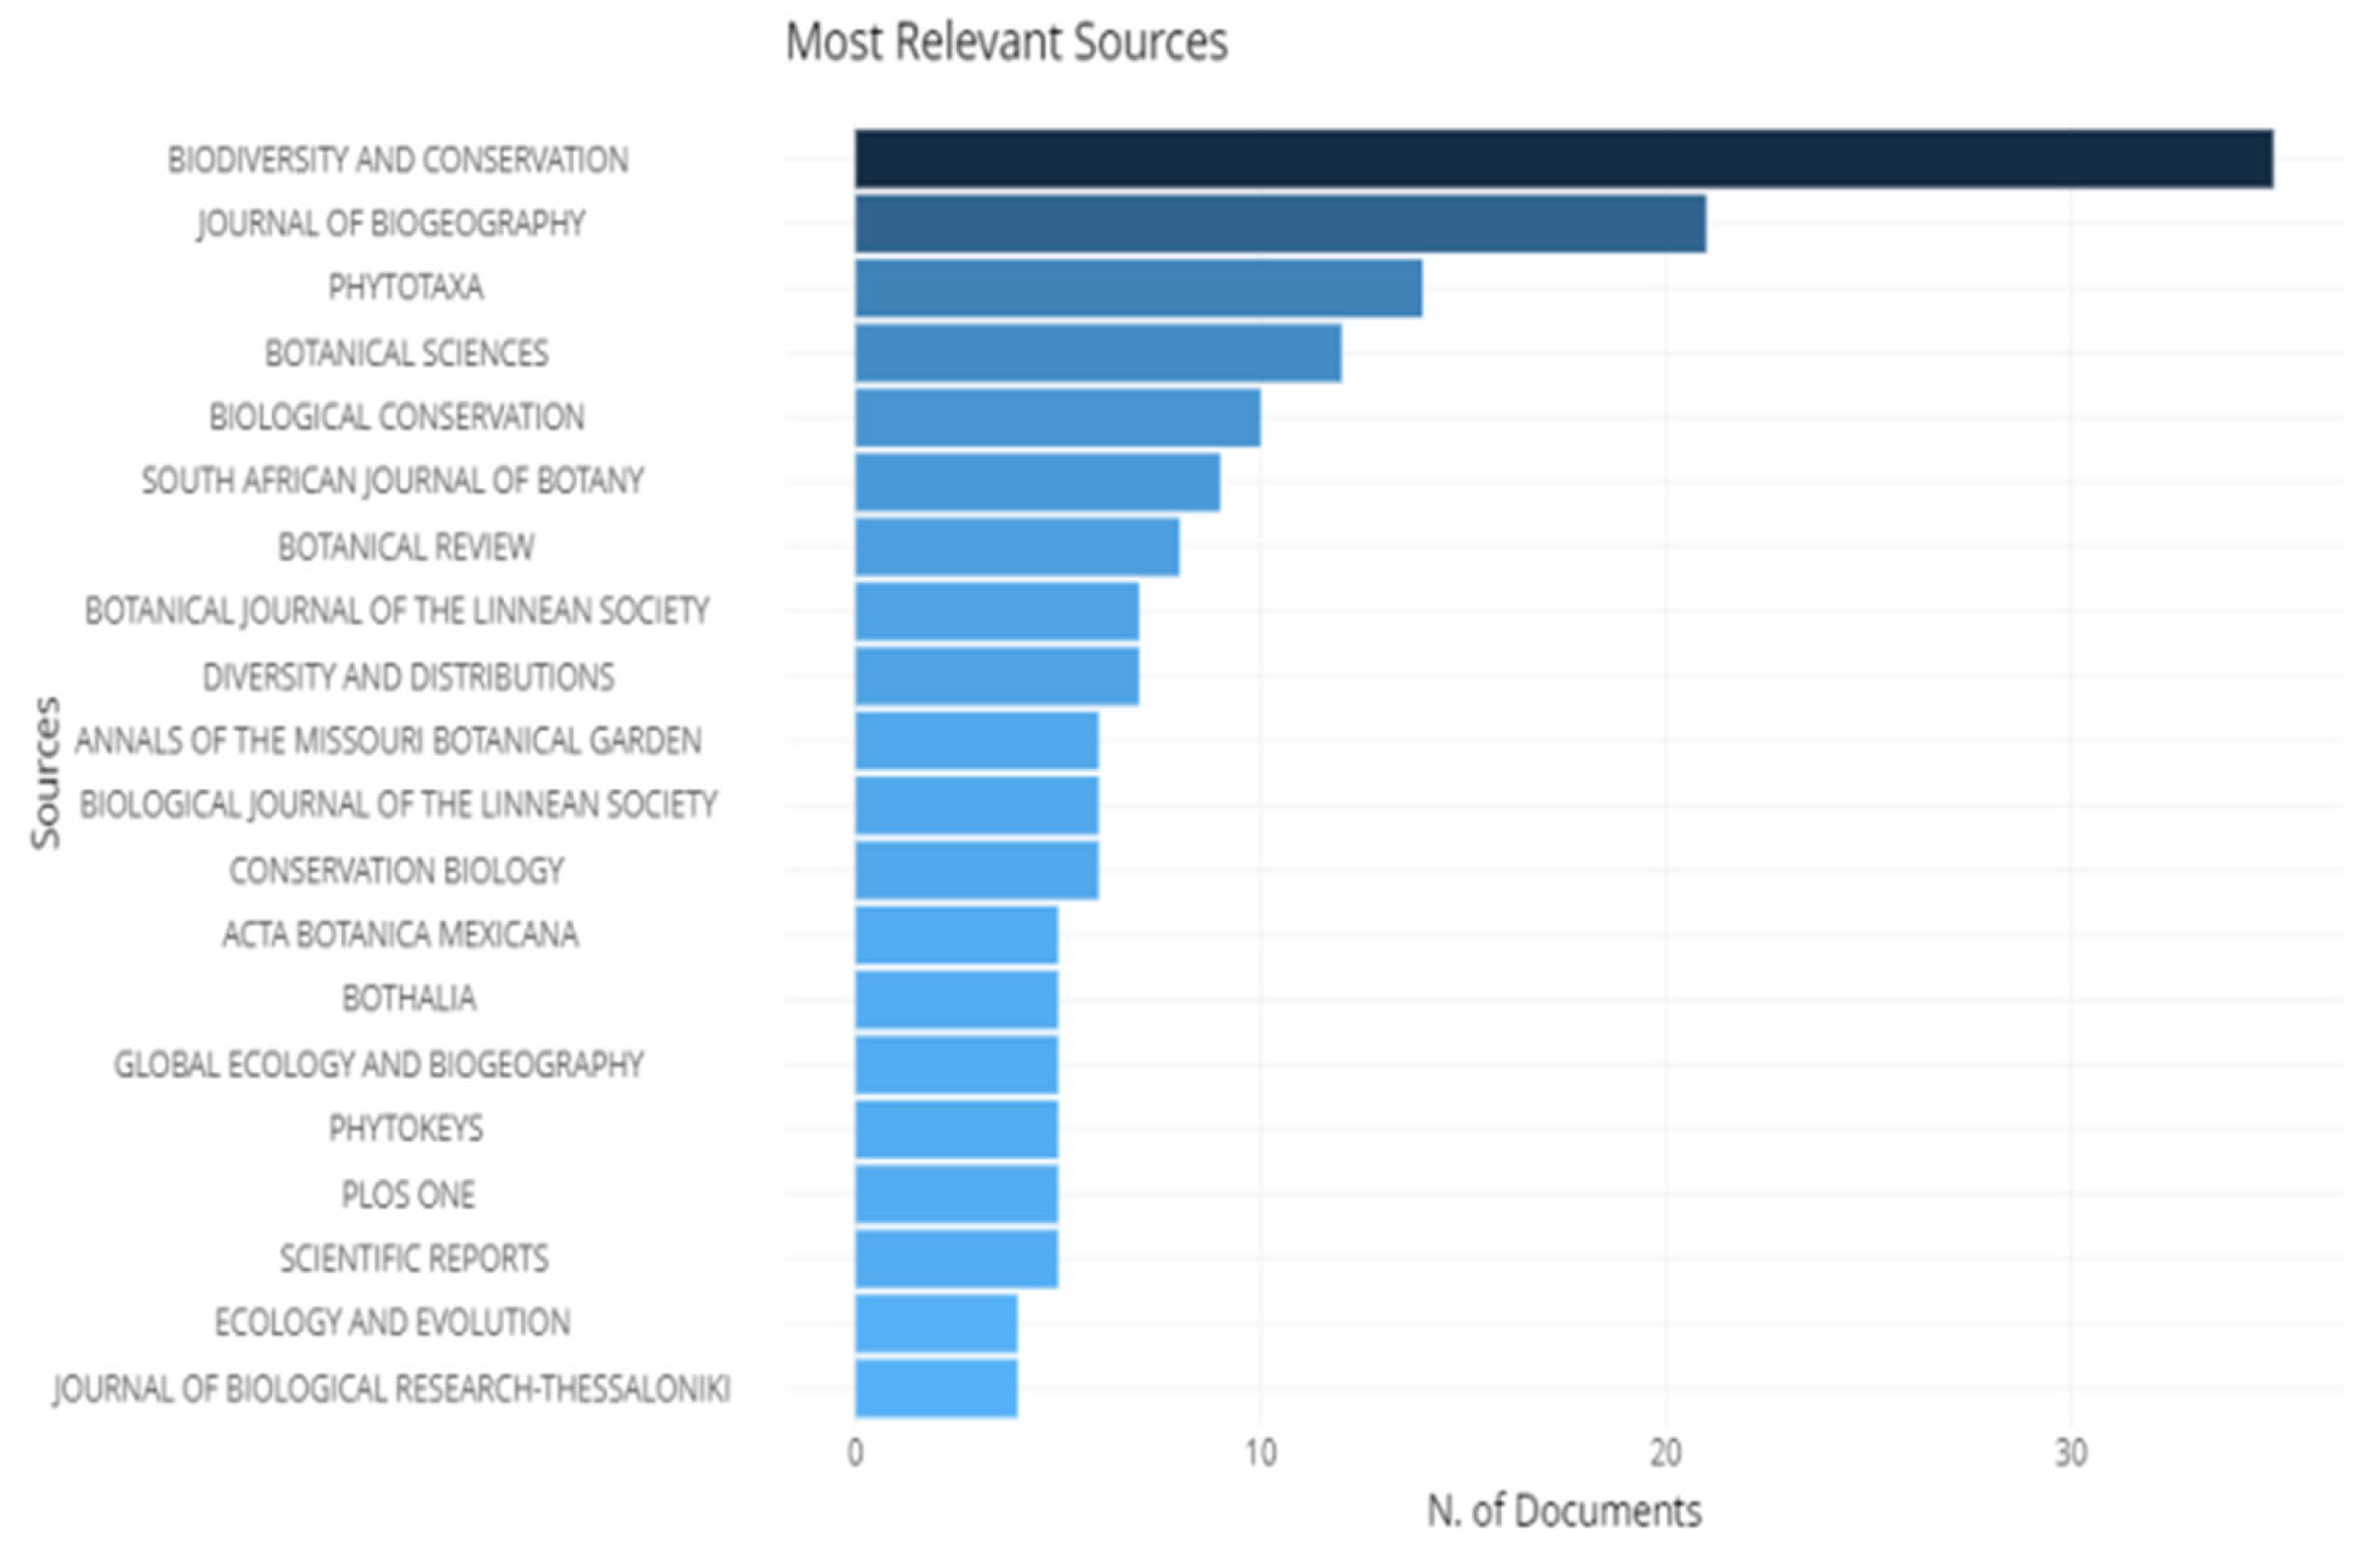
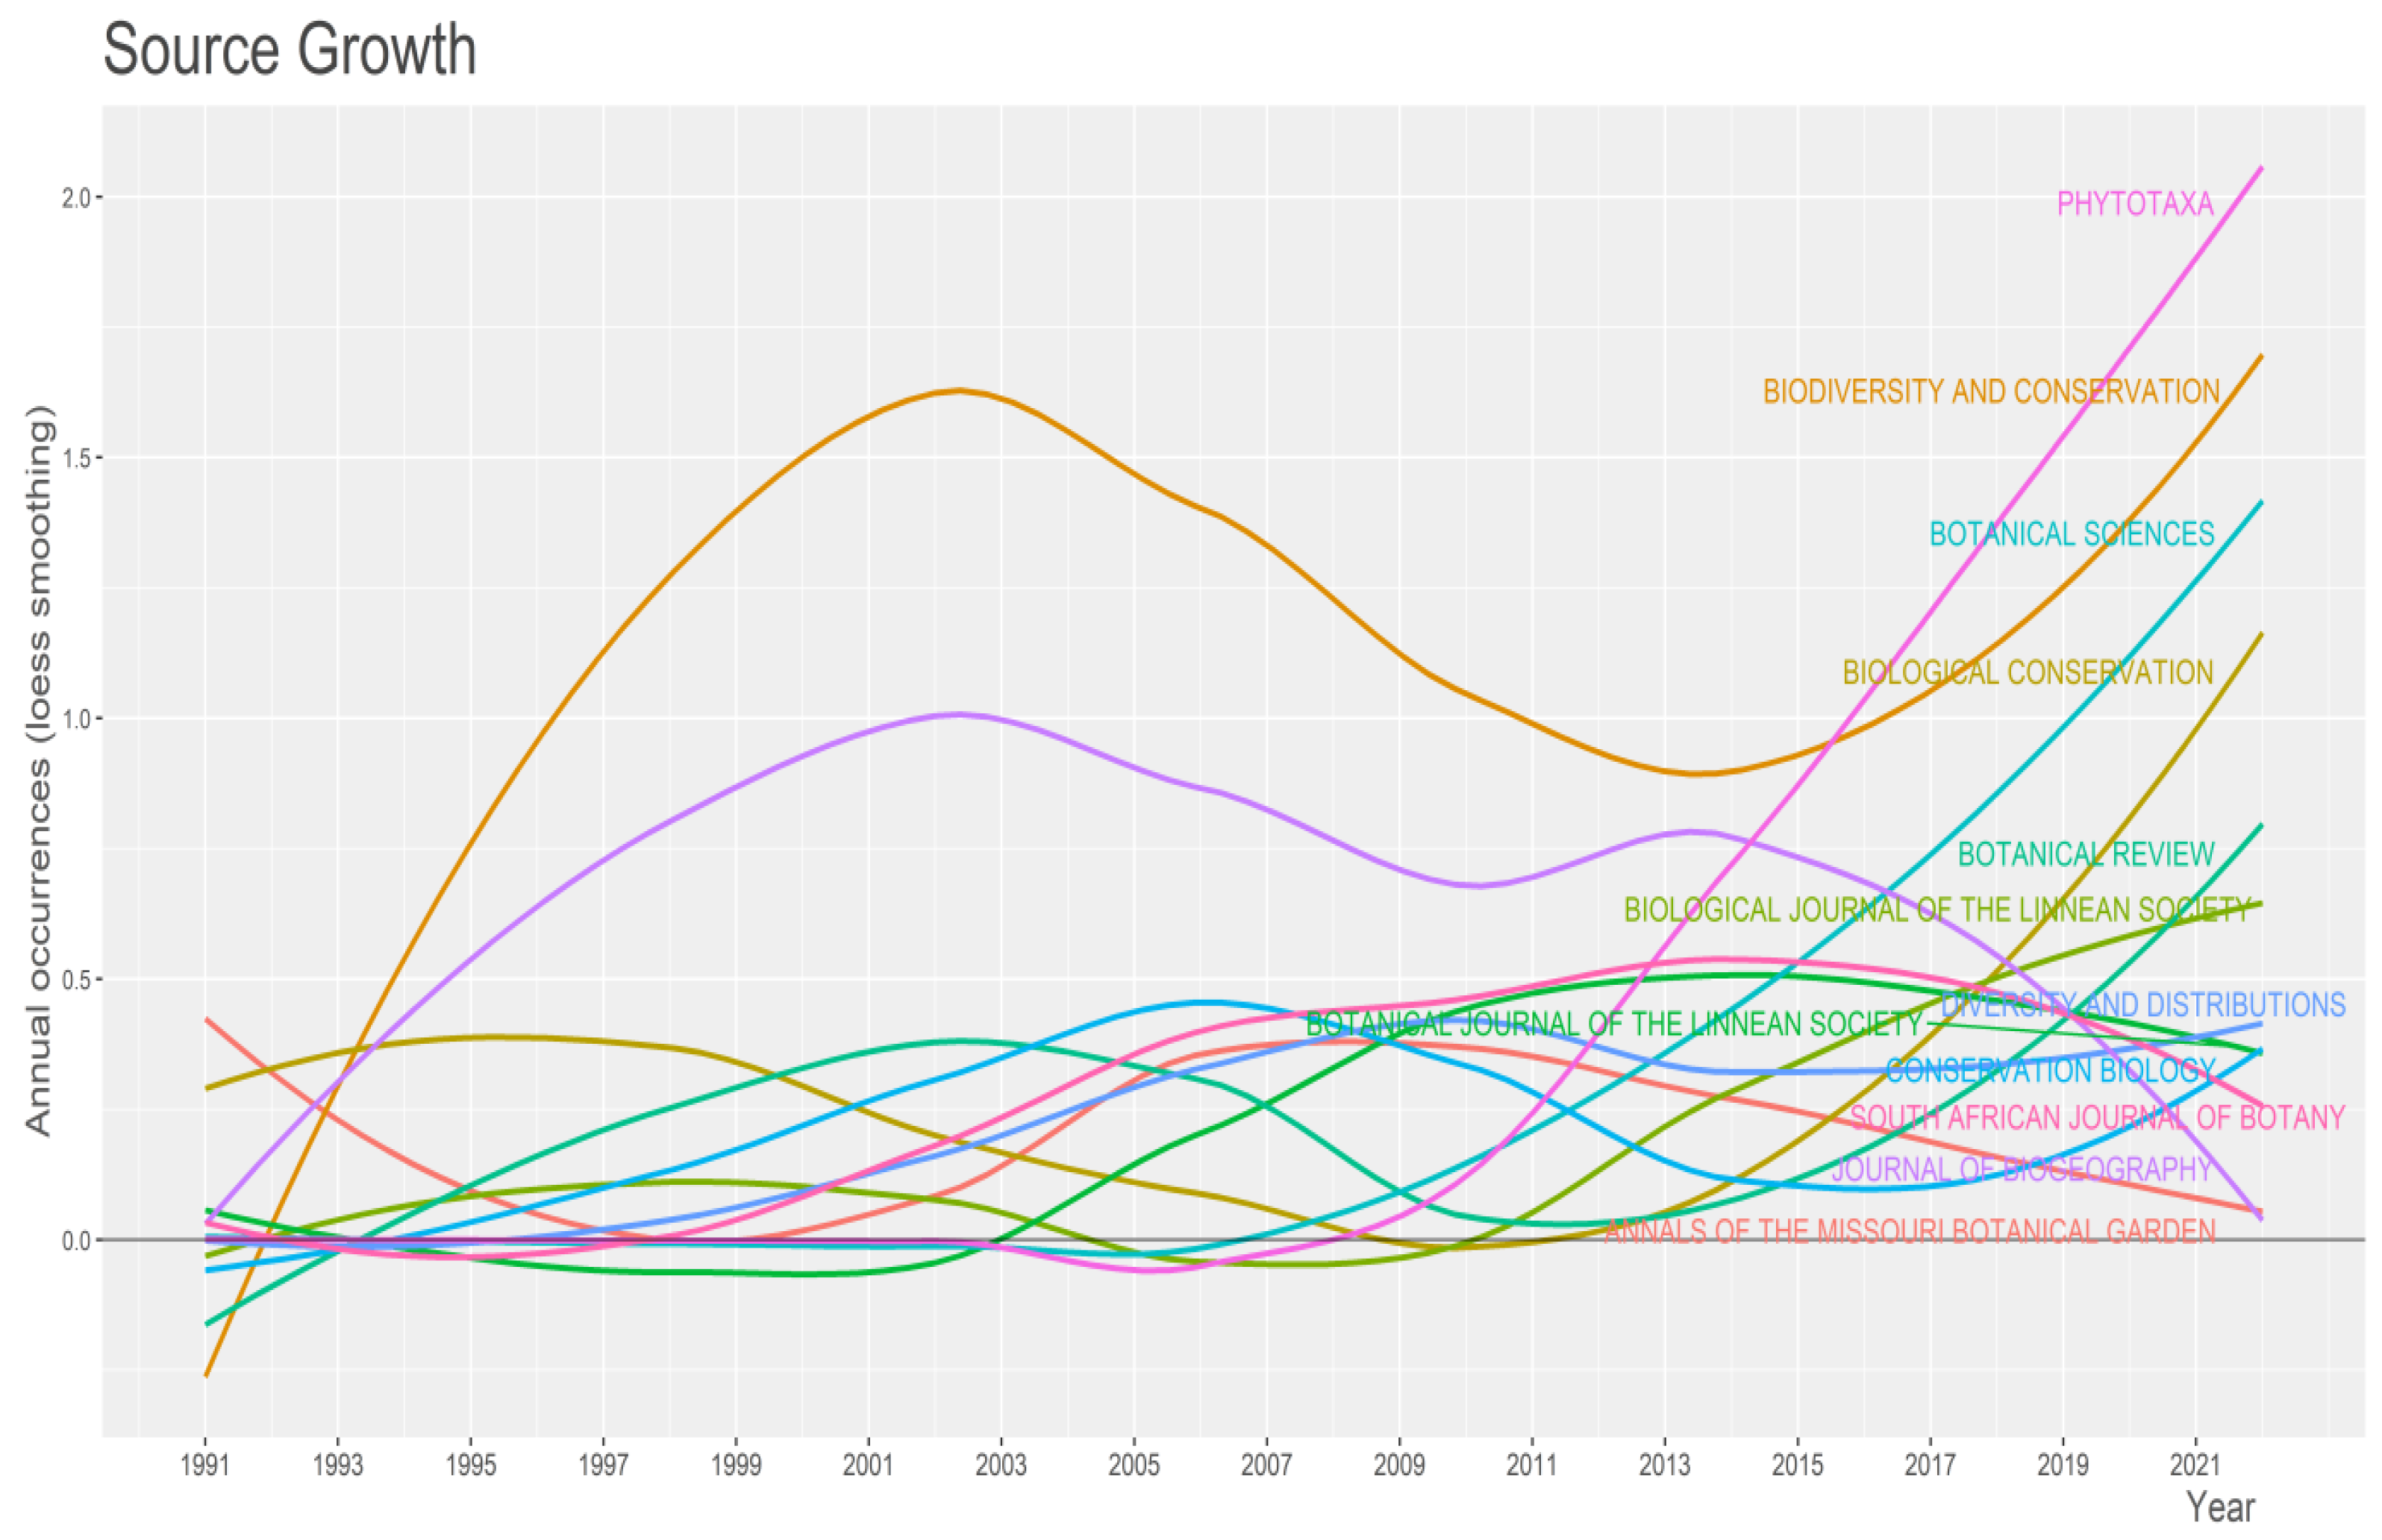
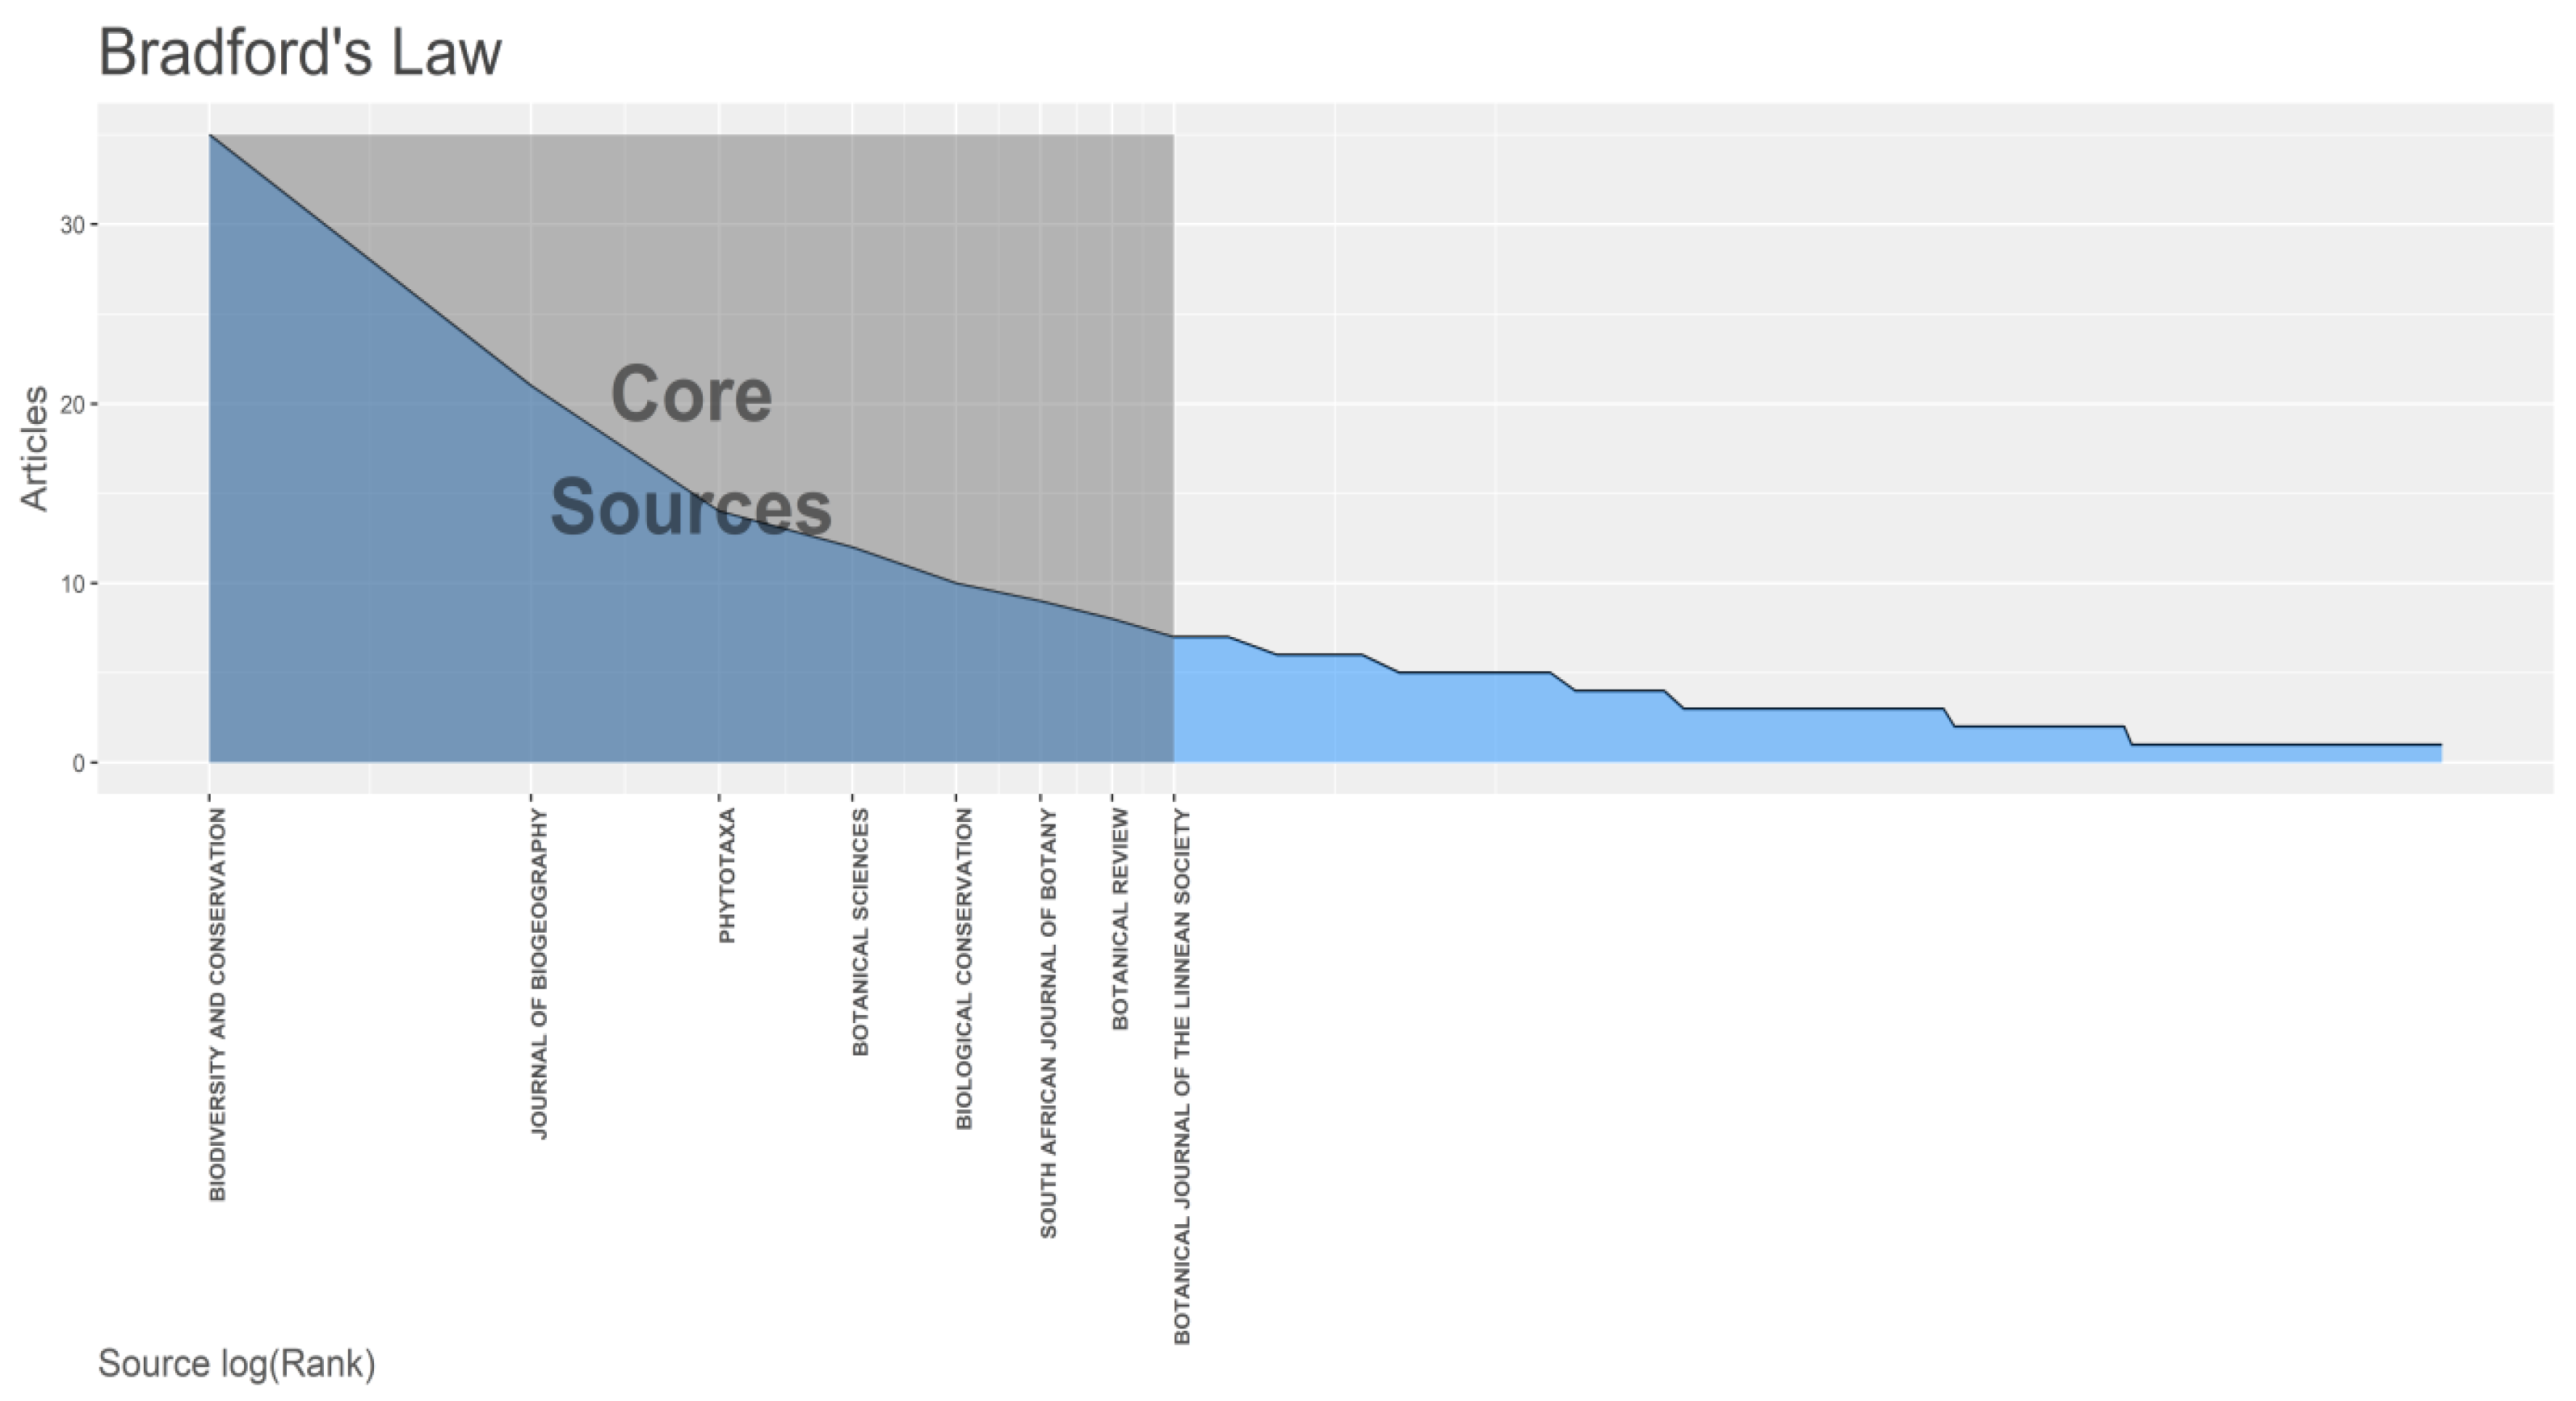
3.2. Most Important Sources/Journals

Journals are regarded as vital tools for disseminating research; hence, the quality and reputation of a journal plays an important role in disseminating knowledge to the relevant section of society [40]. In the present study, out of the total of 123 sources on the topic of plant nativity and endemism, the most relevant sources are the journals ‘Biodiversity and Conservation’, ‘Journal of Biogeography’, ‘Phytotaxa’, ‘Botanical Sciences’, ‘Biological Conservation’, ‘South African Journal of Botany’, ‘Botanical Review’, and ‘Botanical Journal of Linnean Society’ (Figure 3). The journal ‘Biodiversity and Conservation’ is a peer-reviewed journal that publishes research on various aspects of conservation biology and diversity. The scope of the journal is wide and multidisciplinary and embraces all life forms. Since plant nativity and endemism have important implications for conservation and are often treated as important measures of biodiversity, these two often remain as core topics for conservation biologists. Hence, the source dynamics analysis revealed that the journal ‘Biodiversity and Conservation’ has always remained the most relevant in terms of publications on plant nativity and endemism. However, the number of publications on plant nativity and endemism has constantly increased in the Journal ‘Phytotaxa’ since 2010, and it has now surpassed ‘Biodiversity and Conservation’ in terms of number of publications on plant nativity and endemism (Figure 4). The journal ‘Phytotaxa’ is also a peer-reviewed journal that publishes papers on plant taxonomy, systematics, and nomenclature. It covers a wide range of topics related to the classification, naming, and identification of plants, including descriptions of new plant species, revisions of plant groups, phylogenetic studies, and taxonomic treatments of particular plant families, genera, and species. ‘Phytotaxa’ publishes articles from various fields of plant taxonomy, including classical morphology, anatomy, palynology, molecular systematics, and phylogenetics. It serves as a platform for researchers and taxonomists to communicate their findings and contribute to our understanding of plant diversity and evolution. The fact that ‘Phytotaxa’ has surpassed ‘Biodiversity and Conservation’ in terms of their number of publications on plant nativity and endemism is an interesting observation. This could be due to a variety of factors, such as the focus of ‘Phytotaxa’ on taxonomic and systematic studies, which are important for understanding the diversity and distribution of plant species, including endemics. On the other hand, ‘Biodiversity and Conservation’ may have a broader focus that includes studies on other aspects of biodiversity conservation, such as habitat management and restoration, which could account for the difference in publication outputs. Overall, the increase in publications on plant nativity and endemism in ‘Phytotaxa’ and its surpassing of ‘Biodiversity and Conservation’ in terms of the number of publications on this topic indicates the growing importance of this field of research and the need for more studies in this area to inform conservation efforts and further our understanding of plant biodiversity.
Bradford’s Law is a bibliometric principle that states that a small number of journals, known as “core sources”, will contain a significant portion of the articles on a particular topic [41]. Based on Bradford’s law, out of the total of 123 sources, only 8 journals were found to be the core sources (Figure 5). This suggests that these eight journals likely contain a substantial proportion of the articles related to the topic of plant nativity and endemism, while the remaining sources may have a lower relevance or frequency of articles on that specific topic. The journals ‘Biodiversity and Conservation’, ‘Journal of Biogeography’, ‘Phytotaxa’, ‘Botanical Studies’, ‘Biological Conservation’, ‘South African journal of Botany’, ‘Botanical Review’, and ‘Botanical Journal of the Linnean Society’ have been identified as the most important and basic sources.

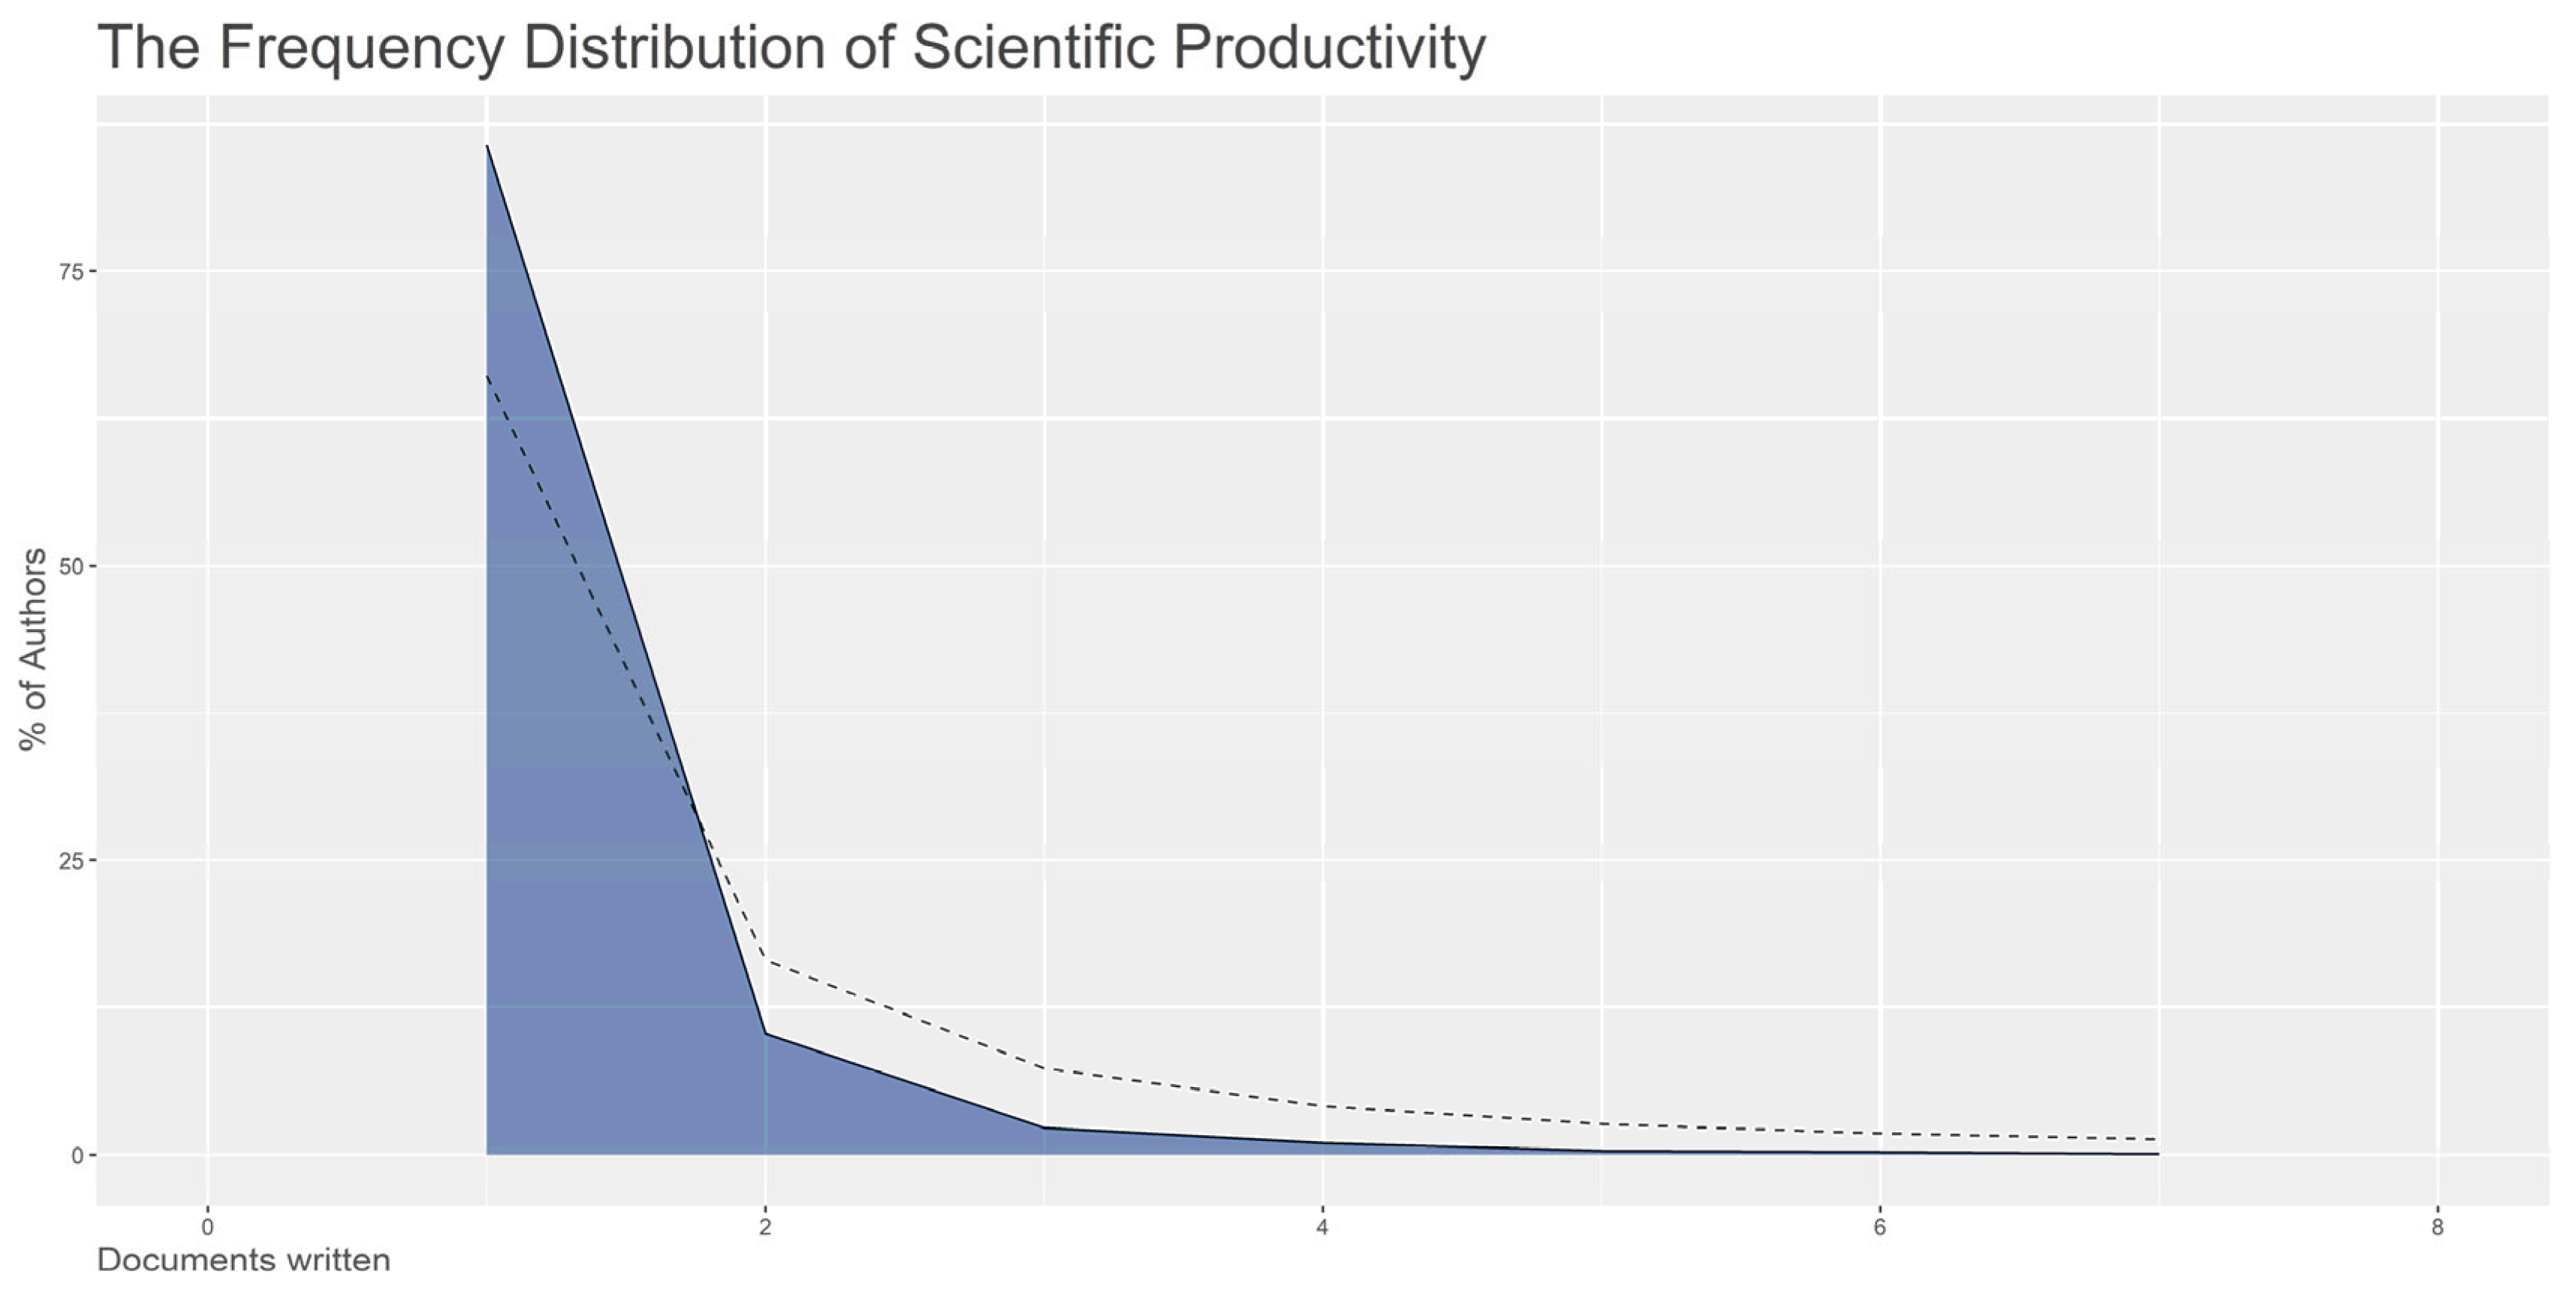
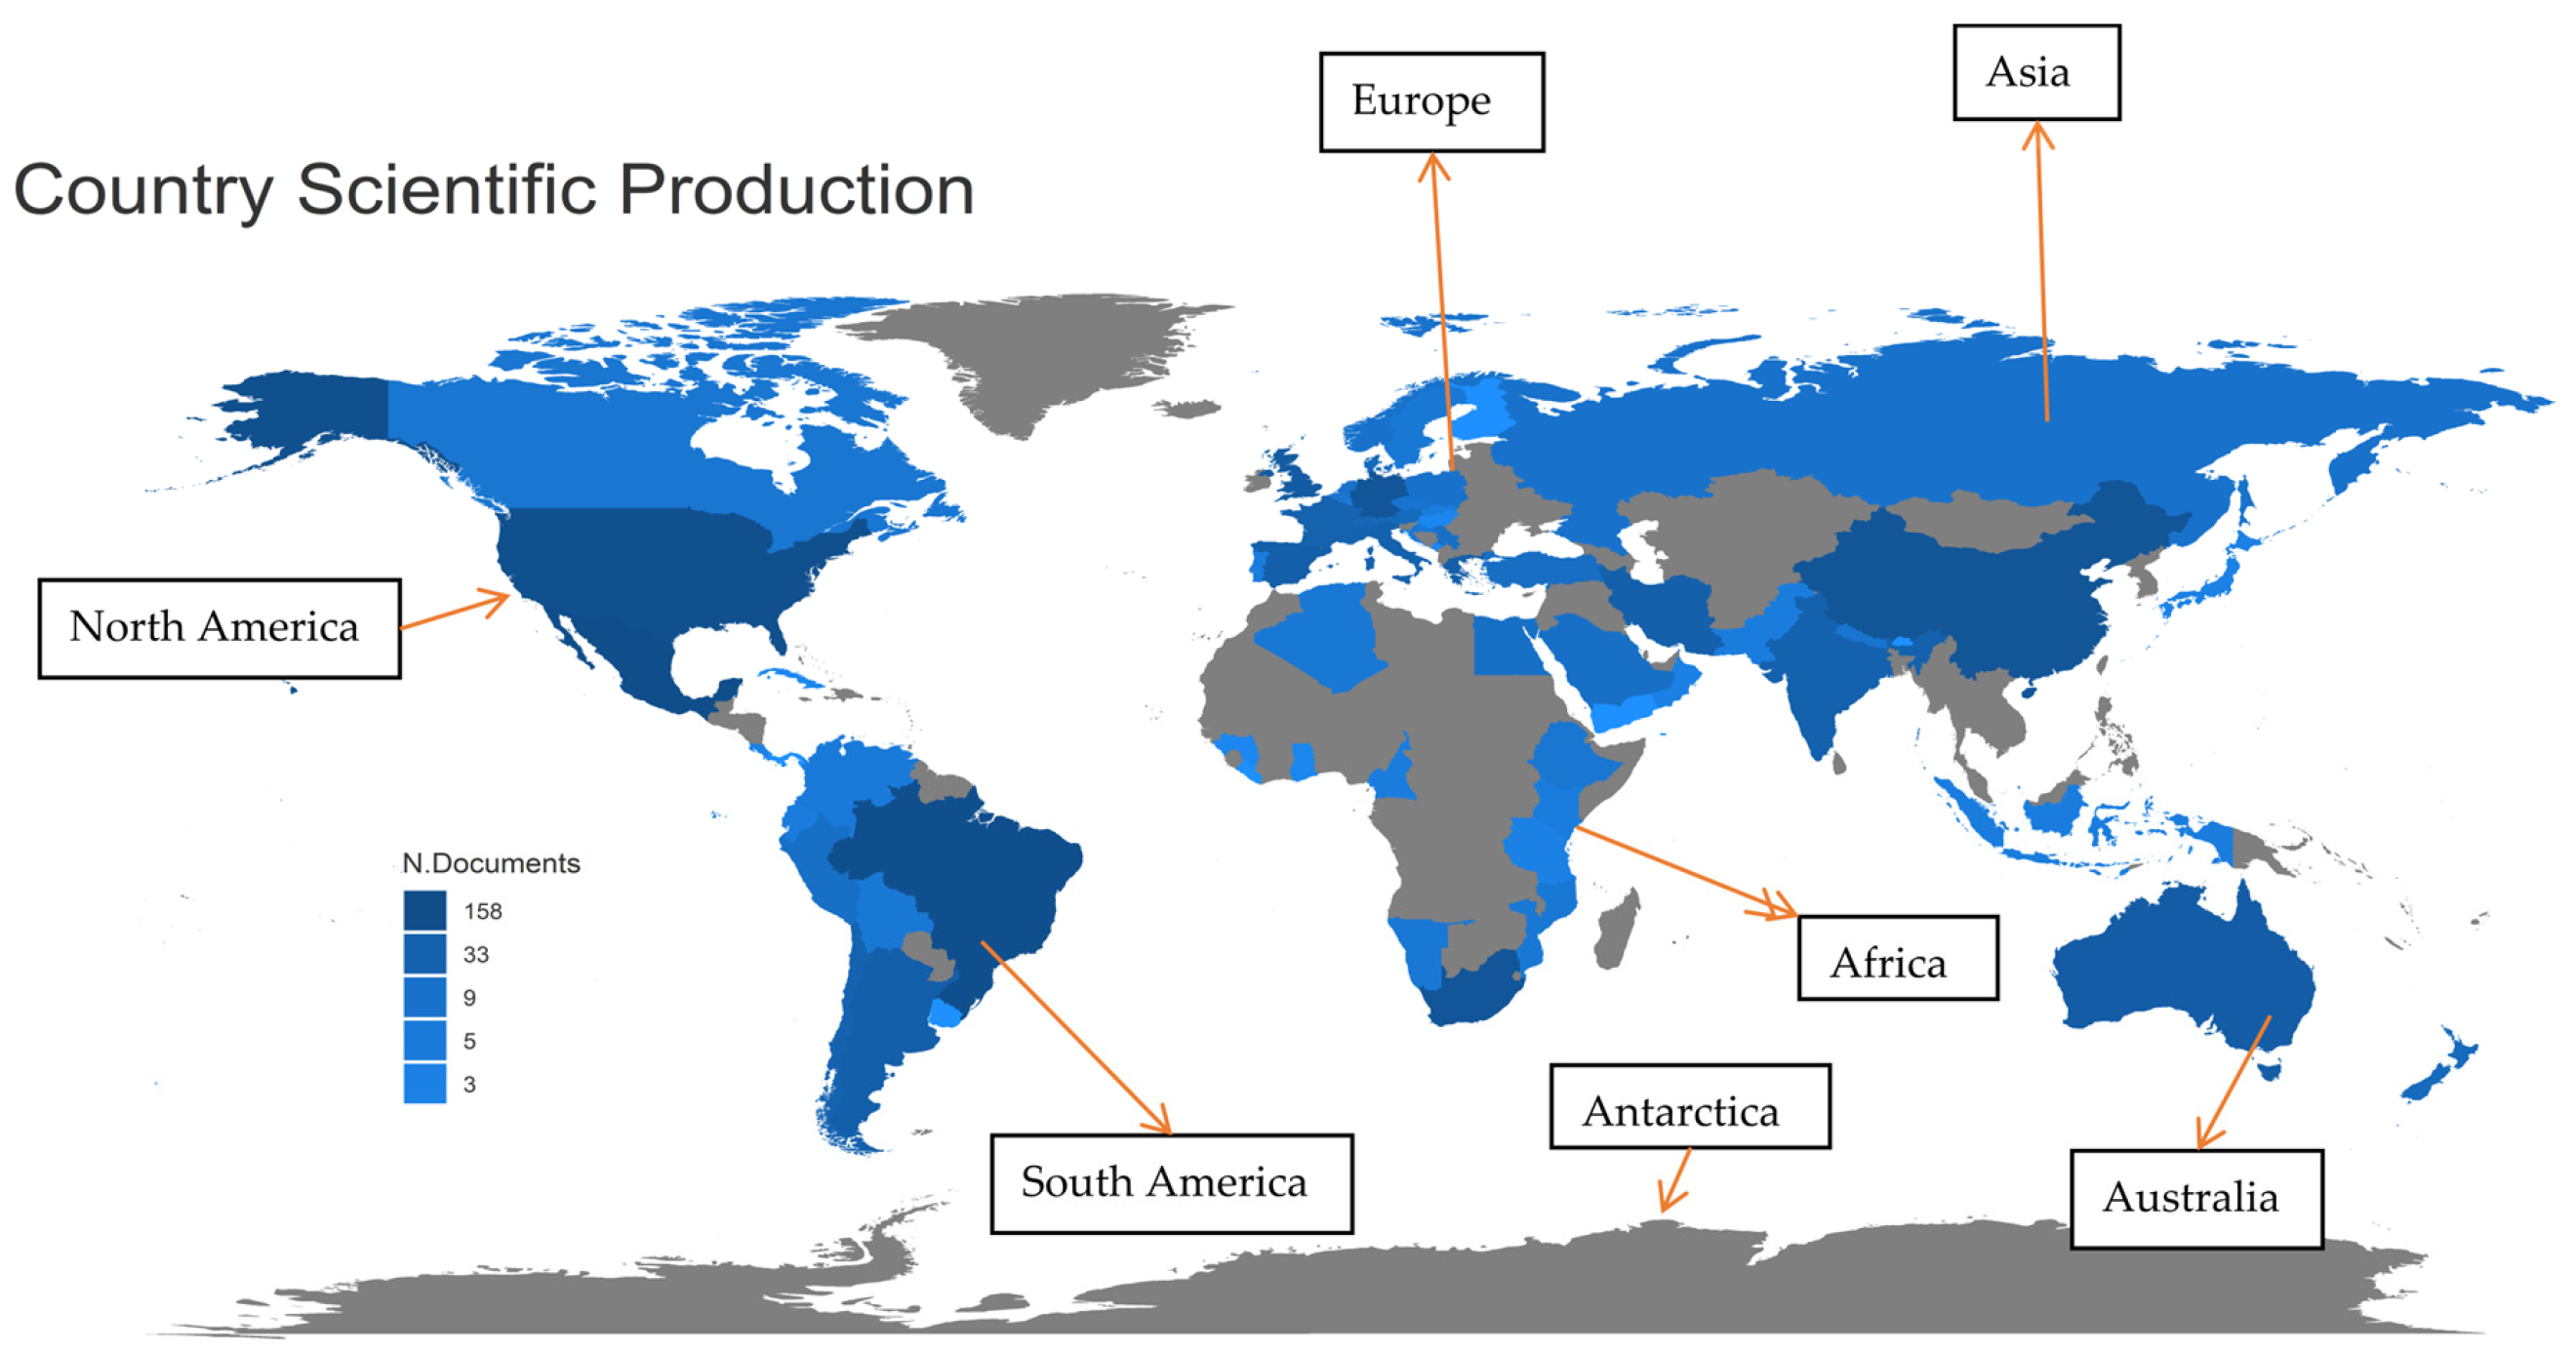
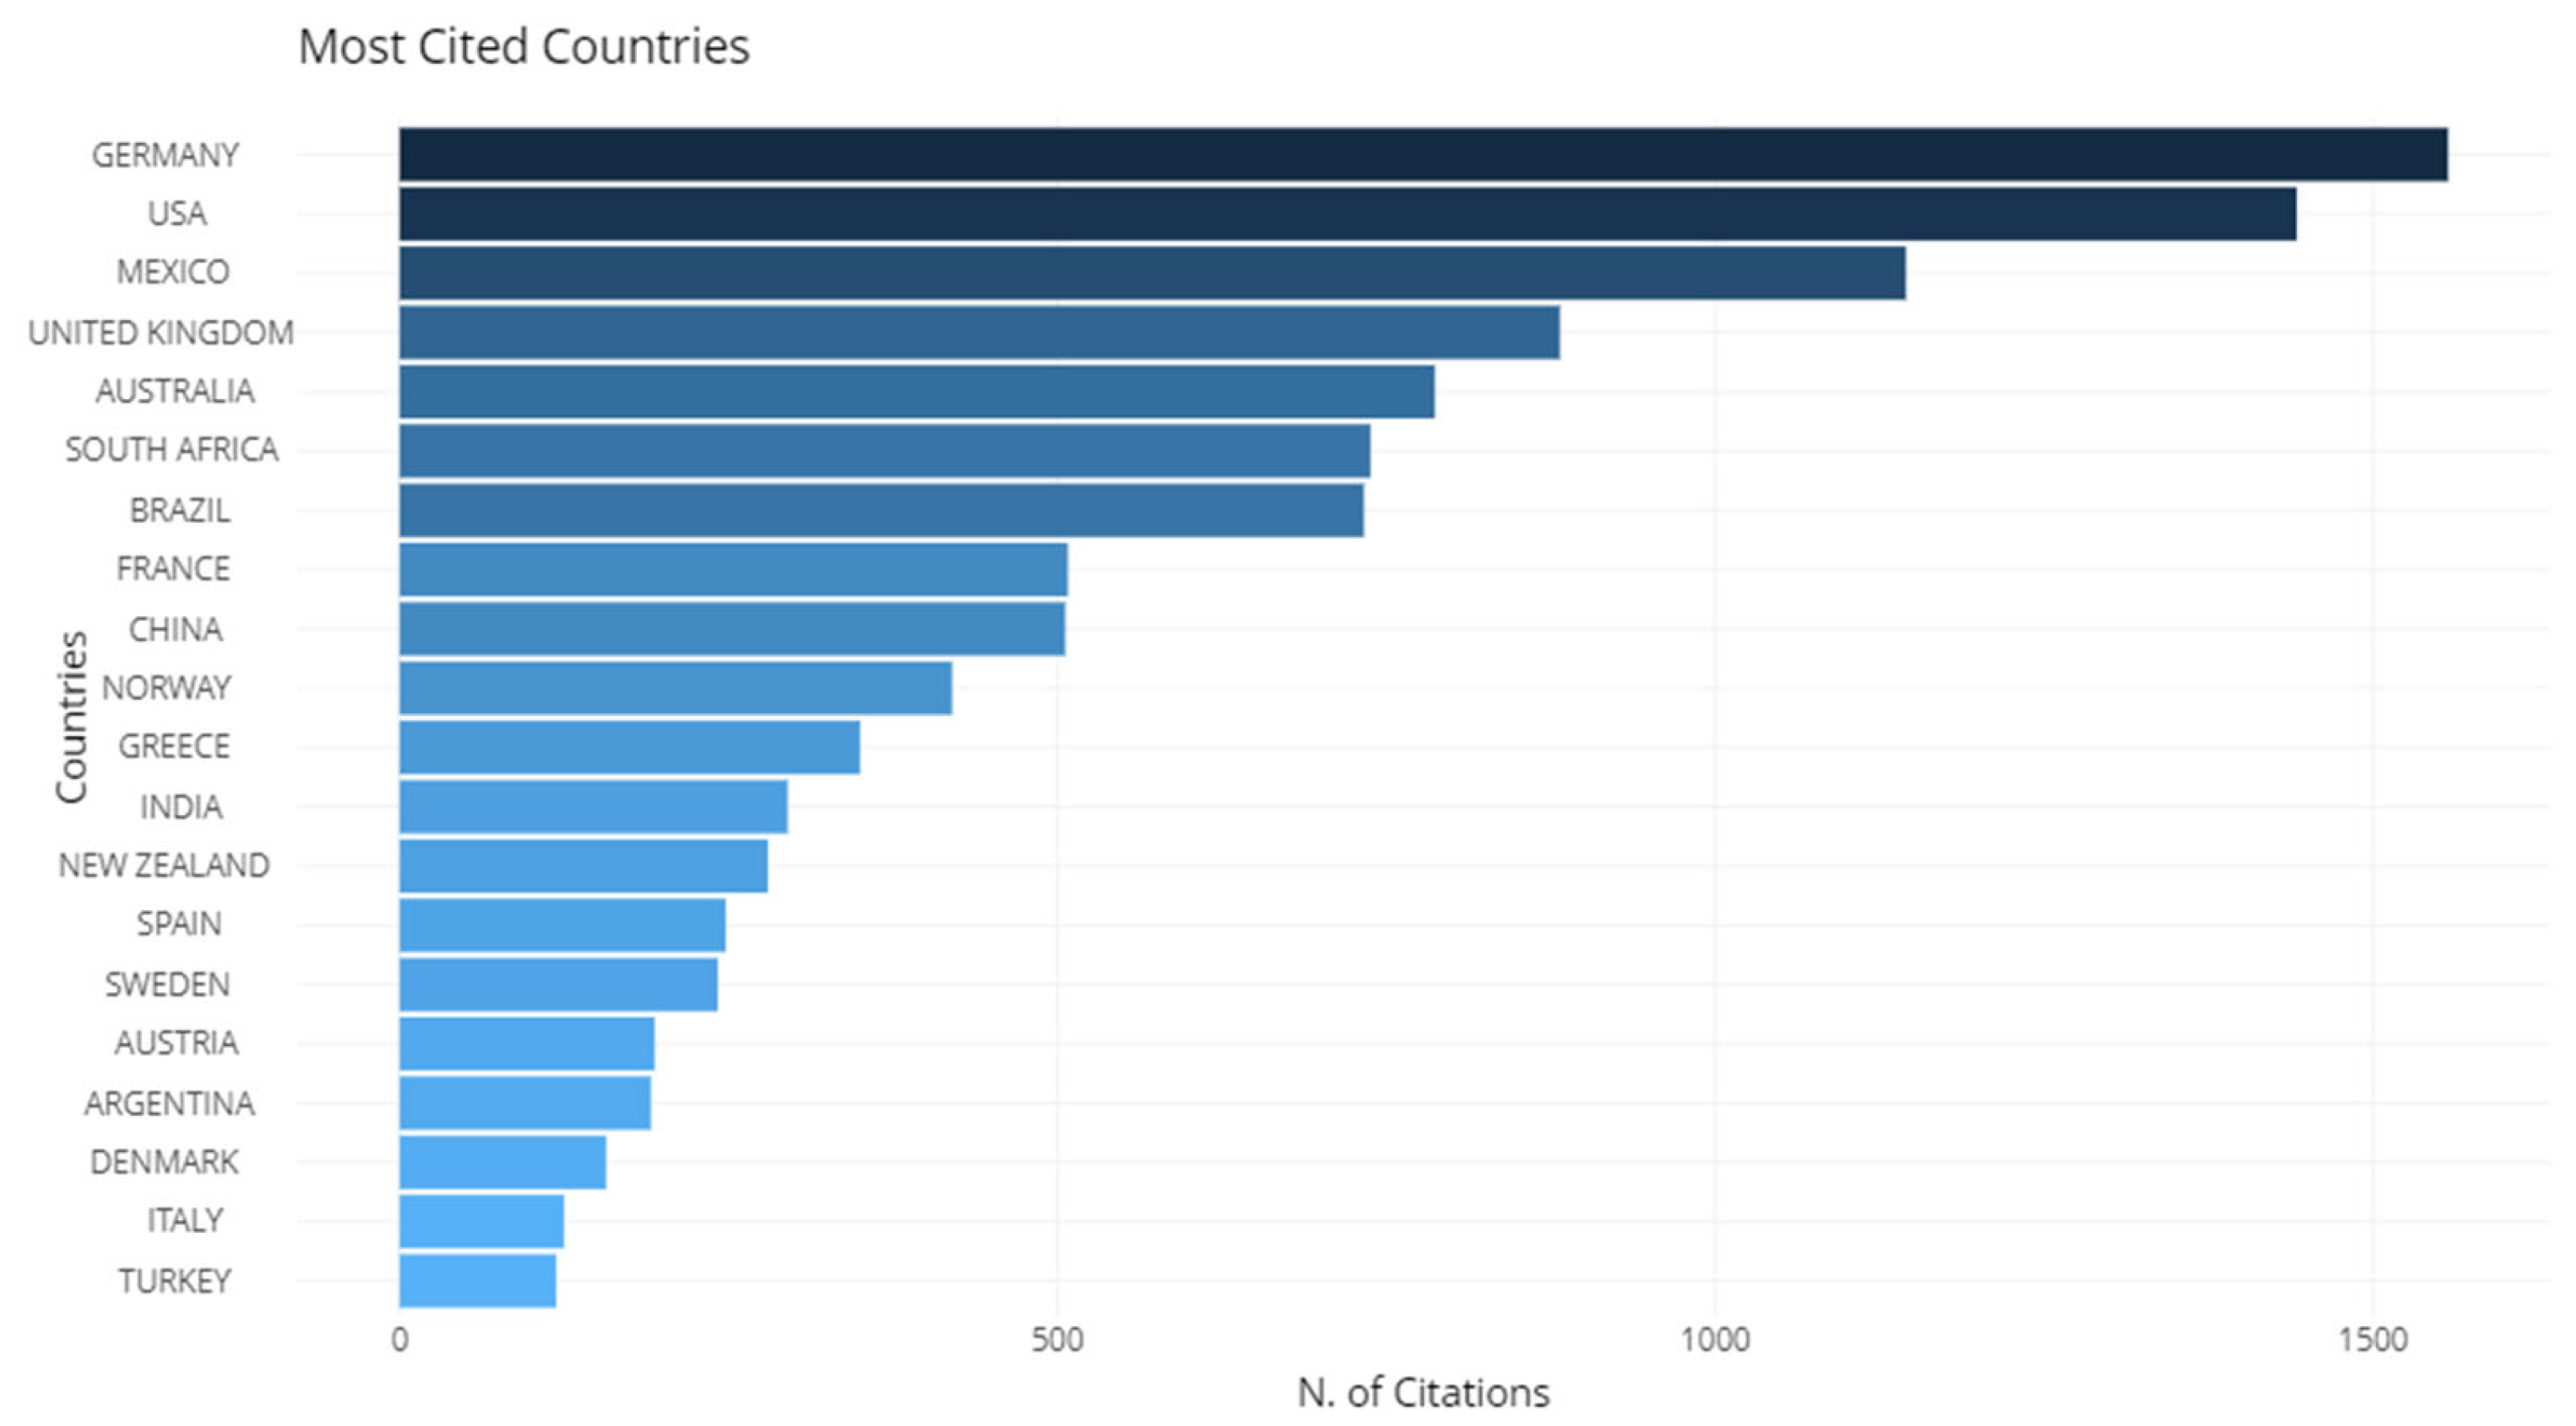
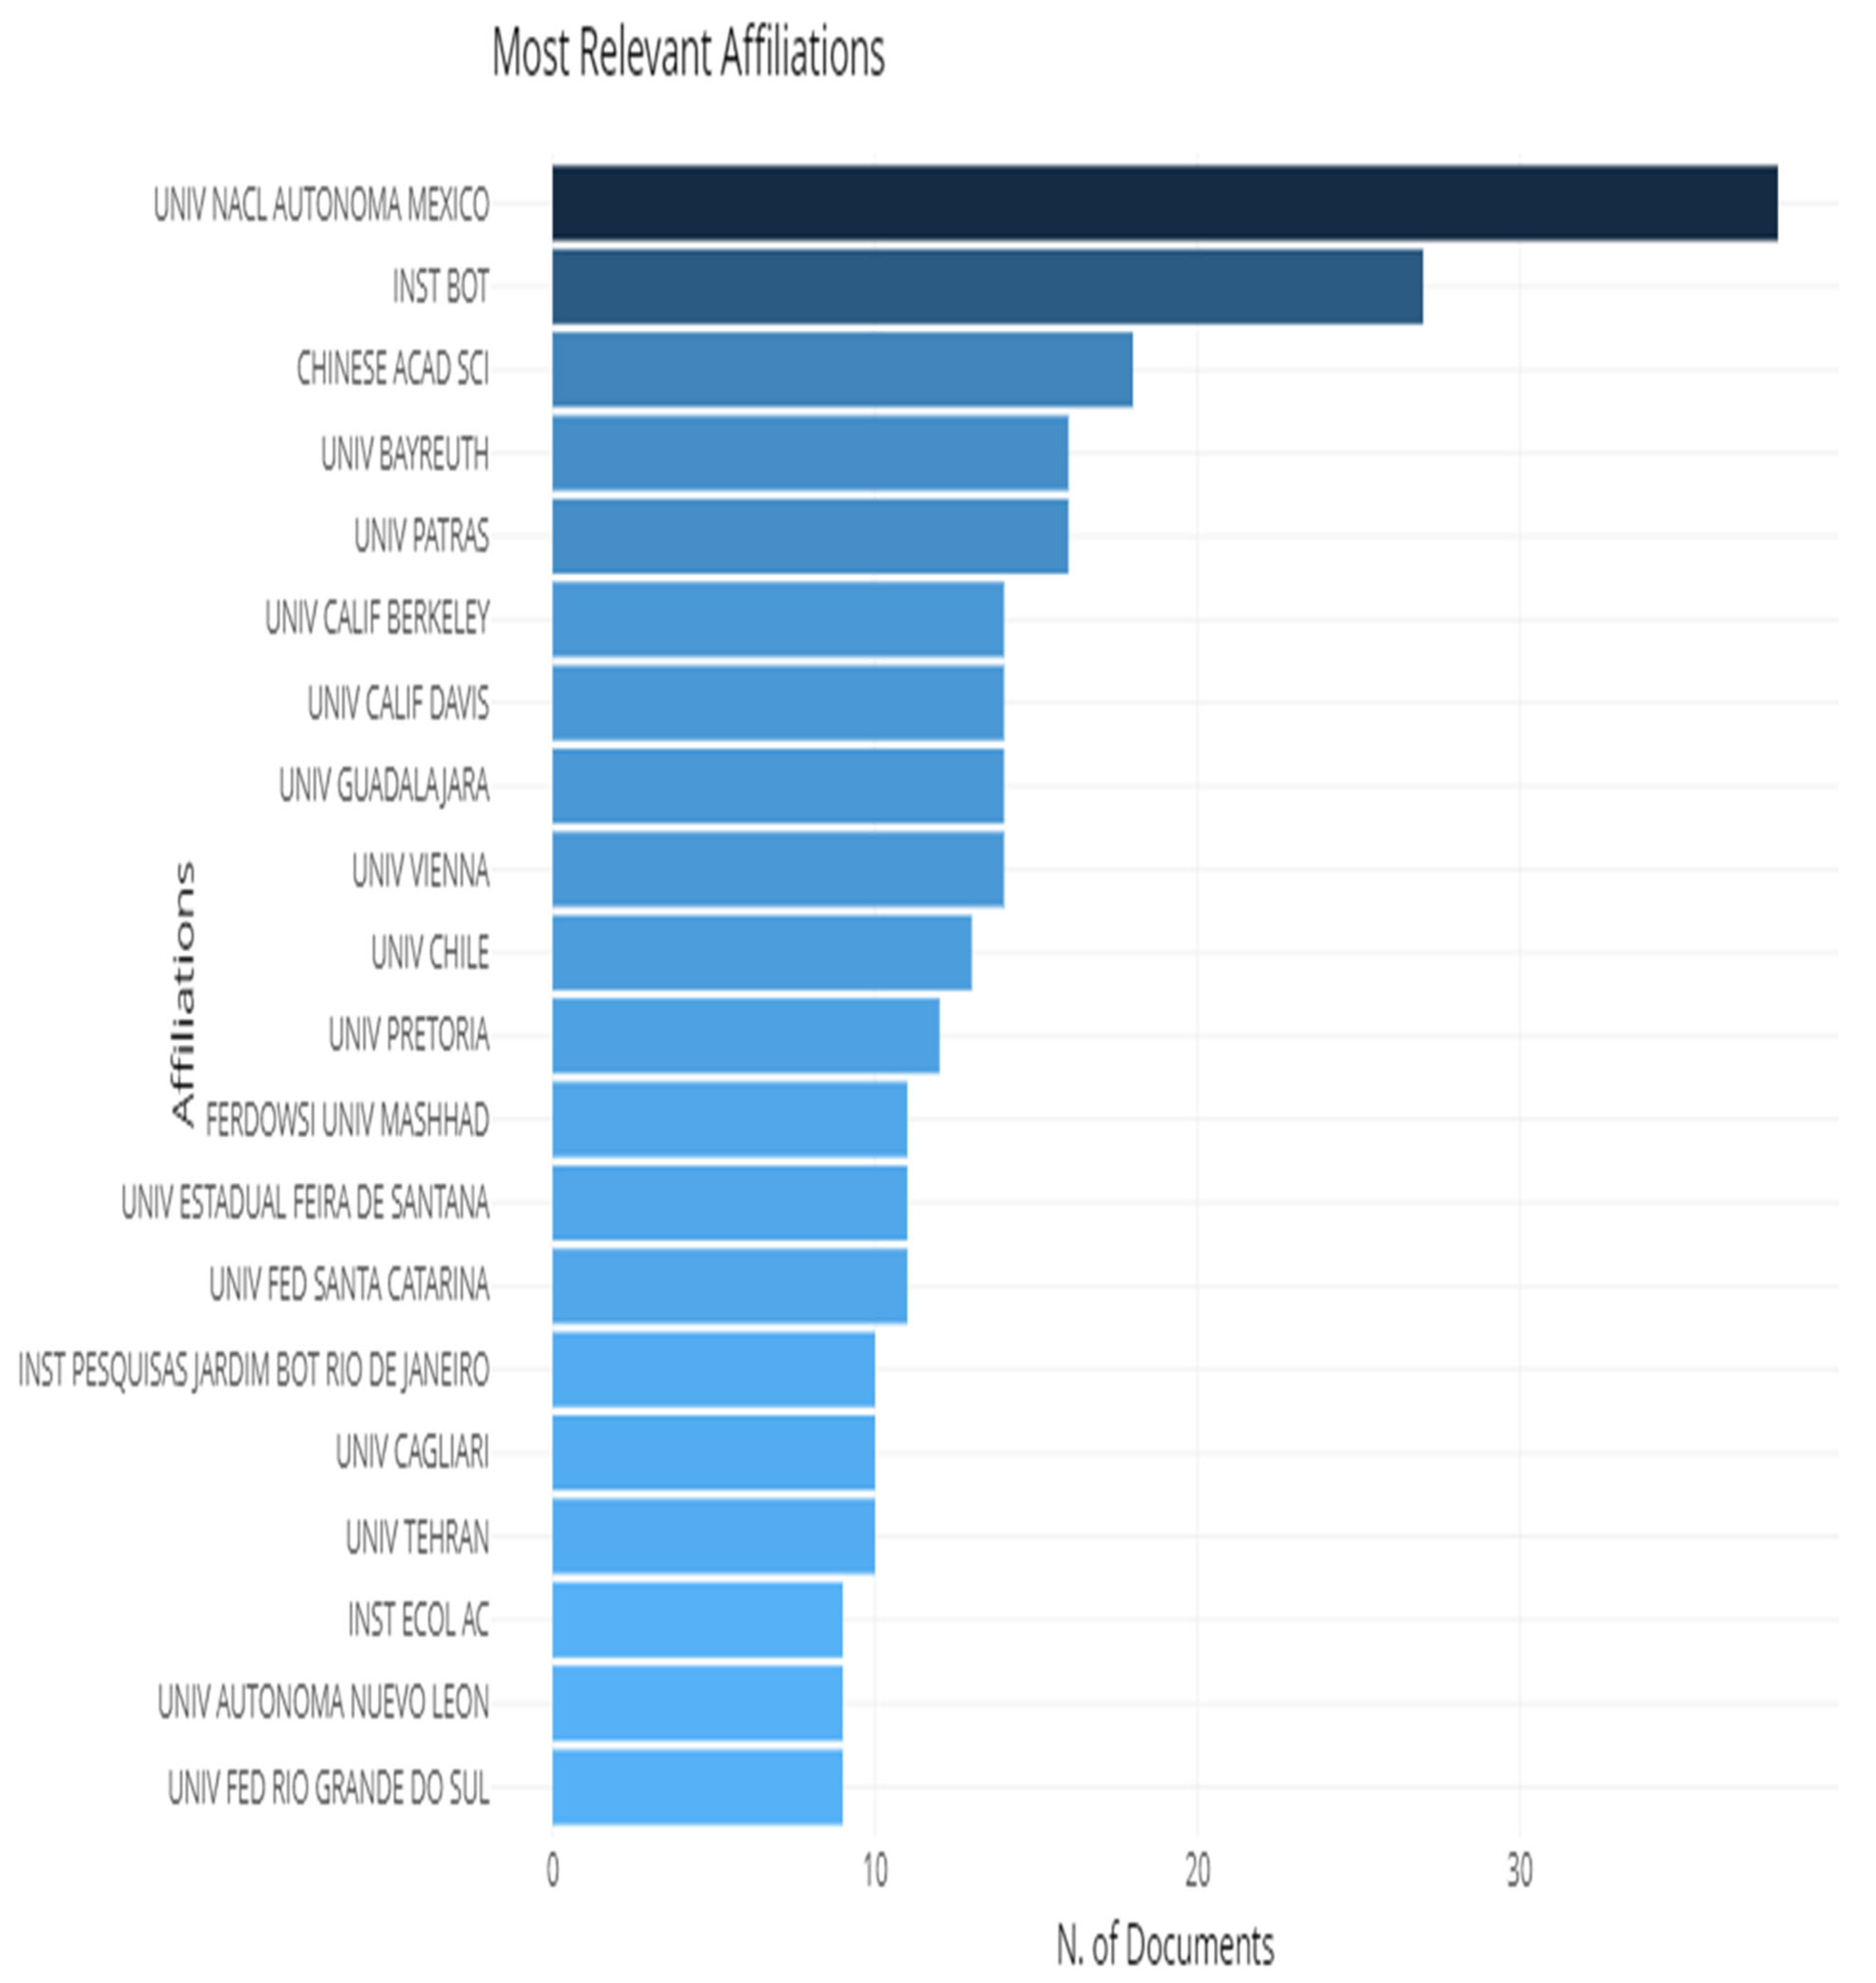
3.3. Most-Contributing Authors, Countries and Institutions

The most-contributing authors, countries, and institutions are often those who have published the highest number of papers in a particular field, or whose papers have been cited the most frequently. Identifying the most-contributing authors in a bibliometric study can provide valuable insights into the research landscape of a particular field. Moreover, the identification of the most-contributing authors can help to identify research networks and collaborations. For instance, co-authorship analysis can be used to identify authors who frequently collaborate with each other, and the nature and strength of these collaborations can be explored in more detail [42]. In the present study, it was revealed that a total of 1254 authors have contributed to the field through their research documents. Out of these, 33 authors have contributed in single-authored documents and 1221 in multi-authored documents. ‘Linder, HP’ has the highest number of publications (seven), followed by ‘Medail, F’, and ‘Noroozi, J’ and ‘Panitsa’ (six each) (Table 1).
Figure 6 shows the frequency distribution of scientific productivity map of Lotka’s Law. Lotka’s law is a well-known empirical pattern that describes the distribution of scientific productivity among researchers [43]. It states that a small proportion of authors (often referred to as “core authors”) are responsible for the majority of published articles, while the majority of authors only publish a few articles. The relationship between the number of authors and the number of articles that they publish follows a power-law distribution [44]. The horizontal axis in Figure 6 represents the number of articles and the vertical axis represents the percentage of authors. The dashed line in the figure represents Lotka’s law. The graph reveals that more than 85% of the authors wrote at least one article. About 10% of the authors wrote two articles. The number of articles and the number of authors on plant endemism and nativity are virtually identical to the dashed line in the figure, which follows Lotka’s general law. Additionally, the fact that only about 10% of authors contributed two articles also fits with the power-law distribution predicted by Lotka’s law.
Figure 7 shows the number of documents produced by different countries (in terms of authors), with Mexico being the highest producer of documents (41), followed by the USA (32), Brazil (29), South Africa (28), Germany (21), China (18), the UK (13), and Greece and India (12 each). This information can be useful for understanding the global distribution of research activity and the relative contributions of different countries to the scientific literature.
Figure 8 shows the number of citations received by articles on plant nativity and endemism from different countries. Germany ranks at the top with 1557 citations, followed by the USA, Mexico, the UK, Australia, and South Africa with 1442, 1145, 882, 787, and 738 citations, respectively. India ranks at number 11 with 295 citations of articles on plant nativity and endemism. This information can provide insight into the impact of research produced by different countries and the influence of their scientific outputs on the wider research community. It is worth noting that the data presented in Figure 7; Figure 8 may not be representative of the entirety of the scientific literature on the topic being studied, as it is possible that some articles or countries were not included in the analysis. Therefore, caution should be exercised when interpreting these results.
Figure 9 provides information on the top 20 relevant affiliations of corresponding authors, with the ‘National Autonomous University of Mexico’ being the most-contributing institute, producing the highest number of documents (38), followed by the ‘Institute of Botany’ (27), the ‘Chinese Academy of Science’ (18), and the ‘University of Bayreuth’ and the ‘University of Patras’ (16 each). This information can be useful for understanding the distribution of research activity on the topic of plant nativity and endemism across different institutions and the relative contributions of different institutes to the scientific literature. It can also provide insights into the research priorities and strengths of different institutions and the potential for collaboration and knowledge-sharing within and across different fields.

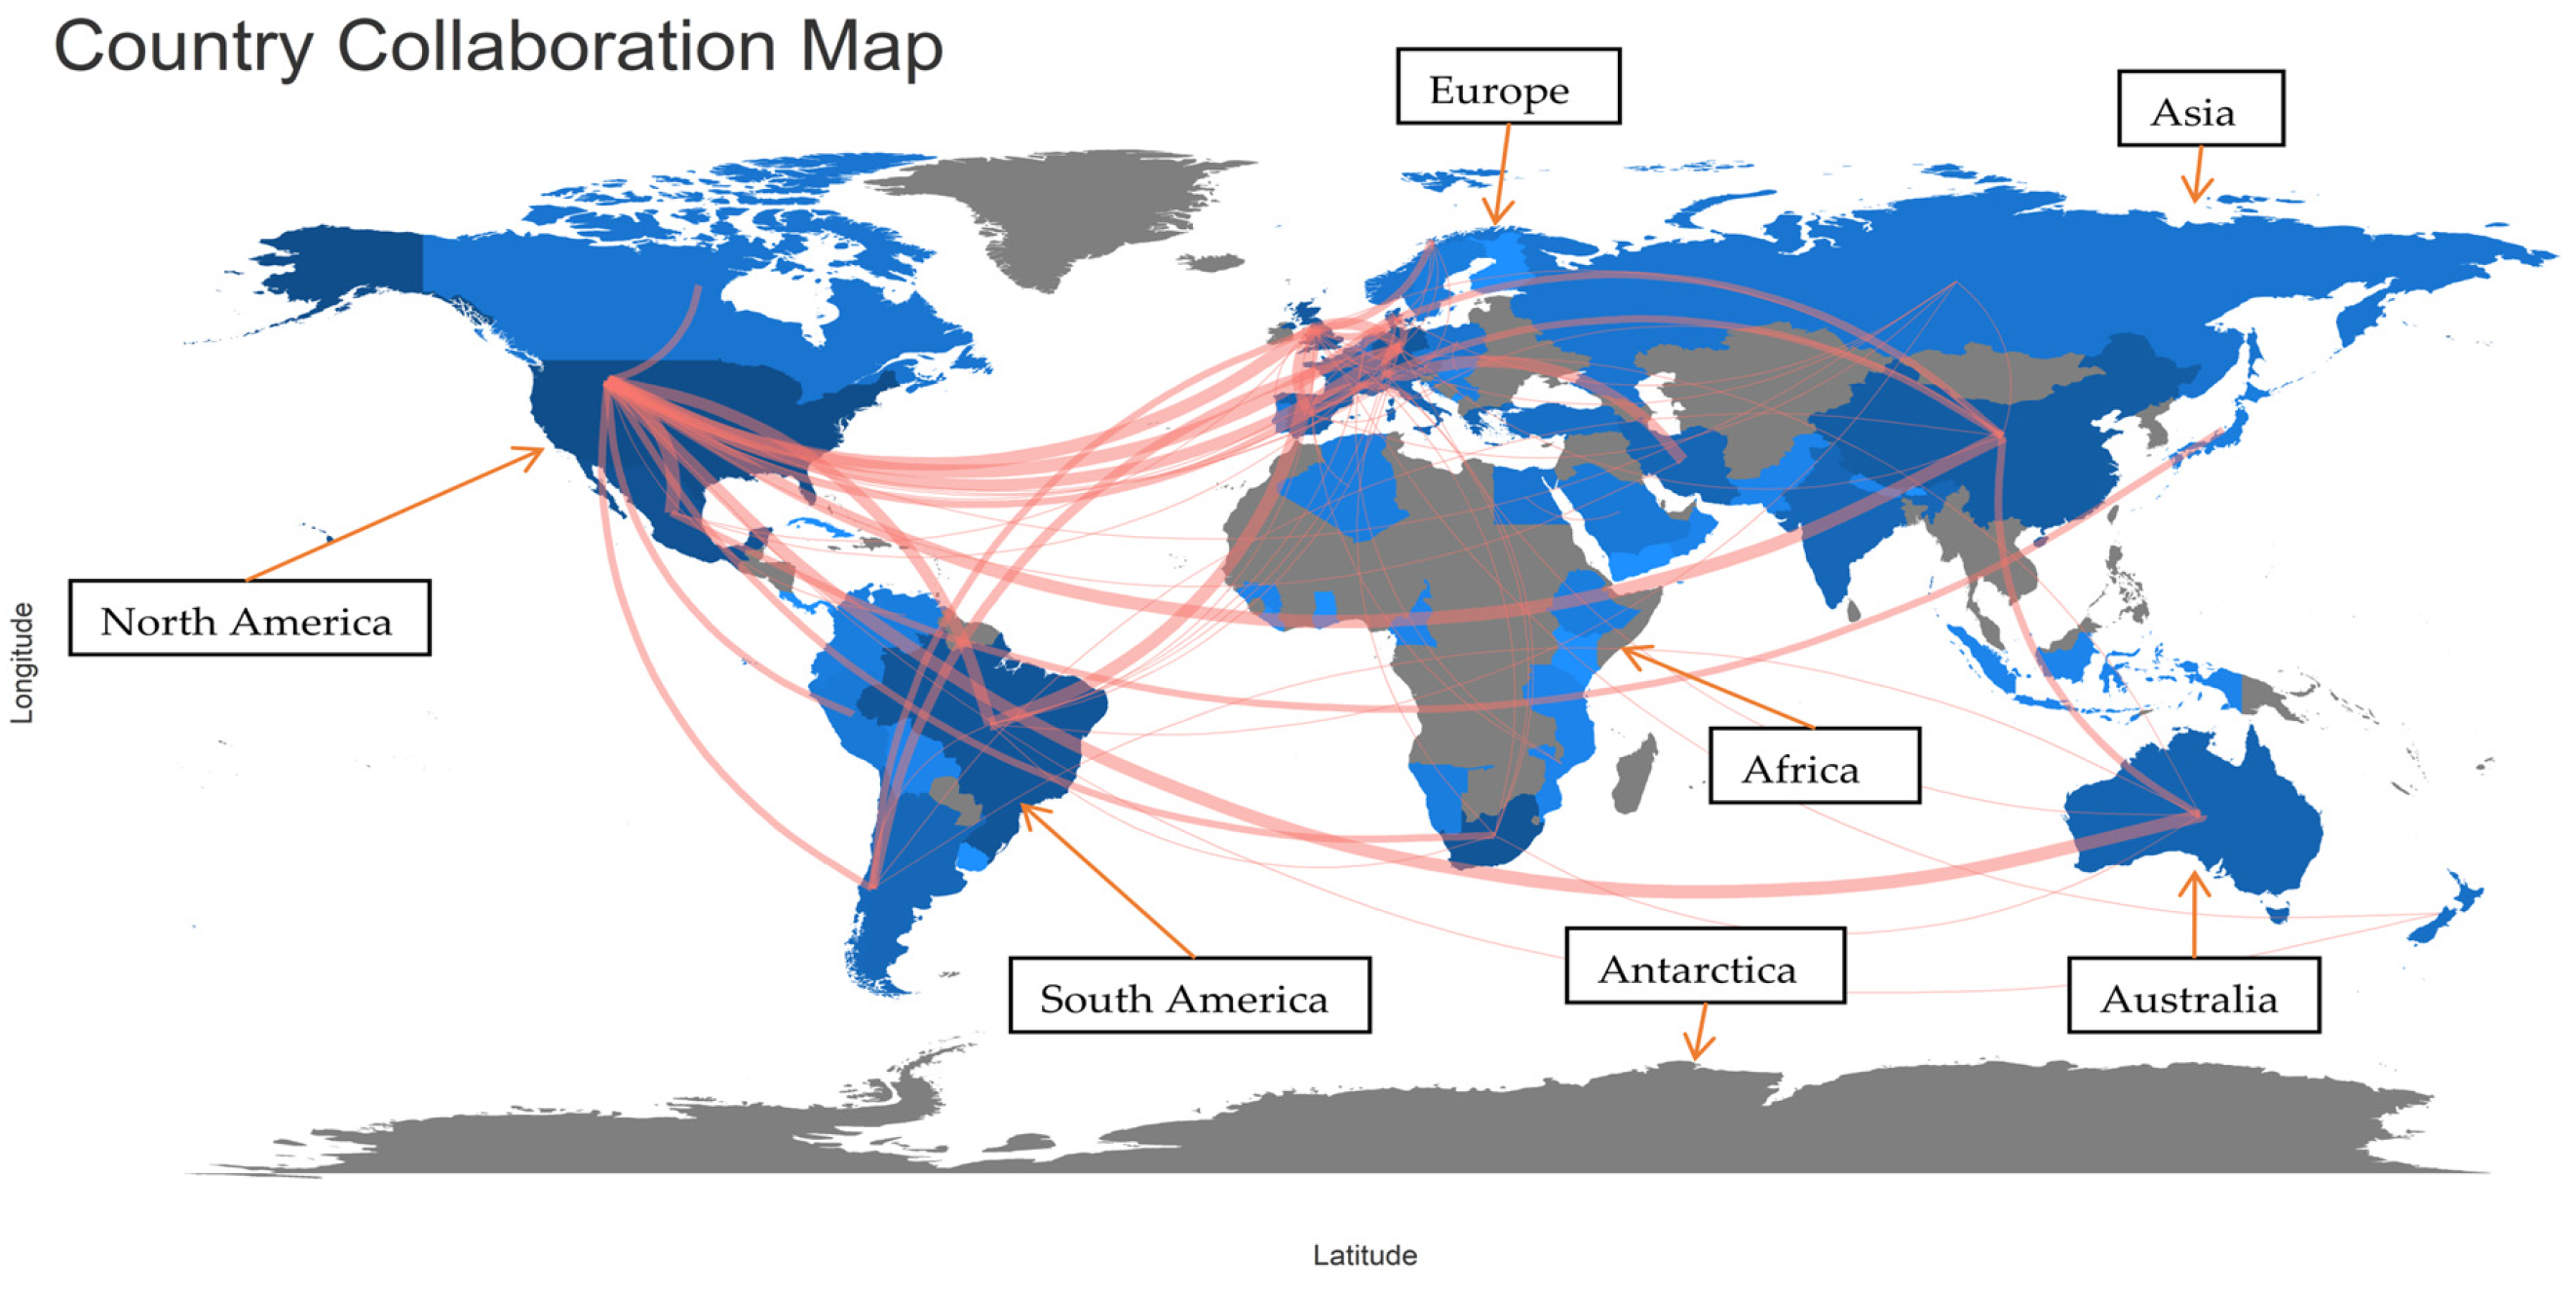
3.4. Collaboration Analysis

Of the total of 349 documents, 38 are single-authored documents, and the average number of documents per authors is 0.278. This indicates that a significant proportion of the publications are a result of collaboration between multiple authors. The average number of authors and co-authors per document is 3.59 and 4.35, respectively, with a collaboration index of 3.93, indicating that, on average, each document is a result of collaboration between almost four authors. This highlights the importance of collaboration in scientific research, especially in interdisciplinary fields such as plant nativity and endemism studies. Italy has the highest Multiple Country Publications (MCP) with an MCP rate of 66.6%, followed by France with an MCP rate of 63.6% and the USA with an MCP rate of 53.8%. India has an MCP rate of only 8.3% (Table 2). This shows that these countries have been successful in collaborating with researchers from different countries to produce publications in this field. On the other hand, India has a lower MCP rate, which could be due to various factors such as limited resources, a lack of international collaboration, or research priorities that are more focused on domestic issues.
Figure 10 provides a visual representation of the countries that have published articles on plant nativity and endemism studies and the level of collaboration between them. The blue color indicates the countries that have published articles, and its intensity is proportional to the number of publications. The pink color line represents the connection between the countries, and its thickness depicts the level of collaboration. These findings indicate that collaboration is an essential aspect of scientific research in plant nativity and endemism studies. The collaboration patterns and trends suggest that researchers from different countries are working together to produce high-quality research in this field, and countries that are more successful in collaborating with researchers from other countries have higher MCP rates, which can have important implications for future research collaborations and funding decisions.

3.5. Citation Analysis

Citation analysis is a valuable method for evaluating the impact of scholarly publications, and can provide important insights into the development and dissemination of knowledge within a particular field [19]. However, it is important to use citation analysis in conjunction with other evaluation methods and to be aware of the limitations of citation analysis, such as the potential for self-citation and citation biases, which can affect the accuracy of the results [45]. In the field of plant nativity and endemism, from 1992 to 2022, it was revealed that, on average, each document has received 33.67 citations, with 3.18 citations per year per document. The average citation rate of 33.67 per document suggests that the field of plant nativity and endemism has been a topic of significant interest among researchers. This implies that the findings and discoveries in this field have had a notable impact on other scientific research and have been widely referenced by other researchers. Moreover, the average citation rate of 3.18 per year per document indicates that the interest in this field has been sustained over time, with new researchers building on the existing body of knowledge. Overall, these findings suggest that the field of plant nativity and endemism is an important area of research that has generated a considerable amount of interest and has had a significant impact on the broader scientific community. The most globally cited document on plant nativity and endemism is ‘A global assessment of endemism and species richness across island and mainland regions’ by Kier et al. [46]. The study quantified the geographical patterns of the endemism richness of vascular plants across 90 terrestrial biogeographic regions and evaluated their congruence with terrestrial vertebrates. Some of the other most-cited documents include Crisp et al. [47]; Villasenor, [48]; Vetaas and Grytnes, [49]; Lopez-Pujol et al. [50]; Linder, [51]; Jansson, [52]; Thomas et al. [53]; McGlone et al. [54]; Medail and Verlaque, [55]; Dodson and Gentry, [56]; Murray-Smith et al. [57]; Davila et al. [58]; Da Silva et al. [59]; Morat et al. [60]; Joppa et al. [61]; Kessler, [62]; Hemp, [63]; Silvertown, [64]; and Tribsch, [65]. Among the authors, ‘Linder HP’ has been the most productive with seven publications, followed by ‘Medail F’, ‘Noroozi J’, and ‘Panitsa M’ (six publications each), and ‘Dimopoulos P’ (five publications). ‘Linder HP’ has received the maximum impact with 897 citations and an h-index of seven, followed by ‘Kessler M’ (328 citations and h-index of four), ‘Medail F’ (288 citations and h-index of four), ‘Noroozi J’ (194 citations and h-index of five), and ‘Panitsa M’ (168 citations and h-index of six) (Table 1). ‘Samant SS’ from India, with 171 citations and an h-index of three, ranks at number 17. Among the sources, the journal ‘Biodiversity and Conservation’ has been the most productive with 35 publications, followed by ‘Journal of Biogeography’ (21 publications), ‘Phytotaxa’ (14 publications), ‘Botanical Sciences’ (12 publications), and ‘Biological Conservation’ (10 publications). ‘Journal of Biogeography’ has had the highestimpact with 2132 citations and an h-index of 19, followed by ‘Biodiversity and Conservation’ (1184 citations and h-index of 20), ‘Conservation Biology’ (466 citations and h-index of 5), ‘Annals of the Missouri Botanical Garden’ (426 citations and h-index of 6), and ‘Biological Conservation’ (415 citations and h-index of 8) (Table 3).

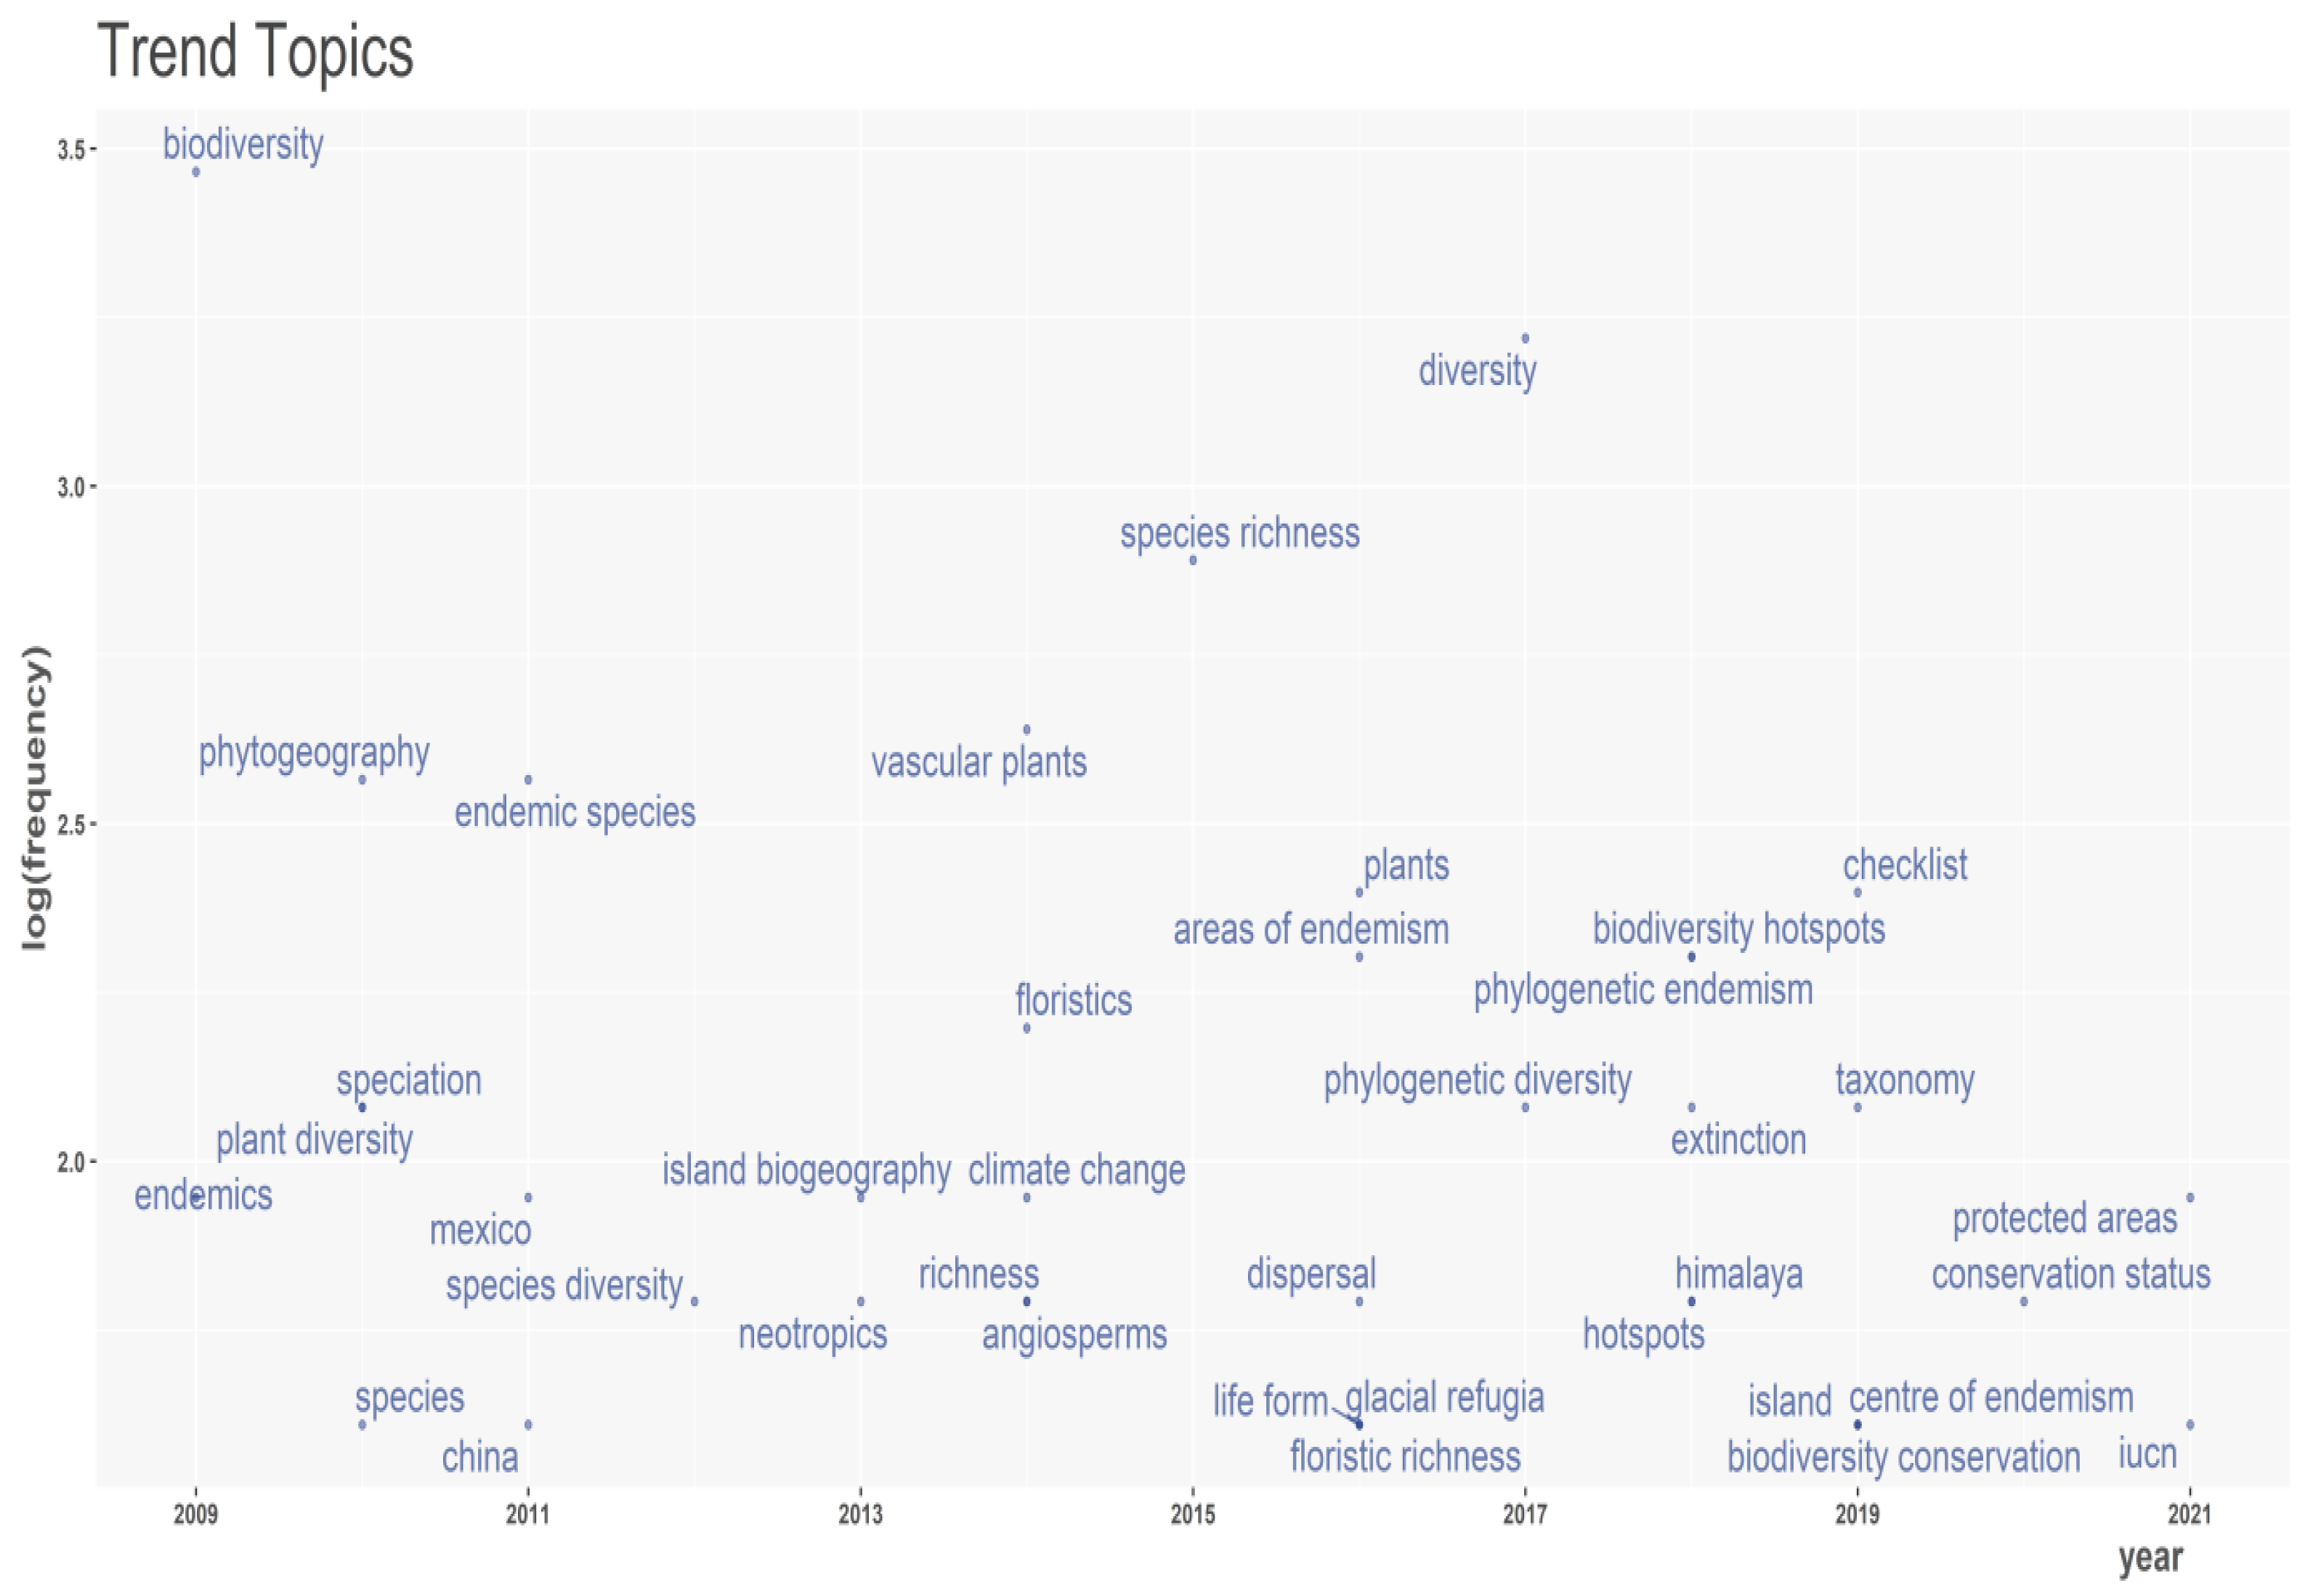
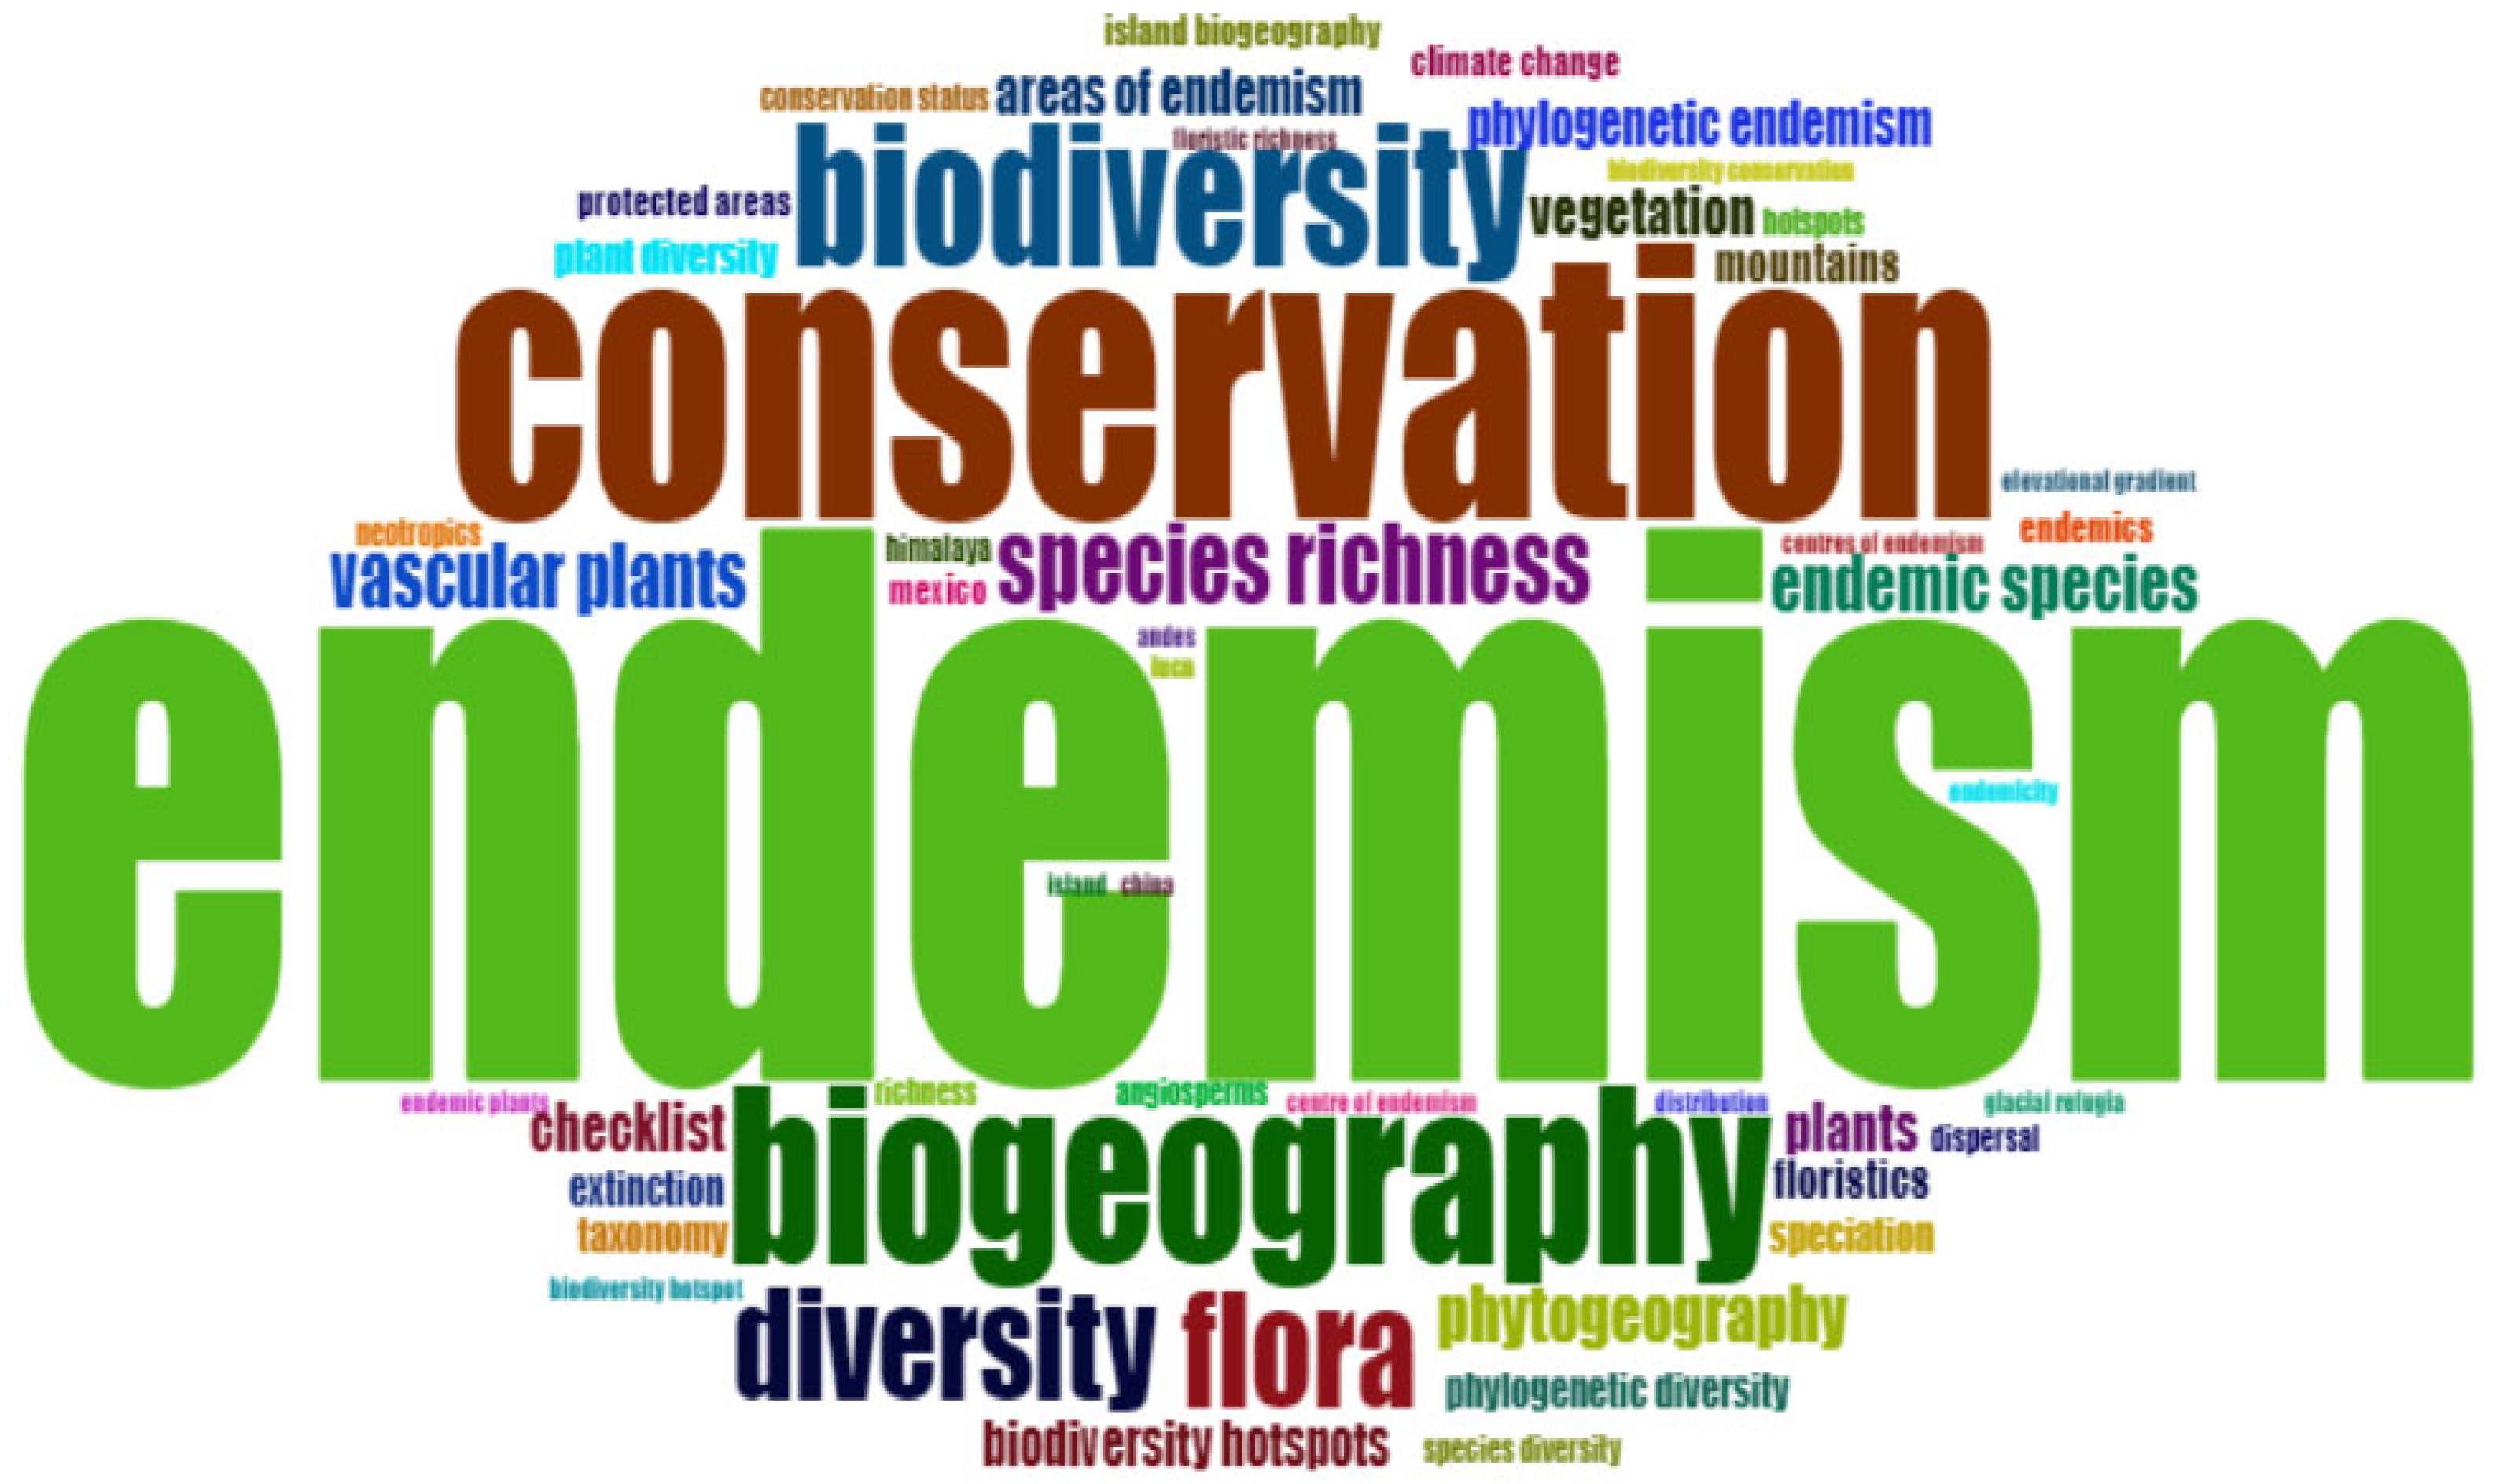
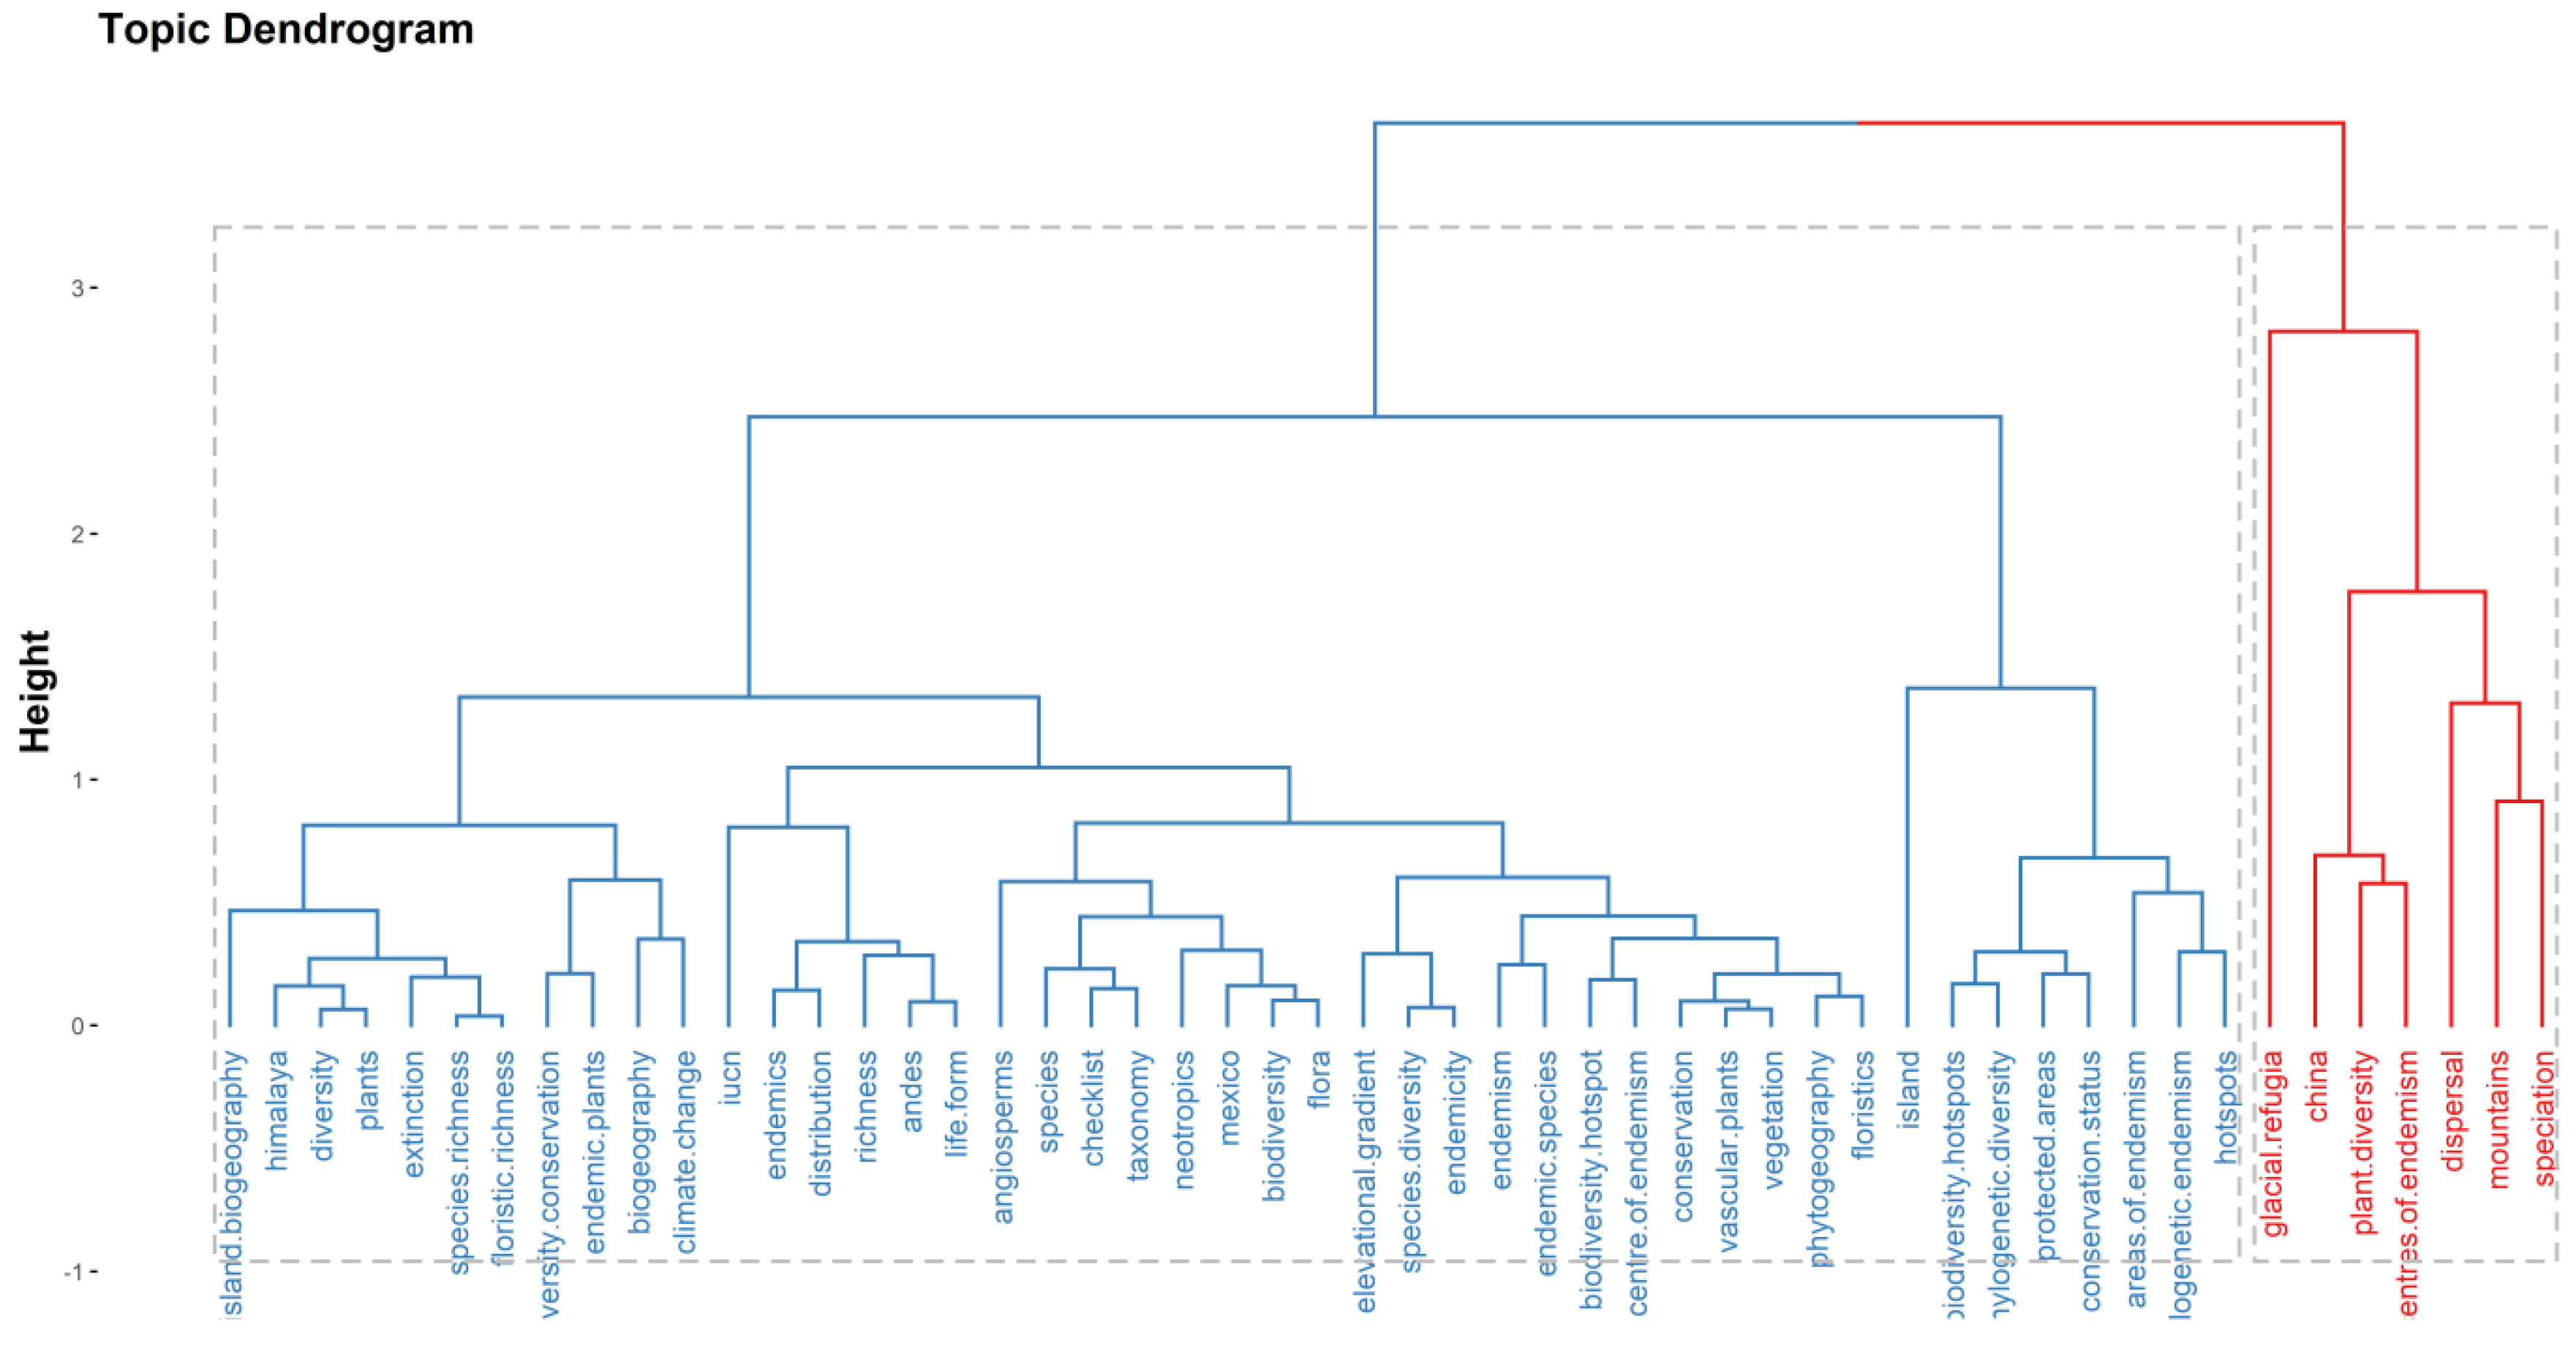
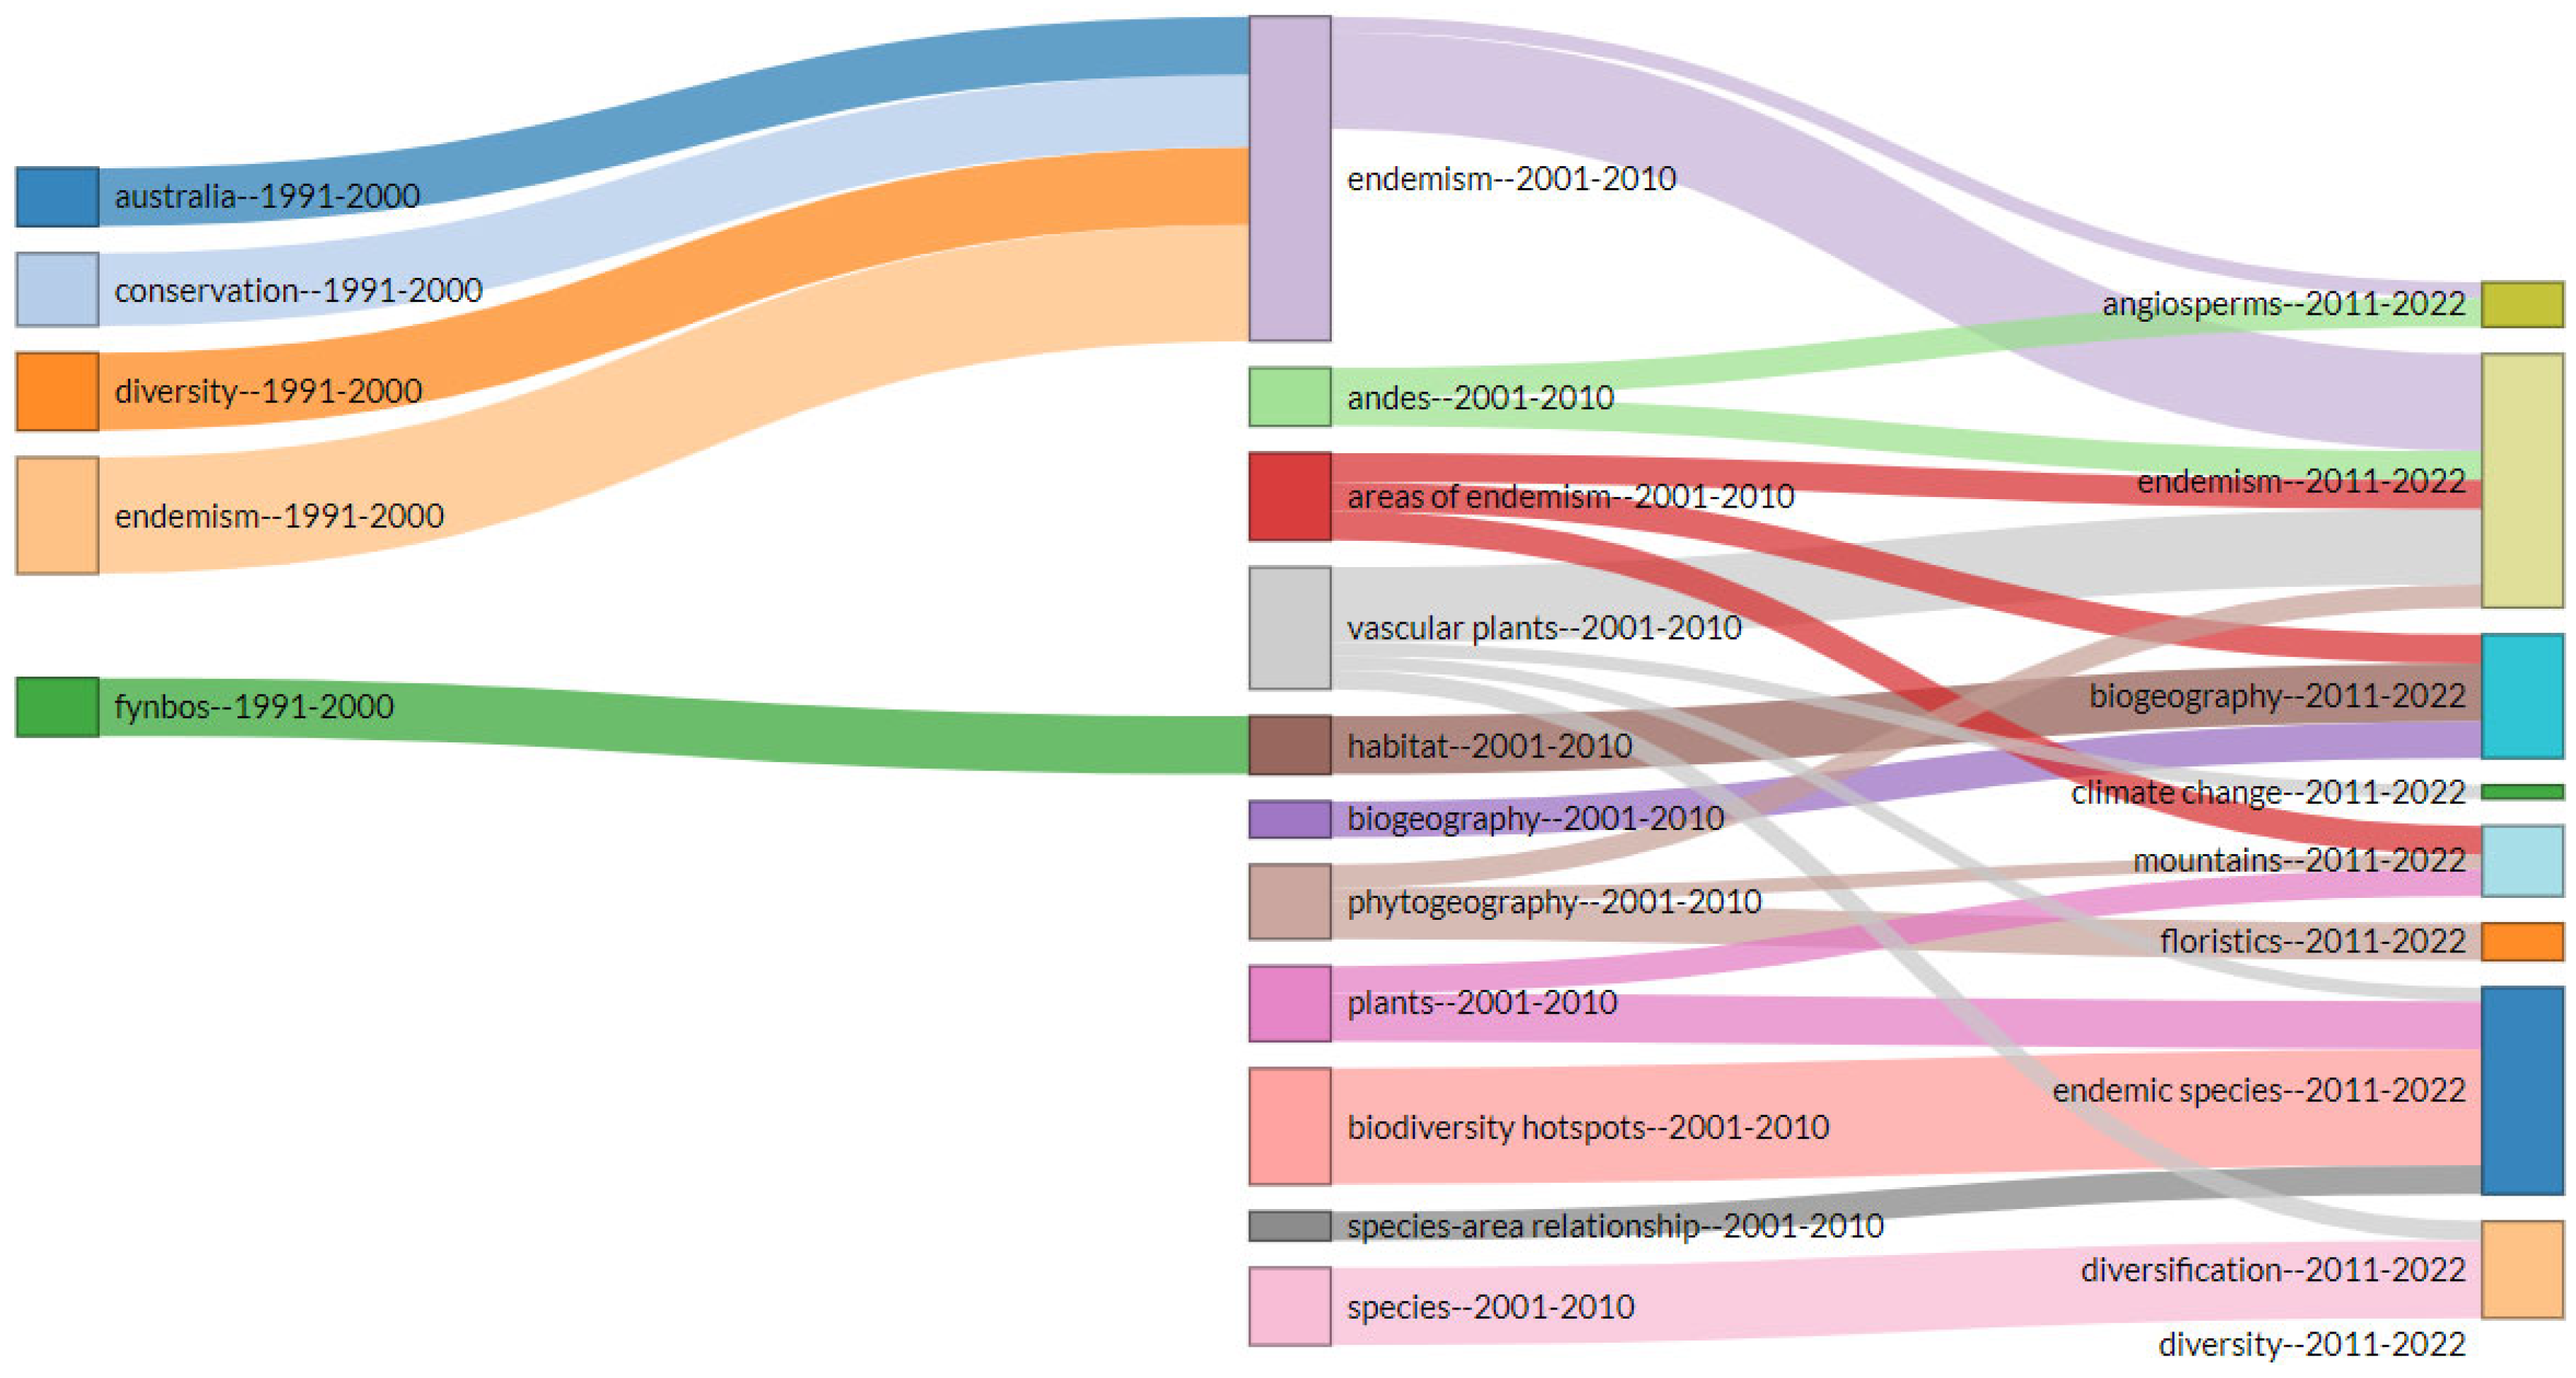
3.6. Keywords Analysis

Keyword analysis can provide valuable insights into the research trends and priorities in a particular field, as well as the evolution of research topics over time [66]. In the present study, for each article dealing with plant nativity and endemism, the original author keywords, i.e., those used by the authors in their articles, were examined. A total of 1086 keywords have been used by the analyzed authors to classify their studies from 1991 to 2022. Figure 11 depicts a scatter plot of the most-trending topics in studies on plant nativity and endemism from 1991 to 2022. The height of the keywords shows their frequency of occurrence in a particular year. The most-frequently occurring keywords typically express the most-trending topics of the year. Overall, the most-frequently used keywords include biodiversity (32 in year 2009), diversity (25 in year 2017), species richness (18 in year 2015), vascular plants (14 in year 2014), and endemic species (13 in years 2011). The most-frequent author keywords are shown in (Figure 12), in which the size of the keyword determines its frequency. The larger the size, the higher the frequency of the keyword.
The dendrogram shown in Figure 13 is a graphical representation of the correlation thresholds among keywords in a hierarchical structure. The dendrogram displays the most commonly used topics and their relationship with other topics. In this dendrogram, the height of each branch indicates the degree of dissimilarity between topics. Topics that are more dissimilar are placed at a greater height, while topics that are more similar are placed at a lower height. The connecting lines between the topics show the level of similarity between them. A lower location of the connecting line indicates that the topics are more similar to each other. The height and location of the connecting lines, together, give us a sense of the relationships between different topics. The two topics at the bottom of the dendrogram, ‘species richness’ and ‘floristic richness’, are very similar to each other and are therefore connected by a short connecting line at a relatively low height. Similarly, the topics ‘checklist’ and ‘taxonomy’, and ‘endemics’ and ‘distribution’, are also very similar and are connected by a short connecting line at a relatively low height.
On the other hand, topics that are more dissimilar are placed at a greater height. The topic ‘IUCN’ is placed at a higher height than the topic ‘life form’, indicating that these two topics are less similar to each other. This can be explained by the fact that the IUCN (International Union for Conservation of Nature) is an organization that focuses on conservation and the sustainable use of natural resources. In contrast, the topic of ‘life form’ refers to the various forms of life that exist on Earth, including plants, animals, and microorganisms. While both ‘IUCN’ and ‘life form’ are related to biodiversity and conservation, they represent distinct aspects of the subject. IUCN is an organization that provides guidance on conservation measures and maintains a Red List of Threatened Species to assess the conservation status of species, while ‘life form’ refers to the characteristics of individual species such as their morphology, physiology, and behavior. Thus, the two topics are less similar and are placed at a greater height in the dendrogram.
The pattern of the evolution of research themes across the three previously divided time periods is shown in Figure 14, giving us a broad overview of the changes in research themes. In the initial period, which spanned from 1991 to 2000, there were fewer study topics compared to subsequent years. Most of the research themes during this period were categorized under the umbrella of endemism, which suggests that researchers were primarily interested in understanding the distribution of species that were unique to a particular geographic area. In the developing period, from 2001 to 2010, new themes emerged such as ‘biodiversity hotspots’, ‘vascular plants’, ‘phytogeography’, and ‘species’. This suggests that researchers began to expand their focus beyond endemism and explore other areas of biodiversity research. For example, the emergence of the ‘biodiversity hotspots’ theme reflects a growing interest in identifying regions of the world that are particularly important for conservation efforts.
In the advanced period, from 2011 to 2022, additional themes such as ‘endemic species’, ‘biogeography’, and ‘diversification’ emerged. These themes suggest that researchers were interested in understanding the evolutionary and historical processes that led to the current patterns of biodiversity, such as the distribution of endemic species and the factors that drive diversification.

4. Conservation and Management Implications of Endemic Species

Plant endemism plays a fundamental role in determining biodiversity hotspots, as endemic species with restricted distributions are particularly vulnerable to threats and extinction risks [67,68]. High endemism within a region indicates the presence of significant eco-regions and ecosystems that require protection [3]. The topography, climate, and altitude of mountainous areas act as barriers that promote speciation and make them potential hotspots for endemic elements [4,5]. Endemic plant species face greater susceptibility to human-induced threats and natural fluctuations, making them more prone to extinction. Safeguarding these species is a significant global priority. In terms of conservation, preserving ecosystems and biodiversity in their natural environments through in situ methods is the most suitable approach. This approach ensures the protection of the original hubs of genetic diversity and geographical distribution [69].Increasing the coverage of protected areas (PAs) is crucial for biodiversity conservation, as recognized by the Convention on Biological Diversity [70]. However, endemic species, often limited to high elevations and with limited dispersal abilities, face the risk of losing suitable habitats due to climate change [71]. The combination of high endemicity and climate change necessitates the adoption of “climate-smart” conservation strategies [72,73].
To enhance the effectiveness of protected area (PA) networks, it is important to consider elevational gradients within PAs and identify and protect potential microrefugia [74]. This will help to bridge existing conservation gaps and increase the adaptability of PAs to changing environmental conditions. Prioritizing high-priority conservation areas based on endemism is critical, as these areas harbor unique species compositions requiring protection from threats [74].
In addition to in situ conservation efforts, ex situ conservation plays a vital role in integrated conservation strategies, offering backup solutions and restoration possibilities for plant species with restricted ranges and small populations [75,76]. Botanical gardens provide a cost-effective means of ex situ conservation, storing threatened and extinct-in-the-wild plant species in living collections, seed banks, and tissue culture facilities [76]. Botanical gardens, with their specialized facilities and expertise, are uniquely positioned to contribute to the conservation of threatened plants, including endemic species, and prevent their extinctions [75,77,78,79]. Through ex situ conservation, botanical gardens can preserve the genetic diversity of endemic plants and serve as potential sources for reintroduction programs and habitat restoration [78,79].
Therefore, recognizing the importance of plant endemism and implementing conservation measures is crucial for preserving biodiversity hotspots. The combination of in situ and ex situ conservation efforts is essential for protecting threatened plants, including endemic species, and preventing their extinctions. By integrating these approaches, we can contribute to the long-term conservation and management of endemic plant species.

5. Conclusions

The bibliometric analysis conducted during the present study on the topic of plant nativity and endemism highlights the increasing significance of this research area within the field of biodiversity conservation and management. This study reveals a remarkable growth in the number of publications on this subject during the past three decades (1991–2022), with the journal ‘Biodiversity and Conservation’ being the most prominent source of research. However, the recent rise of ‘Phytotaxa’ indicates a shift towards this journal as a preferred outlet for publications related to plant nativity and endemism. Our analysis also identifies the most productive authors, with ‘Linder HP’ standing out as the most-cited and productive author in this field. Additionally, Mexico is identified as the most productive country in terms of the number of publications, while Germany has the highest number of citations and Italy has the most publications involving multiple countries. This study underscores the importance of institutions in promoting research on plant nativity and endemism, with the National Autonomous University of Mexico being the most significant contributor of documents in this field. The findings of this bibliometric analysis provide important insights into the research landscape on plant nativity and endemism. The identification of the most productive authors, countries, and institutions can guide researchers in identifying potential collaborators or sources for further research. Additionally, the analysis of publication trends and sources can help researchers stay up to date with the latest developments in the field. The step-by-step methodology presented in this study can serve as a useful guide for researchers interested in conducting their own bibliometric analyses in other fields. However, in the present study, WoS was used as an exclusive source of data; thus it does not represent the intact trend of research on plant endemism. Thus, the use of alternative data sources like Scopus and Google Scholar in future studies for a more thorough analysis of the available literature is highly recommended.
In addition to the findings of this bibliometric analysis, further research is needed to gain a more comprehensive understanding of plant endemism and its underlying processes. To achieve this, autecological studies are required that combine field, greenhouse, and laboratory work. Furthermore, synecological studies are essential, as endemic plants exist within communities and must be studied in relation to their environments, including the climate, soil parent materials, relief, successional stages, fire intensity, and associated flora and fauna. Moreover, it is essential to gather data on endemism by floristic provinces rather than political subdivisions to obtain a more accurate picture of plant endemism patterns. Alongside this, models that predict levels of endemism based on easily measurable environmental variables such as rainfall, temperature, and productivity would be useful in identifying endemic-rich areas [67]. These efforts will lead to a more thorough understanding of plant endemism and will help researchers and conservationists to identify the areas and species that require protection and management. The findings of the present study suggest that plant nativity and endemism is a highly active research field with a wide global reach, and that future research in this area should continue to focus on understanding the ecological and evolutionary processes driving plant nativity and endemism and developing effective strategies for conserving endemic plant species and their habitats.

Author Contributions

Conceptualization, Z.A.W.; methodology, Z.A.W.; software, Z.A.W.; validation, Z.A.W., Q.R. and S.P.; formal analysis, Z.A.W.; investigation, Z.A.W. and Q.R.; resources, S.P.; data curation, Z.A.W. and Q.R.; writing—original draft preparation, Z.A.W. and Q.R.; writing—review and editing, Z.A.W., F.A., Q.R., Y.S.R., Z.A. and S.P.; visualization, Z.A.W.; supervision, S.P.; project administration, S.P.; funding acquisition, Z.A.W. All authors have read and agreed to the published version of the manuscript.

Funding

This research received no external funding.

Institutional Review Board Statement

Not applicable.

Data Availability Statement

Not applicable.

Conflicts of Interest

The authors declare no conflict of interest.

References

  1. Major, J. Endemism: A botanical perspective. In Analytical Biogeography: An Integrated Approach to the Study of Animal and Plant Distributions; Springer: Berlin/Heidelberg, Germany, 1988; pp. 117–146. [Google Scholar]
  2. Myers, N.; Mittermeier, R.A.; Mittermeier, C.G.; DaFonseca, G.A.; Kent, J. Biodiversity hotspots for conservation priorities. Nature 2000, 403, 853–858. [Google Scholar] [CrossRef] [PubMed]
  3. Dhar, U. Conservation implications of plant endemism in high-altitude Himalaya. Curr. Sci. 2002, 82, 141–148. [Google Scholar]
  4. Joshi, H.C. Assessment of Habitat Diversity, Forest Vegetation and Human Dependence in the Buffer Zone of Nanda Devi Biosphere Reserve of West Himalaya. Ph.D. Thesis, Kumaon University, Nainital, India, 2002. [Google Scholar]
  5. Trigas, P.; Panitsa, M.; Tsiftsis, S. Elevational gradient of vascular plant species richness and endemism in Crete—The effect of post-isolation mountain uplift on a continental island system. PLoS ONE 2013, 8, e59425. [Google Scholar] [CrossRef] [PubMed]
  6. Yang, M.; Lu, Z.; Fan, Z.; Liu, X.; Hens, L.; DeWulf, R.; Ou, X. Distribution of non-native plant species along elevation gradients in a protected area in the eastern Himalayas, China. Alp. Bot. 2018, 128, 169–178. [Google Scholar] [CrossRef]
  7. Seipel, T.; Kueffer, C.; Rew, L.J.; Daehler, C.C.; Pauchard, A.; Naylor, B.J.; Alexander, J.M.; Edwards, P.J.; Parks, C.G.; Arevalo, J.R.; et al. Processes at multiple scales affect richness and similarity of non-native plant species in mountains around the world. Glob. Ecol. Biogeogr. 2012, 21, 236–246. [Google Scholar] [CrossRef]
  8. Kalwij, J.M.; Robertson, M.P.; van Rensburg, B.J. Annual monitoring reveals rapid upward movement of exotic plants in a montane ecosystem. Biol. Invasions 2015, 17, 3517–3529. [Google Scholar] [CrossRef]
  9. Huston, M.A. Biological Diversity: The Coexistence of Species on Changing Landscapes; Cambridge University Press: Cambridge, UK, 1994. [Google Scholar]
  10. Segui, J.; Lopez-Darias, M.; Pérez, A.J.; Nogales, M.; Traveset, A. Species–environment interactions changed by introduced herbivores in an oceanic high-mountain ecosystem. AoB Plants 2017, 9, plw091. [Google Scholar] [CrossRef] [PubMed]
  11. Fletcher, R.J., Jr.; Didham, R.K.; Banks-Leite, C.; Barlow, J.; Ewers, R.M.; Rosindell, J.; Holt, R.D.; Gonzalez, A.; Pardini, R.; Damschen, E.I.; et al. Is habitat fragmentation good for biodiversity? Biol. Conserv. 2018, 226, 9–15. [Google Scholar] [CrossRef]
  12. Fahrig, L.; Arroyo-Rodríguez, V.; Bennett, J.R.; Boucher-Lalonde, V.; Cazetta, E.; Currie, D.J.; Eigenbrod, F.; Ford, A.T.; Harrison, S.P.; Jaeger, J.A.G.; et al. Is habitat fragmentation bad for biodiversity? Biol. Conserv. 2019, 230, 179–186. [Google Scholar] [CrossRef]
  13. Shahriary, E.; Gill, T.E.; Langford, R.P. Bibliometric analysis of piosphere research: Implications for conservation and scientific collaboration. Int. J. Sustain. Dev. World Ecol. 2021, 28, 316–325. [Google Scholar] [CrossRef]
  14. Ball, R. An Introduction to Bibliometrics: New Development and Trends; Chandos Publishing: Cambridge, UK, 2017. [Google Scholar]
  15. Carrion-Mero, P.; Montalván-Burbano, N.; Paz-Salas, N.; Morante-Carballo, F. Volcanic geomorphology: A review of worldwide research. Geoscience 2020, 10, 347. [Google Scholar] [CrossRef]
  16. Bezak, N.; Mikoš, M.; Borrelli, P.; Alewell, C.; Alvarez, P.; Anache, J.A.A.; Baartman, J.; Ballabio, C.; Biddoccu, M.; Cerdà, A.; et al. Soil erosion modelling: A bibliometric analysis. Environ. Res. 2021, 197, 111087. [Google Scholar] [CrossRef] [PubMed]
  17. Qin, Y.; Xu, Z.; Wang, X.; Škare, M. Green energy adoption and its determinants: A bibliometric analysis. Renew. Sustain. Energy Rev. 2022, 153, 111780. [Google Scholar] [CrossRef]
  18. Shawahna, R.; Nairat, Q. Research productivity in the field of physical exercise and epilepsy: A bibliometric analysis of the scholarly literature with qualitative synthesis. Epilepsy Behav. 2021, 121, 108058. [Google Scholar] [CrossRef] [PubMed]
  19. Donthu, N.; Kumar, S.; Mukherjee, D.; Pandey, N.; Lim, W.M. How to conduct a bibliometric analysis: An overview and guidelines. J. Bus. Res. 2021, 133, 285–296. [Google Scholar] [CrossRef]
  20. Martin-Martin, A.; Thelwall, M.; Orduna-Malea, E.; Delgado López-Cózar, E. Google Scholar, Microsoft Academic, Scopus, Dimensions, Web of Science, and Open Citations’ COCI: A multidisciplinary comparison of coverage via citations. Scientometrics 2021, 126, 871–906. [Google Scholar] [CrossRef] [PubMed]
  21. Li, N.; Han, R.; Lu, X. Bibliometric analysis of research trends on solid waste reuse and recycling during 1992–2016. Resour. Conserv. Recycl. 2018, 130, 109–117. [Google Scholar] [CrossRef]
  22. Jiang, W.; Aishan, T.; Halik, Ü.; Wei, Z.; Wumaier, M. A Bibliometric and Visualized Analysis of Research Progress and Trends on Decay and Cavity Trees in Forest Ecosystem over 20 Years: An Application of the Cite Space Software. Forests 2022, 13, 1437. [Google Scholar] [CrossRef]
  23. Thompson, D.F.; Walker, C.K. A descriptive and historical review of bibliometrics with applications to medical sciences. Pharmacother. J. Hum. Pharmacol. Drug Ther. 2015, 35, 551–559. [Google Scholar] [CrossRef]
  24. Qiu, H.; Chen, Y.F. Bibliometric analysis of biological invasions research during the period of 1991 to 2007. Scientometrics 2009, 81, 601–610. [Google Scholar] [CrossRef]
  25. He, P.; Lu, W.; Luo, Y. A bibliometric analysis on literatures of biological invasion. J. Beijing For. Uni. 2009, 31, 77–83. [Google Scholar]
  26. Krishnamoorthy, G.; Ramakrishnan, J.; Devi, S. Bibliometric analysis of literature on diabetes (1995–2004). Ann. Lib. Infor. Stud. 2009, 56, 150–155. [Google Scholar]
  27. Mao, G.; Zou, H.; Chen, G.; Du, H.; Zuo, J. Past, current and future of biomass energy research: A bibliometric analysis. Renew. Sustain. Energy Rev. 2015, 52, 1823–1833. [Google Scholar] [CrossRef]
  28. Tao, J.; Che, R.; He, D.; Yan, Y.; Sui, X.; Chen, Y. Trends and potential cautions in food web research from a bibliometric analysis. Scientometrics 2015, 105, 435–447. [Google Scholar] [CrossRef]
  29. Danvila-del-Valle, I.; Estévez-Mendoza, C.; Lara, F.J. Human resources training: A bibliometric analysis. J. Bus. Res. 2019, 101, 627–636. [Google Scholar] [CrossRef]
  30. Huang, L.; Zhou, M.; Lv, J.; Chen, K. Trends in global research in forest carbon sequestration: A bibliometric analysis. J. Clean. Prod. 2020, 252, 119908. [Google Scholar] [CrossRef]
  31. Zhang, Y.; Pu, S.; Lv, X.; Gao, Y.; Ge, L. Global trends and prospects in microplastics research: A bibliometric analysis. J. Haz. Mat. 2020, 400, 123110. [Google Scholar] [CrossRef] [PubMed]
  32. Mao, G.; Hu, H.; Liu, X.; Crittenden, J.; Huang, N. A bibliometric analysis of industrial waste water treatments from 1998 to 2019. Environ. Pol. 2021, 275, 115785. [Google Scholar] [CrossRef]
  33. Xu, J.; Xiao, P.; Li, T.; Wang, Z. Research Progress on endangered plants: A bibliometric analysis. Biodivers. Conserv. 2022, 31, 1125–1147. [Google Scholar] [CrossRef]
  34. Gulhan, P.Y.; Kurutkan, M.N. Bibliometric analysis of covid-19 publications in the field of chest and infectious diseases. Duzce Med. J. 2021, 23, 30–40. [Google Scholar] [CrossRef]
  35. DellaCorte, V.; DelGaudio, G.; Sepe, F.; Sciarelli, F. Sustainable tourism in the open innovation realm: A bibliometric analysis. Sustainability 2019, 11, 6114. [Google Scholar] [CrossRef]
  36. Ahmi, A. Bibliometric Analysis Using R for Non-Coders: A Practical Handbook in Conducting Bibliometric Analysis Studies Using Biblioshiny for Bibliometrix R Package; The R Project for Statistical Computing: Vienna, Austria, 2022. [Google Scholar]
  37. Durieux, V.; Gevenois, P.A. Bibliometric indicators: Quality measurements of scientific publication. Radiology 2010, 255, 342–351. [Google Scholar] [CrossRef] [PubMed]
  38. Rotenberry, J.T.; Preston, K.L.; Knick, S.T. GIS-Based Niche Modeling for mapping species’ habitat. Ecology 2006, 87, 1458–1464. [Google Scholar] [CrossRef] [PubMed]
  39. Wani, Z.A.; Ridwan, Q.; Khan, S.; Pant, S.; Siddiqui, S.; Moustafa, M.; Ahmad, A.E.; Yassin, H.M. Changing Climatic Scenarios Anticipate Dwindling of Suitable Habitats for Endemic Species of Himalaya—Predictions of Ensemble Modelling Using Aconitum heterophyllum as a Model Plant. Sustainability 2022, 14, 8491. [Google Scholar] [CrossRef]
  40. Shah, S.M.; Ahmad, T.; Chen, S.; Yuting, G.; Liu, X.; Yuan, Y. A Bibliometric Analysis of the One Hundred Most Cited Studies in Psychosomatic Research. Psychother. Psychosom. 2021, 90, 425–430. [Google Scholar] [CrossRef] [PubMed]
  41. Gourikeremath, G.; Hiremath, R.; Hadagali, G. Application of Bradford’s Law to the Scientific Literature of two UPE (University with Potential for Excellence) status Universities of India: A study based on the Web of Science Database. J. Adv. Lib. Inform. Sci. 2021, 10, 160–165. [Google Scholar]
  42. Reyes-Gonzalez, L.; Gonzalez-Brambila, C.N.; Veloso, F. Using co-authorship and citation analysis to identify research groups: A new way to assess performance. Scientometrics 2016, 108, 1171–1191. [Google Scholar] [CrossRef]
  43. Ahmi, A.; Saidin, S.Z.; MohdNasir, M.H.; Ismail, Z. Applicability of Lotka’s law in eXtensible business reporting language (XBRL) studies. Inter. J. Adv. Sci. Tech. 2020, 29, 282–289. [Google Scholar]
  44. Lotka, A.J. The frequency distribution of scientific productivity. J. Washing Acad. Sci. 1926, 16, 317–323. [Google Scholar]
  45. Zupic, I.; Cater, T. Bibliometric methods in management and organization. Organ. Res. Meth. 2015, 18, 429–472. [Google Scholar] [CrossRef]
  46. Kier, G.; Kreft, H.; Lee, T.M.; Jetz, W.; Ibisch, P.L.; Nowicki, C.; Mutke, J.; Barthlott, W. A global assessment of endemism and species richness across island and mainland regions. Proc. Natl. Acad. Sci. USA 2009, 106, 9322–9327. [Google Scholar] [CrossRef] [PubMed]
  47. Crisp, M.D.; Laffan, S.; Linder, H.P.; Monro, A.N.N.A. Endemism in the Australian flora. J. Biogeogr. 2001, 28, 183–198. [Google Scholar] [CrossRef]
  48. Villasenor, J.L. Checklist of native vascular plants of México. Rev. Mex. Biodivers. 2016, 87, 559–902. [Google Scholar] [CrossRef]
  49. Vetaas, O.R.; Grytnes, J.A. Distribution of vascular plant species richness and endemic richness along the Himalayan elevation gradient in Nepal. Glob. Ecol. Biogeogr. 2002, 11, 291–301. [Google Scholar] [CrossRef]
  50. Lopez-Pujol, J.; Zhang, F.M.; Sun, H.Q.; Ying, T.S.; Ge, S. Centres of plant endemism in China: Places for survival or for speciation? J. Biogeogr. 2011, 38, 1267–1280. [Google Scholar] [CrossRef]
  51. Linder, H.P. Plant diversity and endemism in sub-Saharan tropical Africa. J. Biogeogr. 2001, 28, 169–182. [Google Scholar] [CrossRef]
  52. Jansson, R. Global patterns in endemism explained by past climatic change. Proc. R. Soc. Lond. Ser. B Biol. Sci. 2003, 270, 583–590. [Google Scholar] [CrossRef] [PubMed]
  53. Thomas, W.W.; Carvalho, A.M.D.; Amorim, A.M.; Garrison, J.; Arbela´EZ, A.L. Plant endemism in two forests in southern Bahia, Brazil. Biodivers. Conserv. 1998, 7, 311–322. [Google Scholar] [CrossRef]
  54. McGlone, M.S.; Duncan, R.P.; Heenan, P.B. Endemism, species selection and the origin and distribution of the vascular plant flora of New Zealand. J. Biogeogr. 2001, 28, 199–216. [Google Scholar] [CrossRef]
  55. Medail, F.; Verlaque, R. Ecological characteristics and rarity of endemic plants from southeast France and Corsica: Implications for biodiversity conservation. Biol. Conserv. 1997, 80, 269–281. [Google Scholar] [CrossRef]
  56. Dodson, C.H.; Gentry, A.H. Biological extinction in western Ecuador. Ann. Miss. Bot. Gard. 1991, 78, 273–295. [Google Scholar] [CrossRef]
  57. Murray-Smith, C.; Brummitt, N.A.; Oliveira-Filho, A.T.; Bachman, S.; Moat, J.; Lughadha, E.M.N.; Lucas, E.J. Plant diversity hotspots in the Atlantic coastal forests of Brazil. Conserv. Biol. 2009, 23, 151–163. [Google Scholar] [CrossRef]
  58. Davila, P.; Arizmendi, M.D.C.; Valiente-Banuet, A.; Villaseñor, J.L.; Casas, A.; Lira, R. Biological diversity in the Tehuacán-Cuicatlán valley, Mexico. Biodivers.Conserv. 2002, 11, 421–442. [Google Scholar] [CrossRef]
  59. DaSilva, J.M.C.; Rylands, A.B.; da Fonseca, G.A. The fate of the Amazonian areas of endemism. Conserv. Biol. 2005, 19, 689–694. [Google Scholar] [CrossRef]
  60. Morat, P.; Jaffre, T.; Tronchet, F.; Munzinger, J.; Pillon, Y.; Veillon, J.M.; Chalopin, M.; Birnbaum, P.; Rigault, F.; Dagostini, G.; et al. The taxonomic reference base Florical and characteristics of the native vascular flora of New Caledonia. Adansonia 2012, 34, 179–221. [Google Scholar] [CrossRef]
  61. Joppa, L.N.; Roberts, D.L.; Myers, N.; Pimm, S.L. Biodiversity hotspots house most undiscovered plant species. Proc. Natl. Acad. Sci. USA 2011, 108, 13171–13176. [Google Scholar] [CrossRef] [PubMed]
  62. Kessler, M. Elevational gradients in species richness and endemism of selected plant groups in the central Bolivian Andes. Plant Ecol. 2000, 149, 181–193. [Google Scholar] [CrossRef]
  63. Hemp, A. Vegetation of Kilimanjaro: Hidden endemics and missing bamboo. Afr. J. Ecol. 2006, 44, 305–328. [Google Scholar] [CrossRef]
  64. Silvertown, J. The ghost of competition past in the phylogeny of island endemic plants. J. Ecol. 2004, 92, 168–173. [Google Scholar] [CrossRef]
  65. Tribsch, A. Areas of endemism of vascular plants in the Eastern Alps in relation to Pleistocene glaciation. J. Biogeogr. 2004, 31, 747–760. [Google Scholar] [CrossRef]
  66. Wang, M.; Chai, L. Three new bibliometric indicators/approaches derived from keyword analysis. Scientometrics 2018, 116, 721–750. [Google Scholar] [CrossRef]
  67. Behera, M.D.; Kushwaha, S.P.S.; Roy, P.S. High plant endemism in an Indian hotspot—Eastern Himalaya. Biodivers. Conserv. 2002, 11, 669–682. [Google Scholar] [CrossRef]
  68. Myers, N. Threatened biotas: “Hotspots” in tropical forests. Environmentalist 1988, 8, 187–208. [Google Scholar] [CrossRef] [PubMed]
  69. Coelho, N.; Gonçalves, S.; Romano, A. Endemic plant species conservation: Biotechnological approaches. Plants 2020, 9, 345. [Google Scholar] [CrossRef] [PubMed]
  70. Díaz, S.; Settele, J.; Brondízio, E.S.; Ngo, H.T.; Agard, J.; Arneth, A.; Balvanera, P.; Brauman, K.A.; Butchart, S.H.M.; Chan, K.M.A.; et al. Pervasive human-driven decline of life on Earth points to the need for transformative change. Science 2019, 366, eaax3100. [Google Scholar] [CrossRef]
  71. Ludovicy, S.; Noroozi, J.; Semenchuk, P.; Moser, D.; Wessely, J.; Talebi, A.; Dullinger, S. Protected area network insufficiently represents climatic niches of endemic plants in a Global Biodiversity Hotspot. Biol. Conserv. 2022, 275, 109768. [Google Scholar] [CrossRef]
  72. Harrison, S.; Noss, R. Endemism hotspots are linked to stable climatic refugia. Ann. Bot. 2017, 119, 207–214. [Google Scholar] [CrossRef]
  73. Elsen, P.R.; Monahan, W.B.; Merenlender, A.M. Global patterns of protection of elevational gradients in mountain ranges. Proc. Natl. Acad. Sci. USA 2018, 115, 6004–6009. [Google Scholar] [CrossRef]
  74. Riemann, H.; Ezcurra, E. Plant endemism and natural protected areas in the peninsula of Baja California, Mexico. Biol. Conserv. 2005, 122, 141–150. [Google Scholar] [CrossRef]
  75. Chen, G.; Sun, W. The role of botanical gardens in scientific research, conservation, and citizen science. Plant Divers. 2018, 40, 181–188. [Google Scholar] [CrossRef]
  76. Westwood, M.; Cavender, N.; Meyer, A.; Smith, P. Botanic garden solutions to the plant extinction crisis. Plants People Planet 2021, 3, 22–32. [Google Scholar] [CrossRef]
  77. Krishnan, S.; Novy, A. The role of botanic gardens in the twenty-first century. CAB Rev. 2016, 11, 1–10. [Google Scholar] [CrossRef]
  78. Mounce, R.; Smith, P.; Brockington, S. Ex situ conservation of plant diversity in the world's botanic gardens. Nat. Plants 2017, 3, 795–802. [Google Scholar] [CrossRef]
  79. Smith, P. The challenge for botanic garden science. Plants People Planet 2018, 1, 38–43. [Google Scholar] [CrossRef]
Figure 1. Flow chart showing the step-by-step methodology for carrying out bibliometric analysis.
Jzbg 04 00049 g001
Figure 2. Annual scientific production from 1991 to 2022.
Jzbg 04 00049 g002
Figure 3. Most relevant and productive journals from 1991 to 2022.
Jzbg 04 00049 g003
Figure 4. Growth of journals with respect to publications from 1991 to 2022.
Jzbg 04 00049 g004
Figure 5. Bradford’s law, showing the most basic and core sources.
Jzbg 04 00049 g005
Figure 6. Frequency distribution of scientific productivity based on Lotka’s Law.
Jzbg 04 00049 g006
Figure 7. Global scientific production on plant nativity and endemism studies.
Jzbg 04 00049 g007
Figure 8. Top 20 most-cited countries.
Jzbg 04 00049 g008
Figure 9. Top 20 most relevant affiliations.
Jzbg 04 00049 g009
Figure 10. Country collaboration map (intensity of blue color shows number of publications and the pink line depicts the connections).
Jzbg 04 00049 g010
Figure 11. Trends in the topics (keywords) from 1991 to 2022.
Jzbg 04 00049 g011
Figure 12. Word cloud of author keywords used in plant nativity and endemism studies from 1991 to 2022.
Jzbg 04 00049 g012
Figure 13. Dendrogram showing the clustering of keywords.
Jzbg 04 00049 g013
Figure 14. Thematic evolution of research on plant nativity and endemism from 1991 to 2022.
Jzbg 04 00049 g014
Table 1. Most-productive and most-cited authors from 1991 to 2022.
Authorh-IndexTotal CitationsNumber of Publications
Linder HP78977
Medail F42886
Noroozi J51946
Panitsa M61686
Dimopoulos P4605
Huang J3393
Siebert SJ3275
Thornhill AH41235
Aagesen L41354
Bredenkamp GJ3814
Irl Sdh4754
Kessler M43284
Lavergne SM41424
Salinas-Rodriguez M2374
Mishler BD31474
Munguia-Lino G2304
Samant SS31714
Scherson RA3294
Schneeweiss GM41654
Trigas P41704
Table 2. Most relevant countries by collaborating authors.
CountryArticlesFrequencySCPMCPMCP Ratio
Mexico410.11883290.2195
USA320.09282480.25
Brazil290.08412090.3103
South Africa280.08122530.1071
Germany210.06091290.4286
China180.0522990.5
United Kingdom130.0377670.5385
Greece120.0348930.25
India120.03481110.0833
France110.0319470.6364
Argentina100.0291000
Australia100.029550.5
Italy90.0261360.6667
Spain90.0261630.3333
Iran80.0232530.375
Chile60.0174330.5
New Zealand60.0174420.3333
Turkey60.0174510.1667
Austria50.0145140.8
Saudi Arabia40.0116130.75
Abbreviations Used: SCP = Single Country Production; MCP = Multiple Country Production.
Table 3. Most productive and cited sources from 1991 to 2022.
Sourceh-IndexTotal CitationsNumber of Publications
Biodiversity and Conservation20118435
Journal of Biogeography19213221
Phytotaxa59714
Botanical Sciences44612
Biological Conservation841510
South African Journal of Botany51509
Botanical Review62228
Botanical Journal of the Linnean Society52697
Diversity and Distributions62187
Annals of the Missouri Botanical Garden64266
Biological Journal of the Linnean Society51656
Conservation Biology54666
Acta Botanica Mexicana51055
Bothalia3245
Global Ecology and Biogeography53435
Phytokeys3305
Plos One52655
Scientific Reports51815
Ecology and Evolution4714
Journal of Biological Research-Thessaloniki3484
Disclaimer/Publisher’s Note: The statements, opinions and data contained in all publications are solely those of the individual author(s) and contributor(s) and not of MDPI and/or the editor(s). MDPI and/or the editor(s) disclaim responsibility for any injury to people or property resulting from any ideas, methods, instructions or products referred to in the content.

