Article

Tree Species Composition and Diversity in a Secondary Forest along the Sierra Madre Mountain Range in Central Luzon, Philippines: Implications for the Conservation of Endemic, Native, and Threatened Plants

by
Christian Ofalla Llait
1,2
1
Department of Forestry, College of Agriculture and Forestry, Tarlac Agricultural University, Camiling 2306, Tarlac, Philippines
2
School of Graduate Studies, Aurora State College of Technology, Baler 3200, Aurora, Philippines
J. Zool. Bot. Gard. 2024, 5(1), 51-65; https://doi.org/10.3390/jzbg5010004
Submission received: 30 October 2023 / Revised: 17 December 2023 / Accepted: 3 January 2024 / Published: 9 January 2024

Abstract

:
The Sierra Madre Mountain Range (SMMR) is the backbone of the Luzon Islands that contains a high concentration of highly important ecological resources distributed among the 68 protected areas therewith. The present study aimed to assess the composition and diversity of tree species in a secondary forest within the SMMR. A 2.25 km transect with 10 900-m2 plots were established to record tree species with a diameter at breast height of at least 10 cm. The findings revealed 148 individuals of trees from 38 morphospecies, 28 genera, and 20 families. Importance values unveiled the Aurora endemic Macaranga stonei Whitmore as the most important species in terms of the relative values of its abundance, frequency, and dominance. The area was also found to be home to 33 natives, 12 endemics, five IUCN threatened species, and nine Philippine threatened trees. Furthermore, the study site was also found to have considerably high diversity, with a Shannon–Weiner Index value of 3.269 and a relatively even distribution of individuals among species, as supported by the Simpson’s Evenness index value of 0.9453. Significant correlational relationships were also found among species richness, Shannon–Weiner index, and Simpson’s Evenness index, with correlation coefficients ranging from 0.881 to 0.934, with all significant at p < 0.001. Lastly, the study was able to produce a distribution map, which is necessary for implementing targeted conservation strategies. These findings provided valuable implications for future research and implementation of targeted and participatory biodiversity conservation and protection strategies.

1. Introduction

The Philippines, an archipelagic country known for its rich biodiversity, stands proudly as one of the 18 megadiverse nations on Earth [1]. This designation signifies that it harbors over two-thirds of the world’s biodiversity resources, which play a crucial role in supporting human well-being and survival while maintaining ecosystem stability [2,3]. Biodiversity generously provides us with essential resources like food, water, raw materials, and clean air. Moreover, it diligently regulates climate and protects us from natural disasters [4]. Ecologically speaking, biodiversity enables vital processes such as pollination, nutrient cycling, water filtration, and soil stabilization and erosion control—all working together to create balanced ecosystems and desirable environmental conditions [5,6,7].
Unfortunately, biodiversity has long been facing numerous threats that jeopardize its existence and the critical services it provides. Climate change, along with many undesirable human activities such as deforestation, habitat destruction, land use change, and overexploitation, primarily drive biodiversity loss globally [8]. Due to these, scientists were able to identify biodiversity hotspots that contain very high rates of endemism and drastic loss of vegetation and habitat that threatens various key biodiversity species [9]. At present, there are already 36 biodiversity hotspots, including the Philippines [10]. This signifies the need for immediate planning and implementation of strategies to prevent total biodiversity loss.
In the Philippines, various conservation and rehabilitation efforts are continuously implemented. The establishment and monitoring of protected zones under the National Integrated Protected Areas Systems (NIPAS) Act is considered one of the most important tools in conserving the country’s key biodiversity resources, as recommended by the Convention on Biological Diversity [11]. Other conservation and rehabilitation programs, such as the National Greening program under Executive Order No. 26 [12], community-based forest management under Executive Order No. 263 [13], and sustainable ecotourism [14], among others, are recognized as greatly contributing to biodiversity conservation while educating people about its values and services.
However, there were critical issues in some rehabilitation and conservation programs. One of these is the unsuitable choice of plant species to rehabilitate a degraded or disturbed area. Several efforts in the past used exotic and invasive species such as Gmelina arborea Roxb. And Swietenia macrophylla King [15] in many greening activities. Some used native species, but there was a lack of pre-assessment of the site–species relationships thus introducing the natives to inappropriate habitats and hindering their successful growth and survival [16]. This is where the importance of plant inventory and assessments comes in. The data and findings yielded by these studies provide essential information on the population structure, composition, and ecology of an area and its resources that are beneficial in recovery planning, such as biodiversity conservation and habitat rehabilitation [17].
This current study aims to contribute to the conservation of Philippine biodiversity by assessing tree diversity in the municipality of San Luis in the province of Aurora. The province is a part of the Sierra Madre Mountain Range, the longest mountain range in the country, which is considered a highly important area in terms of valuable ecological resources distributed among its 68 protected areas [18,19]. Furthermore, there are very few studies about the plant composition and diversity in the province, which only cover the tree species in the municipalities of Baler [20] and Dipaculao [21], as well as the diversity of ferns in the municipalities of Maria Aurora [22] and Baler [23]. Hence, this study will pioneer the assessment of plants in the municipality of San Luis, which is beneficial in identifying the area’s key biodiversity resources, such as the endemic, native, and threatened species, which is a crucial step in biodiversity conservation. Specifically, the study aimed to determine the tree species composition, including ecological classifications (i.e., indigeneity, endemism, and conservation status), calculate the importance values and diversity indices and explore the underlying relationships among diversity parameters and ecological variables (i.e., elevation).

2. Materials and Methods
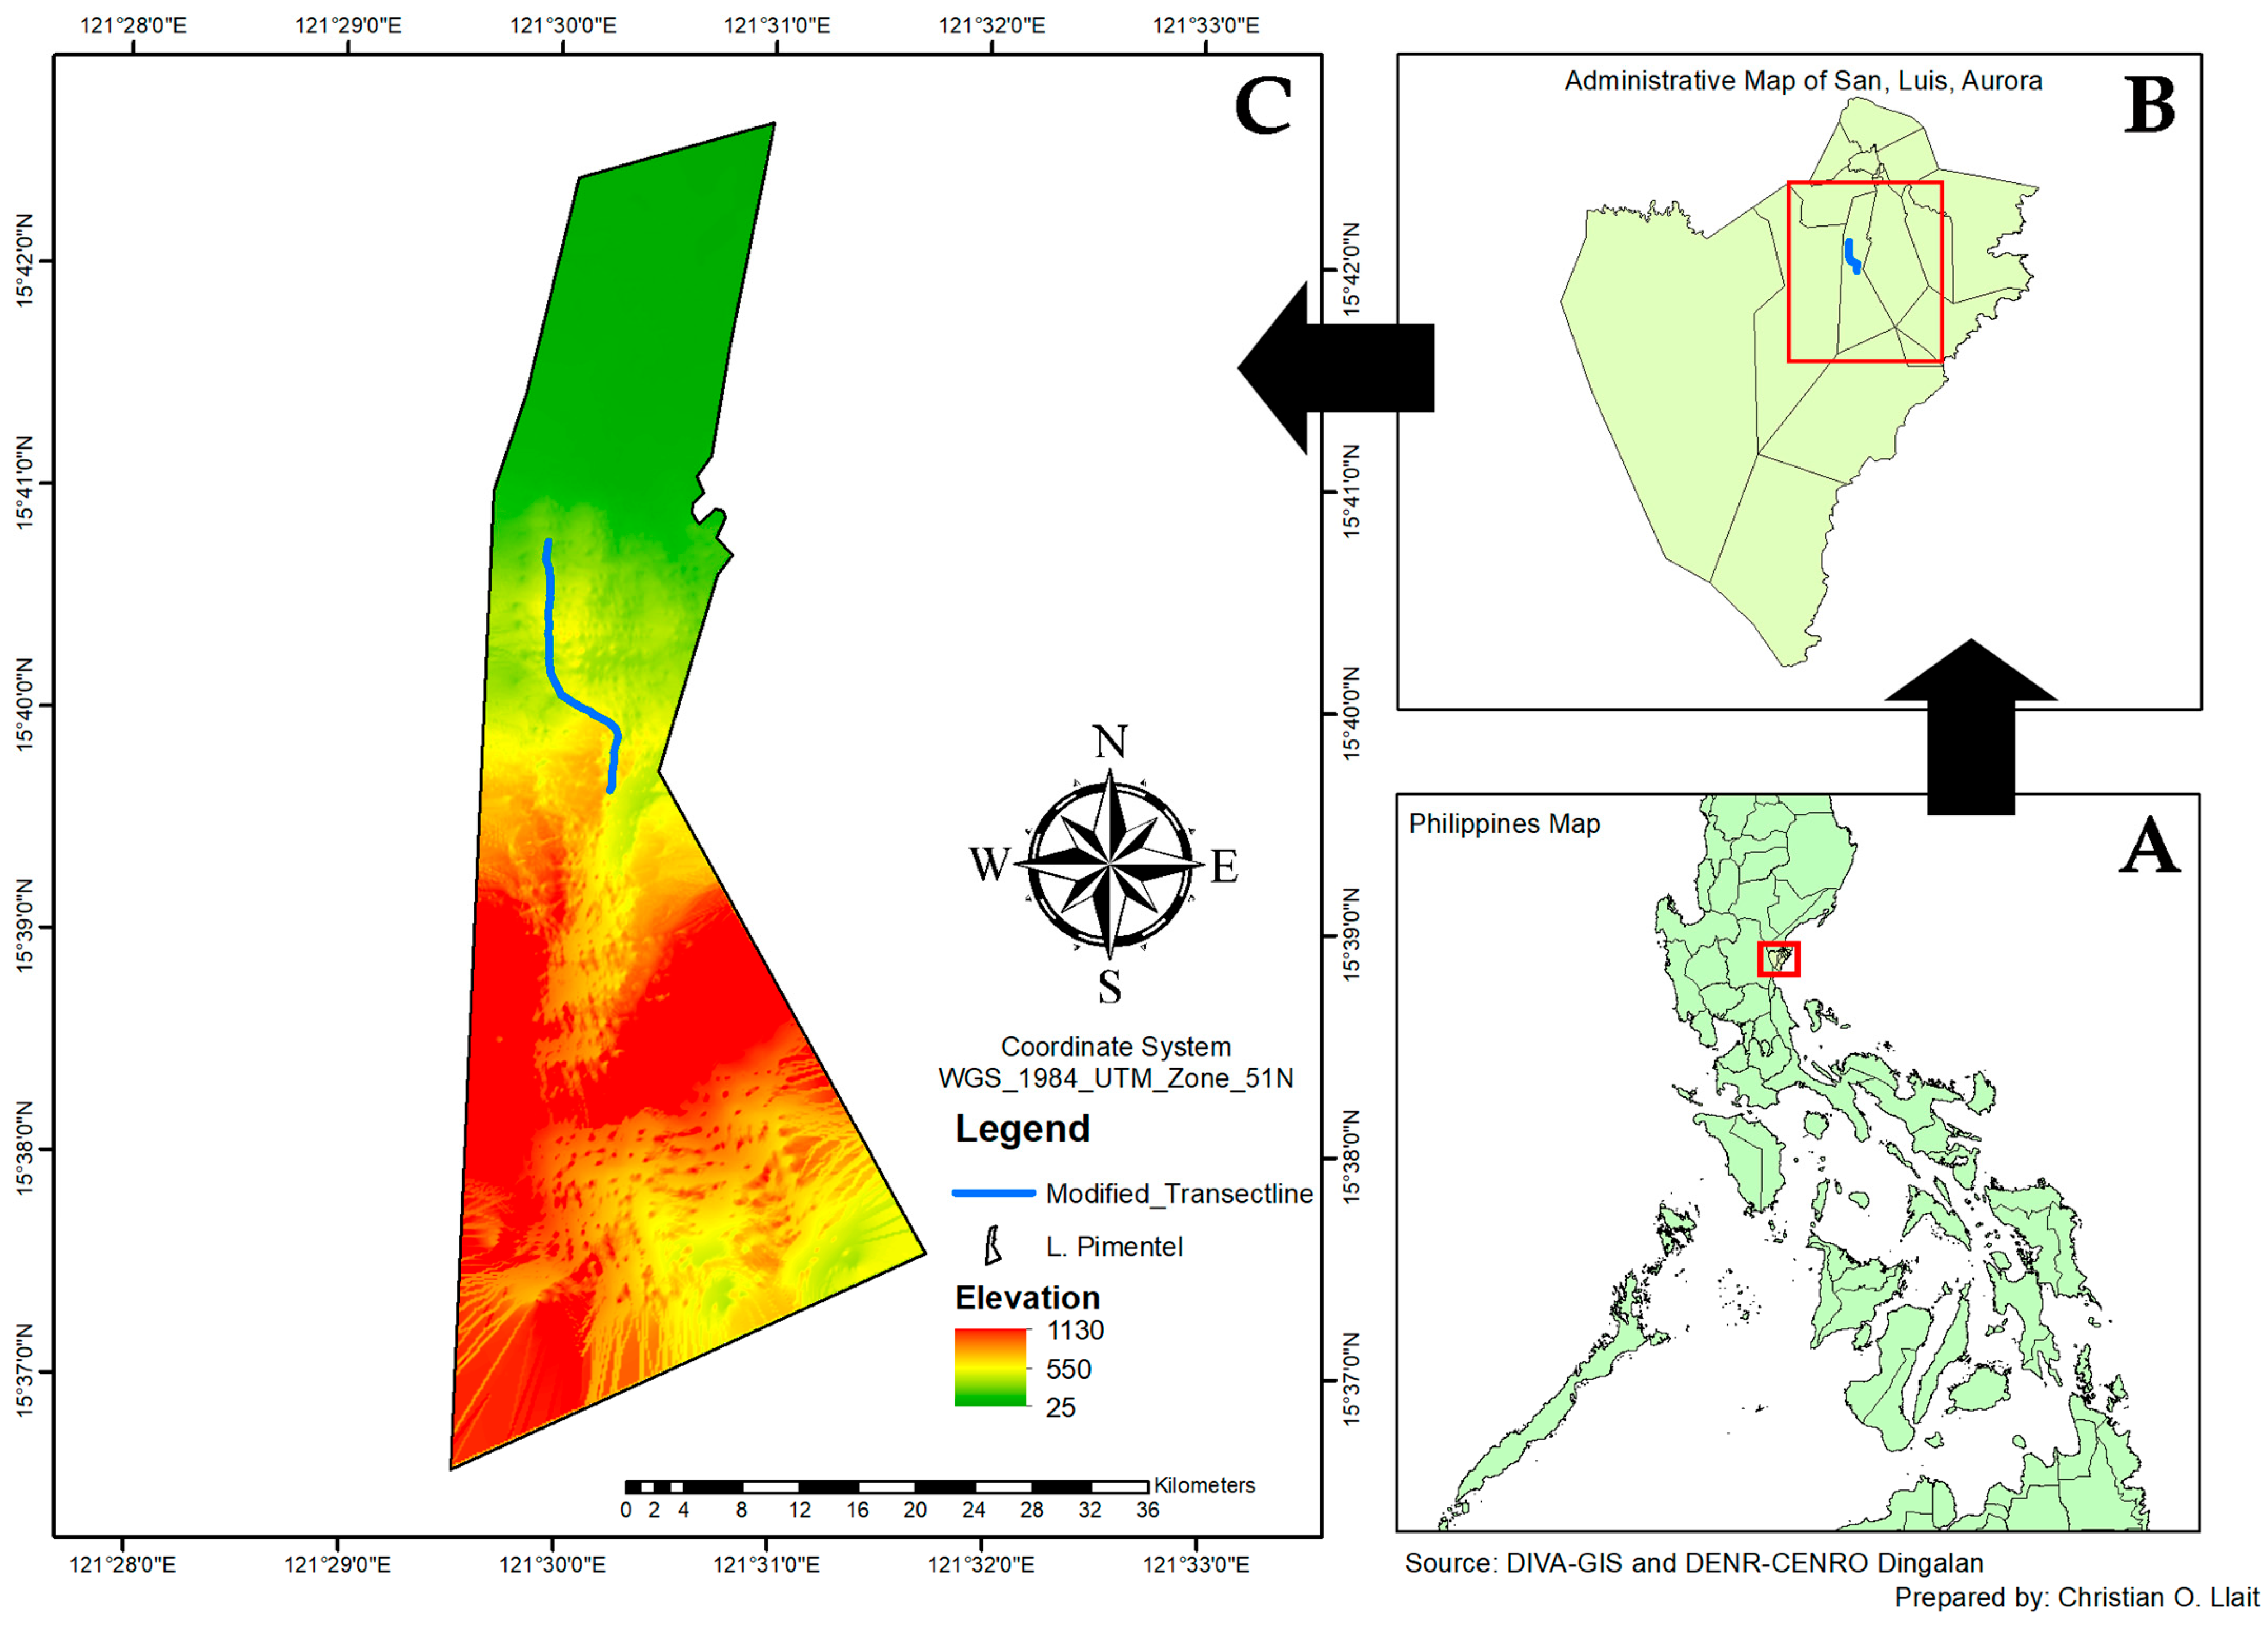
2.1. Study Site

The study was conducted in April 2023 in Barangay L. Pimentel in the municipality of San Luis, province of Aurora, situated approximately 15°41′2.94″ N and 121°30′1.23″ E (Figure 1). The barangay is composed of residential, agricultural, and mountainous forest lands. Specifically, the survey was carried out in mountainous forest lands, which is a portion of the Sierra Madre Mountain Range, the backbone of Luzon Island, that serves as a protector and barrier from typhoons coming from the Pacific Ocean [24]. The survey area had a moderately steep topography, with elevations ranging from 273 to 581 masl. Climate-wise, the municipality has average monthly temperatures ranging from 26 °C to 30 °C (high temperature) and 22 °C to 25 °C (low temperature), and average monthly rainfall ranging from 118.3 mm (March: average of 7 rainfall days) to 416.9 mm (October: average of 17 rainfall days) in 2023. In the past 10 years, the average annual temperatures have usually ranged from 26 °C to 28 °C, while rainfall has been 100.23 mm to 624.86 mm. During the study period, the area had an average temperature of 28 °C during daytime and 24 °C during nighttime and there were 8 rainy days, with precipitation of around 300 mm during the month of April [25].

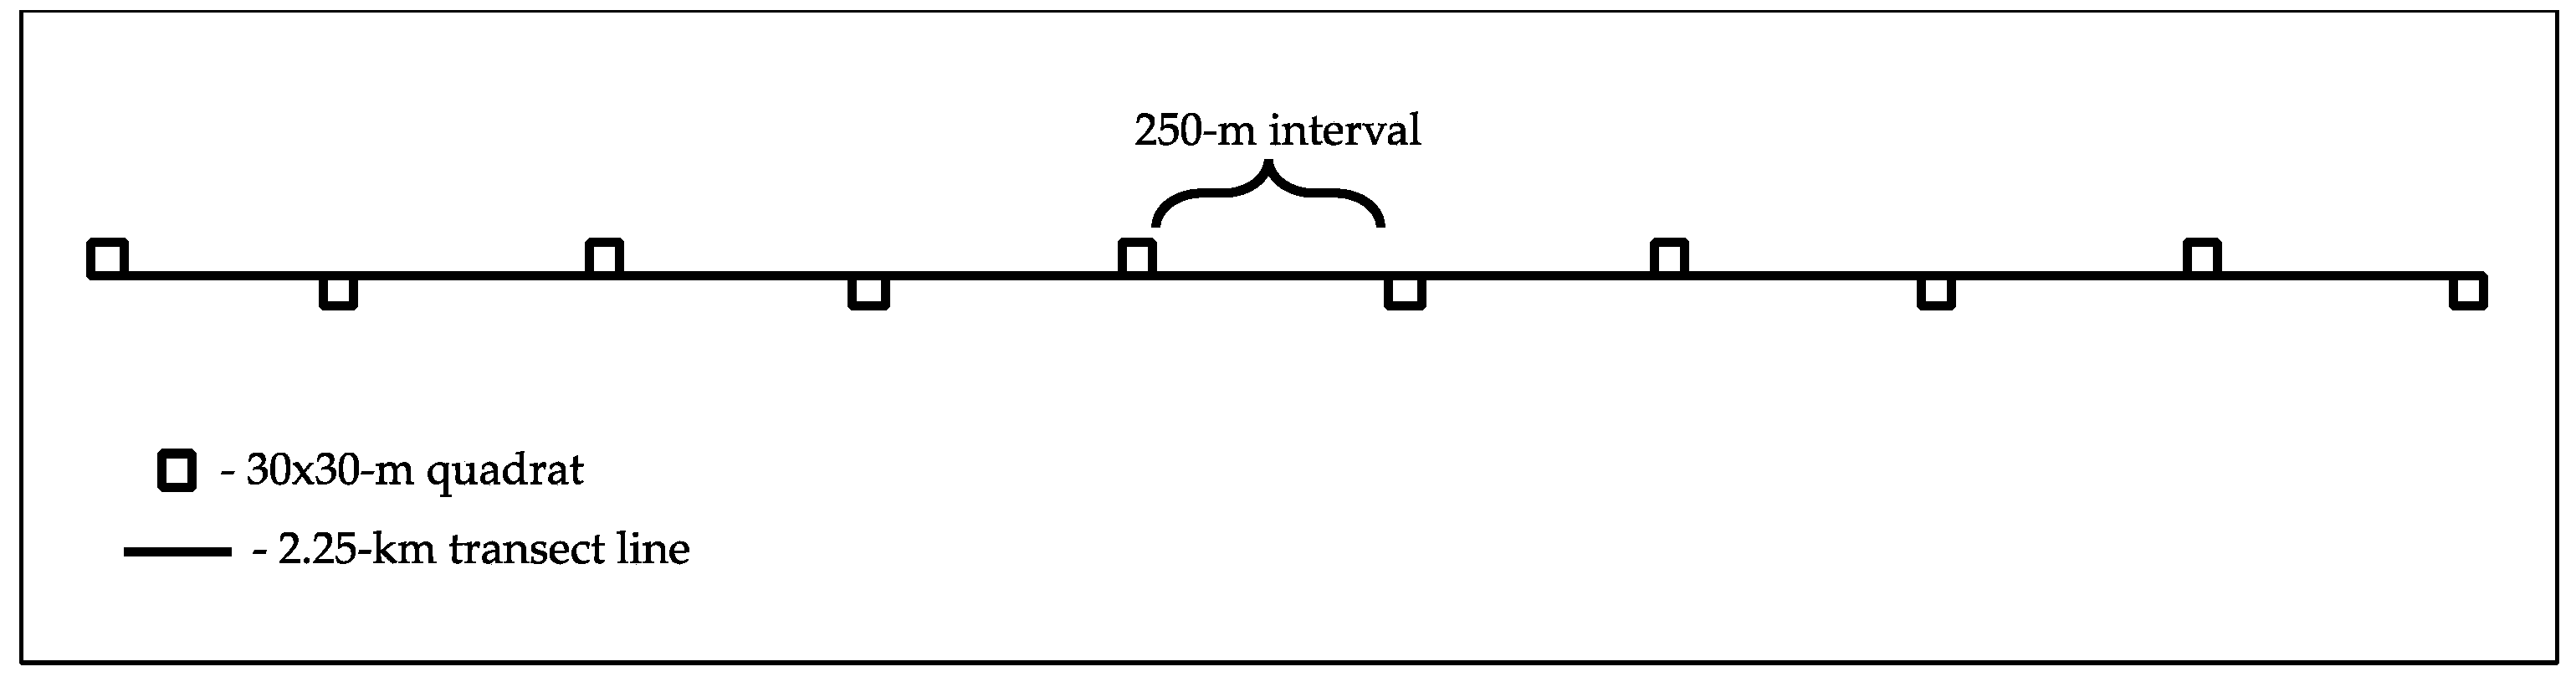
2.2. Survey and Mapping of Tree Species

The inventory of tree species was carried out along a 2.25 km transect line with 10 30 by 30 m quadrats established at every 250 m point (Figure 2). The transect line was established following the trail while the quadrats were positioned alternately at the left and right of the transect line, with an approximate distance of 5 m away from the trail. The total coverage of all the quadrats was 9000 m2. The use of transect in conducting this plant inventory was used to ensure that the quadrats were evenly distributed throughout the forest stand [26].
After the establishment of the transect and quadrats, the plant survey was carried out. Trees with a diameter at breast height (DBH) of at least 10 cm were included in the study, following the DBH cut-off of many tree species inventories undertaken in the Philippines [27,28]. Plant identities were determined in the field using morphological characteristics. For individuals that were not identified in the field, photos were taken for further verification. References and databases such as Co’s Digital Flora of the Philippines [29] and Revised Lexicon of Philippine Trees [30] were used to verify plant identities. Finally, the accepted scientific names of plants were determined using the Plants of the World Online database of the Kew Royal Botanic Gardens [31]. Significant ecological statuses (i.e., indigeneity, endemism, and conservation status) of all species were also assessed. Indigeneity and endemism were obtained from the Co’s Digital Flora of the Philippines [29]. Meanwhile, conservation statuses were determined using the IUCN Red List of Threatened Species [32] for the global scale and DAO 2017-11 or the Updated National Checklist of Threatened Plants and their Categories [33] for the national scale.
Mapping was also carried out to visually present the location of each individual tree, which will also serve as the basis for the future implementation of targeted biodiversity conservation and management measures. Initially, the Locus map (a mobile outdoor navigation application) was used to record the location of the transect line and quadrats. Then, the geographic coordinates of each tree were recorded and encoded in Microsoft Excel. Geographic coordinates in decimal degree format were then converted into the Universal Transverse Mercator (UTM) format using the ArcGeek Coordinate Conversion Tool [34] before feeding it to ArcGIS software (v. 10.4). After that, the locations of all trees were plotted on the map. Lastly, final editing was undertaken to produce the final copy of the map in .jpeg format.

2.3. Data Analysis and Interpretation

2.3.1. Species Richness, Abundance, and Importance Values

Species richness, abundance, and importance values were either counted or calculated to discover the species composition in the area. Species abundance refers to the number of individuals of a species in an area [35], while species richness is the number of species or taxa present [36]. Hence, the number of species and its individuals were counted to determine the species richness and abundance. Lastly, importance values (IVs) serve as an index to measure how dominant a certain species is in a forest area through the relative values of its abundance, frequency, and dominance [37]. Thus, IVs were computed using the following equations [38]:
D e n s i t y = n u m b e r   o f   i n d i v i d u a l s   o f   a     s p e c i e s t o t a l   a r e a   s a m p l e d
R e l a t i v e   D e n s i t y = d e n s i t y   o f   a   s p e c i e s t o t a l   d e n s i t y   o f   a l l   s p e c i e s
F r e q u e n c y = n u m b e r   o f   p l o t s   i n   w h i c h   a   s p e c i e s   o c c u r t o t a l   n u m b e r   o f   p l o t s   s a m p l e d
R e l a t i v e   F r e q u e n c y = f r e q u e n c y   o f   a   s p e c i e s t o t a l   f r e q u e n c y   o f   a l l   s p e c i e s
B a s a l   A r e a = 0.7854   ( D B H   o f   a   s p e c i e s 2 )
D o m i n a n c e = b a s a l   a r e a   o f   a   s p e c i e s t o t a l   a r e a   s a m p l e d
R e l a t i v e   D o m i n a n c e = d o m i n a n c e   o f   a   s p e c i e s t o t a l   d o m i n a n c e   o f   a l l   s p e c i e s
I m p o r t a n c e   V a l u e = R e l a t i v e   D e n s i t y + R e l a t i v e   F r e q u e n c y + R e l a t i v e   D o m i n a n c e

2.3.2. Diversity Indices

Biological diversity can be quantified using mathematical functions known as the diversity indices [39]. In this study, the widely accepted Shannon–Weiner (H’) and Simpson’s Evenness (E) were employed as the species diversity indices and computed through Paleontological Statistics (PAST v 3.18) software. The choice of these indices aligns with the standards set by previous biodiversity studies undertaken in the country and uses the Fernando Biodiversity Scale, which has been widely adopted in diverse ecological investigations in the Philippines to effectively facilitate the interpretation of computed values [40,41] (Table 1).

2.3.3. Correlation Analysis

Exploring intricate relationships among key variables is essential in deeply understanding the dynamics of forest ecosystems. Therefore, Pearson correlation analysis was used to explore the underlying relationship (i.e., monotonic association) among important variables, namely, elevation, species richness, abundance, Shannon–Weiner, and Simpson’s Evenness. This was computed at a significance level of p < 0.05 through JASP v. 0.16.1, an open-source statistical software package. The results were interpreted using the computed correlation coefficient values (r-values) and their associated p-values, as well as the conventional approach in interpreting r-values, contextualized as a direct or inverse relationship [42] (Table 2).

3. Results and Discussion

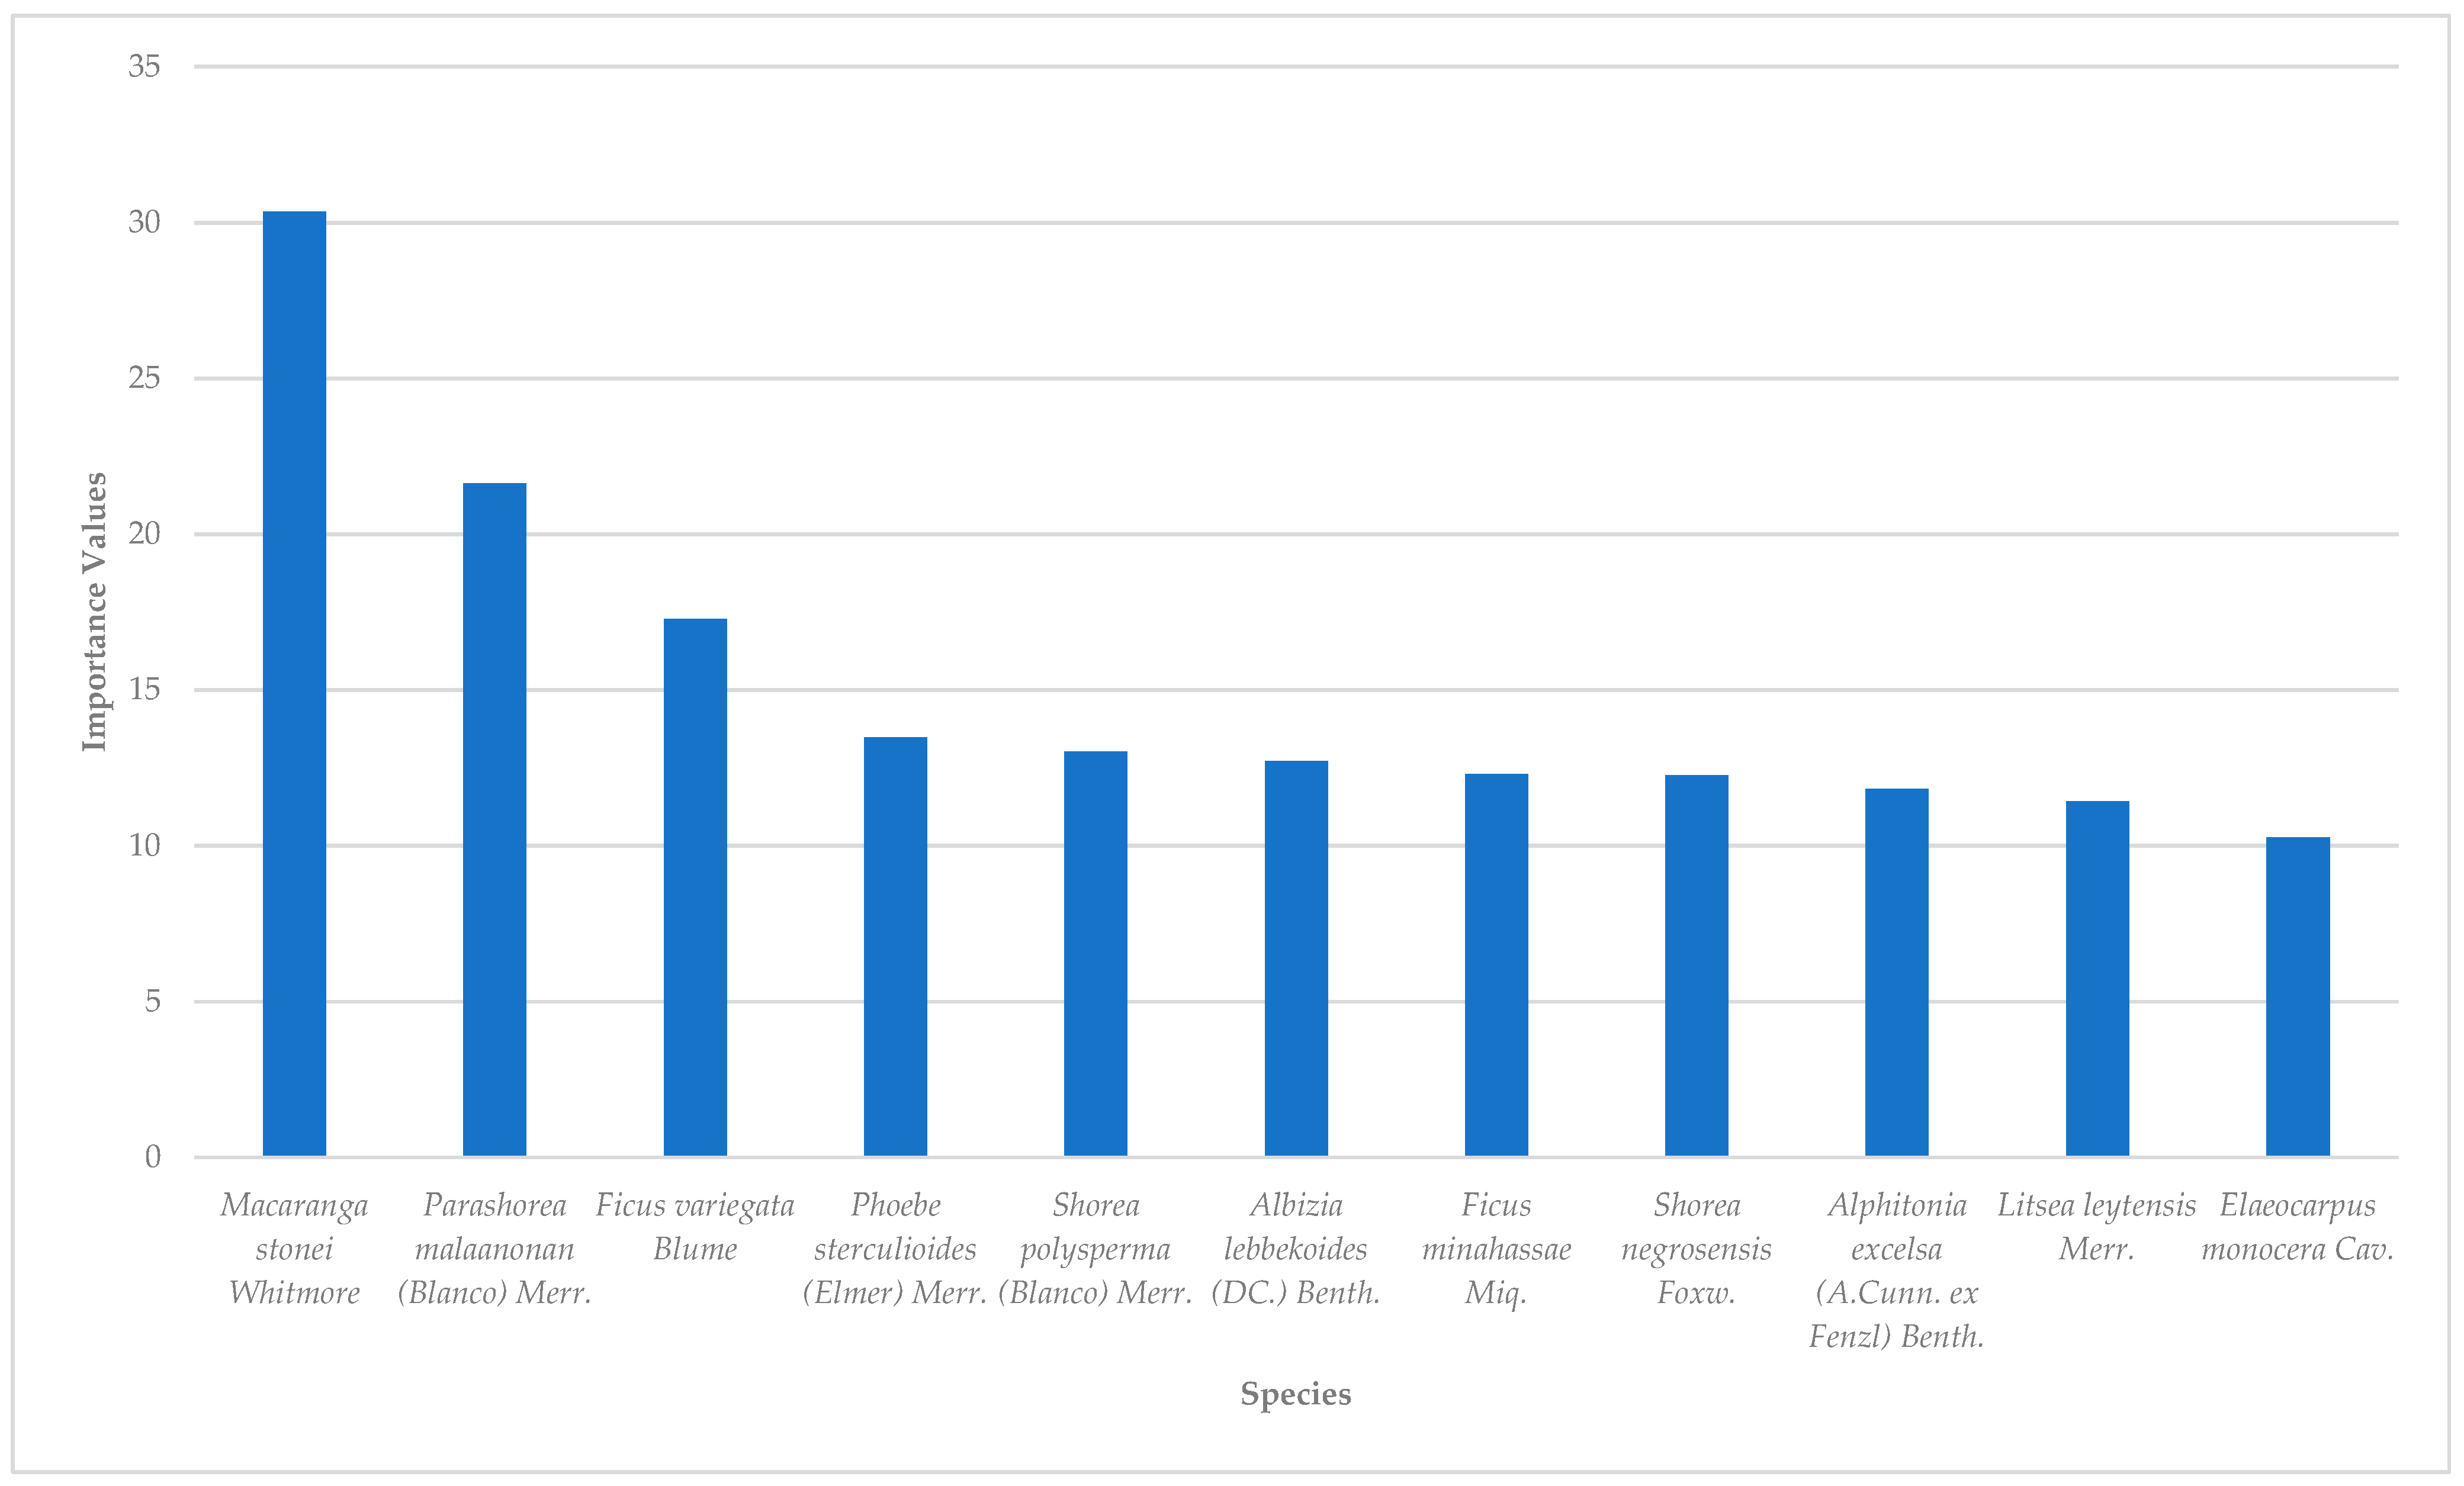
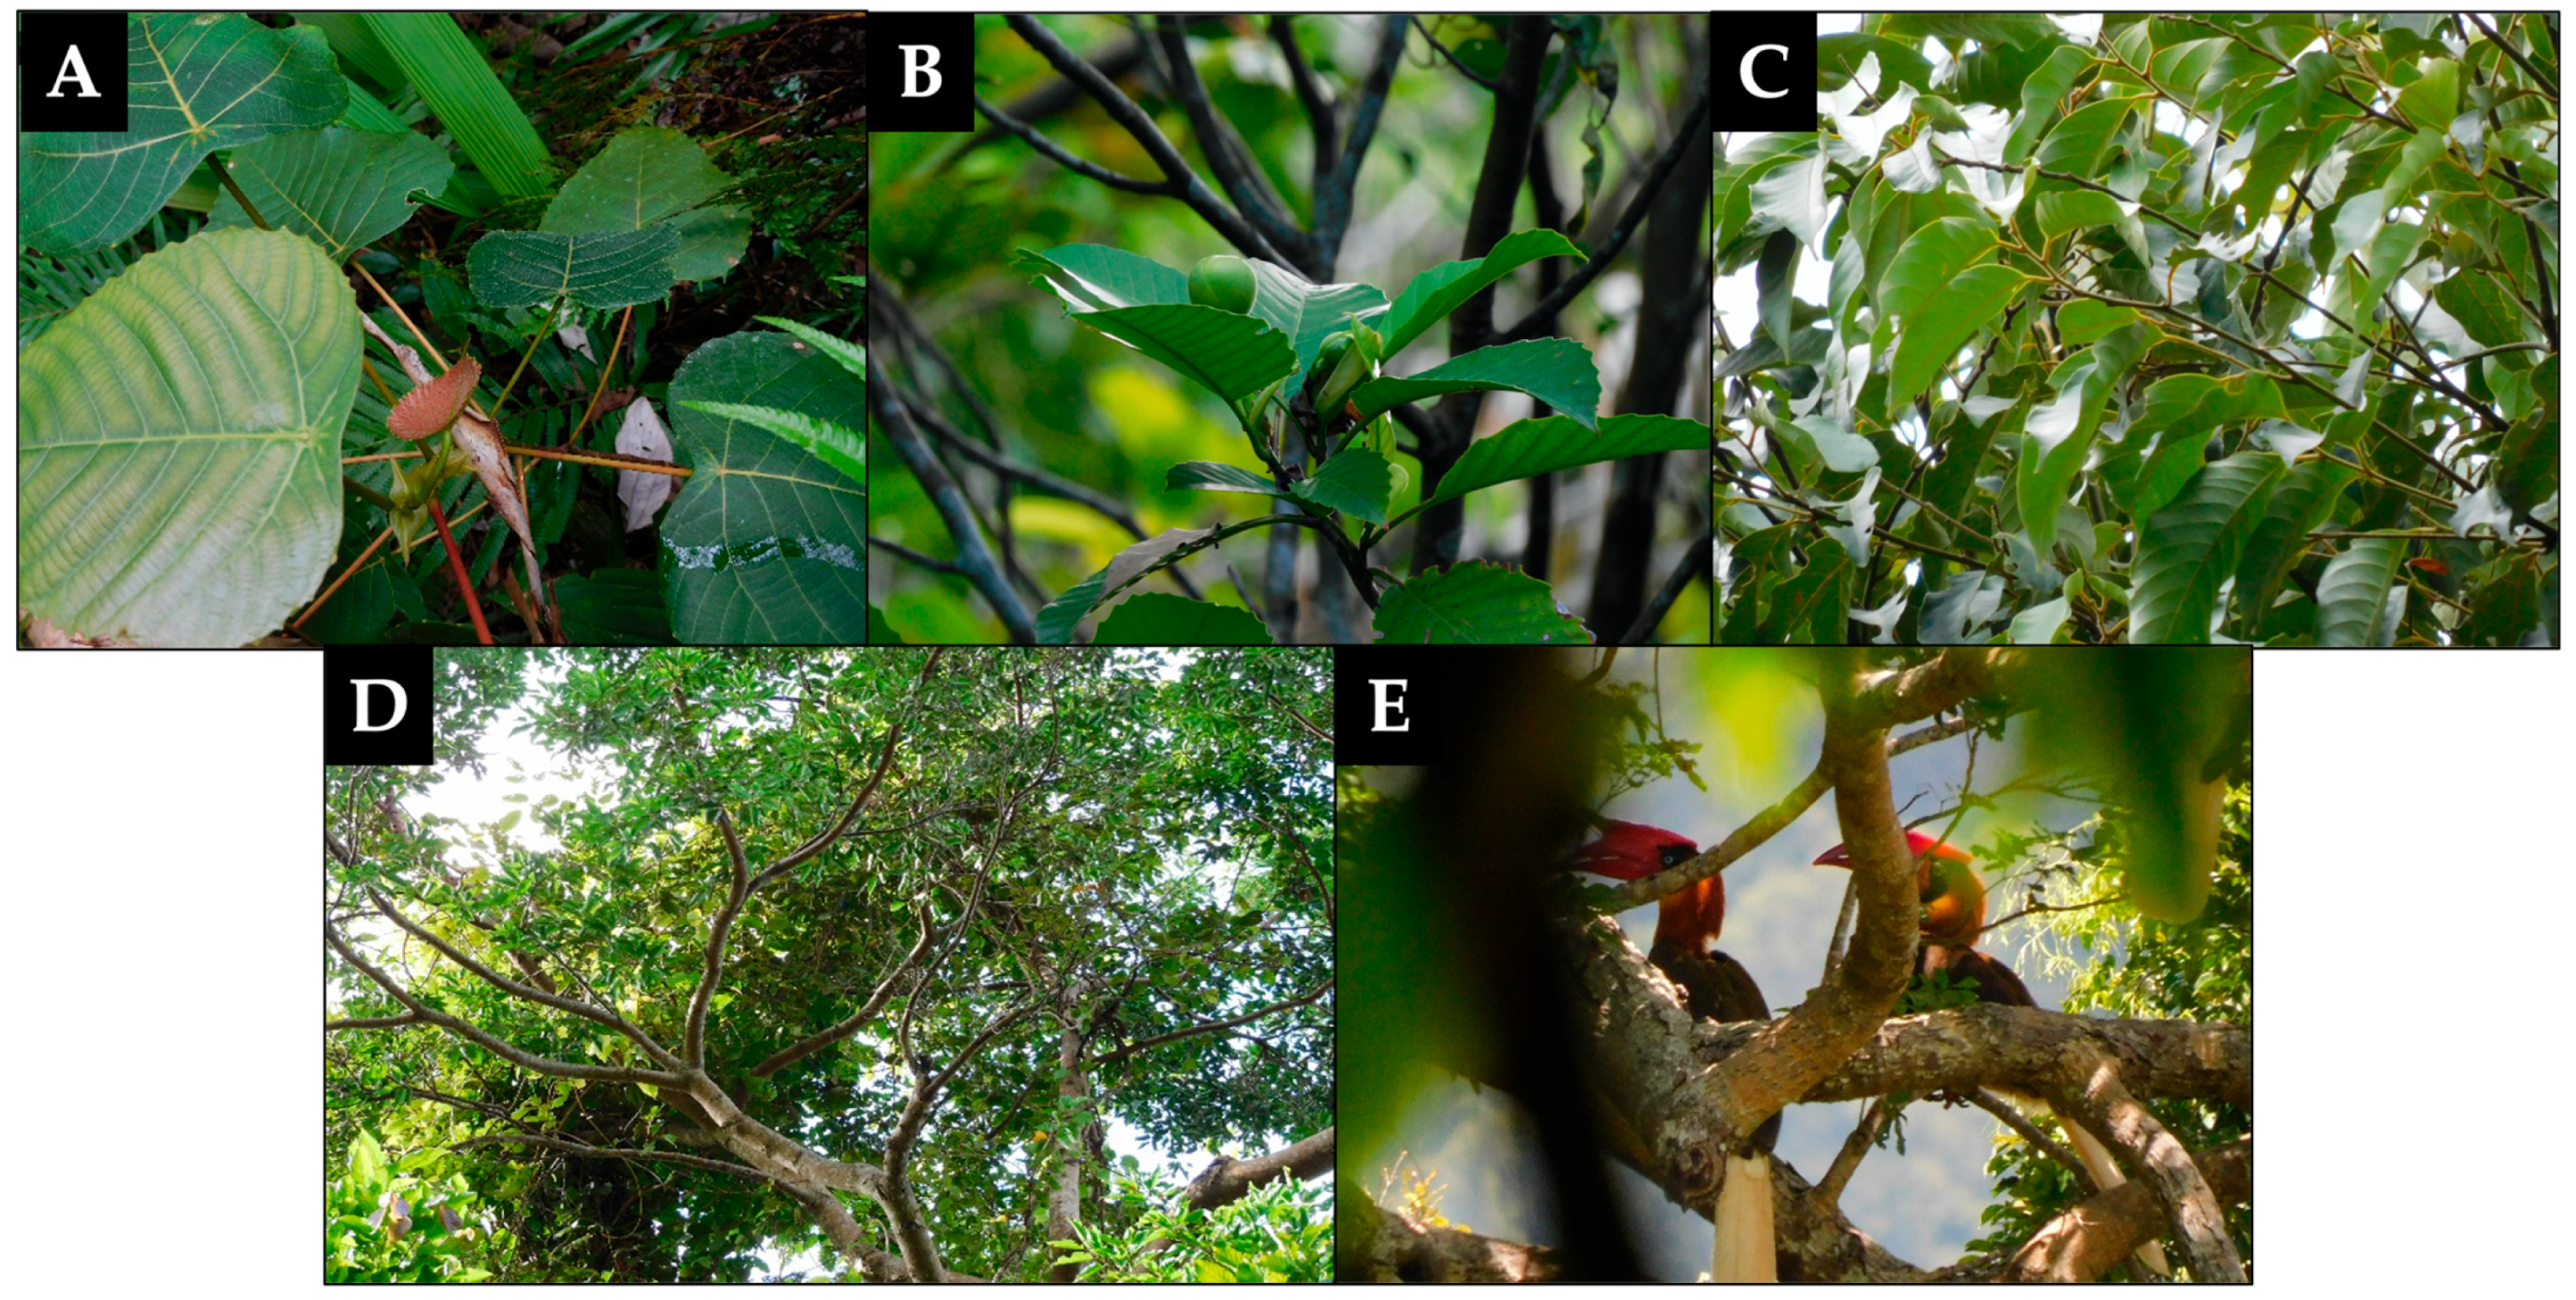
3.1. Tree Species Composition

The study recorded a total of 148 individuals of 38 morphospecies of trees from 20 families and 28 genera. In terms of the families, Dipterocarpaceae and Moraceae were the most speciose with seven and five species, respectively. The most abundant families were Euphorbiaceae, Dipterocarpaceae, and Moraceae, with 29, 28, and 21 individuals, respectively. These families are abundant in the Philippines, especially in tropical lowland evergreen forests that are dominated by dipterocarps [43]. Sadly, dipterocarps are among the most threatened plant species in the Philippines and in Southeast Asia due to deforestation, and their timbers have been massively exported in the past [44,45]. Species-wise, Macaranga stonei Whitmore was the most abundant, followed by Parashorea malaanonan (Blanco) Merr., with 24 and 9 individuals, respectively. Given that the study plots covered 9000 m2, which is 9/10 of a hectare, it is estimated that these species, M. stonei and P. malaanonan, had 26 and 10 individuals in a hectare of the study area, respectively.
The importance values computation also revealed significant findings in terms of the species composition. Eleven (11) species had individual IVs of more than 10 (Figure 3). In total, these 11 species contributed 55.50% of the total IV of all species in the area. Among them, M. stonei had the highest IV of 30.35, which is equivalent to 10.11% of the total IV of all the species recorded, followed by Parashorea malaanonan (Blanco) Merr, with 21.63 (7.21%). M. stonei’s high IV was related to its high abundance of 24, its occurrence in six plots out of all ten plots, and a total basal area of 136.73 m2. M. stonei is Aurora province-endemic and a critically endangered plant species belonging to the family Euphorbiaceae [29,32]. This keystone species lacks focus in terms of research, thus dictating the need to study this species more and include it as one of the top priorities for conservation due to it being a species restricted to the province of Aurora.
The surveyed forest was also found to be home to ecologically important species, namely, native, endemic, and threatened species (Table 3). Out of the 38 species found, 33 (86.84%) were natives, while five were exotics (with one invasive Gmelina arborea Roxb. ex Sm.). The native species were composed of 12 endemics, five IUCN threatened species, and 9 Philippine nationally threatened species. Specifically, there were one critically endangered, two endangered, and two vulnerable species found in the IUCN. Furthermore, there were two endangered, six vulnerable, and one other threatened species found in DAO 2017-11 or the Philippine Red List. The most notable among the Philippine endemic species were the IUCN critically endangered M. stonei and the IUCN vulnerable and DAO 2017-11 endangered Hopea acuminata Merr, and the IUCN endangered and DAO 2017-11 vulnerable Philippine national tree Pterocarpus indicus Willd. The presence of critically important plants in the area dictates the need for immediate action to conserve, protect, and even spread their population. It is emphasized that these species, particularly the endemics, have higher probabilities of extinction because of their narrow and restricted habitat than widespread species [46]. The native and endemic plant species also provide suitable habitats and enough food sources for native and endemic fauna species [47]. In fact, we were able to witness a couple of the Philippine endemic Luzon Rufous Hornbill (Buceros hydrocorax Linnaeus) during the survey. However, the presence of invasive species like the G. arborea adds pressure to the survival and propagation of the native and endemic flora and fauna species due to the aggressive nature of most invasive plants [48]. Actual representative photos of some critically important plant species in the area and an image of B. hydrocorax individuals are shown in Figure 4.

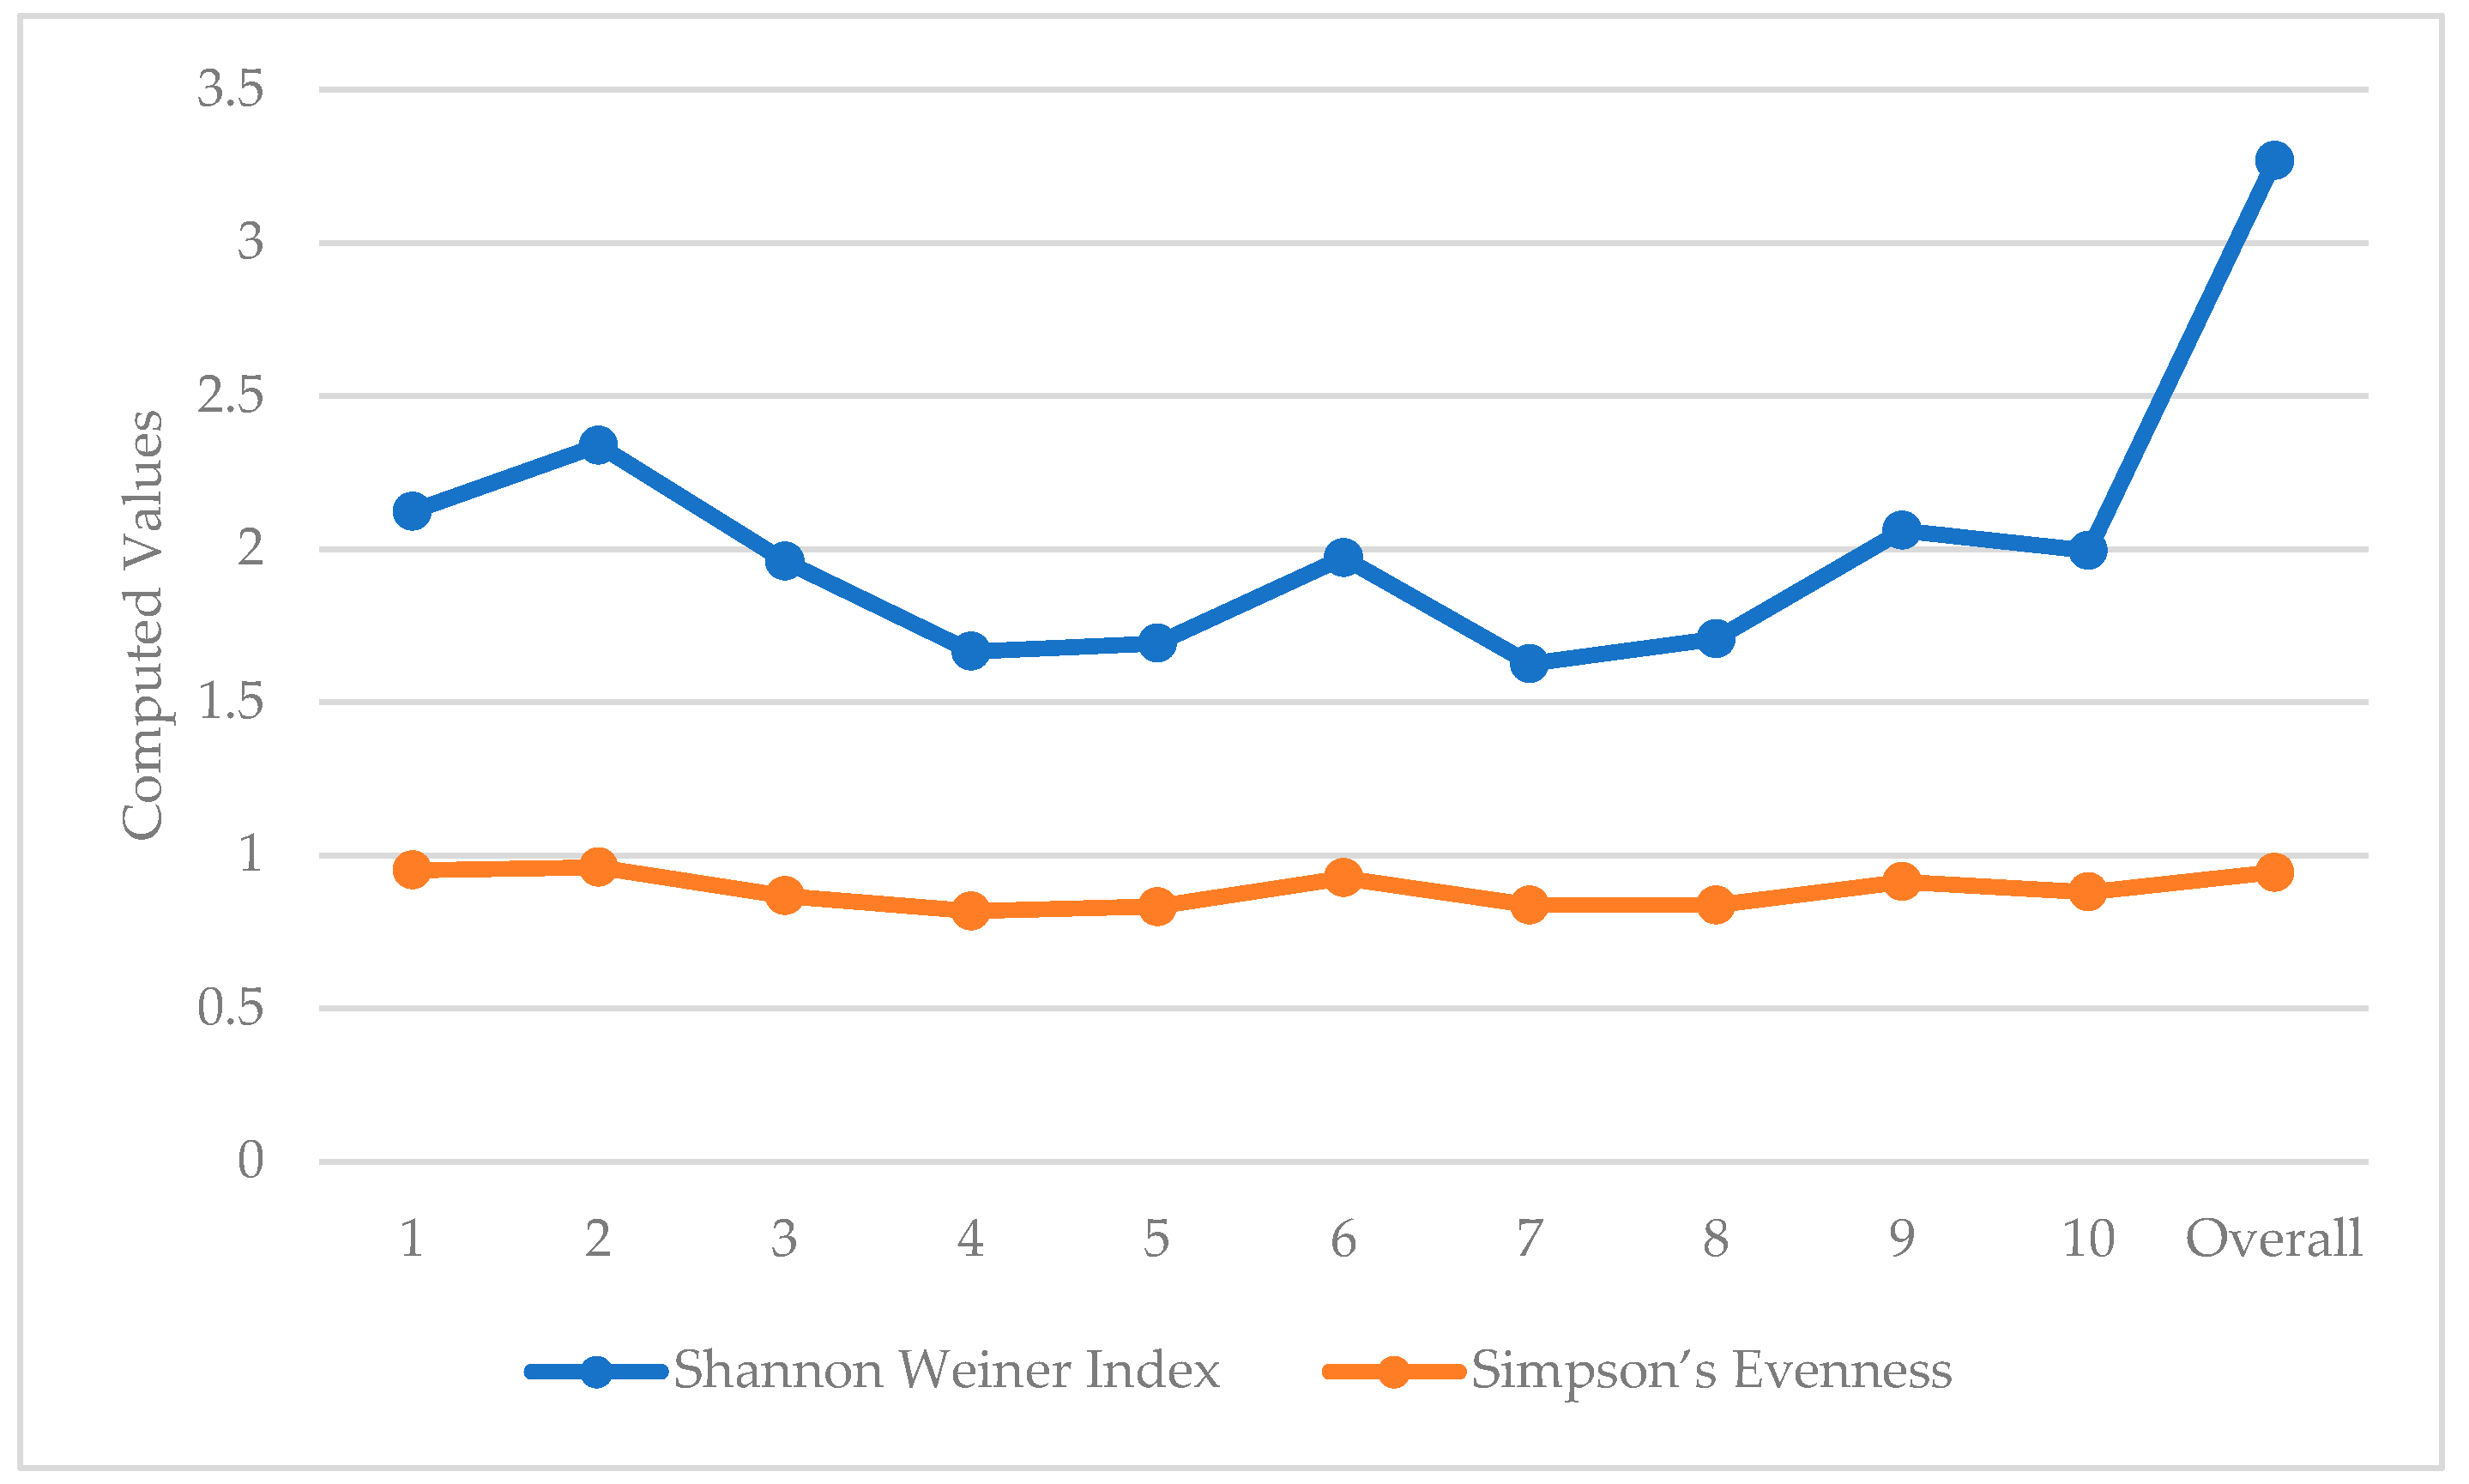
3.2. Tree Species Diversity

The diversity indices of the secondary forest in San Luis are presented in Figure 5. The Shannon–Weiner index values per quadrat ranged from 1.626 to 2.3384 and were interpreted as very low to low based on the Fernando Biodiversity Scale. In terms of Simpson’s Evenness, the values ranged from 0.8182 to 0.9619, which were interpreted as very high. Quadrat 2 had the highest diversity (H′ = 2.384 and E = 0.9619). Overall, the study area had a high Shannon–Weiner index (H′ = 3.269) and a very high Simpson’s Evenness index (E = 0.9453), which means that the trees in the area were relatively diverse and had a considerably even distribution of individuals among species. In most ecological studies in the Philippines, H′ values generally range from 1.5 to 3.5, wherein higher values dictate higher species diversity [49]. The overall H′ value of the present study falls within this range and was interpreted as high, which can possibly be attributed to the variety of native and endemic species that still thrive therewith. This is comparable with some studies undertaken in the Philippines, such as in a lowland forest in Agusan del Sur (H′ = 3.32, E = 0.52) [50], in a secondary forest in Benguet (H′ = 2.40) [49], and in a secondary forest in Pampanga (H′ = 2.2807, E = 0.8549) [51], which were all categorized as having low to moderate diversity based on the Shannon–Weiner index. Similarly, these study sites were either under the management of upland communities or near their residential or agricultural sites. In contrast, the values are lower than the studies in a private mountainous forest in Baler, Aurora (H′ = 4.096; E = 0.9735) [18], in the Quezon Protected Landscape (H′ = 3.90, E = 0.81) [52], and in the Mt. Makiling Forest Reserve (H′ = 3.50, E = 0.91) [53]. The common characteristics that possibly caused these high values were their classifications as private property, with strict monitoring and considerably high protection for the site in the first study and being classified as protected areas under the law of the second and third study sites, relating to the monitoring and protection activities of the government.

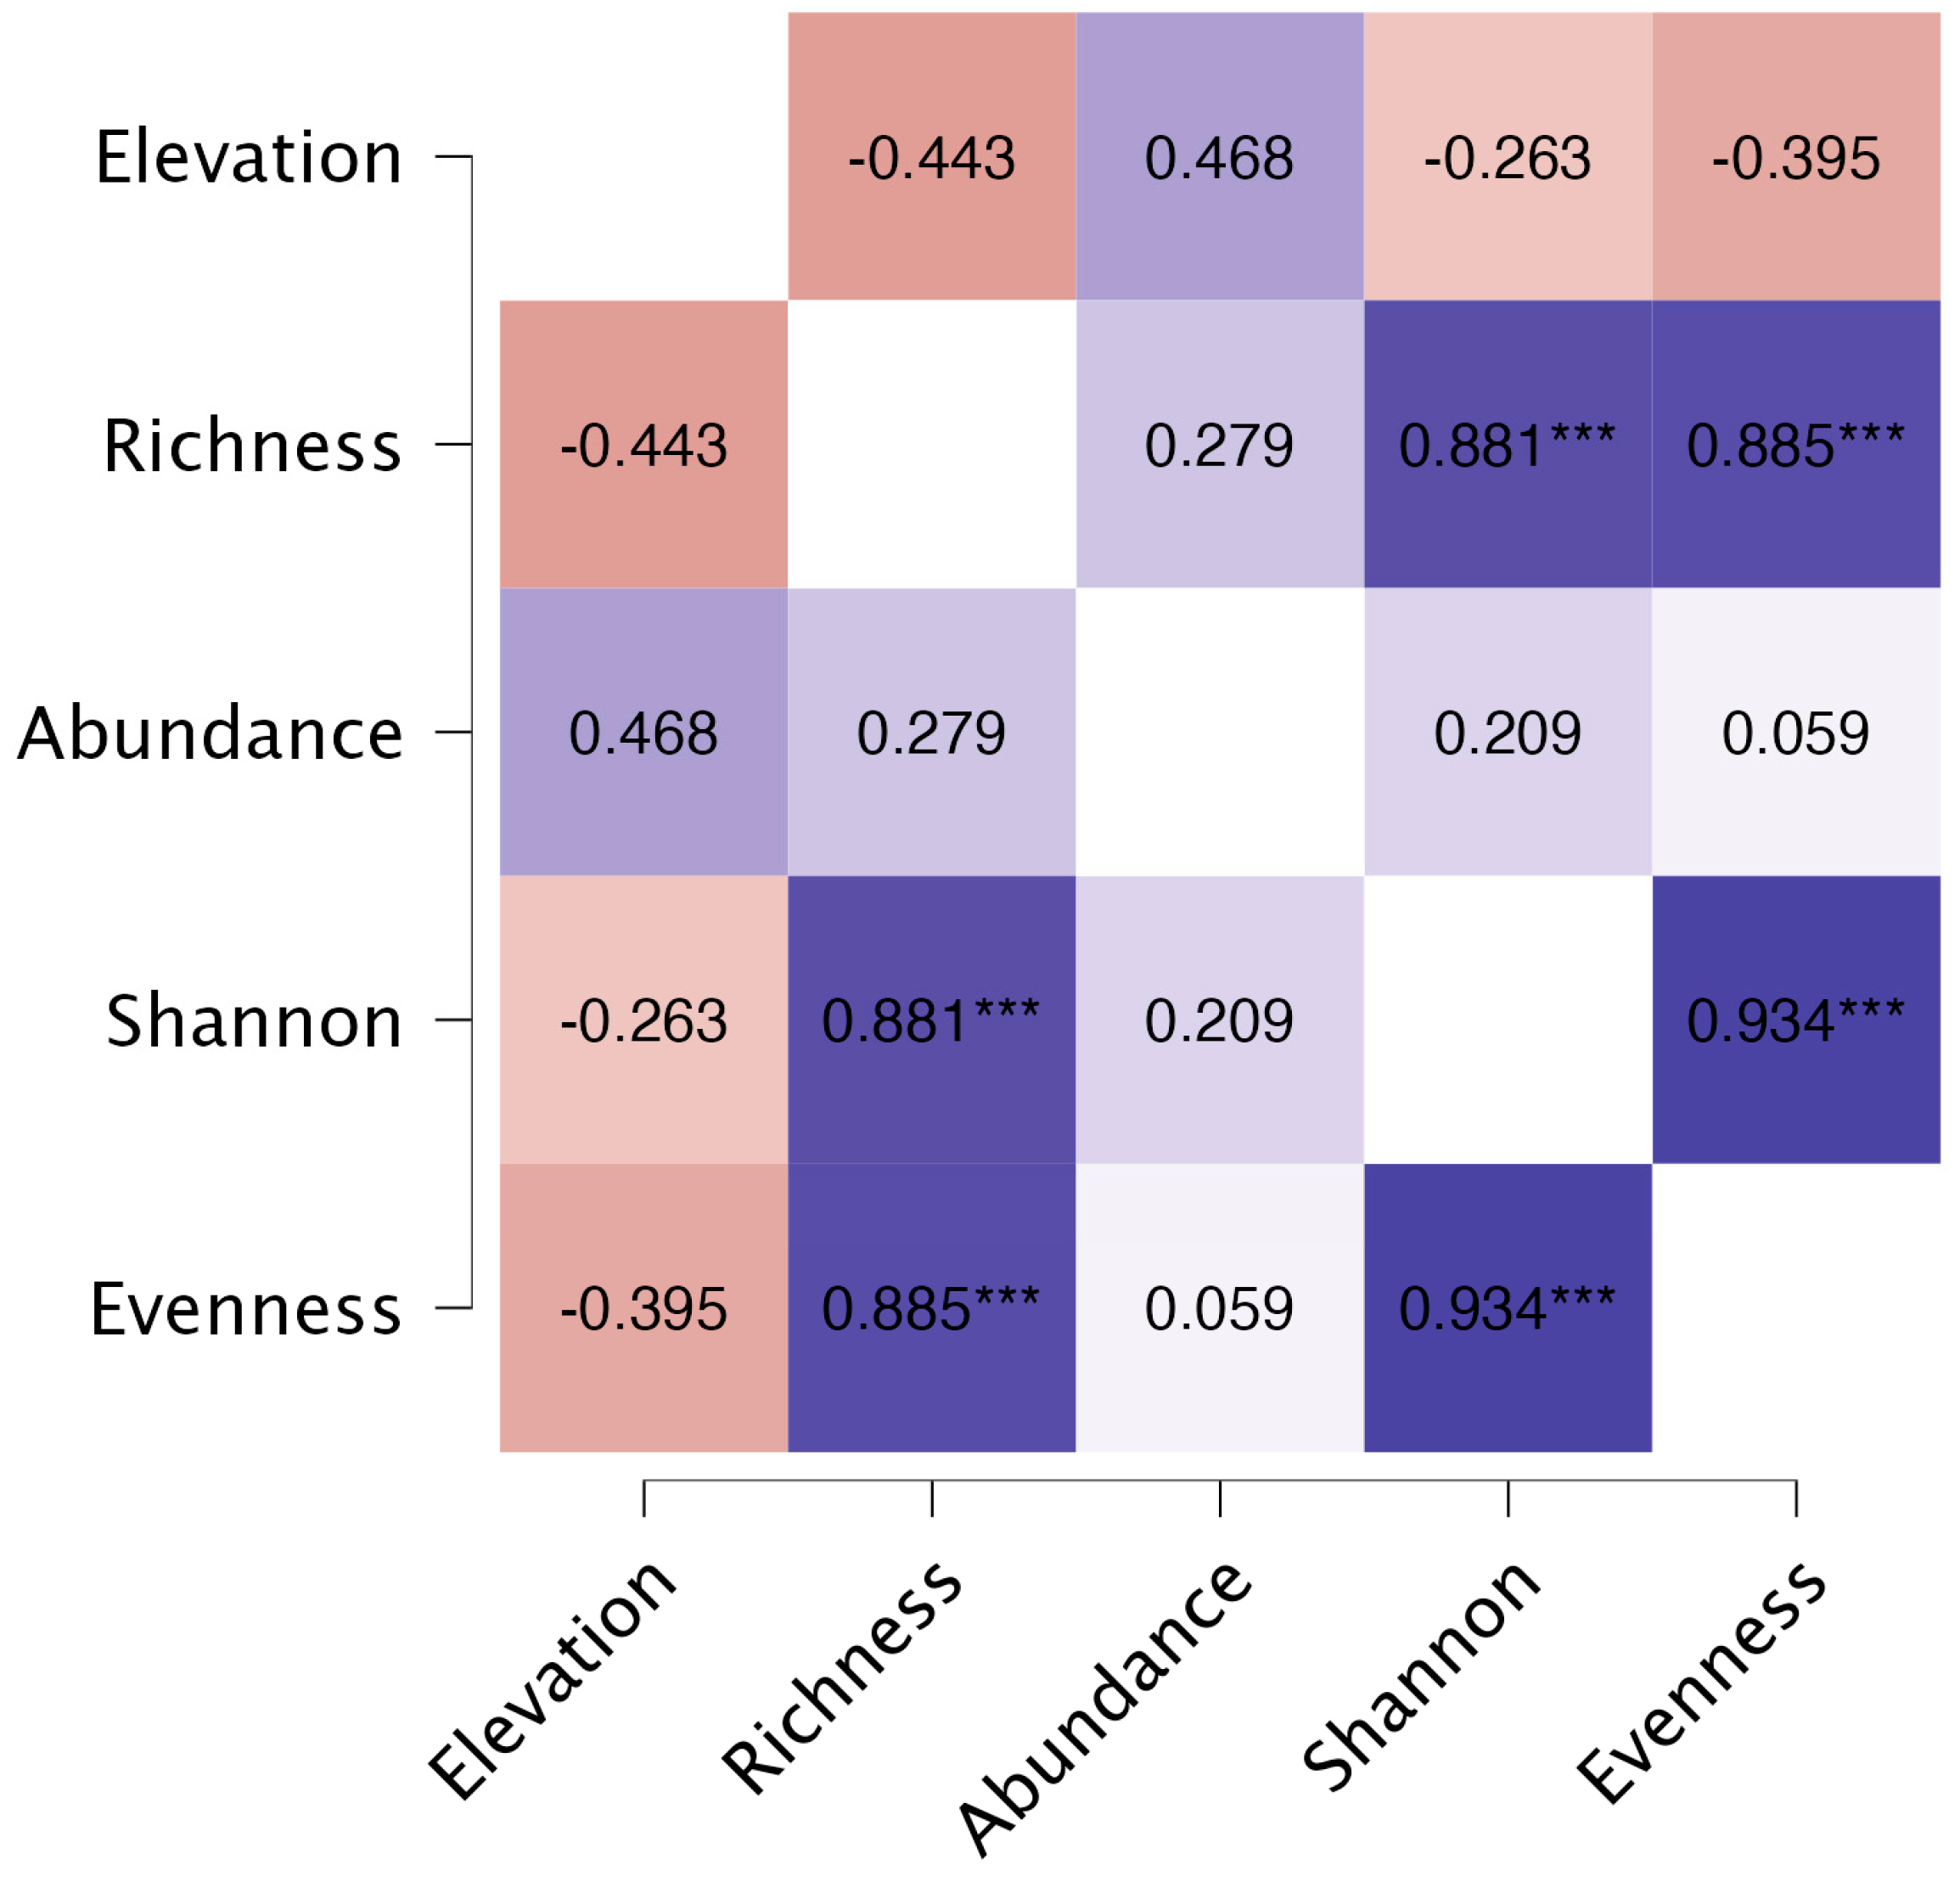
3.3. Correlation among Parameters

This study also tested the correlations among elevation, species richness, abundance, Shannon–Weiner, and Simpson’s Evenness values. As a result, significant correlational relationships were only observed for the following: (a) Species Richness and Shannon–Weiner (r = 0.881, p < 0.001); (b) Species Richness and Simpson’s Evenness (r = 0.885, p < 0.001); and (c) Simpson’s Evenness and Shannon–Weiner (r = 0.934, p < 0.001) (Figure 6). Based on the r-values, there was a strong positive correlation between species richness and Shannon–Weiner index as well as between species richness and Simpson’s Evenness, as supported by a very high significance value of p that is less than 0.001. This relationship suggests that as species richness increases, the values of the Shannon–Weiner and Simpson’s Evenness indices also tend to increase. Thus, this observation indicates that having a greater variety of species can lead to a higher diversity, as measured by using the mentioned indices. Furthermore, there was a very strong positive correlation found between the Simpson’s Evenness index and Shannon–Weiner index based on the obtained r-value, which is backed up by a very high statistical significance with p < 0.001. This indicates that as the value of Shannon–Weiner index increases, the value of Simpson’s Evenness also tends to increase. The findings are corroborated by the study of DeJong, which also found a very strong correlation among species richness, Shannon–Weiner index, and Simpson’s Evenness index, with correlation coefficients of more than 0.96 [54]. However, no significant correlational relationships were found between the following: (a) elevation and other variables, and (b) abundance and other variables. A similar finding was found in a study at a mountain range in Southern Mindano, suggesting that elevation did not greatly affect biodiversity parameters such as the diversity indices [55]. In essence, these results are beneficial in understanding the dynamics of an ecosystem, which can be the foundation for implementing management and rehabilitation strategies in different areas within the study site with the goal of improving biodiversity.

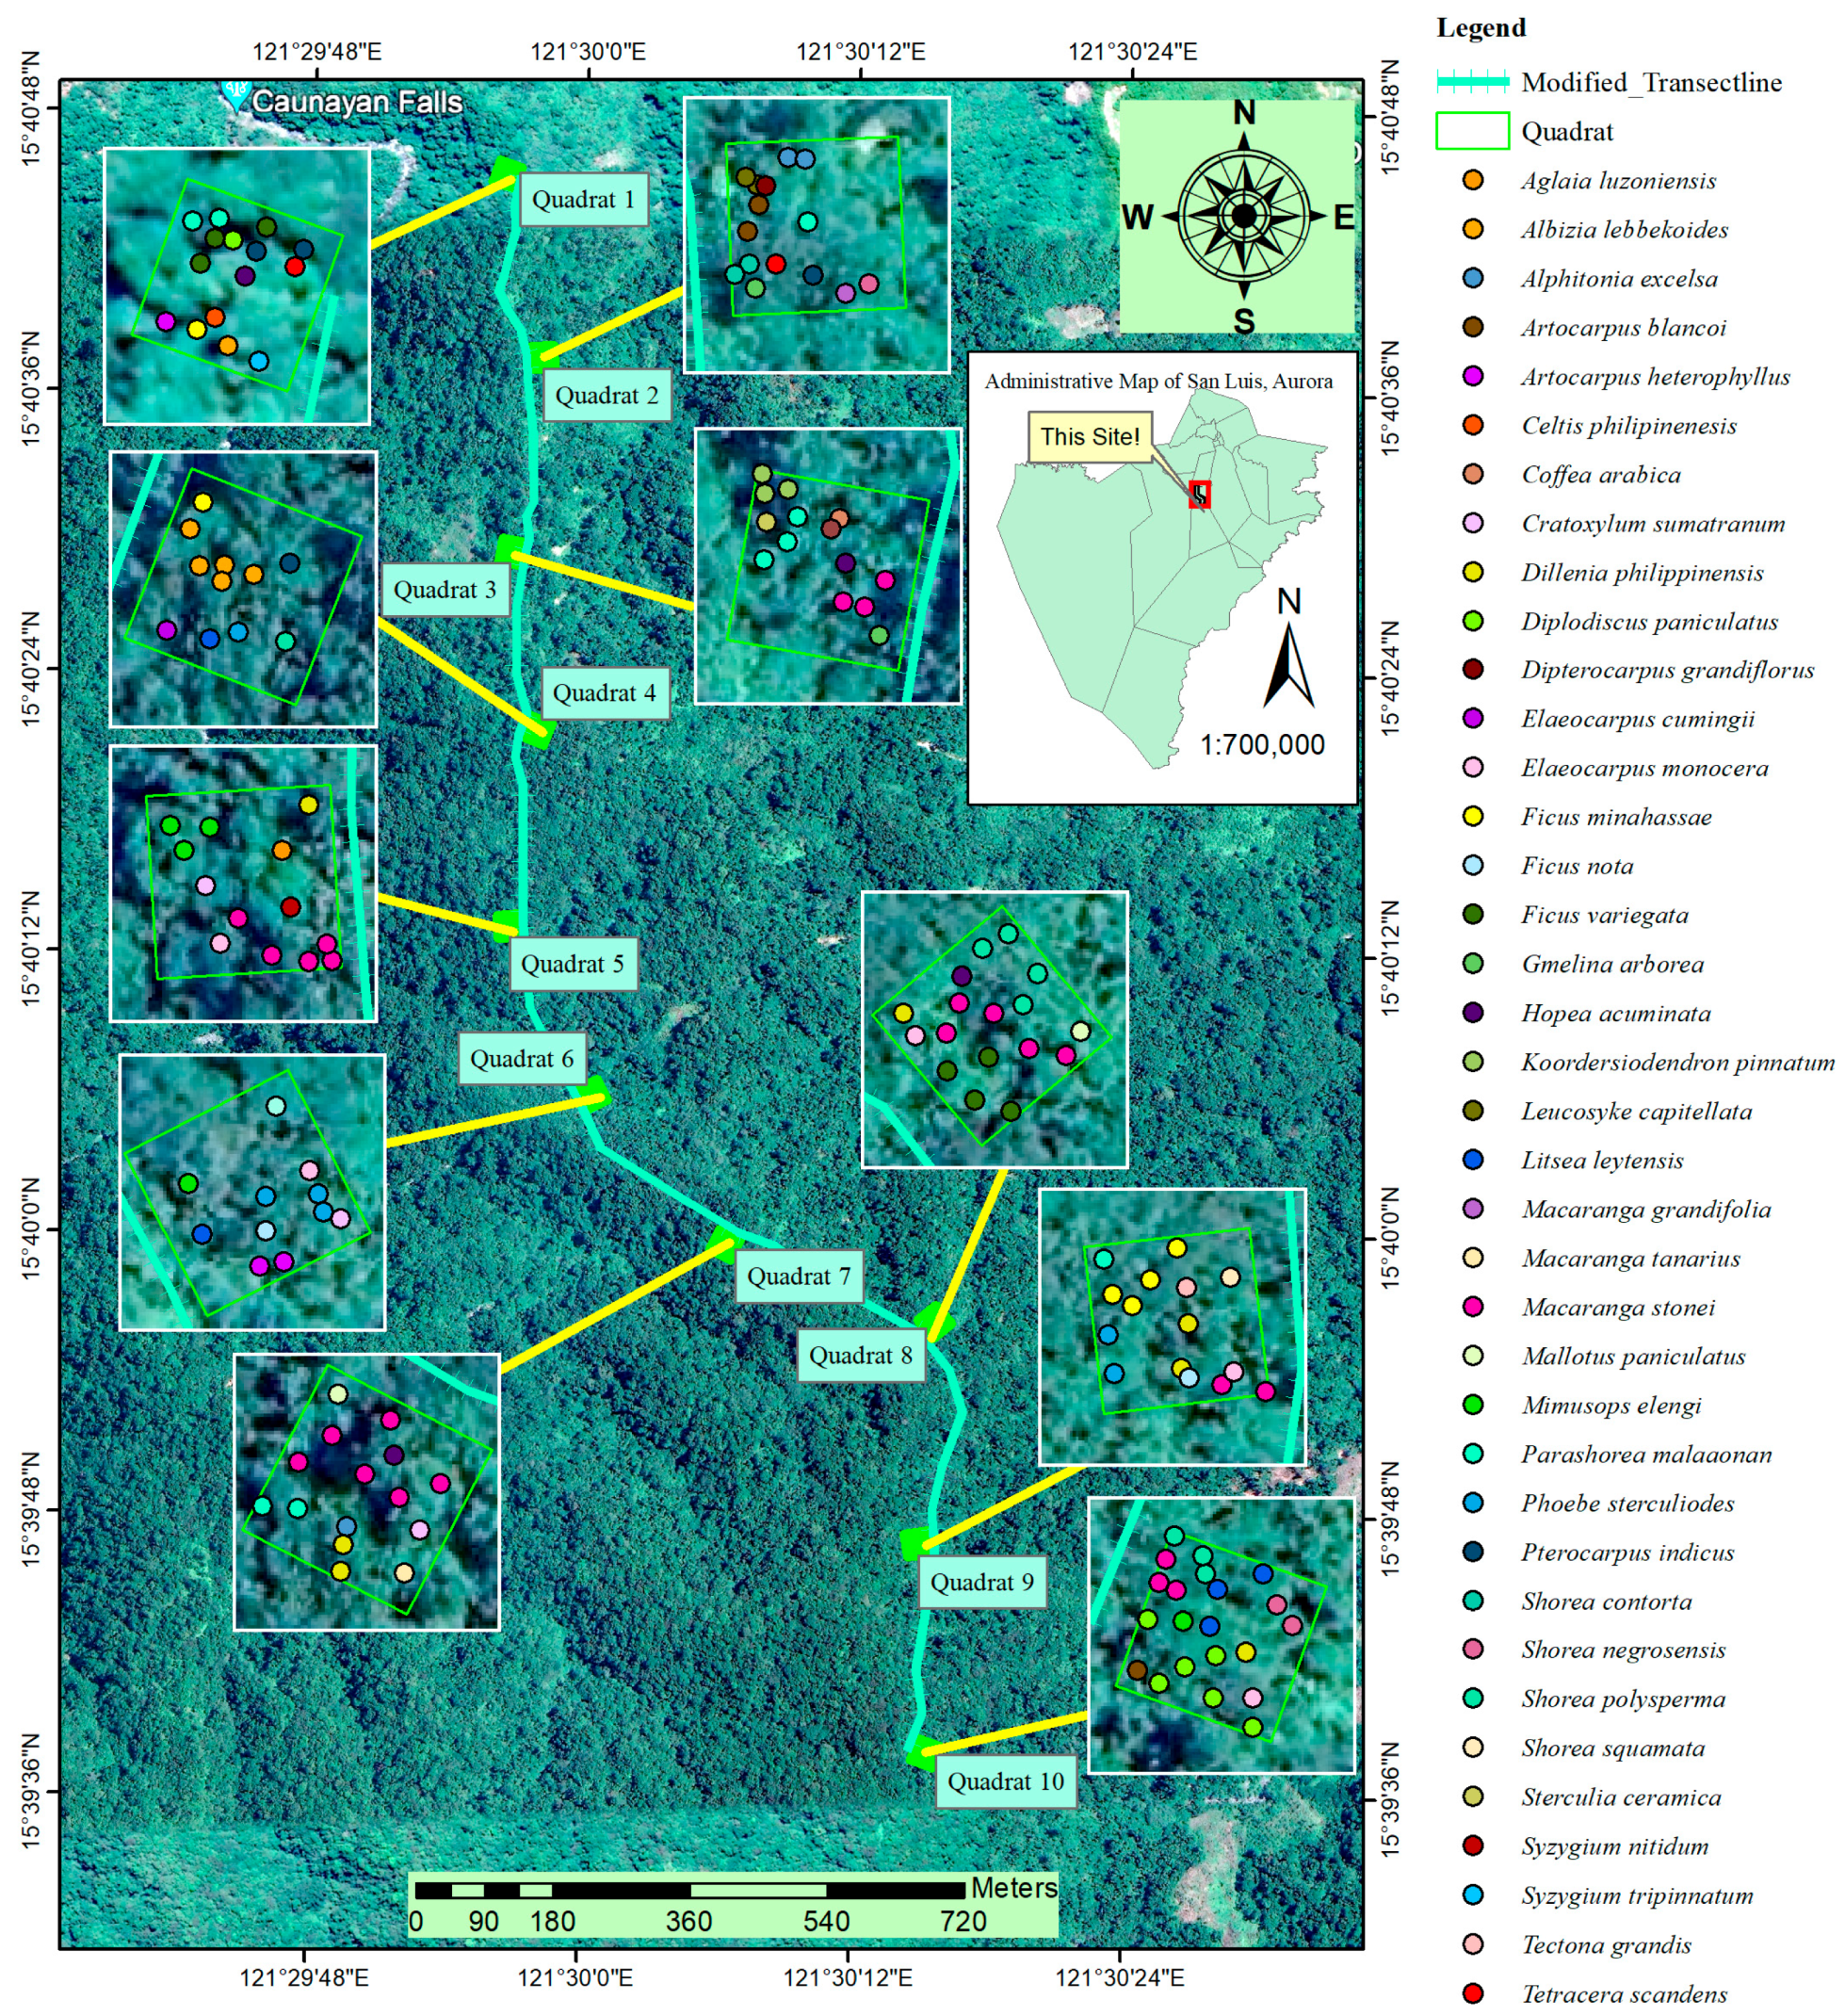
3.4. Spatial Distribution of Trees

Figure 7 shows the spatial distribution of trees across the sampling plots in the secondary forest of San Luis in Aurora, Philippines. This map shows the position of the transect line and the approximate location of each individual tree, represented by colored dots (legend placed on the right-hand side), based on the recorded coordinates. As observed in the map, the plots were zoomed in to show the locations of the trees more clearly. We can also see in the background of the zoomed image of the plots the actual image of the forest cover in the area, as reflected in the base map used. Mapping the spatial distribution of trees is a crucial element in devising strategies for the sustainable management and conservation of natural resources [56]. For instance, locating the trees can help us identify areas with possible sources of mother trees of the targeted species that we aim to propagate [57]. For example, if we are looking for a source of planting materials for a high-priority species such as M. stonei, which is a very important species in the area due to the fact that it is an endemic and critically endangered species, we can refer to the map and see that it can be seen in plots 3, 5, 7, 8, 9, and 10. Furthermore, distribution maps can visually present areas needing attention and immediate measures, such as in the case of our study, the presence of invasive G. arborea that poses a threat to the native biodiversity. Knowing the location of its recorded individuals (present in plots 2 and 3) will allow the forest managers to perform targeted measures in managing specific portions of the area where invasion issues arise [48]. Lastly, we can identify micro-biodiversity hotspots among the sampling plots in the study area by determining the number of critically important species [58].

3.5. Research Limitations

This study provides valuable insights into the composition and diversity of tree species in the San Luis area of the SMMR. However, certain limitations were acknowledged. The research scope was limited to a short duration, and only a specific portion of the secondary forests of San Luis, Aurora, were covered by the transect, where variations in topography, exposure, and elevations, as well as forest dynamics, were not fully explored. Thus, these issues limit the generalizability of the findings in terms of larger ecosystems and dictate the need for long-term monitoring and the eventual establishment of a protected area. Furthermore, tree species were the only life forms included in the study, opening the door for a more comprehensive assessment of other biodiversity components, such as understorey and ground vegetation, wildlife, and soil characteristics, which were beyond the scope of this study. These limitations are crucial in interpreting the results to guide future research directions and in planning a holistic and more effective biodiversity management and conservation.

4. Conclusions and Implications

This study yielded valuable findings and insights regarding the species composition and diversity of a secondary forest in San Luis, Aurora. Overall, the area had a relatively high diversity and significant conservation, as signified by the recorded 148 individuals of 38 morphospecies belonging to 20 families and 28 genera, with 33 natives, 12 endemics, five IUCN threatened, and nine Philippine threatened species. Furthermore, diversity was found to be high in terms of the Shannon–Weiner index (H′ = 3.269) and very high in terms of the Simpson’s Evenness index (E = 0.9453). Significant correlational relationships were also found among species richness, Shannon–Weiner index, and Simpson’s Evenness index. Lastly, individual trees were mapped to serve as a guide for targeted conservation measures. These findings are critical in the following applications for the conservation of native, endemic, and threatened species:
  • The presence of many native, endemic, and threatened species underscores the immediate need to prioritize the conservation of these species through the aid of the map produced in locating the micro-biodiversity hotspots in the area. Furthermore, many endemic species lack scientific studies, highlighting the need to conduct focused studies to explore the ecology and distribution of these critically important species. Furthermore, this can serve as a basis for the Department of Environment and Natural Resources to include the forest as one of the high conservation priorities or to expand protected areas to cover the area surveyed.
  • The relatively high diversity values and even distribution of plants calculated for the area somehow indicate a relatively healthy ecosystem. Thus, this underscores the need for intensified law enforcement to protect the remaining forests that serve as habitats for native and endemic wildlife, such as Buceros hydrocorax Linnaeus.
  • The presence of introduced and invasive species such as Gmelina arborea Roxb. poses a very significant threat to local native biodiversity. Targeted and participatory invasive species management is needed to control and eventually eradicate the impact of invasive plants in the ecosystem.
  • All the implications and conservation strategies discussed above will need the participation of locals and other stakeholders due to the fact that the area is adjacent to residential communities. Thus, information and educational campaigns, as well as a participatory approach in implementing conservation strategies, are ideal tools to ensure more effective biodiversity conservation and protection.

Funding

This research received no external funding.

Institutional Review Board Statement

Not applicable.

Data Availability Statement

Dataset available on request from the authors.

Acknowledgments

The author would like to thank the following individual for their great contributions to this work: Diomedes Llait, Diadema Llait, Cherie Win L. Sanchez, and John Paul Llait for financial and moral guidance. The author would also like to extend gratitude to the faculty of the Department of Forestry, Tarlac Agricultural University, Christian Arvin M. Arce and Mark Anthony L. Bagsit for their assistance when conducting the research. The author also greatly appreciated the Local Government Unit of Barangay L. Pimentel, San Luis, Aurora for allowing the research to be conducted in their vicinity. Finally, a sincere thanks is given to the faculty of the School of Graduate Studies of Aurora State College of Technology, especially Mary Jane Aragon-Marigmen, RB Gallego, Michelle Resueño, Jay Amon, Maria Cristina Cañada, and Afed Daiwey, for their untiring support and advise.

Conflicts of Interest

The author declares no conflicts of interest.

References

  1. Vidallon, S.L.; Arriola, A.H. A preliminary checklist of Rubiaceae in Mt. Mariveles, Bataan, Philippines. Biodiversity 2023, 24, 1–10. [Google Scholar] [CrossRef]
  2. Davids, S.; Mavumengwana, Z. Stocktaking SA’s natural treasures. Veld Flora 2020, 106, 34–37. [Google Scholar]
  3. Li, F.; Altermatt, F.; Yang, J.; An, S.; Li, A.; Zhang, X. Human activities’ fingerprint on multitrophic biodiversity and ecosystem functions across a major river catchment in China. Glob. Change Biol. 2020, 26, 6867–6879. [Google Scholar] [CrossRef] [PubMed]
  4. Ansari, N.A.; Agus, C.; Nunoo, E.K. Foundations of ‘SDG15–LIFE on Land’: Earth, Forests and Biodiversity. In SDG15–Life on Land: Towards Effective Biodiversity Management; Emerald Publishing Limited: Bingley, UK, 2021; pp. 7–48. [Google Scholar]
  5. Sahu, D.; Sahu, J.K.; Kumar, V.; Gupta, P. Role of Floriculture in Promoting Biodiversity and Enhancing Ecosystems: A Comprehensive Review. Int. J. Environ. Clim. Change 2023, 13, 2077–2084. [Google Scholar] [CrossRef]
  6. Keybondori, S.; Abdi, E.; Deljouei, A.; Lázaro-Lobo, A.; Ervin, G.N.; Shakeri, Z.; Etemad, V.; Borz, S.A. Effect of forest roadside on vegetation characteristics in the Hyrcanian temperate forest. Eur. J. For. Res. 2023, 142, 455–473. [Google Scholar] [CrossRef]
  7. Sefidi, K.; Copenheaver, C.A.; Sadeghi, S.M.M. Anthropogenic pressures decrease structural complexity in Caucasian forests of Iran. Écoscience 2022, 29, 199–209. [Google Scholar] [CrossRef]
  8. Caro, T.; Rowe, Z.; Berger, J.; Wholey, P.; Dobson, A. An inconvenient misconception: Climate change is not the principal driver of biodiversity loss. Conserv. Lett. 2022, 15, e12868. [Google Scholar] [CrossRef]
  9. Jepson, P.; Canney, S. Biodiversity hotspots: Hot for what? Glob. Ecol. Biogeogr. 2001, 10, 225–227. [Google Scholar] [CrossRef]
  10. Cunningham, C.; Beazley, K.F. Changes in human population density and protected areas in terrestrial global biodiversity hotspots, 1995–2015. Land 2018, 7, 136. [Google Scholar] [CrossRef]
  11. Hind, E.J.; Hiponia, M.C.; Gray, T.S. From community-based to centralised national management—A wrong turning for the governance of the marine protected area in Apo Island, Philippines? Mar. Policy 2010, 34, 54–62. [Google Scholar] [CrossRef]
  12. Gregorio, N.; Herbohn, J.; Harrison, S.; Pasa, A.; Ferraren, A. Regulating the quality of seedlings for forest restoration: Lessons from the National Greening Program in the Philippines. Small-Scale For. 2017, 16, 83–102. [Google Scholar] [CrossRef]
  13. Lasco, R.D.; Pulhin, J.M. Environmental impacts of community-based forest management in the Philippines. Int. J. Environ. Sustain. Dev. 2006, 5, 46–56. [Google Scholar] [CrossRef]
  14. Catibog-Sinha, C. Biodiversity conservation and sustainable tourism: Philippine initiatives. J. Herit. Tour. 2010, 5, 297–309. [Google Scholar] [CrossRef]
  15. Mangaoang, E.O.; Pasa, A.E. Preferred native tree species for smallholder forestry in Leyte. Ann. Trop. Res. 2003, 25, 25–30. [Google Scholar]
  16. Navarrete, I.A.; Peque, D.P.; Macabuhay, M.D. Soil information as a reforestation decision-making tool and its implication for forest management in the Philippines. In Environmental Resources Use and Challenges in Contemporary Southeast Asia: Tropical Ecosystems in Transition; Springer: Berlin/Heidelberg, Germany, 2018; pp. 97–116. [Google Scholar]
  17. Appiah, M. Tree population inventory, diversity and degradation analysis of a tropical dry deciduous forest in Afram Plains, Ghana. For. Ecol. Manag. 2013, 295, 145–154. [Google Scholar] [CrossRef]
  18. Coracero, E.E.; Malabrigo, P., Jr. Carbon storage potential of the tree species along the ultramafic forest in Sitio Dicasalarin, Barangay Zabali, Baler, Aurora, Philippines. AIMS Environ. Sci. 2020, 7, 589–601. [Google Scholar] [CrossRef]
  19. Forest Foundation Philippines. Sierra Madre Mountain Range: Backbone of Luzon. 2022. Available online: https://www.forestfoundation.ph/wp-content/uploads/2022/04/Sierra-Madre-Mountain-Range_Landscape-Profile.pdf (accessed on 2 July 2023).
  20. Coracero, E.E.; Malabrigo, P.L., Jr. Diversity Assessment of Tree Species in Sitio Dicasalarin, Barangay Zabali, Baler, Aurora, Philippines. Open J. Ecol. 2020, 10, 717–728. [Google Scholar] [CrossRef]
  21. Bambalan, J.M.; Palapal, I.K.S.; Guleng, R.V.; Coracero, E.E.; Gallego, R.J.; Suniega, M.J.S. Tree diversity and carbon stock in North Poblacion and South Poblacion (Dipaculao, Aurora, Philippines). Theor. Appl. Ecol. 2022, 2, 198–208. [Google Scholar] [CrossRef]
  22. Balberona, A.N.; Noveno, J.J.; Angeles, M.G.B.; Santos, R.I.; Cachin, E.J.D.J.; Cruz, K.G.J. Ethnomedicinal plants utilized by the ilongot-eǵongot community of Bayanihan, Maria Aurora, Aurora, Philippines. Int. J. Agric. Technol. 2018, 14, 145–159. [Google Scholar]
  23. Barrogo, K.N.; Delos Santos, M.P.; Montes, A.A.T.; Quiben, A.D.; Rotaquio, E.L., Jr.; Valete, E.J.P. Fern and fern allies as non-timber forest product in Baler, Aurora, Philippines. Int. J. Agric. Technol. 2021, 17, 423–432. [Google Scholar]
  24. Coracero, E.E.; Malabrigo, P.J.L.; Bambalan, J.M.; Palapal, I.K.S.; Guleng, R.V.; Gallego, R.J.; Suniega, M.J.A. Diversity, Species Composition, and Carbon Stock Assessment of Trees in Aurora, Philippines: Variations between Preserved and Developed Ecosystems. Environ. Sci. Proc. 2022, 22, 29. [Google Scholar]
  25. World Weather Online. San Luis Annual Weather Averages. 2023. Available online: https://www.worldweatheronline.com/san-luis-weather-averages/aurora/ph.aspx (accessed on 5 July 2023).
  26. USDA. Multiparty Monitoring and Assessment Guidelines for Community Based Forest Restoration in Southwestern Ponderosa Pine Forests; US Department of Agriculture, Forest Service, Southwestern Region: Washington, DC, USA, 2003; 94p.
  27. Coritico, F.P.; Lagunday, N.E.; Galindon, J.M.M.; Tandang, D.N.; Amoroso, V.B. Diversity of trees and structure of forest habitat types in Mt. Tago Range, Mindanao, Philippines. Philipp. J. Syst. Biol. 2020, 14, 1–11. [Google Scholar]
  28. Malabrigo, P.; Tobias, A.; Eduarte, G.; Terbio, L.; Hernandez, J.; Umali, A.G. Tree diversity and stand structure of a 2-hectare Permanent Biodiversity Monitoring Area (PBMA) in Mts. Iglit-Baco National Park, Mindoro Island, Philippines. Ecosyst. Dev. J. 2022, 12, 83–94. [Google Scholar]
  29. Pelser, P.B.; Barcelona, J.F.; Nickrent, D.L. Co’s Digital Flora of the Philippines. (2011 Onwards). Available online: http://www.Philippineplants.org (accessed on 1 May 2023).
  30. Rojo, J.P. Revised Lexicon of Philippine Trees; Forest Products Research and Development Institute, Department of Science and Technology: Laguna, Philippines, 1999. [Google Scholar]
  31. POWO. Plants of the World Online. 2023. Available online: https://powo.science.kew.org/ (accessed on 2 July 2023).
  32. IUCN. The IUCN Red List of Threatened Species. 2023. Available online: https://www.iucnredlist.org (accessed on 2 July 2023).
  33. DENR. DAO 2017-11; Department of Environment and Natural Resources: Quezon City, Philippines, 2017.
  34. Fox, S.; Stefánsson, H.; Peternell, M.; Zlotskiy, E.; Ásbjörnsson, E.J.; Sturkell, E.; Wanner, P.; Konrad-Schmolke, M. Physical characteristics of microplastic particles and potential for global atmospheric transport: A meta-analysis. Environ. Pollut. 2023, 342, 122938. [Google Scholar] [CrossRef] [PubMed]
  35. He, F.; Gaston, K.J. Estimating species abundance from occurrence. Am. Nat. 2000, 156, 553–559. [Google Scholar] [CrossRef]
  36. Chao, A.; Chiu, C.H. Species richness: Estimation and comparison. Wiley StatsRef Stat. Ref. Online 2016, 1, 26. [Google Scholar]
  37. Ismail, M.H.; Zaki, P.H.; Fuad, M.F.A.; Jemali, N.J.N. Analysis of importance value index of unlogged and logged peat swamp forest in Nenasi Forest Reserve, Peninsular Malaysia. Int. J. Bonorowo Wetl. 2017, 7, 74–78. [Google Scholar] [CrossRef]
  38. Hernandez, J.; Umali, A.G.; Malabrigo, P. Floristic diversity assessment of Caramoan National Park, Camarines Sur, Philippines. Ecosyst. Dev. J. 2021, 11, 73–81. [Google Scholar]
  39. Daly, A.J.; Baetens, J.M.; De Baets, B. Ecological diversity: Measuring the unmeasurable. Mathematics 2018, 6, 119. [Google Scholar] [CrossRef]
  40. Pampolina, N.M.; Coracero, E.E.; Eco, K.O.; Tingson, K.N. Floristic Composition, Diversity, and Ecology for Conservation of Lower Agno Watershed Forest Reserve, Mountain Province, Philippines. Asian J. Biodivers. 2022, 13, 1–23. [Google Scholar]
  41. De Villa, K.R.; Lagat, R.D. Species Diversity and Habitat Association of Ferns and Lycophytes in Mts. Palay-Palay Mataas na Gulod Protected Landscape. In Plant Diversity in Biocultural Landscapes; Springer Nature Singapore: Singapore, 2023; pp. 135–161. [Google Scholar]
  42. Schober, P.; Boer, C.; Schwarte, L.A. Correlation coefficients: Appropriate use and interpretation. Anesth. Analg. 2018, 126, 1763–1768. [Google Scholar] [CrossRef] [PubMed]
  43. Salvaña, F.R.P.; Lopez, C.K.C.; Mangaoang, C.C.; Bretaña, B.L.P. Diversity and community structure of trees in two forest types in Mt. Apo Natural Park (MANP), Philippines. Biodivers. J. Biol. Divers. 2019, 20, 1794–1801. [Google Scholar] [CrossRef]
  44. Langenberger, G. Habitat distribution of dipterocarp species in the Leyte Cordillera: An indicator for species—Site suitability in local reforestation programs. Ann. For. Sci. 2006, 63, 149–156. [Google Scholar] [CrossRef]
  45. Pang, S.E.; De Alban, J.D.T.; Webb, E.L. Effects of climate change and land cover on the distributions of a critical tree family in the Philippines. Sci. Rep. 2021, 11, 276. [Google Scholar] [CrossRef] [PubMed]
  46. Volis, S.; Belolipov, I.V.; Asatulloev, T.; Turgunov, M. Role of endemism and other factors in determining the introduction success of rare and threatened species in Tashkent Botanical Garden. J. Zool. Bot. Gard. 2023, 4, 325–334. [Google Scholar] [CrossRef]
  47. Manchester, S.J.; Bullock, J.M. The impacts of non-native species on UK biodiversity and the effectiveness of control. J. Appl. Ecol. 2000, 37, 845–864. [Google Scholar] [CrossRef]
  48. Coracero, E.E. Distribution and Management of the Invasive Swietenia macrophylla King (Meliaceae) at the Foot of a Protected Area in Luzon Island, Philippines. J. Zool. Bot. Gard. 2023, 4, 637–647. [Google Scholar] [CrossRef]
  49. Batani, R.S.; Basbas, A.V., Jr.; Loncio, R.S.; Napaldet, J.T. Floral diversity in a secondary forest managed by indigenous community: The case of Mt. Kili-kili in Benguet, Cordillera Central Range, Northern Philippines. Biodiversity 2023, 24, 212–230. [Google Scholar] [CrossRef]
  50. Lleno, J.V.; Ligalig, R.J.; Sarmiento, R.T.; Along, A.A. Tree diversity, composition, and stand structure of lowland tropical forest in Prosperidad, Agusan del Sur, Philippines. J. Surv. Fish. Sci. 2023, 10, 4810–4830. [Google Scholar]
  51. Mancera, J.P.; Ragragio, E.M.; Su, G.L.S.; Rubite, R.R. Plant community structure of a secondary forest at Barangay Camias, Porac, Pampanga, The Philippines. Philipp. J. Sci. 2013, 142, 135–143. [Google Scholar]
  52. Carig, E.T.; Manuel, R.P. Tree Diversity and Timber Resources Assessment in Secondary Forests of Quirino Forest Landscape Project, Philippines. Asian J. Biodivers. 2021, 12, 36–54. [Google Scholar] [CrossRef]
  53. Castillo, M.L.; Castillo, L.A.; Canceran, M.S.; Gonzalvo, K.J.P.; Barua, L.D.; Alegre, A.C.; Barredo-Parducho, V.O.; Gestiada, E.; Breva, R.; Bantayan, N.C. Distribution, diversity and spatial analysis of tree species in a long-term ecological research plot in Molawin-Dampalit Watershed, Mount Makiling Forest Reserve. Asian J. Biodivers. 2018, 9, 12–36. [Google Scholar] [CrossRef]
  54. DeJong, T.M. A comparison of three diversity indices based on their components of richness and evenness. Oikos 1975, 26, 222–227. [Google Scholar] [CrossRef]
  55. Gevaña, D.; Pollisco, J.P.; Pampolina, N.; Kim, D.; Im, S. Plant diversity and aboveground carbon stock along altitudinal gradients in Quezon Mountain Range in Southern Mindanao, Philippines. J. Environ. Sci. Manag. 2013, 16, 20–28. [Google Scholar] [CrossRef]
  56. Pu, R. Mapping tree species using advanced remote sensing technologies: A state-of-the-art review and perspective. J. Remote Sens. 2021, 2021, 9812624. [Google Scholar] [CrossRef]
  57. Engay-Gutierrez, K.; Dimailig, E.; Yacon, J. Plus and Mother Trees in Mt. Banahaw de Lucban, Quezon, Philippines. J. Environ. Sci. Manag. 2022, 25, 33–48. [Google Scholar] [CrossRef]
  58. Harris, G.M.; Jenkins, C.N.; Pimm, S.L. Refining biodiversity conservation priorities. Conserv. Biol. 2005, 19, 1957–1968. [Google Scholar] [CrossRef]
Figure 1. Location map of the study site in San Luis, Aurora: (A) study site pointed in the Philippine map, (B) location of the site pointed in the map of San Luis, Aurora, (C) elevation map of Barangay L. Pimentel showing the location of modified transect.
Jzbg 05 00004 g001
Figure 2. Arrangement of quadrats along the transect line.
Jzbg 05 00004 g002
Figure 3. Top eleven species with highest importance values (IVs).
Jzbg 05 00004 g003
Figure 4. Representative photos of critically important species in the area. (A) Macaranga stonei Whitmore (endemic, IUCN critically endangered), (B) Dillenia philippinensis Rolfe (endemic, IUCN near threatened), (C) Shorea polysperma (Blanco) Merr. (endemic, DAO 2017-11 vulnerable), (D) Shorea contorta Vidal (endemic, DAO 2017-11 vulnerable), (E) a couple of Buceros hydrocorax Linnaeus (endemic, IUCN vulnerable, Philippine Red List endangered).
Jzbg 05 00004 g004
Figure 5. Computed diversity indices per quadrat and for the entire survey area.
Jzbg 05 00004 g005
Figure 6. Heatmap of Pearson’s r correlation among elevation and biodiversity parameters (*** p < 0.001).
Jzbg 05 00004 g006
Figure 7. Distribution map of all trees across sampling plots in the secondary forests of San Luis, Aurora.
Jzbg 05 00004 g007
Table 1. Fernando Biodiversity Scale.
InterpretationShannon–WeinerSimpson’s Evenness
Very high3.5 and above0.75–100
High3.0–3.490.5–0.74
Moderate2.5–2.990.25–0.49
Low2.0–2.490.15–0.24
Very Low1.9 and below0.05–0.14
Table 2. Conventional approach in interpreting correlation coefficient [42].
Absolute Value of rInterpretation
0–0.09Negligible correlation
0.10–0.39Weak correlation
0.40–0.69Moderate correlation
0.70–0.89Strong correlation
0.90–1.0Very strong correlation
Table 3. Taxonomic list of native species recorded with their corresponding endemism and conservation statuses.
FamilySpeciesEndemism 1Conservation Status 2
IUCN Red ListDAO 2017-11
AnacardiaceaeKoordersiodendron pinnatum (Blanco) Merr.NENDOTS
BrownlowiaceaeDiplodiscus paniculatus Turcz.PELCND
CannabaceaeCeltis philippensis BlancoNELCND
DilleniaceaeDillenia philippinensis RolfePENTND
DilleniaceaeTetracera scandens (Linn.) Merr.NENDND
DipterocarpaceaeDipterocarpus grandiflorus (Blanco)NEENVU
DipterocarpaceaeHopea acuminata Merr.PEVUEN
DipterocarpaceaeParashorea malaanonan (Blanco) Merr.NELCND
DipterocarpaceaeShorea contorta VidalPELCVU
DipterocarpaceaeShorea negrosensis Foxw.PELCVU
DipterocarpaceaeShorea polysperma (Blanco) Merr.PELCVU
DipterocarpaceaeShorea squamata (Turcz.) Benth. & Hook.PELCND
ElaeocarpaceaeElaeocarpus cumingii Turcz.NELCND
ElaeocarpaceaeElaeocarpus monocera Cav.PENDND
EuphorbiaceaeMacaranga grandifolia (Blanco) Merr.NEVUND
EuphorbiaceaeMacaranga stonei WhitmorePECRND
EuphorbiaceaeMacaranga tanarius (L.) Muell. Arg.NELCND
EuphorbiaceaeMallotus paniculatus (Lam.) Müll. Arg.NELCND
FabaceaeAlbizia lebbekoides (DC.) Benth.NELCND
FabaceaePterocarpus indicus Willd.NEENVU
HypericaceaeCratoxylum sumatranum BlumeNELCND
LauraceaeLitsea leytensis Merr.PENTEN
LauraceaePhoebe sterculioides (Elmer) Merr.PELCND
MeliaceaeAglaia luzoniensis (Vidal) Merr. & RolfeNENTND
MoraceaeArtocarpus blancoi (Elmer) Merr.PELCND
MoraceaeFicus minahassae Miq.NELCND
MoraceaeFicus nota (Blanco) Merr.NELCND
MoraceaeFicus variegata BlumeNELCND
MyrtaceaeSyzygium nitidum Benth.NENDVU
MyrtaceaeSyzygium tripinnatum (Blanco) Merr.NENDND
RhamnaceaeAlphitonia excelsa (A.Cunn. ex Fenzl) Benth.NELCND
SterculiaceaeSterculia ceramica R.Br.NENDND
UrticaceaeLeucosyke capitellata (Poir.) Wedd.NELCND
1 Endemism classifications: PE—Philippine endemic; NE—Not endemic. 2 Conservation status classifications: CR—Critically endangered; EN—Endangered; Vu—Vulnerable; OTS—Other Threatened Species; NT—Near threatened; LC—Least concern; ND—No data.
Disclaimer/Publisher’s Note: The statements, opinions and data contained in all publications are solely those of the individual author(s) and contributor(s) and not of MDPI and/or the editor(s). MDPI and/or the editor(s) disclaim responsibility for any injury to people or property resulting from any ideas, methods, instructions or products referred to in the content.

