Review

A Review on the Process of Greenhouse Gas Inventory Preparation and Proposed Mitigation Measures for Reducing Carbon Footprint

by
Cevat Yaman
Department of Environmental Engineering, College of Engineering, Imam Abdulrahman Bin Faisal University, Dammam 34212, Saudi Arabia
Gases 2024, 4(1), 18-40; https://doi.org/10.3390/gases4010002
Submission received: 6 December 2023 / Revised: 4 March 2024 / Accepted: 13 March 2024 / Published: 15 March 2024

Abstract

:
Greenhouse gases trap heat in the atmosphere, causing the Earth’s surface temperature to rise. The main greenhouse gases are carbon dioxide, methane, nitrous oxide, perfluorocarbons, hydrofluorocarbons, and sulfur hexafluoride. Human activities are increasing greenhouse gas concentrations rapidly, which is causing global climate change. Global climate change is increasing environmental and public health problems. To reduce greenhouse gas emissions, it is necessary to identify where the emissions are coming from, develop a plan to reduce them, and then implement and monitor the plan to ensure that emissions are actually reduced. Anthropogenic global climate change has large and increasingly adverse economic effects. Cities emit the most greenhouse gas due to fossil fuel burning and power usage. The four major greenhouse gas emitters are energy, transportation, waste management, and urban land use sectors. Organizations should prepare action plans to lower their greenhouse gas emissions and stop the worst consequences of climate change. These action plans require companies and local authorities to submit their greenhouse gas emissions reports on a yearly basis. A greenhouse gas emissions management system includes several processes and tools created by organizations to understand, measure, monitor, report, and validate their greenhouse gas emissions. Two of the most widely adapted frameworks for greenhouse gases inventory reporting are ISO 14064 and the greenhouse gas protocol. This review paper aims to identify some of the key points of GHG inventory preparation and mitigation strategies.

1. Introduction

Climate change is a major global problem that has a wide range of implications. The main greenhouse gases (GHGs) are carbon dioxide (CO2), methane (CH4), nitrous oxide (N2O), perfluorocarbons (PFCs), hydrofluorocarbons (HFCs), and sulfur hexafluoride (SF6). Climate science is still a relatively new field, and scientists are still learning about the complex relationship between human activities and climate change. However, there is strong evidence that the increase in greenhouse gas emissions from human sources over the past 100 years is having a significant impact on the climate [1]. Climate change, particularly global warming, is already having a negative impact on human life and development [2]. Extreme weather events are becoming more frequent and intense, and sea levels are rising. These changes are displacing people, disrupting food production, and causing other problems. In 2016, the world experienced its hottest year on record. This has been followed by two more consecutive years of record-breaking heat. These trends are likely to continue as global GHG emissions continue to rise [3]. Governments around the world track and report GHG emissions from human sources. This information is used to track the progress of our efforts to reduce climate change. Climate change is a complicated and challenging problem, but it is one that we must solve. By taking action to reduce GHG emissions, the effects of climate change can be mitigated, and our planet can be protected for future generations.
The Intergovernmental Panel on Climate Change (IPCC) has concluded that the global average surface temperature has increased by 0.85 °C since 1880 [4,5]. If we do not take action to reduce greenhouse gas emissions, the temperature could rise by 2.6 to 4.8 °C by the end of this century [6]. This warming is already having a negative impact on human health. Climate change is causing more extreme weather events, such as heat waves, droughts, floods, and storms. These events can lead to heat stress, respiratory problems, waterborne diseases, and other health problems [7,8,9]. The World Health Organization (WHO) estimates that climate change could cause more than 150,000 deaths and a loss of 5.5 million disability-adjusted life years worldwide by 2030 [10]. The WHO has also estimated that climate change could cause approximately 250,000 additional deaths per year between 2030 and 2050.
The IEA’s Tracking Clean Energy Progress (TCEP) report is an annual assessment of global progress towards clean energy transitions. The report tracks over 50 components of the energy system that are critical for clean energy transitions, including sectors, technologies, infrastructure, and cross-cutting strategies [11]. The economic impacts of climate change are also significant. The IPCC estimates that the combined effects of climate change on global annual gross domestic product (GDP) are expected to increase over time to probable 1.0 to 3.3% levels by 2060. The greatest negative economic consequences are expected to be in some regions in Africa and Asia. Daniel Hoornweg argues that cities are essential to the fight against climate change and emphasizes that cities are responsible for a majority of global greenhouse gas emissions, but that they are also where many of the most innovative and effective climate solutions are being developed and implemented [12].
The main factors that contribute to climate change are:
  • Changes in Earth’s orbital patterns: These changes can cause the Earth to receive more or less solar energy, which can lead to changes in temperature.
  • Volcanic eruptions: Volcanic eruptions can release large amounts of greenhouse gases into the atmosphere, which can trap heat and cause the planet to warm.
  • Increase in greenhouse gas concentrations: Greenhouse gases trap heat in the atmosphere, which can cause the planet to warm. The main greenhouse gases are carbon dioxide, methane, nitrous oxide, and ozone.
To prevent further damage to our planet, greenhouse gas emissions should be reduced. Greenhouse gas emissions can be reduced by switching to renewable energy sources, improving energy efficiency, and reducing deforestation. The 21st Conference of the Parties (COP) agreed to keep global warming below 2 °C compared to pre-industrial levels, and to pursue efforts to limit the increase to 1.5 °C. Businesses are responsible for the majority of global GHG emissions, so they must be a leading actor in the fight to reduce emissions.
Human activities, such as energy generation, transportation, food and agriculture, and household and industrial processes are the main cause of climate change. These activities release greenhouse gases into the atmosphere, which trap heat and cause the planet to warm. For example, Habert et al. (2020) reviewed the environmental impacts of the cement and concrete industries and discussed strategies for reducing these impacts. The cement and concrete industries are responsible for a significant portion of global greenhouse gas emissions [13]. To avoid the worst effects of climate change, we need to reduce greenhouse gas emissions. The Intergovernmental Panel on Climate Change (IPCC) has said that we need to keep global emissions below 2900 billion tons by the end of this century in order to keep the rise in global temperature below 2 °C relative to pre-industrial levels. Cities are a major source of greenhouse gas emissions. They account for more than 70% of energy-related emissions worldwide [14]. This is because cities are densely populated and have a high demand for energy. For example, Shanghai’s per capita emissions are 12 tons of CO2-e/year, which is almost four times higher than the Chinese average. This is because Shanghai is a major financial and industrial center with a large population. Sethi et al. (2020) reviewed the state of the science on climate change mitigation in cities. It was shown that there is a wide range of technological and policy options available for mitigating climate change in cities [15].
The top 10 greenhouse gas emitters in the world are China, the United States, the European Union, India, Russia, Indonesia, Brazil, Japan, Canada, and Mexico. These countries account for 73% of global greenhouse gas emissions. In 2015, many countries in the world met in Paris and agreed to fight climate change. The Paris Climate Agreement has been implemented by more than 189 countries, accounting for more than 81% of global greenhouse gas emissions. The United States rejoined the agreement in 2021. Since the 1990s, the energy sector has been the largest source of greenhouse gas emissions. Greenhouse gas emissions from the energy sector, which includes electricity, transportation, manufacturing, buildings, and fossil fuels, have increased by 56% since 1990. Although the energy sector’s greenhouse gas emissions have increased by 3.5% in the past 5 years, the rate of growth has slowed since 2013. Forestry and land use activities have continued to emit significant amounts of greenhouse gases, despite some fluctuations in recent years. Greenhouse gas emissions from other sectors, such as agriculture, industry, and waste, have increased by 12%, 180%, and 16%, respectively, since 1990. To prevent the worst effects of climate change, greenhouse gas emissions should be reduced across all sectors. We need to quickly cut greenhouse gas emissions to zero by 2050.
Under the Paris Agreement, all countries (or cities) are required to submit their national greenhouse gas inventories on a regular basis. Countries (or cities) need to invest in low-carbon infrastructure and projects [16]. This is an important piece of information that helps countries track their progress towards their climate change mitigation goals. A greenhouse gas inventory is a quantified list of all the sources and emissions of greenhouse gases from a specific organization, system, or region, using standardized methods. It is prepared by choosing a base year, setting boundaries, identifying emission sources, calculating the GHG emissions, creating an inventory management plan (IMP), and setting a reduction goal and reduction target.
There are many reasons why organizations develop GHG inventories, including:
  • Managing greenhouse gas risks and identifying mitigation methods.
  • Joining greenhouse gas programs.
  • Joining greenhouse gas markets.
Every year, authorities in many mega cities create inventories of GHG emissions. They do this by following these steps:
  • Measuring and recording greenhouse gas emissions using the Greenhouse Gas Protocol of the World Resources Institute (WRI) and/or the World Business Council for Sustainable Development (WBC).
  • Having an independent third-party review and certify the accuracy of the greenhouse gas emissions inventory and the plan to manage those emissions.
  • Using a set of principles and guidelines to identify and assess different ways to reduce greenhouse gas emissions.
  • Economic and environmental evaluation of reduction and compensation alternatives.
  • Identifying the boundaries for organizations and businesses.
  • Allocating resources.
  • Collecting activity data.
  • Measuring greenhouse gas emissions.
  • Determining mitigation measures.
  • Balancing.
The Paris Agreement has developed a framework to monitor and evaluate the implementation of national plans to reduce greenhouse gas emissions. These plans are called nationally determined contributions (NDCs) [17,18]. An effective GHG emission reduction strategy and toolkit can help cities manage their budgets and plans to become lower carbon cities. These toolkits can identify the most important sources of GHG emissions in cities and find potential techniques for reducing emissions. While there is a need for comprehensive GHG emission reduction toolkits for cities, there is limited research in this area. Researchers have investigated solutions for specific applications, such as street lighting, commercial buildings, hospitals, and hotels [15]. A comprehensive toolkit for cities to reduce greenhouse gas emissions is being developed. This toolkit focuses on four key areas where cities can reduce emissions: transportation, waste management, urban land use management, and energy efficiency improvement. Other studies have specifically addressed technological or policy tools for reducing GHG emissions at the city scale [15]. These studies have classified these tools by policy type, reduction potential, and socio-technological composition [15]. The Organization for Economic Co-operation and Development (OECD) has also developed some low-carbon infrastructures that could help to reduce greenhouse gas emissions [16].
This study examines the quantitative determination of greenhouse gas (GHG) inventories for cities and discusses GHG reduction strategies. The purpose of this study is as follows:
  • Develop a methodology for quantifying GHG emissions using the procedures defined by ISO 14064, the GHG Protocol, and the reports released after COP meetings;
  • Identify the main sources of GHG in a particular city;
  • Address potential GHG reduction strategies.
This study offers quantitative methods for accurate, trackable greenhouse gas measurement, ensuring standardized reporting and compliance. By enabling year-on-year comparisons and trend analysis, it guides effective mitigation strategies and informs goal setting for tangible progress. The findings of this study will help policy makers identify key steps to be taken during the preparation of GHG inventories and select the best GHG reduction strategies for cities.

2. Materials and Methods

Greenhouse gas accounting principles are guidelines that help organizations report their greenhouse gas emissions in a reliable, accurate, and fair way. These principles are based on generally accepted financial accounting and reporting principles, as well as input from stakeholders from a wide range of technical, environmental, and accounting disciplines. Greenhouse gas reporting is still evolving, but these principles provide a foundation for organizations to build on.
Greenhouse gas accounting and reporting should adhere to the following five principles:
Relevance: The information reported should be relevant to the users of the report. This means that the information should be useful for decision-making.
Accuracy: The information reported should be accurate. This means that the information should be free from errors and bias.
Completeness: The information reported should be complete. This means that all relevant information should be included in the report.
Consistency: The information reported should be consistent over time. This means that the same methods should be used to collect and report information from year to year.
Objectivity: The information reported should be objective. This means that the information should not be influenced by bias or personal opinion.

2.1. Goals of GHG Inventory

GHG inventory can help to keep GHG emissions under control and provide a basis for mitigation strategies. Some specific and measurable goals of a GHG inventory include:
  • Managing risks resulting from GHGs and identifying mitigation strategies: By understanding the risks of climate change, organizations can take steps to reduce their exposure to these risks. For example, they can develop strategies to cope with changes in weather patterns and rising sea levels.
  • Public reporting and participation in GHG programs: This can help organizations to demonstrate their commitment to climate action and to meet the requirements of government regulations or voluntary programs.
  • Participation in reporting programs: This can help organizations to compare their emissions to those of other organizations and to track their progress over time.
  • Participation in carbon markets: This can help organizations to offset their emissions by purchasing carbon credits from other organizations that have reduced their emissions.
  • Calculation of the impact of institutions’ activities on climate change: This can help organizations to understand the full extent of their impact on the climate and to develop strategies to reduce their emissions.
  • Contributing to the formation and management of the Greenhouse Gas Management Plan: This can help organizations to develop and implement a plan to reduce their emissions.
  • Raising awareness of employees and citizens on climate change, energy efficiency, and sustainability: This can help to encourage employees and citizens to take action to reduce their own emissions.
Organizations often want their GHG inventories to serve more than one purpose. For this reason, it is important to be able to design the inventory process to be flexible and adaptable. The GHG Protocol Standard is a comprehensive GHG accounting and reporting framework that can be used to achieve a variety of business objectives. Some of the business objectives that can be achieved with a GHG inventory include:
  • Identifying risks associated with future GHG restrictions.
  • Identifying cost-effective mitigation opportunities.
  • Setting GHG targets.

2.2. Scope of GHG Inventory

GHG inventories should include Scope 1, Scope 2, and Scope 3 greenhouse gas emissions. Scope 1 emissions are direct emissions from sources owned or controlled by the city, such as emissions from vehicles, buildings, and industrial facilities. Scope 2 emissions are indirect emissions from the generation of purchased electricity, heat, or steam. Scope 3 emissions are all other indirect emissions that occur in the value chain of the city, such as emissions from the transportation of goods and services, waste disposal, and employee commuting.
In GHG calculations, the following should be included:
  • Quantities of natural gas, electricity, diesel oil, LPG, refrigerants, and fire tube gas.
  • Purchased electronic items, paper, toner, and water consumption.
  • Waste sent to disposal facilities.
By including all three scopes of emissions, cities can get a comprehensive picture of their overall greenhouse gas footprint. This information can then be used to develop strategies to reduce emissions and mitigate the effects of climate change.

2.3. Industry Based GHG Emission Calculations

2.3.1. Burning Fuel in Thermal Power Plants

Organizations must monitor and report their greenhouse gas emissions from burning fuels, except for hazardous and domestic wastes. The following emission sources must be monitored and reported at a minimum:
  • Steam boilers;
  • Industrial furnaces;
  • Turbines;
  • Incinerators;
  • Engines;
  • Chimneys;
  • Scrubber towers.
Combustion emissions and mass balance methods must be used in GHG emission calculations. CO2 process emissions from the use of carbonate for removing acid gas from the flue gas stream are calculated based on the carbonate consumed or gypsum produced. The following steps are applied:
  • Calculate the amount of carbonate consumed or gypsum produced.
  • Multiply the amount of carbonate consumed or gypsum produced by the carbon dioxide content of carbonate (0.44 kg CO2/kg) or gypsum (0.71 kg CO2/kg).
  • The resulting value is the amount of CO2 process emissions.

Emission Factor

The emission factor of gypsum is calculated based on the chemical equation to produce gypsum, which shows how many moles of carbon dioxide are emitted for every mole of gypsum that is produced. This ratio is equivalent to 0.2558 tons of carbon dioxide per ton of gypsum.
There are special considerations to consider when calculating emissions from flame stacks. The facility must include routine ignitions, operational ignitions, and internal carbon dioxide emissions in the emissions calculation.
The amount of emissions produced by a specific plant is calculated based on the molecular weight of the flue stream, which is estimated using industry standard process modeling software. The average molecular weight of the flue gas over the course of a year can be calculated by considering the proportions and molecular weights of all the different streams that contribute to the flue gas.

Emissions Calculation Approach for Power Plants

CO2 emissions resulting from energy production can be calculated using the following Formula (1).
CO 2   emissions = k = 1 n ( AD k × NCV k × EF k × 1 BR k × OF k )
CO2 emissions resulting from process emissions can be calculated using the following Formula (2).
CO 2   emissions = k = 1 n ( AD k × NCV k × EF k × 1 BR k × RF k )
where
  • AD = Activity data (t or Nm3 fuel combusted)
  • NCV = Net calorific value (J/ton or J/Nm3)
  • EF = Emission factor (t CO2/J or t CO2/t)
  • BR = Biomass ratio (0–100%)
  • OF = Oxidation factor (0–100%)
  • RF = Reduction factor (0–100%)
In thermal power plants, the oxidation factor, sometimes called the combustion efficiency, refers to the fraction of carbon in the fuel that is completely oxidized during combustion to form carbon dioxide (CO2). The reduction factor refers to the fraction of carbon in the fuel that is incompletely oxidized during combustion.
Annual total GHG emissions can be calculated by combining energy-related CO2 emissions and process-related emissions using the following Formula (3).
CO 2   emissions =   CO 2   emissions   energy + CO 2   emissions   process
In power plant emission calculations, it is assumed that 3.664 metric tons of carbon dioxide (t CO2) is equivalent to 1 metric ton of carbon (t C).

2.3.2. Oil Refinery Plants

Oil refineries emit greenhouse gases from combustion and production processes. The facility monitors and reports emissions from different sources such as boilers, turbines, coke ovens, generators, and chimneys.
Emissions from catalytic cracking regeneration and other catalyst regeneration are monitored using the mass balance method. This method considers the condition of the incoming air and flue gas. The emission factor is determined by the following stages.
Stage 1: The facility uses a reference value of 2.9 tons of carbon dioxide (tCO2) per ton of ethane processed. This is a prudent approach because it ensures that the facility is not underestimating its emissions.
Stage 2: The facility uses an emission factor that is tailored to its specific operations, which is calculated based on the carbon content of the feed gas. This factor is more accurate than the reference value, but it requires more data and analysis.

Emissions Calculation Approach for Oil Refineries

All the carbon monoxide (CO) in the flue gas is converted to carbon dioxide (CO2). Emissions from hydrogen production are calculated by multiplying the activity data (expressed in tons of hydrocarbon input) by the emission factor. In oil refinery emission calculations, it is common to assume that 3.664 tons of carbon dioxide (t CO2) is equivalent to 1 ton of carbon (t C).
The oil refinery facility can use the mass balance method to determine its greenhouse gas emissions. The mass balance method is a way of tracking the movement of materials and energy into and out of a system. In the case of an oil refinery, the system would be the refinery itself. The mass balance method is used to calculate the amount of greenhouse gases emitted from the refinery by tracking the input and output streams of carbon. The input streams are the materials and energy that enter the refinery, and the output streams are the materials and energy that leave the refinery. The following formulas are used to calculate the amounts of greenhouse gases emitted from the refinery ((4) and (5)).
CO 2   emissions   input = k = 1 n ( AD k × NCV k × EF k × 1 BR k × RF k )
CO 2   emissions   output = k = 1 n ( AD k × NCV k × EF k × 1 BR k × RF k )
Annual total emissions are calculated by subtracting the CO2 emissions from output source streams from the CO2 emissions from input source streams. The following Formula is used (6).
CO 2   emissions =   CO 2   emissions   input CO 2   emissions   output

2.3.3. Primary Aluminum Production and Processing

CO2 emissions from the production of electrodes in primary aluminum production and processing must be monitored and reported. Perfluorocarbons (PFCs) and CO2 emissions are also reported under aluminum production and processing activities. Primary aluminum production begins with the production of alumina from bauxite. In this standard process, aluminum oxide is obtained from bauxite under high temperature and pressure using caustic soda. The red-colored sludge produced in this step contains dissolved sodium aluminate and a mixture of different metal oxides. The solution is cooled and seeded with aluminum oxide, which crystallizes the hydrated aluminum oxide. The crystals are washed and then calcined in a rotary kiln. Primary aluminum is produced by the electrolytic reduction of alumina (Al2O3) dissolved in molten cryolite at temperatures slightly below 1000 °C. The carbon electrodes extend into the cell and act as the anode. The carbon coating of the cell performs the cathode function. While liquid aluminum is formed at the cathode, the carbon in the electrode reacts with the oxygen in the air to form carbon dioxide gas at the anode. The electrolytic reduction reaction can be expressed as follows:
2Al2O3 + 3C → 4Al + 3CO2
The electrolysis process, which is an essential part of primary aluminum production, emits mostly carbon dioxide (CO2). Perfluorocarbons (PFCs) are also produced during the reactions due to the anode effect. The process also produces tetrafluoromethane (CF4) and hexafluoroethane (C2F6) gases in a ratio of 1:10.

CO2 Emissions

The facility monitors CO2 emissions from the primary aluminum production. The mass balance method tracks the amount of carbon that enters and leaves the facility. The difference between the two amounts is the amount of carbon dioxide emitted.

PFC Emissions

The facility calculates and reports the PFC emissions from the anode effect that can be measured in the stack (point source emissions), including fugitive emissions. The Net PFC emissions are calculated as follows (7):
Net   PFC   emissions = PFC   emissions   Collection   efficiency
The collection efficiency of the stack is measured when plant-specific emission factors are determined. The facility calculates the CF4 and C2F6 emissions released through the stack using the 1-slope and 2-high voltage methods.

2.4. City or Municipality Based GHG Emission Calculations

Calculating GHG emissions for cities involves the following steps:
Here are the steps involved in creating a GHG emissions inventory:
  • Choose a reference year. This is the year that will be used as the basis for the inventory. The reference year should be chosen carefully, as it will affect the accuracy of the inventory.
  • Identify the facilities to be included. This includes all facilities that are owned or operated by the organization.
  • Determine the resources to be included. This includes all resources that are used by the facilities, such as energy, water, and materials.
  • Choose a methodology for calculating emissions. There are a variety of methodologies that can be used to calculate GHG emissions. The methodology chosen should be appropriate for the organization and the resources being considered.
  • Calculate the emissions. This involves using the chosen methodology to calculate the emissions from all identified sources.
  • Report the emissions. The emissions should be reported to the organization’s management, to governments, or to the public.

3. Discussion

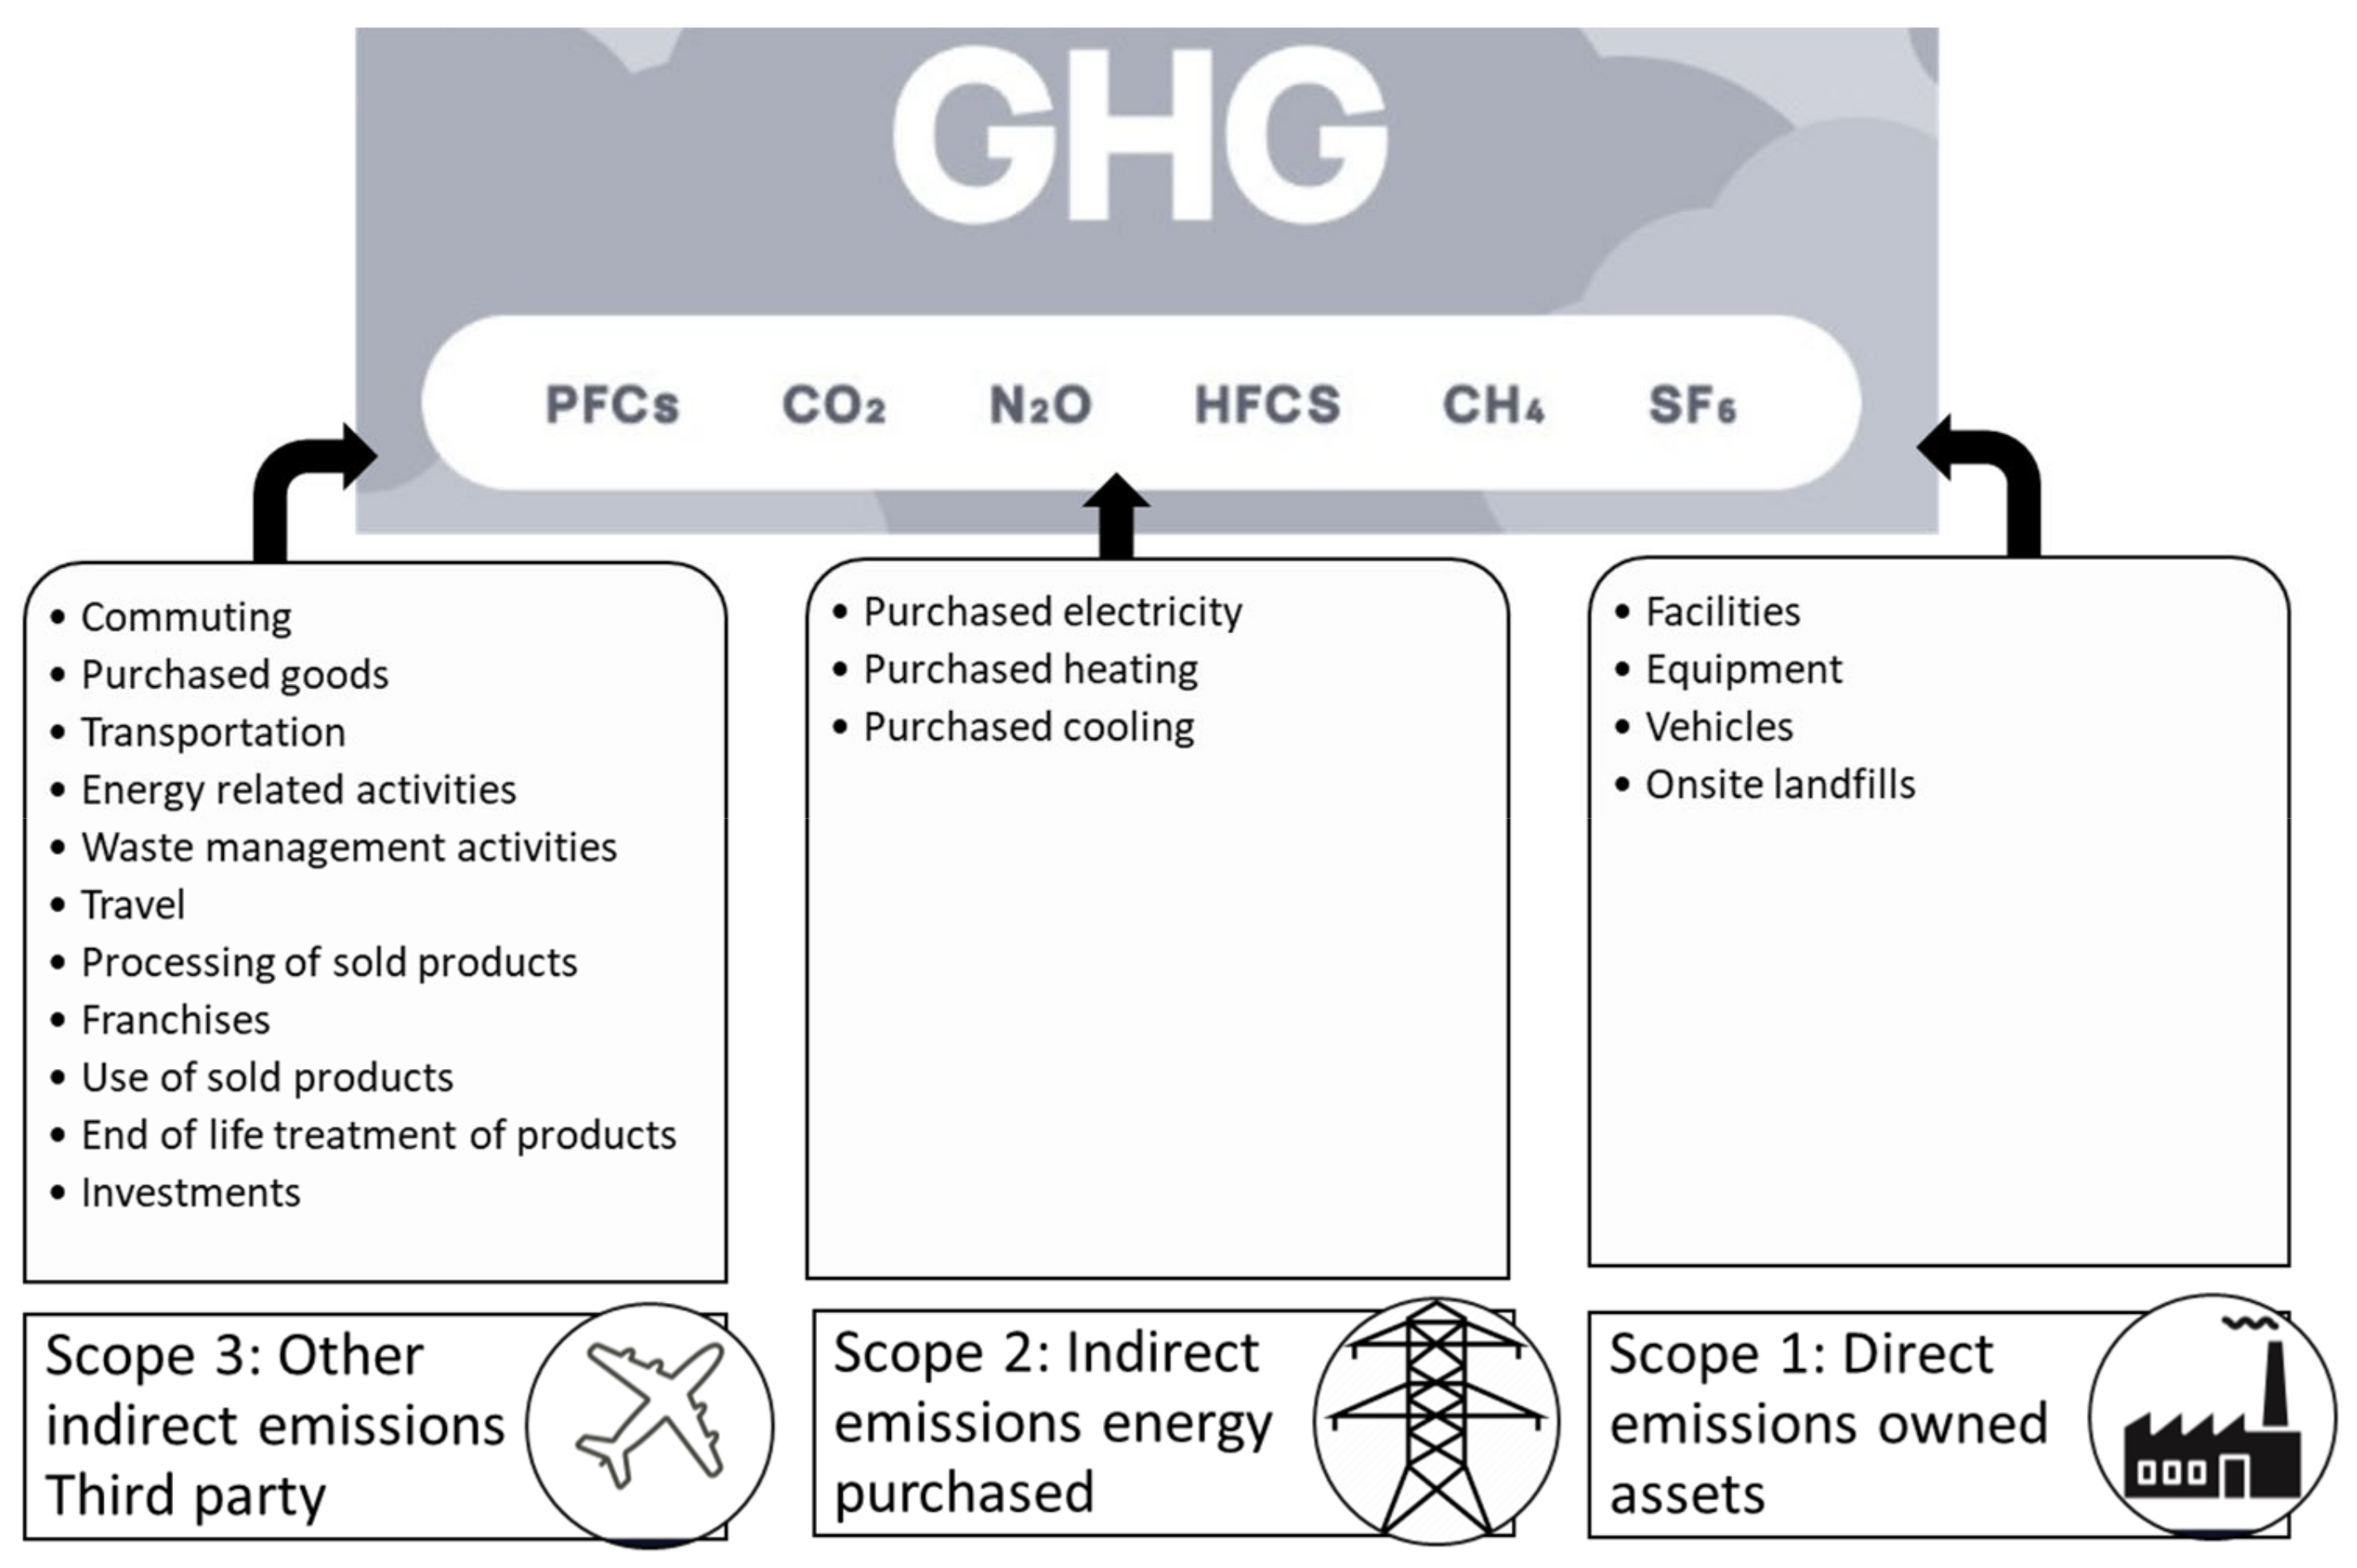
3.1. Scopes and Sources of GHG Emissions

To identify and categorize all the activities within an organization that produces GHG emissions, a thorough evaluation of all operations must be conducted. GHG emissions can come from direct activities, as well as from upstream and downstream processes. When calculating and reporting GHG emissions, they are classified into scopes based on the source of the emissions. This helps to increase transparency and accountability. There are three scopes:

3.1.1. Scope 1: Emissions Released Directly from Sources

Figure 1 shows greenhouse gas emissions of Scope 1, Scope 2, and Scope 3 [19]. Scope 1 emissions are GHGs that are released directly from sources that an organization owns or controls. This includes emissions from burning fuel, leaking gases from equipment, and driving vehicles.
Scope 1 emissions do not include:
All greenhouse gas emissions that are not included in the Kyoto Protocol. The Kyoto Protocol is an international agreement that aims to reduce greenhouse gas emissions. The gases covered by the Kyoto Protocol are carbon dioxide, methane, nitrous oxide, hydrofluorocarbons, perfluorocarbons, and sulfur hexafluoride.
Companies can choose to report Scope 1 emissions separately from the other scopes. This can be helpful for organizations that want to track their emissions more closely or that want to highlight their efforts to reduce their emissions.

3.1.2. Scope 2: Indirect Emissions from Energy Purchased

Scope 2 emissions are indirect GHG emissions from the generation of purchased electricity, steam, heat, and cooling. The energy provider’s power generation activities produce these emissions, not the company itself. For example, if a company uses electricity to power its factory, the emissions from the power plant that generates the electricity would be considered Scope 2 emissions for the company. Scope 2 emissions can be a significant source of GHG emissions for organizations. In some cases, they can be even larger than Scope 1 emissions.

3.1.3. Scope 3: Indirect Emissions from Third Parties

Scope 3 emissions are GHG emissions that occur upstream and downstream of an organization’s operations, throughout its value chain. These emissions are produced by the transportation of goods and services, the use of sold products, and waste disposal. Scope 3 emissions are not included in Scope 2 because they are not generated by the organization itself. Instead, they are generated by other organizations in the value chain.
Upstream Scope 3 emissions occur before the product is sold to the customer. They include emissions from the following activities:
  • Procurement: This includes emissions from the extraction and processing of raw materials, as well as the transportation of these materials to the organization.
  • Manufacturing: This includes emissions from the production of the product, as well as the transportation of the product to the point of sale.
  • Distribution: This includes emissions from the transportation of the product to the customer.
Downstream Scope 3 emissions occur after the product is sold to the customer. They include emissions from the following activities:
  • Use: This includes emissions from the use of the product, such as emissions from driving a car or using electricity.
  • End-of-life: This includes emissions from the disposal of the product, such as emissions from recycling or incineration.

3.2. Identifying Greenhouse Gas Data

Organizations use information about their activities and measurement methods to calculate their Scope 1, Scope 2, and Scope 3 GHG emissions.
Activity data refers to the information about the activities that generate emissions. This includes data on the types of fuel used, the amount of energy consumed, and the transportation of goods and services.
Measurement methodologies are the methods used to calculate the emissions from the activity data. There are a variety of measurement methodologies available, and the choice of methodology will depend on the specific activity and the data that is available.

3.2.1. Activity Data

Without information about the activity data, it is impossible to calculate the GHG emissions accurately. One example of activity data on emissions from consumed electricity is the amount of electricity consumed in kilowatt-hours (kWh), which can be found on vendor invoices. This information allows us to assess the emission intensity level of the activity.

3.2.2. Quantification Methodology

Organizations can use established measurement methods to determine their GHG emissions in a consistent and comparable way. These methods use the carbon dioxide equivalent (CO2-e) unit to express all greenhouse gases in terms of their equivalent to carbon dioxide. The GHG emission inventory includes the six greenhouse gases listed in the Kyoto Protocol. Organizations can use the Global Protocol on Community Greenhouse Gas Emissions (GPC) to prepare a comprehensive greenhouse gas inventory report, prepared by the World Resources Institute (WRI) in 2012. Table 1 shows the definition of GPC principles for preparing a greenhouse gas inventory [19].

3.3. Accounting and Reporting Principles

The Global Protocol on Community Greenhouse Gas Emissions (GPC) defines six principles for calculating and reporting GHG emissions:
  • Relevance: The data collected should be relevant to the organization’s emissions.
  • Completeness: The data collected should be complete, covering all sources of emissions.
  • Consistency: The data collected should be consistent over time, so that trends can be identified.
  • Objectivity: The data collection and reporting process should be transparent, so that stakeholders can understand how the data was collected and reported.
  • Accuracy: The data collected should be accurate, so that the emissions estimates are reliable.
  • Measurability: The data collected should be measurable, so that the emissions estimates can be verified [19].

3.3.1. Direct Emissions

Table 2 shows all the direct emissions from sources that the organization owns or controls, which are also known as Scope 1 emissions.

3.3.2. Other Indirect Emissions

Scope 3 emissions include water-based navigation and aviation excursions that start and end within the country’s borders. Table 3 lists Scope 3 emissions and how they are used in the greenhouse gas inventory.

3.4. GHG Inventory Preparation

3.4.1. Fixed Units

The GHG inventory report includes all GHG emissions from stationary sources within the city’s borders, such as homes, businesses, power plants, and factories, except for illegal emissions and leaks from the natural gas pipeline system.

Methodology

The IPCC Good Practice Guides and Uncertainty Management in National Greenhouse Gas Inventories (IPCC GPG) provide guidance on how to measure emissions from stationary units. Stationary units are fixed sources of greenhouse gas emissions, such as power plants, factories, and commercial buildings. The IPCC methodology uses activity data for all the fuel types to determine emissions. Activity data is information about the amount of fuel that is used. The emission factor is a measure of the amount of greenhouse gases emitted per unit of fuel. The Tier 2 approach provides greenhouse gas emission factors for major fuels that are specific to each country. The emission factors for gas, coal, natural gas, and electricity are determined according to national data provided in the National Inventory Report (NIR). The emissions factor for LPG is determined using the emissions factor toolkit.

Residential Buildings

Greenhouse gas inventories should track how much greenhouse gases are emitted directly from homes when fossil fuels are burned for heating and cooking. Organizations must use the Tier 2 approach to determine their Scope 2 emissions from electricity consumption.

Commercial Buildings

Organizations should track all greenhouse gas emissions that are directly released from commercial and institutional buildings, such as emissions from burning fossil fuels for heating, cooling, and other purposes. Organizations must use the Tier 2 approach to calculate their Scope 2 emissions from electricity use.

Power Plants

This inventory includes greenhouse gas emissions from power plants that are connected to the central electricity grid and from car companies that generate their own energy. Power plants directly emit greenhouse gases, which are counted as Scope 1 emissions. To avoid counting emissions twice, the total annual emissions are combined into a single number, as recommended by the Greenhouse Gas Protocol (GPC). Direct greenhouse gas emissions from power plants are not included in this inventory. Indirect greenhouse gas emissions from electricity use in the industrial sector are reported as industrial energy usage. The emission factors for each fuel type used to calculate these emissions are based on Tier 2 data from the 2012 National Inventory Report.

Industrial Energy Use

The inventory also includes greenhouse gas emissions from industrial facilities that are directly emitted from the burning of fossil fuels, as well as indirect energy emissions from the use of grid electricity. The direct emissions are measured using the Tier 2 approach, which is a method for estimating greenhouse gas emissions from fuel combustion. The indirect emissions are also measured using the Tier 2 approach, which is a method for estimating greenhouse gas emissions from electricity use. The fuels and electricity that are consumed in industrial plants include: liquefied petroleum gas, lignite, natural gas, electricity, and coal.

3.4.2. Mobile Units

Road Transportation

Greenhouse gas emissions from vehicles are accounted for in the inventory. The inventory measures the direct emissions from road vehicles by calculating the amount of CO2, CH4, N2O, and CO emissions from the burning of fuel. Methane emissions are relatively low compared to CO2, typically constituting less than 1% of total road transport emissions. CO emissions are formed from incomplete combustion of gasoline and diesel. N2O emissions account for around 5% of total road transport greenhouse gas emissions. N2O is primarily produced during high-temperature engine combustion, especially in diesel vehicles. To calculate the greenhouse gas emissions from road transportation, the amount of fuel sold within the border is multiplied by the emission factor for each fuel type.

Railroad Transportation

To obtain a complete picture of greenhouse gas emissions from transportation, the inventory should include emissions from the railway system. Railway systems emit a significant amount of greenhouse gases. When trains burn fossil fuels, they release greenhouse gases into the atmosphere. If the railway system is powered only by electricity, it will not produce any direct emissions (Scope 1) from burning fossil fuels. The greenhouse gas emissions from electric vehicles can be calculated by multiplying the amount of electricity they use by the emission factor of the electricity grid. The emission factor is a number that tells us how much greenhouse gas is emitted for each unit of electricity generated. To avoid double counting, the electricity used in rail transportation systems should be excluded from the electricity use of commercial and institutional buildings. This is because the electricity used in both sectors is ultimately sourced from the same grid.

Marine Navigation

The tier 1 water-based navigation methodology is a way to estimate direct and indirect greenhouse gas emissions from watercraft owned by the government and by private individuals. The tier 1 methodology is a simplified method for estimating greenhouse gas emissions from waterborne transportation. It is used to calculate Scope 1 direct emissions, which are emissions that occur from owned or controlled sources, and Scope 3 indirect emissions, which are emissions that occur in the value chain of an organization.

Aviation

The tier 2a methodology is used to measure greenhouse gas emissions from aviation, taking into account each individual landing and take-off cycle. The tier 2a methodology is a more sophisticated way to estimate greenhouse gas emissions from aviation than the tier 1 methodology. This method is used to estimate the amount of greenhouse gases emitted directly from sources that are owned or controlled by a company or organization.
The tier 2a methodology includes the following steps:
  • Identify the aircraft that operate at each airport within the border.
  • Collect data on the number of LTO cycles for each aircraft type.
  • Use the emission factors for each aircraft type to estimate the amount of greenhouse gases that are emitted.
The LTO cycle is the basic unit of operation for aircraft. It includes the landing, taxiing, takeoff, and climb-out phases of flight.

Off-Road

Off-road vehicles are a source of greenhouse gas emissions that are tracked in the greenhouse gas inventory. Off-road vehicles are vehicles that are not designed for use on public roads. They include vehicles used in construction, agriculture, mining, and other industries. The greenhouse gas inventory is a record of all greenhouse gas emissions from a particular area. It is used to track emissions over time and to identify opportunities to reduce emissions. The greenhouse gas inventory includes emissions from off-road vehicles because these vehicles can be a significant source of emissions. By including emissions from off-road vehicles, the inventory can provide a more accurate picture of the total GHG emissions from a particular area.

3.4.3. Waste Management

The GHG inventory includes direct and indirect emissions from MSW management, biological waste processing, and wastewater treatment processes within a city’s borders. MSW management activities include the collection, transportation, treatment, and disposal of MSW. Biological wastes include manure, sewage sludge, and other organic materials. Wastewater treatment activities include the treatment of wastewater from homes, businesses, and industries.
The 2006 IPCC National Greenhouse Gas Inventories Guidelines recommend that CH4 and N2O emissions be measured as CO2 equivalent (CO2-e). This means that the emissions are converted into units of CO2 by multiplying them by their respective global warming potentials. By including emissions from waste management, biological waste treatment, and wastewater treatment operations in the greenhouse gas inventory, cities can get a more accurate picture of their greenhouse gas emissions and take steps to reduce them [20].

Waste Landfilling

To measure the contribution of MSW management to greenhouse gas emissions, the total amount of MSW that is landfilled should be known. Waste management activities include the collection, transportation, treatment, and disposal of MSW. Greenhouse gas emissions from these activities can be significant, and it is important to measure them accurately in order to develop effective mitigation strategies.
It is important to know what sources of waste are used in the calculation of greenhouse gas emissions. Some of these sources are:
  • Removing dirt, litter, and other debris from streets and sidewalks;
  • Treatment sludge;
  • Landfills receiving waste from transfer stations;
  • Waste generated at customs during the process of importing, exporting, or transiting goods;
  • Processed hospital waste;
  • Waste produced at industrial plants.
The waste management sector generates greenhouse gas emissions, such as methane, carbon dioxide, and nitrogen oxides [21]. These emissions are produced by a variety of waste management processes and cycles, including the following:
  • Transportation of recycled materials to the waste recovery plants;
  • Biological or thermal treatment of waste;
  • Storage.
Domestic waste consists of readily biodegradable organic materials which cause GHG emissions. When these materials decompose in landfills, they produce methane, a potent greenhouse gas.

Biological Waste Treatment

Composting can produce greenhouse gases, such as methane, when organic matter in waste decomposes in the presence of oxygen [22]. Aerobic decomposition is a process in which microorganisms break down organic matter in the presence of oxygen. There are different types of composting, and the amount of greenhouse gas emissions produced depends on the type of composting method used.
Aerated heap composting: This method is used to compost large volumes of materials, such as organic waste. The waste is piled up in heaps and aerated by turning it manually or mechanically [23]. This method can produce significant amounts of greenhouse gas emissions.
Row composting: This method involves forming biodegradable waste into windrow piles, defined as rows, and aerating the piles by turning them manually or mechanically. This method produces less greenhouse gas emissions than aerated heap composting.

Combustion

Burning waste can release significant amounts of carbon dioxide and nitrous oxide, but negligible amounts of methane (CH4) [24]. The IPCC guidelines are used to estimate greenhouse gas emissions from incineration plants. Greenhouse gas emissions from burning greenery include CO2, N2O, and CH4. Incomplete combustion in incinerators can release CH4, but this occurs in lower amounts in large, well-functioning incinerators.

Wastewater Disposal

This encompasses all wastewater generated and treated within the study area. Detailed information on the wastewater treatment technologies employed at each treatment plant should be listed and categorized according to the IPCC classification system. Wastewater treatment plants can be classified into four types: preliminary, primary, secondary, and tertiary treatment. The IPCC Guidelines for National Greenhouse Gas Inventories should be used to calculate methane (CH4) and nitrous oxide (N2O) emissions from wastewater treatment processes [20].
The 2006 IPCC National Greenhouse Gas Inventories Directive method states that indirect nitrous oxide (N2O) emissions are produced when wastewater treatment effluents are disposed into water environments. Centralized wastewater treatment plants that use nitrification and denitrification processes emit nitrous oxide (N2O) directly into the atmosphere.

3.5. Emission Factors

GHG emissions are typically measured in terms of their carbon dioxide equivalent (CO2-e), which is a unit of measurement that compares the global warming potential of different gases to that of carbon dioxide. CO2-e is calculated by multiplying the mass of a greenhouse gas emitted by its GWP, which is a measure of how much a gas warms the Earth compared to carbon dioxide over a certain period of time [25]. Table 4 shows some emission factors that are used in greenhouse gas inventories for stationary combustion. These emission factors are not expressed in carbon dioxide equivalent (CO2-e) units. Therefore, the emission factors must be multiplied by the corresponding global warming potentials (GWPs) of carbon dioxide (CO2), methane (CH4), and nitrous oxide (N2O) to convert them to CO2-e units. The GWPs of CO2, CH4, and N2O are 1, 25, and 298, respectively [26,27].

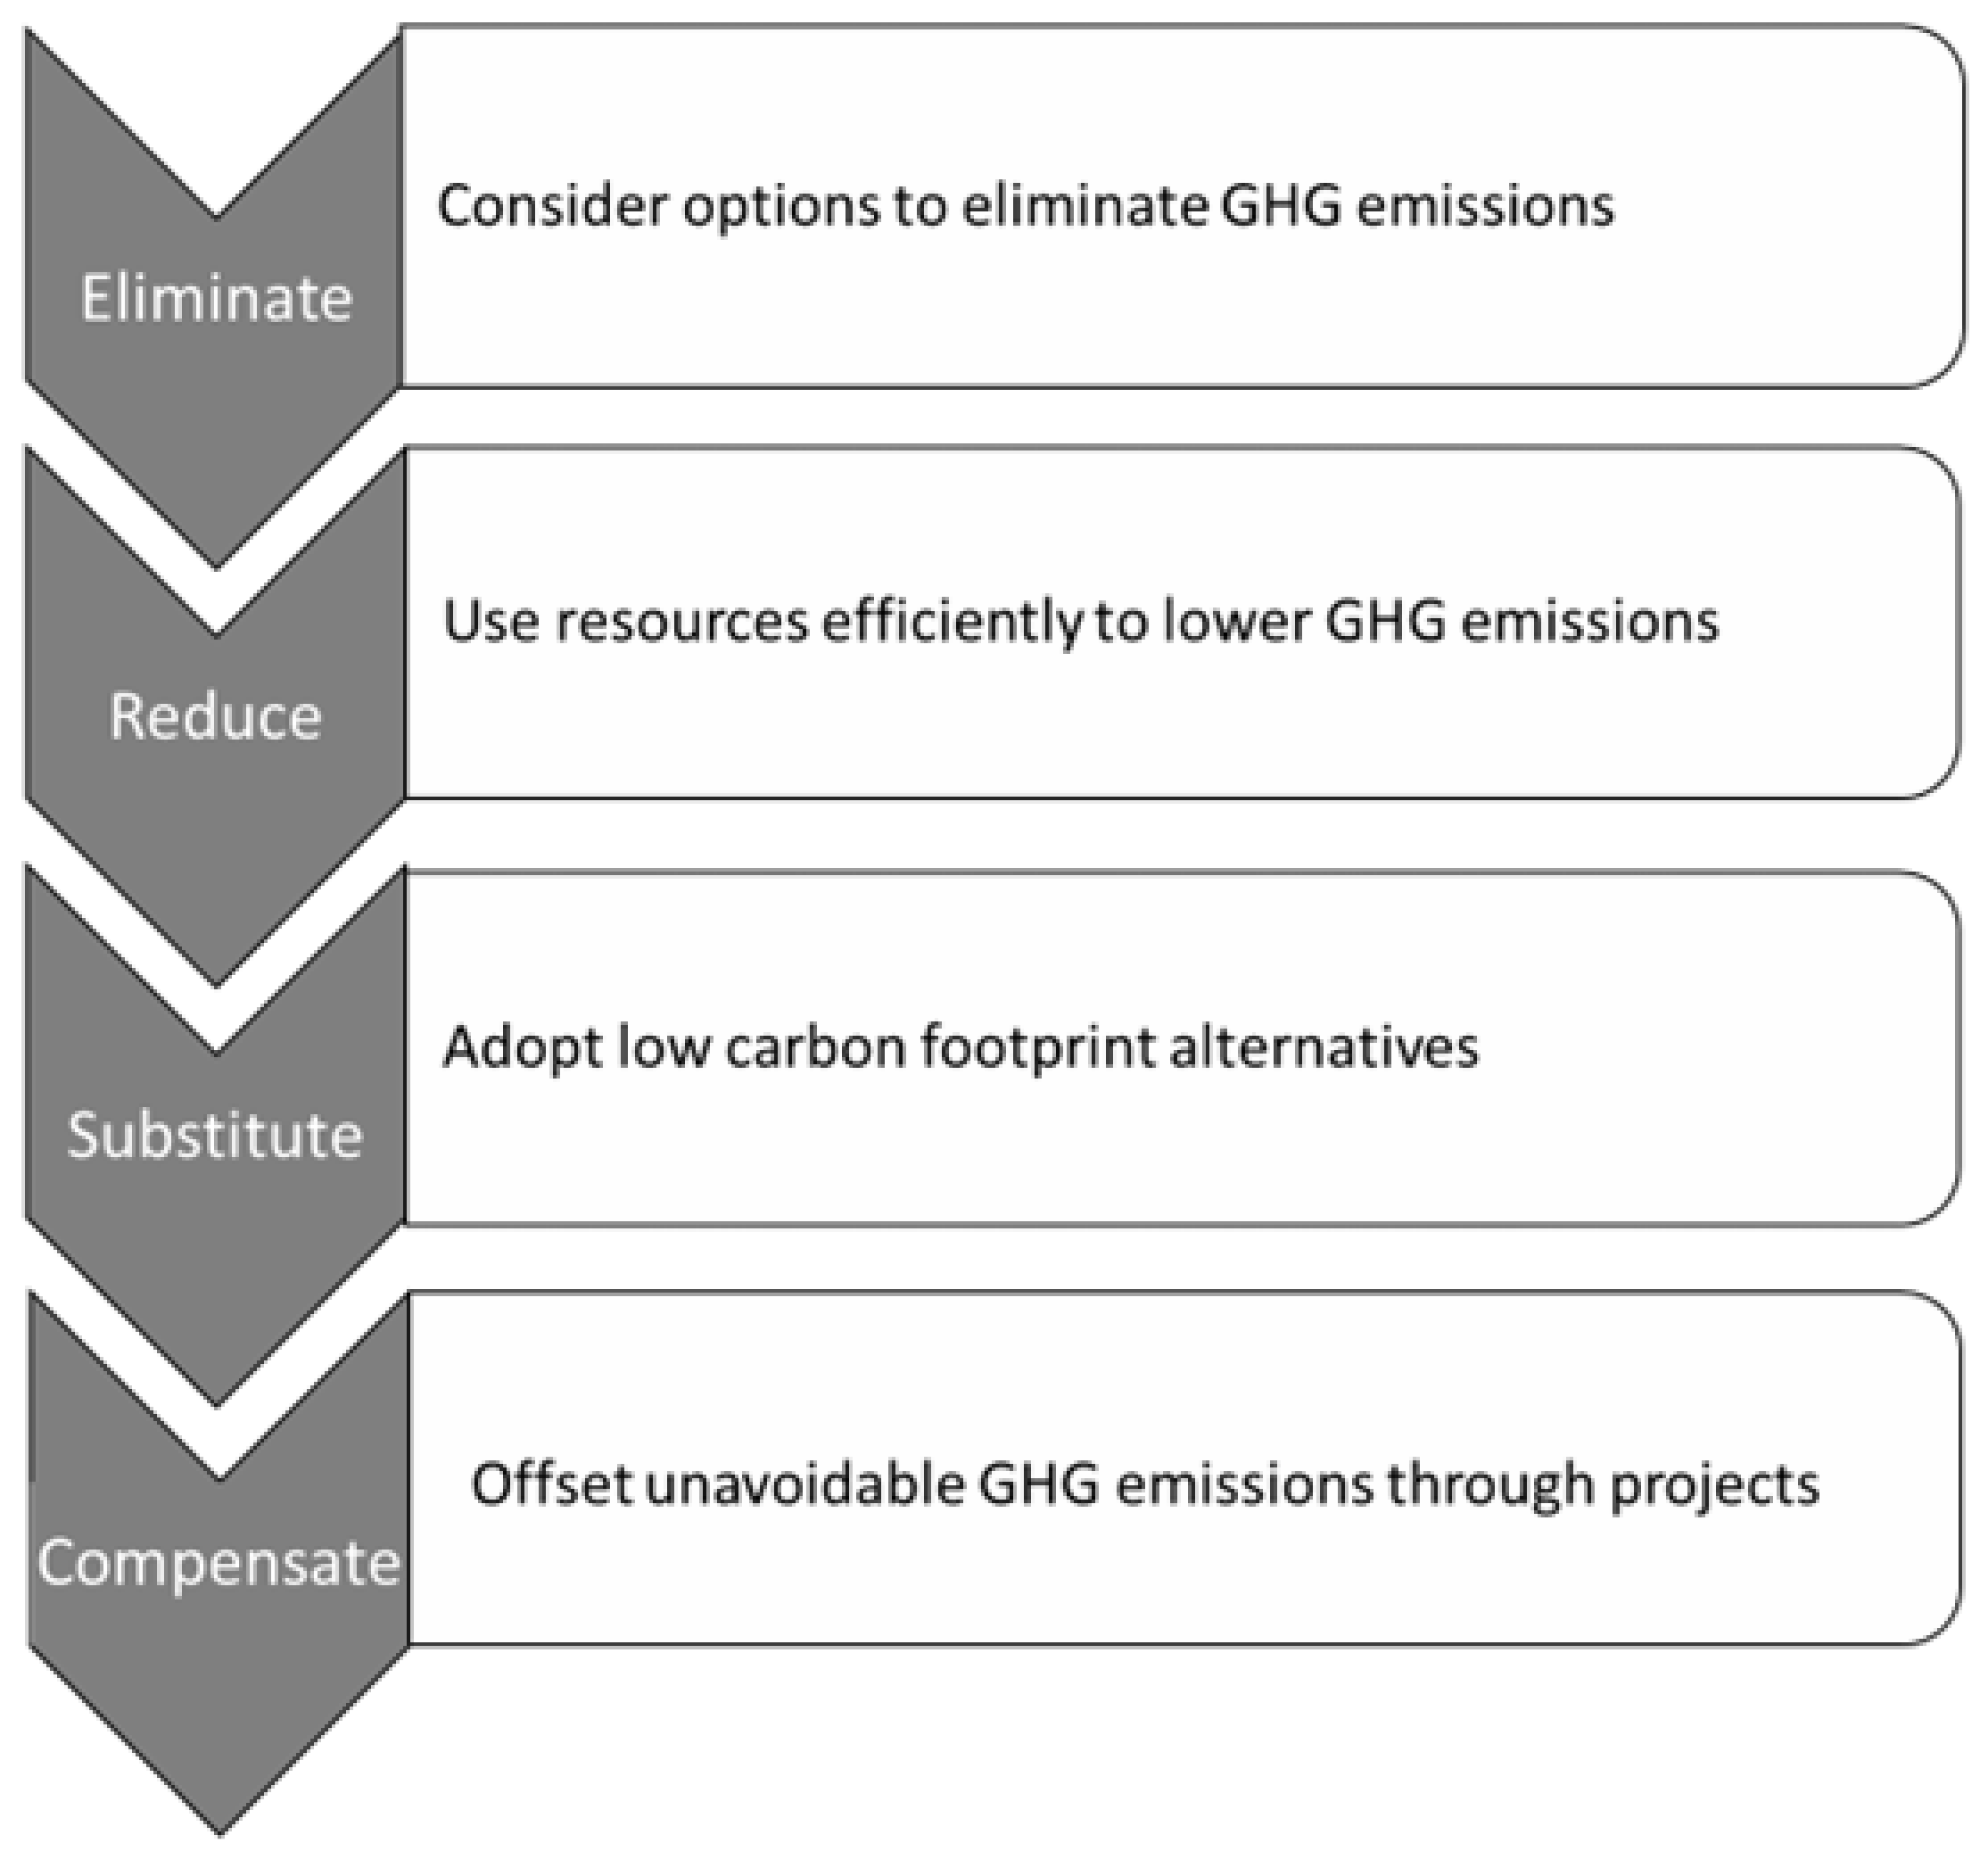
3.6. GHG Emissions Management and Reduction

Institutions should implement effective measurement and record-keeping systems and processes to track and reduce greenhouse gas emissions. Greenhouse gases are gases that trap heat in the atmosphere and contribute to climate change. Seven of the most common greenhouse gases are regulated under the Paris Agreement (Table 5).
A greenhouse gas emission management system is a process that helps organizations track and reduce their GHG emissions. It involves identifying, measuring, monitoring, reporting, and verifying GHG emissions. The two most common frameworks for reporting GHG emissions are ISO 14064 and the Greenhouse Gas Protocol (Table 6).
  • ISO 14064: This is an international standard that provides a framework for GHG accounting and verification. It consists of three parts.
  • Greenhouse Gas Protocol: This is a voluntary framework that provides a standardized approach to measuring and reporting GHG emissions. It consists of four main components.

3.6.1. Recommendations for the Reduction of GHG Emissions

To reduce greenhouse gas emissions effectively, a comprehensive approach is needed to consider all aspects of the problem. This includes reducing our reliance on fossil fuels, improving energy efficiency, protecting forests, and developing new technologies. Figure 2 shows that while reducing greenhouse gas emissions is essential, more action is needed to address the climate crisis. The hierarchy in the figure shows that the preferred approach is to eliminate emissions, subsequently reducing carbon and energy use, and using renewable energy instead of fossil fuels.

Air Quality

Air quality is measured to determine the concentration of pollutants in the air. Air pollutants, such as greenhouse gases, can warm the planet, leading to climate change. Climate change is the long-term heating of Earth’s climate system observed since the pre-industrial period (between 1850 and 1900) due to human activities, primarily fossil fuel burning. Table 7 provides an overview of the recommendations and guidelines for air quality management that can be used to reduce carbon emissions.

Water Management

Water management is the process of managing the quality and quantity of water. Effective water management, including water purification, is crucial for reducing carbon emissions and adapting to climate change. Table 8 provides a summary of the recommended and suggested water management practices that can be used to reduce carbon emissions.

Waste Management

Reducing waste by preventing and recycling is a great way to reduce greenhouse gas emissions. Table 9 provides an overview of the recommended and suggested waste management practices that can be used to reduce carbon emissions.

Energy Management

Energy production and use are the primary sources of greenhouse gas emissions, so promoting and using energy efficiently in the workplace is crucial for reducing carbon emissions. Table 10 provides recommendations and guidelines for energy management to reduce carbon emissions.

Supply Chain Management

Companies emit more greenhouse gases from their supply chains than from their own operations. Companies can reduce greenhouse gas emissions and mitigate climate change in hard-to-decarbonize sectors by managing their supply chains more intelligently. Table 11 summarizes the recommended and suggested supply chain management practices that can be used to reduce carbon emissions.

Organization Management

Environmental management adaptation and mitigation strategies must be tailored to the specific needs and circumstances of each organization to effectively address the complex range of environmental factors. The specific climate measures that organizations implement will vary depending on their type and size. Organizations need strong policies and accountability mechanisms to educate and involve employees and staff in order to achieve a successful GHG reduction plan. Table 12 summarizes the recommendations and guidelines for organizational management.

Climate Action

Climate action plans are holistic and essential roadmaps for tracking and reducing greenhouse gas emissions and their effects on the climate. Climate action plans list current emissions and outline strategies and actions to reduce them. Table 13 summarizes the recommendations and guidelines for climate action management.

4. Conclusions

Fossil fuels and their industrial enablers continue to choke our atmosphere, but a recent plateau hints at the possibility of breaking free. With fossil fuels still clinging to their dominance, targeting manufacturing, extraction, and industrial processes is key to driving emissions down. Cities play an important role in mitigating the effects of climate change. Cities are responsible for a significant portion of global greenhouse gas emissions, but they also have the potential to be leaders in climate action. Cities can reduce their emissions by investing in renewable energy, improving energy efficiency, and developing sustainable transportation systems. Greenhouse gas reporting and management systems are vital to reducing emissions and preventing economic damage. Greenhouse gas reporting and management systems help cities to track their emissions and identify opportunities for reduction. This information can be used to develop effective mitigation strategies and reduce the economic impacts of climate change. Therefore, climate change caused by greenhouse gas emissions can cause significant economic harm. The economic impacts of climate change are already significant, and they are projected to become more severe in the future.
Climate change can damage infrastructure, disrupt supply chains, and reduce agricultural yields. This can lead to job losses, higher prices, and economic recession. To address climate change, the world must transition to an economy that is based on net energy production or one that considers carbon emissions throughout its life cycle. A net zero emissions economy is one in which the amount of greenhouse gases emitted into the atmosphere is balanced by the amount of greenhouse gases removed from the atmosphere. This can be achieved by transitioning to renewable energy sources, improving energy efficiency, and developing carbon capture and storage technologies. For example, a crediting mechanism allows charging for achieved emissions reductions. Carbon crediting mechanisms allow companies and governments to buy and sell credits for reducing greenhouse gas emissions. This can help to incentivize emissions reductions and achieve climate mitigation goals. Carbon pricing works by capturing the external costs of carbon emissions, such as costs paid by the public, such as property loss due to earthquakes. Carbon pricing is a market-based approach to reducing greenhouse gas emissions. It works by putting a price on carbon emissions, which makes them more expensive to emit. This can incentivize businesses and individuals to reduce their emissions [28].
Companies can reduce their financial risk by investing in renewable and sustainable energy technologies to reduce their greenhouse gas emissions. Renewable energy systems, such as wind, geothermal, hydropower, and bioenergy, can help companies reduce their liability by providing clean energy without emitting greenhouse gases. The interactive chart by Johannes Friedrich, Mengpin Ge, and Andrew Pickens of the World Resources Institute (WRI) shows the top 10 greenhouse gas emitters from 1990 to 2016. The chart shows that China, the United States, India, and Russia are the top four emitters, and that their emissions have increased significantly since 1990 [29]. Scientists widely agree that greenhouse gas emissions from many different sources are causing the global climate to change. This means that climate change is a complex problem that cannot be solved by addressing just one source of emissions. Instead, a comprehensive approach is needed that addresses all sources of greenhouse gas emissions. For instance, NASA’s work on climate change is focused on two main areas: mitigation and adaptation [30]. NASA works to reduce emissions from a variety of sources, including power plants, vehicles, industry, and agriculture. NASA also promotes the development and deployment of clean energy technologies. Another example is that the Canadian Environmental Assessment Act (CEAA) 2012 provides guidance on how to assess the GHG emissions of designated projects [31]. Another important example would be the Intergovernmental Panel on Climate Change (IPCC) Summary for Policymakers (SPM), which is a concise summary of the key findings of the IPCC’s Fifth Assessment Report (AR5). The SPM is written for a non-specialist audience and is intended to inform policymakers about the latest science on climate change [2].
Although greenhouse gas emissions from individual projects may seem small on a global scale, it is still important for companies and cities to measure, manage, and report their emissions in order to meet regulatory requirements and succeed in the transition to a low-carbon economy. A well-functioning greenhouse gas management system is essential to achieve this. Authorities need to take the lead in evaluating performance and reporting to stakeholders to inspire, plan, and implement actions. Authorities also play an important role in reducing greenhouse gas emissions. They can do this by setting regulations, providing incentives, and educating the public. They can also lead by example by measuring, managing, and reporting their own emissions.

Funding

This research received no external funding.

Data Availability Statement

Not applicable.

Conflicts of Interest

The author declares no conflicts of interest.

References

  1. IPCC. Climate Change 2014: Synthesis Report. In Contribution of Working Groups I, II and III to the Fifth Assessment Report of the Intergovernmental Panel on Climate Change; IPCC: Geneva, Switzerland, 2014; p. 151. [Google Scholar]
  2. IPCC. Climate Change 2013: The Physical Science Basis. In Contribution of Working Group I to the Fifth Assessment Report of the Intergovernmental Panel on Climate Change; Stocker, T.F., Qin, D., Plattner, G.-K., Tignor, M., Allen, S.K., Boschung, J., Nauels, A., Xia, Y., Bex, V., Midgley, P.M., Eds.; Cambridge University Press: Cambridge, UK, 2013; p. 1535. [Google Scholar]
  3. Watts, N.; Adger, W.N.; Agnolucci, P.; Blackstock, J.; Byass, P.; Cai, W.; Chaytor, S.; Colbourn, T.; Collins, M.; Cooper, A. Health and climate change: Policy responses to protect public health. Lancet 2015, 386, 1861–1914. [Google Scholar] [CrossRef] [PubMed]
  4. IPCC. Climate change 2014: Impacts, adaptation, and vulnerability. Part A: Global and sectoral aspects. In Contribution of Working Group II to the Fifth Assessment Report of the Intergovernmental Panel on Climate Change; Field, C.B., Barros, V.R., Dokken, D.J., Mach, K.J., Mastrandrea, M.D., Bilir, T.E., Chatterjee, M., Ebi, K.L., Estrada, Y.O., Genova, R.C., et al., Eds.; Cambridge University Press: Cambridge, UK, 2014; p. 1132. [Google Scholar]
  5. McMichael, A.J.; Woodruff, R.E.; Hales, S. Climate change and human health: Present and future risks. Lancet 2006, 367, 859–869. [Google Scholar] [CrossRef] [PubMed]
  6. Woodward, A.; Smith, K.R.; Campbell-Lendrum, D.; Chadee, D.D.; Honda, Y.; Liu, Q.; Olwoch, J.; Revich, B.; Sauerborn, R.; Chafe, Z.; et al. Climate change and health: On the latest IPCC report. Lancet 2014, 383, 1185–1189. [Google Scholar] [CrossRef] [PubMed]
  7. Comparative Quantification of Health Risks: Global and Regional Burden of Disease Due to Selected Major Risk Factors; Ezzati, M.; Lopez, A.D.; Rodgers, A.; Murrgay, C.J.L. (Eds.) World Health Organization: Geneva, Switzerland, 2004; pp. 1543–1649.
  8. Quantitative Risk Assessment of the Effects of Climate Change on Selected Causes of Death, 2030s and 2050s; Hales, S.; Kovats, S.; Lloyd, S.; Campbell-Lendrum, D. (Eds.) World Health Organization: Geneva, Switzerland, 2014.
  9. Organization for Economic Co-Operation and Development (OECD). The Economic Consequences of Climate Change; OECD Publishing: Paris, France, 2015. [Google Scholar]
  10. Whitmee, S.; Haines, A.; Beyrer, C.; Boltz, F.; Capon, A.G.; de Souza Dias, B.F.; Ezeh, A.; Frumkin, H.; Gong, P.; Head, P.; et al. Safeguarding human health in the Anthropocene epoch: Report of the Rockefeller Foundation-Lancet Commission on planetary health. Lancet 2015, 386, 1973–2028. [Google Scholar] [CrossRef] [PubMed]
  11. International Energy Agency. Tracking Clean Energy Progress 2017; International Energy Agency: Paris, France, 2017.
  12. Hoornweg, D.; Sugar, L.; Gómez, C.L.T. Cities and greenhouse gas emissions: Moving forward. Environ. Urban. 2011, 23, 207–227. [Google Scholar] [CrossRef]
  13. Habert, G.; Miller, S.A.; John, V.M.; Provis, J.L.; Favier, A.; Horvath, A.; Scrivener, K.L. Environmental impacts and decarbonization strategies in the cement and concrete industries. Nat. Rev. Earth Environ. 2020, 1, 559–573. [Google Scholar] [CrossRef]
  14. Karimipour, H.; Tam, V.W.Y.; Le, K.N.; Burnie, H. A greenhouse-gas emission reduction toolkit at urban scale. Sustain. Cities Soc. 2021, 73, 103103. [Google Scholar] [CrossRef]
  15. Sethi, M.; Lamb, W.; Minx, J.; Creutzig, F. Climate change mitigation in cities: A systematic scoping of case studies. Environ. Res. Lett. 2020, 15, 093008. [Google Scholar] [CrossRef]
  16. Cochran, I.; Hubert, R.; Marchal, V.; Youngman, R. Public Financial Institutions and the Low-Carbon Transition: Five Case Studies on Low-Carbon Infrastructure and Project Investment; OECD Environment Working Papers; OECD Publishing: Paris, France, 2014; Volume 72. [Google Scholar]
  17. UNFCCC. Report of the Conference of the Parties on Its Twenty-First Session, Held in Paris from 30 November to 13 December 2015. Available online: https://unfccc.int/sites/default/files/english_paris_agreement.pdf (accessed on 11 October 2022).
  18. DEFRA. Guidelines to Department for Environment, Food and Rural Affairs (DEFRA)/Department of Energy and Climate Change (DECC) GHG Conversion Factors for Company Reporting. 2012. Available online: http://www.defra.gov.uk/publications/files/pb13773-ghg-conversion-factors-2012.pdf (accessed on 1 December 2023).
  19. Yaman, C. Greenhouse Gas Management. The Palgrave Handbook of Global Sustainability; Palgrave Macmillan: Cham, Switzerland, 2022; p. 1490. [Google Scholar]
  20. IPCC. IPCC Guidelines for National Greenhouse Gas Inventories; Intergovernmental Panel on Climate Change (IPCC): Hayama, Japan, 2006.
  21. Arafat, H.A.; Jijakli, K.; Ahsan, A. Environmental performance and energy recovery potential of five processes for municipal solid waste treatment. J. Clean. Prod. 2015, 105, 233–240. [Google Scholar] [CrossRef]
  22. Deus, R.M.; Mele, F.D.; Bezerra, B.S.; Battistelle, R.A.G. A municipal solid waste indicator for environmental impact: Assessment and identification of best management practices. J. Clean. Prod. 2020, 242, 118433. [Google Scholar] [CrossRef]
  23. Bong, C.P.C.; Lim, L.Y.; Ho, W.S.; Lim, J.S.; Klemes, J.J.; Towprayoon, S.; Ho, C.S.; Lee, C.T. A review on the global warming potential of cleaner composting and mitigation strategies. J. Clean. Prod. 2017, 146, 149–157. [Google Scholar] [CrossRef]
  24. Ryu, C. Potential of municipal solid waste for renewable energy production and reduction of greenhouse gas emissions in South Korea. J. Air Waste Manag. Assoc. 2012, 60, 176–183. [Google Scholar] [CrossRef] [PubMed]
  25. Intergovernmental Panel on Climate Change (IPCC). Fourth Assessment Report (AR4); IPCC: Geneva, Switzerland, 2007.
  26. USEPA. Emission Factors for Greenhouse Gas Inventories. 2020–1. Available online: https://www.epa.gov/climateleadership/ghg-emission-factors-hub (accessed on 2 January 2022).
  27. USEPA. Guide to Greenhouse Gas Management for Small Business & Low Emitters; U.S. EPA Center for Corporate Climate Leadership—Low Emitter Guidance; USEPA: Washington, DC, USA, 2022.
  28. Garnaut, R. Carbon Pricing and Reducing Australia’s Emissions; Garnaut Climate Change Review Update; Cambridge University Press: Cambridge, UK, 2011. [Google Scholar]
  29. Friedrich, J.; Ge, M.; Pickens, A.; Vigna, L. This Interactive Chart Explains World’s Top 10 Emitters, and How They’ve Changed. 2017. Available online: https://www.wri.org/blog/2017/04/interactive-chart-explains-worlds-top-10-emitters-and-how-theyve-changed (accessed on 1 December 2023).
  30. NASA. In Responding to Climate Change. Mitigation and Adaptation. 2020. Available online: https://climate.nasa.gov/solutions/adaptation-mitigation/ (accessed on 1 December 2023).
  31. CEAA. Canadian Environmental Assessment Protection Act 2012; Canadian Environmental Assessment Agency (CEAA): Ottawa, ON, Canada, 2012.
Figure 1. Greenhouse gas emissions of Scope 1, Scope 2, and Scope 3 [19].
Gases 04 00002 g001
Figure 2. GHG management structure [19].
Gases 04 00002 g002
Table 1. Definition GPC principles for preparing a greenhouse gas inventory.
PrincipleDescription
RelevanceGreenhouse gas emissions must be generated by activities and consumption that take place within the city limits
CompletenessAll sources of greenhouse gas emissions within the city’s inventory boundaries must be taken into account
ConsistencyOrganizations must calculate their emissions in a consistent and standardized way, using the preferred methodologies
ObjectivityTo verify an organization’s GHG emissions, the organization must clearly list and explain the activity data, emission sources, emission factors, and calculation methods used
AccuracyThe measurement of greenhouse gas emissions should be accurate and reliable
MeasurabilityThe data needed to complete the greenhouse gas inventory should be accessible in a reasonable amount of time and at a reasonable cost
Table 2. Scope 1 GHG direct emission sources [19].
Emission SourcesFacility Type
Fixed Units Residential Buildings
Corporate FacilitiesCommercial Buildings
Energy ProductionPower Plants
Energy Use in IndustryIndustrial Plants
Fugitive EmissionsLeaking pipes, landfills, unpaved roads, storage piles, construction operations
Mobile Units: Road, Railways, Ships, PlanesCars, planes, ships, trains
Waste landfillingLandfills
Biological Treatment of WasteBiomethanization plants, composting plants
CombustionWaste incineration plants
Wastewater DisposalWastewater treatment plants
Industrial Processes Industrial plants
Agriculture and Forestry Agricultural areas and forests
Table 3. Scope 3 greenhouse gas emission sources [19].
GHG Emissions SourcesIndirect GHG Emissions
LandfillingLandfills located outside the city borders are considered indirect emissions
Waste treatmentBiological waste treatment plants outside of the city borders
CombustionWaste incineration plants outside of the city borders
Wastewater disposalOff-boundary wastewater discharges
Road TransportRoad transport that crosses the border but starts and ends within the border
RailwaysRail journeys that cross the border but start and end within the border
ShipsNavigation trips that start within the border
PlanesAviation that starts and ends within the border
OtherScope 3 emissions that occur across borders
Table 4. Greenhouse gas emission rates for stationary combustion [26].
CO2CH4N2OTotal CO2-e
Biodiesel9.45
kg CO2/gal
0.14
g CH4/gal
0.01
g N2O/gal
9.45648
kg CO2-e/gal
Landfill Gas0.025254
kg CO2/ft3
0.001552
g CH4/ft3
0.000306
g N2O/ft3
0.0254
kg CO2-e/ft3
Natural Gas0.05444
kg CO2/ft3
0.00103
g CH4/ft3
0.0001
g N2O/ft3
0.0545
kg CO2-e/ft3
Coal coke2819
kg CO2/s-ton
273
g CH4/s-ton
40
g N2O/s-ton
2837.745
kg CO2-e/s-ton
Crude Oil10.29
kg CO2/gal
0.41
g CH4/gal
0.08
g N2O/gal
10.3241
kg CO2-e/gal
Municipal Solid Waste902
kg CO2/s-ton
318
g CH4/s-ton
42
g N2O/s-ton
922.466
kg CO2-e/s-ton
Plastics2850
kg CO2/s-ton
1216
g CH4/s-ton
160
g N2O/s-ton
2928.08
kg CO2-e/s-ton
Kerosene10.15
kg CO2/gal
0.41
g CH4/gal
0.08
g N2O/gal
10.1841
kg CO2-e/gal
Propane5.72
kg CO2/gal
0.27
g CH4/gal
0.05
g N2O/gal
5.7417
kg CO2-e/gal
Liquefied
Petroleum Gases
5.68
kg CO2/gal
0.28
g CH4/gal
0.06
g N2O/gal
5.7049
kg CO2-e/gal
Table 5. Greenhouse gas emissions covered in Paris Agreement.
GHGGlobal Warming Potential (GWP)
100 Years (kg CO2-e/kg)
GHG Sources
Carbon dioxide
(CO2)
1Fossil fuel combustion
Methane
(CH4)
25Waste processing, natural gas, oil and coal production
Nitrous Oxides
(N2O)
298Use of fertilizers
Hydrofluorocarbons4–12,400Industrial by-products
(HCFs)
Perfluorocarbons (PFCs)6630–23,500Production of aluminum, semiconductor, and refrigeration products
Sulfur hexafluoride (SF6)25,500Production of circuit breakers and switchgear
Nitrogen trifluoride
(NF3)
16,100Production of semiconductors, LCD panels, and lasers
Table 6. Greenhouse gas management policy and criteria.
Policy/CriteriaDefinition
ISO 14064Part 1: Requirements for greenhouse gas management systems
Part 2: Verification of greenhouse gas statements
Part 3: Application of ISO 14064 to GHG projects
GHG ProtocolScope definition: This defines the boundaries of the GHG inventory.
Inventory calculation: This calculates the amount of GHG emissions.
Reporting: This communicates the GHG inventory to stakeholders.
Verification: This ensures the accuracy of the inventory
Table 7. Overview of air quality management techniques [19].
SuggestionsGuidelines
Encourage employees to use transportation methods that produce fewer carbon emissionsProvide employees with incentives to use public transportation or low-emission vehicles
Provide employees with information about alternative transportation options, such as public transportation, biking, and walkingPublic transport opening hours should be made available in electronic format to reduce paper consumption
Provide secure bike parking for employees and visitorsProvide ample space for bike racks
Use vehicles with lower carbon emissions for your fleetProvide refueling stations for alternative fuels
Implement measures to decrease the number of vehicles with only one occupantConsider using carpooling or car sharing with friends, family, and colleagues
Develop a transportation system that can quantify carbon emission reductionsUse a software or program that is licensed or approved by a government agency to calculate emissions
Table 8. Overview of water management techniques [19].
SuggestionsGuidelines
Provide examples of implementing the targets of water consumption reduction Create a yearly water consumption report that shows the percentage reduction
Create a water management system that uses less water and works more effectivelyConstruct homes that use less water and using energy-efficient appliances at home
Put into practice a comprehensive pest management (IPM) planIntegrated pest management (IPM) is a method of controlling pests that uses both biological and chemical treatments. It emphasizes preventing pests through natural means, such as encouraging beneficial insects, rather than using chemical pesticides
Encourage employees or visitors to reduce water consumptionTo conserve water, use water-saving toilets and install a water-saving shower head
Create educational programs about water quality and water consumption Host seminars on water pollution and conservation
Use water-efficient irrigation techniques to reduce your water consumption and save moneyIrrigate your plants with non-potable water using drip irrigation
Harvest and recycle greywater Equip buildings with gray water treatment systems
Use water-saving car washing methodsUse water-saving nozzles with automatic shutoff functionality
Table 9. Overview of waste management techniques [19].
SuggestionsGuidelines
Safely and easily dispose of hazardous waste, such as heavy metals, paints, sealants, adhesives, and batteriesEstablish hazardous waste collection centers
Develop a waste reduction plan and promote the reuse, donation, and recycling of waste materialsDistribute educational materials on waste reduction, reuse, and recycling
Responsibly dispose of electronic waste (e-waste) by recycling or donating Develop and implement social responsibility projects to facilitate the collection and recycling of e-waste
Determine the amounts of waste and recycled waste generated annuallyReduce the amount of waste that goes to landfills by recycling, composting, donating, or reusing
Start a recycling and composting program with easy-to-follow instructions on how to separate wasteBuildings must have clearly marked recycling bins
Assess the current state of waste management facilities and establish goals for reducing, reusing, and recycling wasteAudits can be conducted by internal or external auditors
Start a composting programProvide educational materials on composting, including its processes and benefits
Reduce the use of paper and purchase climate friendly office suppliesCut down on paper usage with electronic document management
Table 10. Overview of energy management techniques [19].
SuggestionsGuidelines
Put in and use equipment that uses less energyEnergy management plans include switching off equipment that is not in use and setting equipment to low-power mode
Track and record energy use each yearTracking energy use on a monthly basis is the best way to find ways to save energy
Create an energy plan to lower energy use and boost efficiencyStarting a community energy management system (CEMS) to change the way local planning is done by giving top priority to energy efficiency and renewable energy
Encourage the use of renewable energyDevelop a way to make money by supporting renewable energy projects
Switch to LED technology for indoor and outdoor lightingUse LED lighting instead of traditional lights in new buildings
Track energy use each year and set and reach goals to reduce itTracking your energy use each month is the best way to find ways to save energy
Select energy efficiency strategies for your workplaceExamples of energy efficiency measures include turning off equipment at night and installing occupancy sensors
Table 11. Overview of supply chain management techniques [19].
SuggestionsGuidelines
Create a buying policy that gives priority to environmentally friendly, ethically produced, and locally made products and servicesGet materials, goods, services, and supplies from sustainable sources in your business operations
Review the criteria for sustainable purchasing with employees and suppliers each yearBring in people who are skilled at buying things cheaply and organize purchasing by working together effectively
Choose products that are good for the environment and made close to homeChoose to buy office supplies, cleaning products, food, drinks, and seafood that are made locally and are good for the environment
Buy electronics and housing appliances from companies that care about the environmentEncourage businesses to make products that are good for the environment
Request a shipping reduction plan from your suppliersSwitch to transportation methods that produce less greenhouse gas emissions per person or per unit of cargo transported
Track total purchases and the percentage of those purchases that are greenStart buying products and services with a lower carbon footprint
Use only as much packaging as is necessary to protect the product and prevent damageUse less packaging, choose climate friendly materials, and reuse them whenever possible
Table 12. Overview of organization management technique [19].
SuggestionsGuidelines
Provide training to employees on sustainability policies at least once a year, or more often if neededPrioritize sustainability and take calculated risks to innovate
Assign a staff member to be responsible for implementing the sustainability programIdentify sustainability programs, projects, and initiatives
Develop a sustainability planDevelop the ability to continuously identify issues that affect your organization’s long-term growth and build the knowledge and skills to deal with adverse factors
Teach new employees about the company’s sustainability goals and objectivesMake sure that your recruiting materials and job descriptions highlight the company’s sustainability goals and objectives
Table 13. Overview of climate action management techniques [19].
SuggestionsGuidelines
Organizations are required to implement climate action plans to reduce operational emissionsThink about ways to manage your energy use, reduce your emissions, and choose low-emission transportation options
Companies must establish a travel policy that promotes sustainability and reduces carbon emissionsProvide employees with information about sustainable travel options
Disclaimer/Publisher’s Note: The statements, opinions and data contained in all publications are solely those of the individual author(s) and contributor(s) and not of MDPI and/or the editor(s). MDPI and/or the editor(s) disclaim responsibility for any injury to people or property resulting from any ideas, methods, instructions or products referred to in the content.

