Article

Thermodynamic Analysis of Low-Emission Offshore Gas-to-Wire Firing CO2-Rich Natural Gas: Aspects of Carbon Capture and Separation Systems

by
Alessandra de Carvalho Reis
,
Ofélia de Queiroz Fernandes Araújo
and
José Luiz de Medeiros
*
Escola de Química, Federal University of Rio de Janeiro, CT, E, Ilha do Fundão, Rio de Janeiro 21941-909, RJ, Brazil
*
Author to whom correspondence should be addressed.
Gases 2024, 4(2), 41-58; https://doi.org/10.3390/gases4020003
Submission received: 12 December 2023 / Revised: 27 February 2024 / Accepted: 19 March 2024 / Published: 25 March 2024

Abstract

:
Despite the growth of renewable energy, fossil fuels dominate the global energy matrix. Due to expanding proved reserves and energy demand, an increase in natural gas power generation is predicted for future decades. Oil reserves from the Brazilian offshore Pre-Salt basin have a high gas-to-oil ratio of CO2-rich associated gas. To deliver this gas to market, high-depth long-distance subsea pipelines are required, making Gas-to-Pipe costly. Since it is easier to transport electricity through long subsea distances, Gas-to-Wire instead of Gas-to-Pipe is a more convenient alternative. Aiming at making offshore Gas-to-Wire thermodynamically efficient without impacting CO2 emissions, this work explores a new concept of an environmentally friendly and thermodynamically efficient Gas-to-Wire process firing CO2-rich natural gas (CO2 > 40%mol) from high-depth offshore oil and gas fields. The proposed process prescribes a natural gas combined cycle, exhaust gas recycling (lowering flue gas flowrate and increasing flue gas CO2 content), CO2 post-combustion capture with aqueous monoethanolamine, and CO2 dehydration with triethylene glycol for enhanced oil recovery. The two main separation processes (post-combustion carbon capture and CO2 dehydration) have peculiarities that were addressed at the light shed by thermodynamic analysis. The overall process provides 534.4 MW of low-emission net power. Second law analysis shows that the thermodynamic efficiency of Gas-to-Wire with carbon capture attains 33.35%. Lost-Work analysis reveals that the natural gas combined cycle sub-system is the main power destruction sink (80.7% Lost-Work), followed by the post-combustion capture sub-system (14% Lost-Work). These units are identified as the ones that deserve to be upgraded to rapidly raise the thermodynamic efficiency of the low-emission Gas-to-Wire process.

1. Introduction

Global warming concerns have been the subject of several international agreements. The rising utilization of renewable energies is a remarkable fact; however, fossil fuels still lead the global energy matrix. A large increase in natural gas power generation is expected in the next decades as a result of the expanding natural gas (NG) reserves and considering that NG is the cleanest fossil fuel [1].
Deep-water oil reserves of the Brazilian Pre-Salt offshore layer have a high gas–oil ratio, with CO2-rich associated gas (CO2 > 40%mol) [2]. Despite the low-quality gas, large investments in long-distance subsea pipelines are necessary to carry this NG to market [3].
In this scenario, an alternative to bypass both CO2 and NG transport infrastructures (Gas-to-Pipe) is to install floating Gas-to-Wire (GTW) plants, adopting NG Combined Cycle (NGCC) power plants [4]. These plants, placed on the offshore gas field, convert the raw produced gas directly into electricity, which is exported to onshore facilities through long-distance High-Voltage Direct Current (HVDC) cables [5] for less losses [6].
Existing offshore GTW plants (≈600 MW) are not concerned with the destination of CO2, sending it into the atmosphere. To mitigate CO2 emissions, GTW must include carbon capture and storage (CCS) to achieve emission goals [7] by decreasing the carbon footprint of power generation [8]. Captured CO2 reinjection into the reservoir as Enhanced Oil Recovery (EOR) fluid [9] is a solution for CO2 storage while improving oil production [10], as well as offering additional monetary leverage [11]. Hassanpouryouzband et al. [12] showed that more than 90% of the injected stream of CO2 can be stored. Hassanpouryouzband et al. [13] pointed out that it is essential to control the injection pressure to enhance CO2 storage efficiency. Hydraulic fracturing increases the permeability of oil and gas reservoirs [14], improving CO2 storage [15].
Araújo et al. [16] evaluated CCS technologies, such as chemical absorption, physical absorption, membrane permeation, and hybrids. These authors detected that chemical absorption holds the lowest CO2 emission per ton of injected CO2. Hetland et al. [17] performed theorical GTW-CCS research, studying the implementation of post-combustion carbon capture (PCC) downstream a Siemens-NGCC. In their system, the NGCC plant flue gas was sent to a PCC unit using aqueous monoethanolamine (MEA). The authors pointed out that the GTW-CCS concept is feasible, although CO2-EOR stream dehydration was not taken into account.
Aiming to achieve the carbon neutrality of GTW-CCS processes, the implementation of gas turbine exhaust gas recirculation (EGR) has been considered in the literature [18]. By lowering the exhaust gas flowrate and increasing its CO2 content, EGR facilitates the CO2 capture step, because a higher CO2 content increases the driving force for CO2 absorption, lowering column height, while a lower flue gas flowrate lowers column diameter. These both reduce the CCS penalty by lowering investment [19]. In addition, EGR diminishes NOX emissions, since the circulating oxygen and nitrogen concentrations decrease in the cycle [20].
To implement GTW-CCS over offshore deep-water oil and gas fields, the process must include the following: (i) EGR; (ii) post-combustion carbon capture from CO2-rich flue gas via absorption in aqueous monoethanolamine (aqueous-MEA), i.e., the PCC-MEA plant; (iii) CO2 compression; (iv) high-pressure CO2 dehydration (CO2-DEHY) for lower water content (≈200 ppm-mol), avoiding CO2 hydrates [21]; and (v) dense CO2 injection in the oil and gas field for EOR. Offshore GTW for CO2-rich NG with EGR, CCS, and CO2-DEHY is written here as GTW-EGR-CCS-CO2-DEHY.
There is a gap in the literature regarding the GTW-EGR-CCS-CO2-DEHY overall process, the singularities of its separation sub-systems—i.e., the PCC-MEA plant and CO2-DEHY plant—and the thermodynamic analysis of the overall system and its sub-systems (second law analysis). To fill this gap, the present work assesses GTW-EGR-CCS-CO2-DEHY and conducts a thermodynamic analysis of the overall system and sub-systems, as well as exploring the peculiarities of its separation sub-systems. Thermodynamic analysis identifies power destruction sinks and quantifies the Lost-Work of the overall system and its sub-systems, aiming to identify process units that should be improved to increase the overall thermodynamic efficiency.

2. Methods

Offshore GTW-EGR-CCS-CO2-DEHY, using CO2-rich NG and exporting CO2-to-EOR and power, was designed and simulated in Aspen-HYSYS 10 for technical and thermodynamic assessments. The necessary theory, process descriptions, process complexity, and methods are discussed in this section.

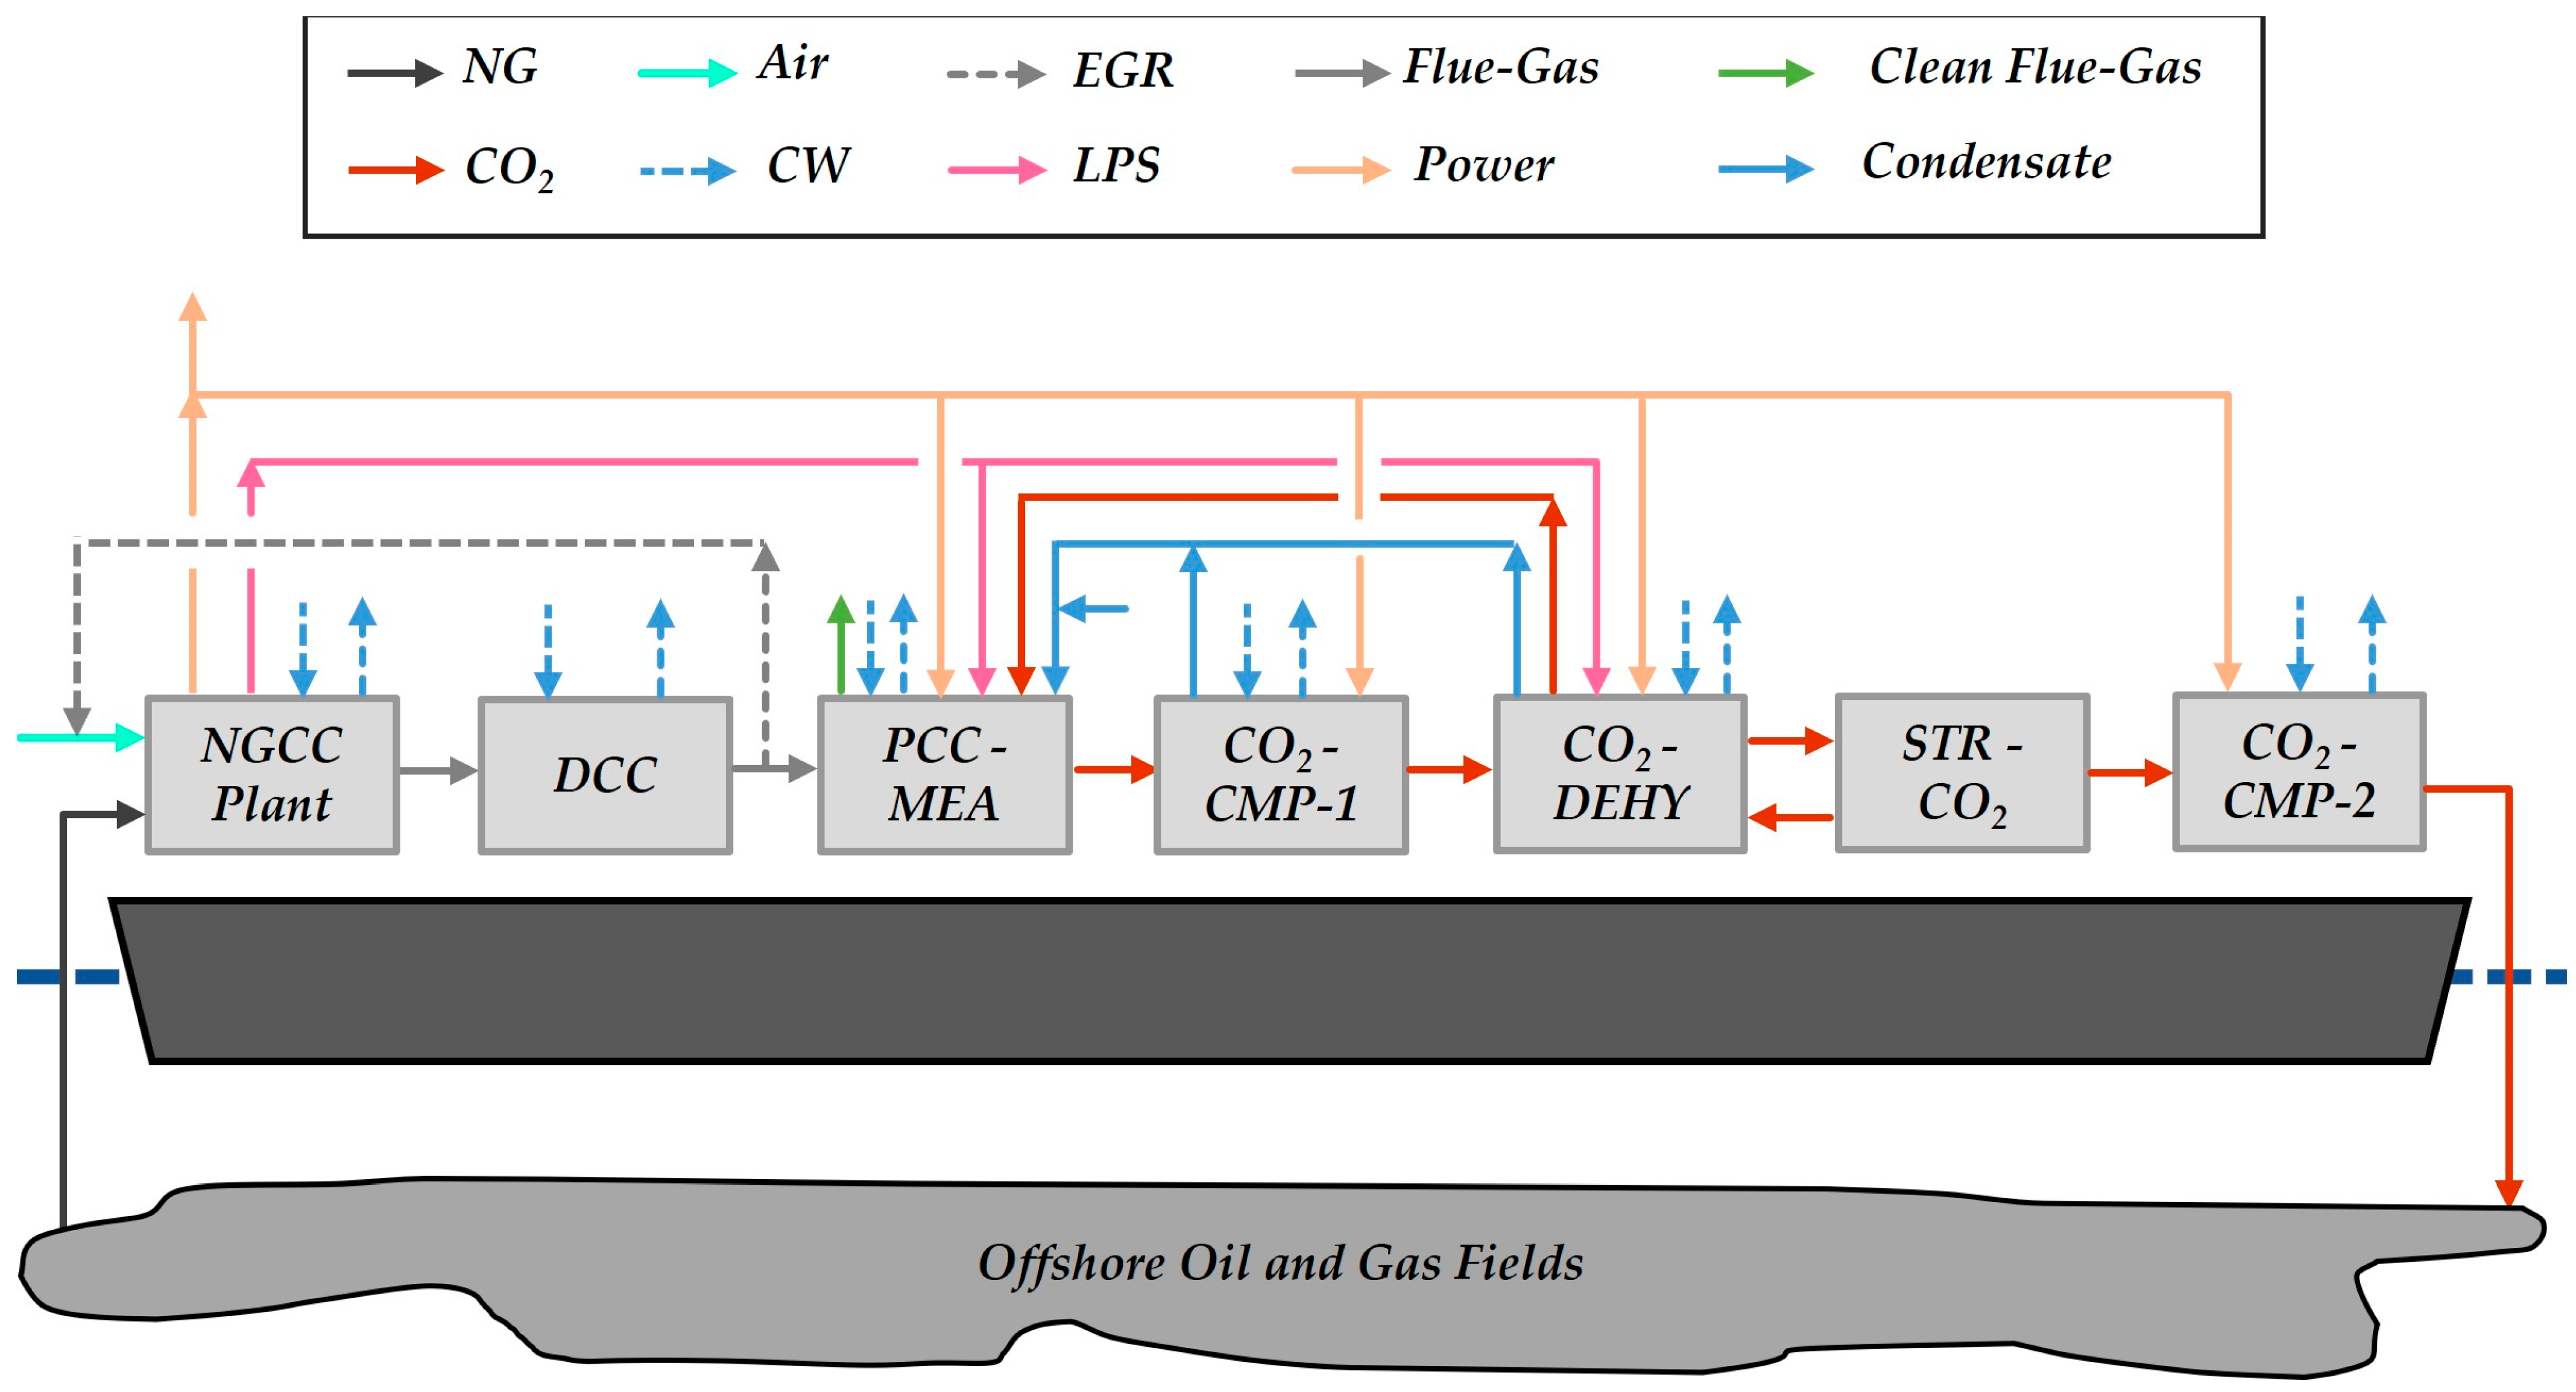
2.1. Process Framework

Figure 1 depicts a block diagram representing GTW-EGR-CCS-CO2-DEHY and subsystems. Medium-capacity (≈600 MW) offshore GTW-EGR-CCS-CO2-DEHY structure comprehends the following: (i) NGCC plant; (ii) Direct-Contact Column (DCC) that cools down the flue gas; (iii) low-pressure PCC-MEA for CO2 capture; (iv) first CO2 Compression Unit (CO2-CMP-1); (v) high-pressure CO2 dehydration unit (CO2-DEHY) with triethylene-glycol (TEG) for water removal from the CO2-to-EOR stream; (vi) CO2 Stripping Gas Unit (STR-CO2) that produces the stripping gas to the CO2-DEHY reboiler; (vii) second CO2 Compression Unit (CO2-CMP-2) that sends CO2-to-EOR; and (viii) EGR arrangement.

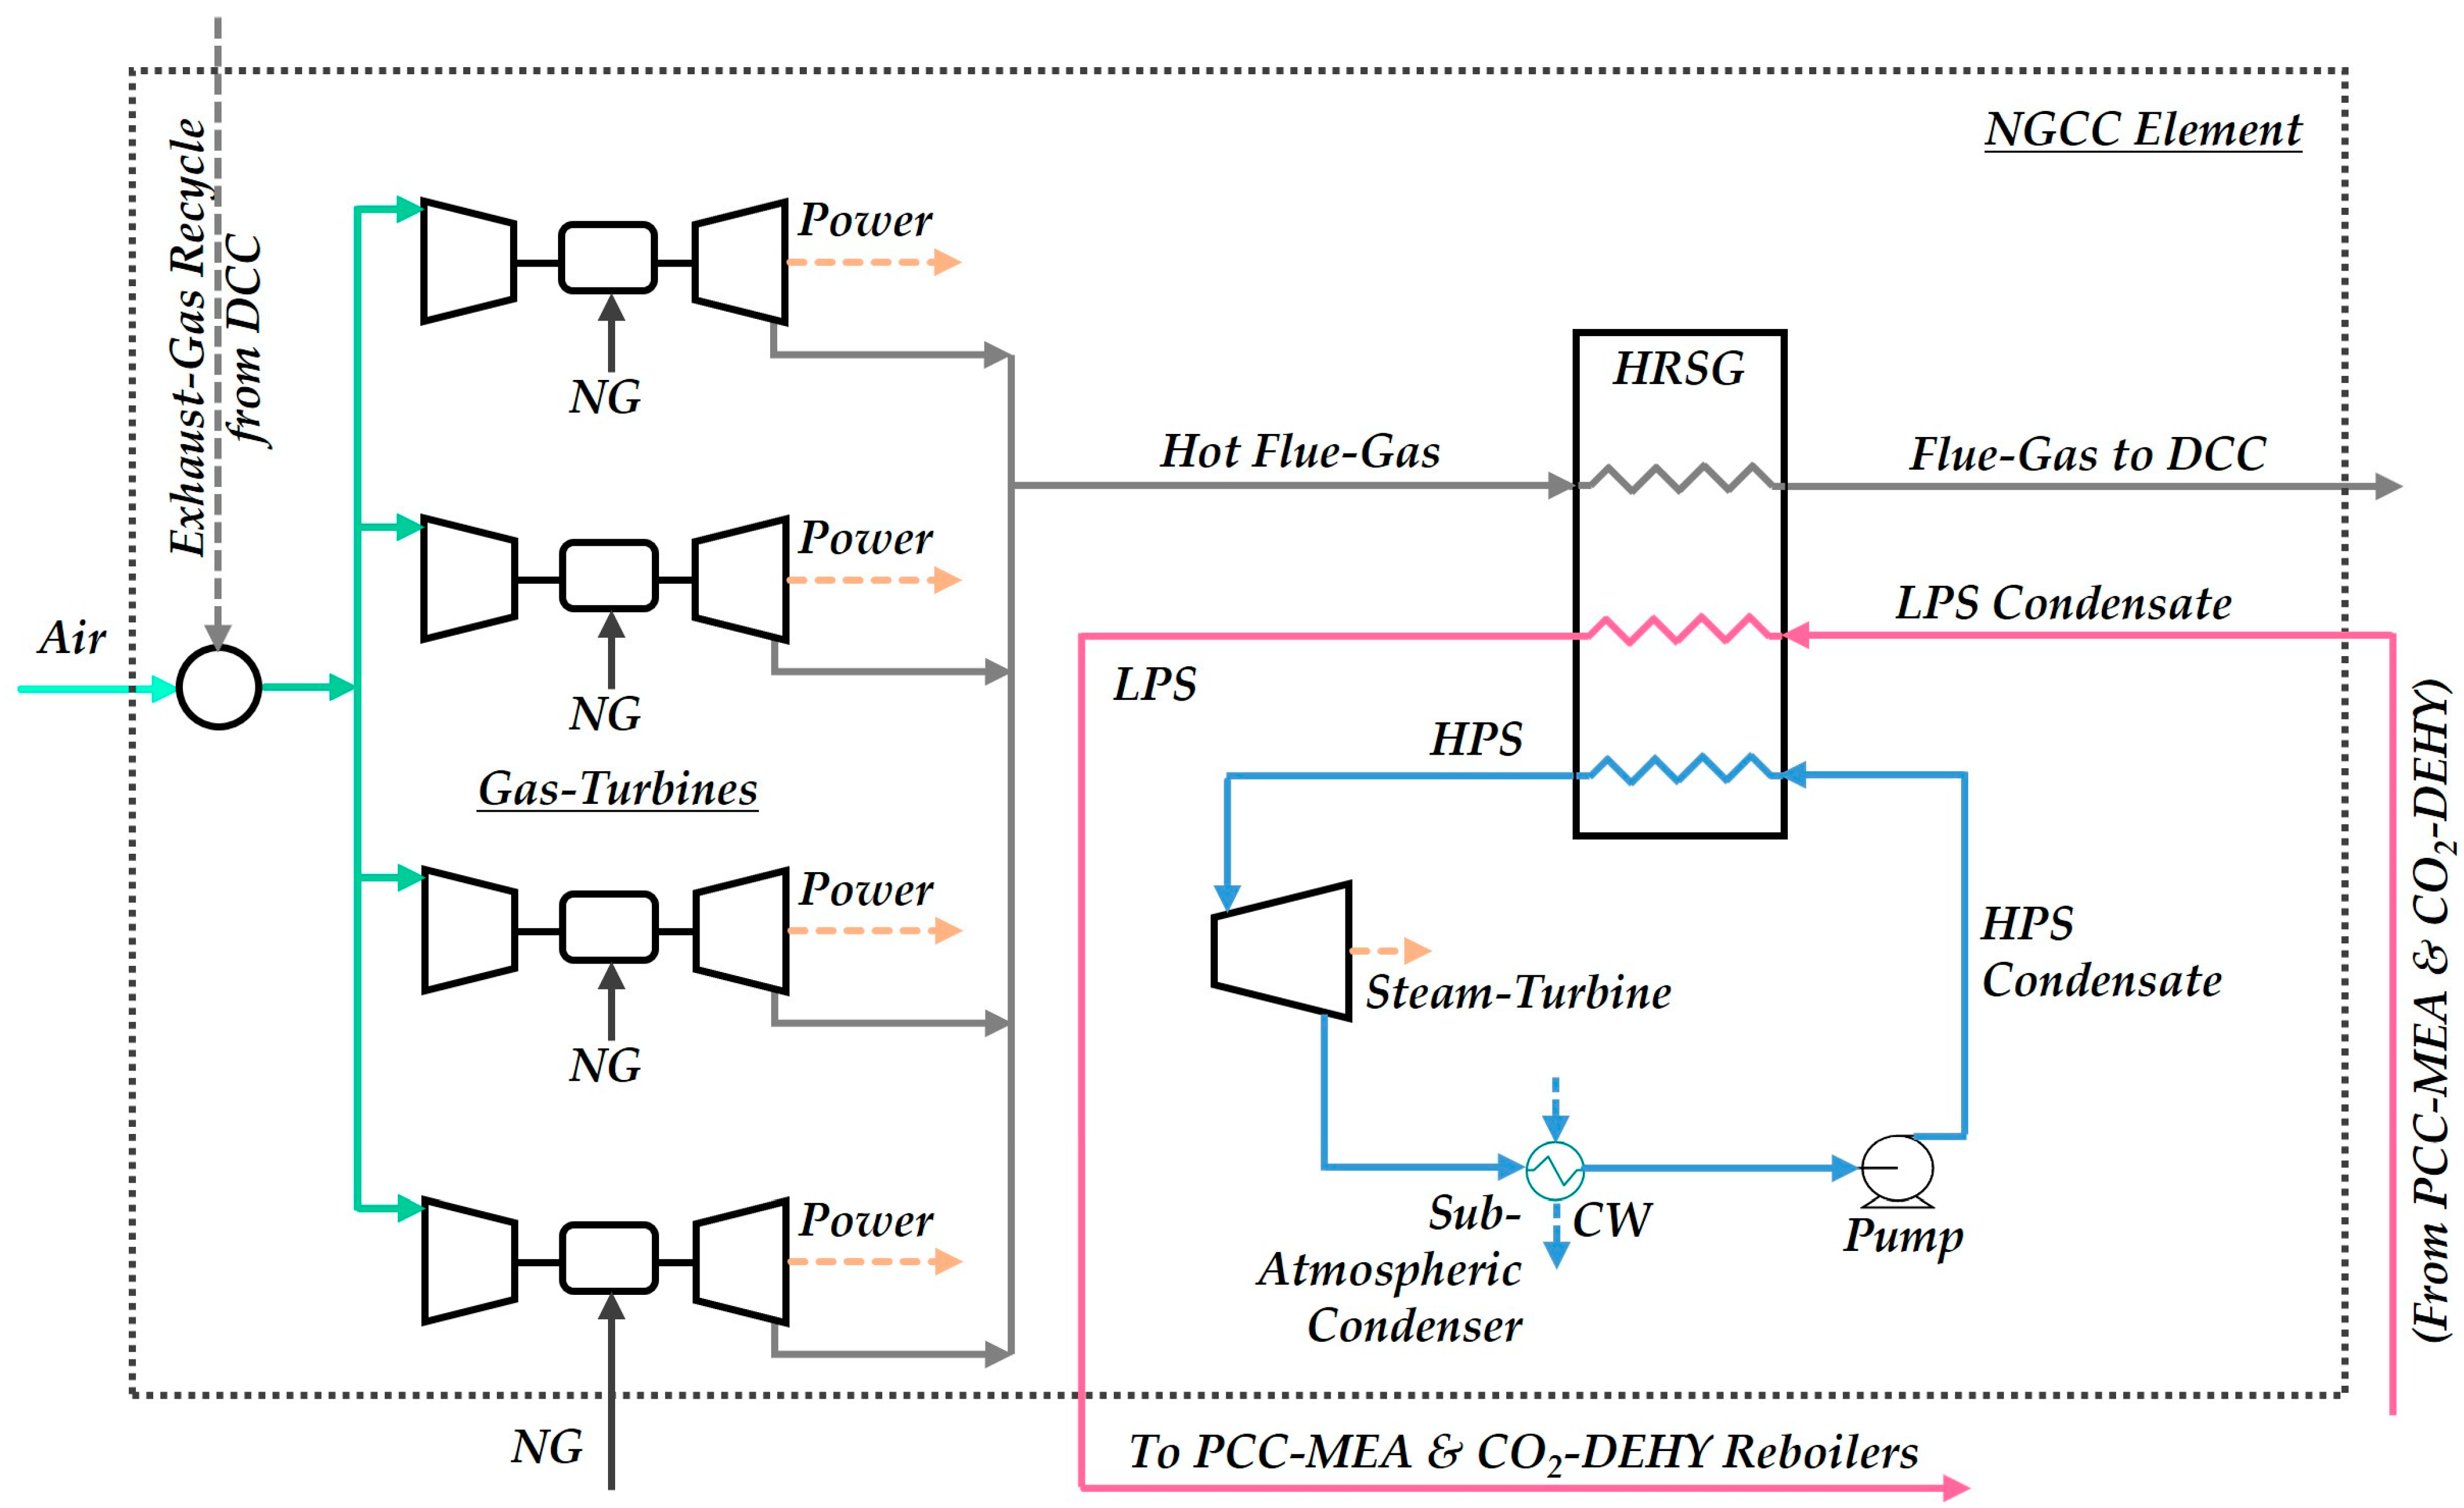
2.1.1. Natural Gas Combined Cycle Plant

The NGCC plant comprises five NGCC elements for adequate electricity output (≈600 MW). As shown in Figure 2, each NGCC element contains four parallel gas turbines united to one Heat Recovery Steam Generator (HRSG), which heats a steam cycle (Rankine cycle). Aero-derivative gas turbines (Table 1) are applicable for offshore rigs considering their high power-to-weight ratio and low footprint [22]. Gas turbines fire raw CO2-rich NG (CO2 > 40%mol) without any conditioning. The generated flue gas feeds the HRSG at T = 549 °C [23], producing High-Pressure Superheated Steam (HPS) (T = 524 °C, P = 24 bar) and Low-Pressure Steam (LPS, T = 160 °C, P = 6 bar). Følgesvold et al. [24] presented the HRSG temperature approaches and head losses. The steam turbine receives the HPS and expands it to P = 0.12 bar. The resulting stream is cooled down in the sub-atmospheric condenser with Cooling Water (CW), arriving as condensation to the HRSG (T = 45 °C). The generated LPS heats PCC-MEA and CO2-DEHY reboilers; therefore, the steam cycle power is controlled by LPS demand. The gas turbine model in HYSYS involves the following: (i) adiabatic single-stage air compressor; (ii) combustion chamber modeled as adiabatic conversion reactor; and (iii) adiabatic expander. This model was adjusted to manufacturing data by calibrating the adiabatic efficiencies of its air compressor and expander. Air is provided at stoichiometric proportion for complete NG combustion. To restrict the combustion temperature to factory settings, stoichiometric air is mixed with Exhaust Gas Recycle (EGR). Recycled flue gas is removed after the DCC and before the PCC-MEA, and its flowrate is adjusted to reach the prescribed flue gas temperature at the expander outlet (T = 549 °C).

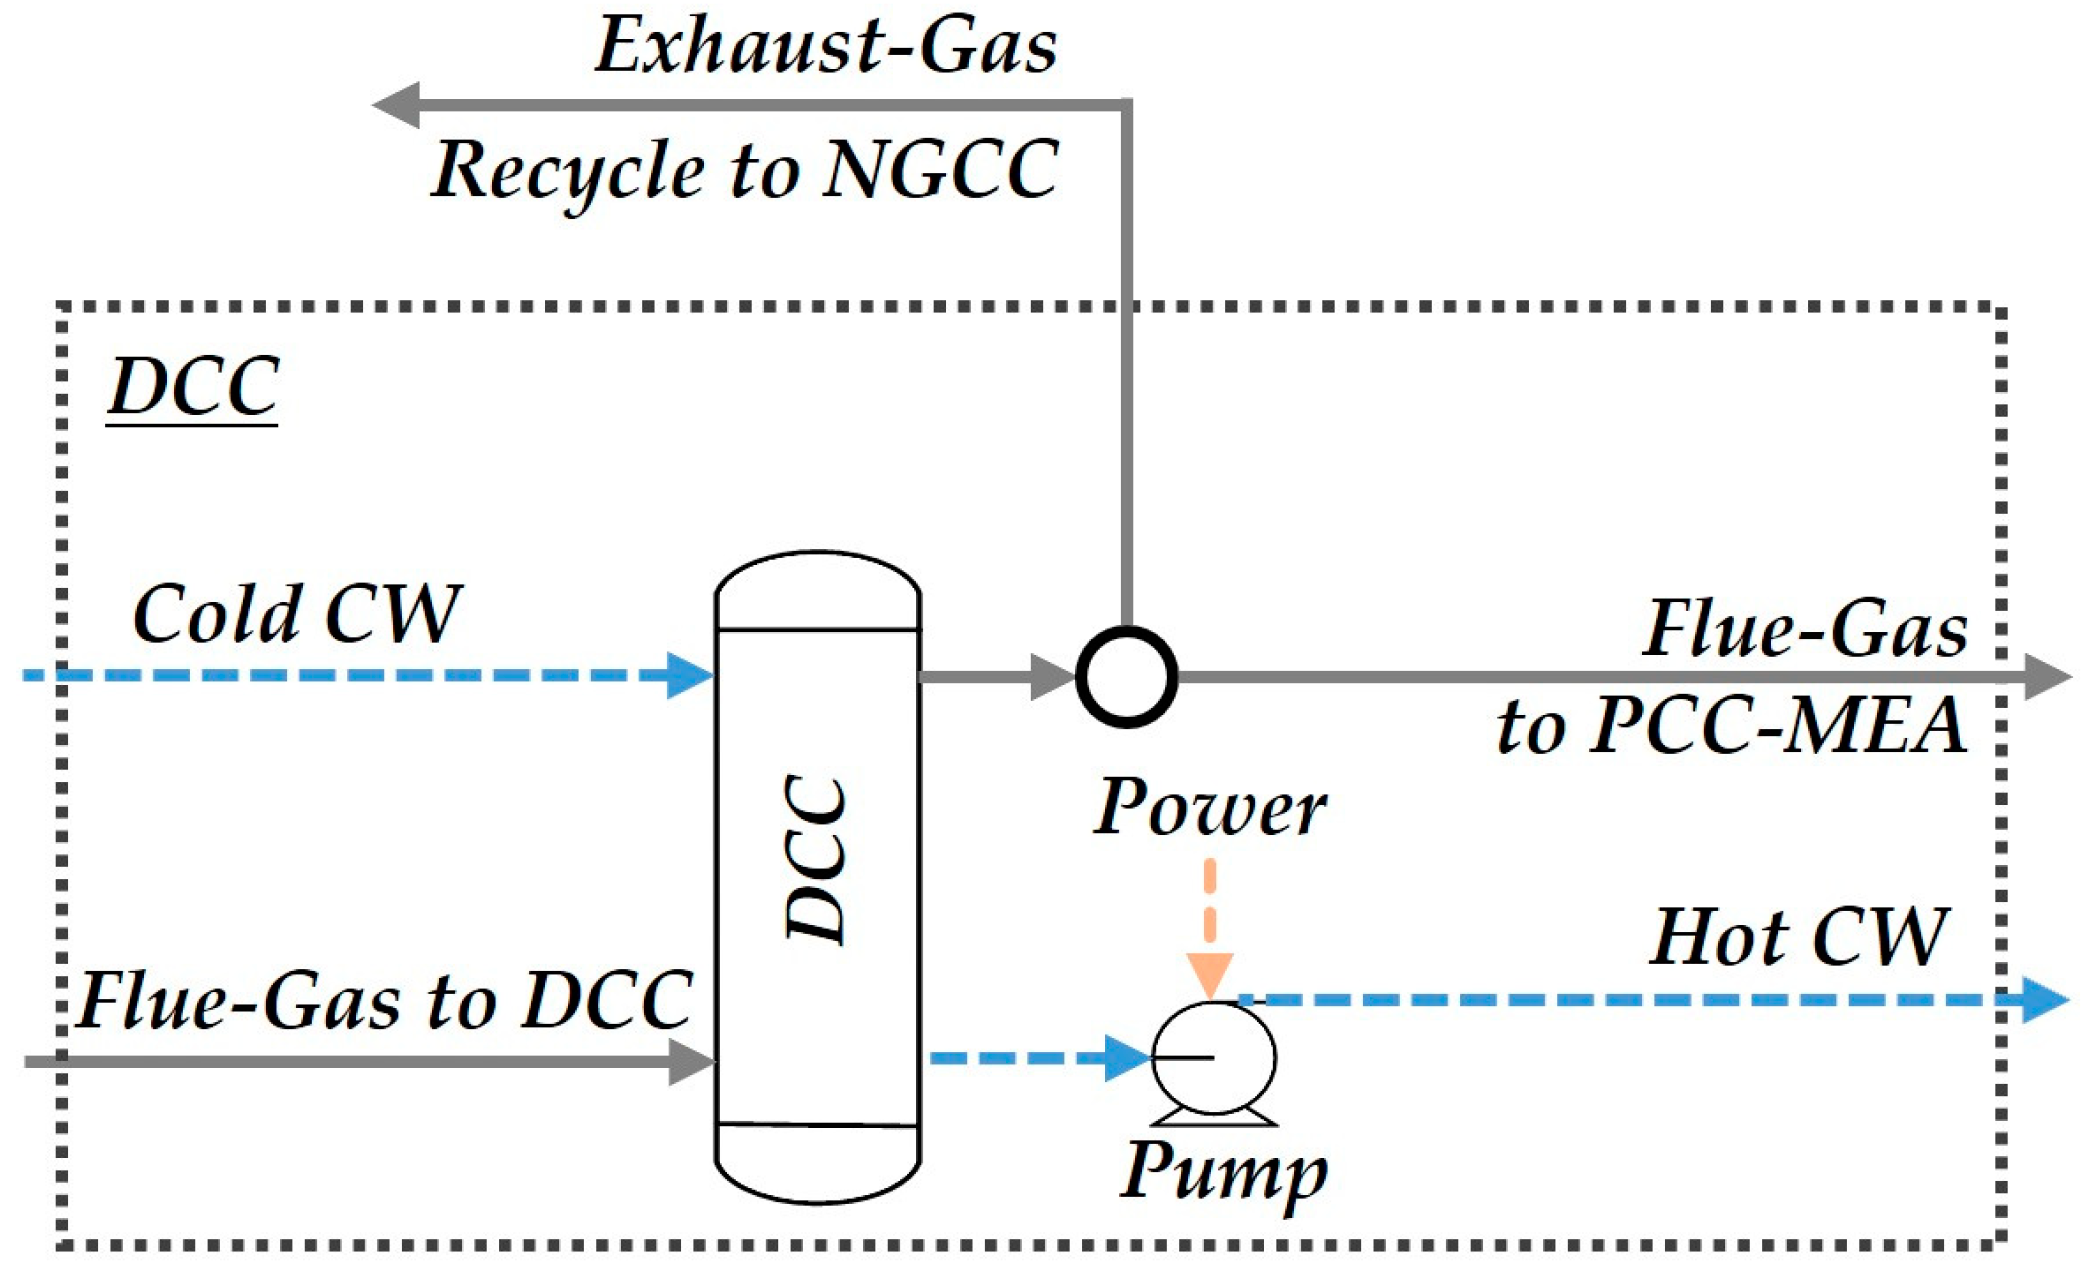
2.1.2. Direct-Contact Column

The DCC (Figure 3) receives flue gas from the five NGCC elements and cools them down to 40 °C via direct contact with CW (T = 30 °C). The cooled flue gas is split by (i) about 65% recycles as EGR and is mixed to the gas turbine air feed, decreasing the flame temperature, and (ii) the rest is forwarded to the PCC-MEA unit.

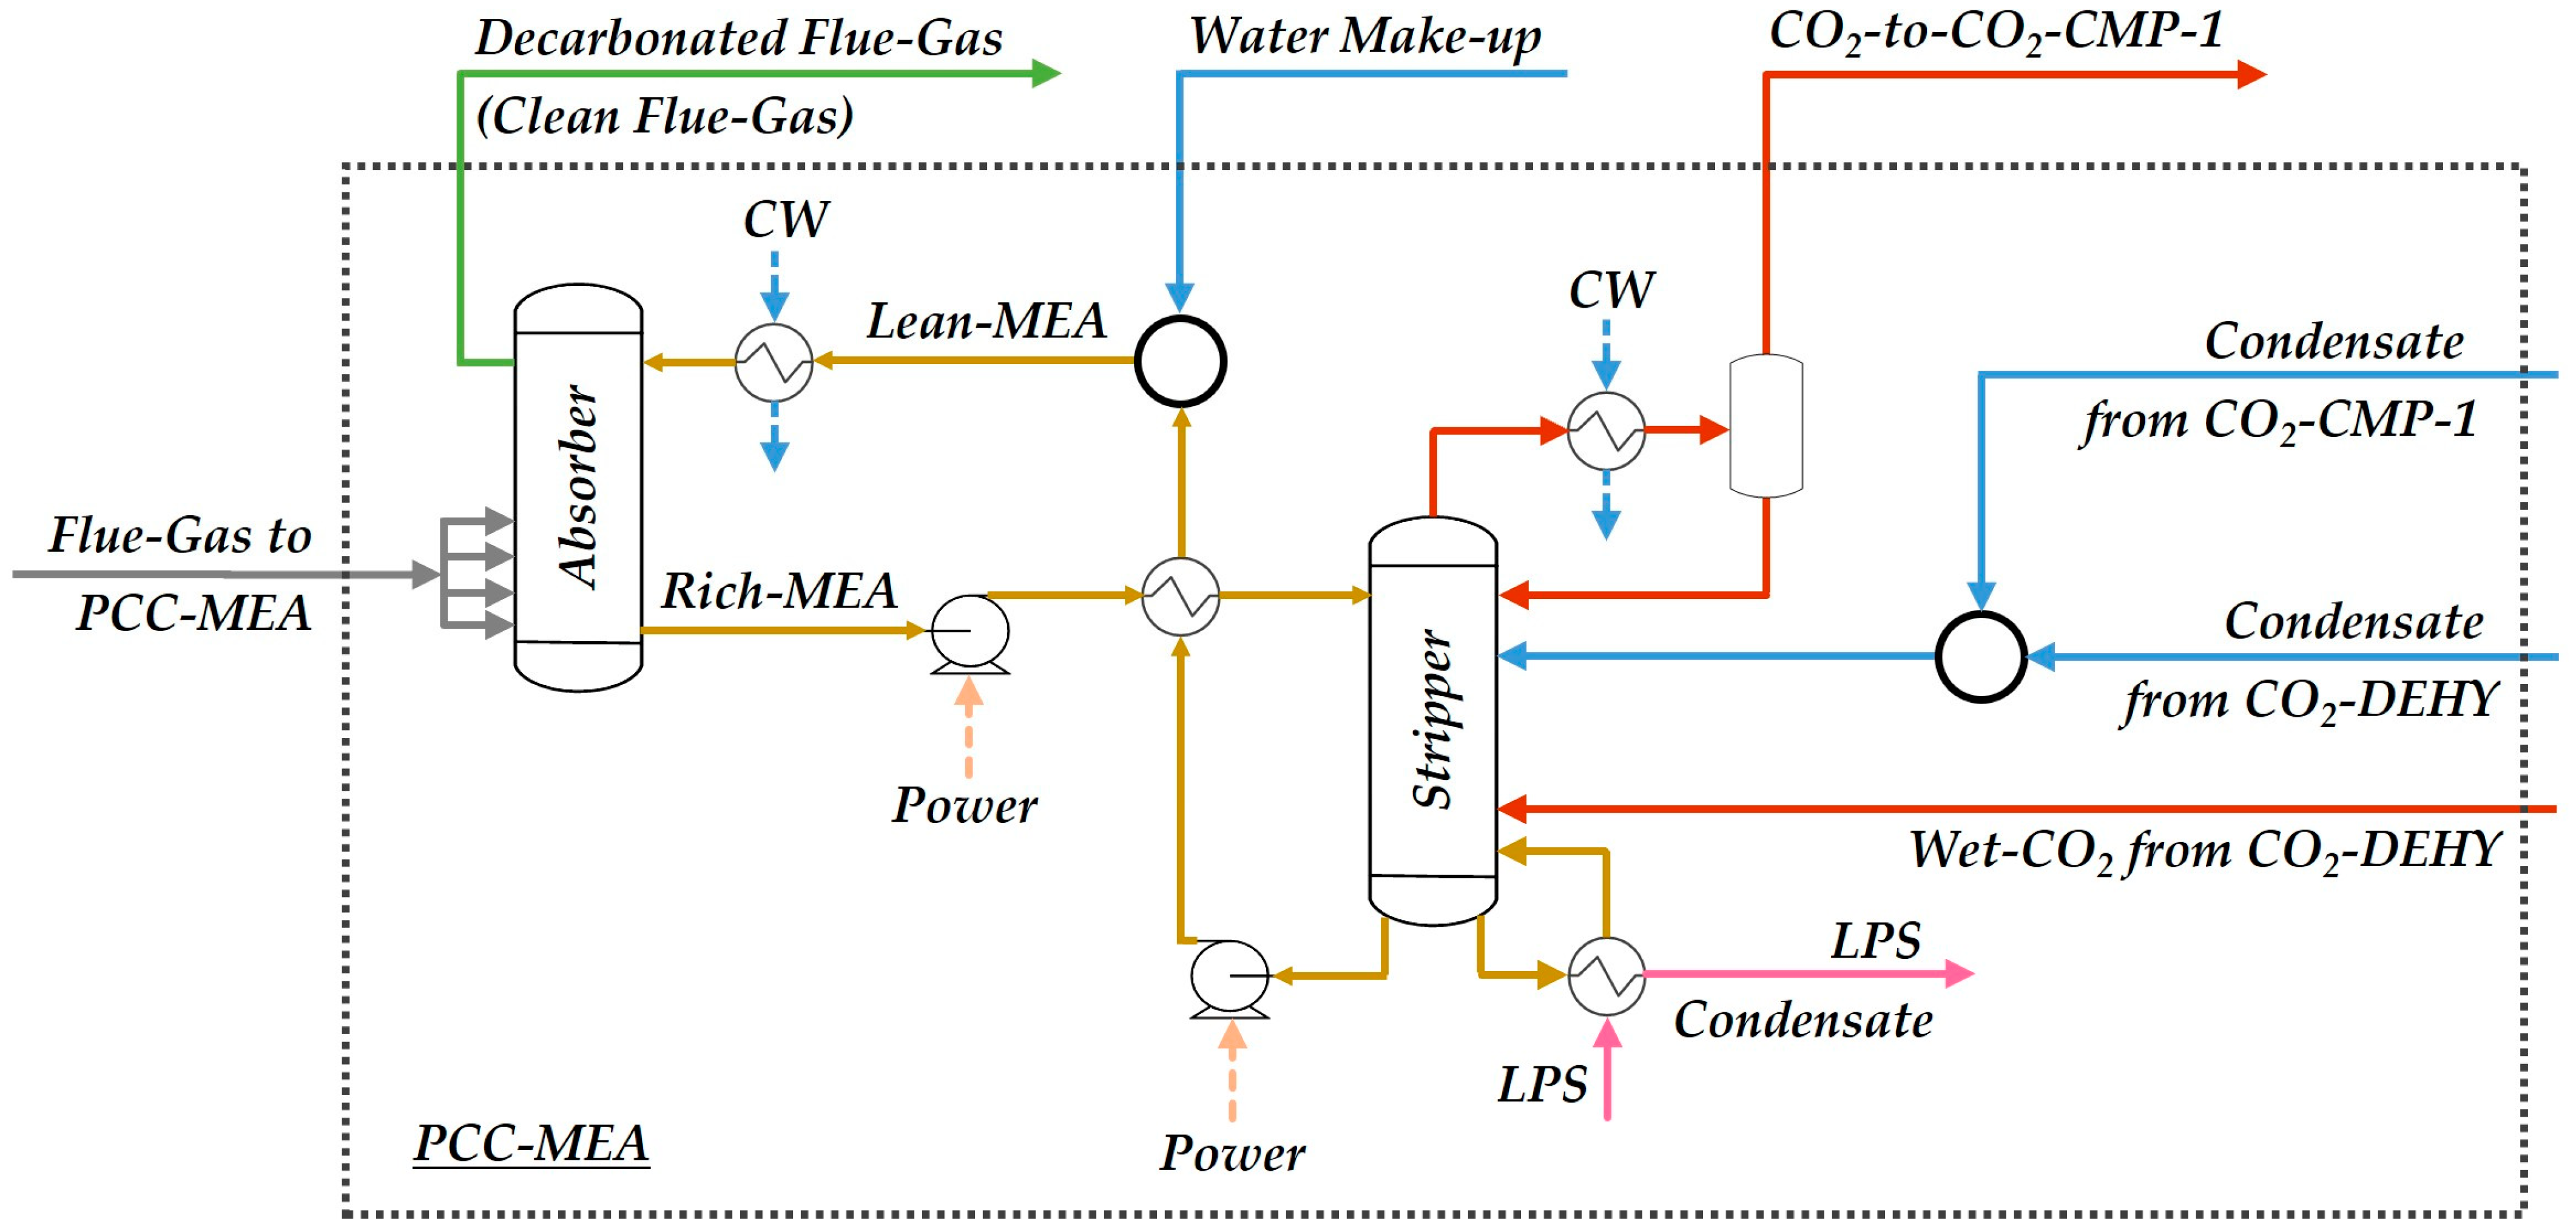
2.1.3. Post-Combustion Capture with Aqueous-MEA

The flue gas that arrives at PCC-MEA is divided into four smaller feeds (Figure 4) in order to improve the capture efficiency [25]. PCC-MEA is designed to capture 90% of the CO2 flue gas under two primordial parameters that define solvent recirculation and stripper duty: the Capture Ratio (CR: kg of fresh solvent per kg of captured CO2) and the stripper Heat Ratio (HR: GJ of heat per CO2 ton). Ideal values for the CR (10–15 kgSolvent/kgCO2) and HR (2.0–4.5 GJ/tCO2) for aqueous-MEA are reported by Araújo et al. [26].
The atmospheric PCC-MEA stripper requires LPS (P = 6 bar, T = 160 °C) to heat its reboiler (T = 103 °C). The stripper condenser operates in total reflux, i.e., it refluxes 100% condensation and distillates water-saturated CO2 (P = 1 atm) through its vent. To maintain CO2 confined in the CO2 loop between the PCC-MEA and CO2-DEHY units, all the condensed carbonated waters (T = 35 °C) from CO2-CMP-1 knock-out vessels and from the TEG stripper condenser (T = 40 °C) are recycled to the PCC-MEA stripper tray#1, while water-saturated CO2 from the TEG stripper condenser vent (T = 40 °C) is recycled to tray#10. This recycling enables a reduction in make-up water and condenser duty, as well as blocks CO2 emissions from CO2-CMP-1 and CO2-DEHY units. After receiving make-up water, a pump recirculates lean-MEA (MEA ≈ 30% w/w) to the PCC-MEA absorber.

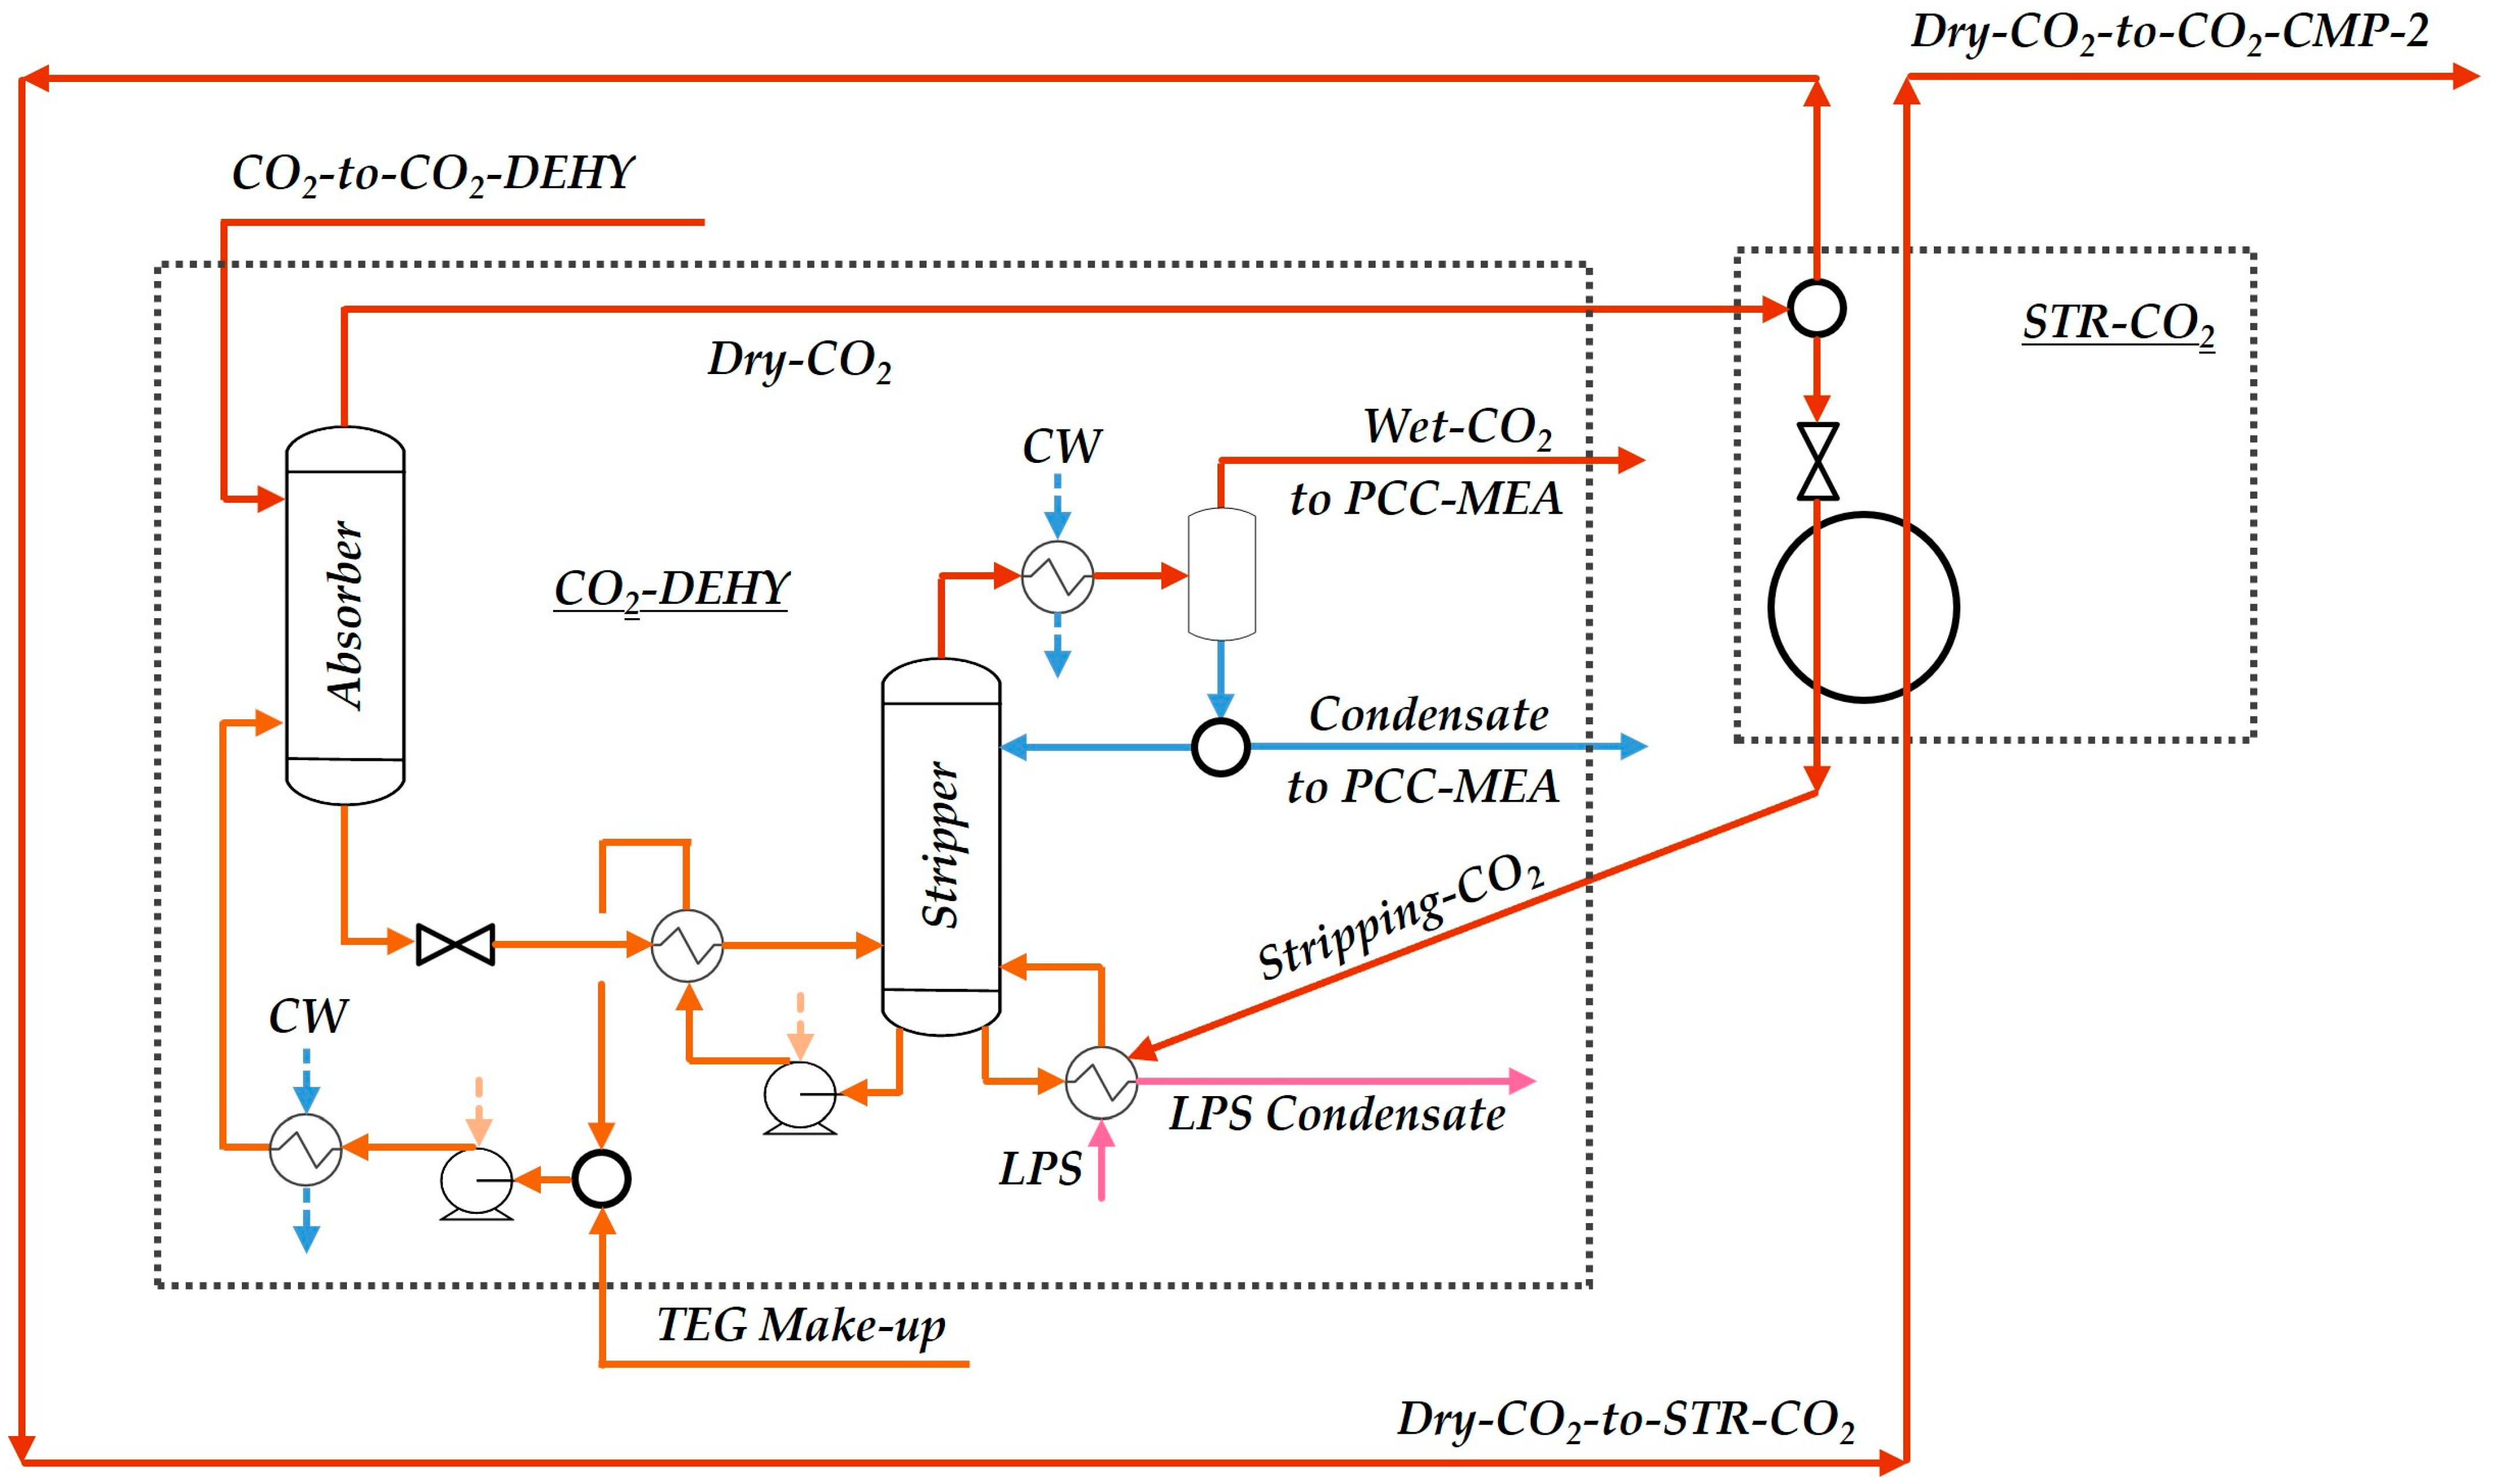
2.1.4. CO2 Dehydration TEG Unit and CO2 Stripping Gas Unit

The CO2 stream arrives at CO2-DEHY (Figure 5) at a high pressure (50 bar), favoring water removal [27]. The CO2-to-CO2-DEHY stream (≈2700 ppm-mol H2O) and TEG solvent (TEG = 98.5%w/w) feed the 15-stage TEG absorber, generating Dry-CO2 to STR-CO2 (≈200 ppm-mol H2O). This unit is the top product, and rich-TEG (TEG ≈ 60%mol) is the bottom product. TEG solvent is regenerated in the 10-stage TEG stripper, producing lean-TEG as the bottom product (T = 138 °C), and the top distillates water-saturated CO2 vapor and carbonated liquid water in the partial condenser. Both water and CO2 distillates are recycled to the stripper of the PCC-MEA unit, avoiding CO2 emissions and water losses. STR-CO2 is a small-scale unit that produces stripping gas (1% of Dry-CO2) in order to keep the TEG stripper reboiler temperature below the TEG degradation temperature (T ≈ 206 °C) [28,29]. Although some operators limit the reboiler temperature to 190–200 °C [30], the present study was more conservative and maintained the reboiler temperature below 140 °C to improve TEG durability, eliminating reposition costs. The residual Dry-CO2 is forwarded to CO2-CMP-2 to reach the EOR pipeline pressure (P = 300 bar). In the STR-CO2 unit, these two Dry-CO2 streams feed a countercurrent heat exchanger, allowing for a slight temperature reduction (≈0.5 °C) in the CO2-to-EOR stream.

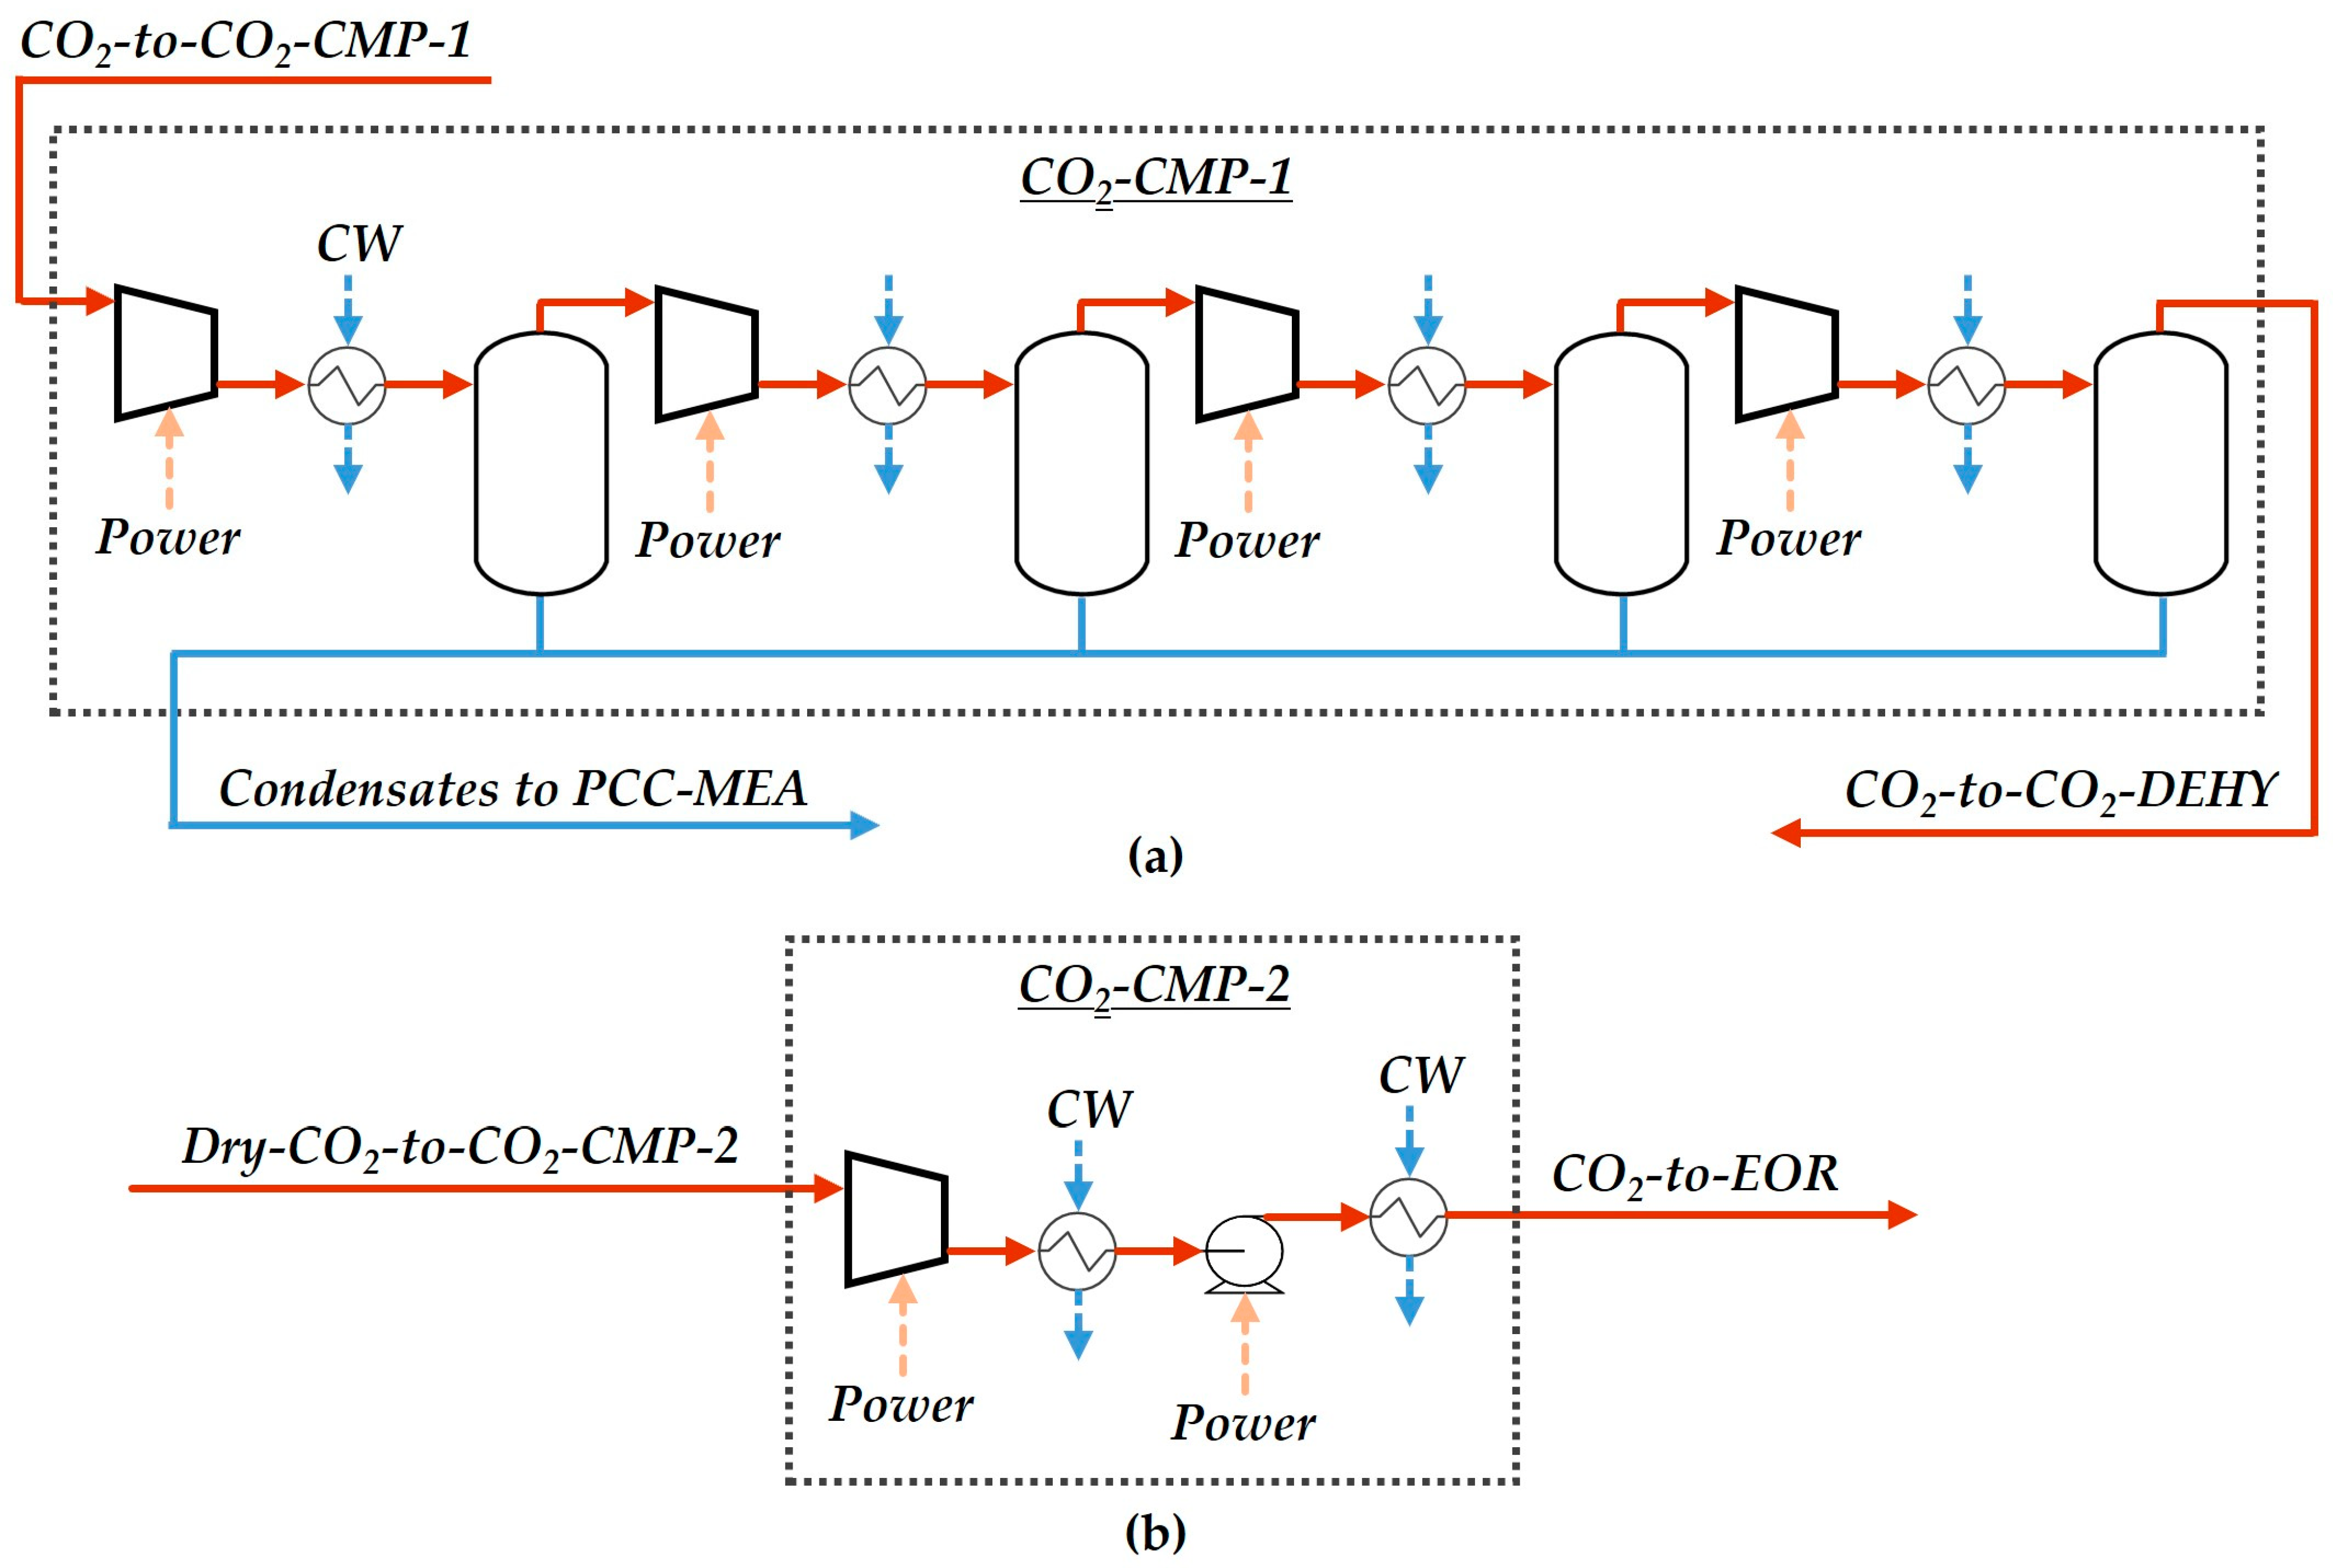
2.1.5. CO2 Compression Units

CO2-CMP-1 (Figure 6a) is a four-stage intercooled compression train (stage–compression ratio = 2.85) to increase the CO2 stream pressure to 50 bar for feeding the CO2-DEHY unit. CO2-CMP-2 (Figure 6b) receives the Dry-CO2 from STR-CO2 and pressurizes the stream in order to reach the EOR pipeline pressure (P = 300 bar).

2.1.6. Equipment Conditions and Process Simulation Assumptions

The main process simulation assumptions and equipment conditions are shown in Table 1.
Table 1. Simulation assumptions.
ItemAssumption
A1Thermodynamic ModelsGas streams: Peng–Robinson equation of state;
Rankine cycle: ASME steam table; PCC-MEA: HYSYS Acid-Gas Package;
CO2-DEHY: HYSYS Glycol package.
A2Air T = 25 °C; P = 1.013 bar; N2 = 77.14%mol; O2 = 20.51%mol; H2O = 2.35%mol; [31].
A3Raw
CO2-rich
NG
6.5 MMSm3/d; T = 40 °C; P = 25 bar; CH4 = 49.82%mol, CO2 = 43.84%mol, C2H6 = 2.99%mol, C3H8 = 1.99%mol, iC4H10 = 0.3%mol, C4H10 = 0.2%mol, iC5H12 = 0.2%mol, C5H12 = 0.1%mol, C6H14 = 0.1%mol, C7H16 = 0.05%mol, C8H18 = 0.03%mol, C9H20 = 0.01%mol, C10H22 = 0.01%mol, H2O = 0.36%mol [2,31].
A4Gas turbine Aero-Derivative GE LM2500 + G4; EfficiencyLHV = 36.5%; PInlet = 23 bar; [2,31]
Air-Ratio = 6.2 mol/mol; TFlue Gas = 549 °C.
A5Steam turbine HPS: PInlet = 24 bar; POutlet = 0.12 bar; TInlet = 524 °C; Outlet-Quality = 98.1%; [31].
A6CompressorsStage–compression ratio = 2.85; [2,31]
Intercoolers: TGas-Outlet = 35 °C; ΔTApproach = 5 °C; ∆P = 0.5 bar.H
A7Adiabatic
efficiencies
ηPumps = ηCompressors = ηSteam Turbine = 75%; Gas Turbines:ηAir Compressor = 87%, ηExpander = 85.4%; [31].
A8HRSG∆PFlue Gas = 0.025 bar; ∆PSteam = 0.05 bar; ΔTApproach = 25 °C; [24].
A9ExchangersΔTApproach = 10 °C (gas-gas, liq-liq); ΔTApproach = 5 °C (gas-liq); ΔP = 0.5 bar; [31].
A10DCCStagesTheoretical = 10; PTop = 1.053 bar; TTop-Flue Gas = 40 °C.
A11PCC-MEAAbsorber: StagesTheoretical = 40; PTop = 1.013 bar; TInlet-Top = 40 °C; Capture = 90%; [31]
Stripper: StagesTheoretical = 10; PTop = 1.013 bar; TTop = 40 °C; TReboiler = 103 °C; [31]
Lean-MEA: H2O = 63.3%w/w, MEA = 31.6%w/w, CO2 = 5.1%w/w; [31]
Capture Ratio: CR ≈ 14 kgSolvent/kgCO2; stripping Heat Ratio: HR ≈ 225 kJ/molCO2; [31].
A12CO2-DEHYAbsorber: StagesTheoretical = 15; P = 50 bar; TInlet = 35 °C; Solvent: TEG = 98.5%w/w;
Stripper: StagesTheoretical = 10; PTop = 1.013 bar; TTop = 40 °C; TReboiler = 128 °C.
A13CO2-to-EOR T = 35 °C; P = 300 bar; Purity: CO2 ≥ 99.9%mol; [31].
A14LPSPLPS= 6 bar, TLPS = 160 °C.
A15Cooling WaterCW: TInlet = 30 °C; TOutlet = 45 °C; PInlet = 4 bar; POutlet = 3.5 bar.
A16Steam productionPriority: LPSPCC-MEA + LPSCO2-DEHY; Surplus: HPSRankine-Cycle.

2.1.7. Complexity and Limitations of the New Offshore GTW-EGR-CCS-CO2-DEHY Process

Ordinary NGCC plants at around 500 MW of capacity are feasible and quite simple plants that are already implemented in the offshore scenario of oil and gas production. However, existing ordinary NGCC plants are not concerned with the destination of CO2, emitting it freely into the atmosphere. To mitigate CO2 emissions, one solution is used in its reinjection into reservoirs via EOR. To make this possible, it is necessary to add the PCC-MEA (post-combustion CO2 capture with aqueous-MEA) and the CO2-DEHY (CO2 dehydration) plants. Moreover, to lower the CCS costs, it is necessary to implement the Exhaust Gas Recycle (EGR), which reduces the flue gas flowrate (about 50% or higher reduction) and increases the flue gas content of CO2 (about 100% or higher increase). The EGR is practically mandatory if CCS is involved because it raises the driving force for CO2 absorption and reduces the volume of flue gas to be treated, consequently allowing for a reduction in column height and diameter and the number of absorbing columns. This way, the insertion of PCC-MEA, CO2-DEHY, and EGR loop implies that there is a high increase in the number of recycling processes—the EGR itself and several recycles of carbonated waters and CO2 vapors to the stripper of PCC-MEA—which intrinsically increases the complexity of the process and negatively impacts its controllability. Thus, while a typically ordinary NGCC is a process with a simple direct structure, the proposed offshore GTW-EGR-CCS-CO2-DEHY process is a reasonably complex one with a handicapped controllability—besides being a much more expensive process—which demands careful analysis of its global controllability and the possible interactions of different control actions during the design of its control and start-up systems. The problematic controllability configures the main shortcoming and limitation of the new proposed process because it may turn the process into a dynamically unstable system whose operation may entail risks and unexpected extra costs.

2.2. Thermodynamic Analysis of Steady-State Processes

Thermodynamic analysis is efficient to pinpoint resource degradation through processes. Steady-state offshore GTW-EGR-CCS-CO2-DEHY and its sub-systems are evaluated by the second law analysis of processes. For the second law analysis, systems and their sub-systems are formerly classified as power-producing or power-consuming systems. Figure 7 exhibits a steady-state open system for thermodynamic assessment with numerous feed/product streams (blue/red arrows, respectively) interacting with an infinite isothermal heat reservoir (R0) at temperature T0. The overall system and its sub-systems may be power-producing ( W ˙ > 0 ) or power-consuming ( W ˙ < 0 ), but they must only have thermal interactions with R0 either absorbing ( Q ˙ > 0 ) or rejecting ( Q ˙ < 0 ) heat. G n , H ¯ G n , S ¯ G n represent, respectively, the molar flowrate (kmol/s), enthalpy (MJ/kmol), and entropy (MJ/kmol.K) of the nth feed stream (n = 1 … Nf), while K n , H ¯ K n , S ¯ K n are similar for the nth product stream (n = 1 … Np).

2.2.1. Maximum Power

Equations (1) and (2) depict the first law of thermodynamics applied to a steady-state open system (Figure 7). The system maximum power/work ( W ˙ M A X ) is calculated through the second law at reversible conditions adopting Equations (3)–(6). At reversible conditions, Equation (4) performs the universe entropy balance, making S ˙ U N I V R E V the universe entropy-creation rate. Under reversibility, Equation (5) derives from Equations (2) and (6), which result from Equation (4). Therefore, W ˙ M A X is given by Equation (7) or Equation (8). Equation (8) provides positive W ˙ M A X for power-producing systems (e.g., NGCC plant, DCC, and STR-CO2) and negative W ˙ M A X for power-consuming Systems (e.g., PCC-MEA, CO2-DEHY, CO2-CMP-1, and CO2-CMP-2).
i = 1 N f G i H ¯ G i + Q ˙ W ˙ = i = 1 N p K i H ¯ K i
W ˙ = i = 1 N p K i H ¯ K i i = 1 N f G i H ¯ G i + Q ˙
W ˙ = W ˙ M A X , Q ˙ = Q ˙ R E V
i = 1 N p K i S ¯ K i i = 1 N f G i S ¯ G i Q ˙ R E V T 0 = S ˙ U N I V R E V = 0
W ˙ M A X = i = 1 N p K i H ¯ K i i = 1 N f G i H ¯ G i + Q ˙ R E V
Q ˙ R E V = T 0 i = 1 N p K i S ¯ K i i = 1 N f G i S ¯ G i
W ˙ M A X = i = 1 N p K i H ¯ K i i = 1 N f G i H ¯ G i + T 0 i = 1 N p K i S ¯ K i i = 1 N f G i S ¯ G i
W ˙ M A X = i = 1 N p K i ( H ¯ K i T 0 S ¯ K i ) i = 1 N f G i ( H ¯ G i T 0 S ¯ G i )

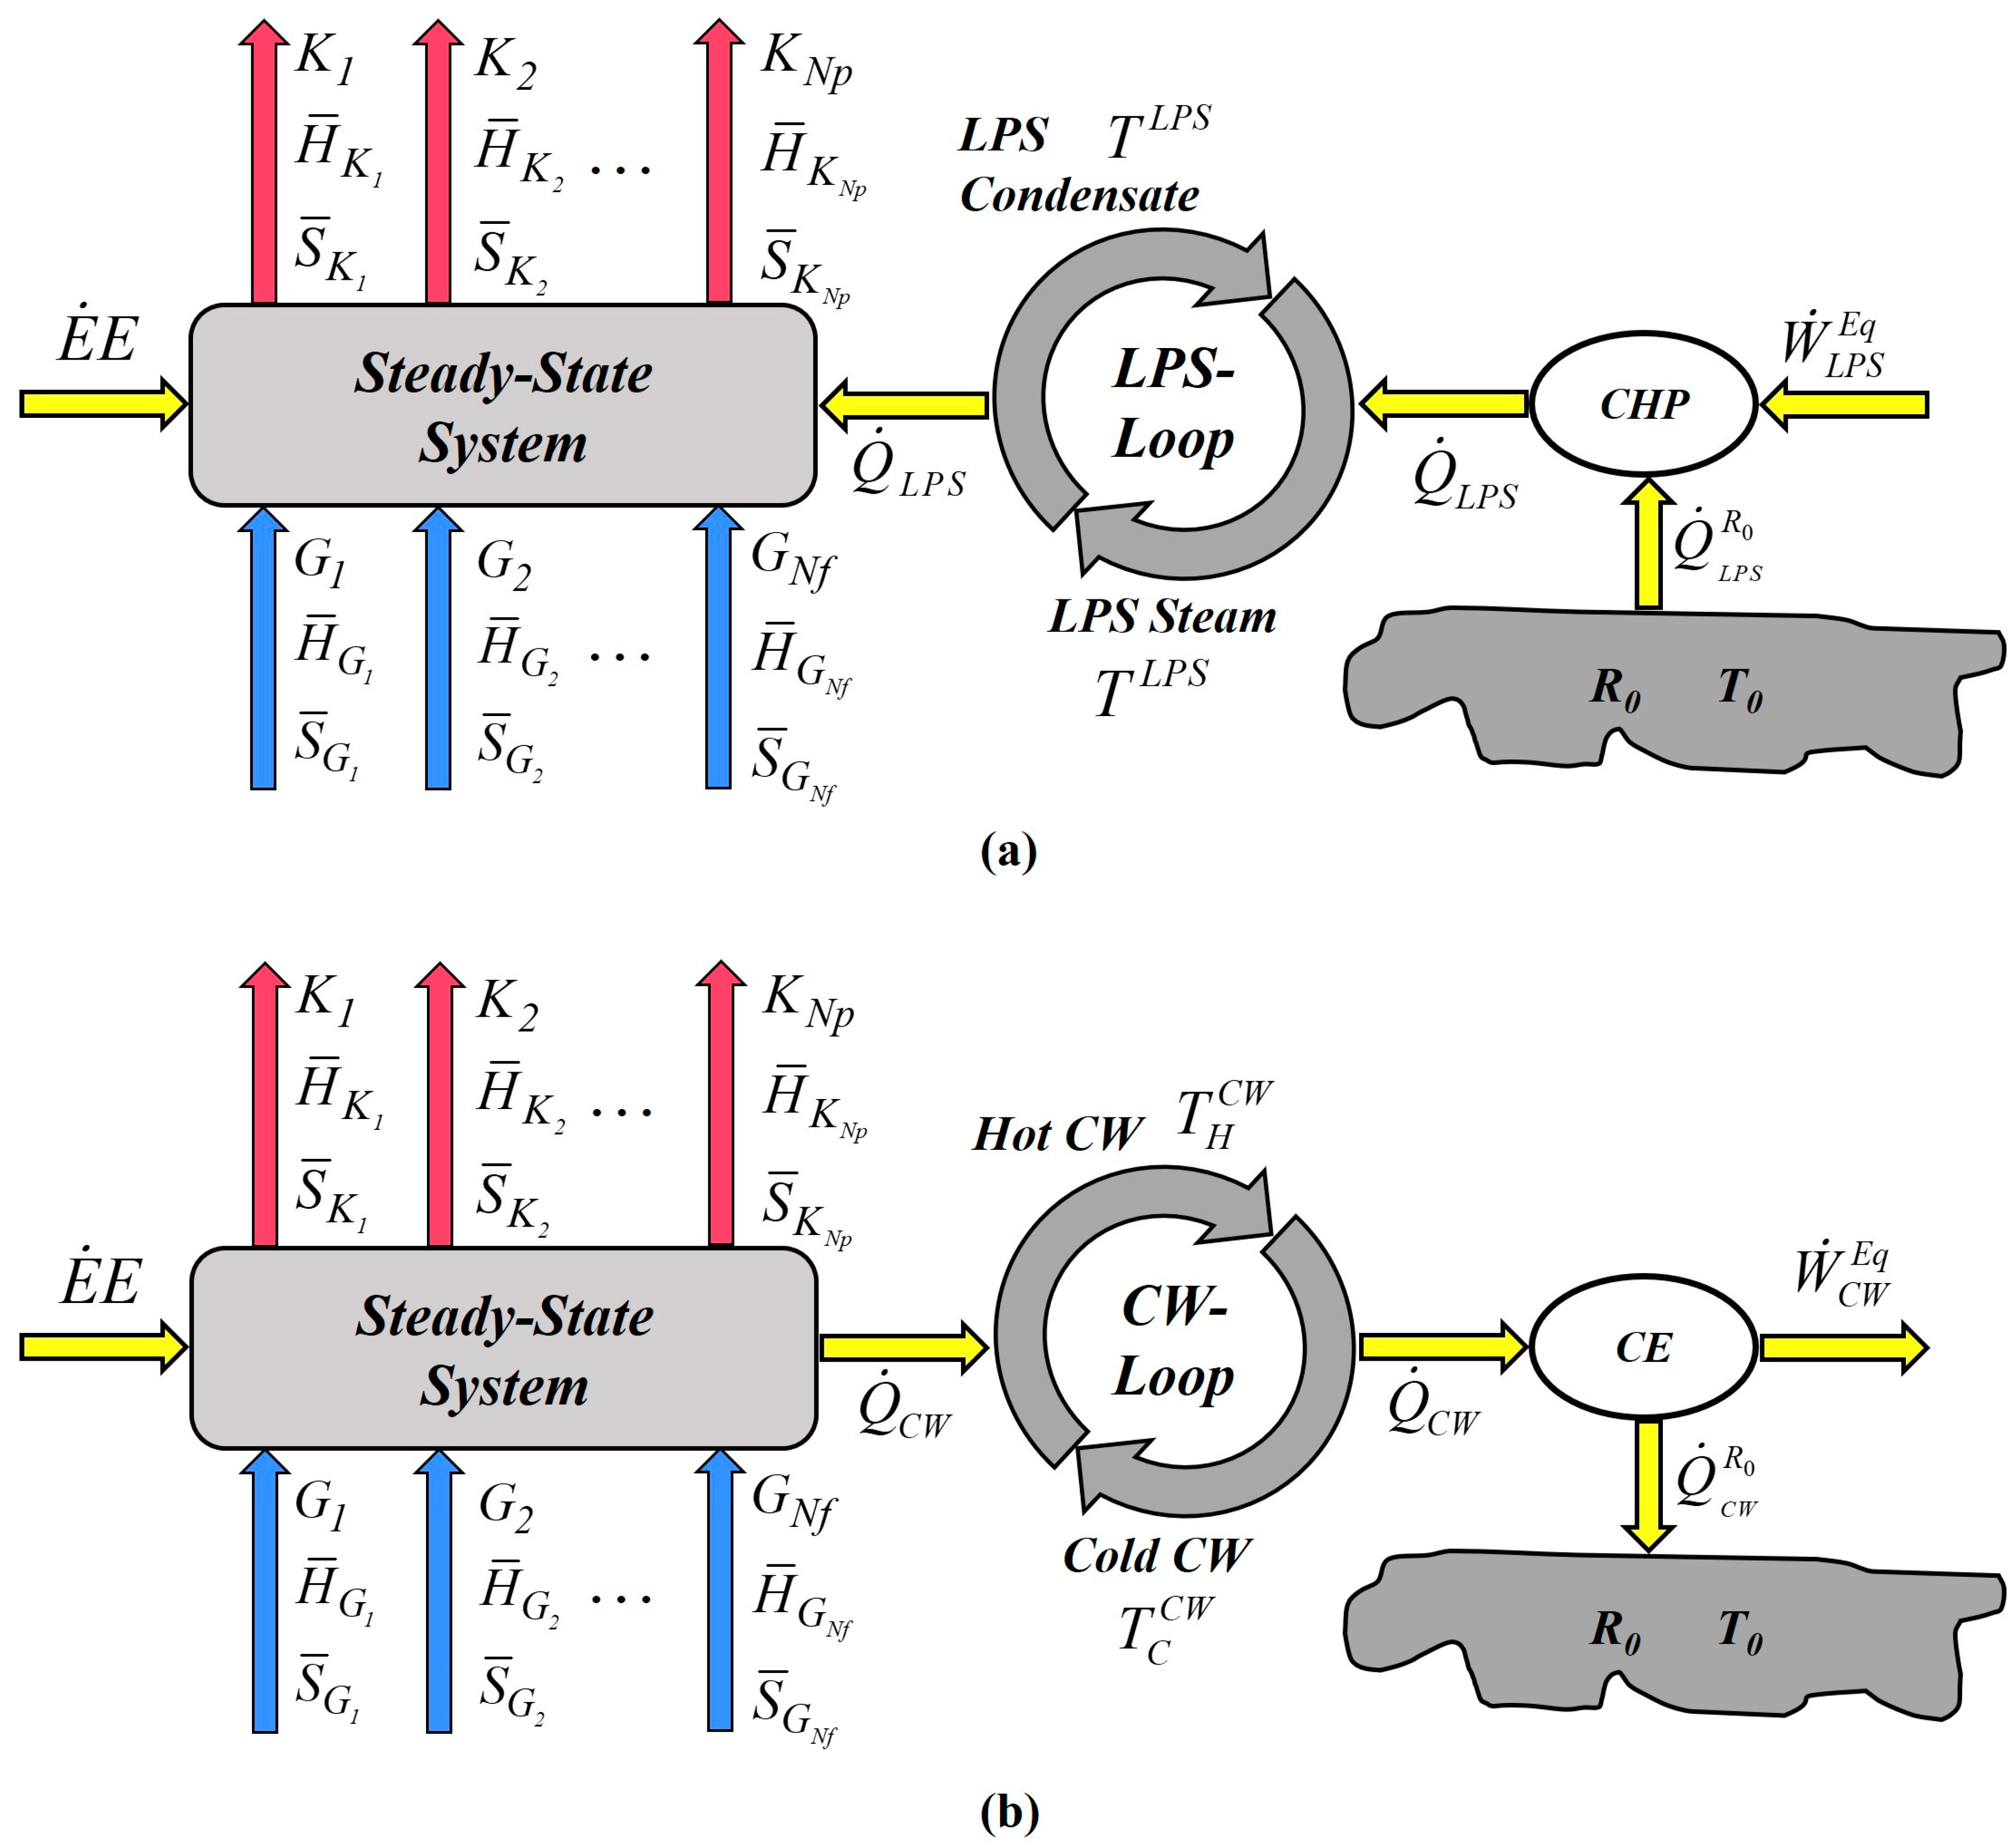
2.2.2. Equivalent Power

Being always positive for regular systems, W ˙ E q represents the thermodynamic power equivalence of electricity production (consumption) and utility production (consumption) [31]. For example, LPS production (consumption) is equivalent to W ˙ E q production (consumption), while CW consumption is always equivalent to W ˙ E q production. Offshore GTW-EGR-CCS-CO2-DEHY demands three kinds of utilities: (i) electricity E ˙ E (MW); (ii) LPS with flowrate J L P S (kmol/s), vaporization enthalpy Δ H ¯ L P S V A P (MJ/kmol), and temperature T L P S (K); and (iii) CW with flowrate J C W (kmol/s), isobaric heat capacity C ¯ P C W (MJ/kmol.K), and hot/cold temperatures T H C W (K), T C C W (K). Considering the LPS and CW narrow temperature ranges studied, Δ H ¯ L P S V A P and C ¯ P C W are assumed constants.
Heat power equivalences are calculated through reversible heat engines with the maximum heat work conversion yield, namely, the Carnot Heat Pump (CHP) and the Carnot Engine (CE) [31]. The CHP imports power, absorbs heat from a cold source, and rejects heat to a hotter source, while the CE absorbs heat from a hot source, exports power, and rejects heat to a colder one.
Figure 7 displays a power-consuming system with the following utility effects: absorbs E ˙ E , absorbs heat Q ˙ L P S from LPS-Loop (imports power W ˙ L P S E q ), and rejects heat Q ˙ C W to CW-Loop (exports power W ˙ C W E q ). Figure 7 shows that the LPS-Loop and CW-Loop are external to the system (Figure 7), R0 is always a cold heat reservoir (cold source), and W ˙ L P S E q , Q ˙ L P S   W ˙ C W E q , Q ˙ C W are always positive. It is possible to frame an analogous version of Figure 7 for a power-producing system (i.e., electricity and LPS are exported, and CW is imported).
The steady-state power-consuming system (Figure 7a) absorbs heat ( Q ˙ L P S ) from LPS, making it LPS-condensate, which is restored to LPS via a LPS-Loop, using the CHP, that imports power ( W ˙ L P S E q ) and absorbs heat ( Q ˙ L P S R 0 ) from R0. Similarly, the power-consuming system (Figure 7b) rejects heat ( Q ˙ C W ) to cold-CW, producing hot-CW, which is restored to cold-CW via a CW-Loop using the CE that exports power ( W ˙ E q C W ) and rejects heat ( Q ˙ R 0 C W ) to R0.
W ˙ L P S E q is given by Equation (10) using Equation (9a,b), and the CHP entropy conservation in Equation (9c). Accordingly, W ˙ C W E q is given by Equation (12) using Equation (11a,b), and the CE entropy conservation in Equation (11c). Equation (10) also works for W ˙ L P S E q in power-producing systems, but the LPS-Loop rotates counter-clockwise, the CHP is replaced by the CE, and all the effects are reversed.
Equation (13a) provides the equivalent power ( W ˙ E q ) produced by a power-producing system that exports E ˙ E and LPS (counter-clockwise LPS-Loop in Figure 7) and consumes CW. Analogously, Equation (13b) gives the equivalent power consumed by a power-consuming system that consumes E ˙ E , CW, and LPS. The substitution of Equations (10) and (12) into Equation (13a,b) results in Equation (14a,b) that give, respectively, the equivalent power produced by a power-producing system and the equivalent power consumed by a power-consuming system.
W ˙ L P S E q = Q ˙ L P S Q ˙ L P S R 0
Q ˙ L P S = J L P S Δ H ¯ L P S V A P
Q ˙ L P S R 0 T 0 + J L P S Δ H ¯ L P S V A P T L P S = 0
W ˙ L P S E q = J L P S Δ H ¯ L P S V A P 1 T 0 T L P S
W ˙ C W E q = Q ˙ C W Q ˙ C W R 0
Q ˙ C W = J C W C ¯ P C W ( T H C W T C C W )
Q ˙ C W R 0 T 0 + J C W C ¯ P C W l n T C C W T H C W = 0
W ˙ C W E q = J C W C ¯ P C W T H C W T C C W T 0 · l n T H C W T C C W
W ˙ E q = E ˙ E + W ˙ L P S E q + W ˙ C W E q                 { P o w e r - P r o d u c i n g   S y s t e m
W ˙ E q = E ˙ E + W ˙ L P S E q W ˙ C W E q                 { P o w e r - Consuming   S y s t e m
W ˙ E q = E ˙ E + J L P S Δ H ¯ L P S V A P 1 T 0 T L P S + J C W C ¯ p C W T H C W T C C W T 0 · l n T H C W T C C W
W ˙ E q = E ˙ E + J L P S Δ H ¯ L P S V A P 1 T 0 T L P S J C W C ¯ p C W T H C W T C C W T 0 · l n T H C W T C C W

2.2.3. Thermodynamic Efficiency

Process resource degradation is calculated via second law analysis, obtaining the thermodynamic efficiency and the Lost-Work (Lost-Power) of the overall system and its sub-systems. With W ˙ M A X (Equation (8)) and W ˙ E q (Equation (14a,b)), the thermodynamic efficiencies of power-producing systems and power-consuming systems are given by Equation (15a) and Equation (15b), respectively.
η % = 100 · W ˙ E q / W ˙ M A X                 { P o w e r - P r o d u c i n g   S y s t e m
η % = 100 · ( W ˙ M A X ) / W ˙ E q         { P o w e r - C o n s u m i n g   S y s t e m

2.2.4. Lost-Work

The Lost-Work (Lost-Power) formulas for power-producing systems and power-consuming systems are intuitively calculated by Equation (16a,b). Additionally, Lost-Work can be measured through the second law formula (Equation (17a)) that considers all the universe changes caused by system transitions, where S ˙ U N I V is the entropy-creation rate of the universe due to the system operation. Thus, Equation (17b,c) denote Lost-Work formulas derived from Equation (17a) for power-producing systems and power-consuming systems, respectively, where S ˙ R 0 was substituted by Equation (18a) and Equation (18b) for power-producing systems and power-consuming systems, respectively.
W ˙ L O S T = W ˙ M A X W ˙ E q         { P o w e r - P r o d u c i n g   S y s t e m
W ˙ L O S T = W ˙ E q ( ) W ˙ M A X         { P o w e r - C o n s u m i n g   S y s t e m
W ˙ L O S T = T 0 S ˙ U N I V = T 0 S ˙ R 0 + i = 1 N p K i S ¯ K i i = 1 N f G i S ¯ G i
W ˙ L O S T = J L P S Δ H ¯ L P S V A P T 0 T L P S + J C W C ¯ p C W T 0 · l n T H C W T C C W + T 0 i = 1 N p K i S ¯ K i i = 1 N f G i S ¯ G i
W ˙ L O S T = J L P S Δ H ¯ L P S V A P T 0 T L P S   +   J C W C ¯ p C W T 0 · l n T H C W T C C W   +   T 0 i = 1 N p K i S ¯ K i i = 1 N f G i S ¯ G i
S ˙ R 0 = Q ˙ C W R 0 T 0 + Q ˙ L P S R 0 T 0 = J C W C ¯ P C W l n T H C W T C C W + J L P S Δ H ¯ L P S V A P T L P S
S ˙ R 0 = Q ˙ C W R 0 T 0 Q ˙ L P S R 0 T 0 = J C W C ¯ P C W l n T H C W T C C W J L P S Δ H ¯ L P S V A P T L P S

3. Results and Discussion

Technical and thermodynamic analyses of offshore GTW-EGR-CSS-CO2-DEHY are presented and discussed.

3.1. Technical Assessment

Table 2 compiles the technical performance of offshore GTW-EGR-CCS-CO2-DEHY. The NGCC plant, comprising five parallel NGCC elements, produces 599.3 MW of gross power (≈92.4% from gas turbines) entailing 534.4 MW of net exported power. Each gas turbine generates ≈ 30 MW at 36.5% LHV-efficiency, firing ≈ 4.76 kg/s of gas. Due to the EGR, each NGCC element produces 370.6 kg/s of flue gas at 17.3%mol CO2. The HRSG reduces the gas turbine flue gas temperature from 549 °C to 140 °C, which is the minimum value to maximize HPS output, providing enough LPS for PCC-MEA and CO2-DEHY strippers.
The PCC-MEA stripper demands 722.2 MW of LPS and releases 144.2 kg/s of water-saturated CO2 top product. CO2-CMP-1 increases the pressure of the CO2 stream up to 50 bar in order to achieve CO2-DEHY ideal conditions. CO2-DEHY captures ≈93% of water from its feed and generates 503.8 t/h of Dry-CO2 (≈193 ppm-mol H2O). STR-CO2 dispatches 5.3 t/h of low-pressure Dry-CO2 to the TEG stripper reboiler as stripping gas to maintain its temperature below 140 °C, avoiding TEG degradation. The TEG stripper reboiler requires only 0.6 MW of LPS, since the flowrate of captured water from the CO2 stream is small. CO2-CMP-2 sends 498.8 t/h of Dry-CO2 (P = 300 bar, T = 35 °C) to EOR. The Offshore GTW-EGR-CCS-CO2-DEHY power requirement corresponds to 10.8% of its gross power. CO2-CMP-1 and CO2-CMP-2 units are the major electricity consumers, while PCC-MEA leads LPS and CW consumptions.

3.2. Thermodynamic Analysis

Thermodynamic and Lost-Work analyses were accomplished for the offshore GTW-EGR-CCS-CO2-DEHY overall system and its sub-systems, namely (i) NGCC plant; (ii) DCC; (iii) PCC-MEA; (iv) CO2-CMP-1; (v) CO2-DEHY; (vi) STR-CO2; and (vii) CO2-CMP-2. No sub-system was missed, i.e., the GTW-EGR-CCS-CO2-DEHY is correctly partitioned among the sub-systems mentioned, which means that the respective sums of W ˙ M A X , W ˙ E q , and W ˙ L O S T for all sub-systems must deliver the same value of the overall system, which is calculated independently of the sub-systems. The comparison of the overall system values with the respective sum over the sub-systems entails an indirect consistency check of the thermodynamic analysis. It is worth mentioning that there is always some divergence between the overall system and the sums over the sub-systems in practice. Thus, divergences below 1% can be accepted to validate the consistency of the thermodynamic analysis.

3.2.1. Maximum Power, Equivalent Power, and Thermodynamic Efficiency Results

Table 3 shows the thermodynamic efficiencies and other second law analysis results of the offshore GTW-EGR-CCS-CO2-DEHY and its sub-systems. The overall system, NGCC plant, DCC, and STR-CO2, are power-producing systems ( W ˙ M A X > 0 ); thus, Equations (13a)–(16a), (17b), and (18a) were used for W ˙ E q , η % , W ˙ L O S T . Furthermore, sub-systems PCC-MEA, CO2-CMP-1, CO2-DEHY, and CO2-CMP-2 are power-consuming systems ( W ˙ M A X < 0 ), requiring Equations (13b)–(16b), (17c), and (18b) for W ˙ E q , η % , W ˙ L O S T . The overall offshore GTW-EGR-CCS-CO2-DEHY thermodynamic efficiency reaches 33.35% (Table 3).
Totaling a positive W ˙ M A X  = 1678.12 MW, the NGCC plant is clearly a power-producing system as a result of its highly spontaneous transitions (e.g., combustion) inside the NGCC elements. The W ˙ E q generated by each NGCC element is calculated as follows: E ˙ E is produced as gas turbines power plus steam turbine power minus the Rankine cycle pump power (Figure 2), it is added to W ˙ C W E q generated by the Rankine cycle condenser, and then it is added to W ˙ L P S E q from the HRSG LPS exportation. The thermodynamic efficiency of the NGCC plant reached 48.62%.
CW is a process stream suffering evaporation loss in the flue gas–liquid direct contact of DCC, so CW should not be considered a utility ( W ˙ C W E q = 0 ) in the DCC. In addition, LPS was not consumed ( W ˙ L P S E q = 0 ). Therefore, only E ˙ E from the pump contributes (negatively) to W ˙ E q . DCC W ˙ E q is negative because it is a power-producing system performing spontaneous changes ( W ˙ M A X > 0 ), but electricity is consumed instead of produced.
As with any separation process, PCC-MEA is a power-consuming system. As expected, PCC-MEA W ˙ M A X is negative (−31.29 MW) due to the equivalent power required for CO2 separation from flue gas. PCC-MEA W ˙ E q consumption (181.14 MW) is measured as follows: electricity demanded in a solvent recirculation pump and water make-up pump is added to W ˙ L P S E q consumed in the PCC-MEA stripper reboiler, and W ˙ C W E q exported as hot-CW from the PCC-MEA stripper condenser and from the lean-MEA cooler are subtracted. The PCC-MEA thermodynamic efficiency reaches 17.27%.
Another separation process, CO2-DEHY, is also a power-consuming system ( W ˙ M A X = −0.00014 MW). The W ˙ M A X incredibly small value is due to the almost counter-balance of three small opposed factors: (i) the small water flowrate removed from CO2 stream (≈2700 ppm-mol H2O to ≈200 ppm-mol H2O), which evidently is a separation that demands small power consumption ( W ˙ M A X < 0 ); (ii) the positive power which could be produced by expanding streams through the head losses generated in the absorber, stripping column, and heat exchangers ( W ˙ M A X > 0 ); and (iii) the positive power which could be produced by the utilization of the thermal approaches in heat exchangers, the stripper reboiler, and stripper condenser. As a result, CO2-DEHY has a minimum net power demand to perform water removal from the CO2 of only 0.00014 MW. On the other hand, CO2-DEHY has W ˙ E q (0.12 MW) calculated as follows: (i) E ˙ E consumed in TEG recirculation pumps, added to W ˙ L P S E q consumed through LPS consumption in the stripper reboiler, subtracted from W ˙ C W E q exported through hot-CW from the stripper condenser and from the lean-TEG cooler. The CO2-DEHY thermodynamic efficiency reaches 0.12% (0.00014 MW*100/0.12 MW).
STR-CO2 is another sub-system guided by spontaneities; in other words, it is a power-producing system ( W ˙ M A X = 0.48 MW), but its thermodynamic efficiency is 0%. The underlying reason is because E ˙ E , W ˙ L P S E q , and W ˙ C W E q are all zero. This means that STR-CO2 has sufficient spontaneities to produce power, but this potential is wasted, and zero power is produced. Consequently, the STR-CO2 thermodynamic efficiency is zero.
CO2-CMP-1 and CO2-CMP-2 are obvious power-consuming systems ( W ˙ M A X = −28.41 MW and W ˙ M A X = −4.88 MW, respectively) because they perform non-spontaneous compression. The respective W ˙ E q is obtained as follows: E ˙ E consumed in compressors and pump, minus W ˙ C W E q exported as hot-CW from compressor intercoolers (there is no LPS consumption, i.e., W ˙ L P S E q = 0 ). The CO2-CMP-1 and CO2-CMP-2 thermodynamic efficiencies are 59.09% and 42.49%, respectively.

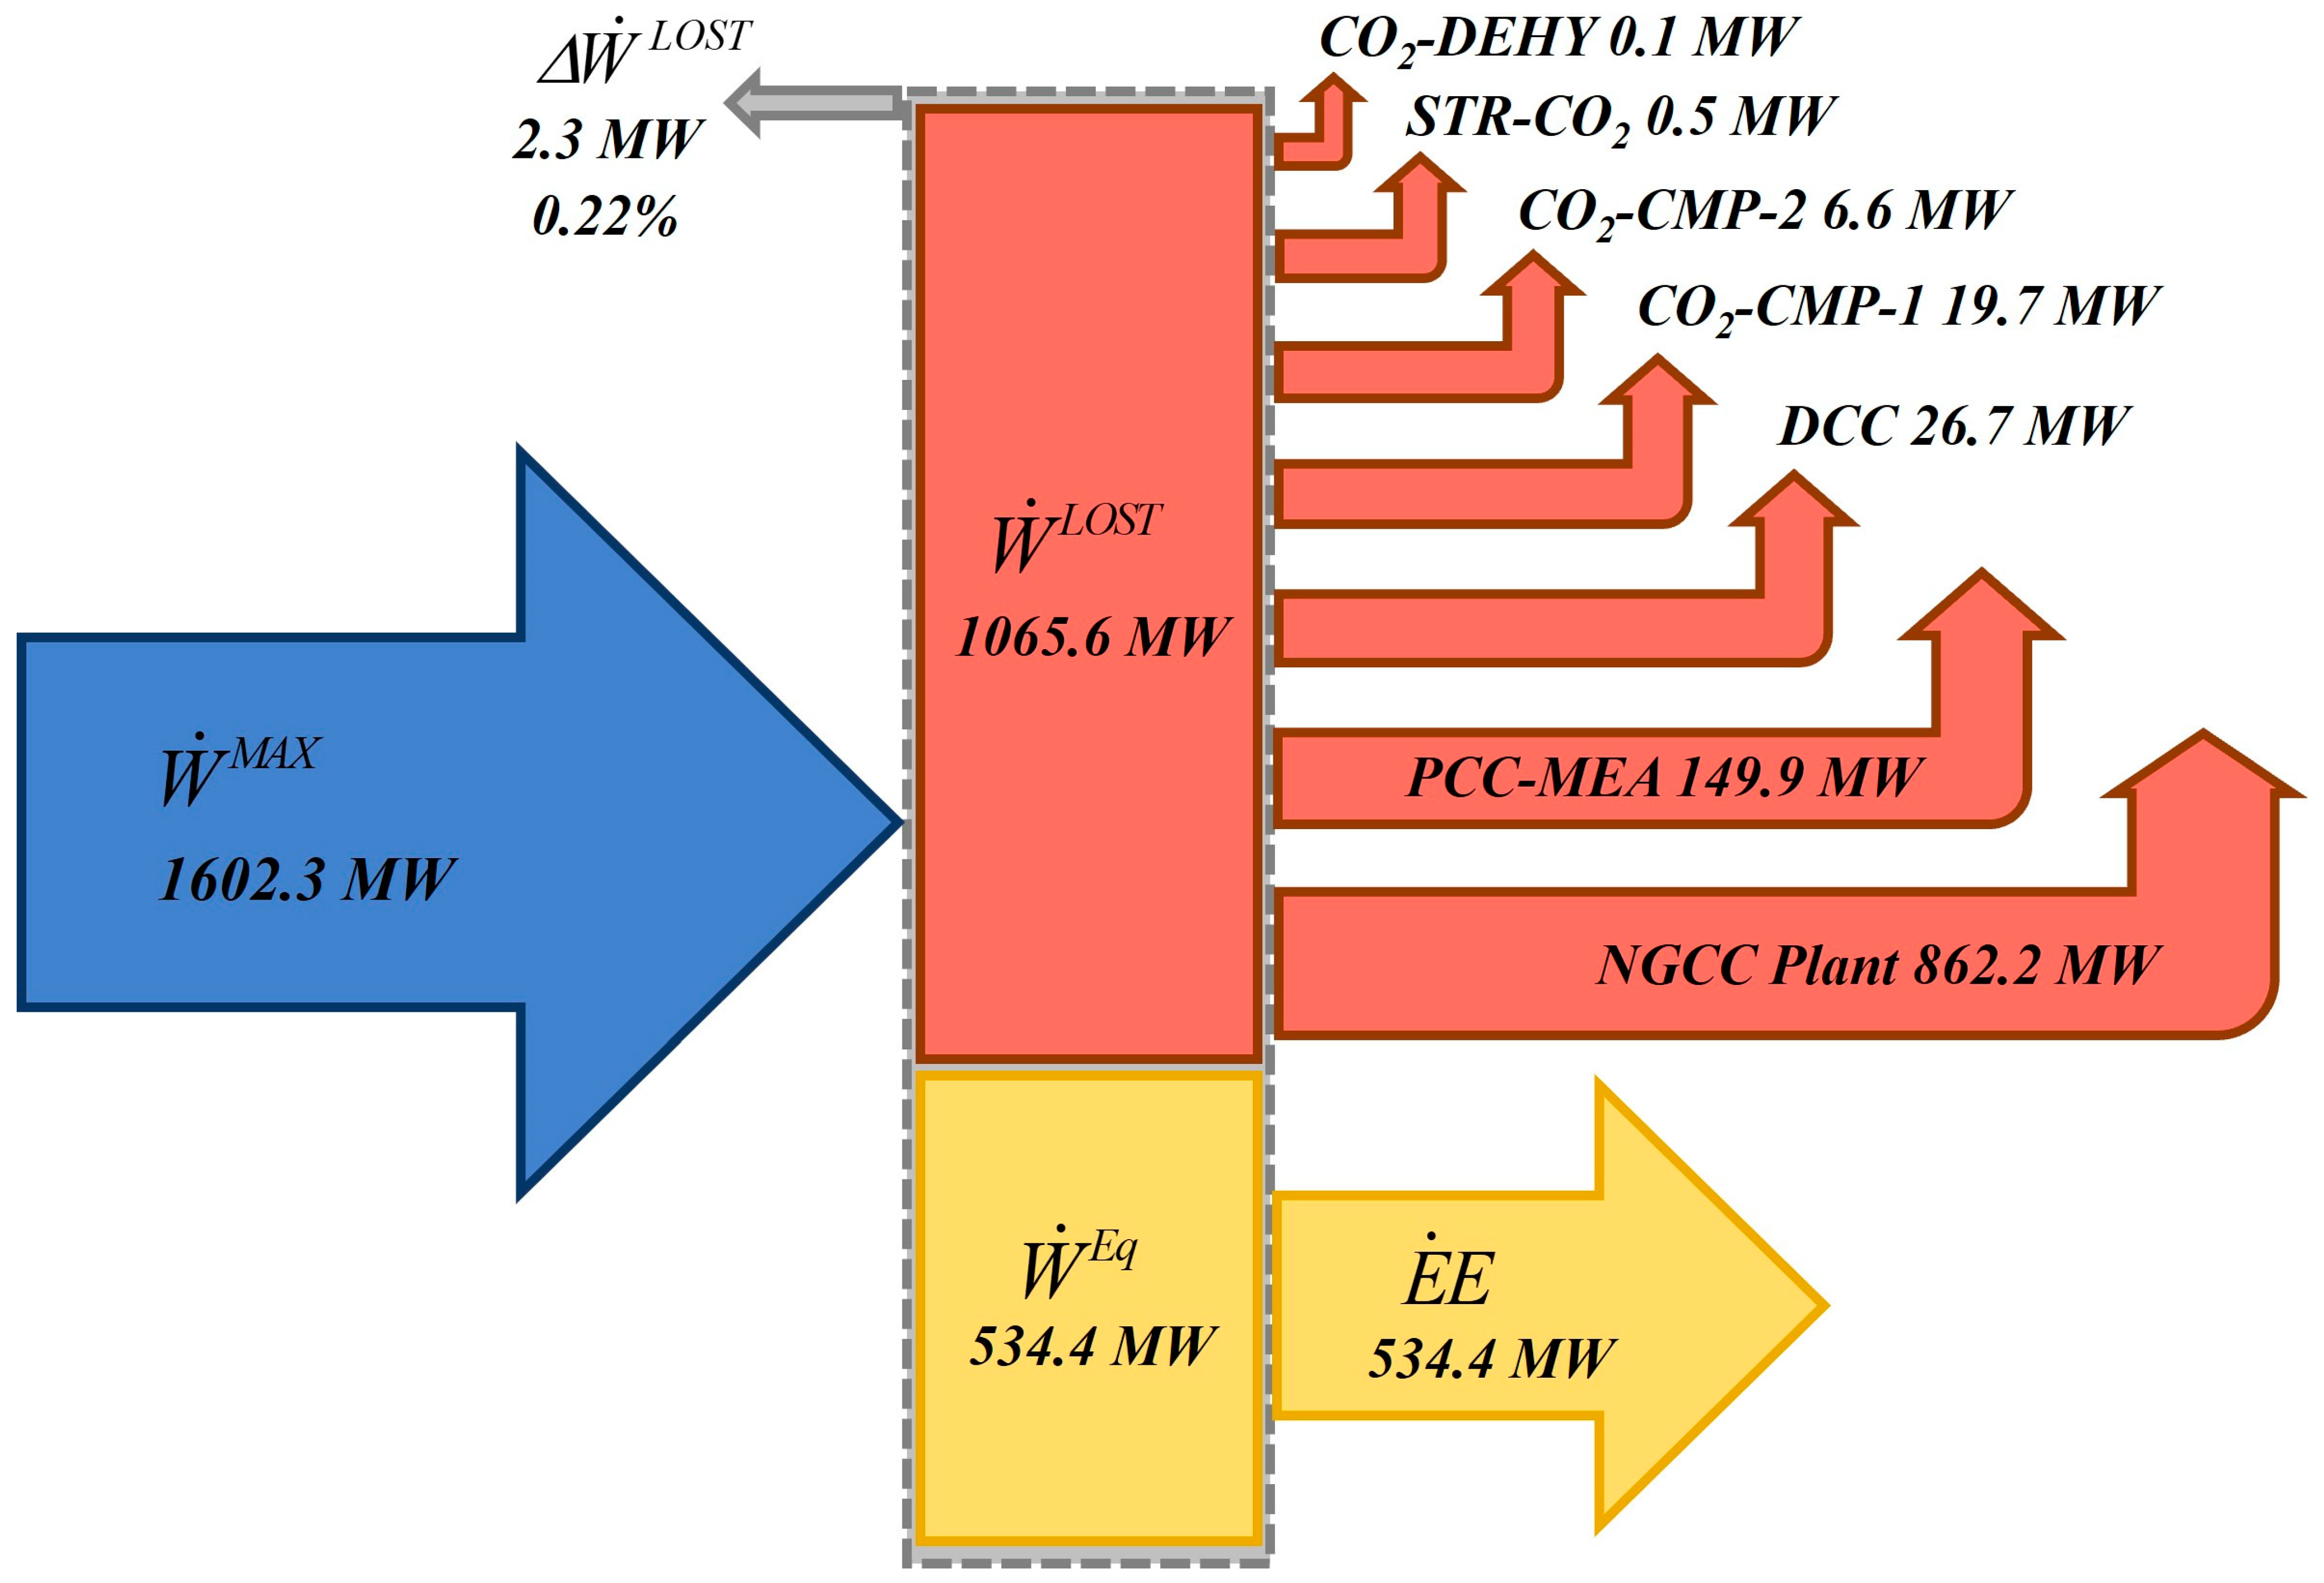
3.2.2. Lost-Work Analysis

Lost-Work exposes the power potential destroyed in GTW-EGR-CCS-CO2-DEHY and in its sub-systems due to spontaneities. Table 3 reveals the Lost-Work results and also attests the consistency of the present thermodynamic analysis by comparing Lost-Work values calculated through two thermodynamically independent ways: (i) via W ˙ M A X and W ˙ E q in Equation (16a,b) and (ii) via T 0 S ˙ U N I V in Equation (17b,c) for power-producing and power-consuming systems, respectively. In addition, Table 3 proves a consistency crosscheck in the sum of Lost-Works over sub-systems which, theoretically, should be equal to the overall-system Lost-Work (obtained divergences are smaller than 1%).
Figure 8 illustrates Sankey diagrams for W ˙ M A X , W ˙ E q , and W ˙ L O S T flows for the overall system and its sub-systems, in which W ˙ L O S T represents the sum of Lost-Works over sub-systems (light-red flows), while Δ W ˙ L O S T is its difference from the overall system Lost-Work (Table 3). In total, 66.65% of the offshore GTW-EGR-CCS-CO2-DEHY available power ( W ˙ M A X = 1602.33 MW) is wasted as Lost-Work through process spontaneities, which are mainly (i) combustion spontaneity and mixing in gas turbines; (ii) heat transfer finite thermal approaches; (iii) finite head losses; (iv) mixing of streams in several units; and (v) machine irreversibility, with compressor/expander adiabatic efficiencies lower than 100%.
The NGCC plant has the highest W ˙ L O S T (832.2 MW, 80.7% share) by virtue of extremely spontaneous combustion reactions, followed by PCC-MEA (149.9 MW, 14.0% share) as consequence of its mass transfer finite potentials in columns, stream mixing, thermal approaches in exchangers, and columns/exchangers head losses. The Lost-Works of the other sub-systems are still smaller because these sub-systems are rather small in importance: DCC (26.7 MW, 2.5% share), CO2-CMP-1 (19.7 MW, 1.8% share), CO2-CMP-2 (6.6 MW, 0.6% share), STR-CO2 (0.48 MW, 0.04% share), and CO2-DEHY (0.1 MW, 0.01% share).

4. Conclusions

Technical and thermodynamic analyses of a theoretically environmentally friendly (low-emission) and new offshore GTW-EGR-CCS-CO2-DEHY process were conducted. The offshore GTW-EGR-CCS-CO2-DEHY burns ≈ 6.5 MMSm3/d of CO2-rich NG (CO2 > 40%mol), exports low-emission electricity, and sends dense CO2 to EOR. The offshore GTW-EGR-CCS-CO2-DEHY produces 534.4 MW of net power, abating ≈ 90% of flue gas CO2. The offshore GTW-EGR-CCS-CO2-DEHY is an intensified power production process, whose major intensification components comprehend the following: (i) Exhaust Gas Recycle (EGR), which reduces the flue gas flowrate by ≈65% while increasing its CO2 content from ≈7%mol up to ≈17%mol, and (ii) high-pressure CO2 dehydration in CO2-DEHY, which extracts ≈ 93% of water from the CO2-to-EOR stream (≈200 ppm-mol H2O), avoiding the formation of hydrates in EOR pipelines. The advantage brought about by EGR is that it dismisses air excess (typically ≈ 100%) for gas turbine flame temperature reduction, consequently decreasing ≈ 65% the flue gas volumetric flowrate and raising its CO2 content from typical ≈ 7%mol (without EGR) to ≈17%mol (with EGR). Thus, EGR drastically lowers investment and the operational cost of the CCS plant by reducing column diameter/height and improving low-emission GTW profitability.
The second law analysis of the offshore GTW-EGR-CCS-CO2-DEHY overall system reveals a 33.35% thermodynamic efficiency with 66.65% of Lost-Work, making the NGCC sub-system the greatest Lost-Work sink (80.7% W ˙ L O S T share) due to the highly spontaneous gas turbine firing process. The PCC-MEA sub-system is the second largest Lost-Work sink (14.0% W ˙ L O S T share). Therefore, the NGCC and PCC-MEA are the major GTW-EGR-CCS-CO2-DEHY units that need to be upgraded to improve the efficiency of the overall system to attain better economic and environmental benefits. The consistency of the thermodynamic analysis was settled via Lost-Work sum-crosschecks and lateral checks considering the alternative second law formula T 0 S ˙ U N I V for the Lost-Work (Table 3).
The technological innovations associated with the new proposed offshore GTW-EGR-CCS-CO2-DEHY process are not related to the units that constitute it because all these units and the adopted intensification strategies (such as EGR and CO2 dehydration) are well known and individually techno-economically feasible. Instead, one could say that the most important innovation is the overall process configuration and the new possible interactions that emerge among the units that constitute the new process. These interactions obviously occur in the steady-state context as well as in the dynamic and controllability contexts, and they are very different depending on the context. It was demonstrated in the steady-state context, for example, that in spite of the gigantism of the new process and its main complex objective of generating low-emission electricity by firing CO2-rich NG at remote offshore sites, its thermodynamic efficiency is still reasonable, and its revenues are improved by exporting tradable CO2 as an EOR agent, which boosts oil production while being confined in the reservoir.
In other words, the main contribution associated with this study is that it proves that the new process accomplishes its finalities and is thermodynamically, environmentally, and economically feasible. That is, it configures an expensive technological package that is worthwhile of further study, aiming at achieving large-scale implementation.

5. Suggestions for Future Work

The comparison of the efficiency and other performance (economic, environmental, thermodynamic) aspects of the newly proposed process against conventional counterparts is a very relevant point. It is also relevant to compare our proposed thermodynamic analysis of processes against alternative analyses such as the exergy analysis of processes, which is much more present in the literature. But these recommendations are also somewhat out of the present scope, which is already overburdened. Thus, we recommend that future works are dedicated to these important comparisons. The authors suggest carrying out an exergy analysis of the GTW-EGR-CCS-CO2-DEHY process and a subsequent comparison of it against conventional counterparts. Although the exergy analysis of processes is formally different from the thermodynamic analysis of processes, they normally point in the same direction, since both aim at revealing the weak (less thermodynamically efficient) units in the process that mostly require improvement. In addition to the exergy analysis, the efficiency and performance aspects (economic, environmental, and thermodynamic) of the GTW-EGR-CCS-CO2-DEHY process should be compared against existing offshore NGCC concepts.

Author Contributions

Conceptualization J.L.d.M.; methodology J.L.d.M. and O.d.Q.F.A.; formal analysis, A.d.C.R., J.L.d.M. and O.d.Q.F.A.; investigation, A.d.C.R. and J.L.d.M.; data curation, A.d.C.R.; writing—original draft preparation, A.d.C.R. and J.L.d.M.; visualization, A.d.C.R. and J.L.d.M.; writing—review and editing, J.L.d.M. and O.d.Q.F.A.; supervision, J.L.d.M. and O.d.Q.F.A.; project administration, J.L.d.M. and O.d.Q.F.A. All authors have read and agreed to the published version of the manuscript.

Funding

Authors acknowledge financial support from Petrobras S/A (5850.0107386.18.9). JL de Medeiros and OQF Araújo also acknowledge support from CNPq-Brazil (313861/2020-0, 312328/2021-4) and from FAPERJ Brazil (E-26/200.522/2023, E-26/201.178/2021). AC Reis acknowledges financial support from FAPERJ Brazil (E-26/203.508/2023).

Data Availability Statement

Data are contained within the article.

Conflicts of Interest

The authors declare no potential conflicts of interest with respect to the research, authorship, and/or publication of this article.

Nomenclature

E ˙ E Electricity (MW)
GiFlowrate of ith feed stream (kmol/s)
H ¯ Molar enthalpy (MJ/kmol)
KiFlowrate of ith product stream (kmol/s)
NfNumber of feed streams (inputs)
NpNumber of product streams (outputs)
PPressure (bar)
Q ˙ , S ¯ Heat duty (MW), molar entropy (MJ/K·kmol)
T, WTemperature (K), power (MW)
ηThermodynamic efficiency (%)
CW, Eq, LPSCooling Water, equivalent, Low-Pressure Steam

References

  1. Neseli, M.A.; Ozgener, O.; Ozgener, L. Energy and exergy analysis of electricity generation from natural gas pressure reducing stations. Energy Convers. Manag. 2015, 93, 109–120. [Google Scholar] [CrossRef]
  2. de Freitas, V.A.; Vital, J.C.S.; Rodrigues, B.R.; Rodrigues, R. Source rock potential, main depocenters, and CO2 occurrence in the pre-salt section of Santos Basin, southeast Brazil. J. S. Am. Earth Sci. 2022, 115, 103760. [Google Scholar] [CrossRef]
  3. Andrei, M.; Sammarco, G. Gas to wire with carbon capture & storage: A sustainable way for on-site power generation by produced gas. In Proceedings of the Abu Dhabi International Petroleum Exhibition and Conference, Abu Dhabi, United Arab Emirates, 13–16 January 2017. [Google Scholar] [CrossRef]
  4. Ojijiagwo, E.; Oduoza, C.F.; Emekwuru, N. Economics of gas to wire technology applied in gas flare management. Eng. Sci. Technol. Int. J. 2016, 19, 2109–2118. [Google Scholar] [CrossRef]
  5. Sayed, S.; Massoud, A. Minimum transmission power loss in multi-terminal HVDC systems: A general methodology for radial and mesh networks. Alex. Eng. J. 2019, 58, 115–125. [Google Scholar] [CrossRef]
  6. Watanabe, T.; Inoue, H.; Horitsugi, M.; Oya, S. Gas to Wire (GTW) system for developing ‘small gas field’ and exploiting ‘associated gas’. In Proceedings of the SPE International Oil and Gas Conference and Exhibition in China, Beijing, China, 5–7 December 2006; Volume 1, pp. 310–315. [Google Scholar]
  7. Brito, T.L.F.; Galvão, C.; Fonseca, A.F.; Costa, H.K.M.; Moutinho dos Santos, E. A review of gas-to-wire (GtW) projects worldwide: State-of-art and developments. Energy Policy 2022, 163, 112859. [Google Scholar] [CrossRef]
  8. Zhou, D.; Li, P.; Liang, X.; Liu, M.; Wang, L. A long-term strategic plan of offshore CO2 transport and storage in northern South China Sea for a low-carbon development in Guangdong province, China. Int. J. Greenh. Gas. Control 2018, 70, 76–87. [Google Scholar] [CrossRef]
  9. Roussanaly, S.; Aasen, A.; Anantharaman, R.; Danielsen, B.; Jakobsen, J.; Heme-De-Lacotte, L.; Neji, G.; Sødal, A.; Wahl, P.; Vrana, T.; et al. Offshore power generation with carbon capture and storage to decarbonise mainland electricity and offshore oil and gas installations: A techno-economic analysis. Appl. Energy 2019, 233–234, 478–494. [Google Scholar] [CrossRef]
  10. Zhao, H.; Chang, Y.; Feng, S. Influence of produced natural gas on CO2-crude oil systems and the cyclic CO2 injection process. J. Nat. Gas. Sci. Eng. 2016, 35, 144–151. [Google Scholar] [CrossRef]
  11. Monson, C.C.; Korose, C.P.; Frailey, S.M. Screening methodology for regional-scale CO2 EOR and storage using economic criteria. Energy Procedia 2014, 63, 7796–7808. [Google Scholar] [CrossRef]
  12. Hassanpouryouzband, A.; Yang, J.; Tohidi, B.; Chuvilin, E.; Istomin, V.; Bukhanov, B. Geological CO2 Capture and Storage with Flue Gas Hydrate Formation in Frozen and Unfrozen Sediments: Method Development, Real Time-Scale Kinetic Characteristics, Efficiency, and Clathrate Structural Transition. ACS Sustain. Chem. Eng. 2019, 7, 5338–5345. [Google Scholar] [CrossRef]
  13. Hassanpouryouzband, A.; Yang, J.; Tohidi, B.; Chuvilin, E.; Istomin, V.; Bukhanov, B.; Cheremisin, A. CO2 Capture by Injection of Flue Gas or CO2–N2 Mixtures into Hydrate Reservoirs: Dependence of CO2 Capture Efficiency on Gas Hydrate Reservoir Conditions. Environ. Sci. Technol. 2018, 52, 4324–4330. [Google Scholar] [CrossRef]
  14. Wu, M.; Jiang, C.; Song, R.; Liu, J.; Li, M.; Liu, B.; Shi, D.; Zhu, Z.; Deng, B. Comparative study on hydraulic fracturing using different discrete fracture network modeling: Insight from homogeneous to heterogeneity reservoirs. Eng. Fract. Mech. 2023, 284, 109274. [Google Scholar] [CrossRef]
  15. Huang, L.; Dontsov, E.; Fu, H.; Lei, Y.; Weng, D.; Zhang, F. Hydraulic fracture height growth in layered rocks: Perspective from DEM simulation of different propagation regimes. Int. J. Solids Struct. 2022, 238, 111395. [Google Scholar] [CrossRef]
  16. Araújo, O.Q.F.; Reis, A.d.C.; de Medeiros, J.L.; Nascimento, J.F.D.; Grava, W.M.; Musse, A.P.S. Comparative analysis of separation technologies for processing carbon dioxide rich natural gas in ultra-deepwater oil fields. J. Clean. Prod. 2017, 155, 12–22. [Google Scholar] [CrossRef]
  17. Hetland, J.; Kvamsdal, H.M.; Haugen, G.; Major, F.; Kårstad, V.; Tjellander, G. Integrating a full carbon capture scheme onto a 450 MWe NGCC electric power generation hub for offshore operations: Presenting the Sevan GTW concept. Appl. Energy 2009, 86, 2298–2307. [Google Scholar] [CrossRef]
  18. Hachem, J.; Schuhler, T.; Orhon, D.; Cuif-Sjostrand, M.; Zoughaib, A.; Molière, M. Exhaust gas recirculation applied to single-shaft gas turbines: An energy and exergy approach. Energy 2022, 238, 121656. [Google Scholar] [CrossRef]
  19. Li, H.; Ditaranto, M.; Yan, J. Carbon capture with low energy penalty: Supplementary fired natural gas combined cycles. Appl. Energy 2012, 97, 164–169. [Google Scholar] [CrossRef]
  20. Li, H.; Ditaranto, M.; Berstad, D. Technologies for increasing CO2 concentration in exhaust gas from natural gas-fired power production with post-combustion, amine-based CO2 capture. Energy 2011, 36, 1124–1133. [Google Scholar] [CrossRef]
  21. Ahmadi, M.A.; Soleimani, R.; Bahadori, A. A computational intelligence scheme for prediction equilibrium water dew point of natural gas in TEG dehydration systems. Fuel 2014, 137, 145–154. [Google Scholar] [CrossRef]
  22. Kloster, P. Energy Optimization on Offshore Installations with Emphasis on Offshore Combined Cycle Plants. In Proceedings of the SPE Offshore Europe Conference and Exhibition, Aberdeen, UK, 7–10 September 1999; Society of Petroleum Engineers: Aberdeen, UK, 1999. Epub ahead of print. [Google Scholar] [CrossRef]
  23. GE LM2500+G4 Marine Gas Turbine. 2021. Available online: https://www.geaviation.com/sites/default/files/datasheet-lm2500plusg4.pdf (accessed on 2 August 2022).
  24. Følgesvold, E.R.; Skjefstad, H.S.; Riboldi, L.; Nord, L.O. Combined heat and power plant on offshore oil and gas installations. J. Power Technol. 2017, 97, 117–126. [Google Scholar]
  25. Oh, S.-Y.; Binns, M.; Cho, H.; Kim, J.-K. Energy minimization of MEA-based CO2 capture process. Appl. Energy 2016, 169, 353–362. [Google Scholar] [CrossRef]
  26. Araújo, O.Q.F.; de Medeiros, J.L. Carbon capture and storage technologies: Present scenario and drivers of innovation. Curr. Opin. Chem. Eng. 2017, 17, 22–34. [Google Scholar] [CrossRef]
  27. Liu, G.; Zhu, L.; Hong, J.; Liu, H. Technical, Economical, and Environmental Performance Assessment of an Improved Triethylene Glycol Dehydration Process for Shale Gas. ACS Omega 2022, 7, 1861–1873. [Google Scholar] [CrossRef] [PubMed]
  28. Neagu, M.; Cursaru, D.L. Technical and economic evaluations of the triethylene glycol regeneration processes in natural gas dehydration plants. J. Nat. Gas. Sci. Eng. 2017, 37, 327–340. [Google Scholar] [CrossRef]
  29. Chebbi, R.; Qasim, M.; Abdel Jabbar, N. Optimization of triethylene glycol dehydration of natural gas. Energy Rep. 2019, 5, 723–732. [Google Scholar] [CrossRef]
  30. Mokhatab, S.; Poe, W.A.; Mak, J.Y. Natural Gas Dehydration and Mercaptans Removal. Handb. Nat. Gas. Transm. Process 2019, 4, 307–348. [Google Scholar] [CrossRef]
  31. Milão, R.d.F.D.; de Medeiros, J.L.; Interlenghi, S.F.; Araújo, O.d.Q.F. Low-emission Gas-to-Wire with thermodynamic efficiency: Monetization of carbon dioxide rich natural gas from offshore fields. Gas Sci. Eng. 2023, 115, 205021. [Google Scholar] [CrossRef]
Figure 1. Process sub-systems (NGCC: NG Combined Cycle, DCC: Direct-Contact Column, PCC-MEA: post-combustion capture with aqueous-MEA, CO2-CMP: CO2 Compression Unit, CO2-DEHY: CO2 Dehydration TEG Unit, STR-CO2: CO2 Stripping Gas Unit, EGR: Exhaust Gas Recycle, CW: Cooling Water, LPS: Low-Pressure Steam).
Gases 04 00003 g001
Figure 2. NG Combined Cycle (NGCC) element (HRSG: Heat Recovery Steam Generator, CW: Cooling Water, LPS: Low-Pressure Steam, HPS: High-Pressure Steam, DCC: Direct-Contact Column, PCC-MEA: Aqueous-MEA Post-Combustion Capture, CO2-DEHY: CO2 Dehydration TEG Unit).
Gases 04 00003 g002
Figure 3. Direct-Contact Column (DCC) (NGCC: NG Combined Cycle, CW: Cooling Water, PCC-MEA: Aqueous-MEA Post-Combustion Capture).
Gases 04 00003 g003
Figure 4. Aqueous-MEA Post-Combustion Capture (PCC-MEA) (CW: Cooling Water, LPS: Low-Pressure Steam, CO2-DEHY: CO2 Dehydration TEG Unit, CO2-CMP: CO2 Compression Unit).
Gases 04 00003 g004
Figure 5. CO2 Dehydration TEG Unit (CO2-DEHY) and CO2 Stripping Gas Unit (STR-CO2) (PCC-MEA: Aqueous-MEA Post-Combustion Capture, CO2-CMP: CO2 Compression Unit, CW: Cooling Water, LPS: Low-Pressure Steam, HPS: High-Pressure Steam).
Gases 04 00003 g005
Figure 6. CO2 Compression Units (CO2-CMP): (a) CO2-CMP-1 and (b) CO2-CMP-2 (PCC-MEA: Aqueous-MEA Post-Combustion Capture, CO2-DEHY: CO2 Dehydration TEG Unit, EOR: Enhanced Oil Recovery, CW: Cooling Water).
Gases 04 00003 g006
Figure 7. Equivalent power for power-consuming system (blue arrows: feed streams; red arrows: product streams): imports electricity ( E ˙ E ); (a) imports equivalent power via LPS-Loop ( W ˙ L P S E q ); and (b) exports equivalent power via CW-Loop ( W ˙ C W E q ) (LPS: Low-Pressure Steam, CW: Cooling Water, CHP: Carnot Heat Pump, CE: Carnot Engine).
Gases 04 00003 g007
Figure 8. Lost-Work Sankey diagram ( E ˙ E : electricity, W ˙ M A X : maximum power, W ˙ L O S T : Lost-Work, W ˙ E q : equivalent power, NGCC: NG Combined Cycle, DCC: Direct-Contact Column, PCC-MEA: Aqueous-MEA Post-Combustion Capture, CO2-CMP: CO2 Compression Unit, CO2-DEHY: CO2 Dehydration TEG Unit, SGU-CO2: CO2 Stripping Gas Unit).
Gases 04 00003 g008
Table 2. Technical analysis results.
GTW-EGR-CCS-CO2-DEHY Utilities DemandPower (MW)LPS (t/h)CW (t/h)
CO2 flue gas (t/h) (PCC-MEA Feed)557.2NGCC plant0.15-6109
CO2 emissions (t/h) (atmosphere)59.6PCC-MEA0.35123036,249
Gross power (MW)599.3CO2-DEHY0.003551.122.4
Power demand (MW)64.9CO2-CMP-150.9-3894
Net power (MW)534.4CO2-CMP-213.17-2324
DCC0.36--
STR-CO2---
Total64.9123148,598
PCC-MEA Results CO2-DEHY Results
Flue gas inlet (%molCO2)17.3CO2 inlet (ppm-mol H2O)2690.2
Decarbonated flue gas (%molCO2)1.8CO2 outlet (ppm-mol H2O)192.8
CO2 to CO2-CMP-1 (%molCO2)92.7Capture Ratio (kgTEG/kgH2O)3.7
Capture Ratio (kgSolvent/kgCO2)13.7Lean solvent (t/h)2.1
CO2Captured (tCO2/h)497.6Absorber: TTop (°C)/TBottom (°C)36.4/35.3
Lean solvent (t/h)6814Stripper: TFeed (°C)/TTop (°C)/TBottom (°C)62/40/138
Absorber: TTop (°C)/TBottom (°C)62.2/61.9Reboiler duty (MW)0.6
Stripper: TFeed (°C)/TTop (°C)/TBottom (°C)83/40/103
Heat Ratio (kJ/molCO2)225
Reboiler duty (MW)722
Table 3. Second law analysis and Lost-Work validation.
Second Law AnalysisLost-Work Validation
Sub-System W ˙ M A X
(MW)
W ˙ L P S E q
(MW)
W ˙ C W E q
(MW)
E ˙ E
(MW)
W ˙ E q
(MW)
η % W ˙ LOST
(MW) *
W ˙ LOST
(MW) #
Δ W ˙ LOST
(%)
NGCC plant1678.12212.374.40599.18815.9648.62%862.16860.660.17
PCC-MEA−31.29212.1931.410.35181.1417.27%149.85149.030.55
CO2-DEHY−0.000140.180.070.003550.120.12%0.11930.11890.34
CO2-CMP-1−28.41-2.8150.9048.0959.09%19.6719.74−0.36
CO2-CMP-2−4.88-1.6813.1711.4942.49%6.616.590.30
DCC26.31--−0.36−0.36−1.37%26.6726.500.64
STR-CO20.48----0.00%0.4800.4780.42
Sum-crosscheck 1065.561063.120.23
Overall system1602.33--534.40534.4033.35%1067.931061.740.58
* via Equation (16a,b); # via Equation (17b,c).
Disclaimer/Publisher’s Note: The statements, opinions and data contained in all publications are solely those of the individual author(s) and contributor(s) and not of MDPI and/or the editor(s). MDPI and/or the editor(s) disclaim responsibility for any injury to people or property resulting from any ideas, methods, instructions or products referred to in the content.

