Article

Natural Gas Matters: LNG and India’s Quest for Clean Energy

by
Subhadip Ghosh
1,*,
Rajarshi Majumder
2 and
Bidisha Chatterjee
2
1
Department of Decision Sciences, School of Business, MacEwan University, Edmonton, AB T5J 4S2, Canada
2
Department of Economics, The University of Burdwan, Bardhaman 713104, WB, India
*
Author to whom correspondence should be addressed.
Gases 2024, 4(1), 1-17; https://doi.org/10.3390/gases4010001
Submission received: 11 December 2023 / Revised: 28 January 2024 / Accepted: 30 January 2024 / Published: 3 February 2024
(This article belongs to the Section Natural Gas)

Abstract

:
India, the world’s most populous country, is the world’s third-largest emitter of greenhouse gases (GHGs). Despite employing several energy sources, it still relies heavily on coal, its primary energy source. Given India’s swiftly rising energy demand, this challenges meeting emission reduction targets. In recent years, India has significantly increased investments in renewables like solar and hydrogen. While commendable, these initiatives alone cannot meet the country’s expanding energy demands. In the short term, India must rely on both domestic and imported fossil fuels, with natural gas being the most environmentally friendly option. In this context, this paper attempts to forecast energy consumption, natural gas production, and consumption in India until 2050, using both univariate and multivariate forecasting methods. For multivariate forecasting, we have assumed two alternative possibilities for GDP growth: the business-as-usual and the high-growth scenarios. Each of our forecasts indicates a notable shortfall in the projected production of natural gas compared to the expected demand, implying our results are robust. Our model predicts that nearly 30–50 percent of India’s natural gas consumption will be met by imports, mainly in the form of LNG. Based on these findings, this paper recommends that Indian government policies emphasize increasing domestic natural gas production, importing LNG, and expanding renewable energy resources.

1. Introduction

1.1. Background and Context of India’s Clean Energy Goals

India has recently surpassed China as the most populous country in the world. Its rapid economic growth since the 1990s has led to a significant increase in its energy consumption, with Total Primary Energy Consumption (TPEC) increasing from 8.3 EJ in 1990 to approximately 32.2 EJ in 2020. The International Energy Agency predicts that over the next few decades, energy demand growth in India will be higher than in any other country [1]. Even though India employs a variety of energy sources, and there is a clear shift towards non-fossil fuels, coal remains the most significant energy source in the country even in 2020 (close to 55% of energy coming from it), followed by oil (about 29%), which are the two dirtiest sources of fossil fuel energy [2]. It is thus not surprising that India is the world’s third-largest contributor to greenhouse gas (GHG) emissions, which has also been increasing steadily since 2010 [2]. Persistently plagued by serious environmental concerns, such as severe air pollution and contaminated water supplies resulting from heavy dependence on coal and oil, the Indian government is presently formulating policies to promote greater utilization of lower-carbon energy sources.

1.2. Significance of Natural Gas and LNG in the Energy Transition

In recent years, India has significantly increased its investments in renewable energy production, such as solar and hydrogen. Renewables account for about 10 percent of India’s total energy consumption [3], and it plans to increase this share to 50 percent by 2040 [4]. While the commendable emphasis on renewable energy is pivotal for addressing environmental concerns, it is imperative to recognize that this alone may not suffice to meet India’s rapidly growing energy demands. Therefore, in the short term, India must rely on domestic and imported fossil energy sources. However, a concerted effort should be made to minimize dependence on ‘dirty’ fuels. As the most environmentally friendly choice among fossil energy alternatives, natural gas can play a crucial role as an interim energy source in the ongoing transition process. The Indian government has established a target of raising the proportion of natural gas in the overall energy mix from 6.5% to 15% by 2030 [5]. To reach this ambitious objective, the government has implemented various initiatives to enhance nationwide access to natural gas, such as extending domestic pipeline networks and increasing the number of liquefied natural gas (LNG) terminals. Despite numerous government initiatives, the proportion of natural gas in the energy mix has declined due to various social, political, and economic challenges. It is thus imperative to examine the future growth trajectory of natural gas production, consumption, and import needs in India in the medium run.

1.3. Existing Studies

The natural gas market in India is still in its early stages of development. However, several researchers have studied the current trends and potential for this sector to meet India’s burgeoning energy demand while reducing its carbon footprint. Some of the notable studies are those by Samaddar and Arora [6], Seznec & Pallakonda [7], Kumar et al. [8], Safari et al. [9], and Mitra [10]. Studies that focus more on the policy environment related to the natural gas sector in India include those by Prasad [11], Kelkar [12], Jain & Sen [13], and Tiewsoh et al. [14], all of whom argue that a clear and stable policy direction is necessary for this sector to develop. As regards the import of natural gas, while Vaid [15] argues that better gas diplomacy for transnational gas pipelines and a policy push for completing domestic projects would enable India to obtain sufficient natural gas to meet its growing demand, Janardhanan [16] cautions against transnational pipelines due to geopolitical vulnerabilities and the security risk. Incidentally, that approach has now been shelved by the Government of India. Mahalingam and Sharma [17] suggest that the natural gas sector has been stifled without an independent regulator, which has limited the sector’s growth. Researchers have also explored factors that affect the development of the natural gas sector in India, e.g., Bhowmick and Dutta [18] and Rawat and Garg [19]. Forecasting the future course of the natural gas sector in India in terms of Demand, Production, Import, and Prices is sparse, the exception being the study on prices by Alam et al. [20]. Most recently, Adebayo et al. [21] examined the role of natural gas in fostering sustainable development in India but cautioned that gas consumption is detrimental to the country’s environmental sustainability in the long run. However, hardly any studies attempt to forecast natural gas demand and production in India over the medium-to-long run and its associated policy implications. The only study available in the public domain is that by the Petroleum & Natural Gas Regulatory Board of the government of India [22]. Even this report forecasts only up to 2030, and the energy sector, especially the natural gas industry, has undergone substantial transformations since 2015.
This paper aims to address this gap in existing research. This is especially important because India seeks to be a zero-carbon economy by 2070. In this process, natural gas has emerged as an essential energy source for India during the transition period. It is cheaper and more readily available than renewables but cleaner than other fossil fuels, like coal and oil. Thus, this sector holds the key to a successful evolution of the Indian economy to an environmentally sustainable one, and we must try to understand the medium- to long-term prospects, problems, challenges, and opportunities of this sector.

1.4. Research Objectives and Scope

In this paper, we have first tried to discern the evolving trends in energy demand within India. We have examined the dynamic shifts in the proportional contributions of diverse energy sources—spanning both renewable and non-renewable categories—to India’s overall energy consumption landscape, starting from 1990. Subsequently, we have tried to forecast energy consumption, natural gas production, and natural gas consumption in India up to the year 2050. We have used both univariate forecasting techniques, like double exponential smoothing, and multivariate forecasting techniques, namely, the Cochrane–Orcutt method. For multivariate forecasting, we have considered two alternative scenarios for GDP growth: a business-as-usual scenario (BAUS) assuming a 6% growth rate and a high-growth rate scenario (assuming an 8% growth rate). Our univariate forecasts are very similar to our multivariate forecasts under the BAUS case, highlighting the robustness of our results. We have used univariate forecasts for natural gas production and compared them with the projected values from India’s National Energy Policy 2017 [23]. Our analysis reveals that the latter figures are overly optimistic. Our production and consumption projections highlight a significant deficit in the anticipated natural gas production compared to the projected demand, a trend consistently observed across all forecasting methods and scenarios examined in our study. According to our model, imports, predominantly in the form of LNG, are poised to account for approximately 30–50 percent of India’s natural gas consumption. Considering these findings, this paper advocates for government policies in India to prioritize expanding domestic natural gas production, facilitating LNG imports, and expanding investments in renewable energy resources.

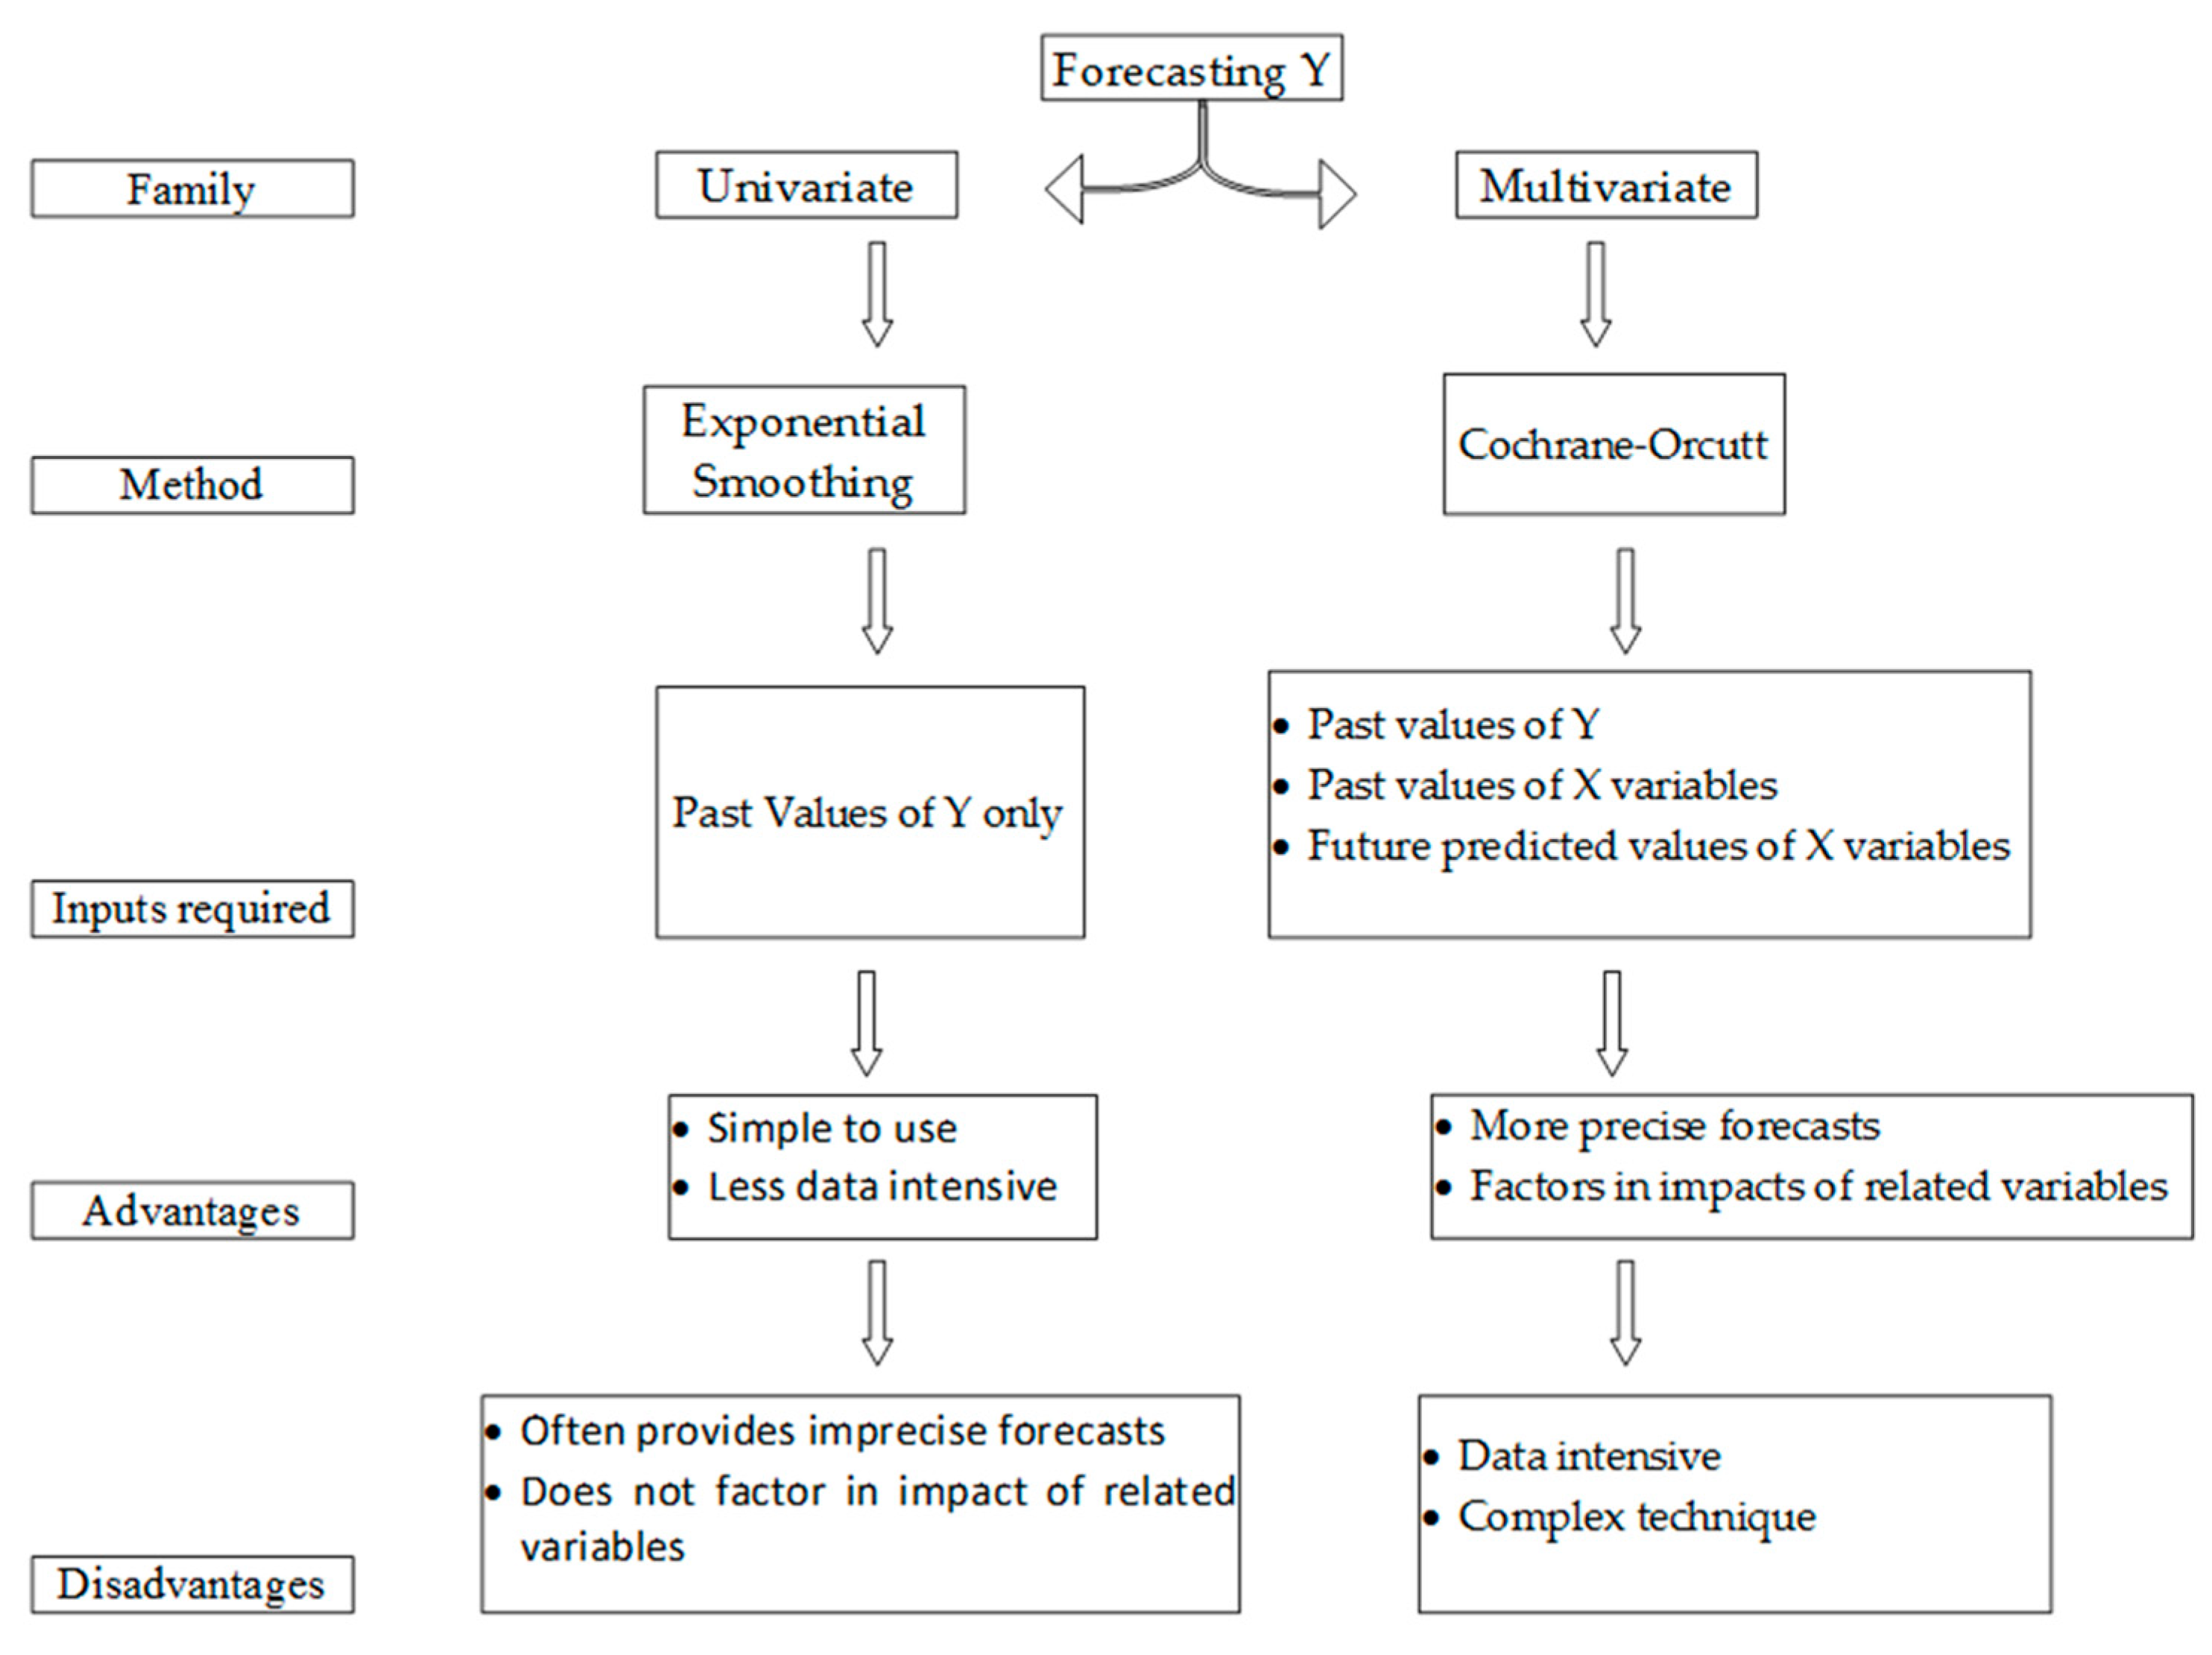
2. Methodology and Data Sources

This paper uses univariate and multivariate techniques to forecast total energy demand and LNG production and consumption in India over the 2030–2050 period (See Figure A1).

2.1. Univariate Modeling

For the univariate method, we have considered exponential smoothing, where forecasts are weighted averages of previous observations with exponentially decreasing weights on older terms. Specifically, we applied Holt’s Linear exponential smoothing method for forecasting (Gelper et al. [24]). This method accommodates both the Level or Average Value and Trend components of the Time Series. Though this is a primitive technique, it is used for its simplicity in understanding and computation. This method is used in isolation or as a starting point in conjunction with other methods. Some recent studies that used this technique are Tularam and Saeed (2016) [25], Trater et al. (2016) [26], and de Oliveira and Oliveira (2018) [27]. In addition, since the length of our data series is short, we refrained from using more sophisticated techniques, like ARIMA.

2.2. Multivariate Modeling

While the ETS method does provide a starting point or base value of the forecast, it ignores the impact of other variables on the series to be forecasted. In addition to the ETS method, we have used the Cochrane–Orcutt Autoregressive model for forecasting based on a multivariate model to allow for the impact of other relevant factors (Cochrane and Orcutt [28]). Based on the current literature (e.g., Suganthi and Jagadeesan [29], Sengupta [30], and Parikh et al. [31] for India and Intarapravich et al. [32] and Hunt & Ninomiya [33] for studies outside India, among others), we hypothesize that Gross Energy Consumption depends primarily on four factors—Gross Output or GDP from the production side, Technology (or Energy Efficiency), Total Population, and Energy prices. It is also argued that the manufacturing sector typically has higher energy intensity than the rest of the economy, and hence, the share of manufacturing in GDP also affects TPEC. Thus, our list of explanatory variables includes GDP (both level and per capita at constant 2011–2012 prices), Population (million), Gross Capital Formation (both level and per capita at constant 2011–2012 prices, as a proxy for Technology), Share of Manufacturing in GDP, and Energy Prices.
We have used a log-linear Cobb-Douglas (C-D) type functional form, where the elasticities of demand with respect to the factors are assumed to be constant and captured as parameters of the equation:
T P E C t = A · G D P t β 1 · P O P t β 2 · G C F t β 3 · P C M A N U t β 4 · P t β 5 ;
With a log-transformation, we obtain the following log-linear model amenable to OLS estimation:
ln T P E C t = ln A + β 1 ln G D P t + β 2 ln P O P t + β 3 ln G C F t + β 4 ln P C M A N U t + β 5 ln P t + u t ;
However, this model suffered from autocorrelation with a statistically significant Durbin–Watson statistic (see Table A1 for details). On further inspection, the error term ut in Equation (1b) was observed to be first-order autoregressive, i.e.,
u t = ρ · u t 1 + e t ;   ρ < 1 is the autocorrelation parameter
Hence, we applied a Cochrane–Orcutt type transformation to the original model, so that we have:
l n   T P E C t * = ln A * + β 1 ln G D P t * + β 2 ln P O P t * + β 3 ln G C F t * + β 4 ln ln P C M A N U t * + β 5 ln ln P t * + e t ;
where:
T P E C t * = T P E C t ρ · T P E C t 1
A t * = A t ρ · A t 1
G D P t * = G D P t ρ · G D P t 1
P O P t * = P O P t ρ · P O P t 1
G C F t * = P C M A N U t ρ · P C M A N U t 1
P t * = P t ρ · P t 1
The error terms of Equation (1d) are white noise, and so this equation can be estimated using OLS, and the coefficients can be obtained. The Cochrane–Orcutt method estimates ρ , then transforms the model and re-estimates the coefficients. We have used this technique to estimate the multivariate function for TPEC.
We have used a similar methodology to forecast LNG Consumption in the country, except for the change that instead of taking both Population and GDP as explanatory variables, we have taken GDP Per Capita as an explanatory variable. Here, too, the original model was observed to be suffering from autocorrelation, and so a Cochrane–Orcutt transformed model was estimated (see Table A2 for details).
This part of the forecasting is based on the in-sample period of 32 years, and forecasts are made for the future period of 28 years. It would have been better if we could split the in-sample into two periods, Training or in-sample and Testing or validation (pseudo-out-of-sample), and then make a forecast for an actual out-of-sample future period. However, this could not be done due to the short time-series data available for natural gas, which has a nascent history of use in India.
Between the two methods, the univariate method is simple to understand, less data intensive, and easy to compute. However, it is less precise and does not factor in the impact of other related causal variables. On the other hand, the Cochrane–Orcutt method provides more accurate forecasts and allows the inclusion of causal variables. However, it is a relatively complex and much more data-intensive method.

2.3. Data Sources

The sources for secondary data include BP Statistical Review [34] and International Energy Agency [35] reports for Energy Consumption data; World Bank [36] reports for population and GDP data; National Accounts Statistics [37] of the government of India for data on GDP, Capital Formation, and sectoral shares in GDP; Handbook of Statistics on Indian Economy [38] for data on price indices; and India Energy Outlook [1] for details on domestic energy production and consumption (see Table A3). We have used annual data until 2022, going back to 1990 (even earlier in some cases). However, we have used a three-year moving average for the year 2021 to accommodate the impact of the COVID-19 pandemic and lockdown on production and energy consumption. Thus, our study consists of data for 32 periods from 1990 to 2022. We then forecasted Energy Demand in India until 2050, which is a period of roughly 30 years. In addition, we also forecasted natural gas consumption and production for the same period.

3. Results and Analysis

3.1. Gross Energy Demand

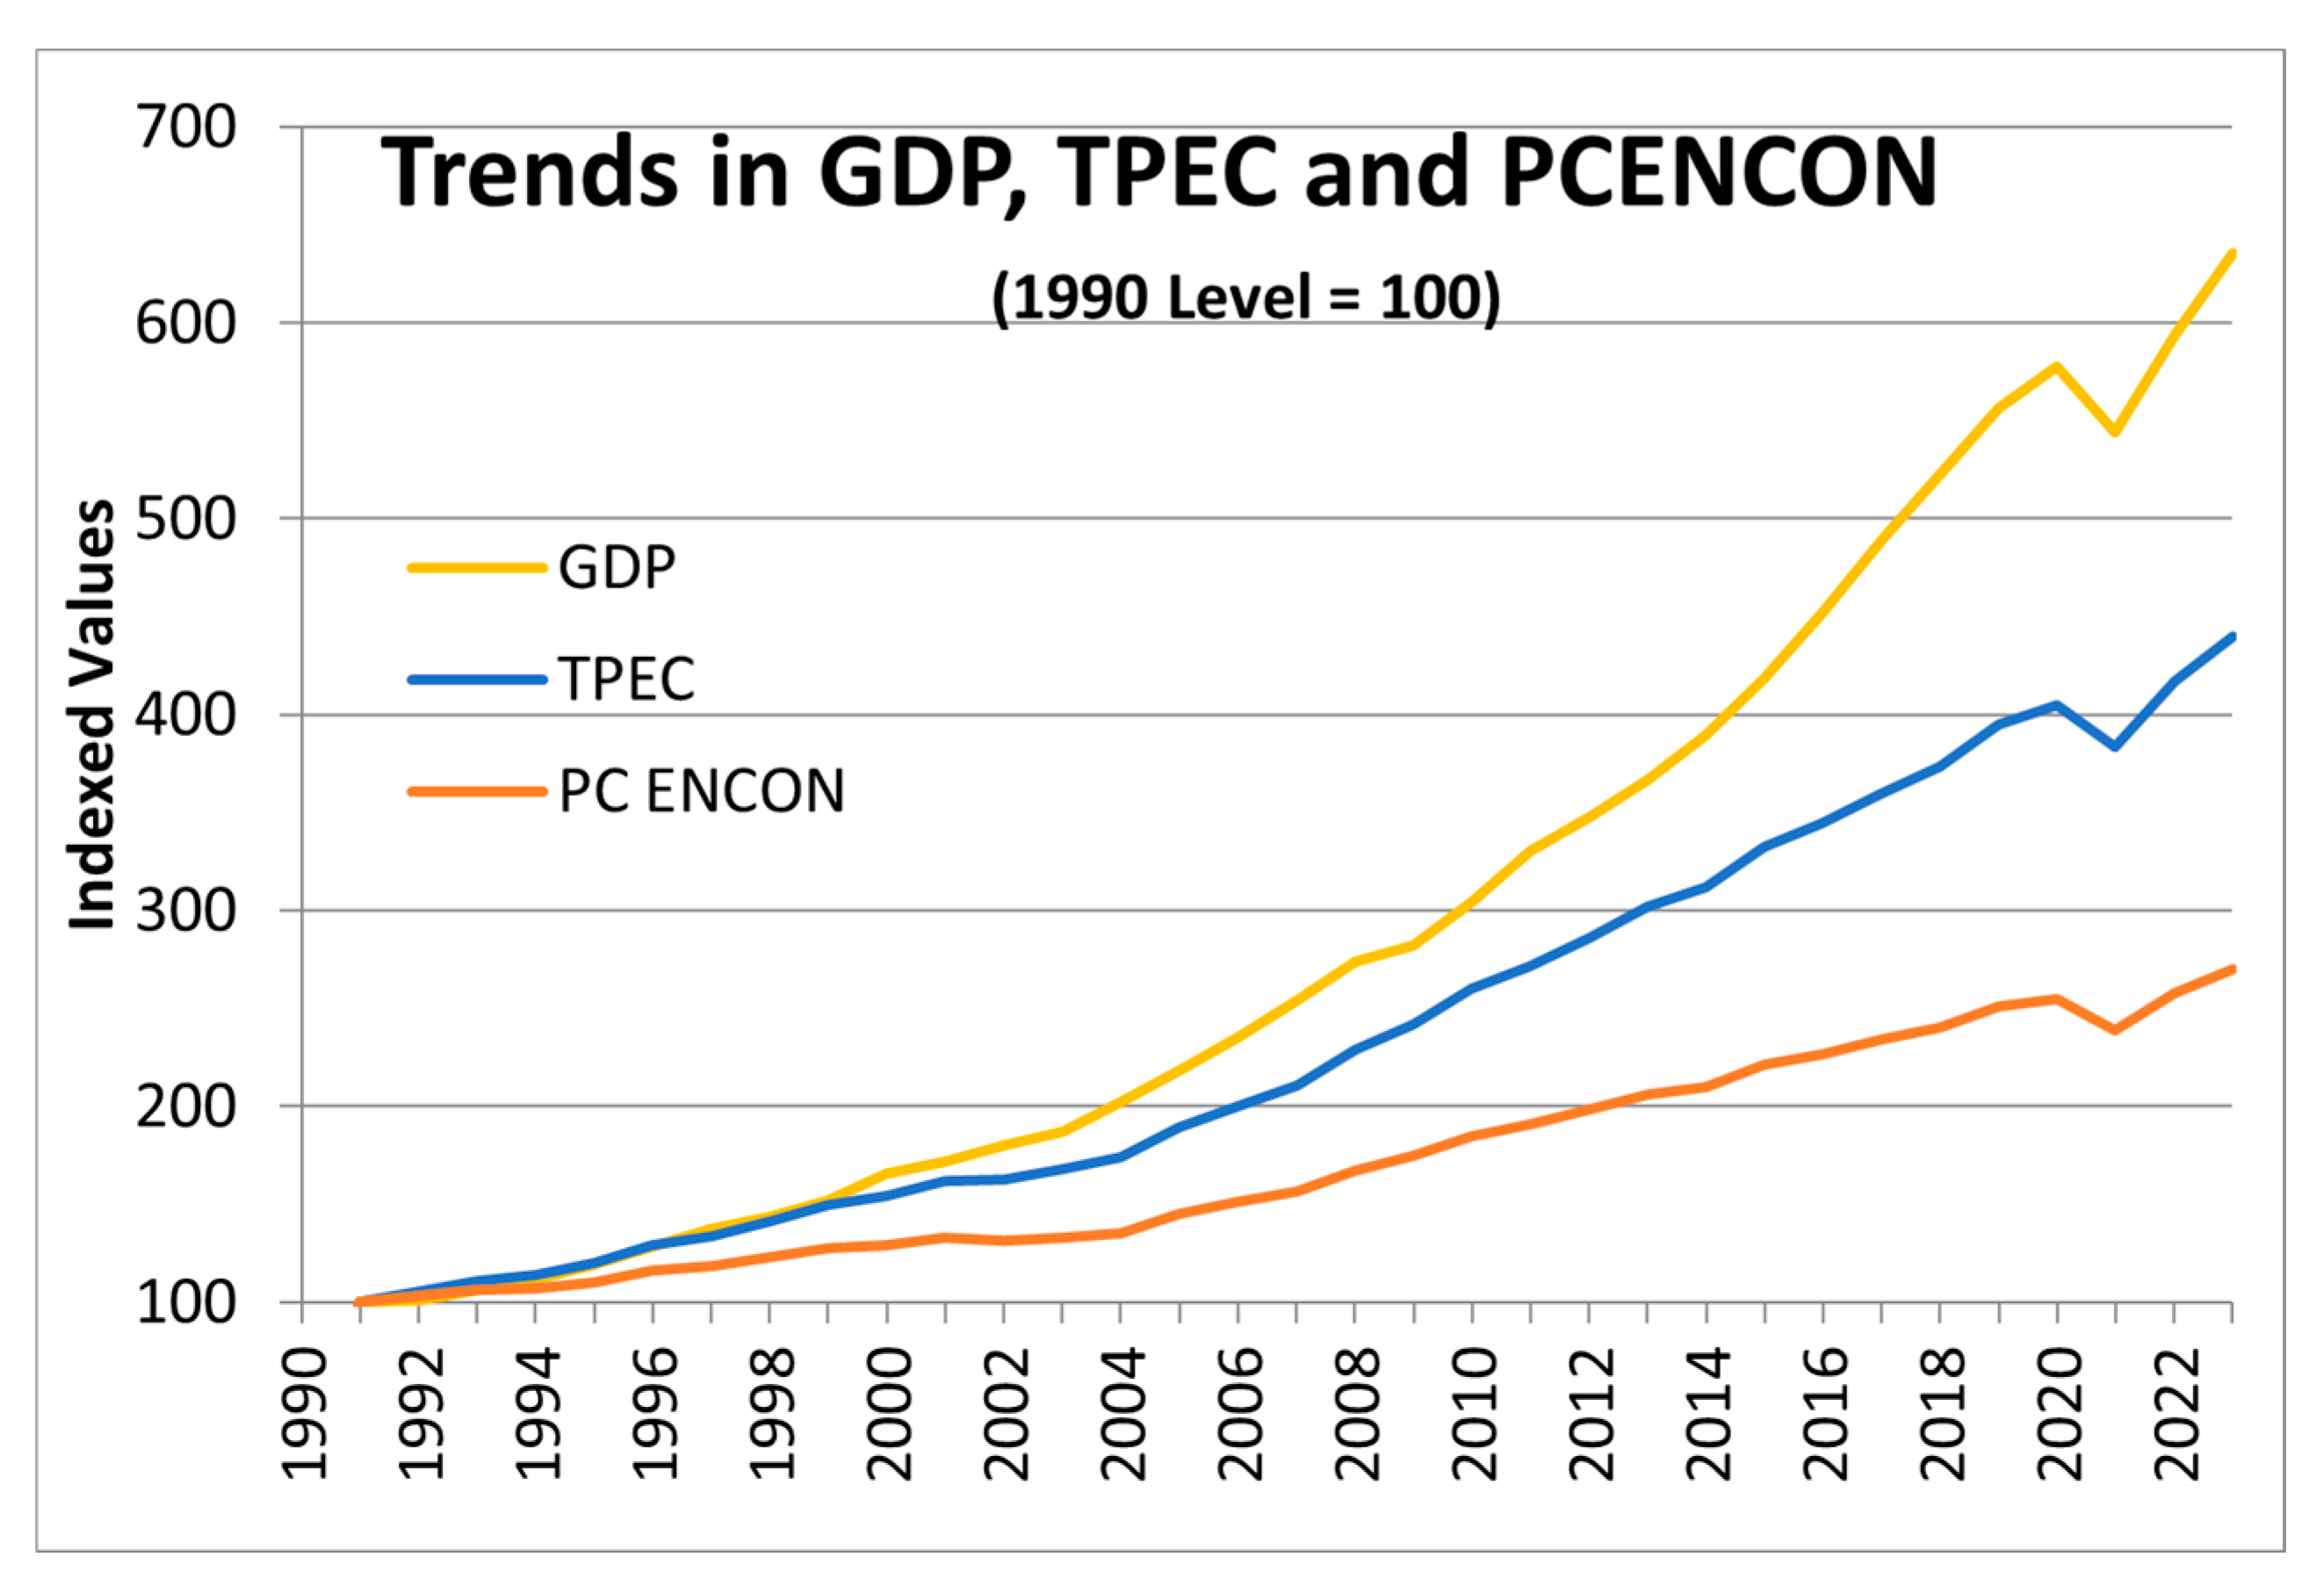
3.1.1. Status and Trends

It is a fact that a positive relationship exists between economic growth and energy demand. Therefore, we try to outline the energy demand pattern and economic growth levels during 1990–2022.
From Table 1, we find that during the year 1990, India’s GDP was USD 465.2 billion (at constant 2015 prices); Primary Energy Consumption was 8.3 EJ, and Per Capita Energy Consumption was 9.5 Gigajoule per person. With progress in economic growth and development, GDP increased over the decades to USD 2954.9 billion in 2022, Energy Consumption increased to 36.4 EJ, and Per Capita Energy Consumption increased to 0.26 EJ per 10 million persons. This consistent upward trend (except for the COVID-19 pandemic period of 2020–2021) is exhibited in Figure 1, as well.

3.1.2. Share of Coal/Oil/Nuclear/Renewables
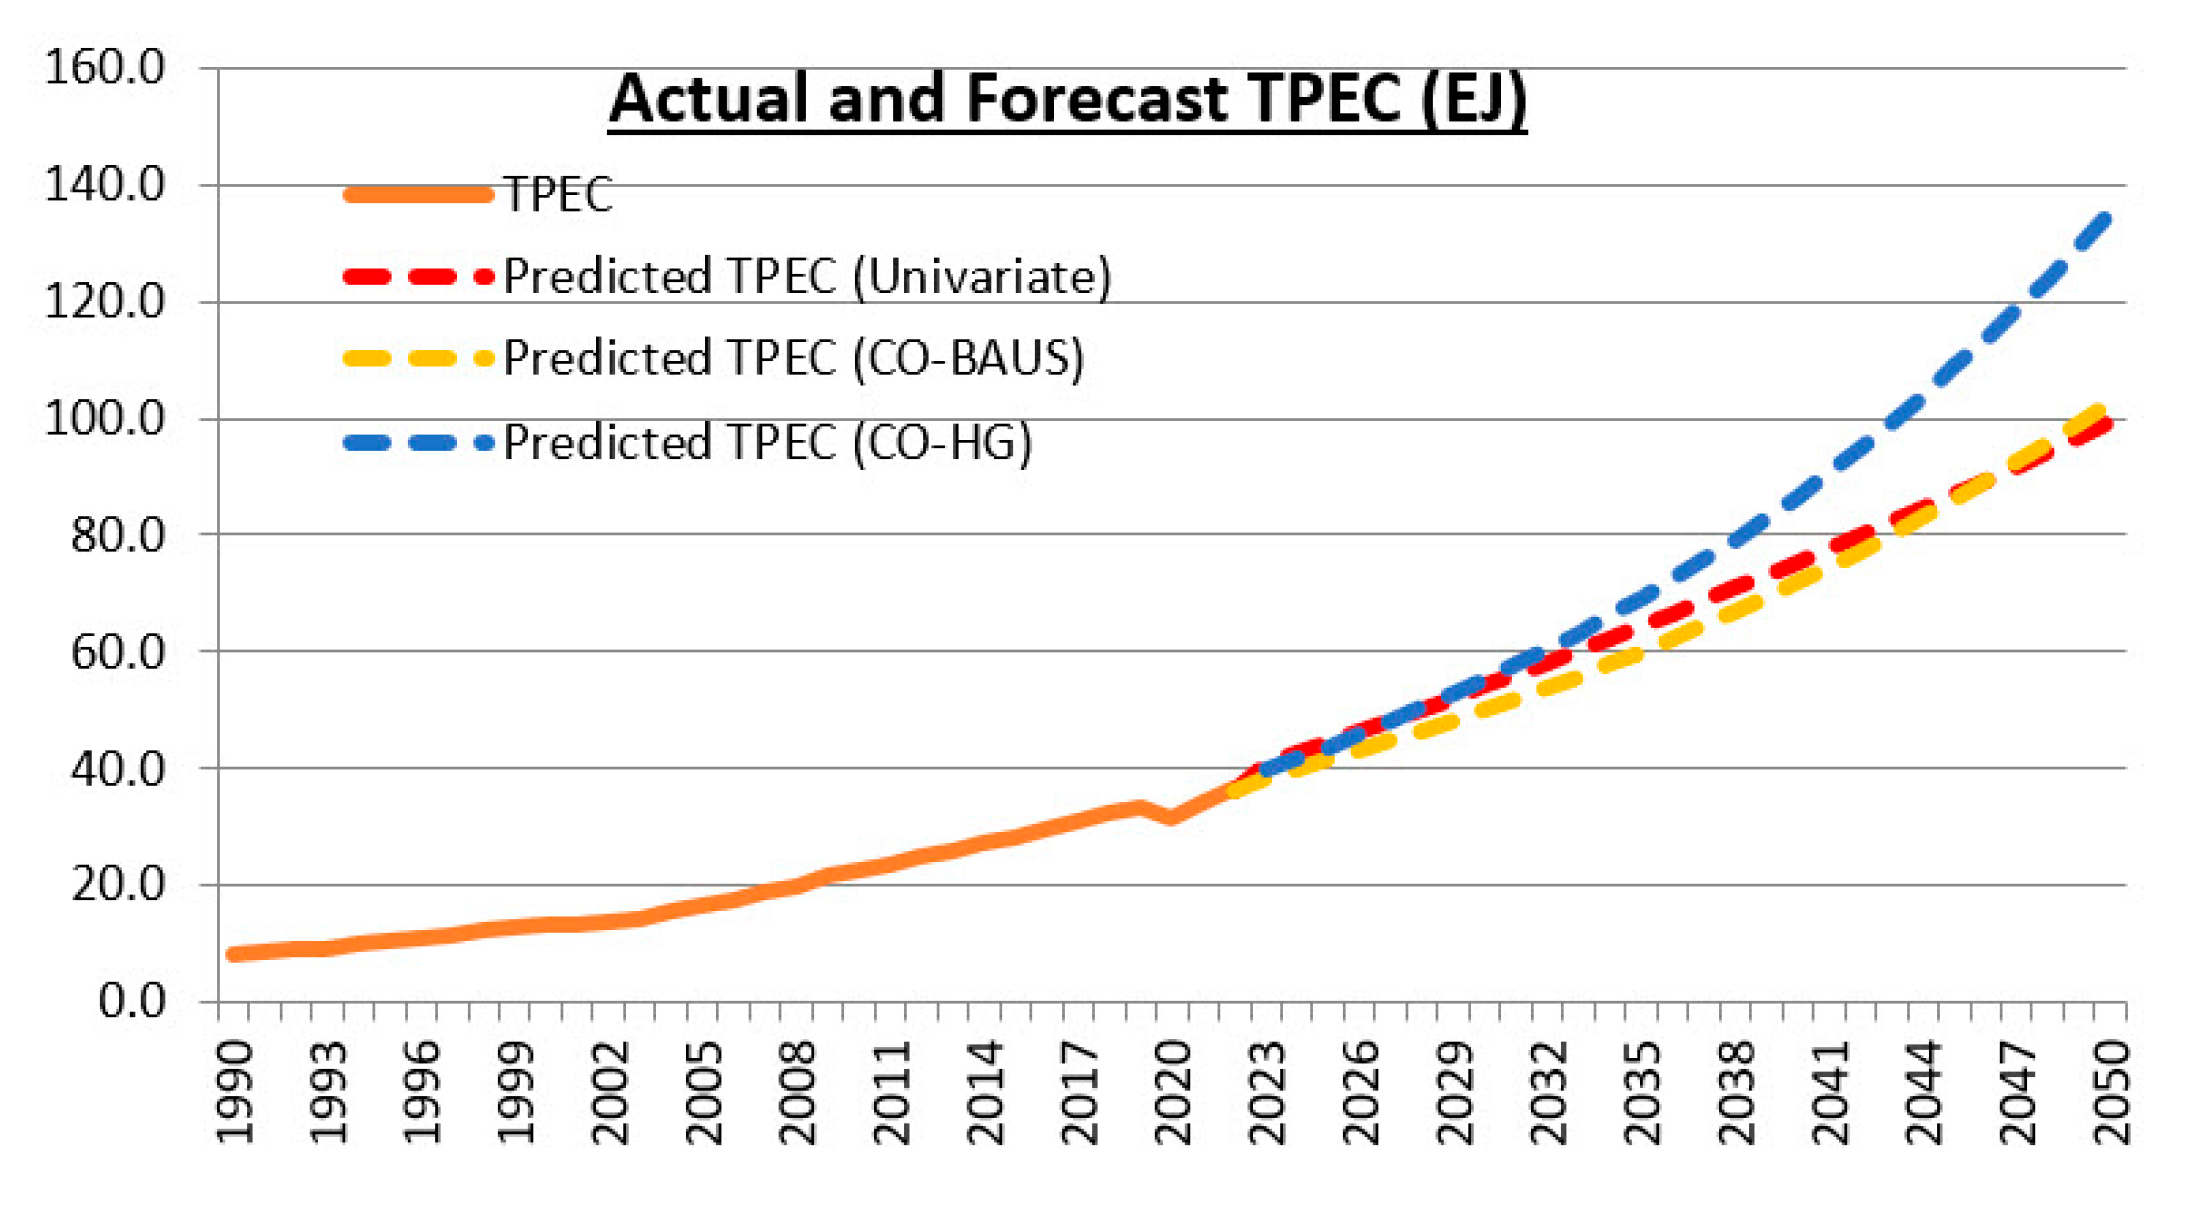
It is necessary to examine the pattern of energy mix, which comes from different energy sources—both renewable and non-renewable or fossil energy. In India, renewables like Solar and Wind energy were not used until the 1980s, and coal was the dominant source of TPEC, accounting for more than half of total energy consumption. During the 1990–2010 period, the share of fossil fuel increased while renewables declined. After 2010, the share of renewables, including hydroelectricity, increased, but the share of fossil fuels remained above 80 percent until 2020, as evident from Table 2. Consumption of fossil fuels other than coal and oil has also increased in the last decade, and natural gas has played a significant role in that. This follows a continuous effort to improve environmental sustainability and decrease the consumption of high-carbon energy sources.

3.1.3. Forecast

We have tried to forecast Total Primary Energy Consumption in India over the next two decades using both univariate and multivariate methods. For the univariate method, we have considered exponential smoothing, where forecasts are weighted averages of previous observations, with exponentially decreasing weights on older terms. Specifically, we applied Holt’s Linear exponential smoothing method for forecasting. Using this univariate method, we find that TPEC is expected to reach around 54 EJ in 2030, 75 EJ in 2040, and 99 EJ in 2050 (Table 3). These figures are close to the predictions by IEA [1] and BP [34].
However, the univariate forecasts depend on past trends of TPEC only and do not consider the movement of other explanatory variables on TPEC. Hence, a better estimate of the projected values would be that from the multivariate forecasting methods. For the multivariate forecasts based on the Cochrane–Orcutt method, we have assumed the following scenario for the explanatory variables:
(i)
GDP: two alternate scenarios—6 percent pa growth between 2020 and 2050 (Business-as-Usual scenario (BAUS), observed long-run growth rate over the 2010–2020 period) and 8 percent pa growth rate (high-growth scenario).
(ii)
GCF: remains unchanged at 30 percent of GDP.
(iii)
Share of the manufacturing sector in GDP: unchanged at 16 percent of GDP.
(iv)
Price levels: follows the IEA projections, rising by 2.5 percent pa during 2020–2030 and at 3 percent pa after that.
(v)
Population: MOHFW [39] projections.
The multivariate Cochrane–Orcutt regression results are provided in Table A1. Using those results and under the assumptions outlined above, TPEC is expected to reach around 50 EJ by 2030, 72 EJ by 2040, and 102 EJ by 2050 (for the BAUS scenario). If India shows an impressive 8 percent pa growth sustained over the next two decades, TPEC will touch 55 EJ in 2030, 86 EJ in 2040, and 135 EJ under the high-growth scenario.
We find that the univariate and multivariate forecasts under BAUS are close, and the discrepancy between them is less than 5% in the long run (Figure 2). We can thus infer that our forecasts are robust. The high-growth forecast is close to the other forecasts for 2030 but significantly higher for 2040 and 2050.
Several institutions like BP [40] have predicted that the share of Coal and Oil is expected to show a declining trend over the next three decades, while Natural Gas and Renewables will show a marked rising trend (Table 4). This trend will be accelerated if the country follows the Net-Zero Carbon policy over the 2030–2050 period. This brings us to the importance of natural gas in India’s energy transition process.

3.2. Natural Gas

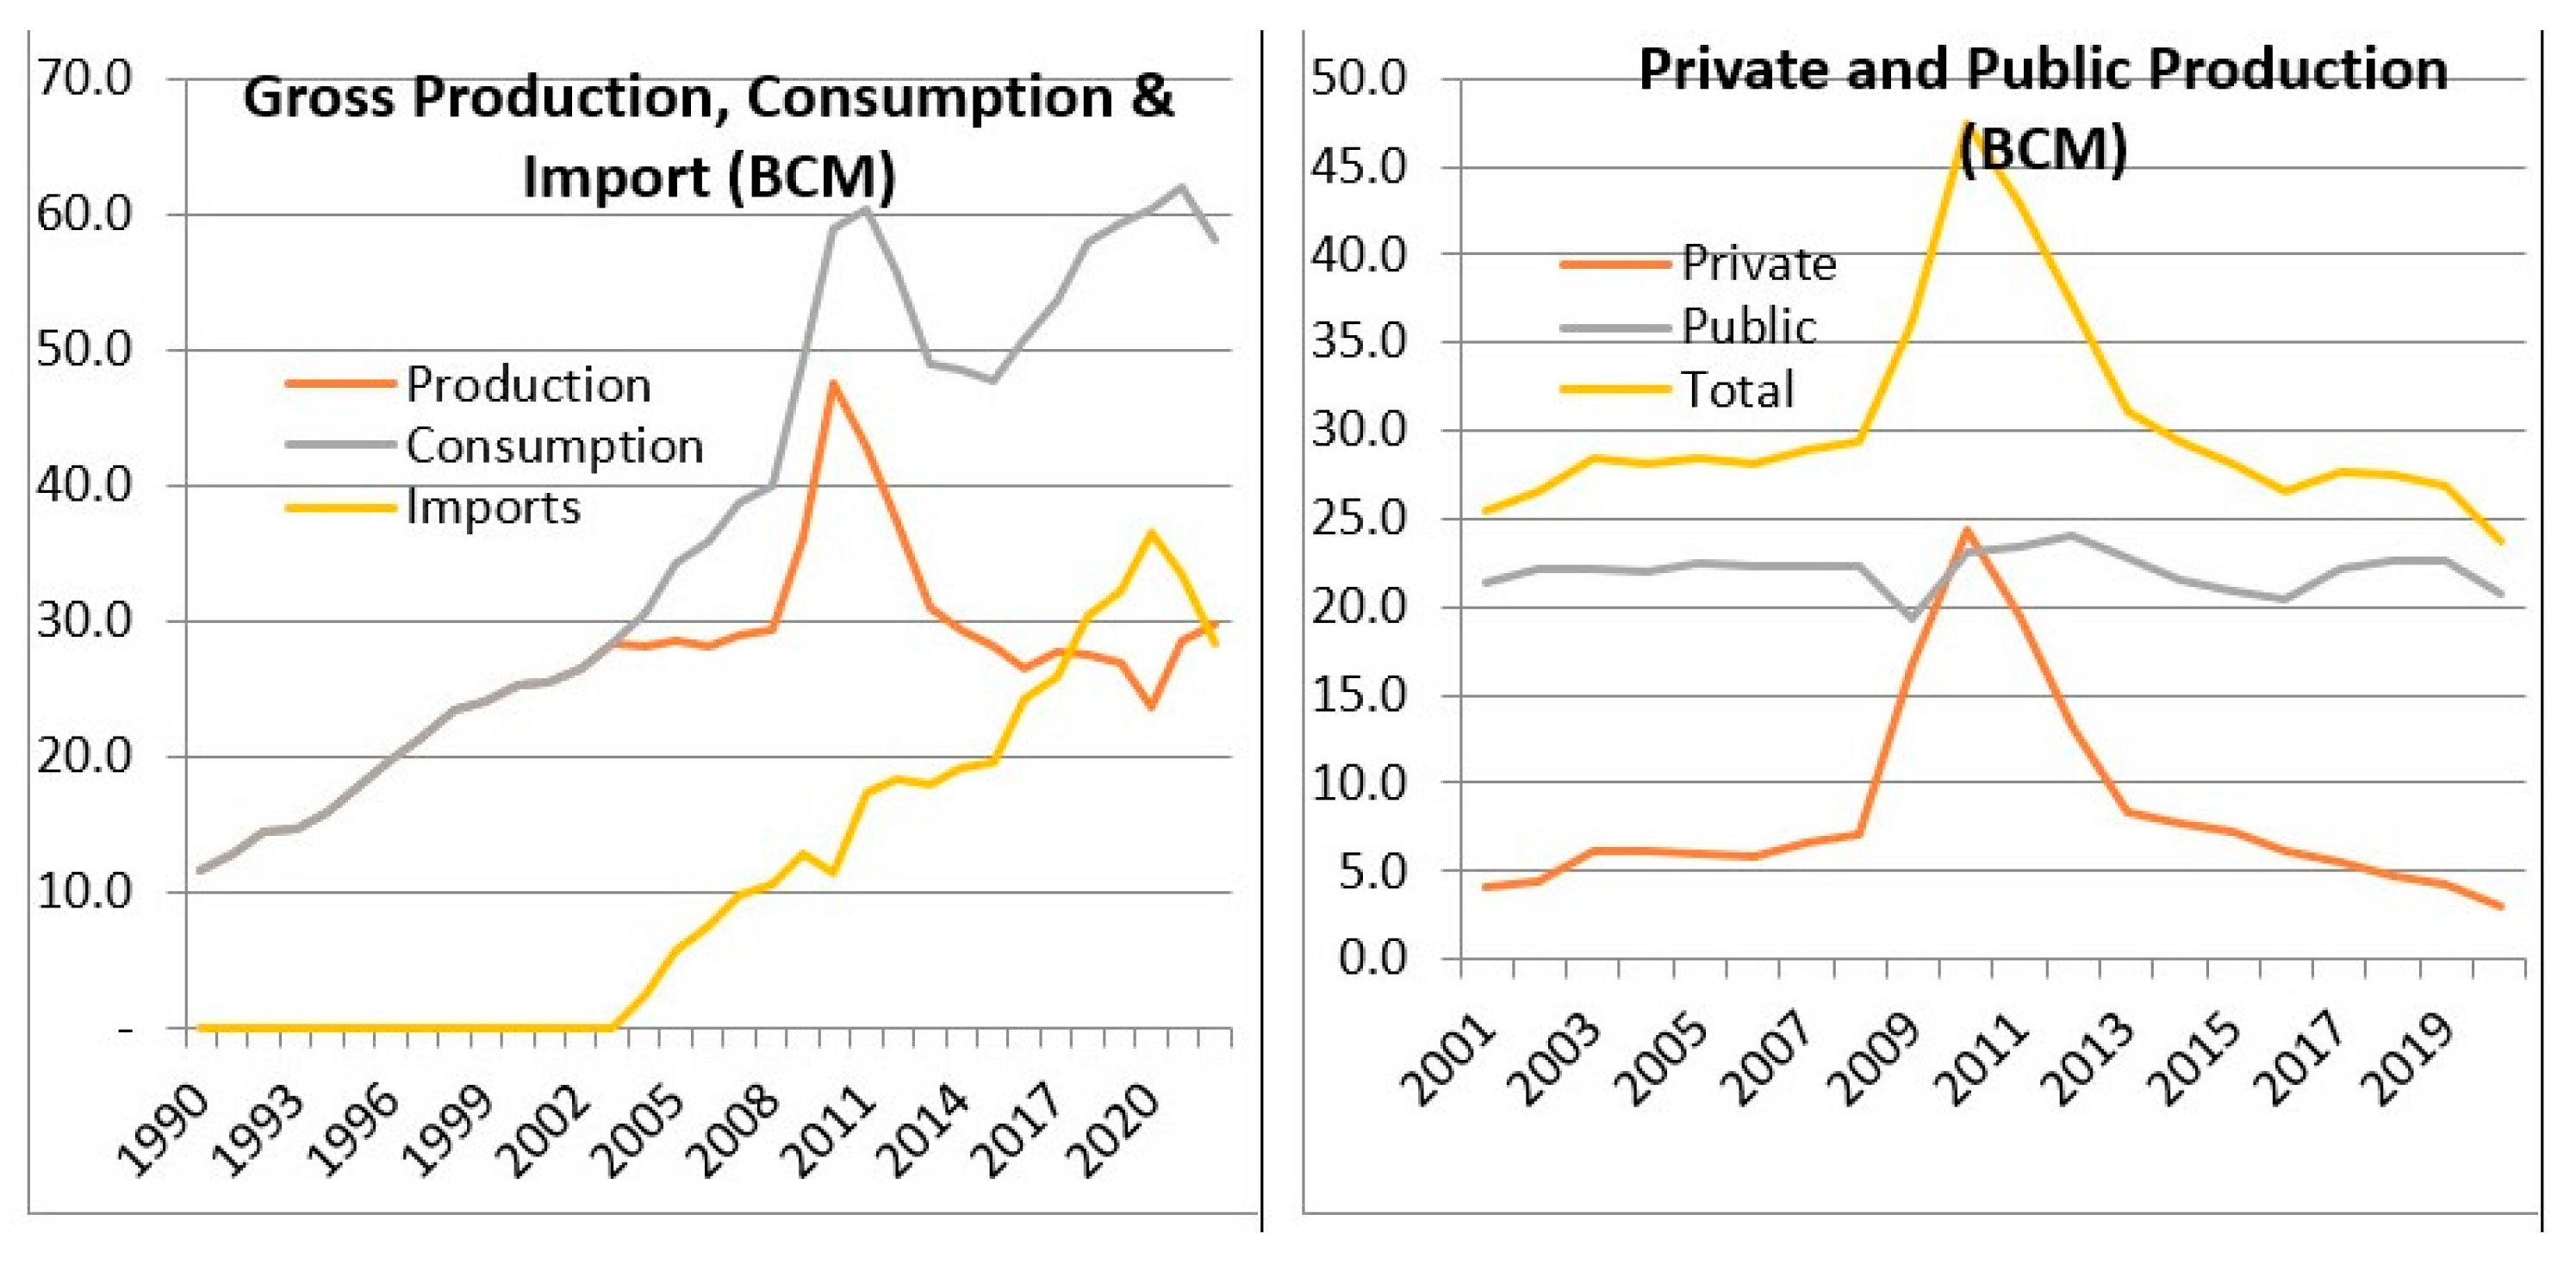
3.2.1. Production and Consumption: Status and Trends

It is found that India has been gradually inclined towards using renewable energy sources to decarbonize the environment within the next twenty years. However, it cannot depend only on renewables without compromising economic growth. Therefore, demand for natural gas, which has a low carbon content compared to other non-renewable energy sources, has recently gained importance.
We find that natural gas consumption during the year 1990 was 11.59 bcm, all of which was produced domestically (Table 5). Both consumption and production of natural gas have increased since then. However, after 2010, domestic production decreased, while consumption kept growing. Higher amounts of natural gas had to be imported to meet the shortfall. Natural gas imports have consistently increased since 2000, indicating that natural gas imports have played an essential role in India’s energy mix in the current century (Figure 3). Also, domestic production of natural gas had almost halved in the country between 2010 and 2020 because of various reasons, like the aging of the gas wells, conflict with the lessee in the leased-out KG-D6 offshore basin, and under-exploitation of Coal Bed Methane (Corbeau et al.) [41].
Besides studying the trends in the production of natural gas over time, we need to explore the requirement of demand for natural gas within the country across energy-using and non-energy-using sectors of the economy and the resultant imports. Natural gas is widely used as an energy source by several sectors, such as power generation, industrial, agricultural, tea plantations, and residential. Moreover, it is also used for non-energy use in sectors like fertilizer and petrochemicals. Initially, the country’s energy and non-energy use of natural gas were almost similar. During the 1990–2010 period, natural gas use as energy skyrocketed to more than double that of non-energy use. However, during the next decade, the non-energy use of natural gas increased while that as an energy source declined to one-third of its amount in 2010 (Table 6).
The main reason behind this was the falling domestic gas production; the government started a rationing system where allotment to the Fertilizer and Petrochemical sectors were prioritized. Fertilizer production and power generation account for more than four-fifths of natural gas consumption in India. Thus, falling domestic natural gas production has impacted India’s ambitious program of cleaning the electricity sector by shifting from a coal-based power grid to gas-based power generation. Domestic production, however, picked up after 2018 when the HELP (Hydrocarbon Exploration and Licensing Policy) was enacted, but imports still play an important role in India’s gas sector.

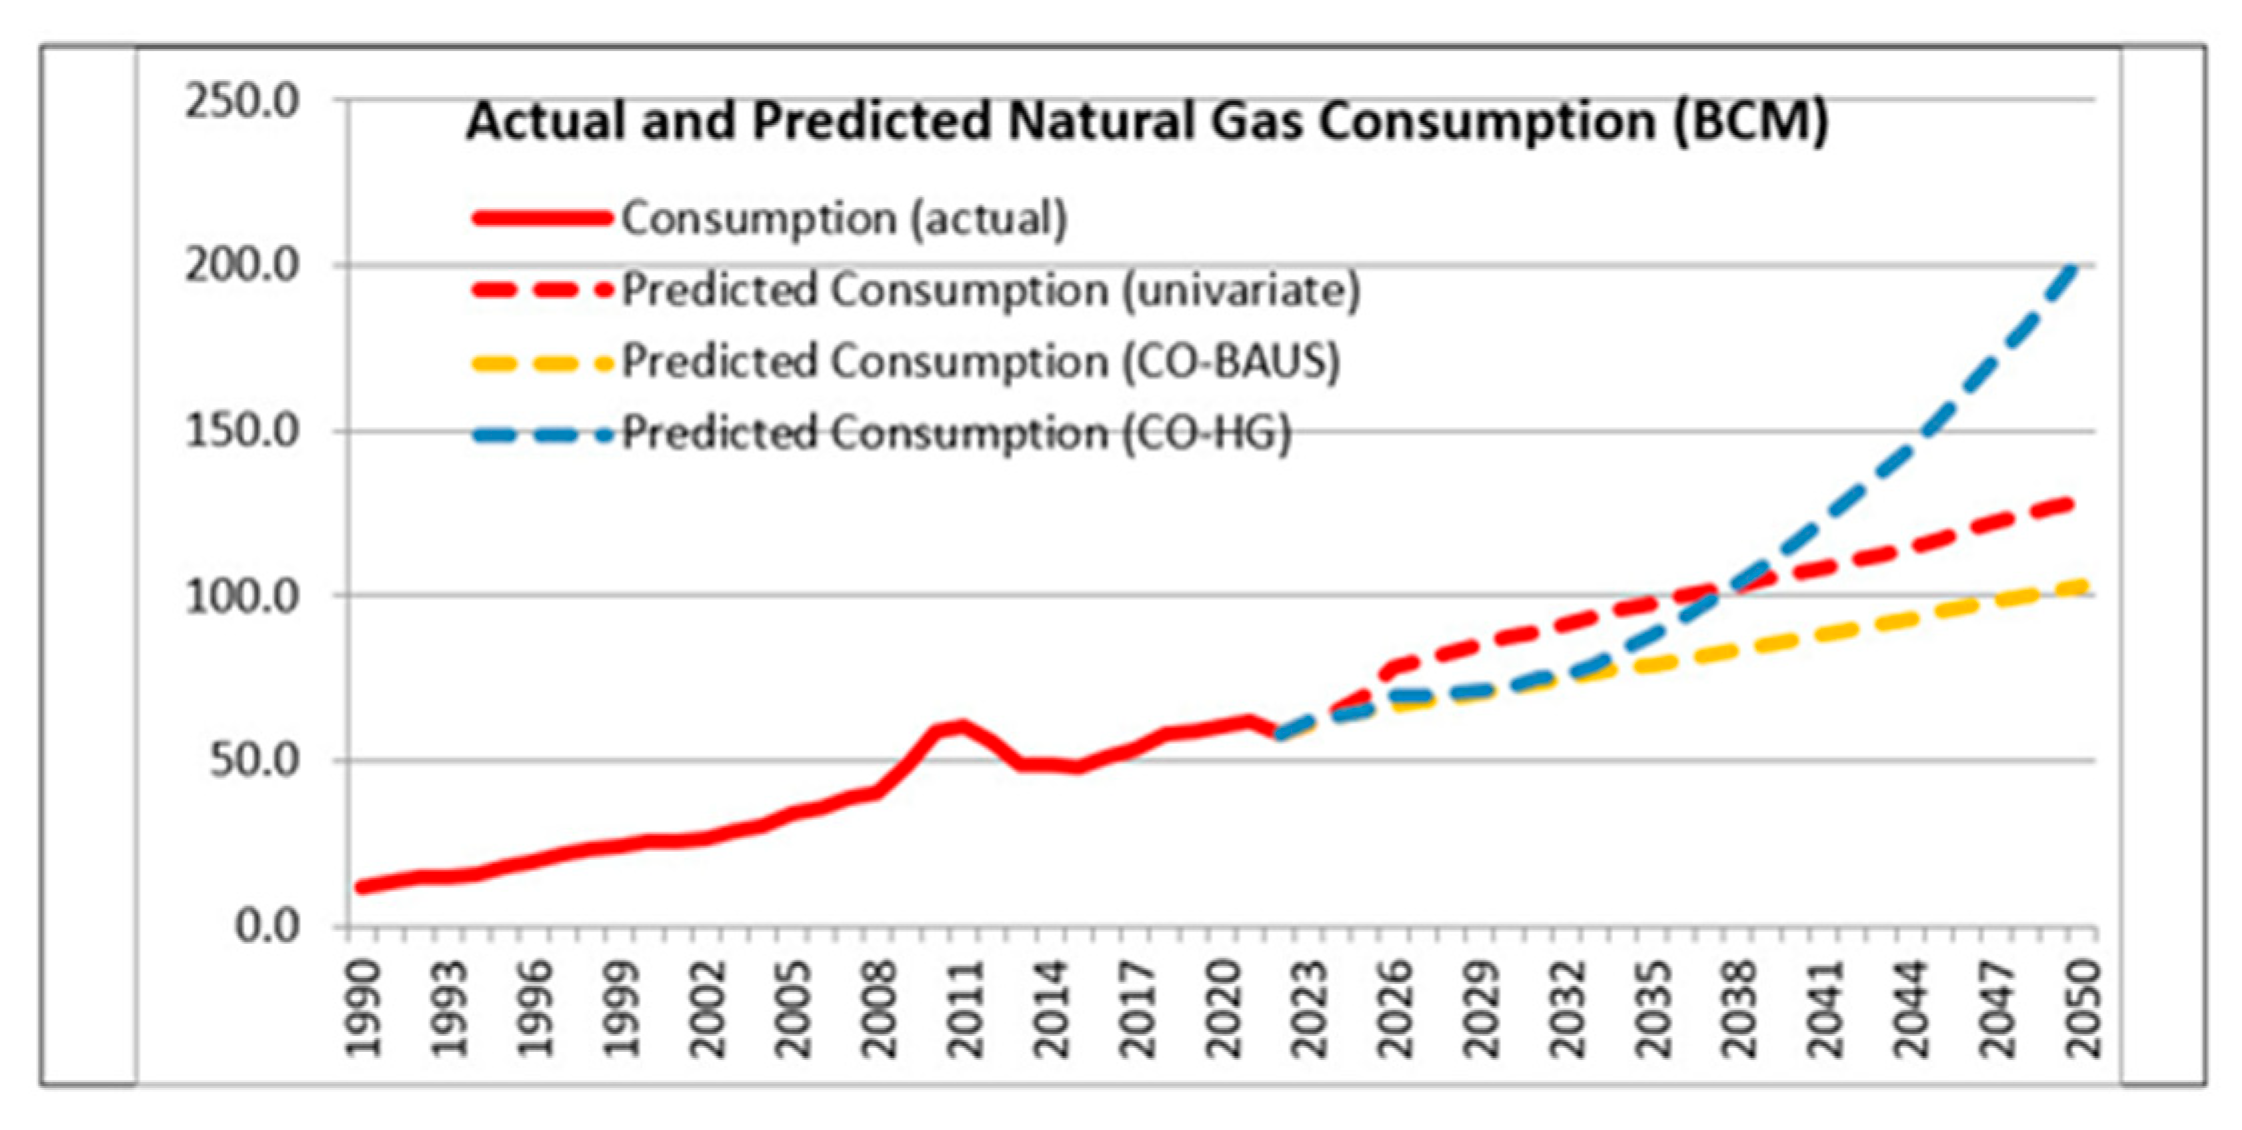
3.2.2. Univariate Forecast of Natural Gas Consumption

As mentioned in the methodology section, we have used Exponential Smoothing using the Holt-Winters Linear method for univariate forecasting since it is the most appropriate method for forecasting yearly data without seasonal components, given that our dataset is small. Using a double exponential smoothing forecasting process, our results indicate that consumption of natural gas will continue to rise in the coming decades until 2050 (Table 7).

3.2.3. Multivariate Forecast of Natural Gas Consumption

As mentioned in the methodology section, while the Holt-Winters smoothing algorithm provides a reasonable approximation for predicting future natural gas production and consumption, it relies solely on the historical values of the specific variable to be forecasted. Given that numerous factors influence natural gas consumption, the suitability of forecasting energy demand using a double exponential smoothing algorithm may be subject to scrutiny. Exploring alternative methods that consider various related variables may be necessary. In this study, we opted for the Cochrane–Orcutt model. Results of multivariate time-series regression using the Cochrane–Orcutt model are available in Table A2.
Regression results show that only GDP Per Capita has a positive and statistically significant impact on natural gas consumption. Other variables, like Gross Capital Formation, Share of Manufacturing in GDP (PCMANU), and Price Index of Natural Gas, also have a positive impact on gas consumption. However, the coefficients are not statistically significant. This translates to a forecasted natural gas consumption of 88 BCM in 2040 and 133 BCM in 2050 under the BAUS. Under the high-growth scenario, gas consumption may cross 200 BCM in 2050 (Table 7 above). The forecasts are outlined in Figure 4.

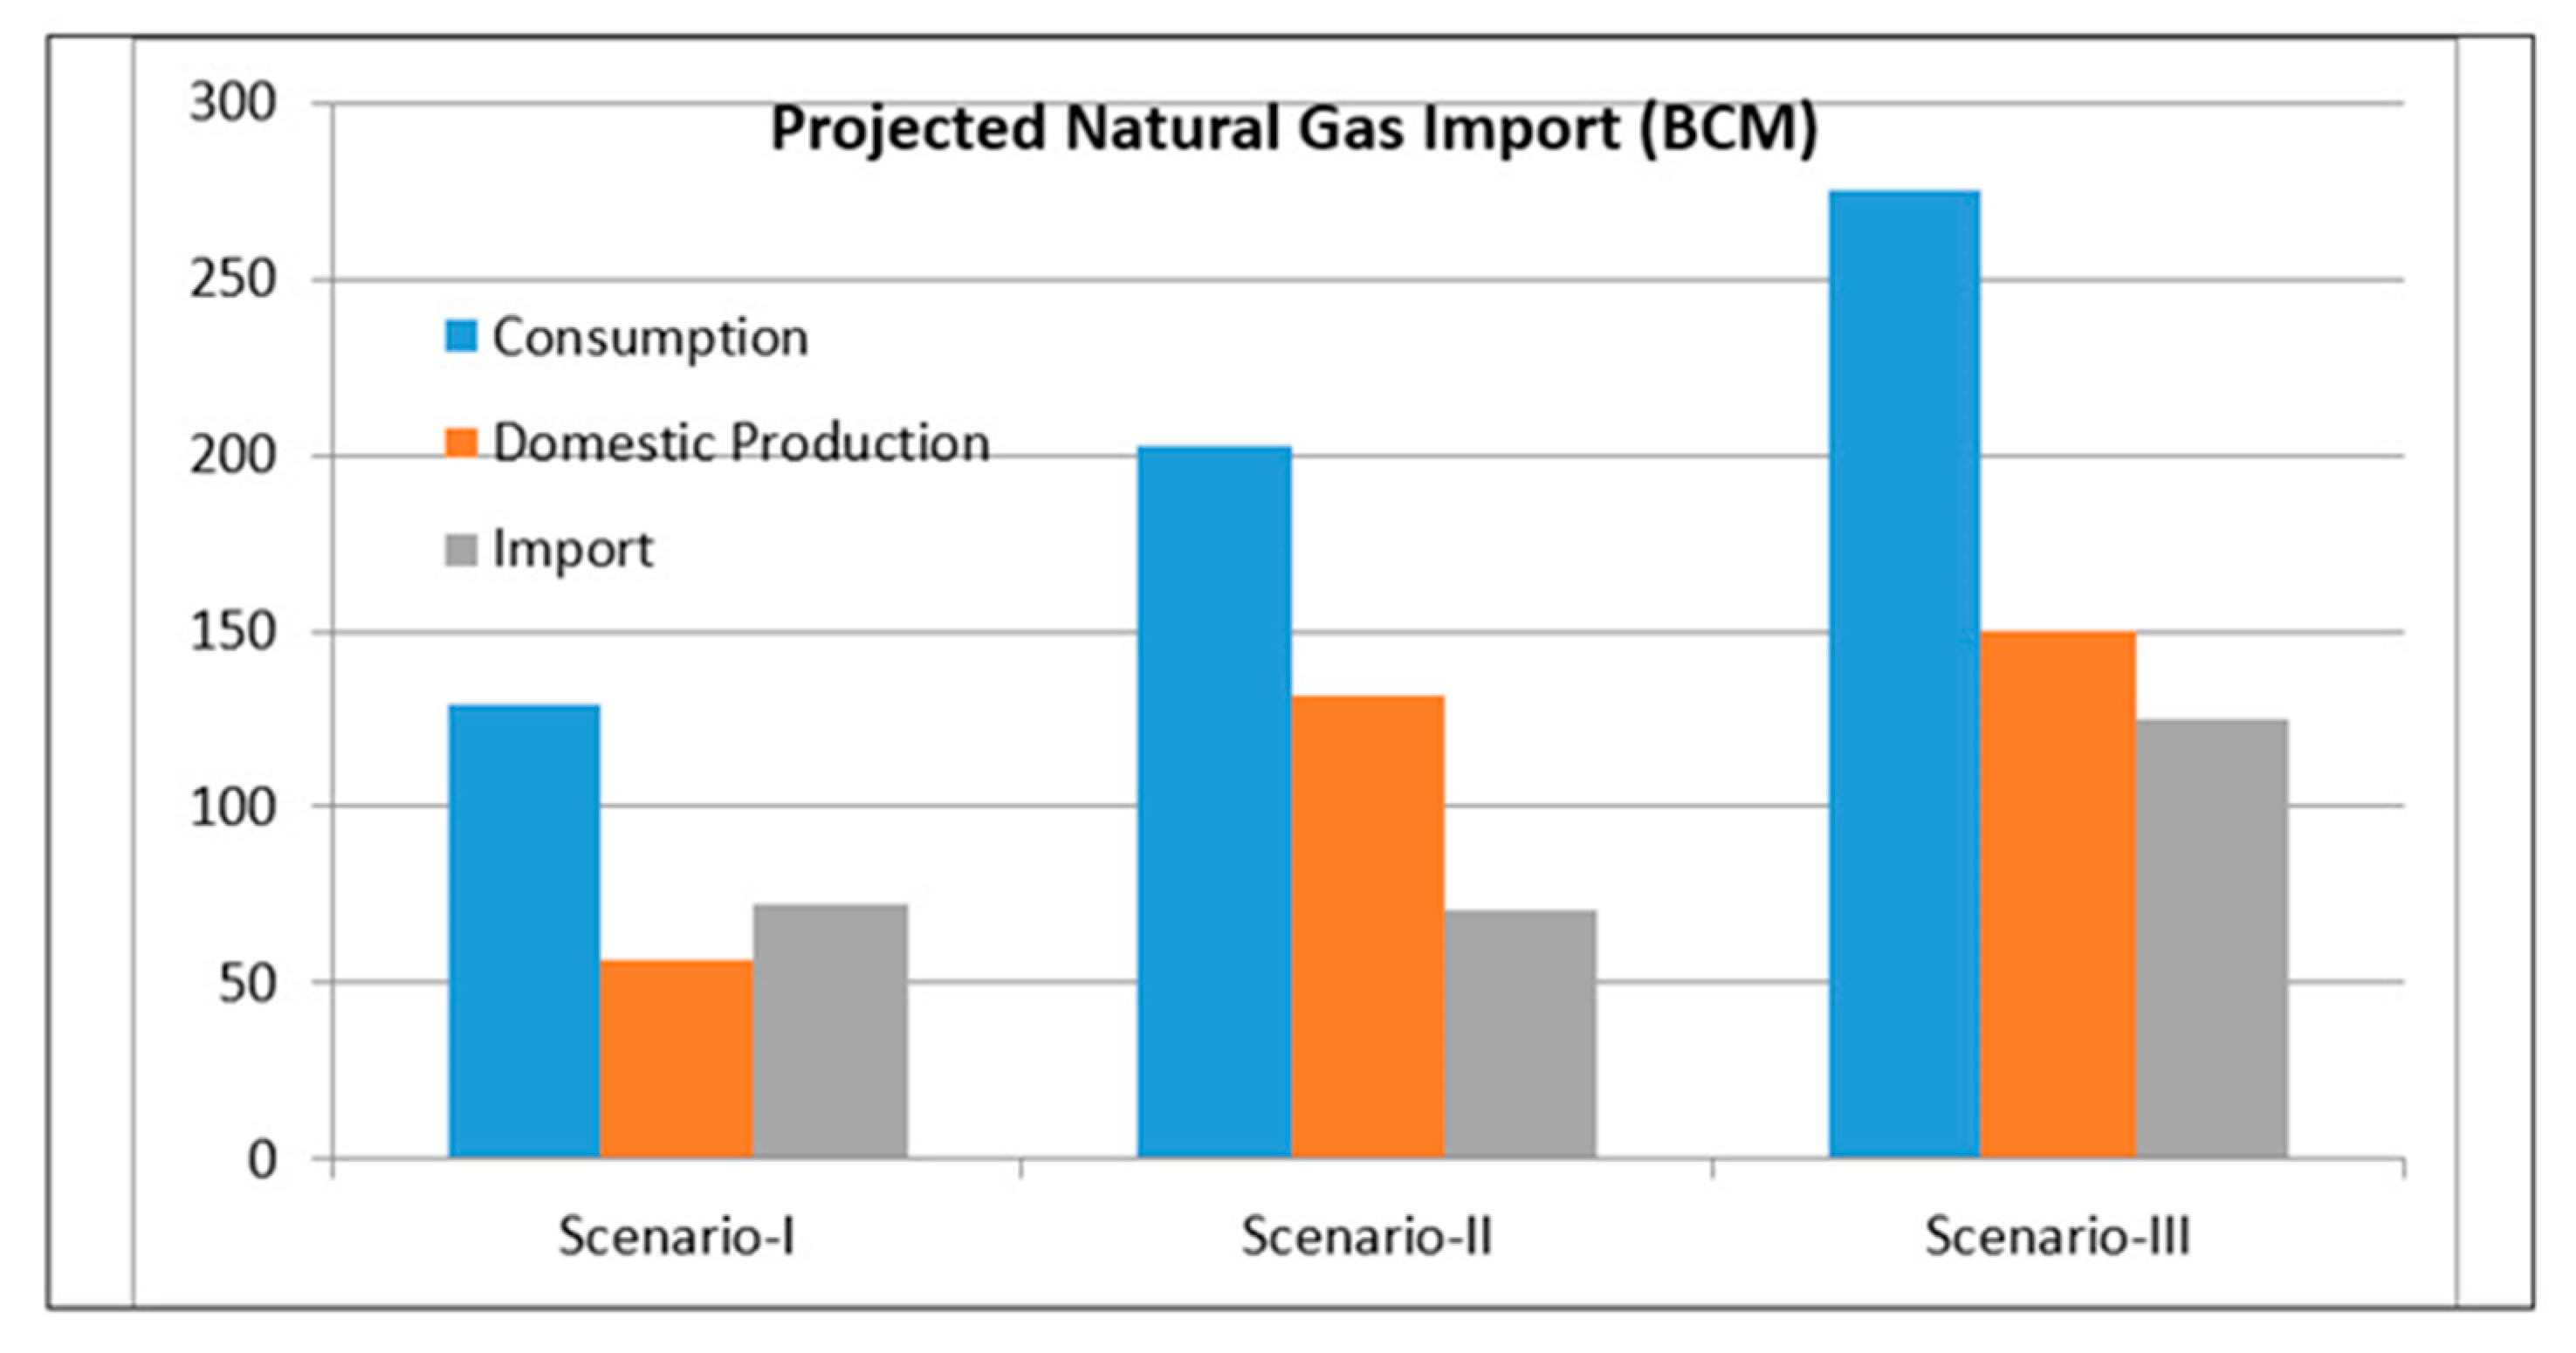
3.2.4. Forecast of Natural Gas Production

As mentioned in the methodology section, forecasts of domestic production of natural gas have been done in two ways. First, we used the Holt-Winters univariate exponential smoothing method to estimate production until 2050. Using this method, production is expected to rise to 49 BCM in 2040 and 56 BCM in 2050 (Table 8). In the same table, we have also reported the projected domestic production values from India’s National Energy Policy 2017 report prepared by the government think tank NITI Aayog [43] and the BP Energy Outlook 2023 [40]. The NEP or NITI Aayog projections can be considered overly optimistic, as even half of the projected figure for 2022 has not been met. We also see that projected production lags behind expected consumption during the period.

4. Discussion and Implications for Natural Gas Sector

While we have presented model-based forecasts about natural gas consumption and production in India, there are also other considerations. India expects to meet nearly 15 percent of its total energy needs from natural gas in the short-to-medium term (PNGRB, 2013) [22]. Following our projections of TPEC in Table 3, this translates to about 8 EJ of energy coming from gas by 2030, rising to approximately 15 EJ by the year 2050. That amounts to nearly quadrupling natural gas consumption from its current figures by 2030 and increasing it by eight times by 2050—a very tall order indeed! Even a conservative projection of 10% of TPEC being met by gas would indicate gas consumption to be close to 150 BCM in 2030 and 275 BCM in 2050.
A corollary of such a scenario is that domestic production of natural gas would not be able to meet even one-third of these projected consumption levels. Naturally, India’s dependence on imported natural gas will increase further, and by 2050, 30–50 percent of India’s gas consumption (roughly 70–125 BCM) will be met by imports (Figure 5).
This has several implications for the gas sector and, consequently, the energy sector. First, with an increasing share of gas in the energy basket, India’s gas infrastructure must be ramped up on a war footing basis. India’s operational gas pipeline length is 21,129 km, while another 12,000 km of pipeline is under construction (GoI) [44]. The combined capacity of LNG terminals for handling gas imports is 42.7 MMTPA, of which about half are being utilized. To address the increased gas consumption, pipelines must be trebled by 2030 and quadrupled by 2050. Similarly, to handle the increased imports, LNG terminal capacity must be doubled by 2030 and trebled by 2050. However, only half of the additional infrastructure necessary by 2030 is currently under construction (MoPNG) [45]. This requires massive investment in gas infrastructure. Since natural gas is seen as an interim choice in India’s energy basket, being relatively cleaner among all fossil fuels, before transitioning to a non-fossil fuel regime in the long run, the efficacy of such a considerable investment is questioned by the corporate sector and fiscal policymakers.
However, to reduce import dependency and enhance domestic production of natural gas, the government of India has taken several initiatives—such as natural gas marketing reforms; the discovery of the market price of natural gas through e-bidding; implementation of production enhancement contracts for cross-country natural gas pipelines; building land re-gasification infrastructure, along with floating storage regasification units, in the country—and the city gas distribution network has been developing to ensure an increase in the supply of natural gas to domestic, industrial, and commercial spaces (Annual Report of Ministry of Petroleum and Natural Gas, GOI) [46]. Whether these policies can transform the gas sector at the ground level remains to be seen.

5. Conclusions

5.1. Summary and Future Recommendations

India faces inherent challenges in its energy landscape, relying significantly on fossil fuel imports due to its limited ability to obtain energy from domestic resources. This paper has used univariate and multivariate forecasting techniques to predict energy demand. The BAUS scenario predicts that total primary energy consumption (TPEC) will attain approximately 50 EJ by 2030 and 100 EJ by 2050. We also found that our univariate and multivariate forecasts are close in the long run, confirming the robustness of our TPEC predictions.
Despite significant focus on renewable energy in the last decade, India has struggled to make substantial progress. Diverse sources, such as solar, waste, tidal wave, biomass, geothermal, and wind, have the potential to contribute to the energy mix, as highlighted by NITI [4,43] and recent media reports (ET [47]). Indeed, the government of India has undertaken several policy initiatives to harness these resources. Still, implementing these policies remains slow, and whether the ambitious plans are fulfilled remains to be seen.
Even with these expanded reserves and enhanced renewable energy development, our forecasts indicate that domestic production alone is unlikely to meet the escalating energy demand. India will continue to depend significantly on imported fossil energy. Natural gas could be the fuel of choice for India, being the cleanest among fossil energy sources (IGU [48]. Considering this, this study has also forecasted natural gas production and consumption in India. According to our projections, natural gas consumption is anticipated to reach around 90 BCM in 2040 and 133 BCM in 2050 under the BAUS. It is expected to cross 200 BCM if India shows high economic growth over the next 30 years. In contrast, domestic production by 2050 is forecasted to be around 60 BCM in the worst-case scenario and around 125 BCM in the best-case scenario. LNG imports will likely meet the gap (ranging between 30 and 50% of demand). Advancements in LNG technology, encompassing liquefaction, transport, and regasification, have positioned LNG as the preferred fuel for many countries. India should also aim to increase LNG imports rather than oil to ensure it minimizes its carbon footprint while meeting its energy requirements.
Thus, importing LNG and developing renewable energy from domestic sources will enable India to meet its growing energy requirements while aligning with its global climate change commitments. In conclusion, as India navigates the complex terrain of energy transitions, natural gas emerges as a helpful bridge fuel that can facilitate the journey from non-renewable to renewable energy and, thus, toward a cleaner, greener, and more prosperous future.

5.2. Limitations of the Study and Future Scope

This paper uses historical data spanning 32 years to forecast the future trajectory of Total Primary Energy Consumption and natural gas production and demand for India over 28 years. It is essential to acknowledge that these projections rely on a small dataset, representing a limitation of this study. This limitation mainly stems from the nascent nature of the natural gas sector in India, leading to a lack of more extensive historical data. Another limitation is the absence of policy-related explanatory variables in our multivariate forecasting model. Structural breaks brought in through policy changes are thus not accounted for in our model. Also, our forecasts may not materialize if scientific discoveries or technological innovations change the structure and composition of the energy sector in the near future.
We have also refrained from discussing India’s energy and climate strategies in detail and outlining the proposed power plant construction plans. While important, the breadth of this topic hinders comprehensive coverage in a brief space. Furthermore, exploring energy supply forecasting, a likely outcome of an extensive discussion on that, extends beyond the scope of this paper. Indeed, analyzing energy supply forecasting forms part of our future research endeavors.
The study can be extended by attempting a cross-country comparison of the trends and forecasts, where we include some other developing and developed countries to understand the differences in the functioning of the natural gas sector. One can also extend the study to examine the impact of the rise in natural gas consumption on India’s actual and future carbon emission levels.

Author Contributions

Conceptualization, S.G. and R.M.; methodology, S.G.; software, R.M. and B.C.; validation, R.M.; formal analysis, S.G. and R.M.; investigation, B.C.; resources, S.G., R.M., and B.C.; data curation, B.C.; writing—original draft preparation, B.C., S.G., and R.M.; writing—review and editing, R.M. and S.G.; visualization, R.M.; supervision, R.M. and S.G. All authors have read and agreed to the published version of the manuscript.

Funding

This research received no external funding.

Data Availability Statement

All the data are available publicly.

Conflicts of Interest

The authors declare no conflicts of interest.

Appendix A

Table A1. Multivariate Time-Series Forecasting: Cochran–Orcutt Model [Dependent Variable: Total Primary Energy Consumption].
Explanatory VariablesCoefficients
(after Transformation)
p-Value
LN Population1.164 * (0.830)0.082
LN GDP0.445 ***
(0.172)
<0.01
LN PCMANU0.045
(0.099)
0.652
LN Gross Capital Formation0.030
(0.034)
0.383
LN Price Index0.109
(0.068)
0.124
Rho (ρ) for residuals of the OLS model0.866 **
Breusch–Godfrey test statistic for OLS model22.183 **<0.01
Durbin–Watson Statistic of OLS model0.642 **<0.01
Rho (ρ) for residuals of C-O model0.035
Durbin–Watson Statistic of C-O model1.8250.193
Adjusted R2 for C-O Model0.928
Source: Authors’ calculation. Note: Figures in parentheses are standard errors. ***, **, * denote significance at 1%, 5%, and 10%, respectively.
Table A2. Multivariate Time-Series Forecasting: Cochran–Orcutt Model [Dependent Variable: Consumption of Natural Gas].
Explanatory VariablesCoefficients
(after Transformation)
p-Value
LN GDP Per capita0.624 **
(0.239)
0.015
LN PCMANU0.163
(0.305)
0.597
LN Gross Capital Formation0.129
(0.118)
0.284
LN Price Index of NG0.016
(0.042)
0.699
Rho (ρ) for residuals of the OLS model0.835 **
Breusch–Godfrey test statistic for OLS model12.396 *0.03
Durbin–Watson Statistic of OLS model0.683 **<0.01
Rho (ρ) for residuals of C-O model0.547
Durbin–Watson Statistic of C-O Model1.63490.25
Breusch–Godfrey test statistic for C-O model10.2000.17
Adjusted R2 for C-O Model0.450
Source: Authors’ calculation. Note: Figures in parentheses are standard errors. **, * denote significance at 5% and 10%, respectively.
Figure A1. Flowchart of Forecasting Techniques Used. Source: Authors’ conceptualization.
Gases 04 00001 g0a1
Table A3. Variables Used for Forecasting.
Variables UsedUnits of MeasurementSource
Gross Domestic Product (GDP) and its sectoral compositionUSD Billion at Constant 2005 pricesNational Account Statistics, GoI (various years), converted to USD using World Development Indicators, World Bank Database
Gross Capital FormationUSD Billion at Constant 2005 pricesNational Account Statistics, GoI (various years), converted to USD using World Development Indicators, World Bank Database
PopulationMillions(a) Census of India
(b) Ministry of Health & Family Welfare, GoI
Price Index (Energy)Indexed valueHandbook of Statistics on Indian Economy, Reserve Bank of India
Primary Energy ConsumptionExajoule (EJ)British Petroleum (BP) Statistical Review
Per Capita Energy ConsumptionGigajoule (GJ) per capitaBritish Petroleum (BP) Statistical Review
Total Energy ConsumptionExajoule (EJ)British Petroleum (BP) Statistical Review
Forecasted Total Primary Energy Consumption (TPEC)Exajoule (EJ)Authors’ own calculation
Natural Gas Production, Consumption, and ImportBillion Cubic Meters (BCMs)Indian Petroleum and Natural Gas Statistics, Ministry of Petroleum & Natural Gas, Government of India
Consumption of Natural Gas in India by Sectors: 1990–2020Billion Cubic Meters (BCMs)Indian Petroleum and Natural Gas Statistics
Forecasts of Natural Gas Consumption in India: 2030–2050Billion Cubic Meters (BCMs)Authors’ own calculation
Price of Natural GasUSD/MMBTUBP Statistical Review

References

  1. IEA. India Energy Outlook 2021 Special Report. 2021. Available online: https://www.iea.org/reports/india-energy-outlook-2021 (accessed on 30 November 2023).
  2. Energy Statistics of India. Ministry of Statistics and Programme Implementation, Government of India (MoSPI). 2023. Available online: http://www.mospi.gov.in (accessed on 25 November 2023).
  3. GoI. “Vision 2030”: Natural Gas Infrastructure in India; Petroleum & Natural Gas Regulatory Board, Ministry of Petroleum and Natural Gas, Government of India: New Delhi, India, 2013.
  4. NITI Aayog, GoI. “India Vision 2040” Chapter 15, Draft National Energy Policy NITI Aayog, Government of India. 2017. Available online: http://www.niti.gov.in (accessed on 1 December 2023).
  5. MoPNG. Annual Report, Ministry of Petroleum and Natural Gas, Government of India. 2022. Available online: https://mopng.gov.in/en (accessed on 21 November 2023).
  6. Samaddar, A.; Arora, S. Natural Gas Scenario in India: An Overview. 2012. Available online: http://papers.ssrn.com (accessed on 18 September 2023).
  7. Seznec, J.; Pallakonda, R. NATURAL GAS. In India’s Energy Needs and the Arab/Persian Gulf; Atlantic Council: Washington, DC, USA, 2017; pp. 6–8. Available online: http://www.jstor.org/stable/resrep03692.7 (accessed on 29 October 2023).
  8. Kumar, V.V.; Shastri, Y.; Hoadley, A. A consequence analysis study of natural gas consumption in a developing country: Case of India. Energy Policy 2020, 145, 111675. [Google Scholar] [CrossRef]
  9. Safari, A.; Das, N.; Langhelle, O.; Roy, J.; Assadi, M. Ntural Gas: A Transition Fuel for Sustainable Energy System Transformation? Energy Sci. Eng. 2019, 7, 1075–1094. [Google Scholar] [CrossRef]
  10. Mitra, N. Energy Policy Planning in India: Case of Petroleum and Natural Gas. Econ. Political Wkly. 1992, 27, M109–M115. [Google Scholar]
  11. Prasad, N.K. Regulation of Natural Gas in India. Econ. Political Wkly. 2008, 43, 21–24. [Google Scholar]
  12. Kelkar, V. Towards a New Natural Gas Policy. Econ. Political Wkly. 2009, 44, 8–10. [Google Scholar]
  13. Jain, A.; Sen, A. Natural Gas in India: An Analysis of Policy; The Oxford Institute for Energy Studies: Oxford, UK, 2011. [Google Scholar]
  14. Tiewsoh, L.S.; Sivek, M.; Jirásek, J. Traditional energy resources in India (coal, crude oil, natural gas): A review. Energy Sources Part B Econ. Plan. Policy 2017, 12, 110–118. [Google Scholar] [CrossRef]
  15. Vaid, M. India’s Natural Gas Infrastructure: Reassessing Challenges and Opportunities. Strateg. Anal. 2014, 38, 508–527. [Google Scholar] [CrossRef]
  16. Janardhanan, N.K.; Institute of Peace and Conflict Studies. India’s Energy Policy: Energy Needs and Climate Change. In Indian and Chinese Energy Policies: Addressing Energy Needs and Climate Change; Institute of Peace and Conflict Studies: New Delhi, India, 2017; pp. 3–8. Available online: http://www.jstor.org/stable/resrep09398.4 (accessed on 1 November 2023).
  17. Mahalingam, S.; Sharma, D. Political Economy of Independent Regulation in India’s Natural Gas Industry. Econ. Political Wkly. 2017, 52, 44–50. [Google Scholar]
  18. Bhowmick, M.; Dutta, T. Dependency of Indian Economy on Natural Gas and Its Barriers; Working Paper Series, GCP/JU/17/01; Global Change Programme; Jadavpur University: Kolkata, India, 2017. [Google Scholar]
  19. Rawat, A.; Garg, C.P. Assessment of the barriers of natural gas market development and implementation: A case of developing country. Energy Policy 2021, 152, 112195. [Google Scholar] [CrossRef]
  20. Alam, M.S.; Murshed, M.; Palanisamy, M.; Duraisamy, P.; Abduvaxitovna, S.Z. Forecasting oil, coal, and natural gas prices in the pre-and post-COVID scenarios: Contextual evidence from India using time series forecasting tools. Resour. Policy 2023, 81, 103342. [Google Scholar] [CrossRef] [PubMed]
  21. Adebayo, T.; Ozturk, I.; Aga, M.; Uhunamure, S.; Kirikkaleli, D.; Shale, K. Role of natural gas and nuclear energy consumption in fostering environmental sustainability in India. Sci. Rep. 2023, 13, 11030. [Google Scholar] [CrossRef] [PubMed]
  22. PNGRB. Vision 2030: Natural Gas Infrastructure in India, Report by Industry Group for PNGRB. 2013. Available online: www.pngrb.gov.in/Hindi-Website/pdf/vision-NGPV-2030-06092013.pdf (accessed on 8 November 2023).
  23. NEP. 2017. Available online: https://www.niti.gov.in (accessed on 11 November 2023).
  24. Gelper, S.; Fried, R.; Croux, C. Robust Forecasting with Exponential and Holt-Winters Smoothing. SSRN 2007. [Google Scholar] [CrossRef]
  25. Tularam, G.A.; Saeed, T. The use of Exponential Smoothing (ES), Holts and Winter (HW) and ARIMA models in oil price analysis. Int. J. Math. Game Theory Algebra 2016, 25, 13–22. [Google Scholar]
  26. Tratar, L.F.; Mojškerc, B.; Toman, A. Demand forecasting with four-parameter exponential smoothing. Int. J. Prod. Econ. 2016, 181, 162–173. [Google Scholar] [CrossRef]
  27. De Oliveira, E.M.; Oliveira, F.L.C. Forecasting mid-long term electric energy consumption through bagging ARIMA and exponential smoothing methods. Energy 2018, 144, 776–788. [Google Scholar] [CrossRef]
  28. Cochrane, D.; Orcutt, G.H. Application of Least Squares Regression to Relationships Containing Auto-Correlated Error Terms. J. Am. Stat. Assoc. 1949, 44, 32–61. [Google Scholar] [CrossRef]
  29. Suganthi, L.; Jadadeesan, T.R. A modified model for prediction of India’s future energy requirement. Energy Environ. 1992, 3, 371–386. [Google Scholar] [CrossRef]
  30. Sengupta, J.K. Information Theory in Econometrics. In Econometrics of Information and Efficiency; Springer: Dordrecht, The Netherlands, 1993; pp. 71–105. [Google Scholar]
  31. Parikh, J.; Purohit, P.; Maitra, P. Demand Projections of petroleum products and natural gas in India. Energy 2007, 32, 1825–1837. [Google Scholar] [CrossRef]
  32. Intarapravich, D.; Johnson, C.J.; Li, B.; Long, S.; Pezeshki, S. Asia-Pacific energy supply and demand to 2010. Energy 1996, 21, 1017–1039. [Google Scholar] [CrossRef]
  33. Hunt, L.C.; Ninomiya, Y. Primary energy demand in Japan: An empirical analysis of long-term trends and future CO2 emissions. Energy Policy 2005, 33, 1409–1424. [Google Scholar] [CrossRef]
  34. BP Statistical Review. BP Statistical Review of World Energy. 2023. Available online: https://www.bp.com/en/global/corporate/energy-economics/statistical-review-of-world-energy.html (accessed on 22 November 2023).
  35. IEA (International Energy Agency). World Energy Outlook 2022. Available online: https://www.iea.org/reports/world-energy-outlook-2022 (accessed on 16 November 2023).
  36. World Bank. World Development Indicators. Available online: http://data.worldbank.org (accessed on 8 November 2023).
  37. National Accounts Statistics, MoSPI. Available online: https://mospi.gov.in (accessed on 3 November 2023).
  38. Handbook of Statistics on the Indian Economy. Wholesale Price Index, Annual Average; Reserve Bank of India. 2022. Available online: https://dbie.rbi.org.in (accessed on 31 October 2023).
  39. MOHFW. Annual Report, Ministry of Health and Family Welfare. 2011. Available online: http://main.mohfw.gov.in (accessed on 6 November 2023).
  40. BP Energy Outlook. BP Energy Outlook Summary Tables—2020–2050. 2023. Available online: http://bp.com/energyoutlook (accessed on 20 November 2023).
  41. Corbeau, A.; Hasan, S.; Dsouza, S. The Challenges Facing India on Its Road to a Gas-Based Economy; King Abdullah Petroleum Studies and Research Centre: Riyadh, Saudi Arabia, 2018; Available online: https://www.kapsarc.org/uploads/2018/10.pdf (accessed on 14 August 2023).
  42. Indian Petroleum and Natural Gas Statistics (Various Volumes). Economics and Statistics Division, Ministry of Petroleum and Natural Gas, Government of India. Available online: http://mopng.gov.in (accessed on 5 November 2023).
  43. NITI Aayog. Annual Report, 2022-23; Government of India: New Delhi, India, 2023. Available online: https://www.niti.gov.in/sites/default/files/2023-02/Annual-Report-2022-2023-English_1.pdf (accessed on 15 November 2023).
  44. GoI. Snapshot of India’s Oil & Gas data: Monthly Ready Reckoner April 2023; Petroleum Planning & Analysis Cell, Ministry of Petroleum & Natural Gas, Government of India: New Delhi, India, 2023. [Google Scholar]
  45. MoPNG. Indian Petroleum and Natural Gas Statistics 2017–2018. 2018. Available online: http://petroleum.nic.in/sites/default/files/ipngstat_0.pdf (accessed on 21 November 2023).
  46. MoPNG. Annual Report of Ministry of Petroleum and Natural Gas; GOI: New Delhi, India, 2023. Available online: https://mopng.gov.in/files/TableManagements/annualreport2223.pdf (accessed on 24 November 2023).
  47. ET. India to Achieve 50% Clean Energy Share, 500 GW RE Capacity Targets before 2030 Deadline: RK Singh. The Economic Times, 9 November 2021. Available online: https://economictimes.indiatimes.com/industry/renewables/india-to-achieve-50-clean-energy-share-500-gw-re-capacity-targets-before-2030-deadline-singh/articleshow/87604552.cms (accessed on 12 August 2023).
  48. International Gas Union. 2022 World LNG Report. Available online: https://www.igu.org/wp-content/uploads/2022/07/IGU-World-LNG-Report-2022_final.pdf (accessed on 16 August 2023).
Figure 1. India’s GDP and Energy Consumption—1990–2022. Source: Same as Table 1. Note: Values are with 1990 levels at 100; TPEC refers to Total Primary Energy Consumption, PCENCON refers to Per Capita Energy Consumption.
Gases 04 00001 g001
Figure 2. Actual and Forecasted Total Primary Energy Consumption in India. Source: Authors’ calculations.
Gases 04 00001 g002
Figure 3. Natural Gas Production, Consumption, and Import in India. Source: Indian Petroleum & Natural Gas Statistics (various volumes) [42].
Gases 04 00001 g003
Figure 4. Actual and Forecasted Natural Gas Consumption in India. Source: Authors’ calculations.
Gases 04 00001 g004
Figure 5. Forecasted Natural Gas Imports in India—2050. Source: Authors’ calculations. Note: Scenario-I: Univariate Forecasts of Consumption and Production; Scenario-II: Consumption & Production at High-Growth Scenario; Scenario-III: Consumption at 10% of projected TPEC and Production at Optimistic scenario.
Gases 04 00001 g005
Table 1. India’s GDP and Energy Consumption—1990–2022.
YearGross Domestic Product (GDP)
(at Constant 2015 USD Billion)
Primary Energy Consumption
(EJ)
Per Capita Energy Consumption
(GJ per Capita)
1990465.28.39.5
2000800.513.412.7
20101535.922.618.1
20202508.632.222.7
20222954.936.425.7
Source: BP Statistical Review [34]; World Development Indicators, World Bank Database [35].
Table 2. Energy Consumption Mix in India—1990–2022.
YearTotal Energy Consumption (EJ) fromShares (%) in TPEC of
CoalOilNuclearOther Non-RenewablesRenewables (Incl. Hydro)Fossil FuelsRenewables
(Incl. Hydro)
Others
19904.592.500.070.430.7186.38.65.2
20006.884.610.160.890.8686.96.46.6
201012.146.600.222.151.4983.96.69.5
202017.409.080.402.193.1383.59.76.8
202219.309.250.403.663.7979.510.410.1
Source: BP Statistical Review [34].
Table 3. Forecasted Energy Consumption in India—2030–2050.
Forecasted TPEC (EJ)
Univariate Forecast
(Holt Method)
Multivariate Forecast (Cochrane–Orcutt)
BAUSHigh-Growth Scenario
203054.250.255.4
204075.371.986.7
205099.4102.7135.3
Source: Authors’ calculations.
Table 4. Forecasted Energy Mix in India—2030–2050.
Year% of TPEC Coming from
CoalOilNatural GasNuclearRenewables
(Incl. Hydro)
2020
(actual)
52.428.06.46.64.6
203043.123.513.14.515.7
204040.320.912.73.722.4
205033.017.012.12.835.1
Source: Authors’ calculations.
Table 5. Natural Gas Production, Consumption, and Import in India—1990–2022.
YearProduction (BCM)Consumption (BCM)Imports (BCM)
199011.611.6-
200025.424.11.3
201047.459.011.6
202023.860.536.7
202229.858.228.4
Source: Indian Petroleum & Natural Gas Statistics (various volumes) [42].
Table 6. Consumption of Natural Gas in India by Sectors—1990–2020.
Using SectorTotal Consumption (BCM)Share in Total Consumption (%)
19902000201020201990200020102020
TOTAL12.827.850.234.4100.0100.0100.0100.0
Use as Energy6.417.234.512.950.061.968.737.5
Power3.68.827.410.828.131.754.631.4
Industry a0.932.50.77.010.85.02.0
Captive1.854.50.914.118.09.02.6
Residential0.10.300.40.81.10.01.2
Non-energy Use6.410.715.721.550.038.531.362.5
Fertilizer5.68.513.417.843.830.626.751.7
Petrochemicals0.40.81.23.13.12.92.49.0
Other0.41.41.10.63.15.02.21.7
Source: Indian Petroleum & Natural Gas Statistics (various volumes) [42]. Note: a—includes use in Tea Plantations/Factories.
Table 7. Forecasts of Natural Gas Consumption in India—2030–2050.
YearForecasted Natural Gas Consumption (BCM)
Univariate Forecast
(Holt Method)
Multivariate Cochrane–Orcutt Forecasts
BAUSHigh-Growth Scenario
2020 (actual)60.560.560.5
203087.266.367.1
2040106.987.6116.0
2050128.9132.8202.5
Source: Authors’ calculations.
Table 8. Forecasts of Natural Gas Production in India—2030–2050.
YearUnivariate Forecast
(Holt Method)
NEP/NITI Aayog ForecastsBP New Momentum Forecast
BAUSOptimistic
2020 (actual)23.823.823.823.8
203045.288.0101.0-
204048.995.0124.0-
205056.4--132.0
Source: Authors’ calculations, NITI [43].
Disclaimer/Publisher’s Note: The statements, opinions and data contained in all publications are solely those of the individual author(s) and contributor(s) and not of MDPI and/or the editor(s). MDPI and/or the editor(s) disclaim responsibility for any injury to people or property resulting from any ideas, methods, instructions or products referred to in the content.

