Article

An Independent Assessment of a Commercial Clinical Interpretation Software Indicates That Software Can Mitigate Variation in Human Assessment

1
GenQA, Edinbugh EH16 4UX, UK
2
QIAGEN, Redwood City, CA 94063, USA
*
Author to whom correspondence should be addressed.
Present address: Sema4, Stamford, CT 06902, USA.
J. Mol. Pathol. 2022, 3(3), 125-139; https://doi.org/10.3390/jmp3030012
Submission received: 6 May 2022 / Revised: 21 June 2022 / Accepted: 27 June 2022 / Published: 5 July 2022

Abstract

:
Comprehensive next-generation sequencing (NGS) panels for cancer diagnostics create a bottleneck for interpretation. QIAGEN Clinical Insights Interpret One (QCI) is a clinical decision support software that supports molecular pathologists in the classification of oncology-related variants. This study compares variant assessments by QCI to assessments utilizing current laboratory methods. Eight laboratories were recruited by the external quality assessment organization GenQA. The laboratories submitted VCFs from sequencing studies performed on both hematological disorders and solid tumors for analysis by QCI and an independent laboratory. Results were compared and conflicts were resolved using a panel of experts. In total, 14/149 variants (9%) reported as Tier 1 or Tier 2 by either QCI or the submitting laboratory were found to be discordant after expert panel review. In contrast, 41/149 variants (28%) reflected discrepancy among human reviewers. The expert panel was unable to reach resolution on eight variants. QCI demonstrates high concordance in the classification of actionable mutations with independent laboratory methods and expert assessment. The rate of disagreement among laboratories and the expert panel was greater than the disagreement between QCI and expert assessment. Disagreement among experts highlights the subjectivity of classifying variants. The study demonstrates that QCI interpretation supports streamlining and standardization of NGS variant interpretation.

1. Introduction

Over the last twenty years, molecular analysis of cancers has offered clinicians a growing toolbox for understanding and treating cancer. Next-generation sequencing of tumors identifies alterations that can predict sensitivity and resistance to targeted therapies as well as ascribe prognostic and diagnostic significance. As sequencing power and research into cancer-causing mutations have grown, the number of genes on panels has increased. In 2009, Sequenom’s MassARRAY technology supported the analysis of 238 mutations across 19 genes [1]. In 2022, typical panels can detect hundreds of thousands of mutations across several hundred cancer-related genes. In some cases, laboratories will perform exome analysis with the power to detect mutations across all ~22,000 genes in the human genome. As a result, the burden of variant interpretation has also expanded exponentially.
Numerous clinical decision support systems and knowledgebases have been developed to assist variant scientists and laboratory directors with the task of variant classification. These private and commercially available systems, including JAX Clinical Knowledgebase [2], OncoKB [3], CIViC [4], Navify [5] and PierianDx [6], utilize varying degrees of software automation and manually curated literature to provide variant assessment and therapy matching for clinicians. The body of literature that must be accessed to deliver accurate variant interpretation is vast and there is debate in the field as to the most accurate and efficient approach (reviewed in [7]). Artificial intelligence or natural language processing can index enormous volumes of literature but lacks precision in correctly representing complex genomic interactions in association with clinical outcomes; in this context, human curation remains the gold standard [8,9,10]. A community crowdsourcing approach allows contribution from many different experts and can help to build a larger pool of knowledge in the context of limited resources [3,4,11]. However, significant standardization efforts are required to ensure a consistent level of accuracy and reliability. In contrast to machine curation, human professional expert curation is resource intensive but can provide consistent and accurate interpretation [7].
QIAGEN Clinical Insight Interpret One (QCI) is a clinical decision support software that enables pathologists to identify biologically and clinically relevant oncology-related variants. The application draws on a large knowledgebase of curated information, coupled with an expert interpretation service. The QIAGEN knowledgebase is populated through a combined approach utilizing human and machine curation. Over 200 PhD- and MD-level scientists manually curate data from the literature as well as public and proprietary databases that have been harmonized with semantic consistency. Manual curation is augmented and efficiencies gained through the prioritization of literature sources using different methods such as natural language processing (NLP) and text mining processes. The prioritized source is then presented to the curators who review papers, trials, drug labels and guidelines, extract information and store it in computable units according to well-defined protocols. QCI utilizes the structured content to match appropriate variant- and disease-specific content and executes rules to classify variant pathogenicity and actionability based on the ACMG [12] and AMP [13] guidelines. The computed classification and supporting data are available for review in a user interface; the user has the ability to review all the data and approve or revise the classification.
QCI Interpret One also incorporates an additional level of human expert interpretation. The variants are submitted in the context of the disease to the expert interpretation service, staffed by trained professional expert scientists with clinical content reviewed by oncologists. The expert interpretation utilizes a contrasting analysis approach; the scientists execute a topic-based analysis, searching for and extracting information on each variant and formulating an assessment based on the synthesis of the evidence. The expert interpretation supplies report-ready text with references that can be reviewed and incorporated into clinical reports. The expert classification and interpretation are presented in a user interface alongside the computed classification and the user has another opportunity to review the summarized data and approve or revise the classification for reporting.
Multiple studies have been published comparing variant classification across institutions and performance of different variant interpretation and clinical decision support software [14,15,16]. However, all of these studies lack a “gold standard” set of variant interpretations that could stand as a benchmark for evaluation. In order to assess the utility and accuracy of QCI, QIAGEN engaged GenQA, an external quality assessment organization, to design and execute a study that would compare the use of QCI to internal laboratory methods. The study involved the recruitment of eight independent laboratories to utilize QCI for variant interpretation, compared the results to the originally reported classifications and employed an expert panel to resolve conflicts. The results suggest that QCI Interpret One is a reliable clinical decision support tool that can help laboratories streamline and improve their interpretation practices.

2. Materials and Methods

GenQA, an external quality assessment organization, performed the data collection and analysis. GenQA recruited eight laboratories who regularly perform next-generation sequencing of oncology samples. The laboratories were located in the UK (seven laboratories) and Belgium (one laboratory). Laboratories were asked to submit five representative variant call files (VCF) from either solid tumors or hematological malignancies, or ten samples if participating in both parts of the study. All files were assessed by GenQA, anonymized and uploaded to the QIAGEN Clinical Insight Interpret One (QCI) software application (version 7.1), using a common set of filtering and analysis parameters. Analysis was limited to genes listed within the Illumina TruSight Oncology 500 assay. Variants with >1% MAF in gnomAD were filtered out unless they were established pathogenic common variants, and a cutoff of 5% variant allele frequency (VAF) was applied to remove low frequency variants from the assessment.
Each partner lab was assigned a set of five or ten VCF files to analyze using their current analysis methods. Each partner lab was also assigned an additional set of files to analyze using QCI. Each VCF was therefore subject to up to three analyses by three independent laboratories: one analysis aided by QCI and one or two independent analyses by the laboratories using their current methods. The laboratories were asked to determine which variants they would report and what “tier” would be assigned to each variant. The tiers were defined according to the guidelines described by AMP/ASCO/CAP in Li et al. 2017 [13].
GenQA collected and analyzed the data from the partner laboratories. The variants reported and classified using QCI were compared to the variants reported and classified using independent methods. In the case of results that differed between QCI and one or two of the laboratories, the case was submitted for additional interpretation using QCI One’s expert interpretation service. Variants that remained discrepant were considered by a panel of experts, composed of a nominated variant interpretation expert from each of the participating laboratories.

3. Results

GenQA collected a total of 77 VCFs, 34 from hematological malignancies and 43 from solid tumors (Table 1, Supplementary Tables S1 and S2, Figure 1). The VCFs contained a total of 217,718 variants, 78,213 from the heme cases and 139,505 from the solid tumor cases. All VCFs were assessed by at least one laboratory using QCI and the submitting laboratory. Data were not available for all VCFs from a second assessing laboratory. In total, 252 variants were reported by QCI as Tier 1 or Tier 2; the total number of Tier 1 and Tier 2 variants reported by QCI or a submitting laboratory was 264. After the initial assessment, 49 variants from the heme files and 136 variants from the solid tumor files were found to be discrepant between the QCI classification and either the submitting laboratory or the second assessing laboratory, for a total of 185 variants. Upon assessment, 115 of these variants were determined to be discrepant due to technical issues described below, reducing the number of reported classification discrepancies to 70 out of 149 classified variants, excluding technical discrepancies from the analysis. These discrepancies represent differences between QCI and the submitting laboratory as well as discrepancies between the submitting laboratory and the second assessing laboratory. After the analysis and conflict resolution were complete, the remaining number of variants that were discrepant between QCI and the laboratories or consensus expert panel was 5 from the heme cases and 9 from the solid tumor cases, for a total of 14, resulting in a total of 91% agreement between the classification by QCI and that of the laboratories or expert panel. These data are summarized in Table 1 and Figure 1.

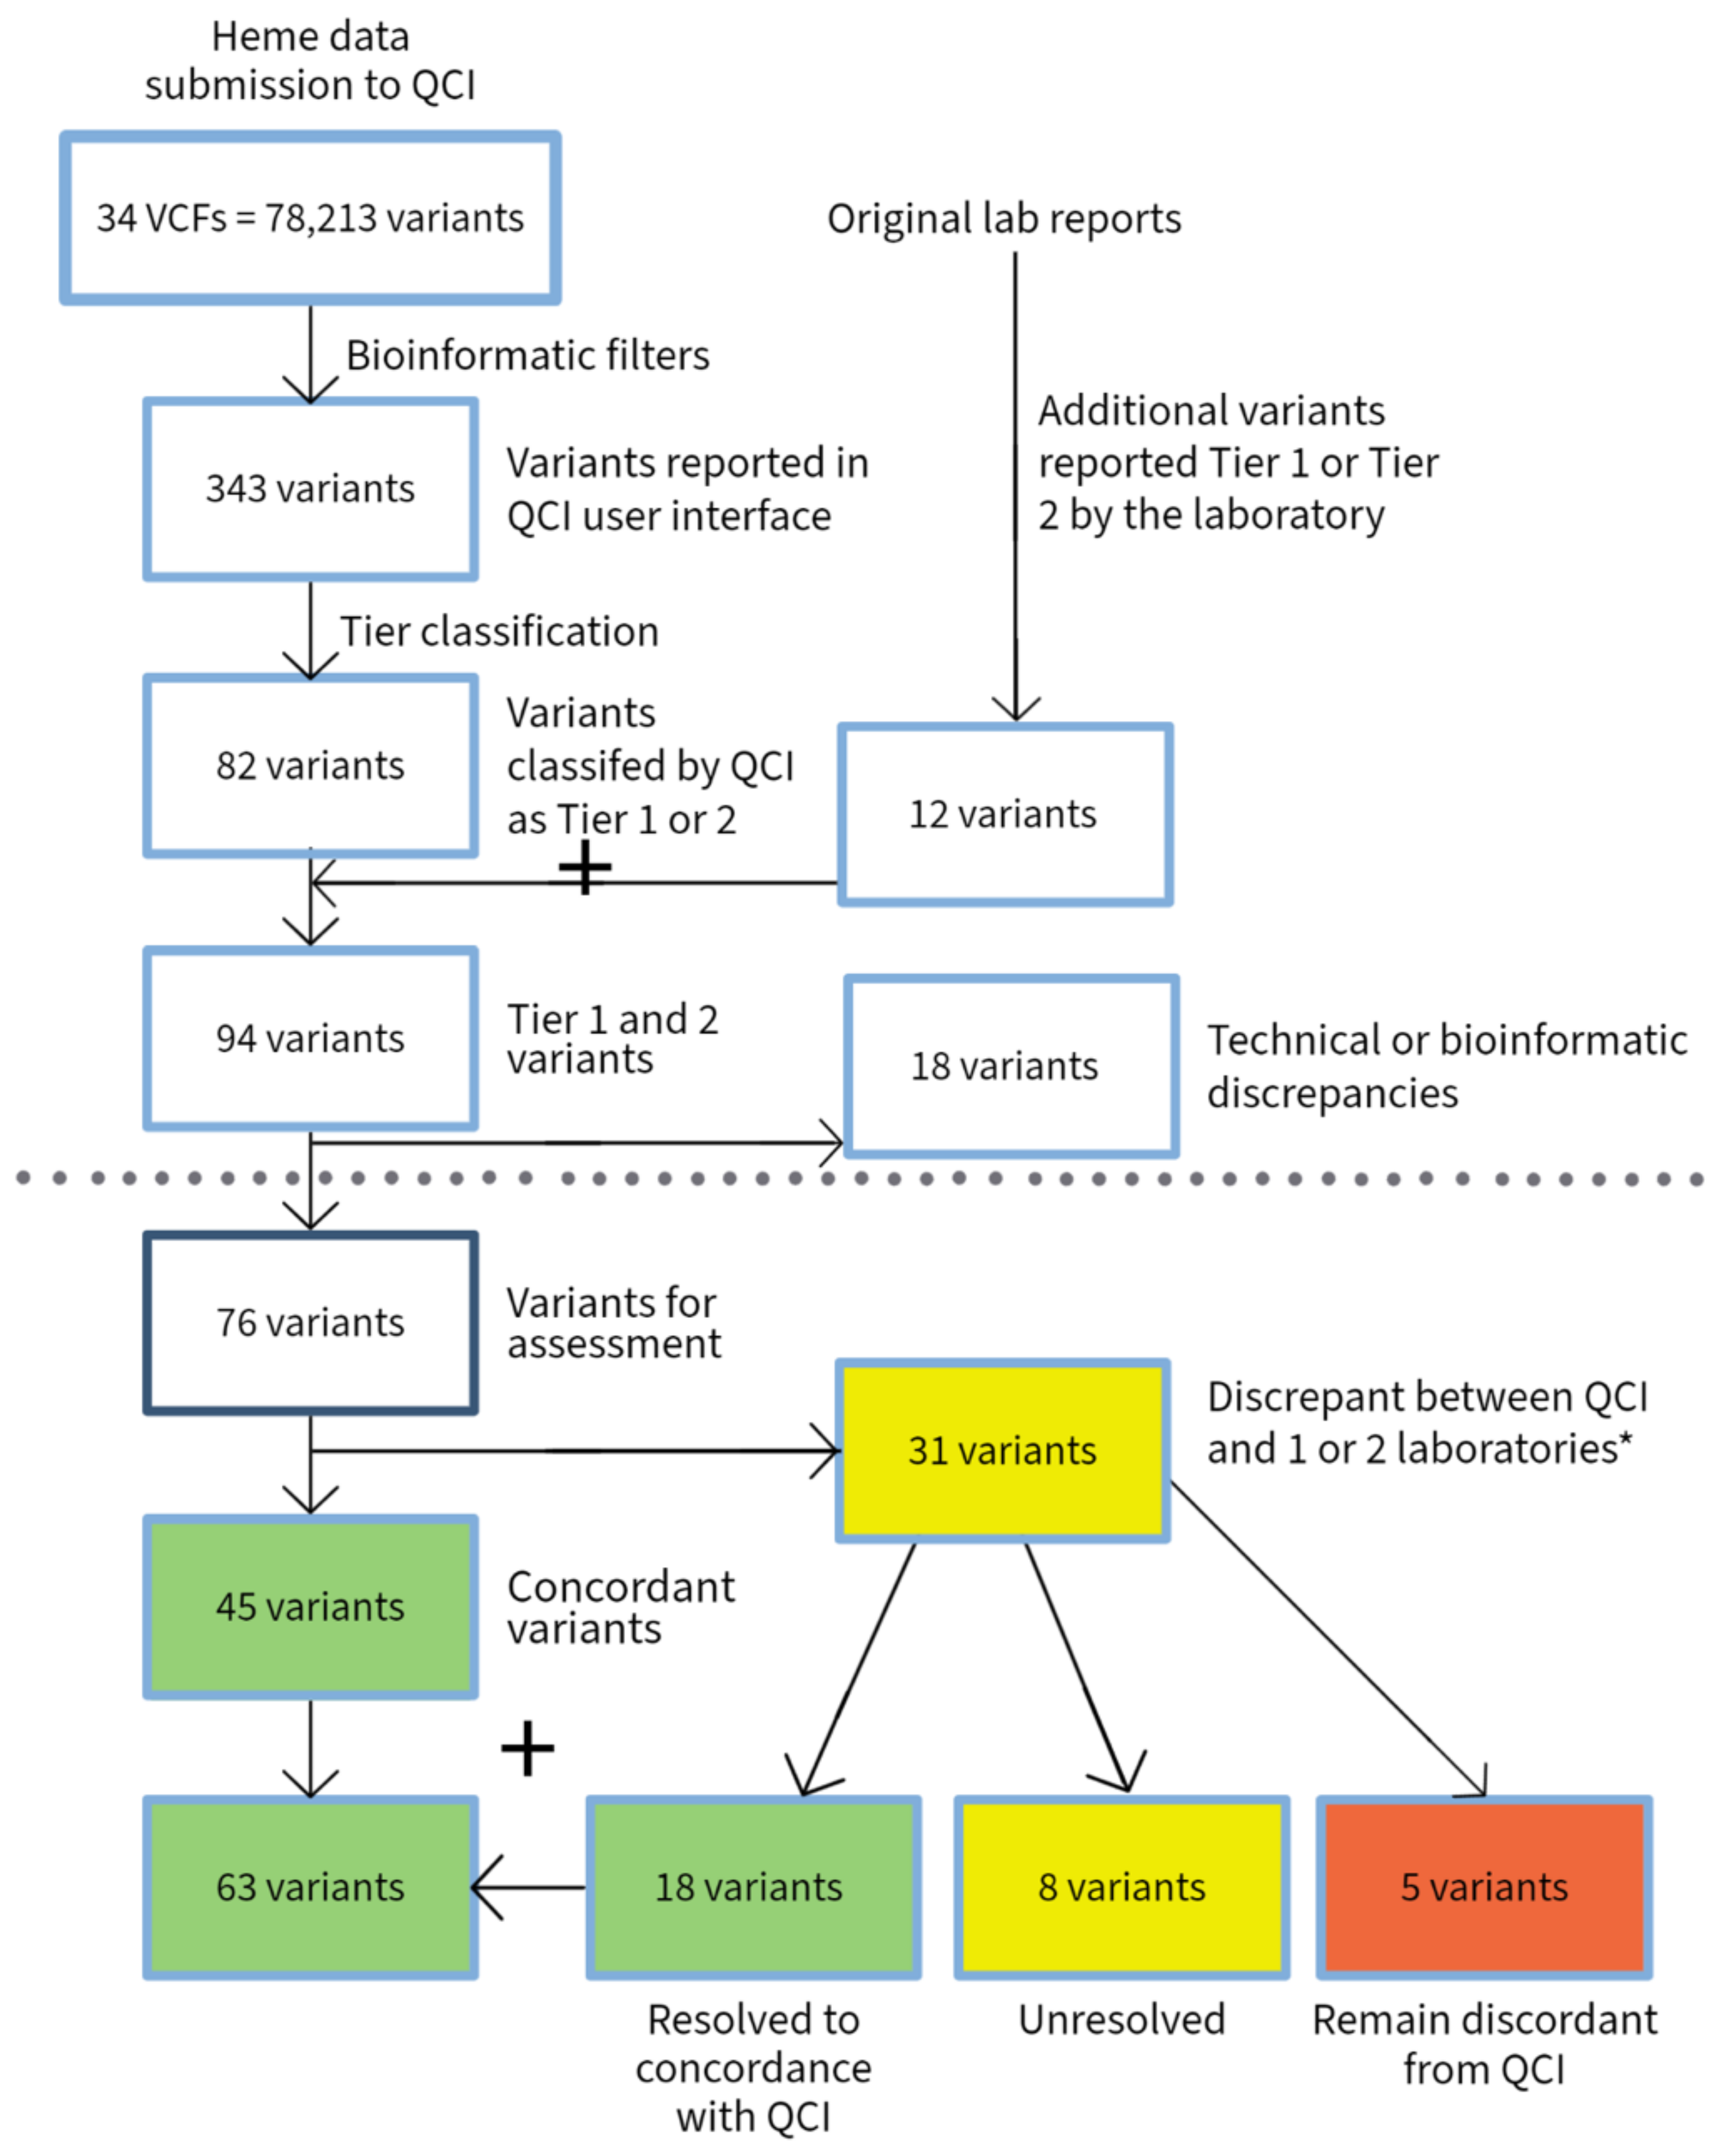
3.1. Hematological Malignancies
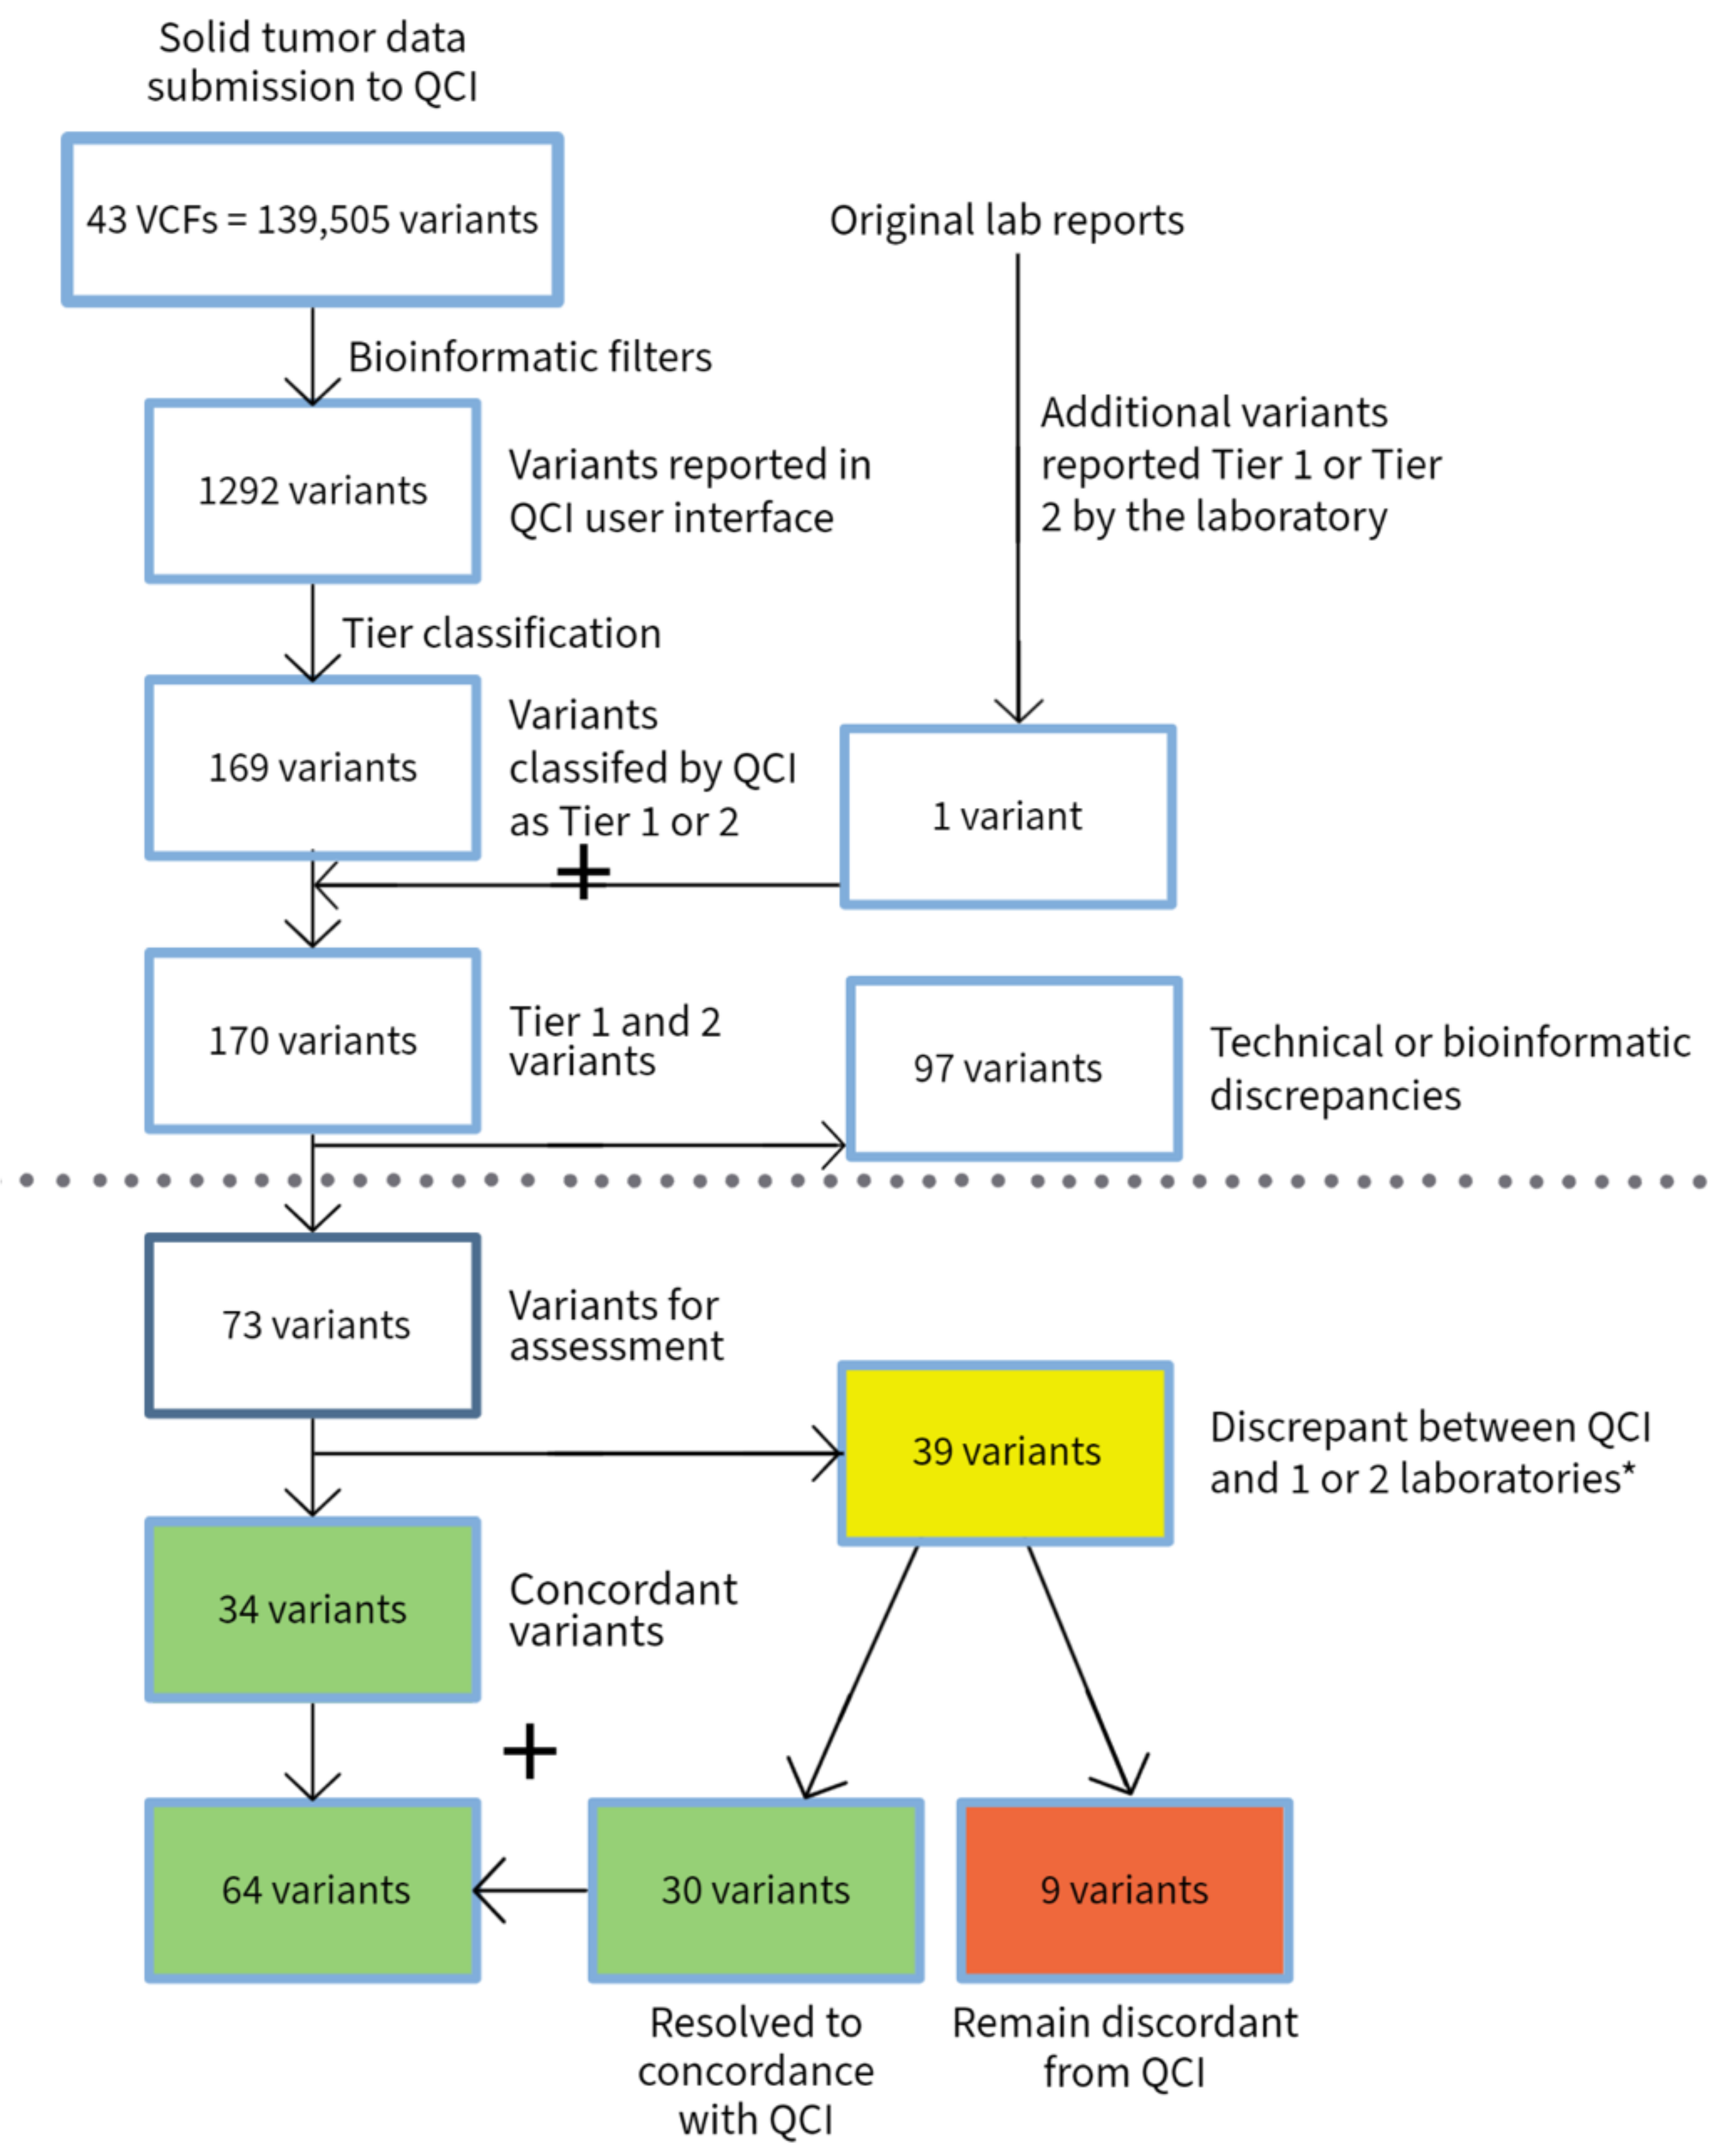
In total, 34 VCFs containing a total of 78,213 variants from hematological malignancies were submitted for analysis, with a total of 94 variants reported as Tier 1 or Tier 2 by either QCI or the submitting laboratory. In the initial assessment, 49 variants differed in classification between the QCI classification and the classification by either the submitting laboratory or the second assessing laboratory (Table 2, Figure 2). Overall, 18 of these variants were determined to be discrepant due to technical or bioinformatic issues. Six of the variants that were reported by the laboratories were not detected in the submitted data. Upon investigation, it was determined that these variants were not present in the VCF files submitted to QCI, they were generated by a separate bioinformatic process and reported in the same laboratory report. Six of the variants reported by the laboratories were filtered out of the results in the QCI application because they were below the variant allele frequency (VAF) cutoff established for this study. An additional six variants were discrepant due to the usage of an incorrect or underspecified disease term. In this case, the disease entry was “myelofibrosis.” For two of the variants, the term entered was “MF”, which was mapped to “mycosis fungoides”, a completely different disease entity. In the context of clinical use, the user would immediately observe that the disease phenotype was different from the intended phenotype. Because the tier classification is disease dependent, the computed tier assigned was different than it would have been for the intended disease, “primary myelofibrosis”. The subsequent submission for expert interpretation likewise provided a tier classification for “myelofibrosis” or “mycosis fungoides” rather than the intended disease “primary myelofibrosis”. As a result, the tier classifications from the expert interpretation did not agree with the submitting laboratory. The AMP classifications are specific for the diagnosis, and in order to provide a direct comparison of the classifications for each variant in the context of the diagnosis in this study, the discrepancies attributed to disease-specificity errors were considered to be technical differences and were not included in the calculation.
The 31 discrepancies that were not attributed to technical issues were submitted to the conflict resolution protocols. GenQA assessed the QCI Interpret One “expert interpretation” classification for each of the variants and convened a panel of experts to review the remaining discrepancies. In three cases, the QCI expert interpretation agreed with the submitting partner laboratory. In these cases, the variants were determined to be resolved and concordant, as the QCI product includes the expert interpretation and allows the user to assess all the information and determine the final classification. In an additional 15 cases, the expert panel agreed with the QCI interpretation. Therefore, in 18 of the 31 apparently discrepant variants, the discrepancy was resolved either by QCI Interpret One expert review or revision of the classification by the expert panel.
For 8 of the remaining 13 variants, there was broad disagreement among QCI, QCI expert interpretation, the submitting laboratory and the second partner laboratory, and the expert panel was unable to reach a resolution. In total, seven of these eight variants were in TET2, and one variant was in PTPN11 (Supplementary Table S1). PTPN11 p.Glu76Lys in MDS was agreed to be a pathogenic variant, but it was computed as Tier 1A by QCI, classified as Tier 2 by QCI expert interpretation, Tier 2D by the submitting laboratory and Tier 1B by the second assessing laboratory. The TET2 variant classifications differed based on the diagnosis. Of the seven variants, all analyses agreed that six out of the seven variants were pathogenic, but one of the variants (p.Cys1709Valfs*10) was determined to be a VUS by both the submitting laboratory and the second assessing laboratory, whereas QCI computed this variant as Tier 1A in CMML and QCI expert interpretation classified the variant as Tier 2. While this variant is located downstream of the cutoff for nonsense-mediated degradation (NMD), truncations in this region have been reported to disrupt Tet2 protein function, with amino acids 1129–1936 shown to be required for catalytic activity [17]. The expert panel did agree that although the tier classification could not be resolved, seven out of the eight variants would be reported in clinical practice and the clinical impact of the difference between Tier 1 and 2 in this context is minimal.
For the other five discrepant variants, the expert panel agreed with the submitting laboratory and disagreed with the QCI classification and the QCI expert interpretation did not resolve the discrepancy. For two variants in EZH2 and one variant in STAG2, QCI and the experts agree that the variants are pathogenic but disagree on the actionability tier. These three variants were submitted to QCI as “acute myeloid leukemia”; however, the submitting laboratory’s diagnoses were “MF transforming to AML” and “AML transformed from MDS/MPN”. QCI expert interpretation classifies pathogenic inactivating EZH2 mutations in primary myelofibrosis as Tier 1A and in MDS/MPN overlap diseases as Tier 1B; STAG2 mutations are classified as Tier 1B in myelodysplastic syndrome. However, QCI classifies EZH2 and STAG2 mutations in AML as Tier 2C (the expert review classifies these mutations as Tier 3 in AML, with no evidence for prognostic or diagnostic significance that meets the criteria for AMP levels A–D, but agreed that these mutations are pathogenic). However, as above, these variants would still be reported by QCI and could be used for clinical management.
The KMT2A alteration (c.432+2T>G) in an AML case was classified as Tier 2C by QCI but as Tier 3 by the expert panel. The expert panel noted that there was no evidence to support prognostic or diagnostic significance for single-nucleotide variants (SNVs) in KMT2A. QCI agrees with that assessment in the context of SNVs (although KMT2A rearrangements in AML would be classified as Tier 1A on the basis of prognostic data), but finds preclinical support for the use of HDAC inhibitors in the context of inactivating KMT2A alterations. The weight given to the preclinical data and the low likelihood that these drugs would be utilized in this clinical context explains the difference between the classifications by QCI and the expert panel.
CBL p.Lys362_Thr364del was classified as Tier 1 in MDS/MPN by QCI but Tier 3 by the expert panel. The experts determined that this alteration was a variant of unknown significance. This indel in CBL is immediately adjacent to a region (codons 366–420) where missense mutations are cited in the NCCN guidelines as “frequent” in JMML and CMML; any missense mutation in this region is considered likely to be related to a myelodysplastic disorder. The mutation in this case is a small deletion rather than a missense mutation, and it lies just outside the cited region. This mutation is located in a linker region, in which insertions and deletions have been reported to impair function of the CBL protein [18,19,20,21,22,23]. In this case, QCI suggested that the mutation may be pathogenic, but the expert panel disagreed.
Discrepancy among human analysts was evident in 24 out of the 31 discrepant variants in the heme cases. As shown in Table 3, 12 variants exhibited disagreement between the submitting and second assessing labs in their initial analysis. Of six variants which exhibited agreement between laboratories in the initial assessment, two were unresolvable. Of 13 variants assessed by only one laboratory, 9 were resolved by the expert panel in favor of QCI and 1 was unresolvable.
In total, after conflict resolution and discussion by the expert panel, five variants were found to be discrepant between the classification from QCI and the submitting laboratory and experts, out of a total of seventy-six variants assessed in the hematological VCFs by QCI and the submitting laboratories, resulting in 93% concordance between QCI and the independent variant scientists.

3.2. Solid Tumors

In total, 43 VCFs from solid tumors were submitted for analysis, with a total of 170 variants reported as Tier 1 by either QCI or the submitting laboratory. In the initial assessment, 136 variants differed in classification or reporting status between the computed QCI classification and the submitting laboratory or second assessing laboratory classification (Table 4, Figure 3). Overall, 97 of these variants were determined to be discrepant due to technical issues; they were reported by the laboratories but were not displayed for analysis in QCI following the standardized filter cascades. Upon investigation, 8 of these variants were determined to be data artifacts and 88 of the variants reported by the laboratories were filtered out of the results in the QCI application because they were below the variant allele frequency (VAF) cutoff established for this study. In the process of clinical use, the filters in QCI could be adjusted to include these variants or the variants could be identified by the user as passengers and removed from the report. These variants do not represent a difference in classification; rather, their presence in the report is dependent on adjustable bioinformatic processes.
One additional variant, EGFR p. Tyr764_Val765insPheGlnGluAla, was reported by the laboratory and present in the submitted VCF, but was removed in the QCI filter cascade. Investigation revealed that this variant was removed due to its chromosomal position in the intron (c.2284-5_2290dupTCCAGGAAGCCT). Filtering of this variant was acknowledged as a technical limitation in this use of QCI but was not considered to be an error in classification. The filters are subject to adjustment and validation by the individual laboratories, and the standard filter that removed this variant has since been adjusted.
The remaining 39 discrepancies that were not attributed to technical issues were submitted to the conflict resolution protocols; in total, 30 of the variants were resolved during this phase. GenQA first assessed the QCI “expert interpretation” classification for each of the variants and subsequently convened a panel of experts to review all remaining discrepancies. In 15 cases, the QCI expert interpretation agreed with the submitting partner or second assessing laboratory. In these cases, the variants were determined to be resolved and concordant. In an additional five cases, the QCI expert interpretation agreed with the QCI computed classification and the expert panel also agreed with the QCI interpretation. In total, 10 of the apparently discrepant variants were in TP53. The submitting laboratory considered TP53 mutations to be Tier 3, but QCI classified them as Tier 2C, based on the presence of clinical trials that have TP53 mutation as a recruitment criterion. The experts agreed that these clinical trials provided support for a Tier 2C classifications of the TP53 variants. Furthermore, it was noted that QCI could have utility in raising awareness of clinical trial availability, particularly for unusual variants or trials that are not located at the specific institution where the patient is being treated. Therefore, for 30 of the 39 variants, the discrepancy was resolved either by QCI expert review or revision of the classification by the expert panel. Of note, some of the original submitters commented that some of their assessments changed over the time period encompassed by this study; when the expert panel met, they had changed their assessment and agreed with the expert panel and QCI.
For the nine remaining variants, the expert panel agreed with the submitting or second assessing laboratory and disagreed with the QCI classification. Seven of these variants were from one colorectal cancer case, which exhibited high microsatellite instability and hypermutation (Supplementary Table S2). Five of these variants (BARD1 p.Ala638Hisfs*76, CTNNB1 p.Thr41Ala, AKT1 p.Glu17Lys, RNF43 p.Gly659Valfs*41 and FBXW7 p.Arg505His) are known hotspot mutations or predicted inactivating alterations and were classified as Tier 2C by QCI based on the association of potential off-label therapies or criteria for clinical trials. The expert panel felt that in the context of the patient with high MSI, these are likely to be passenger mutations despite their classification as pathogenic, and felt that the variants should be classified as Tier 3 as they are unlikely to have a clinical impact in this context. It is important to note that while the QCI system can account for interactions between variants within a case, the tier classification of the variants, while accounting for the cancer type, is otherwise independent of the overall molecular context. However, the user of a clinical decision support tool would have the opportunity to evaluate the case and determine whether the variants were relevant.
Two additional variants from this case are in MSH6, a gene that is associated with mismatch repair deficiency and MSI. MSH6 is a DNA mismatch repair (MMR) gene and loss of MSH6 is associated with high microsatellite instability and sensitivity to immunotherapies. The expert panel stated that these alterations would explain the high MSI, and therefore, the variants should be considered Tier 1. QCI agrees that the variants are pathogenic and likely associated with the observed MSI, but classified the variants as Tier 2 based on the details of the drug label, which specifies “loss” of an MMR gene, typically detected by IHC. While these mutations are both frameshift alterations that clearly lead to loss of function, QCI did not consider these mutations to specifically meet the requirements of the drug label, while the expert panel stated that the nature of the mutations justified the Tier 1A classification.
The other two discrepant variants came from different cases. An APC variant in colorectal cancer was classified by QCI as Tier 2D, based on prognostic evidence; the expert panel found that these data were insufficient to support this finding. Interestingly, the QCI expert review for APC variants in colorectal cancer was independently revised during the course of this study based on a regular knowledgebase review and update, and a later assessment agreed with the expert panel that this variant should be classified as Tier 3. An EP300 variant (p.Gly211Ser) was classified by QCI as Tier 2C, but the expert panel noted that it is present in gnomAD at >1% and should be classified as a Tier 4 benign variant. The QCI classification is pushed to pathogenic based on a publication reporting an association between somatic EP300 p.Gly211Ser mutations and a particular breast cancer subtype [24]. It was classified as Tier 2C by QCI, based on clinical trial criteria.
Discrepancy among human analysts was evident in 17 out of the 39 discrepant variants in the solid tumor cases. As shown in Table 3, six variants exhibited disagreement between the submitting and second assessing labs in their initial analysis. Of the six variants which exhibited agreement between laboratories in the initial assessment, three were resolved by the expert panel in favor of QCI. Of the 27 variants assessed by only one laboratory, 8 were resolved by the expert panel in favor of QCI.
In summary, after conflict resolution and discussion by the expert panel, 9 variants were found to be discrepant between the computed classification from QCI and the submitting laboratory and experts, out of a total of 73 variants assessed in the solid tumor VCFs by QCI and the submitting laboratories, resulting in 88% concordance between QCI and the independent variant scientists.

4. Discussion

Variant interpretation is a nuanced task, and while there are several sets of guidelines in place for assessing and reporting variants in cancer, the diverse biological nature of the variants and evidence makes it extremely challenging to design a set of rules and criteria that will cover every case. While there are many variants that are clearly significant or clearly benign, many more variants fall into intermediate categories. In the assessment of variants that fall into the intermediate categories, experts often disagree. Clinical decision support software, such as QCI, can help to streamline and standardize the interpretation process. In the current study, in the absence of a gold standard set of variant interpretations, an expert panel served as arbiter to resolve conflicts between the software and the variant scientists. The QCI computed classification coupled with expert scientific interpretation results in variant classifications that are highly concordant with experts upon review. There were a total of 14 variants for which the classification differed between the assessment reached using QCI and the assessment of a panel of variant interpretation experts, across 77 VCF files containing over 200,000 variants. In contrast, experts disagreed with each other on the classification of 41 variants (Table 3) and were unable to come to any agreement for 8 of the variants. Even among the fourteen variants that remained discrepant after the expert panel review, the classifications were not straightforward, and in some cases, represent differences in scientific opinion and regional reporting standards between the evaluating experts and the expert curators at QIAGEN. These data suggest that the current state of the field is such that expert variant scientists disagree with each other more frequently than they disagree with clinical decision support software, such as QCI Interpret One, which includes its own expert analysis. Numerous facets of the analysis contribute to the disagreement.

4.1. Disease Specificity

The AMP guidelines [13] that establish the tier classification criteria are highly dependent on the specific diagnosis that is provided. The tier is based on the level of evidence established for the impact of a variant on sensitivity or resistance to therapies, diagnosis or prognosis within that specific cancer type. If the disease is insufficiently defined, or incorrect, the evidence applied will not result in the designation of the correct tier. For example, for three of the five variants from the heme cases that were found to be discrepant, classifications differed due to the specific diagnosis supplied to QCI. The expert panel noted that in each of these cases, the distinction between Tier 1 and Tier 2 was not critical, as the variants would be reported and could be utilized for assessment and management in the clinic.
In many cases, particularly in hematological disorders, specific diagnoses are not available at the time of analysis; indeed, the molecular diagnostics may contribute to the establishment of a diagnosis. In this case, a more general cancer type designation, such as “myeloid neoplasm,” may be necessary. The tiers assigned to the variants vary depending on the specific diagnosis, and in at least some cases would necessarily differ from the tiers assigned to “myeloid neoplasm”. However, in these cases, the interpretive comments provided by QCI may help to establish the diagnosis. If the case were to be resubmitted with the more specific diagnosis, the tiers would be more accurately assigned.
Furthermore, the assignment of tiers for general diagnoses may differ depending on the approach of an individual group. If a molecular marker within a specific diagnosis is identified as a Tier 1 alteration, some groups may also apply the Tier 1 designation to the more general disease term, while others may restrict it to the specific disease term if Tier 1 would not be appropriate for other diseases under that umbrella term. These differences could also lead to discrepancies in classification, both among experts and between experts and QCI. For this study, it was important that the assessment of each variant be performed with the same level of disease specificity, so that any differences could be understood as error or difference in approach, rather than use of a different disease term.
The accuracy of disease mapping could be described as a limitation of QCI; the accuracy of the classifications does depend on the correct entry of a diagnosis. The disease mapping in the application is subject to continuous refinement and improvement. Indeed, partly as a result of this study, QCI has been enhanced to display the mapped disease term to the user during the upload process, reducing the likelihood of an incorrect mapping based on the use of an abbreviation.

4.2. Analysis of Evidence

The lack of agreement among experts for a subset of variants in this study serves to underscore the high degree of variability among practitioners of variant interpretation. The assignment of tiers depends not only on the acquisition of literature evidence but also on the assessment of that evidence and determination of its suitability to support a tier designation. The levels of therapeutic evidence are relatively straightforward to assess, as they depend directly on regulatory approval of a drug targeting that alteration, practice guidelines recommending a therapy, or clinical trials requiring an alteration as part of inclusion criteria. In contrast, for hematological disorders, the tiers are more often based on the prognostic and diagnostic significance of a variant in a cancer type. The Tier 1A designations, dependent on description in practice guidelines, are straightforward, but levels B, C and D are less clear-cut and require the assessment of the strength of clinical evidence. These distinctions are subject to individual human judgment: the fact that there were eight variants in the heme cases that could not be resolved by the expert panel underscores the subjectivity surrounding these assessments.
Another source of potential disagreement is the weight given to molecular context in the assessment of individual variants. Molecular interactions between co-occurring variants are critical in variant analysis; these interactions can have impacts on drug sensitivity and resistance, and co-occurring variants can influence the prognosis and diagnosis particularly in hematologic disorders. The interactions between variants in this context can certainly affect the tier classification of individual variants. However, there is less agreement with respect to the impact of the overall molecular context of a tumor on the tier classification of an individual variant. For example, in one of the cases in this study, a tumor with high microsatellite instability (MSI) contained a large number of somatic mutations, and in some cases, the mutations were well-known hotspot mutations in established oncogenes and tumor suppressors. QCI assessed these variants based on the evidence in the literature supporting their function and relevance in the cancer type and determined them to be Tier 2. However, the submitting laboratory and expert panel asserted that the MSI phenotype negated the clinical relevance of these variants. The final decision as to the reporting of these variants, even when assisted by clinical decision support software, is ultimately in the hands of the laboratory director or pathologist.
Even in cases where the variant classifications remained discrepant after expert review, there was high concordance with respect to the pathogenicity of the variants. The observed discrepancies were most often identified between Tier 1 and Tier 2; the expert panel noted that these discrepancies would be unlikely to have a negative impact on patient management, since the variants would all be present in the report. In the present study, there were no examples of variants that were determined to be Tier 3 VUS by QCI that were Tier 1 or 2 by the submitting or second assessing laboratories, or by the experts. This finding is significant, because it supports the assertion that QCI is unlikely to miss an important variant and supports a fail-safe approach. Additionally, there were only nine variants classified as Tier 1 or 2 by QCI that were ultimately determined to be Tier 3 VUS by the expert panel.
Additionally, the evidence supporting variant classification is dynamic, and thus the classifications may change, as they did even across the time span of this study. For example, APC variants were assessed in two different colorectal cancer cases and were computed by QCI to be Tier 2C. However, they were sent for QCI Interpret One’s expert interpretation at two different times. The first time the APC variant was classified as Tier 2C, based on a publication that reported a prognostic association in colorectal cancer [25]. In the intervening time, independent of the study, the QIAGEN team had reviewed and updated the information supporting APC mutation in colon cancer and downgraded the classification based on this review. Thus, when the second colorectal cancer case containing an APC variant was assessed by QCI, it was classified as Tier 3 pathogenic, in line with the submitting laboratory and the expert assessment. This observation highlights the value and need for up-to-date content in interpretation and clinical decision support software. In a number of additional cases, the submitting laboratory revised their findings over the course of the study and variants that had initially been discordant became concordant with QCI and agreed with the expert panel.

4.3. Guidelines

The level of disagreement between scientists and the nuances of the discussion surrounding the variant tier assessment, particularly for hematological disorders, suggests a need for clearer or more extensive guidelines for interpretation. The American College of Medical Genetics (ACMG) published a set of guidelines for determining the pathogenicity of variants [12] and the Association for Molecular Pathology (AMP), American Society of Clinical Oncology (ASCO) and College of American Pathologists (CAP) jointly published a set of standards for reporting somatic variants in cancer [13]. These guidelines represent a significant advance in the field; however, as seen in this study, many variants fall between the classes described in these papers. Experts disagree on the resolution of these variants.
A recent publication by Horak et al. [26], representing the Clinical Genome Resource (ClinGen), Cancer Genomics Consortium (CGC) and Variant Interpretation for Cancer Consortium (VICC), proposes a set of standards for the classification of somatic variants, following a similar schema to the ACMG guidelines for the interpretation of germline variants. The guidelines offer a set of rules of different strengths, with points awarded for evidence supporting each rule, and a calculation schema to determine an “oncogenicity” score and classification. This set of rules may provide a much-needed structure to the assessment of somatic variants. However, some variation in classification will still be expected, as the evaluation of evidence will be required to determine whether a rule is satisfied. If these guidelines become accepted in the field, a tool such as QCI Interpret One could be adapted to incorporate the rules and provide computed classifications based on the evidence in the QIAGEN knowledgebase.

5. Conclusions

Overall, this study demonstrates that a clinical decision support tool such as QCI Interpret One can help to reliably streamline and standardize somatic variant interpretation and address the high degree of variability among experts in somatic clinical interpretation. QCI Interpret One provides computed classifications combined with expert manual interpretations, with transparency to the underlying data that can be used to expedite laboratory classifications and flexibility for the user to make changes and customize their reports. It provides consistency in interpretation, which exceeds the consistency among variant scientists.

Supplementary Materials

The following supporting information can be downloaded at: https://www.mdpi.com/article/10.3390/jmp3030012/s1, Table S1 (the 1st tab): Detailed variant data from hematologic malignancy cases; Table S2 (the 2nd tab): Detailed variant data from solid tumor cases.

Author Contributions

Conceptualization, J.A.F., Z.C.D., R.J.L.T., J.H. and S.K.E.; Formal analysis, J.A.F. and S.K.E.; Investigation, J.A.F., E.G. and J.H.; Methodology, J.A.F., R.J.L.T., J.H. and S.K.E.; Project administration, Z.C.D.; Supervision, Z.C.D.; Writing—original draft, S.K.E.; Writing—review and editing, J.A.F., Z.C.D., K.B., R.B. and S.K.E. All authors have read and agreed to the published version of the manuscript.

Funding

This research was funded by QIAGEN.

Institutional Review Board Statement

Not applicable.

Informed Consent Statement

Not applicable.

Data Availability Statement

Not applicable.

Acknowledgments

The authors express appreciation to Dominic John for supporting the project.

Conflicts of Interest

J.A.F., Z.C.D., R.J.L.T. and E.G. are employees of GenQA and declare no conflicts of interest. S.K.E., K.B. and R.B. are employees of QIAGEN, the funder of the study; J.H. is a former employee of QIAGEN. S.K.E., K.B., R.B. and J.H. participated in discussions regarding the design of the study but had no contact with the participating laboratories or evaluating experts.

References

  1. Pearce, M.; Cullinan, A.; Hogg, G.; Hosseini, D.; Ehrich, M. Mutation profiling in tumor samples using the Sequenom OncoCartaTM Panel. Nat. Methods 2009, 6, vii–viii. [Google Scholar] [CrossRef]
  2. Patterson, S.E.; Statz, C.M.; Yin, T.; Mockus, S.M. Utility of the JAX Clinical Knowledgebase in capture and assessment of complex genomic cancer data. NPJ Precis. Oncol. 2019, 3, 2. [Google Scholar] [CrossRef] [PubMed] [Green Version]
  3. Chakravarty, D.; Gao, J.; Phillip, S.; Kundra, R.; Zhang, H.; Wang, J.; Rudolph, J.E.; Yaeger, R.; Soumerai, T.; Nissan, M.H.; et al. OncoKB: A Precision Oncology Knowledge Base. JCO Precis. Oncol. 2017, 1, 1–16. [Google Scholar] [CrossRef] [PubMed]
  4. Griffith, M.; Spies, N.C.; Krysiak, K.; McMichael, J.F.; Coffman, A.C.; Danos, A.M.; Ainscough, B.J.; Ramirez, C.A.; Rieke, D.T.; Kujan, L.; et al. CIViC is a community knowledgebase for expert crowdsourcing the clinical interpretation of variants in cancer. Nat. Genet. 2017, 49, 170–174. [Google Scholar] [CrossRef] [Green Version]
  5. Yaung, S.J.; Pek, A. From Information Overload to Actionable Insights: Digital Solutions for Interpreting Cancer Variants from Genomic Testing. J. Mol. Pathol. 2021, 2, 312–318. [Google Scholar] [CrossRef]
  6. PierianDx—Home. Available online: https://www.pieriandx.com (accessed on 28 April 2022).
  7. Bungartz, K.D.; Lalowski, K.; Elkin, S.K. Making the right calls in precision oncology. Nat. Biotechnol. 2018, 36, 692–696. [Google Scholar] [CrossRef]
  8. Dlamini, Z.; Francies, F.Z.; Hull, R.; Marima, R. Artificial Intelligence (AI) and big data in cancer and precision oncology. Comput. Struct. Biotechnol. J. 2020, 18, 2300–2311. [Google Scholar] [CrossRef]
  9. Cabitza, F.; Rasoini, R.; Gensini, G.F. Unintended Consequences of Machine Learning in Medicine. JAMA 2017, 318, 517–518. [Google Scholar] [CrossRef]
  10. Lohr, S. What Ever Happened to IBM’s Watson. New York Times, 16 July 2021. Available online: https://www.nytimes.com/2021/07/16/technology/what-happened-ibm-watson.html(accessed on 3 May 2022).
  11. Dewdney, S.B.; Lachance, J. Electronic Records, Registries, and the Development of “Big Data”: Crowd-Sourcing Quality toward Knowledge. J. Front. Oncol. 2017, 6, 268. [Google Scholar] [CrossRef] [Green Version]
  12. Richards, S.; Aziz, N.; Bale, S.; Bick, D.; Das, S.; Gastier-Foster, J.; Grody, W.W.; Hegde, M.; Lyon, E.; Spector, E.; et al. Standards and Guidelines for the Interpretation of Sequence Variants: A Joint Consensus Recommendation of the American College of Medical Genetics and Genomics and the Association for Molecular Pathology. Genet. Med. 2015, 17, 405–424. [Google Scholar] [CrossRef] [Green Version]
  13. Li, M.M.; Datto, M.; Duncavage, E.J.; Kulkarni, S.; Lindeman, N.I.; Roy, S.; Tsimberidou, A.M.; Vnencak-Jones, C.L.; Wolff, D.J.; Younes, A.; et al. Standards and Guidelines for the Interpretation and Reporting of Sequence Variants in Cancer. J. Mol. Diagn. 2017, 19, 4–23. [Google Scholar] [CrossRef] [PubMed] [Green Version]
  14. Perakis, S.O.; Weber, S.; Zhou, Q.; Graf, R.; Hojas, S.; Riedl, J.M.; Gerger, A.; Dandachi, N.; Balic, M.; Hoefler, G.; et al. Comparison of three commercial decision support platforms for matching of next-generation sequencing results with therapies in patients with cancer. ESMO Open 2020, 5, e000872. [Google Scholar] [CrossRef] [PubMed]
  15. Gao, P.; Zhang, R.; Li, Z.; Ding, J.; Xie, J.; Li, J. Challenges of Providing Concordant Interpretation of Somatic Variants in Non-Small Cell Lung Cancer: A Multicenter Study. J. Cancer 2019, 10, 1814–1824. [Google Scholar] [CrossRef] [PubMed] [Green Version]
  16. Sirohi, D.; Schmidt, R.L.; Aisner, D.L.; Behdad, A.; Betz, B.L.; Brown, N.; Coleman, J.F.; Corless, C.L.; Deftereos, G.; Ewalt, M.D.; et al. Multi-Institutional Evaluation of Interrater Agreement of Variant Classification Based on the 2017 Association for Molecular Pathology, American Society of Clinical Oncology, and College of American Pathologists Standards and Guidelines for the Interpretation and Reporting of Sequence Variants in Cancer. J. Mol. Diagn. 2020, 22, 284–293. [Google Scholar] [CrossRef]
  17. Hu, L.; Li, Z.; Cheng, J.; Rao, Q.; Gong, W.; Liu, M.; Shi, Y.G.; Zhu, J.; Wang, P.; Xu, Y. Crystal structure of TET2-DNA complex; insight into TET-mediated 5mC oxidation. Cell 2013, 155, 1545–1555. [Google Scholar] [CrossRef] [Green Version]
  18. Grand, F.H.; Hidalgo-Curtis, C.E.; Ernst, T.; Zoi, K.; Zoi, C.; McGuire, C.; Kreil, S.; Jones, A.; Score, J.; Metzgeroth, G.; et al. Frequent CBL mutations associated with 11q acquired uniparental disomy in myeloproliferative neoplasms. Blood 2009, 113, 6182–6192. [Google Scholar] [CrossRef] [Green Version]
  19. Martinelli, S.; De Luca, A.; Stellacci, E.; Rossi, C.; Checquolo, S.; Lepri, F.; Caputo, V.; Silvano, M.; Buscherini, F.; Consoli, F.; et al. Heterozygous germline mutations in the CBL tumor suppressor gene cause a Noonan syndrome-like phenotype. Am. J. Hum. Genet. 2010, 87, 250–257. [Google Scholar] [CrossRef] [Green Version]
  20. Javadi, J.; Richmond, T.D.; Huang, K.; Barber, D.L. CBL linker region and RING finger mutations lead to enhanced granulocyte-macrophage colony-stimulating factor (GM-CSF) signaling via elevated levels of JAK2 and LYN. J. Biol. Chem. 2013, 288, 19459–19470. [Google Scholar] [CrossRef] [Green Version]
  21. Fernandes, M.S.; Reddy, M.M.; Croteau, N.J.; Walz, C.; Weisbach, H.; Podar, K.; Band, H.; Carroll, M.; Reiter, A.; Larson, R.A.; et al. Novel oncogenic mutations of CBL in human acute myeloid leukemia that activate growth and survival pathways depend on increased metabolism. J. Biol. Chem. 2010, 285, 32596–32605. [Google Scholar] [CrossRef] [Green Version]
  22. Andoniou, C.E.; Thien, C.B.; Langdon, W.Y. Tumour induction by activated abl involves tyrosine phosphorylation of the product of the cbl oncogene. EMBO J. 1994, 13, 4515–4523. [Google Scholar] [CrossRef]
  23. Thien, C.B.; Walker, F.; Langdon, W.Y. RING finger mutations that abolish c-Cbl-directed polyubiquitination and downregulation of the EGF receptor are insufficient for cell transformation. Mol. Cell 2001, 7, 355–365. [Google Scholar] [CrossRef]
  24. Bemanian, V.; Noone, J.C.; Sauer, T.; Touma, J.; Vetvik, K.; Soderberg-Naucler, C.; Lindstrom, J.C.; Bukholm, I.R.; Kristensen, V.N.; Geisler, J. Somatic EP300-G211S mutations are associated with overall somatic mutational patterns and breast cancer specific survival in triple-negative breast cancer. Breast Cancer Res. Treat. 2018, 172, 339–351. [Google Scholar] [CrossRef] [PubMed]
  25. Chang, S.; Lin, J.; Lin, T.; Liang, W. Loss of heterozygosity: An independent prognostic factor of colorectal cancer. World J. Gastroenterol. 2005, 11, 778–784. [Google Scholar] [CrossRef] [PubMed]
  26. Horak, P.; Griffith, M.; Danos, A.M.; Pitel, B.; Madhavan, S.; Liu, X.; Chow, C.; Williams, H.; Carmody, L.; Barrow-Laing, L.; et al. Standards for the classification of pathogenicity of somatic variants in cancer (oncogenicity): Joint recommendations of Clinical Genome Resource (ClinGen), Cancer Genomics Consortium (CGC), and Variant Interpretation for Cancer Consortium (VICC). Genet. Med. 2022, 24, 986–998. [Google Scholar] [CrossRef] [PubMed]
Figure 1. Flow diagram of summary data. * Discrepancy between laboratories 1 and 2 may indicate agreement with QCI from at least one laboratory.
Jmp 03 00012 g001
Figure 2. Flow diagram of data from hematologic malignancies. * Discrepancy between laboratories 1 and 2 may indicate agreement with QCI from at least one laboratory.
Jmp 03 00012 g002
Figure 3. Flow diagram of data from solid tumors. * Discrepancy between laboratories 1 and 2 may indicate agreement with QCI from at least one laboratory.
Jmp 03 00012 g003
Table 1. Summary data.
HemeSolid TumorTotal
VCFs submitted344377
Total number of submitted variants78,213139,505217,718
Variants reported by QCI34312921635
Variants reported as Tier 1 and 2 by QCI82169251
Total variants reported as Tier 1 and 2 by QCI and submitting laboratories94170264
Variants with discrepancy in reporting due to technical issue (bioinformatics or disease mapping)1897115
Total variants excluding technical discrepancies7673149
Variants with discrepancy in tier classification313970
Variants with discrepancies between labs or between labs and experts241741
Discrepant variants after conflict resolution5914
Table 2. Classification discrepancies in hematologic malignancies.
GroupResolutionResolution Description# Discordant# Resolved
ANot resolvedRemain discordant5
BNot resolved by experts8
CResolvedQCI One expert review resolved conflict 3
DExpert panel agreed with QCI 15
ETechnical issueQCI disease mapping issue6
FFiltered out by QCI preset filters 6
GNot present in submitted data 6
1930
49
Table 3. Discrepancies among expert interpretations.
Heme ResolutionsSolid Tumor Resolutions
Submitting laboratory and second assessing laboratory AGREENo agreement2No agreement0
Expert panel resolves for lab2Expert panel resolves for lab0
Expert panel resolves for QCI0Expert panel resolves for QCI3
QCI expert review resolves2QCI expert review resolves3
Submitting laboratory and second assessing laboratory DISAGREENo agreement5No agreement0
Expert panel resolves for lab1Expert panel resolves for lab0
Expert panel resolves for QCI6Expert panel resolves for QCI4
QCI expert review resolves0QCI expert review resolves2
Only one laboratory assessment availableNo agreement1No agreement0
Expert panel resolves for lab2Expert panel resolves for lab9
Expert panel resolves for QCI9Expert panel resolves for QCI8
QCI expert review resolves1QCI expert review resolves10
Numbers in bold indicate disagreement among variant scientists. Numbers in standard typeface indicate disagreement between variant scientists and QCI.
Table 4. Classification discrepancies in solid tumors.
GroupResolutionResolution Description# Discordant# Resolved
ANot resolvedRemain discordant9
CResolvedQCI One expert review resolved conflict 15
DExpert panel agreed with QCI 5
ETP53—clinical trial inclusion led to Tier 2C from QCI—expert panel agreed 10
FTechnical IssueFiltered out by QCI 1
GLow VAF—filtered out by QCI 88
HNot reported by submitting lab 8
9127
136
Publisher’s Note: MDPI stays neutral with regard to jurisdictional claims in published maps and institutional affiliations.

