Proceeding Paper

Temporal Dynamics of Vegetation Indices for Fires of Various Severities in Southern Siberia †

by
Evgeny Shvetsov
1,2
1
Federal Research Center “Krasnoyarsk Science Center, Siberian Branch, Russian Academy of Sciences”, 50/45, Akademgorodok, 660036 Krasnoyarsk, Russia
2
Department of Natural Sciences and Mathematics, Khakassian State University, 655017 Abakan, Russia
Presented at the 3rd International Electronic Conference on Forests—Exploring New Discoveries and New Directions in Forests, 15–31 October 2022; Available online: https://iecf2022.sciforum.net/.
Environ. Sci. Proc. 2022, 22(1), 16; https://doi.org/10.3390/IECF2022-13048
Published: 15 October 2022

Abstract

:
Wildfire is a critical environmental disturbance affecting forest dynamics, succession, and the carbon cycle in Siberian forests. In recent decades, forests of southern and central Siberia experienced an increase in fire-disturbed area. The main goal of this study was to assess the degree of fire disturbance in the southern regions of central Siberia, as well as the dynamics of post-fire changes for fires of different intensities. Remote sensing data from MODIS and VIIRS sensors were used to estimate burned area, fire radiative power (FRP), and post-fire dynamics using the normalized burn ratio (NBR) and normalized difference index vegetation (NDVI). The mean annual forest burned area between 2001 and 2021 in the region was about 250 thousand ha per year, with the largest burned areas observed in mixed and larch-dominant forests. Fires detected in the dark-needle coniferous (DNC) and larch-dominant forests were found to have higher (by about 25%) fire radiative power compared with fires in pine-dominant and mixed forests. The analysis of FRP together with NBR showed a significant correlation (R2 = 0.46; p < 0.05) between these variables, indicating that fires with higher intensity generally result in a higher degree of fire disturbance. Evaluation of the post-fire dynamics showed that NBR is more sensitive to fire-related disturbances compared with NDVI and requires more than 16 years to return to pre-fire values. At the same time, in case of the NDVI, the difference between disturbed and background areas was less than 1σ after 11 years since fire.

1. Introduction

Wildfire is one of the dominant disturbances influencing vegetation dynamics, biodiversity, and carbon cycling in boreal forests of Russia [1,2]. Burned area across Russia can vary greatly between years depending on weather conditions, with a mean annual forested burned area of 5–7 million ha [1]. In particular, forests of southern and central Siberia experienced an increase in area burned by wildfires in recent decades [3,4].
Assessments of burn severity can be considered as important factors for better understanding of the wildfire effect of forest ecosystems. For instance, fires in pine forests of southern Siberia usually do not lead to significant tree mortality [5], while fires in dark-needle coniferous stands result in complete tree mortality [6]. Thus, the assessment of the regional peculiarities of the degree of forest disturbance caused by fires is still an urgent task. The time period required for vegetation indices to recover after wildfire depends on forest type, wildfire severity, climate, and the initial post-fire density of tree seedlings [7,8]. A better understanding of post-fire dynamics will contribute to predicting the effects of the increasing number of wildfires observed under climate change.
The aim of the study was to estimate the fire disturbance of forests in the southern regions of central Siberia between 2001 and 2021 including the following objectives: (1) to estimate the proportion of fire-disturbed forest stands for several forest types predominant in the region; (2) to analyze the relationship between fire radiative power and forest disturbance degree estimated using the dNBR index; and (3) to evaluate the postfire dynamics of burned areas compared with unburned areas.

2. Materials and Methods
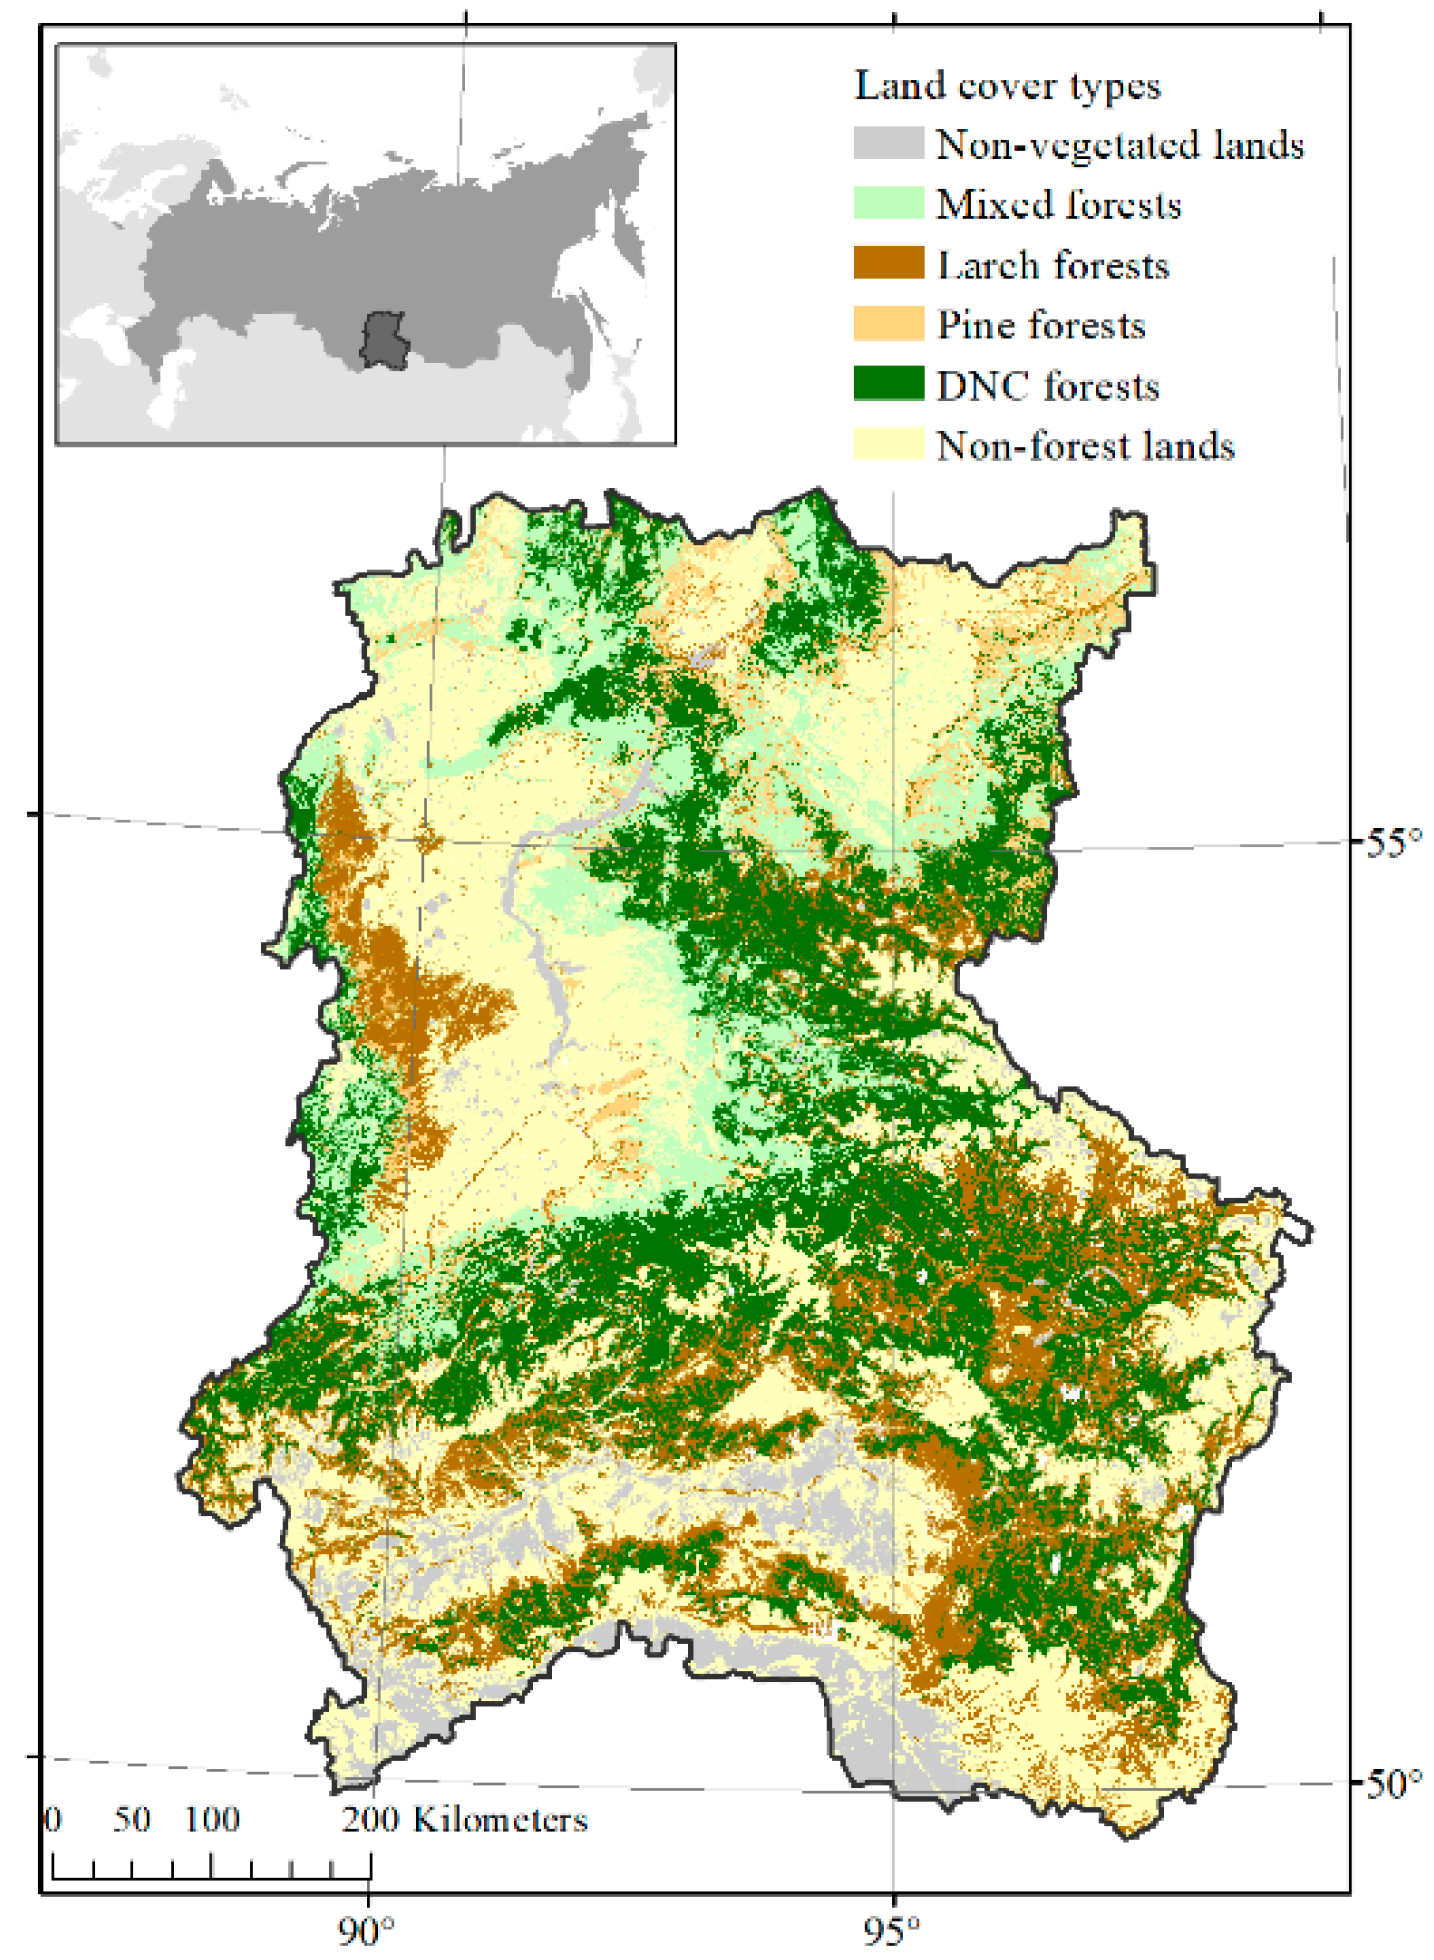
2.1. Study Area

The study area covers southern regions of central Siberia between 50–58° N and 86–99° E. The area of the study region was about 7.5 × 10⁵ km2 (Figure 1). According to the vegetation map developed by Space Research Institute and available at http://pro-vega.ru/maps/ (last accessed 18 November 2022), the dominant tree species include dark-needle coniferous (DNC) forests mainly represented by cedar (Pinus sibirica) and fir (Abies sibirica) (25% of the study area), with a smaller proportion of larch (Larix sibirica) (16%) and pine (Pinus sylvestris) (5%). A significant part of the forest area (12%) is occupied by mixed forests with a predominance of deciduous species (Betula spp., Populus tremula) [9].

2.2. Data

Data products generated from MODIS data for 2001–2021 were used to locate burned areas and evaluate the degree of pyrogenic disturbance. Burned areas were delineated using the MODIS burned area product (MCD64A1) with a spatial resolution of 500 m [10]. Surface reflectance product (MOD09A1) with a spatial resolution of 500 m [11] was used to estimate the degree of vegetation disturbance by fires. To estimate fire radiative power (FRP), the MODIS thermal anomalies and fire product (MOD14A1 with a spatial resolution of 1000 m) was used [12]. Data products were downloaded using the LAADS service (Level-1 and Atmosphere Archive and Distribution System, https://ladsweb.modaps.eosdis.nasa.gov, last accessed 18 November 2022).
Prevailing forest types within the study region were determined using the vegetation map developed by Space Research Institute and available through the VEGA service (http://pro-vega.ru/maps/, last accessed 18 November 2022) [5].

2.3. Methods

Data processing included an assessment of fire radiative power and the degree of pyrogenic disturbance of forests for each fire pixel.
The delta normalized burn ratio (dNBR) calculated from the MODIS surface reflectance product was used to estimate the degree of fire-caused vegetation disturbance [13,14]. This index was calculated as the difference between pre-fire (the year preceding the fire) and post-fire (the year following the fire) normalized burn ratio (NBR) values. According to the previous classification [14], fire-disturbed areas with a dNBR value of 0.44 and higher can be characterized as highly disturbed.
Fire dates and locations were obtained from the MODIS burned area product. For each year between 2001 and 2021, GIS layers of burned area were generated, resulting in 21 burned area raster layers. For this study, only fires on forest lands were considered, while fires on non-forest lands (steppe, agricultural lands) were excluded. Using the thermal anomalies product, FRP values were obtained for each fire pixel. If several FRP values corresponded to one fire pixel, the maximum value was used. The entire FRP range was divided into 50 MW/km2 intervals and, for each interval, the number of fire pixels was calculated, which characterizes the frequency of fire occurrence with a given FRP value, as well as its mean value.
For each season between 2001 and 2021, time series of spectral indices (NBR and NDVI) were created for the period from mid-June to the end of August (161–233 days of the year) excluding low quality data. For these time series, the mean values for each fire season were calculated. Thus, for each fire pixel, there were 21 values of the NDVI and NBR. Spectral indices for fire-disturbed areas were analyzed in comparison with undisturbed (background) sites in similar conditions. Background values were calculated for areas 100 × 100 pixels in size (~50 × 50 km2) around burned areas. For these background areas, mean values and standard deviations were calculated for both spectral indices. A pixel-based analysis of deviations from background values was performed. The deviation of the spectral indices from the background was calculated using Z-scores from the ratio
Z = ( V V b ) 2 σ b
where V and Vb represent the post-fire and background values of spectral indices and σb is the standard deviation of the background value.

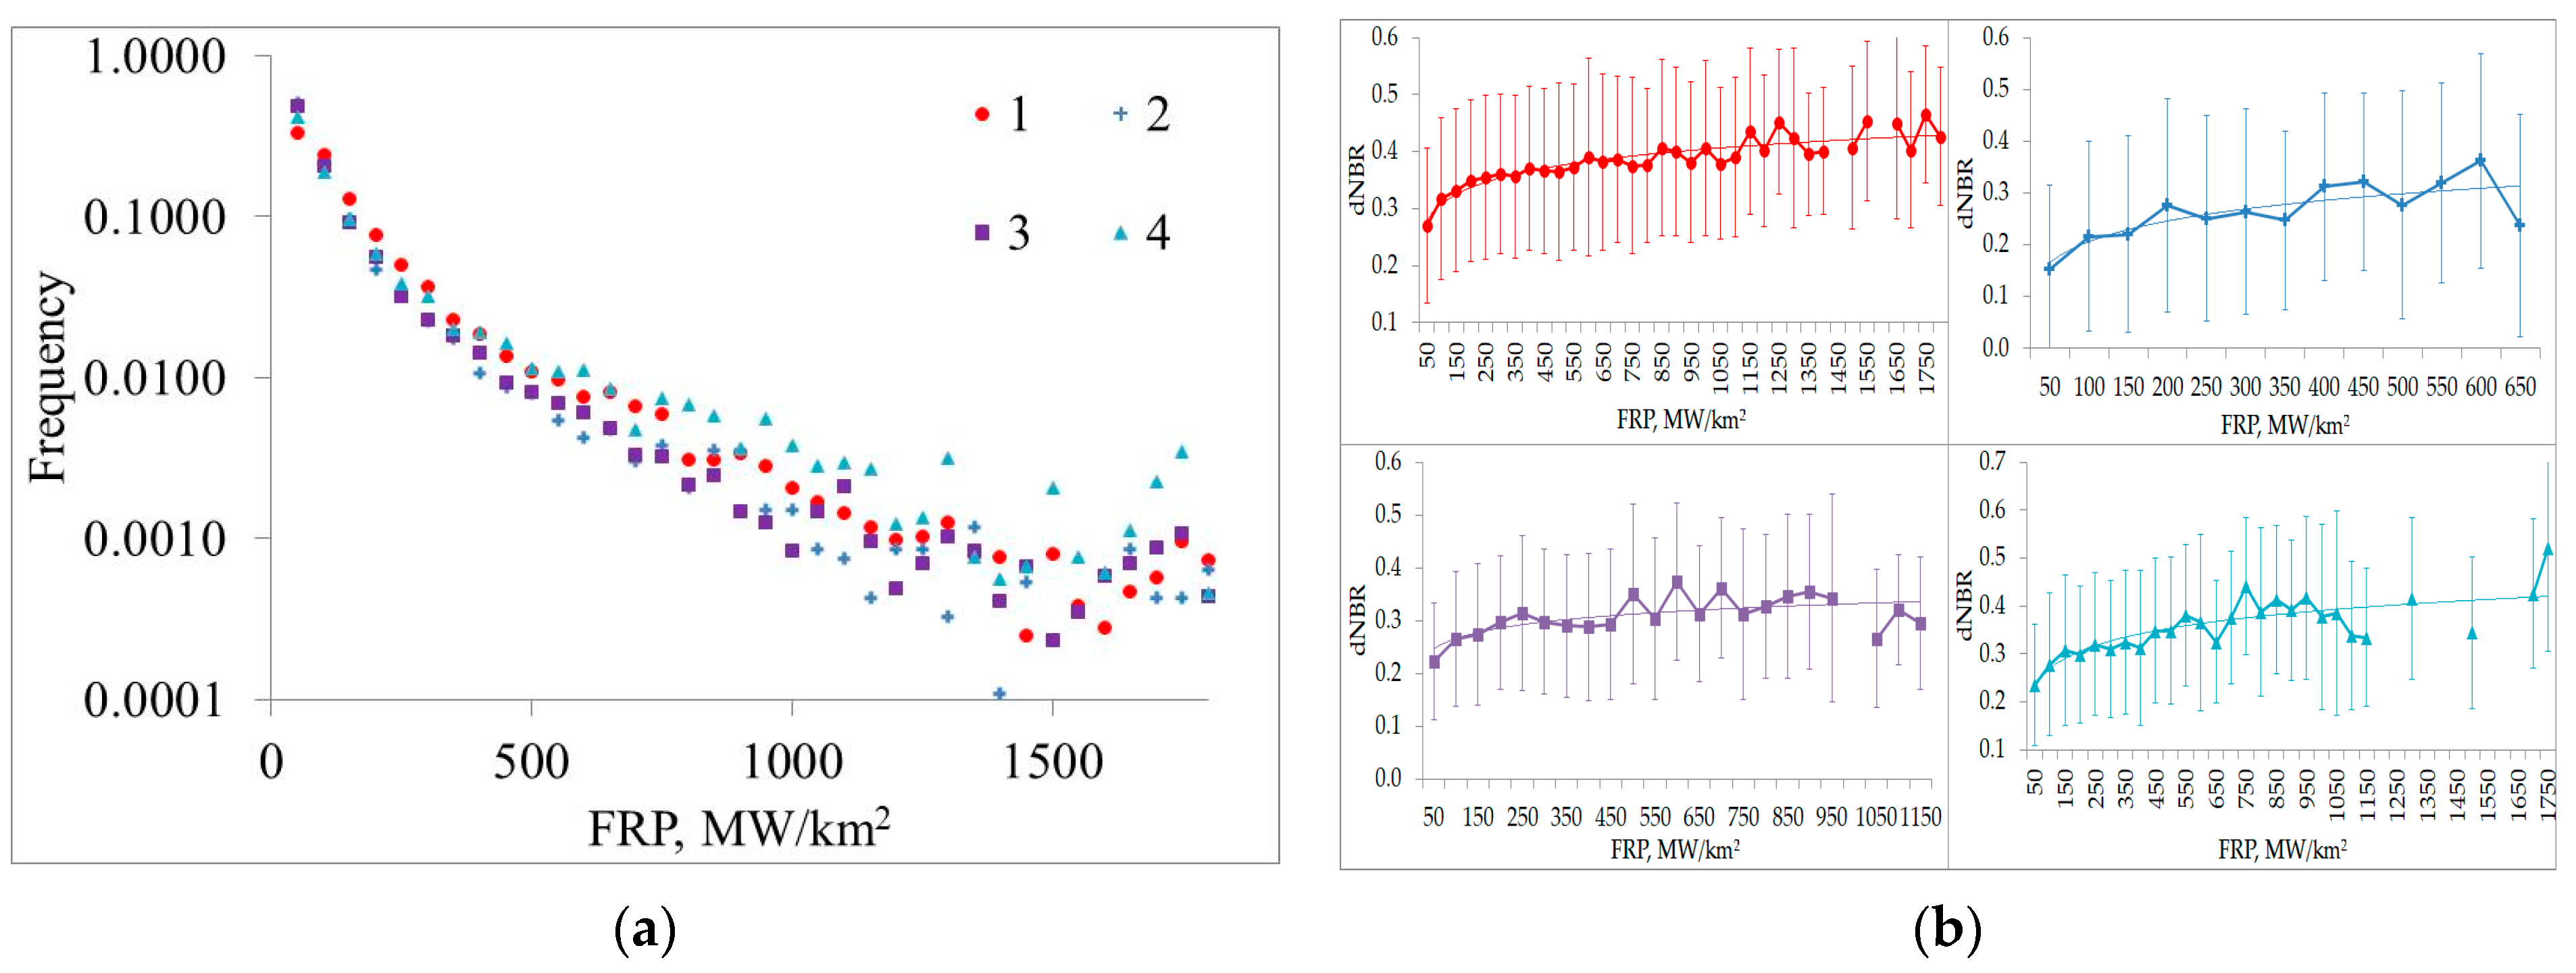
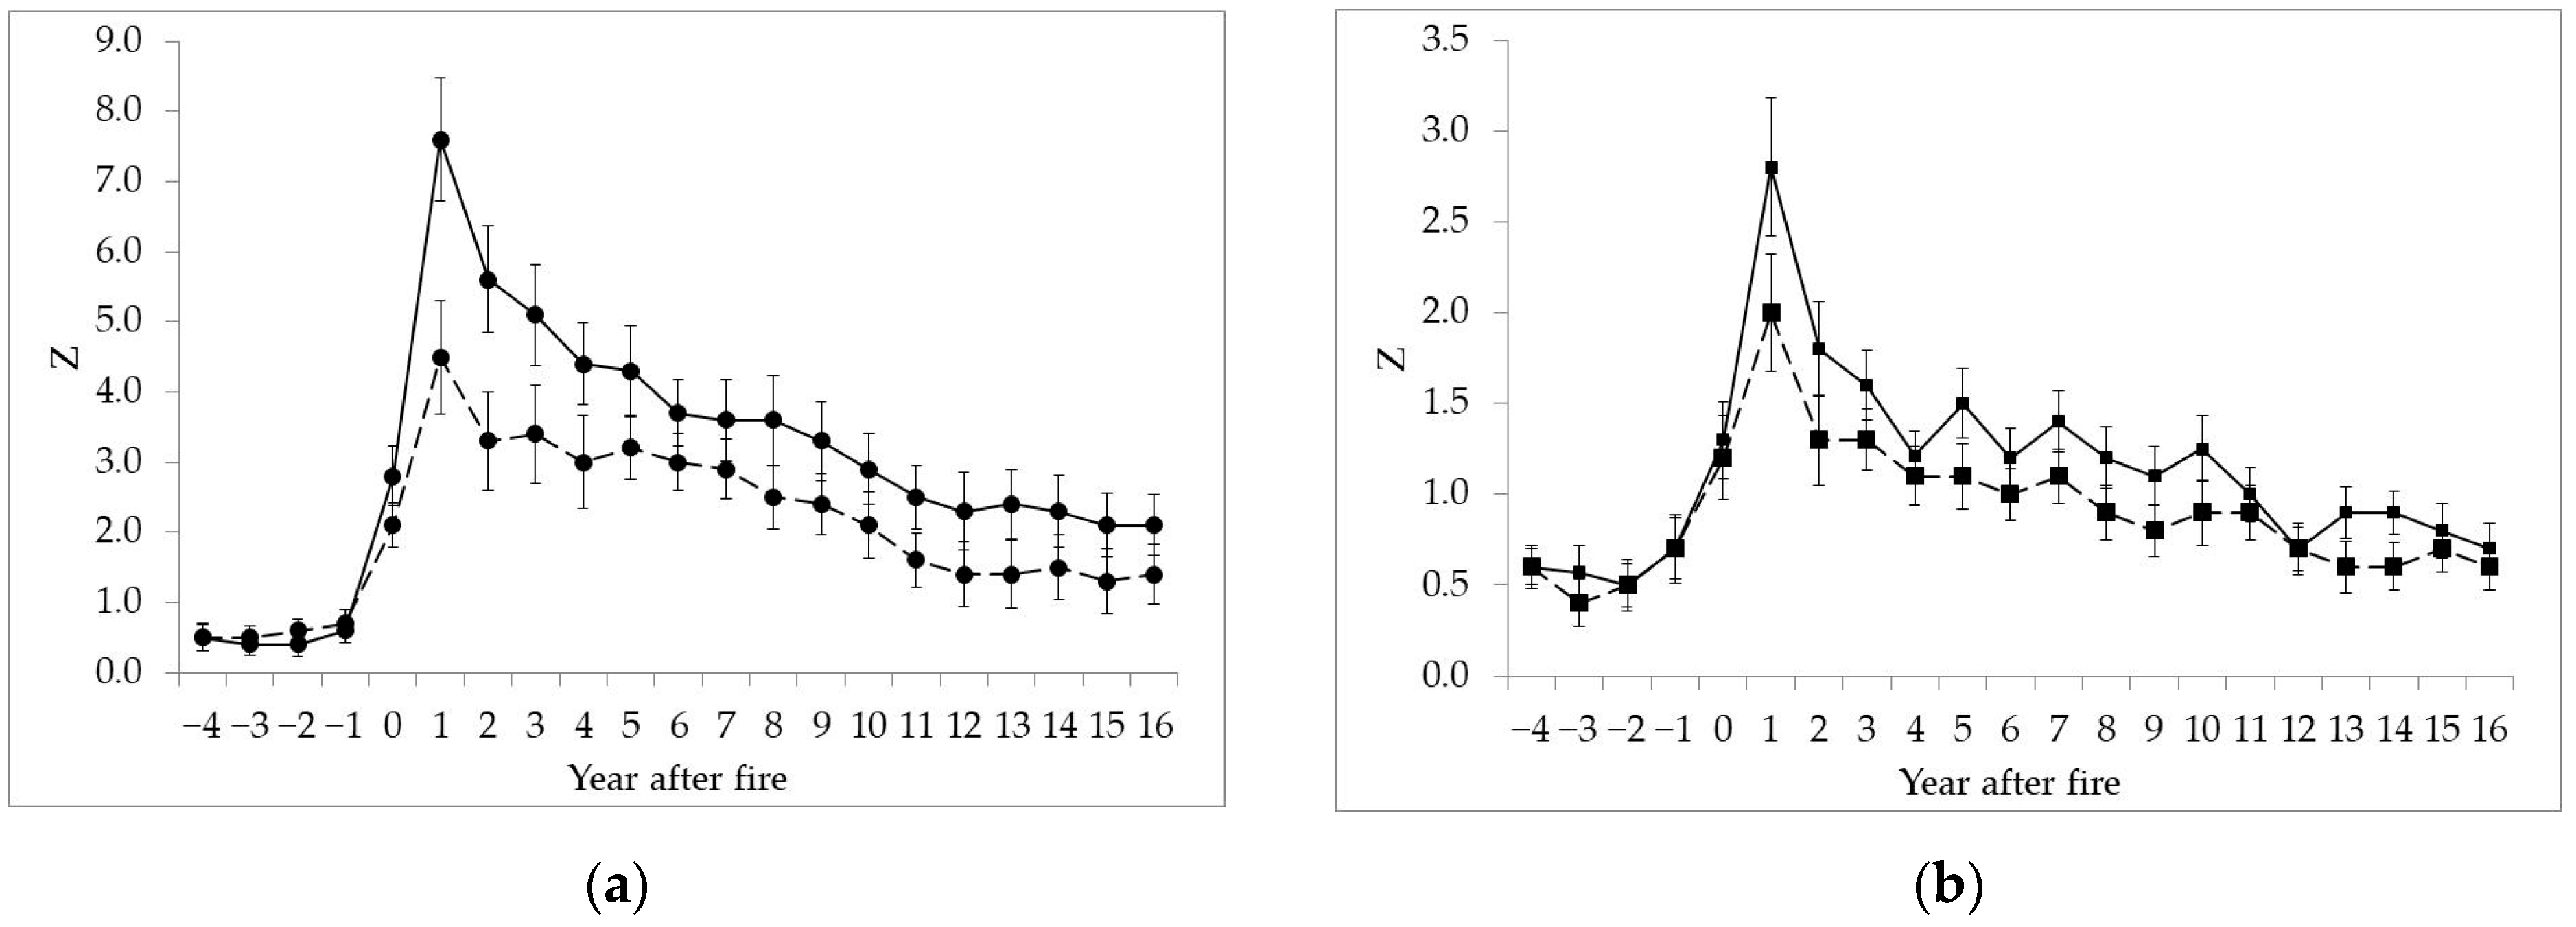
3. Results and Discussion

Annual burned areas in the region between 2001 and 2021 were highly variable depending on weather conditions ranging between 31 and 537 thousand hectares, with a decreasing trend in burned area (R2 = 0.29; p < 0.05). The mean annual burned area was 250.2 ± 153.7 thousand ha (mean ± SD). The highest disturbance rate (11.4%) calculated as the ratio of the total burned area to the total forest area was observed in mixed forests, meaning that 11.4% of mixed forest experienced fire disturbance between 2001 and 2021. The lowest (3.1%) was observed in dark-needle coniferous stands (Table 1). The highest proportions of severely burned area were observed in the larch-dominant (20.8%) and DNC forests (19.1%), while in the pine-dominant stands and mixed forests, these were about two times lower (10.9% and 9.8%, respectively) (Table 1).
The distribution of the fire radiative power was approximated by a power law (R2 = 0.92, p < 0.05) (Figure 2a) that is consistent with the previous results obtained for the boreal forests of Eurasia and North America [15,16]. Mean FRP for the study area was 37.4 ± 26.4 MW/km2 and the lowest FRP values were observed for pine and deciduous stands (33.8 ± 34.5 MW/km2 and 30.1 ± 29.3 MW/km2, respectively) (Figure 2a). In the larch and DNC, FRP values were 25–30% higher, at 46.6 ± 42.7 MW/km2 and 42.8 ± 44.1 MW/km2, respectively. These results were in good correspondence with the previously obtained estimates for the central and northern regions of Siberia [16] and were approximately 20% higher than the estimates for the Altai-Sayan region [17]. The Mann–Whitney U-test showed that differences in FRP between forests with different dominant species are significant at the level of 0.05 (Figure 2a).
FRP values were also compared with the corresponding dNBR values. For fire pixels from each 50 MW/km2 interval, the mean FRP values were calculated, as well as dNBR means and standard deviations. Fire pixels within each FRP range were characterized by significant dNBR variations (standard deviation in Figure 2b). The relationship between FRP and mean dNBR values within these intervals can be approximated by a logarithmic law (R2 = 0.46; p < 0.05) (Figure 2b). For example, for larch stands, an increase in the FRP from 50 to 750 MW/km2 resulted in an increase in the dNBR by about 43% (Figure 2b); however, a further FRP increase resulted in a much smaller increase in dNBR. FRP change from 750 to 1750 MW/km2 led to an increase in dNBR by only about 8%. It also should be noted that, in severely burned areas (dNBR > 0.44), the mean FRP value was 72–116% higher compared with moderately burned areas.
Post-fire dynamics of NBR and NDVI showed significant differences between areas with a high and moderate disturbance degree (estimated using dNBR). For instance, for the NBR index in the first post-fire year, the Z-value was almost two times higher for severely disturbed areas compared with moderately disturbed areas (Figure 3). At the same time, this initial anomaly was smaller in the case of NDVI—severely disturbed areas had 1.5–2 times higher anomaly values compared with moderately disturbed areas.
In the case of moderately disturbed areas, the NBR and NDVI values of the considered indicators after 10–15 years of restoration were 30–40% closer to the background values compared with severely disturbed areas. However, even after 15 years, a one-way ANOVA test showed significant differences between disturbed and undisturbed areas for both NBR (p < 0.005) and NDVI (p < 0.01), while before fires, the differences between these areas were not significant. At the same time, in the case of NDVI, the differences between disturbed and undisturbed areas were less than 1 σb (Z < 1) for both severely and moderately disturbed areas after 11 years post fire. For the NBR event 16 years post fire, the difference was higher than 1 σb (Z > 1).

4. Conclusions

Using the satellite data, an assessment of the fire-disturbed forest areas and post-fire dynamics was performed for the southern regions of central Siberia. A decreasing trend in forest burned area (R2 = 0.29; p < 0.05) was observed in the region with a mean burned area of 250.2 ± 153.7 thousand ha. The highest disturbance rates of 11.4% and 7.2% were observed in mixed and larch-dominant forests, respectively. At the same time, the highest proportions of severely burned areas were observed in the larch-dominant (20.8%) and DNC forests (19.1%), while in the pine-dominant stands and mixed forests, these were about two times lower.
Fire frequency versus FRP was well-fitted by a power law (R2 = 0.92, p < 0.05). The highest FRP values (46.6 ± 42.7 MW/km2 and 42.8 ± 44.1 MW/km2) were observed for the larch-dominant and DNC forest types, that is, 25–30% higher than for pine-dominant and deciduous stands. While fire pixels within were characterized by significant dNBR variations, the relationship between mean FRP and dNBR values was fitted using a logarithmic law (R2 = 0.46; p < 0.05). Fires resulted in severely burned areas generally had 72–116% higher mean FRP value comparing to moderately burned areas.
The results indicated that severely disturbed areas need a longer period of recovery. For instance, after 10–15 years of recovery, NBR and NDVI for severely disturbed areas were 30–40% higher than for moderately disturbed areas. The differences between disturbed and background areas were still more than one standard deviation for NBR after 16 years of recovery, while for NDVI, this difference becomes less than one standard deviation 11 years post fire. However, it takes more than 15 years for both indices to fully recover after a fire because, even 15 years post fire, a one-way ANOVA test shows significant differences between disturbed and undisturbed areas.

Funding

The research was supported by the Russian Science Foundation and the Government of Republic of Khakassia (grant #22-17-20012, https://rscf.ru/en/project/22-17-20012/, last accessed 18 November 2022).

Institutional Review Board Statement

Not applicable.

Informed Consent Statement

Not applicable.

Data Availability Statement

For the analysis performed in this study, several publicly available datasets were used. These datasets include vegetation map: http://pro-vega.ru/maps/ (accessed on 14 September 2022) and MODIS data downloaded from the LAADS service (https://ladsweb.modaps.eosdis.nasa.gov) (accessed on 22 September 2022).

Conflicts of Interest

The author declares no conflict of interest.

References

  1. Bartalev, S.; Stytsenko, F.; Egorov, V.; Loupian, E. Satellite assessment of fire-caused forest mortality in Russia. Forestry 2015, 2, 83–94. (In Russian) [Google Scholar]
  2. Bartalev, S.; Shvidenko, A.; Held, A. Natural forest disturbances. In Russian Forests and Climate Change. What Science Can Tell Us; Leskinen, P., Lindner, M., Verkerk, P.J., Nabuurs, G.J., Van Brusselen, J., Kulikova, E., Hassegawa, M., Lerink, B., Eds.; European Forest Institute: Joensuu, Finland, 2020; pp. 21–25. [Google Scholar]
  3. Shvetsov, E.; Kukavskaya, E.; Shestakova, T.; Laflamme, J.; Rogers, B. Increasing fire and logging disturbances in Siberian boreal forests: A case study of the Angara region. Environ. Res. Lett. 2021, 16, 115007. [Google Scholar] [CrossRef]
  4. Kukavskaya, E.; Buryak, L.; Shvetsov, E.; Conard, S.; Kalenskaya, O. The impact of increasing fire frequency on forest transformations in southern Siberia. For. Ecol. Manag. 2016, 382, 225–235. [Google Scholar] [CrossRef]
  5. Ivanova, G.; Ivanov, V. Fire regimes in Siberian forests. Int. For. Fires News 2005, 32, 67–69. [Google Scholar]
  6. Furyaev, V. Pyrological regimes and dynamics of the southern Taiga forests in Siberia. In Fire in Ecosystems of Boreal Eurasia Forestry Sciences; Goldammer, J., Furyaev, V., Eds.; Springer: Dordrecht, The Netherlands, 1996; Volume 48, pp. 168–185. [Google Scholar]
  7. Cuevas-Gonzalez, M.; Gerard, F.; Balzter, H.; Rianos, D. Analysing forest recovery after wildfire disturbance in boreal Siberia using remotely sensed vegetation indices. Glob. Chang. Biol. 2009, 15, 561–577. [Google Scholar] [CrossRef]
  8. Yi, K.; Tani, H.; Zhang, J.; Guo, M.; Wang, X.; Zhong, G. Long-Term Satellite Detection of Post-Fire Vegetation Trends in Boreal Forests of China. Remote Sens. 2013, 5, 6938–6957. [Google Scholar] [CrossRef]
  9. Bartalev, S.A.; Egorov, V.A.; Zharko, V.O.; Lupyan, E.A.; Plotnikov, D.E.; Khvostikov, S.A.; Shabanov, N.V. Satellite Mapping of the Vegetation Cover of Russia; ISR RAS: Moscow, Russia, 2016; 208p. (In Russian) [Google Scholar]
  10. Giglio, L.; Boschetti, L.; Roy, D.; Humber, M.; Justice, C. The Collection 6 MODIS burned area mapping algorithm and product. Remote Sens. Environ. 2018, 217, 72–85. [Google Scholar]
  11. Vermote, E.F.; Roger, G.C.; Ray, J.P. MOD09A1 MODIS Surface Reflectance 8-Day L3 Global 500 m SIN Grid V006. NASA EOSDIS Land Processes DAAC. 2015. Available online: https://salsa.umd.edu/files/MOD09_UserGuide_v1.4.pdf (accessed on 27 September 2022).
  12. Giglio, L.; Schroeder, W.; Justice, C.O. The collection 6 MODIS active fire detection algorithm and fire products. Remote Sens. Environ. 2016, 178, 31–41. [Google Scholar] [CrossRef] [PubMed]
  13. French, N.; Kasischke, E.; Hall, R.; Murphy, K.; Verbyla, D.; Hoy, E.; Allen, J. Using Landsat data to assess fire and burn severity in the North American boreal forest region: An overview and summary of results. Int. J. Wildland Fire 2008, 17, 443–462. [Google Scholar] [CrossRef]
  14. Key, C.; Benson, N. Landscape Assessment: Sampling and Analysis Methods. In FIREMON: Fire Effects Monitoring and Inventory System; Lutes, D.C., Keane, R.E., Caratti, J.F., Key, C.H., Benson, N.C., Sutherland, S., Gangi, L.J., Eds.; Rocky Mountain Research Station, USDA Forest Service: Fort Collins, CO, USA, 2006. [Google Scholar]
  15. Wooster, M.J.; Zhang, Y.H. Boreal forest fires burn less intensely in Russia than in North America. Geophys. Res. Lett. 2004, 31, L20505. [Google Scholar] [CrossRef]
  16. Shvetsov, E.G.; Ponomarev, E.I. Estimating the influence of external environmental factors of fire radiative power using satellite imagery. Contemp. Probl. Ecol. 2015, 8, 337–343. [Google Scholar] [CrossRef]
  17. Ponomarev, E.I.; Shvetsov, E.G.; Kharuk, V.I. Fires in the Altai-Sayan region: Landscape and ecological confinement. Izv. Atmos. Ocean. Phys. 2016, 52, 725–736. [Google Scholar] [CrossRef]
Figure 1. Study area. Land cover types are shown in colors.
Environsciproc 22 00016 g001
Figure 2. (a) Frequency distribution of fire pixels depending on their FRP. The numbers indicate different dominant tree stands: 1—larch forests (red circles); 2—deciduous forests (blue diamonds); 3—pine forests (purple squares); and 4—DNC forests (cyan triangles). (b) dNBR depending on the FRP. Color scheme is the same as for the left panel. Error bars correspond to one standard deviation. Each point shows the mean dNBR value for the corresponding FRP interval. Points are shown only for FRP intervals with 50 fire pixels or more.
Environsciproc 22 00016 g002
Figure 3. Post-fire dynamics for (a) NBR and (b) NDVI. Solid lines correspond to severely disturbed areas, while dashed lines show moderately disturbed areas. Error bars correspond to one standard deviation.
Environsciproc 22 00016 g003
Table 1. Fire disturbance (2001–2021) for main forest types.
Dominant Tree SpeciesBurned Area as Fraction of Total Forest Area, %Severely Burned Area as Fraction of Total Burned Area, %
Larch7.220.8
Mixed11.49.8
Pine6.010.9
DNC3.119.1
Disclaimer/Publisher’s Note: The statements, opinions and data contained in all publications are solely those of the individual author(s) and contributor(s) and not of MDPI and/or the editor(s). MDPI and/or the editor(s) disclaim responsibility for any injury to people or property resulting from any ideas, methods, instructions or products referred to in the content.

