Proceeding Paper

Mapping the Wildland-Urban Interface from Houses Location and Terrain Slope in Patagonia, Argentina †

Instituto de Investigaciones en Biodiversidad y Medioambiente (CONICET-UNCOMA), Quintral 1250, San Carlos de Bariloche CP 8400, Argentina
*
Author to whom correspondence should be addressed.
Presented at the 3rd International Electronic Conference on Forests—Exploring New Discoveries and New Directions in Forests, 15–31 October 2022; Available online: https://iecf2022.sciforum.net/.
Environ. Sci. Proc. 2022, 22(1), 14; https://doi.org/10.3390/IECF2022-13041
Published: 15 October 2022

Abstract

:
Urbanization of forested areas increases the surface of wildland–urban interface (WUI), where fire is the primary hazard for humans and ecosystems. We determined the WUI using a novel approach in NW Patagonia, Argentina and evaluated its relationship with the fire ignition points. The WUI expands a greater distance on upslopes, where the rate of fire spread is highest. The WUI reaches the maximum distance under the most hazardous conditions: houses surrounded by fuel with steep slopes towards them. In the Bariloche district in 2021, the WUI included 81% of the houses and occupied 37% (11,006 ha) of the total study area. Between 2015 and 2021, 77% of fire ignitions occurred in the WUI, highlighting the relevance of urban growth planning and the management of fuel load in order to reduce wildfire risk.

1. Introduction

The wildland–urban interface (WUI) is defined as areas where houses border or intermingle with wildland vegetation [1]. WUI fires are a frequent concern in fire-prone ecosystems [2], fueled by urban expansion into forest areas, climate change, and changes in land use [3]. Their impacts on communities are severe; in the US, the number of houses destroyed by fire per year increased by 300% between 1990 and 2014 [4]. Around 90% of ignitions are anthropogenic [5] and the global trend toward the expansion of the WUI raises the probability of fires. Warmer and drier conditions in some regions increase the frequency of fires, examples of this are the fires of 2017–18 in Portugal and Greece and 2019–20 in Australia [6,7,8]. Extreme wildfires have occurred in northwestern Patagonia, Argentina, during the hot and dry seasons in 2011–2012 [9] and in 2021 two wildfires burned 500 houses in the cities of Lago Puelo and El Hoyo.
Studies have focused on mapping the WUI and its application for management and planning (e.g., [1,10,11]). The delimitation of the WUI can be used to plan urban expansion and to manage fuel treatment in areas of high hazard. The different methodologies for the WUI delimitation can be grouped into zonal and point-based approaches [10]. Zonal methods, mainly applied in the US, use aggregated data such as census blocks (smallest area with houses information) and vegetation maps [1]. The US WUI definition indicates that a populated area can be categorized as WUI if it contains a given house density (>6.17 houses/km2) within a maximum distance from large patches of wildland vegetation. This method excludes less dense blocks; however, studies indicate that isolated or scattered houses are more vulnerable to fires [11,12]. Point-based approaches employ the exact location of houses and require the determination of an area around them [10,11,13]; this area can be constant [10,13] or variable depending on vegetation characteristics related to fire hazard [14,15].
Fire hazard depends on fuel variables (load, continuity, flammability) and topography (i.e., the slope). Fire advances downslope at practically the same rate as on flat terrain, while upslope of 25–30° the rate of fire spread increases exponentially [16]. Although some studies incorporate the fire hazard in the delimitation of the WUI [14,15], none have taken the slope into account until now.
In this work, our general objective was to generate a WUI map applicable to fire prevention management and human and structure protection plans. We developed a new methodology for mapping the WUI based on a building footprint global database [17]. The local extension of the WUI varies depending on the slope, reaching the maximum width under the most hazardous conditions. Finally, to assess the WUI obtained with this method, we quantified the houses in the WUI and the WUI-located ignitions over the last six years, and we compared our results with other studies.

2. Materials and Methods
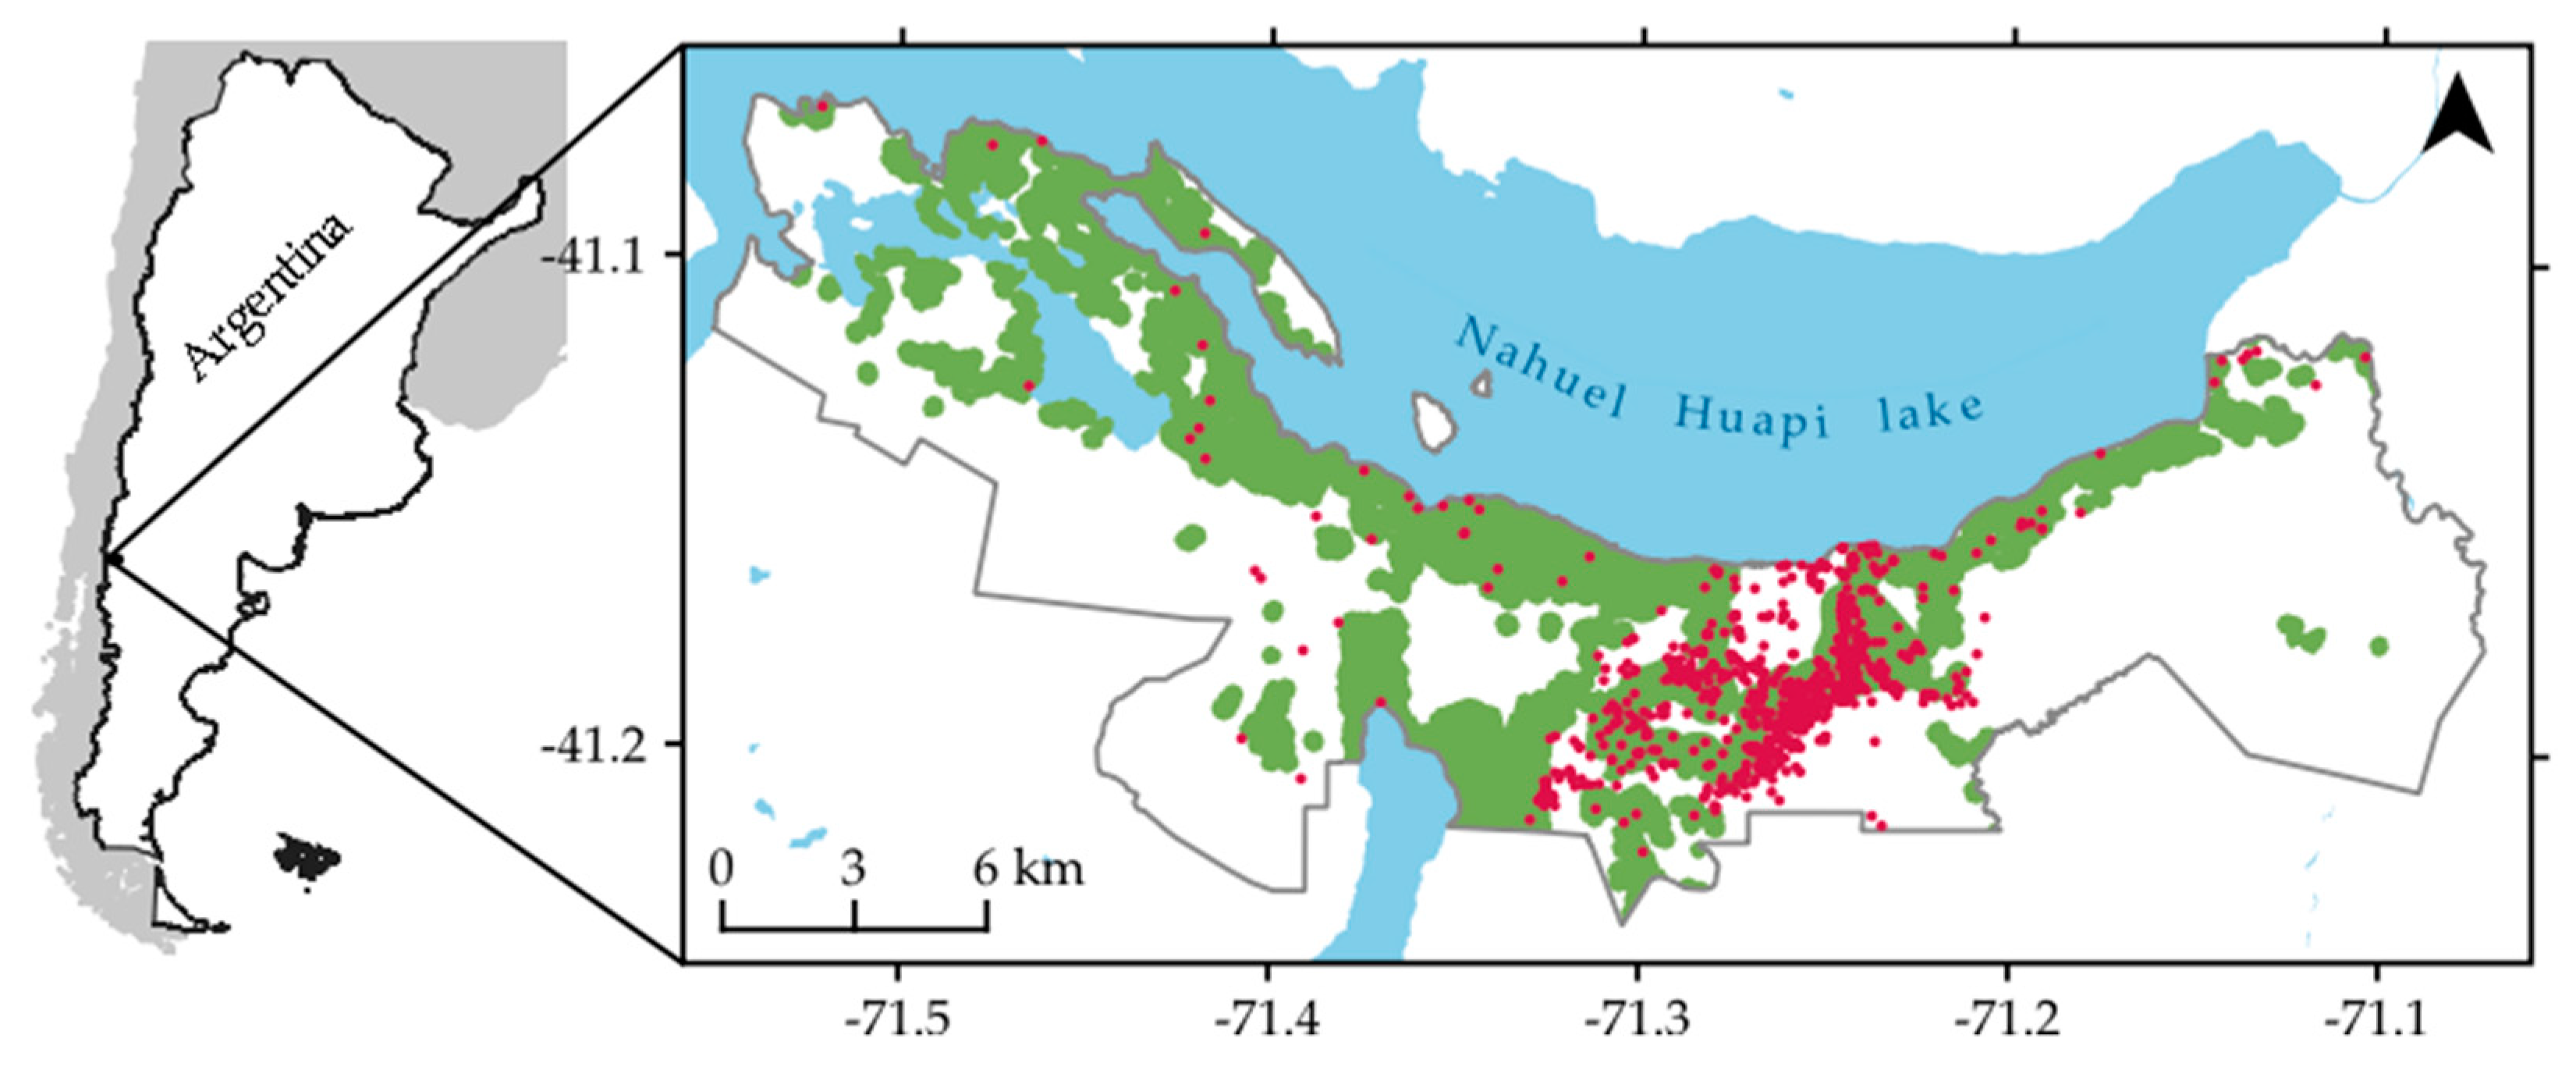
2.1. Study Area

The study area (30,141 ha) covers the district of Bariloche (41°09′ S 71°18′ W) (Figure 1), the most populated city of northwestern Patagonia, Argentina (146,000 inhabitants, census 2022), located along the southern shore of Nahuel Huapi lake. Bariloche district has a perimeter of more than 40 km surrounded by the Nahuel Huapi National Park (700,000 ha) and the extensive derived WUI that borders the protected area.
The climate in the study area is temperate Mediterranean, with dry summers and rainfall in autumn-winter. The average temperature in Bariloche is 8 °C and the mean annual precipitation is 1344 mm. The dominant vegetation is the mixed Nothofagus dombeyi and Austrocedrus chilensis forests in the southwestern sectors, Nothofagus pumilio forests above 1000 m, and monospecific shrublands of Nothofagus antarctica and mixed N. antarctica, Lomatia hirsuta and Schinus patagonicus to the northeast [18]. In disturbed sites, exotic species such as Pinus spp. and Pseudotsuga menziesii are found [19].
Tourism and recreation are the main economic activities of Bariloche and the anthropic pressure in the city is increasing due to an accelerated urban expansion. Between 1999 and 2005, more than 45% of fires in Patagonia occurred near Bariloche, with 97% of them of anthropic origin [20].

2.2. Data Sources and Preprocessing

We obtained the vegetation cover from a classification map of forest types and land cover updated to 2017, carried out by the Andean Patagonian Forest Research and Extension Center (CIEFAP) from Spot 5, Landsat TM, ETM+ and OLI images [21]. The map in vector format has a spatial resolution of 10 m.
We generated a digital terrain model (DTM) from contour lines of the National Geographic Institute of Argentina, with altitude changes of 50 m. We used 82,397 random points along the contour lines to generate a DTM of 10 m resolution by interpolation with the inverse distance weighting method. We defined the optimal power parameter for the interpolation by cross-validation, with power values between 0.01 and 10 with increments of 0.01, resulting in an optimal value of 4.91 with a mean absolute error of 0.001 m. We carried out this procedure using the R programming language and the spatstat, raster, rgdal and Metrics libraries.
To represent human presence, we derived the location of individual houses from a high-quality building footprint global database developed by Microsoft [17]. This data product is generated using deep neural network with segmentation techniques to trace the shape of individual buildings from high-resolution imagery data from 2014–2021 (~50 cm) and has been used successfully in other WUI studies from California [22,23], Montana [24], and the US [25], as it simplifies the procedure by eliminating the need to apply a house density threshold. The product contains over 6 million polygons of computer-generated building footprints for Argentina in GeoJSON format. We visually inspected the layer using Google Earth images of high spatial resolution updated to 2022, to eliminate possible false positives and digitized missing houses, since the Microsoft product does not completely cover the Argentine territory. We extracted the centroids of the polygons to reduce computation time in the WUI delimitation.
We used ignition data from historical records of the Forest Fire Prevention and Fighting Service of Río Negro (SPLIF) for the period 2015–2021 (unpublished data).

2.3. WUI Mapping Method

We extracted the fuel classes from the vegetation map, including forests, forest plantations, grasslands, shrublands, and wetlands [10,26]. We classified the other categories as non-fuel (horticultural crops, ice or snow, lakes, rock, urban and infrastructure areas, and unclassified areas). We excluded urban parks by filtering isolated areas of vegetation smaller than 20 ha, then we rasterized the polygons and reclassified the fuel cells with value 1 and non-fuel cells with 2.
To map the WUI, we used a cost distance function of ArcGIS 10.4 software that enables the delimitation of variable areas according to conditions defined by the user. The tool uses the housing location, the raster of fuels, the DTM and a factor that varies with the slope (Equation (1)). Previous studies in NW Patagonia indicate that fire spreads more easily on 20–35° slopes [27,28]. To represent this, a constant factor of 2 was applied to slopes less than 20°, the factor decreases to 1 for slopes greater than 20° towards houses and becomes infinity for slopes greater than 80°. Thus, the WUI expands a greater distance on upslopes and stops if it encounters a physical barrier. The interface reaches a maximum distance of 500 m under the most hazardous condition (houses surrounded by fuel with steep slopes towards them). This distance has been used in previous studies for the region [26,29] and other parts of Argentina [30] because it gives the optimal relation between the number of houses and the WUI area [10]. We considered populated but non-wildland areas as WUI if they are up to 500 m from large vegetated areas (>20 ha). This avoids including too many houses that make the map less useful for planning fuel reduction treatments (e.g., in urban areas where they are not needed).
distance = ∑ ½ (fi + fj) VFij 10 m
In Equation (1), fi is the value of one cell of the fuel raster (1: fuel, 2: non-fuel) that surrounds each house and fj is the value of the adjacent cell, VFij is the factor of the slope between both cells and 10 m is the raster resolution. For diagonal cells, the equation is multiplied by √2, a factor that arises from the geometry of the diagonal inter-cell movement. The calculation stops when the maximum distance of 500 m is reached.

2.4. WUI Areas and Ignitions Occurrence

We quantified the number of ignitions that occurred between 2015 and 2021 in the WUI. We filtered ignitions that occurred on wildland vegetation, leaving out those corresponding to structural fires (e.g., houses, cars; without including wildland vegetation), and calculated the proportion of ignitions that occurred inside the WUI areas.

3. Results and Discussion

We extracted 48,186 building polygons within the study area from the Microsoft buildings database. The number of houses reported by the 2010 national census for Bariloche is 34,867. We eliminated 780 polygons corresponding to non-residential constructions (garbage dump, quarries, hypermarkets, power plants) and false positives. The latter were isolated and mainly distributed in mountainous areas and roads. In some cases, large stones and docks were assigned as houses. We manually digitized 2844 missing houses, either because they were built after the date of the image used in that zone, or the product was not generated for that area (mainly on the east side of the study area). After this preprocessing, the total number of houses was 50,250.
The wildland-urban interface occupies 37% of Bariloche district (11,006 ha) and contains 81% (40,649) of total houses (Figure 1). Other studies from NW Patagonia showed similar results, with the WUI areas from the cities of El Bolsón and Esquel containing 97% of the houses in both cases [26,29]. Although in these studies the authors used a different methodology to map the WUI, the relative percentage of houses within interface areas of NW Patagonia is higher than other regions. For example, in Córdoba, Argentina, approximately 15% of the Sierras Chicas region is considered WUI containing 52% of the houses [30]. A recent study showed that the WUI in California contains 45.13% of total houses [23]. In south-central Chile, the WUI includes only 20.6% of the houses [31].
The fire database of Río Negro SPLIF registered 1134 ignitions between 2015 and 2021. We obtained 1050 ignition points after eliminating the records without location coordinates and filtering those that occurred in wildland vegetation (forests, shrubland or grassland). Some 807 ignitions (77% of the total) occurred in the WUI. Previous studies in the region support this result, indicating that a significant proportion of fires occur in the vicinity of urbanizations [27,28]. In El Bolsón and Esquel cities, 77% and 65% of the ignitions were located in the WUI [26,29]. Particularly in Esquel, 80% of the ignitions located in the WUI were concentrated in the southern part of the WUI. Similarly, Figure 1 shows that ignitions are not evenly distributed, but concentrate south-center of the study area, particularly on the southeast border of Bariloche WUI. This pattern may result from socio-economical conflicts present in this zone of the WUI that could be analyzed in depth; nevertheless there are some studies about this issue [32,33].
The relationship between the WUI and the occurrence of ignitions is consistent throughout the literature. In France, the interface presents a higher density of ignitions, especially in isolated and scattered houses [11]. In Galicia, Spain, in all land uses within the WUI, except agricultural areas, there is a high presence of ignitions [34]. A study from California shows that the WUI obtained without using a house density threshold captures the majority of ignitions from 2010–2019 (86.25%) compared to the WUI delimited using census data (66.5% of the ignitions) [23]. In south-central Chile, the WUI delimited with a national definition based on risk thresholds captured a higher proportion of the ignitions compared to the WUI obtained with the US-based approach that applies a 6.17 houses/km2 threshold [31].

4. Conclusions

We have developed a methodology for mapping the WUI with variable extensions based on the slope. The Microsoft building footprint product allows a spatially precise delimitation of the interface, without the necessity for a house density-based WUI definition. The WUI obtained with this method reaches a maximum extension around houses surrounded by fuel on steep slopes towards them. The WUI areas obtained could be applied for fire prevention and fuel management since they consider the chances that a wildfire reaches a house. With this method, the wildland–urban interface is defined as the area where houses are bordering or within 500 m of wildland vegetation patches of at least 20 ha.
The WUI of Bariloche presents similar characteristics to other interface areas of NW Patagonia in terms of the proportion of houses contained in the WUI. Unlike other parts of Argentina and the world, NW Patagonia seems characterized by a high percentage of houses within interface areas. In this region, urbanizations are placed in wildland areas, dominated by forests and shrublands. In the future, the development of Patagonian fuel models can be incorporated to characterize the fire hazard in the WUI.
The study demonstrates the high concentration of fire ignition points in WUI areas, that can become hazardous wildfires. Increased ignition occurrence in WUI areas results from anthropic activities in the landscape, represented by the proximity to human settlements. In the future, the pattern of ignitions and its relation to different factors can be evaluated to optimize fire prevention programs based on the causes of ignitions.

Author Contributions

Conceptualization, C.S., S.G. and L.G.; methodology, C.S.; software, C.S.; formal analysis, C.S.; investigation, C.S. and L.G.; data curation, C.S.; writing—original draft preparation, C.S.; writing—review and editing, C.S., S.G. and L.G.; visualization, C.S.; supervision, S.G. and L.G. All authors have read and agreed to the published version of the manuscript.

Funding

This research received no external funding.

Institutional Review Board Statement

Not applicable.

Informed Consent Statement

Not applicable.

Data Availability Statement

The detailed data supporting reported results are available upon request to the corresponding author.

Acknowledgments

The ignition databases were provided by technicians J. P. Cabrera and A. J. Villegas (Forest Fire Prevention and Fighting Service of Río Negro).

Conflicts of Interest

The authors declare no conflict of interest.

References

  1. Radeloff, V.C.; Hammer, R.B.; Stewart, S.I.; Fried, J.S.; Holcomb, S.S.; McKeefry, J.F. The wildland–Urban interface in the United States. Ecol. Appl. 2005, 15, 799–805. [Google Scholar] [CrossRef]
  2. Syphard, A.D.; Radeloff, V.C.; Hawbaker, T.; Stewart, S.I. Conservation Threats Due to Human-Caused Increases in Fire Frequency in Mediterranean-Climate Ecosystems. Conserv. Biol. 2009, 23, 758–769. [Google Scholar] [CrossRef]
  3. Ganteaume, A.; Barbero, R.; Jappiot, M.; Maillé, E. Understanding future changes to fires in southern Europe and their impacts on the wildland-urban interface. J. Saf. Sci. Resil. 2021, 2, 20–29. [Google Scholar] [CrossRef]
  4. Mietkiewicz, N.; Balch, J.K.; Schoennagel, T.; Leyk, S.; Denis, L.A.S.; Bradley, B.A. In the Line of Fire: Consequences of Human-Ignited Wildfires to Homes in the U.S. (1992–2015). Fire 2020, 3, 50. [Google Scholar] [CrossRef]
  5. Balch, J.K.; Bradley, B.A.; Abatzoglou, J.T.; Nagy, R.C.; Fusco, E.J.; Mahood, A.L. Human-started wildfires expand the fire niche across the United States. Proc. Natl. Acad. Sci. USA 2017, 114, 2946–2951. [Google Scholar] [CrossRef] [PubMed]
  6. Turco, M.; Jerez, S.; Augusto, S.; Tarín-Carrasco, P.; Ratola, N.; Jiménez-Guerrero, P.; Trigo, R.M. Climate drivers of the 2017 devastating fires in Portugal. Sci. Rep. 2019, 9, 13886. [Google Scholar] [CrossRef] [PubMed]
  7. Levin, N.; Yebra, M.; Phinn, S. Unveiling the Factors Responsible for Australia’s Black Summer Fires of 2019/2020. Fire 2021, 4, 58. [Google Scholar] [CrossRef]
  8. Rovithakis, A.; Grillakis, M.G.; Seiradakis, K.D.; Giannakopoulos, C.; Karali, A.; Field, R.; Lazaridis, M.; Voulgarakis, A. Future climate change impact on wildfire danger over the Mediterranean: The case of Greece. Environ. Res. Lett. 2022, 17, 045022. [Google Scholar] [CrossRef]
  9. Defossé, G.E.; Godoy, M.M.; Bianchi, L.O.; Lederer, N.S.; Kunst, C. Fire history fire ecology and Management in Argentine Patagonia: From ancient times to nowadays. In Current International Perspectives on Wildland Fires, Mankind and the Environment, 1st ed.; Alexander, M., Leblon, B., Eds.; Nova Science Publishers: New York, NY, USA, 2015; pp. 177–210. [Google Scholar]
  10. Bar-Massada, A.; Stewart, S.I.; Hammer, R.B.; Mockrin, M.H.; Radeloff, V.C. Using structure locations as a basis for mapping the wildland urban interface. J. Environ. Manag. 2013, 128, 540–547. [Google Scholar] [CrossRef]
  11. Lampin-Maillet, C.; Long-Fournel, M.; Ganteaume, A.; Jappiot, M.; Ferrier, J. Land cover analysis in wildland–urban interfaces according to wildfire risk: A case study in the South of France. For. Ecol. Manag. 2011, 261, 2200–2213. [Google Scholar] [CrossRef]
  12. Syphard, A.D.; Keeley, J.E.; Massada, A.B.; Brennan, T.J.; Radeloff, V.C. Housing Arrangement and Location Determine the Likelihood of Housing Loss Due to Wildfire. PLoS ONE 2012, 7, e33954. [Google Scholar] [CrossRef] [PubMed]
  13. Lampin-Maillet, C.; Jappiot, M.; Long, M.; Bouillon, C.; Morge, D.; Ferrier, J.-P. Mapping wildland-urban interfaces at large scales integrating housing density and vegetation aggregation for fire prevention in the South of France. J. Environ. Manag. 2010, 91, 732–741. [Google Scholar] [CrossRef] [PubMed]
  14. Johnston, L.M.; Flannigan, M.D. Mapping Canadian wildland fire interface areas. Int. J. Wildland Fire 2018, 27, 1–14. [Google Scholar] [CrossRef]
  15. Theobald, D.M.; Romme, W.H. Expansion of the US wildland–urban interface. Landsc. Urban Plan. 2007, 83, 340–354. [Google Scholar] [CrossRef]
  16. Dupuy, J.-L.; Maréchal, J. Slope effect on laboratory fire spread: Contribution of radiation and convection to fuel bed preheating. Int. J. Wildland Fire 2011, 20, 289–307. [Google Scholar] [CrossRef]
  17. Microsoft. Global ML Building Footprints. 2022. Available online: https://github.com/microsoft/GlobalMLBuildingFootprints (accessed on 23 May 2022).
  18. Veblen, T.T.; Lorenz, D.C. Post-fire stand development of Austrocedrus-Nothofagus forests in northern Patagonia. Plant Ecol. 1987, 71, 113–126. [Google Scholar] [CrossRef]
  19. Paritsis, J.; Landesmann, J.B.; Kitzberger, T.; Tiribelli, F.; Sasal, Y.; Quintero, C.; Dimarco, R.D.; Barrios-García, M.N.; Iglesias, A.L.; Diez, J.P.; et al. Pine Plantations and Invasion Alter Fuel Structure and Potential Fire Behavior in a Patagonian Forest-Steppe Ecotone. Forests 2018, 9, 117. [Google Scholar] [CrossRef]
  20. De Torres Curth, M.I.; Ghermandi, L.; Pfister, G. Los incendios en el noroeste de la Patagonia: Su relación con las condiciones meteorológicas y la presión antrópica a lo largo de 20 años. Austral Ecol. 2008, 18, 153–167. [Google Scholar]
  21. Mohr-Bell, D.; Diaz, G.; Príncipe, R.; Gonzalez, C.; Bono, J.; Ciuffoli, L.; Strada, M.; Parmuchi, G.; Chomnalez, F.; Montenegro, C.; et al. Monitoreo de la Superficie de Bosque Nativo de la República Argentina, Región Forestal Bosque Andino Patagónico. Tomo I Informe, 1st ed.; Secretaría de Ambiente y Desarrollo Sustentable de la Nación: Esquel (Chubut), Argentina, 2019; p. 87. [Google Scholar]
  22. Syphard, A.D.; Rustigian-Romsos, H.; Keeley, J.E. Multiple-Scale Relationships between Vegetation, the Wildland–Urban Interface, and Structure Loss to Wildfire in California. Fire 2021, 4, 12. [Google Scholar] [CrossRef]
  23. Li, S.; Dao, V.; Kumar, M.; Nguyen, P.; Banerjee, T. Mapping the wildland-urban interface in California using remote sensing data. Sci. Rep. 2022, 12, 5789. [Google Scholar] [CrossRef]
  24. Ketchpaw, A.R.; Li, D.; Khan, S.N.; Jiang, Y.; Li, Y.; Zhang, L. Using Structure Location Data to Map the Wildland–Urban Interface in Montana, USA. Fire 2022, 5, 129. [Google Scholar] [CrossRef]
  25. Carlson, A.R.; Helmers, D.P.; Hawbaker, T.J.; Mockrin, M.H.; Radeloff, V.C. The wildland–urban interface in the United States based on 125 million building locations. Ecol. Appl. 2022, 32, e2597. [Google Scholar] [CrossRef] [PubMed]
  26. Godoy, M.M.; Martinuzzi, S.; Kramer, H.A.; Defossé, G.E.; Argañaraz, J.; Radeloff, V.C. Rapid WUI growth in a natural amenity-rich region in central-western Patagonia, Argentina. Int. J. Wildland Fire 2019, 28, 473. [Google Scholar] [CrossRef]
  27. Mermoz, M.; Kitzberger, T.; Veblen, T.T. Landscape Influences on Occurrence and Spread of Wildfires in Patagonian Forests and Shrublands. Ecology 2005, 86, 2705–2715. [Google Scholar] [CrossRef]
  28. Morales, J.M.; Mermoz, M.; Gowda, J.H.; Kitzberger, T. A stochastic fire spread model for north Patagonia based on fire occurrence maps. Ecol. Model. 2015, 300, 73–80. [Google Scholar] [CrossRef]
  29. Godoy, M.M.; Martinuzzi, S.; Masera, P.; Defossé, G.E. Forty Years of Wildland Urban Interface Growth and Its Relation With Wildfires in Central-Western Chubut, Argentina. Front. For. Glob. Chang. 2022, 5, 1–15. [Google Scholar] [CrossRef]
  30. Argañaraz, J.; Radeloff, V.; Bar-Massada, A.; Gavier-Pizarro, G.; Scavuzzo, C.; Bellis, L. Assessing wildfire exposure in the Wildland-Urban Interface area of the mountains of central Argentina. J. Environ. Manag. 2017, 196, 499–510. [Google Scholar] [CrossRef]
  31. Miranda, A.; Carrasco, J.; González, M.; Pais, C.; Lara, A.; Altamirano, A.; Weintraub, A.; Syphard, A.D. Evidence-based mapping of the wildland-urban interface to better identify human communities threatened by wildfires. Environ. Res. Lett. 2020, 15, 094069. [Google Scholar] [CrossRef]
  32. Curth, M.D.T.; Biscayart, C.; Ghermandi, L.; Pfister, G. Wildland–Urban Interface Fires and Socioeconomic Conditions: A Case Study of a Northwestern Patagonia City. Environ. Manag. 2012, 49, 876–891. [Google Scholar] [CrossRef]
  33. Bühler, M.D.; Curth, M.D.T.; Garibaldi, L.A. Demography and socioeconomic vulnerability influence fire occurrence in Bariloche (Argentina). Landsc. Urban Plan. 2013, 110, 64–73. [Google Scholar] [CrossRef]
  34. Calviño-Cancela, M.; Chas-Amil, M.L.; García-Martínez, E.D.; Touza, J. Wildfire risk associated with different vegetation types within and outside wildland-urban interfaces. For. Ecol. Manag. 2016, 372, 1–9. [Google Scholar] [CrossRef]
Figure 1. Wildland-urban interface (green) of Bariloche district (grey line polygon), located in northwestern Patagonia, Argentina. Fire ignition points from 2015–2021 are shown in red.
Environsciproc 22 00014 g001
Disclaimer/Publisher’s Note: The statements, opinions and data contained in all publications are solely those of the individual author(s) and contributor(s) and not of MDPI and/or the editor(s). MDPI and/or the editor(s) disclaim responsibility for any injury to people or property resulting from any ideas, methods, instructions or products referred to in the content.

