Proceeding Paper

Usefulness of UAV-Mounted Multi-Sensors System for In Situ Atmospheric Measurement: A Case Study from Wrocław, Poland †

by
Anetta Drzeniecka-Osiadacz
*,
Tymoteusz Sawiński
,
Magdalena Korzystka-Muskała
,
Marek Kowalczyk
and
Piotr Modzel
Department of Climatology and Atmosphere Protection, Institute of Geography and Regional Development, University of Wrocław, LIFE-MAPPINGAIR/PL Project, Kosiby 8 Str., 51-621 Wrocław, Poland
*
Author to whom correspondence should be addressed.
Presented at the 5th International Electronic Conference on Atmospheric Sciences, 16–31 July 2022; Available online: https://ecas2022.sciforum.net/.
Environ. Sci. Proc. 2022, 19(1), 49; https://doi.org/10.3390/ecas2022-12843
Published: 22 July 2022
(This article belongs to the Proceedings of The 5th International Electronic Conference on Atmospheric Sciences)

Abstract

:
Air pollution, especially particulate matter (PMx), is one of the most serious environmental threats worldwide. It is challenging in terms of both public health, impact on climate, and the reduction in visibility. The assessment of spatial variability of PMx allows us to better understand the processes that cause smog episodes, and may also be an additional element for the validation of the results of dispersion models. This study presents the results of measurements of basic meteorological parameters and air pollution involving a multi-sensor system. A Matrice 600 hexacopter with an installed environmental head was used as the measurement platform. This system enables us to measure the concentrations of PM2.5, PM10, air temperature and humidity.

1. Introduction

Air pollution, especially particulate matter (PM), is considered as a major environmental threat worldwide [1,2]. Associations between ambient air pollution and adverse health effects are well documented, both for long-term [3,4] and short-term health impacts [5,6]. Particulate matter has a serious detrimental effect on the environment, damages the crop, causes climate change and reduces visibility [7,8,9]. High-resolution monitoring of air pollution concentration and meteorological conditions (temperature, humidity, wind, etc.) within the atmospheric boundary layer (ABL) [10] is crucial for various environmental applications [11]. It is important to understand the processes of surface–atmosphere interactions, which govern, e.g., high air pollution concertation events, and it is vital to measure the impacts of air pollution on human health [12] and the environment. Information about these parameters is usually limited to a few meters above the ground; moreover, these measurements are most frequently carried out in stationary mode [13], and sometimes are extended with remote sensing technology [14,15]. Thus, mobile measurement involving UAVs is an interesting supplement for ground-based measurement [16,17].
The development of unmanned aerial vehicles (UAVs) provides possibilities for atmospheric measurements within the ABL and seems to be useful for surveys in small areas [18]. Drones equipped with properly designed and constructed sensors are successfully used in measuring air pollution, greenhouse gases, and meteorological variables [19,20].
The main objective of the study is to present the ability of using UAVs in simultaneous research of air pollution concentration and meteorological parameters and to determine the variability of the PM concentration together with the ABL structure in the lower part of the atmosphere in various types of land use and with different emission structures.

2. Data and Methods

2.1. Design of the Hexacopter-Based Measuring System

The measuring head installed on the UAV is the original solution, configured to measure selected air pollutants (PM, O3) and basic meteorological parameters (T, RH, P) during flight. In addition, the device records flight parameters such as geographic coordinates and altitude. The inlets of the sensors used in the measuring heads were placed above the plane of the rotors to minimize the influence of turbulence caused by the propellers. Low-cost PM (optical) and O3 (electrochemical) sensors were installed in the head, the selection of which was preceded by research and tests. All data were validated against the higher-quality data from Meteorological Observatory during the test stage. Measurement data were saved in the logger’s memory placed on the UAV and continuously monitored on the monitor screen using radio transmission.

2.2. Field Companies

The measurements using the drone were carried out in Wrocław, SW Poland. Wrocław, as do many cities in Poland, suffers from poor air quality, especially during the winter period. This is the result of the widespread use of coal and wood for domestic heating. Due to this reason, Polish cities are placed among the regions with the worst air quality in the European Union [21].
In order to assess the spatial variability of the particulate matter concentration and meteorological conditions, measurement campaigns were performed in 3 locations representing urban, suburban (an area of detached houses and allotments) and rural locations. Measurements were carried out in horizontal and vertical modes. In the years 2019–2020, nine such sessions were conducted, and during each of them several flights were performed (Table S1 in Supplementary material). The effective monitoring time during each flight was about 10–20 min. Background data including one-minute PM2.5 and PM10 concentration, air temperature, humidity, wind speed and wind direction supplemented by sodar data were obtained from the Meteorological Observatory of the University of Wrocław.

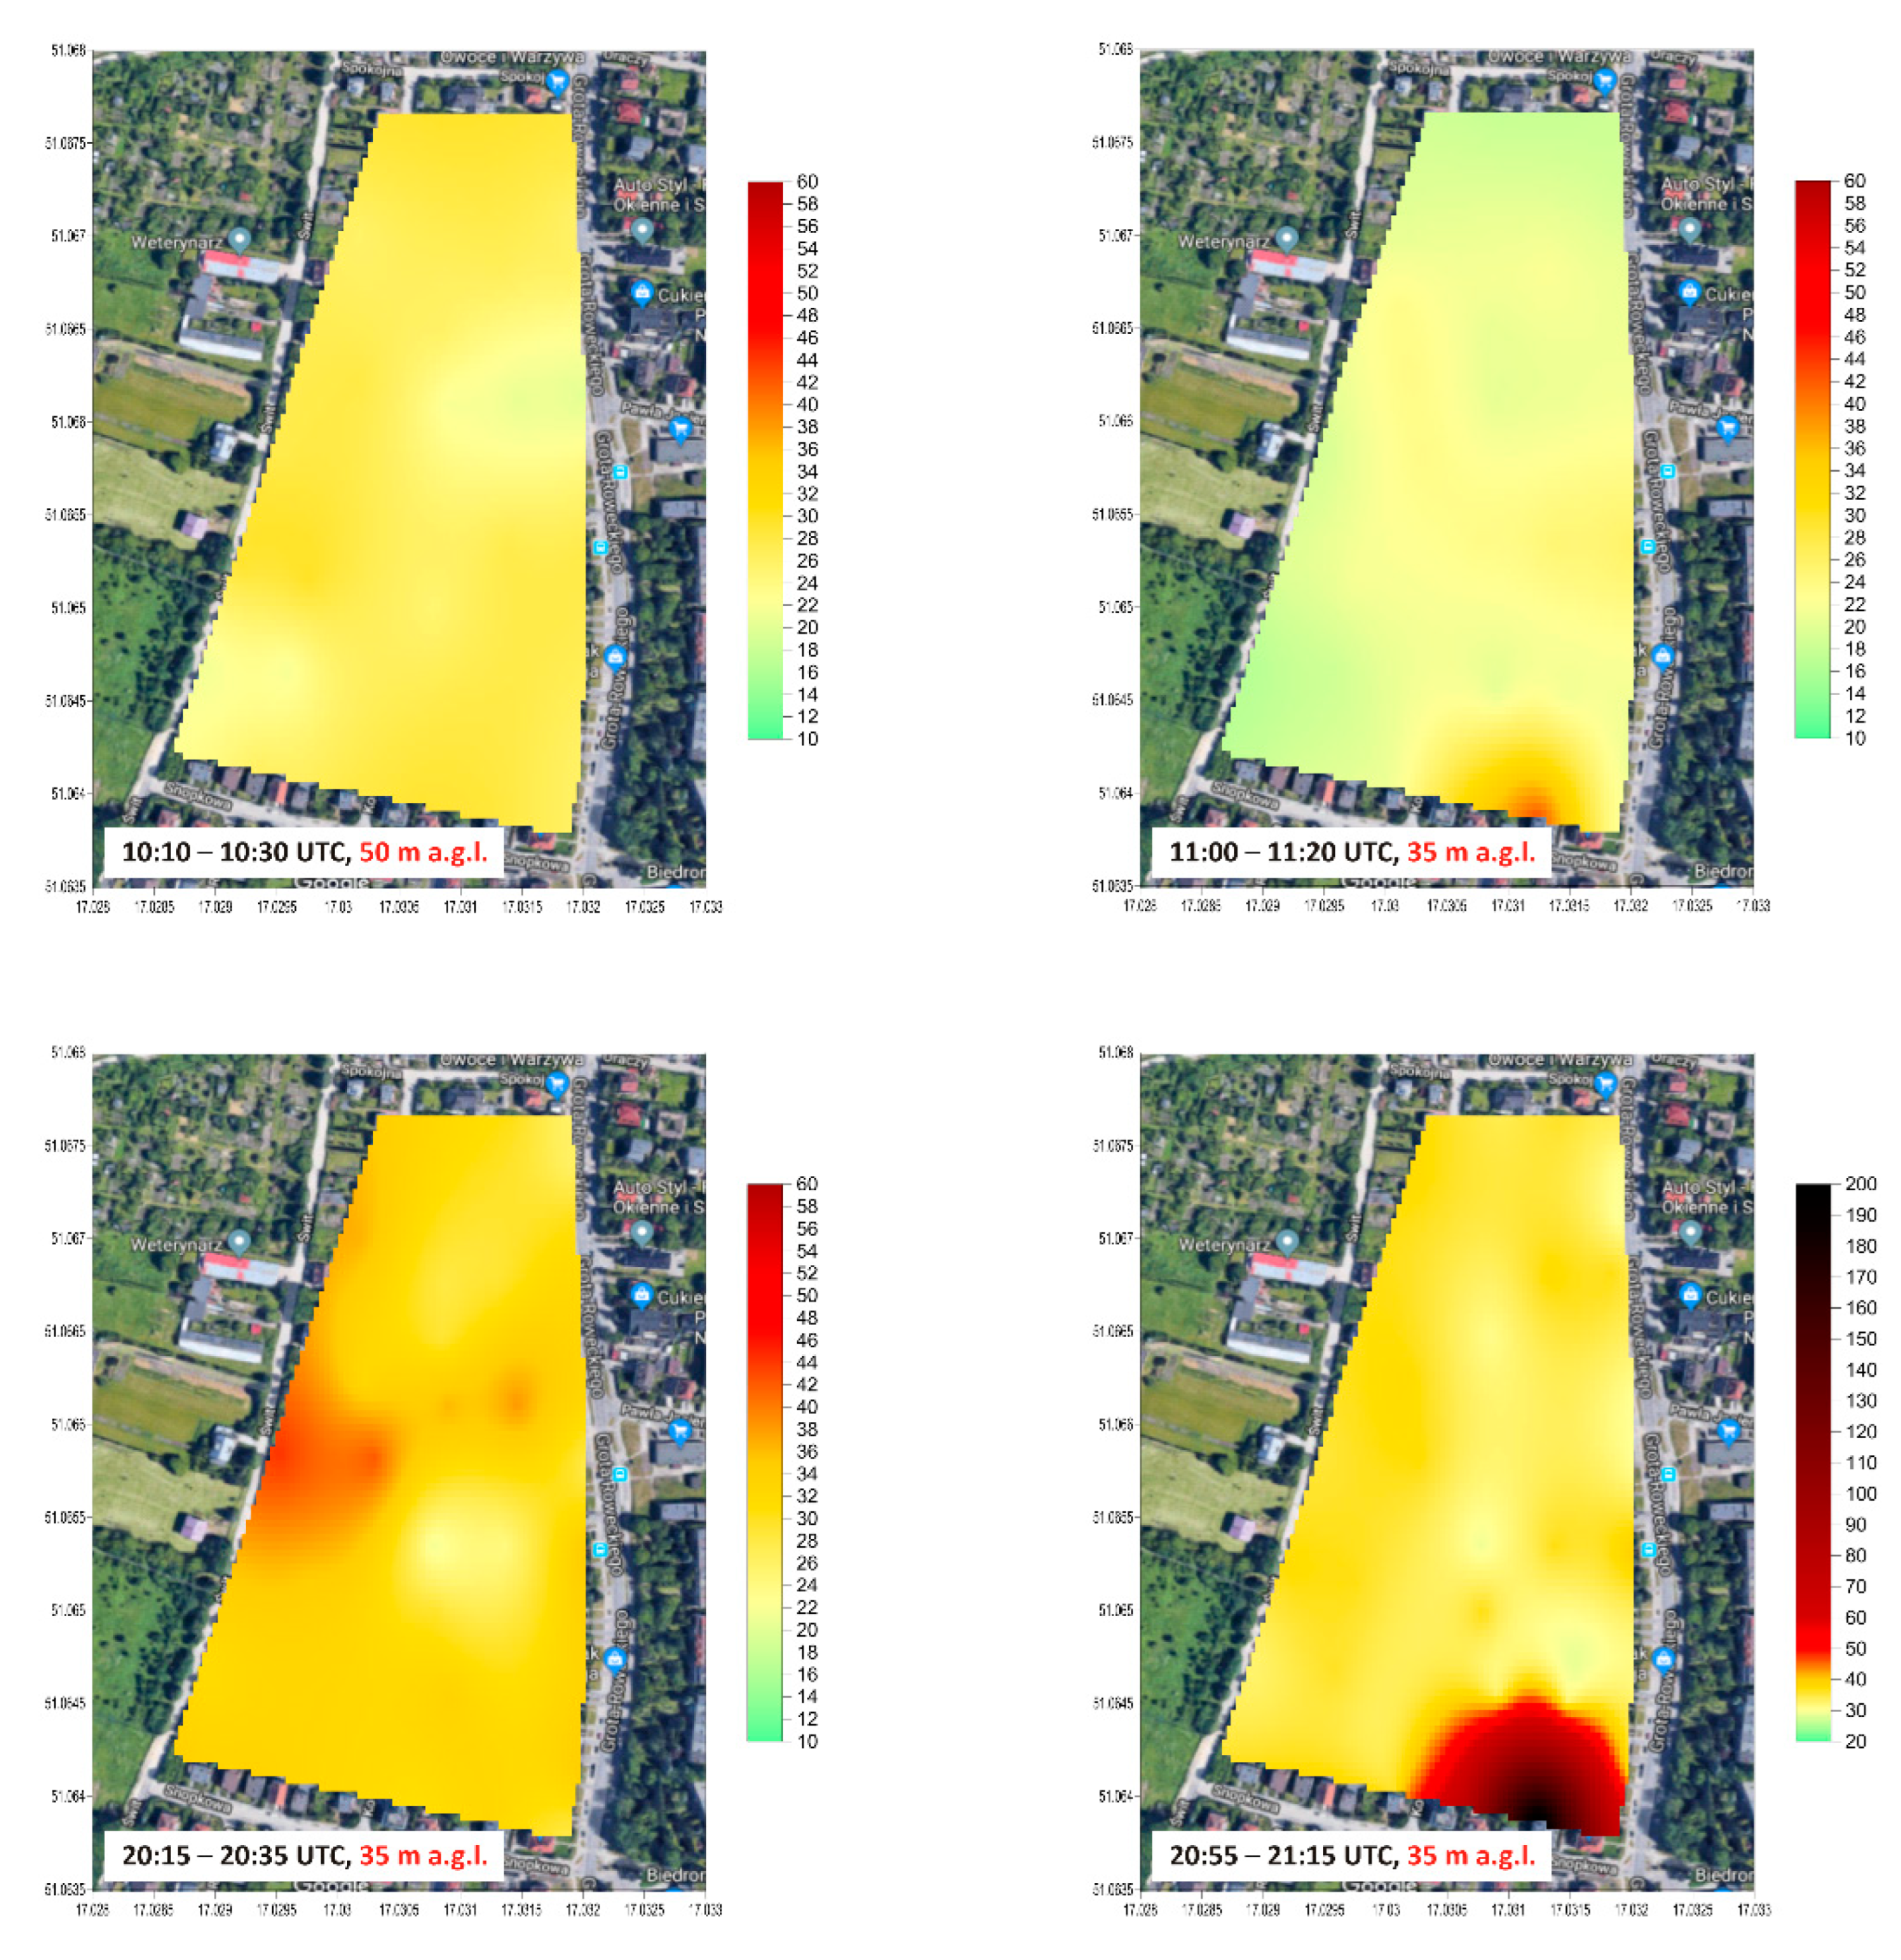
2.2.1. Horizontal Measurements

Horizontal measurements were carried out automatically in a selected area and at a certain height above the roof layer (Figure 1). The data were then presented in the form of spatial distributions of the analysed parameter. This enabled the identification of the main sources of air pollution, as well as the assessment of the variability of air temperature in a given area.

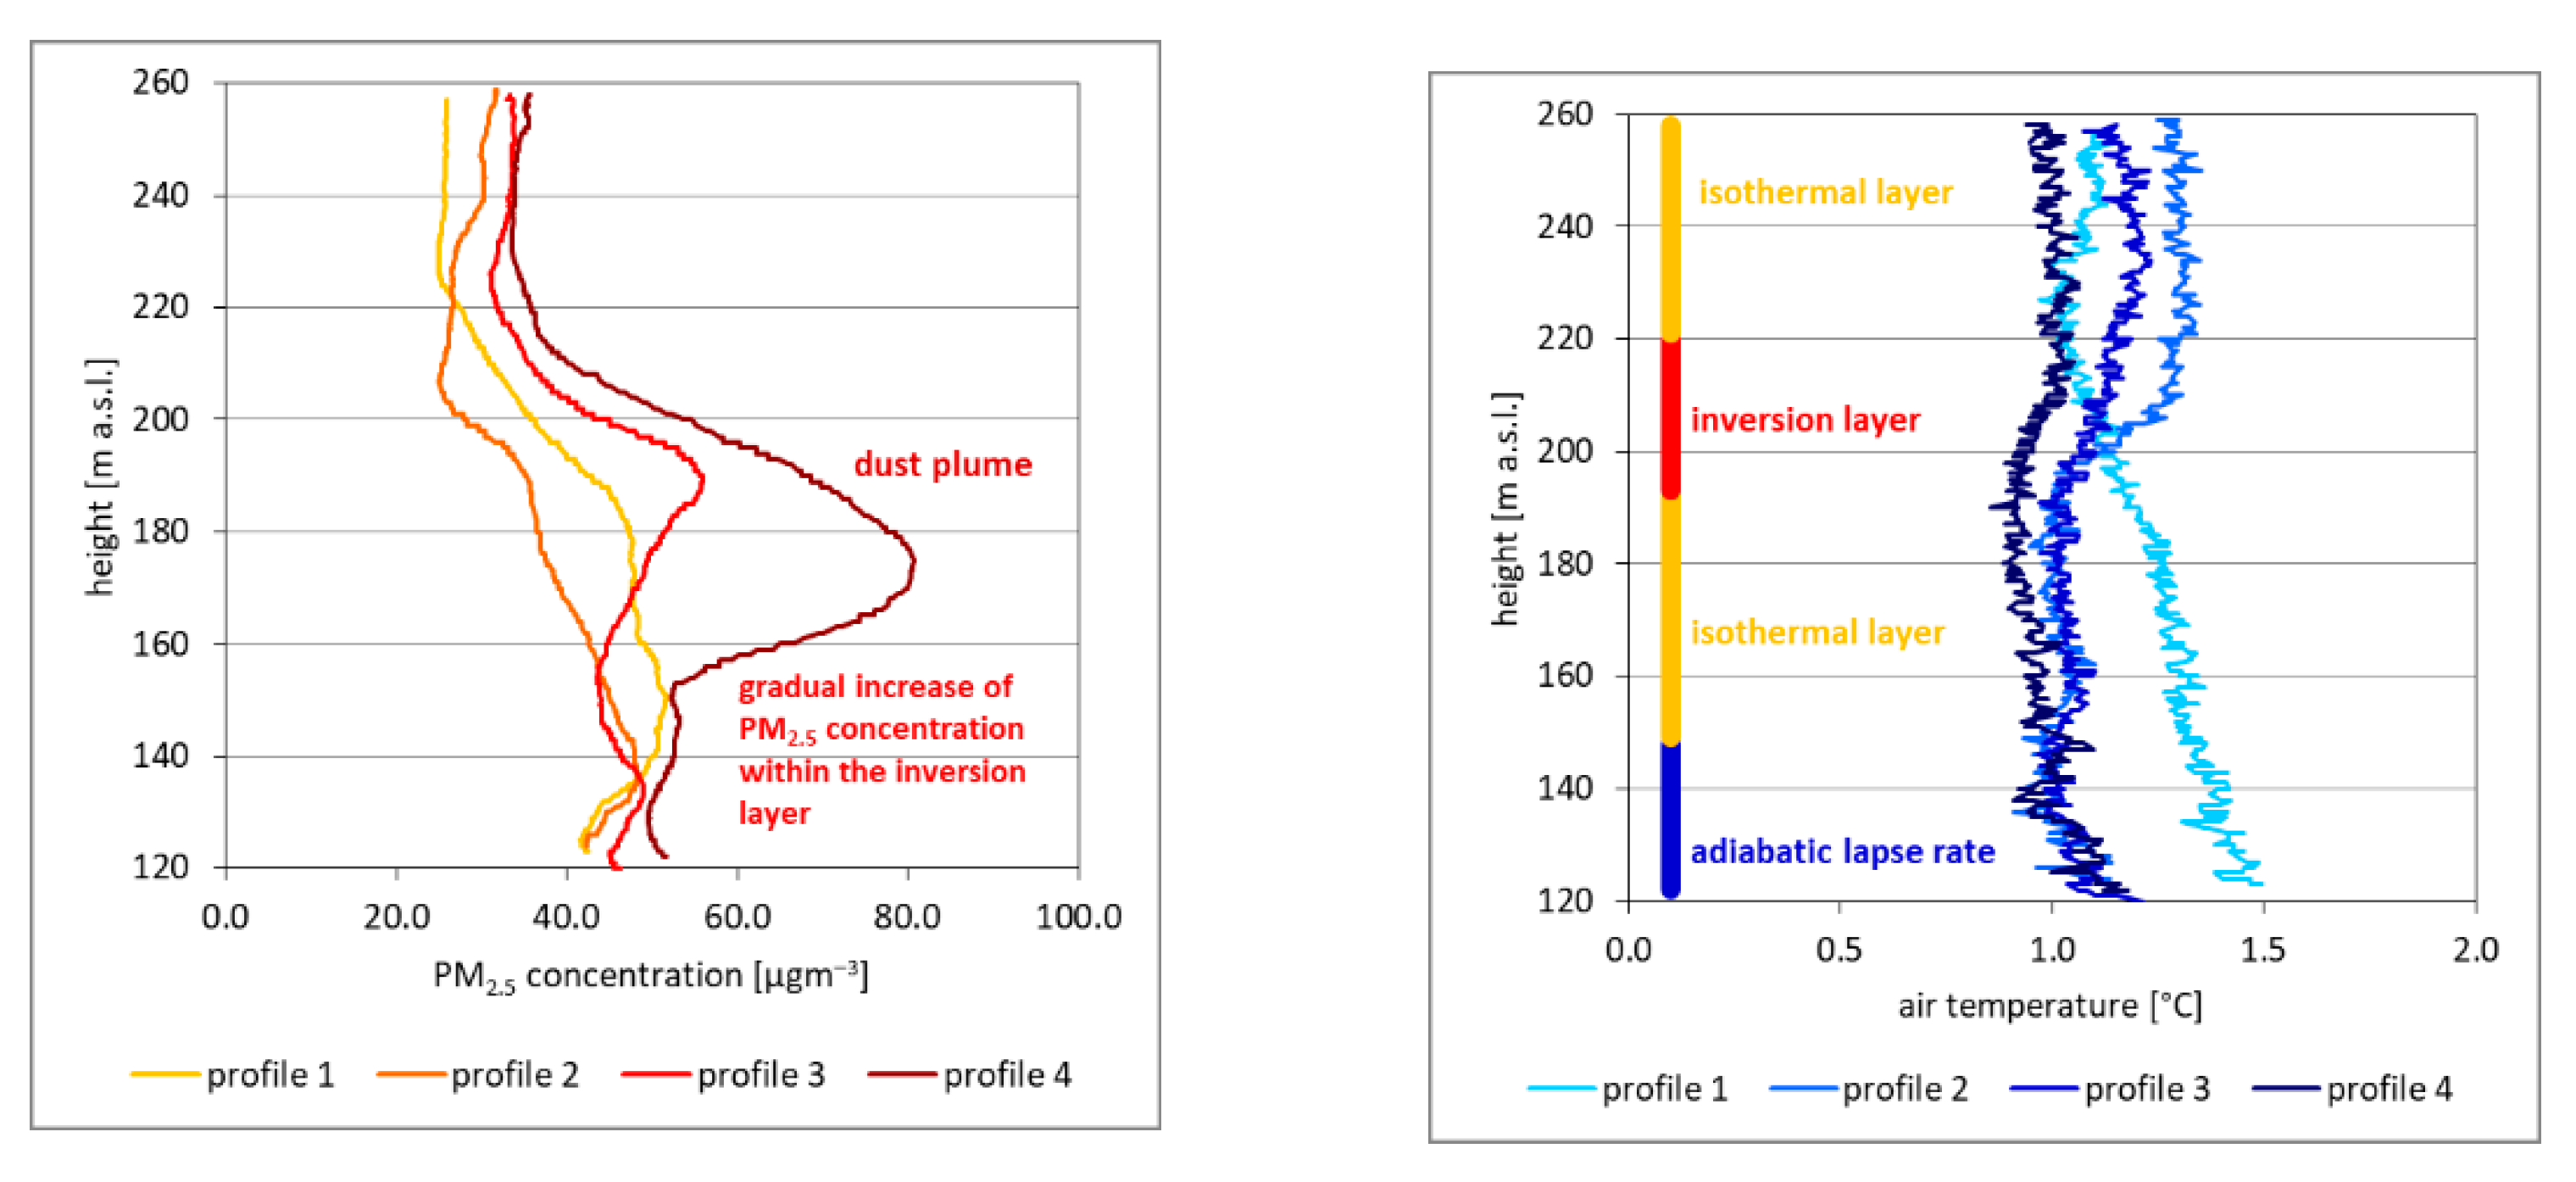
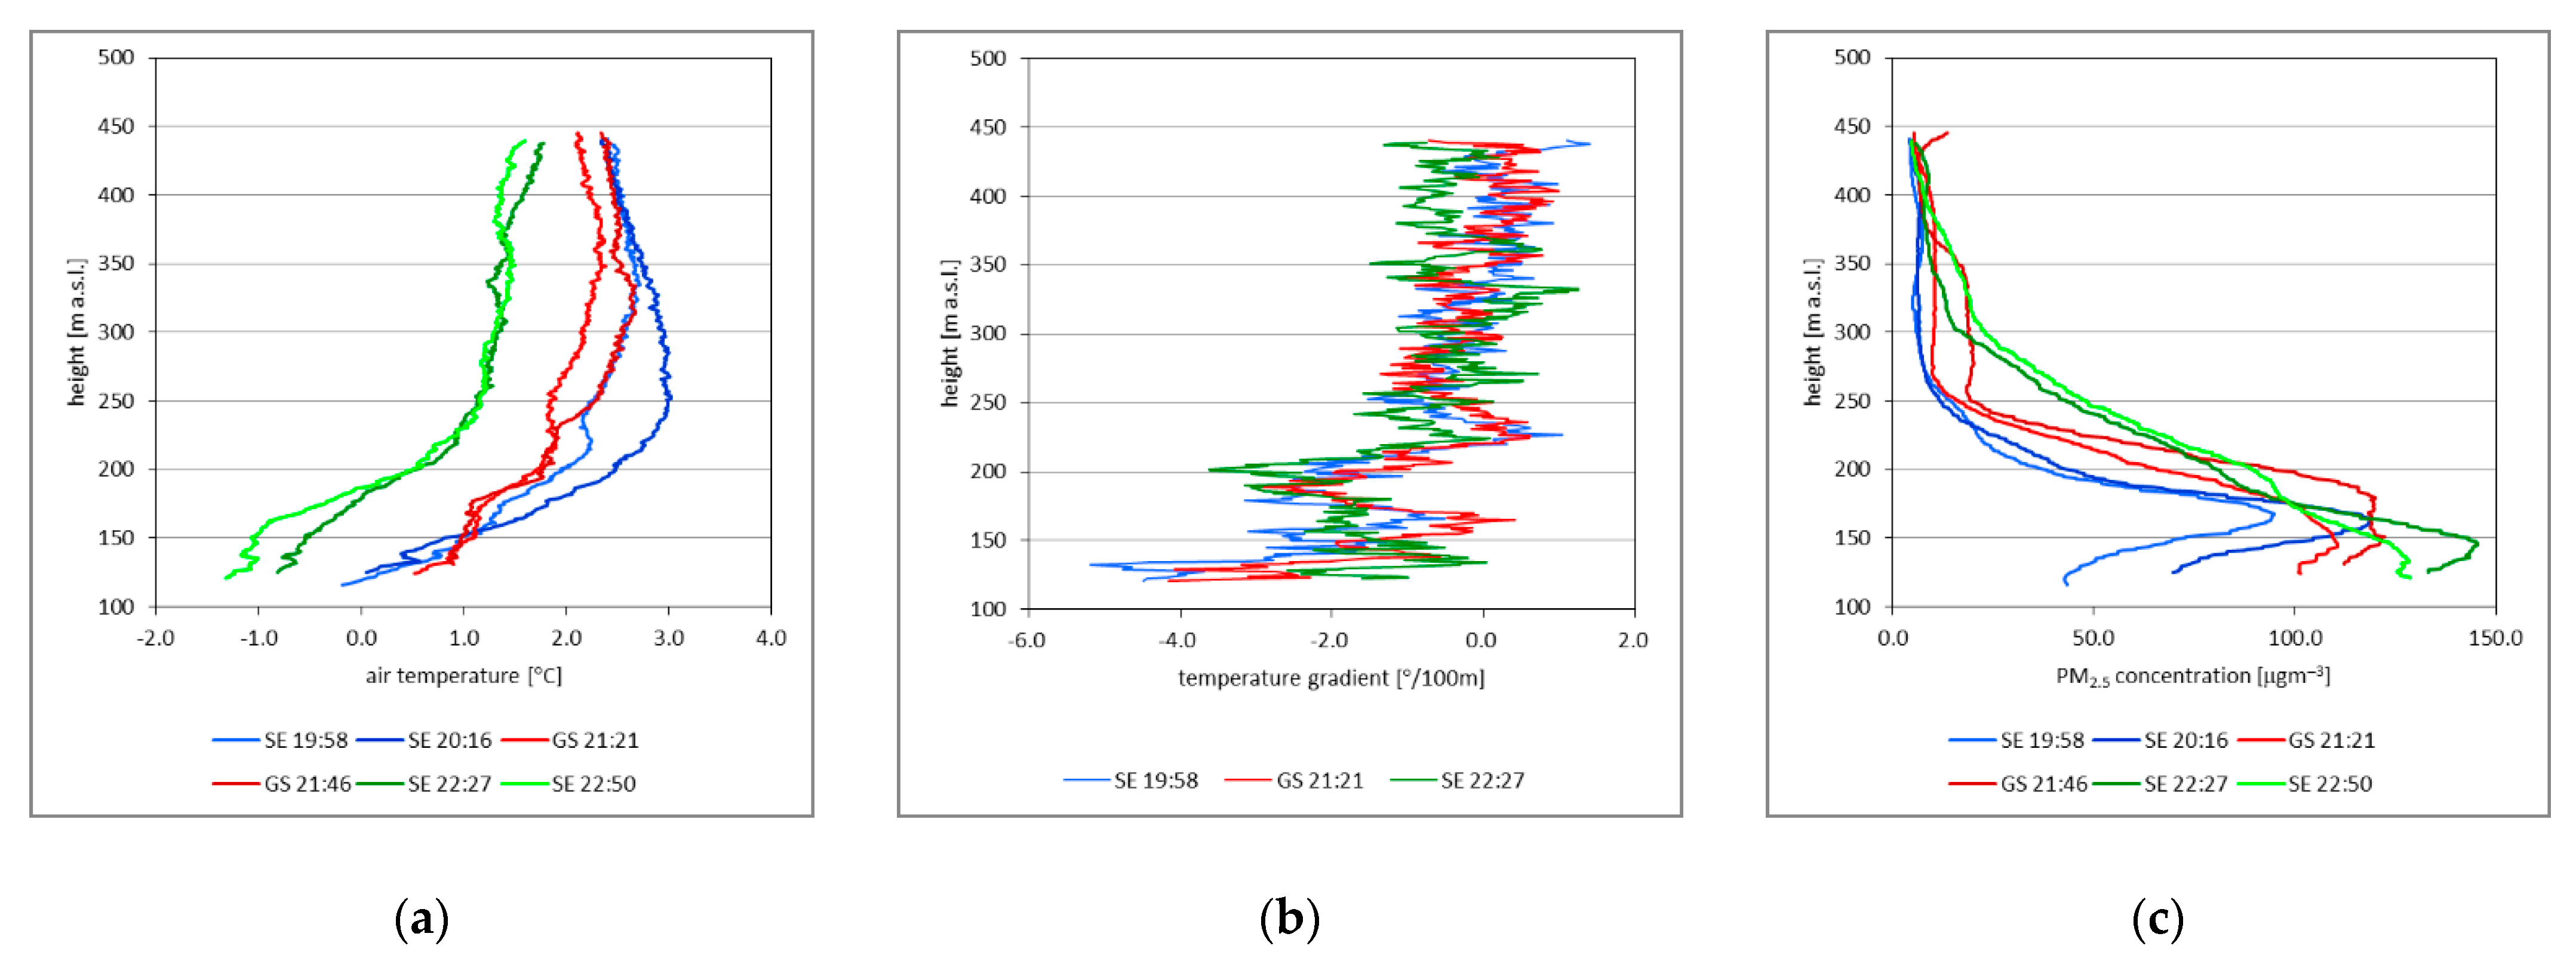
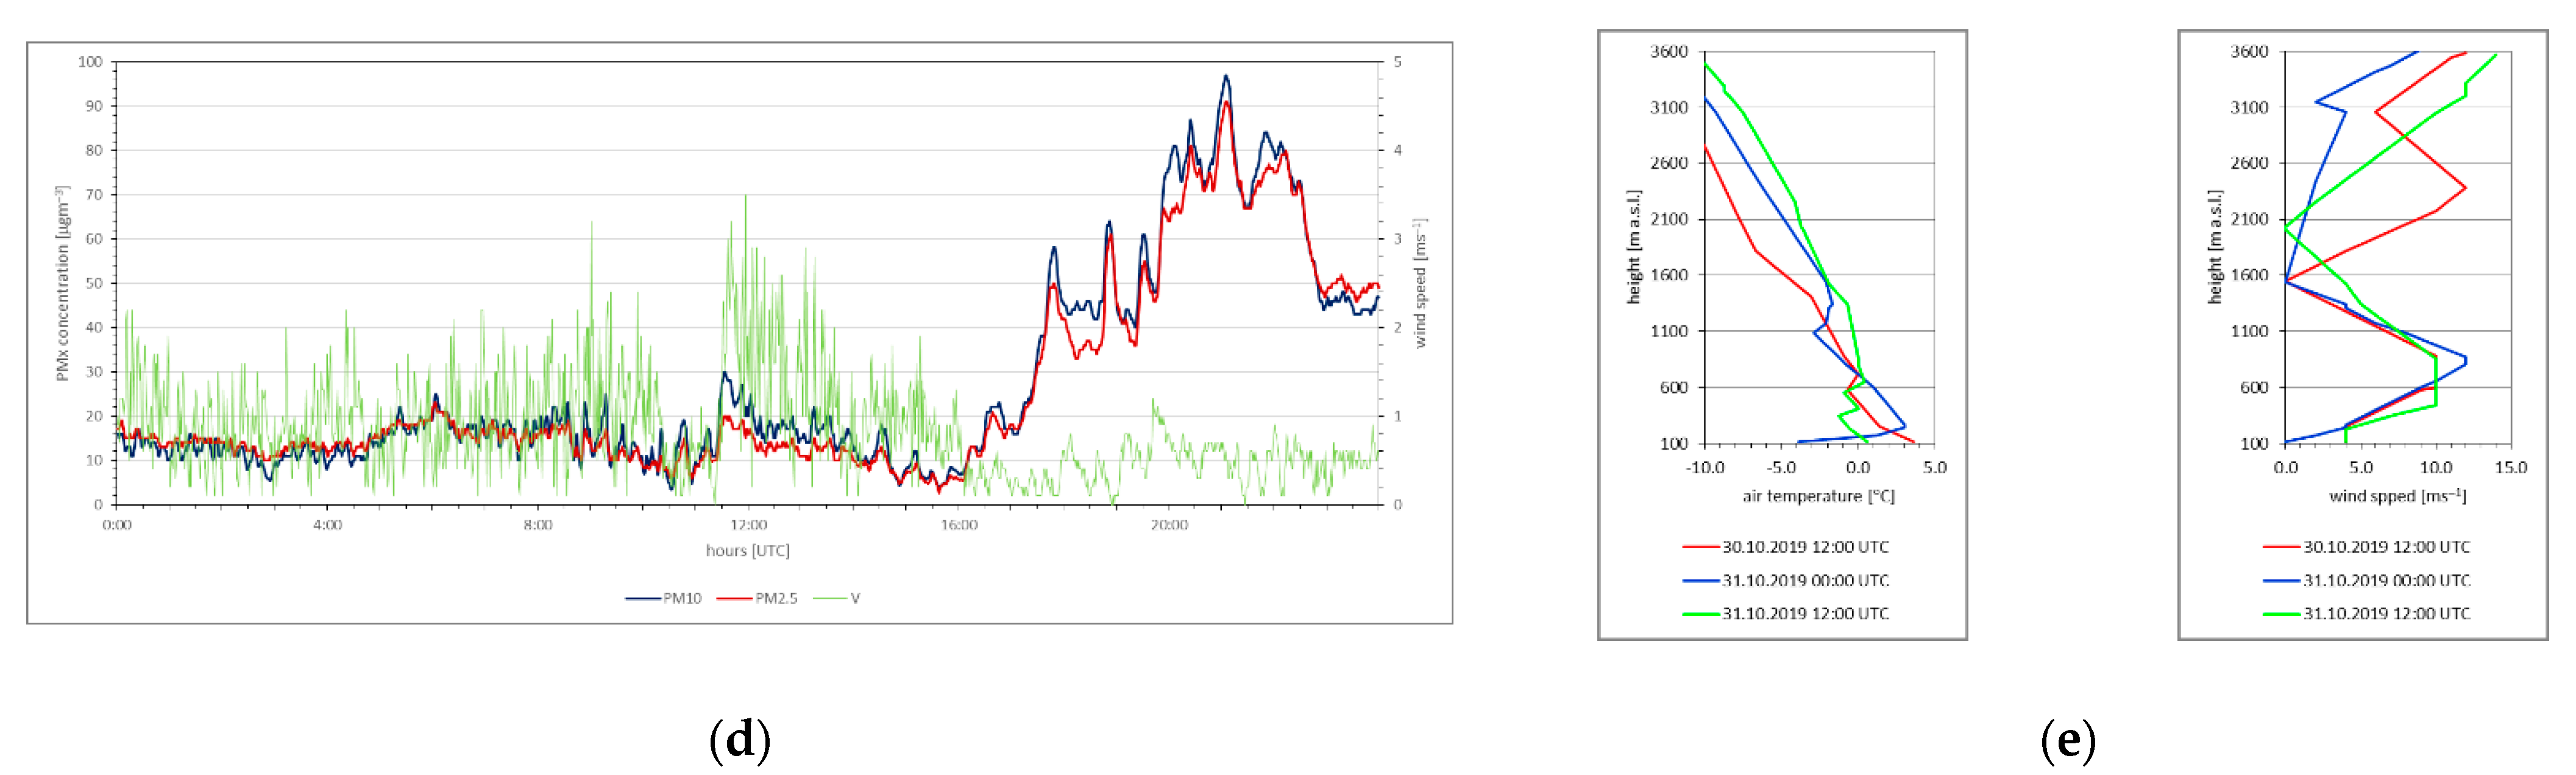
2.2.2. Vertical Measurements

Vertical transects over different types of land-use within the lowest 350 m were carried out several times during each survey in order to obtain temperature, humidity, and PM profiles. This approach allowed us to assess the vertical distribution of these variables and compare the temperature profile with acoustic sodar data (Figure 2). Due to the distortion of air caused by the rotors, only ascending flights were used for further analysis.

3. Examples Results

To assess the variability of the structure of the atmospheric boundary layer and distribution of particulate matter, we investigated in detail three selected measurement sessions. The first one was characterized by stable conditions during the night with a well-developed ground-based temperature inversion. The second one, carried out in November 2020, was characterized by a multi-layered night boundary layer with quite high dynamics. The last one, from December 2020, was conducted during the morning transition period.
The development of a stable, nocturnal boundary layer during calm wind conditions provides a gradual increase in air pollution concentration from combustion sources within the surface layer (Figure 3). After sunset, the inversion layer develops because of the steadily dropping temperature caused by the radiative cooling of the ground. Such conditions also favour very strong gradients in the pollutant profile, and maximum concentrations occur below the inversion layer, falling to almost 0 µgm−3 in the zone above the ground-based layer. As indicated by the measurements carried out in the city centre (GS profiles), the increased roughness and the modification of radiation properties of the surface contribute to the reduction in the temperature gradients within the inversion layers to about 70 m a.g.l. and the occurrence of an isothermal layer in the lower part of the ABL.
During the next field study, the concentration of PM was lower because of the less stable conditions within the night ABL. As indicated by the sodar data, the inversion was characterized by a wavy structure caused by stronger mixing processes. The course of PM concentration in the vertical profile above the two selected areas was very similar, except for the last flight. The advection of the plume from the emission sources (also visible in horizontal measurements) increased the concentration by about 20 μg m−3 (Figure 4).
During the morning hours, the dynamics of PM concentrations vary from those of the evening or night conditions. First, the breaking of the night ABL leads to the formation of strong descending flows, which may cause an increase in PM concentrations close to the ground, below the elevated inversion (Figure 5). Moreover, the development of turbulence causes both the temperature and the PM concentration gradients in the vertical profile to be remarkably diverse.

4. Discussion and Conclusions

Research on the atmospheric boundary layer involving sensors mounted on drones is an interesting alternative to traditional measurement platforms, such as profile in situ measurements or remote sensing techniques. They can be used in various environments, e.g., in polar regions, in varying terrain, or in urban areas [16,19,21].
The studies indicate, first of all, the influence of the boundary layer structure on the concentrations of pollutant and the strongly vertical variability of the parameters analyzed in the vertical profile (Figure S1), which was also confirmed in other studies [22]. The key issue to be solved is the appropriate design of the measurement system for comprehensive atmospheric studies [18], and in the case of using low-cost sensors, their proper calibration [23] to obtain reliable data with high resolution. The use of miniature solutions also allows measurements to be made up to a height of 1000 m above ground level [22]; however, it seems that from the point of view of concentration dynamics and the structure of the ABL, the lowest 300–500 m above the ground is the most important, especially in urban areas [24].
The solution presented in this article, utilizing simultaneous measurements of meteorological variables carried out according to the standards and air quality, allows for a detailed analysis of the influence of the structure of the ABL on air quality. It also complements remote sensing measurements, such as ABL sodar research. Thanks to the modular construction of the measuring head, in addition to basic equipment for measuring temperature, humidity, particulate matter, and ozone concentration, selected devices could be added depending on the scientific needs.

Supplementary Materials

The following supporting information can be downloaded at: https://www.mdpi.com/article/10.3390/ecas2022-12843/s1, Table S1: The description of the measurement campaigns; Figure S1: Whisker plots describing general characteristics of temperature (a) and particulate matter PM2.5 (b) and PM10 from drone measurements during selected field studies.

Author Contributions

Conceptualization, A.D.-O., T.S., M.K.-M., M.K. and P.M.; methodology, A.D.-O. and T.S.; analysis A.D.-O. and T.S.; writing A.D.-O., T.S. and P.M. All authors have read and agreed to the published version of the manuscript.

Funding

This research was funded within the LIFE-MAPPINAIR/PL Project.

Institutional Review Board Statement

Not applicable.

Informed Consent Statement

Not applicable.

Data Availability Statement

Datasets described as a result of this study are available on request to the corresponding author, basic meteorological data are openly available on https://opendata.meteo.uni.wroc.pl/ (accessed on 1 June 2022) from the Dpt. of Climatology and Atmosphere Protection Archive.

Conflicts of Interest

The authors declare no conflict of interest.

References

  1. World Health Organization. WHO Global Air Quality Guidelines: Particulate Matter (PM2.5 and PM10), Ozone, Nitrogen Dioxide, Sulfur Dioxide and Carbon Monoxide; World Health Organization: Geneva, Switzerland, 2021. [Google Scholar]
  2. Manisalidis, I.; Stavropoulou, E.; Stavropoulos, A.; Bezirtzoglou, E. Environmental and health impacts of air pollution: A review. Front. Public Health 2020, 8, 14. [Google Scholar] [CrossRef]
  3. Brauer, M.; Brook, J.R.; Christidis, T.; Chu, Y.; Crouse, D.L.; Erickson, A.; Hystad, P.; Li, C.; Martin, R.V.; Meng, J.; et al. Mortality–Air Pollution Associations in Low-Exposure Environments (MAPLE), Phase 1. Res. Rep. Health Eff. Inst. 2019, 2019, 203. [Google Scholar]
  4. Tian, Y.; Liu, H.; Wu, Y.; Si, Y.; Song, J.; Cao, Y.; Li, M.; Wu, Y.; Wang, X.; Chen, L.; et al. Association between ambient fine particulate pollution and hospital admissions for cause specific cardiovascular disease: Time series study in 184 major Chinese cities. BMJ 2019, 367, l6572. [Google Scholar] [CrossRef] [PubMed]
  5. Dominici, F.; Schwartz, J.; Di, Q.; Braun, D.; Choirat, C.; Zanobetti, A. Assessing Adverse Health Effects of Long-Term Exposure to Low Levels of Ambient Air Pollution: Phase 1. Res. Rep. Health Eff. Inst. 2019, 2019, 200. [Google Scholar]
  6. Wolf, K.; Hoffmann, B.; Andersen, Z.J.; Atkinson, R.W.; Bauwelinck, M.; Bellander, T.; Brandt, J.; Brunekreef, B.; Cesaroni, G.; Chen, J.; et al. Long-term exposure to low-level ambient air pollution and incidence of stroke and coronary heart disease: A pooled analysis of six European cohorts within the ELAPSE project. Lancet Planet. Health 2021, 5, e620–e632. [Google Scholar] [CrossRef]
  7. Fuzzi, S.; Baltensperger, U.; Carslaw, K.; Decesari, S.; Van Der Gon, H.D.; Facchini, M.C.; Fowler, D.; Koren, I.; Langford, B.; Lohmann, U.; et al. Particulate matter, air quality and climate: Lessons learned and future needs. Atmos. Chem. Phys. 2015, 15, 8217–8299. [Google Scholar] [CrossRef]
  8. Huang, Y.; Shen, H.; Chen, H.; Wang, R.; Zhang, Y.; Su, S.; Chen, Y.; Lin, N.; Zhuo, S.; Zhong, Q.; et al. Quantification of global primary emissions of PM2.5, PM10, and TSP from combustion and industrial process sources. Environ. Sci. Technol. 2014, 48, 13834–13843. [Google Scholar] [CrossRef] [PubMed]
  9. UNEP-CCAC. Time to Act to Reduce Short-Lived Climate Pollutants; UNEP-CCAC: Paris, France, 2014; ISBN 978-82-7701-130-1. [Google Scholar]
  10. Stull, R.B. Mean boundary layer characteristics. In An Introduction to Boundary Layer Meteorology; Kluwer, Academic Publishes: Dordrecht, The Netherlands, 1988; pp. 1–26. [Google Scholar]
  11. Aurell, J.; Gullett, B.K. Emission factors from aerial and ground measurements of field and laboratory forest burns in the southeastern US: PM2.5, black and brown carbon, VOC, and PCDD/PCDF. Environ. Sci. Technol. 2013, 47, 8443–8452. [Google Scholar] [PubMed]
  12. Lelieveld, J.; Evans, J.S.; Fnais, M.; Giannadaki, D.; Pozzer, A. The contribution of outdoor air pollution sources to premature mortality on a global scale. Nature 2015, 525, 367–371. [Google Scholar] [CrossRef] [PubMed]
  13. Wardencki, W.; Katulski, R.J.; Stefański, J.; Namieśnik, J. The State of the Art in the Field of Non-Stationary Instruments for the Determination and Monitoring of Atmospheric Pollutants. Crit. Rev. Anal. Chem. 2008, 38, 259–268. [Google Scholar] [CrossRef]
  14. Dang, R.; Yang, Y.; Hu, X.M.; Wang, Z.; Zhang, S. A review of techniques for diagnosing the atmospheric boundary layer height (ABLH) using aerosol lidar data. Remote Sens. 2019, 11, 1590. [Google Scholar] [CrossRef]
  15. Buzdugan, L.; Stefan, S. A comparative study of sodar, lidar wind measurements and aircraft derived wind observations. Rom. J. Phys. 2020, 65, 15. [Google Scholar]
  16. Lambey, V.; Prasad, A.D. A review on air quality measurement using an unmanned aerial vehicle. Water Air Soil Pollut. 2021, 232, 1–32. [Google Scholar] [CrossRef]
  17. Alvear, O.; Calafate, C.T.; Hernández, E.; Cano, J.-C.; Manzoni, P. Mobile pollution data sensing using UAVs. In Proceedings of the 13th International Conference on Advances in Mobile Computing and Multimedia, Brussels, Belgium, 11–13 December 2015; pp. 393–397. [Google Scholar]
  18. Chang, C.C.; Chang, C.Y.; Wang, J.L.; Pan, X.X.; Chen, Y.C.; Ho, Y.J. An optimized multicopter UAV sounding technique (MUST) for probing comprehensive atmospheric variables. Chemosphere 2020, 254, 126867. [Google Scholar] [CrossRef] [PubMed]
  19. Madokoro, H.; Kiguchi, O.; Nagayoshi, T.; Chiba, T.; Inoue, M.; Chiyonobu, S.; Nix, S.; Woo, H.; Sato, K. Development of Drone-Mounted Multiple Sensing System with Advanced Mobility for In Situ Atmospheric Measurement: A Case Study Focusing on PM2.5 Local Distribution. Sensors 2021, 21, 4881. [Google Scholar] [CrossRef] [PubMed]
  20. European Environment Agency. Air Quality in Europe—2019 Report. In EEA; European Environment Agency: Copenhagen, Denmark, 2019; p. 99. Available online: https://www.eea.europa.eu/publications/air-quality-in-europe-2019 (accessed on 1 June 2022).
  21. Kral, S.T.; Reuder, J.; Vihma, T.; Suomi, I.; O’Connor, E.; Kouznetsov, R.; Wrenger, B.; Rautenberg, A.; Urbancic, G.; Jonassen, M.O.; et al. Innovative Strategies for Observations in the Arctic Atmospheric Boundary Layer (ISOBAR)—The Hailuoto 2017 Campaign. Atmosphere 2018, 9, 268. [Google Scholar] [CrossRef]
  22. Lu, S.-J.; Wang, D.; Li, X.-B.; Wang, Z.; Gao, Y.; Peng, Z.-R. Three-dimensional distribution of fine particulate matter concentrations and synchronous meteorological data measured by an unmanned aerial vehicle (UAV) in Yangtze River Delta, China. Atmos. Meas. Tech. Discuss. 2016. preprint. [Google Scholar] [CrossRef]
  23. Badura, M.; Batog, P.; Drzeniecka-Osiadacz, A.; Modzel, P. Evaluation of low-cost sensors for ambient PM2.5 monitoring. J. Sens. 2018, 2018, 1–16. [Google Scholar] [CrossRef]
  24. Alaoui-Sosse, S.; Durand, P.; Medina, P.; Pastor, P.; Lothon, M.; Cernov, I. OVLI-TA: An Unmanned Aerial System for Measuring Profiles and Turbulence in the Atmospheric Boundary Layer. Sensors 2019, 19, 581. [Google Scholar] [CrossRef] [PubMed]
Figure 1. The examples of data processing and distribution of particulate matter concentration PM2.5 [μg m−3] for different height achieved during one-day campaign (red areas indicate the location of PM emission sources).
Environsciproc 19 00049 g001
Figure 2. Examples of the visual interpretation of temperature and particulate matter vertical profiles from drone measurements.
Environsciproc 19 00049 g002
Figure 3. Vertical profile of air temperature (a), environmental lapse rates (b) and PM2.5 concentration (c), diurnal distribution of PMx and wind speed (d) and vertical profile of temperature and wind speed from balloon sounding (e) (www.weather.uwyo.edu/upperair/sounding.html (accessed on 1 June 2022). Flights on 30 October 2019.
Environsciproc 19 00049 g003aEnvironsciproc 19 00049 g003b
Figure 4. Vertical profile of air temperature (a), environmental lapse rates (b) and PM2.5 concentration (c), diurnal distribution of PMx and wind speed (d) and sodar echogram (e; dark horizontal areas indicate inversion layer, so-called “spiky echoes” during day indicate convection), and results of horizontal profiling (f,g). Flights on 24 November 2020.
Environsciproc 19 00049 g004aEnvironsciproc 19 00049 g004b
Figure 5. Vertical profile of air temperature (a), environmental lapse rates (b) and PM2.5 concentration (c), diurnal distribution of PMx and wind speed (d) and sodar echogram (e; dark horizontal areas indicate inversion layer, so-called “spiky echoes” during the day indicate convection). Flights on 17 December 2020.
Environsciproc 19 00049 g005
Publisher’s Note: MDPI stays neutral with regard to jurisdictional claims in published maps and institutional affiliations.

