Proceeding Paper

A Study of Southwest Monsoon Rainfall in West Bengal and Orissa and Its Correlation with Sunspot Numbers †

by
Dhruba Banerjee
1,* and
Ramaprosad Bondyopadhaya
2
1
Department of Physics, Swami Vivekananda Institute of Science and Technology, Kolkata 700145, India
2
Mathematics Department, Jadavpur University, Kolkata 700032, India
*
Author to whom correspondence should be addressed.
Presented at the 5th International Electronic Conference on Atmospheric Sciences, 16–31 July 2022; Available online: https://ecas2022.sciforum.net/.
Environ. Sci. Proc. 2022, 19(1), 48; https://doi.org/10.3390/ecas2022-12854
Published: 25 July 2022
(This article belongs to the Proceedings of The 5th International Electronic Conference on Atmospheric Sciences)

Abstract

:
This paper presents a study of the comparison of the southwest monsoon rainfall (SWMR) over two East Coastal States of India with the sunspot number (SSN) of the solar cycle, when the SSN is 50% or more of the maximum SSN of any cycle, during 1880–2003. Firstly, it was found that in many cases the SSN of MAP has the tendency to increase with time, having an embedded oscillation of a period of 22 years (similar to double the solar cycle period). The analysis of the SWMR in those states separately or combined reveals that it is moderately influenced by solar activities, provided the SSN lies between 90 and 130. When the SSN is less than 90 it becomes too weak to influence; no definite pattern of change of SWMR appears. However, when the SSN increases from 90 to 130, SWMR tends to decrease. The SSN has an inverse significant effect on SWMR. Finally, when linear trend lines for SWMR are compared, it becomes apparent that gradients of SWMR for West Bengal are slightly positive, for Orissa are slightly negative, and are almost zero for total SWMR. This implies that, overall, there is no change in the amount of rainfall due to southwest monsoons in the combined area of West Bengal and Orissa.

1. Introduction

India in mainly an agriculture-based country, so the amount of rainfall over India is of immense importance for the maintenance of the stability of the Indian economy. Currently, the rainfall in India is mainly due to monsoons which enter India from the south-west on 1 June (vide e.g., Chakraborty and Bondyopadhaya 1988 [1]) and the covers the whole country (for roughly one month). After this, it remains active till September. We shall consider two states: West Bengal (22.57° N, 88.37° E) in the lower Gangetic plane (The Ganges is a river originating from Himalaya in the north and extending in the south through a 2500 km-long plane land) and Orissa (22.15° N, 85.5° E) in the upper Eastern Coastal part of India which is influenced very much by the southwest monsoon rainfall. However, is this rainfall affected by the solar activities which, in turn, are measured by sunspot number? This is an important question which will be dealt with here, along with some general interesting characteristic features.
The southwest monsoon rainfall (SWMR) reaches West Bengal (W.B.) and Orissa almost at the same time (7–8 June). It appears that the total monsoon rainfall during this time of season is distributed over these two states (245 thousand squar km.approx.) and their neighboring country Bangladesh (134 thousand squar km.approx.). However, there are many important investigations and analysis of MR over India, e.g., Ananta Krishnan and Gopalchari (1963) [2], Jagannathan and Bhalme (1973) [3], Chakraborty and Bondyopadhaya (1986) [4], Ananthakrishan and Parthasarathy (1984) [5], Hiremath and Mandi (2004 [6]), and Perker (1973) [7] have suggested that the SWMR over India is not entirely random. Chakraborty and Bondyopadhaya (1988) mentioned that the anomalous fluctuation of this rainfall is associated with the different phases of sunspot cycles. Hiremath (2006) [8] attempted to show that the rainfall all over India is correlated with sunspot activity, and the overall trend of rainfall variability is higher during low solar activity than that during high solar activity. In general, SWMR occurs from June to September, but July-September is the duration when SWMR is most active. In this piece of work, we shall investigate the special features of SWMR from July to September (in brief, we will call MR).
The introduction will briefly place the study in a broad context and define the purpose of the work and its significance.

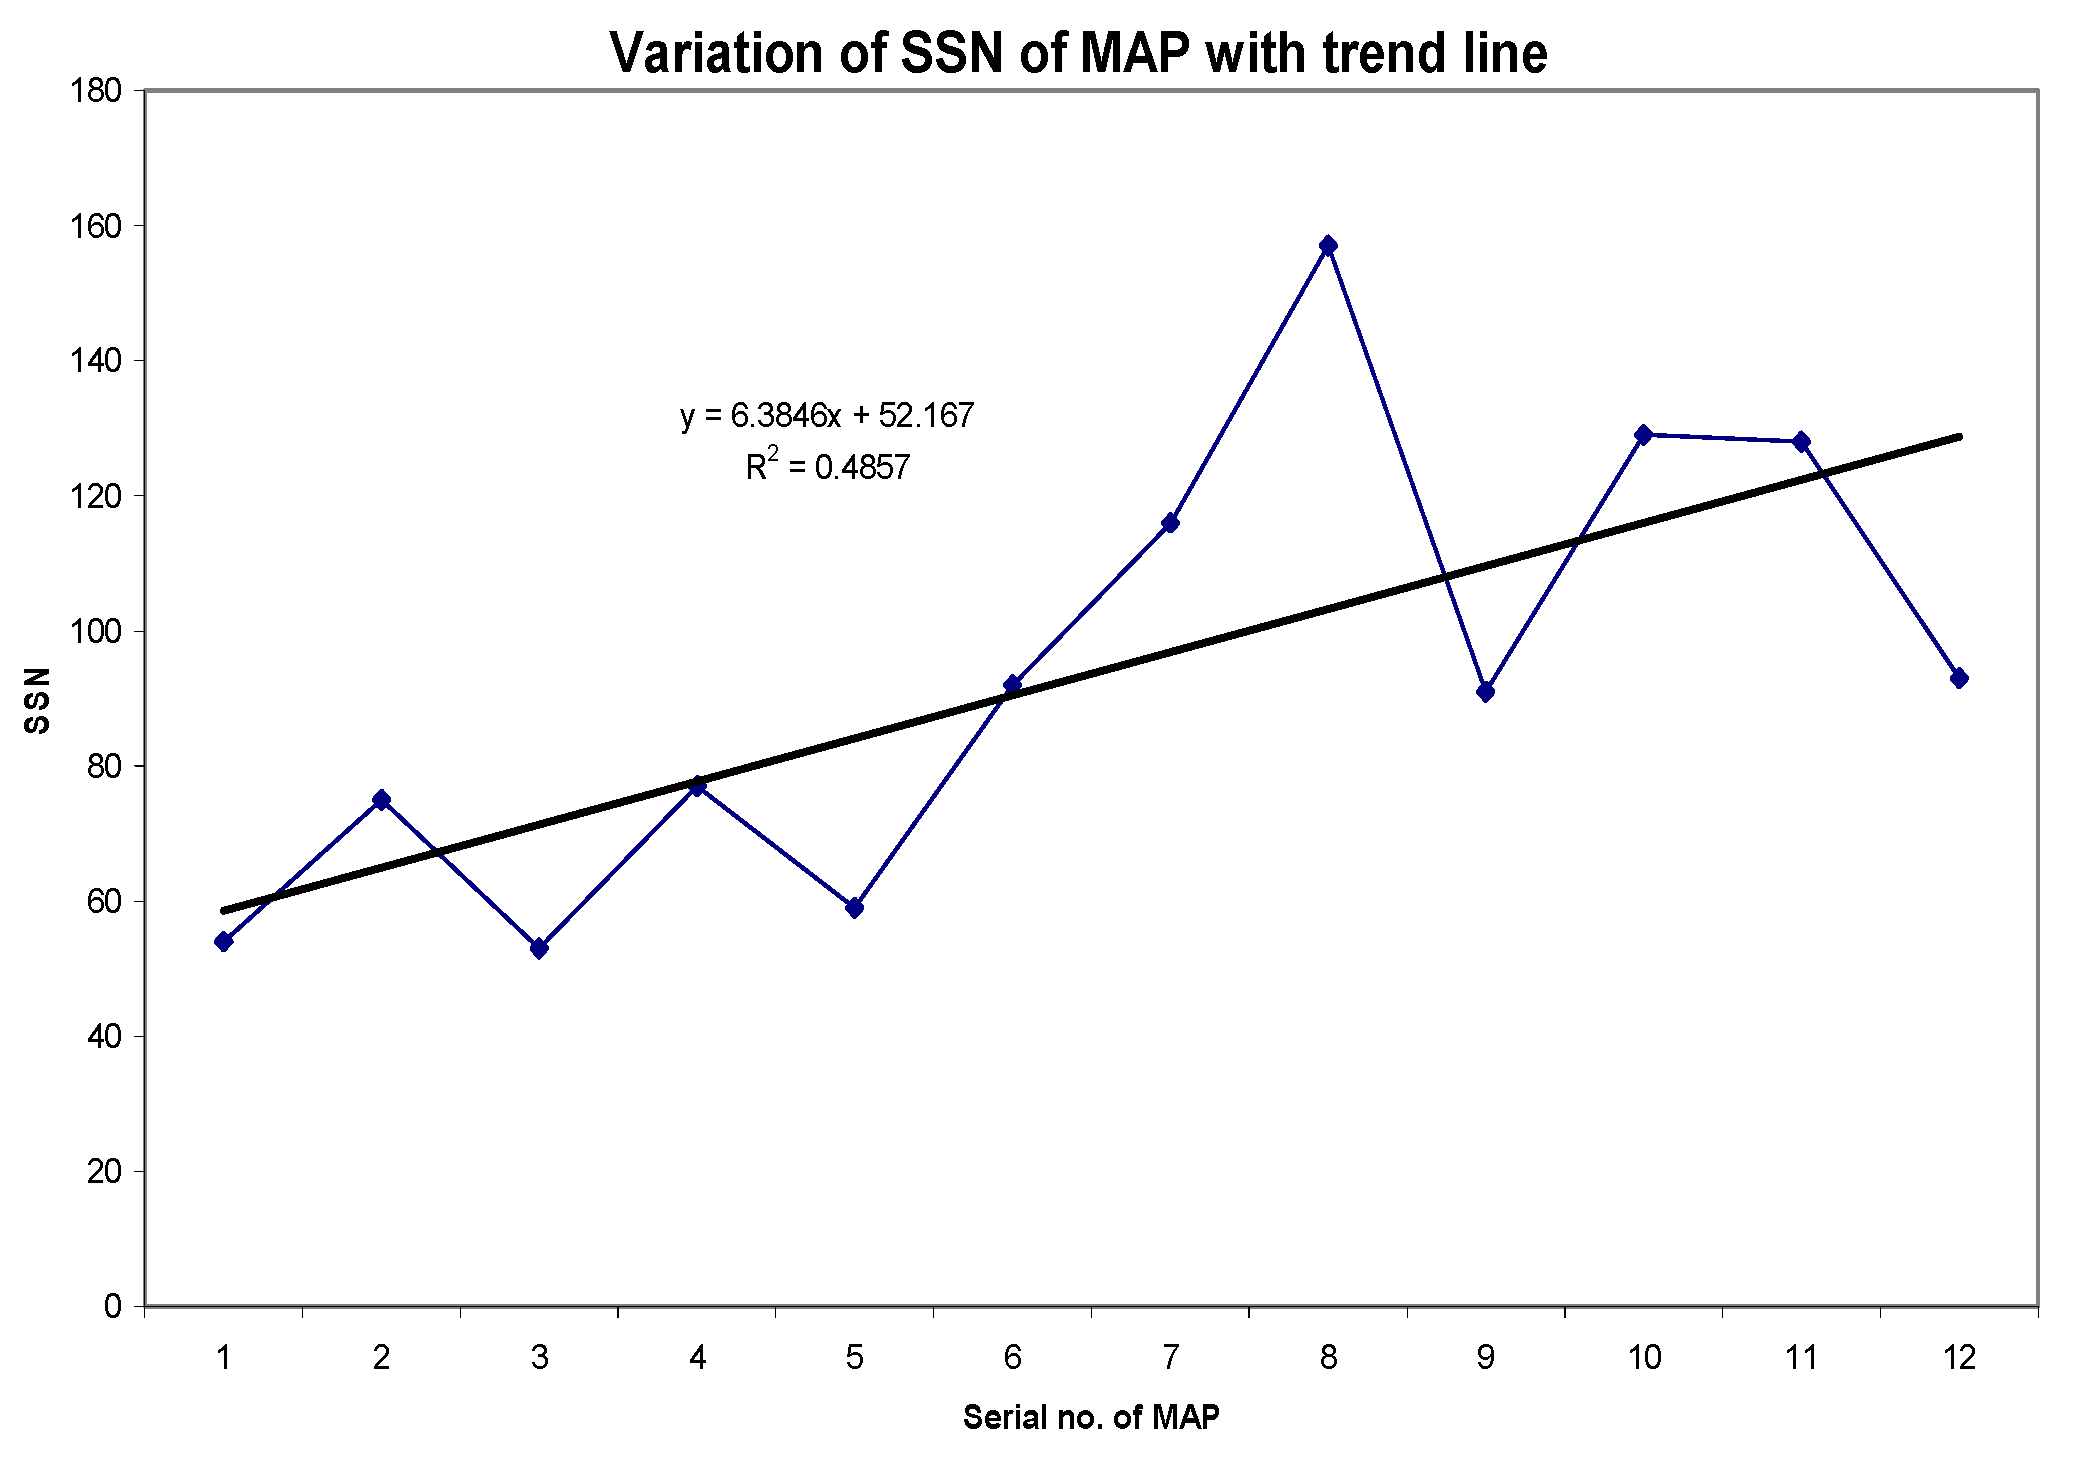
2. More Active Period (MAP) of the Solar Cycle and Its Characteristic Feature

It is well known that the occurrence of sunspots is a periodic phenomenon of 11 or 22 years, and solar wind, etc., is closely related to sunspot number (SSN). Therefore, to find any influence of solar activities on Earth it is always suggested to consider the time when sunspot numbers become comparatively higher than at other times of a cycle. This is what we consider a More Active Period (MAP), when SSNs are greater than half of the maximum SSNs in a cycle. Obviously, such times are available both before and after every solar maximum. We first identify such MAPs of solar cycles during 1880–2005 and calculate the average annual sunspot number (SSN) (vide Table 1, Colm-I). Some of the characteristic features of MAP are the following: the average value of SSNs during MAP oscillatedfrom1880–1946 at every alternate MAP, i.e., at the interval of 22 years. In fact, SSN reached its maximum in 1946 and then increased until 1960. After this, the time-average SSN again oscillated. However, the overall trend of SSN with time is positive (with a correlation coefficient of 0.7) as shown in Figure 1. It is interesting to note that SSN was always greater than 90 after 1946 (except in 1949 when it was 84), but it was never greater than 90 before1946 (except in 1917 when it was 104).

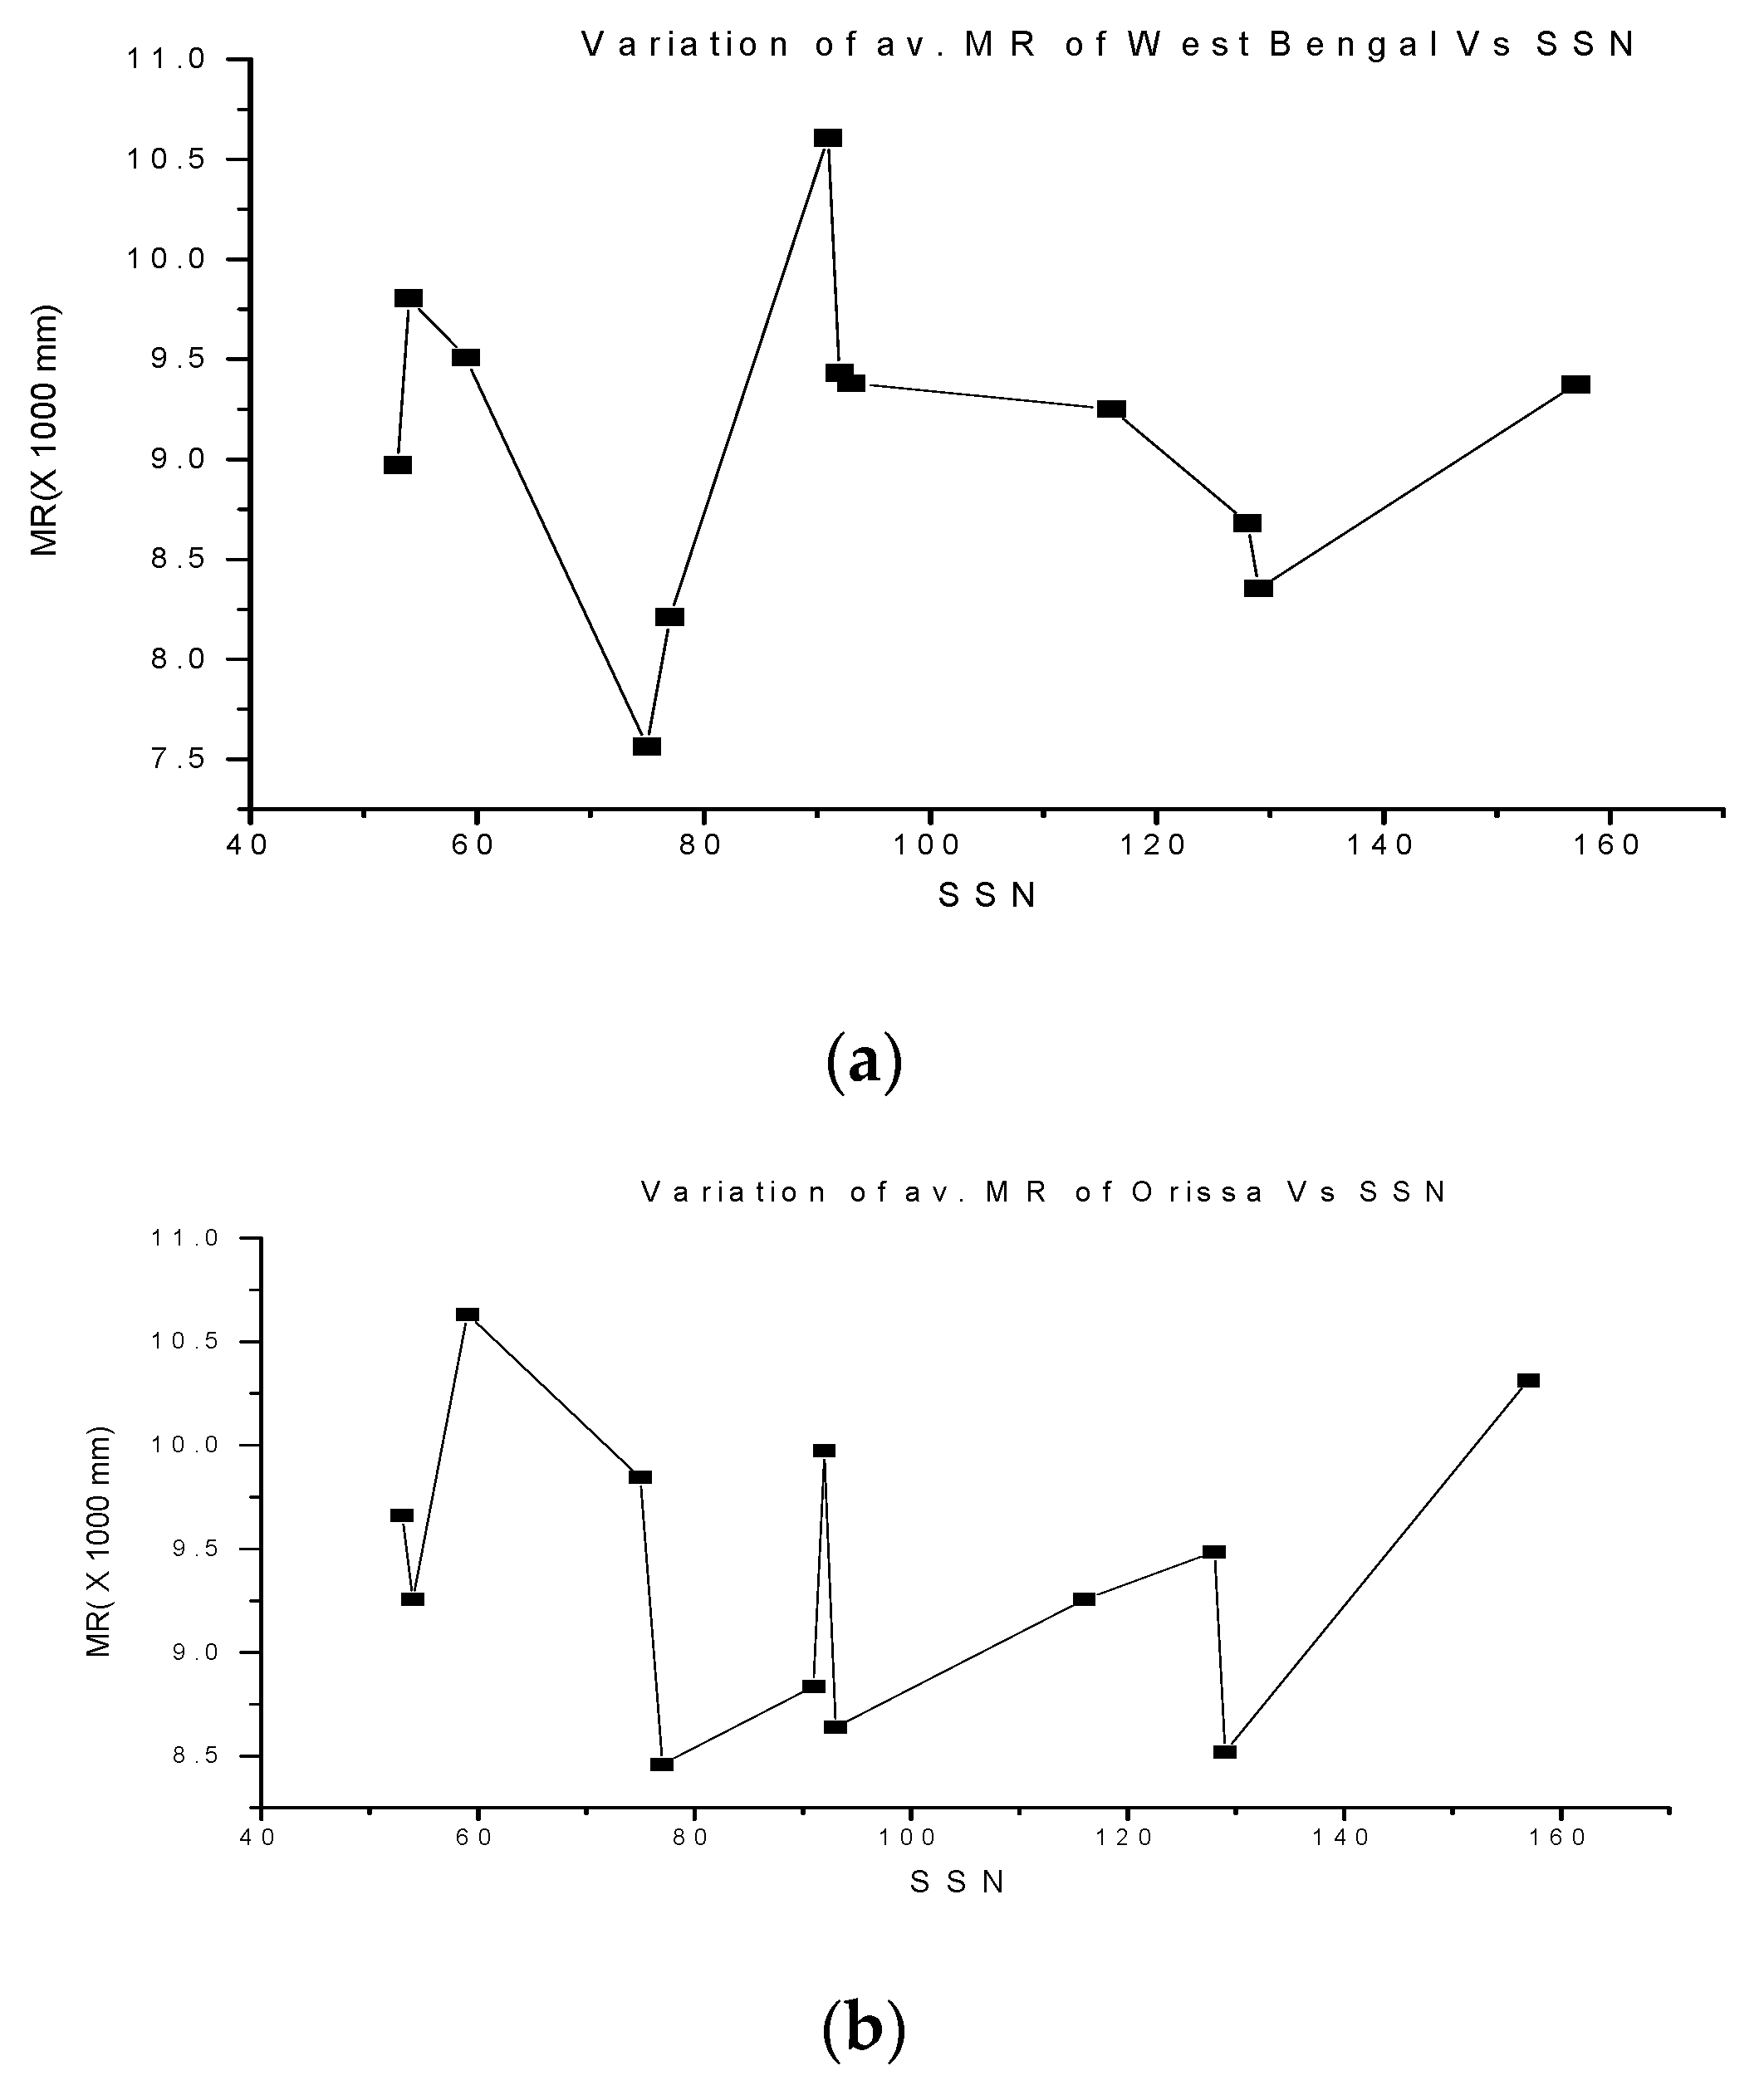
3. Variation of MR for Different Range of SSN

We now investigate the characteristic variations of MR in W.B. & Orissa during MAPs of solar cycles. From Figure 2a, where MR vs. SSN have been plotted, we can observe that MR in West Bengal fluctuates when the SSN varies from 50 to 90. (Hiremath 2006 [4]) made a similar remark on the low value of SSN and thereafter declines when the SSN exceeds 90, until it exceeds 130, after which it increases again. However, the same rainfall fluctuates when SSN varies from 50 to 80. A similar feature is observed for MR in Orissa (Figure 2b) although there exists a slight fluctuation for SSN lying between 90 and 130 and close to 90. Finally, when the SSN exceeds 130, MR in Orissa begins to increase. This trend is also present for the total MR in W.B. and Orissa (See Figure 2c).
Thus, it appears that MR is an oscillating function of SSN. When SSN increases from 0 to 90, and then slowly decreases as the SSN increases from 90 to 130. Almost similar observations have been made by Chakraborty and Bondyopadhaya (1988) or the temperature over Eastern India. Let us now compare the MR of W.B. and Orissa during 1880–2003 (see Figure 3). In the early two stages the peaks in MR in W.B. and Orissa are in opposite phases, but after the forth to seventh solar cycle the phases become more or less similar. In the eighth cycle the phases of MR for these two are slightly shifted. In the last two solar cycles, namely, the eleventh and twelfth, the same opposite nature of MR in W.B. and Orissa is it was in the first two cycles. In general, the average rate per year of MR in Orissa (9407 mm) is more than that of W.B by 10%. During the middle of 4th to 5th cycles up to 9th to 10th cycles ( i.e., from 1925 to 1975) approximately, the MR in W.B and Orissa remained greater than average.

3.1. Correlation

If we calculate the correlation coefficient between MR of the MAP for all values of SSN of MAP, we find it is extremely small (−0.067). However, if we calculate the correlation coefficient between MR and the SSN of MAP when it was 30–89, we find it is still very small (−0.077). Nonetheless, the correlation coefficient becomes −0.44 when 90 < S < 116. Clearly, we have found there is the an existence of some critical range of SSN, after which SSN starts to inversely influence on southwest monsoon rainfall (Table 2).

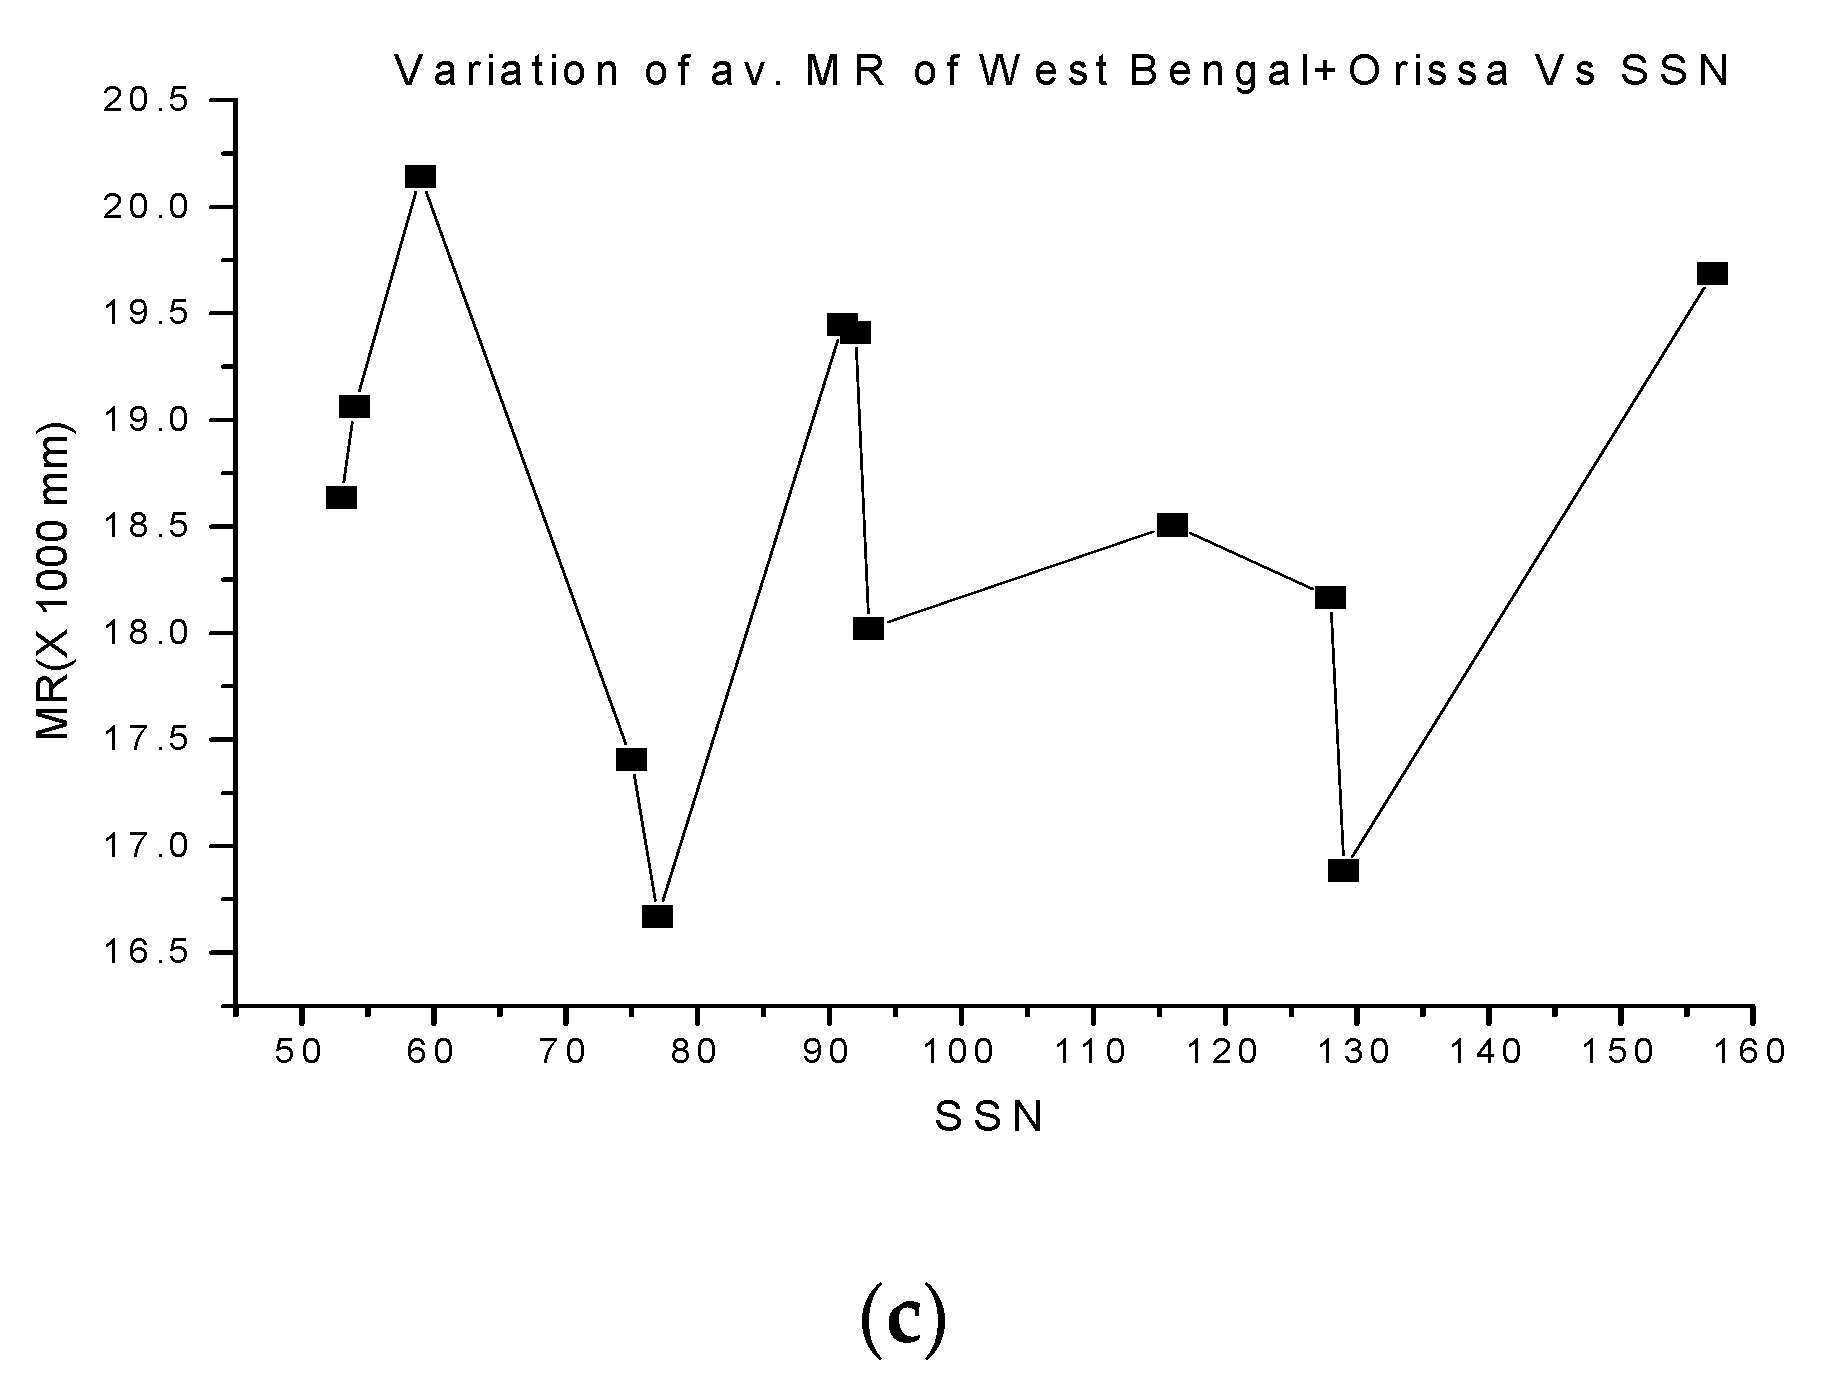
3.2. Critical Range of SSN

It has been observed that small SSNs (00–90) are not capable of influencing MR, but beyond the SSN value of 90, MR appears to decrease until SSN becomes 130, then it begins to increase. Therefore, in every likelihood there exists a critical range of SSN where MR behaves in a regular pattern (here MR decreases). In fact, the existence of such critical range of SSN has also been observed for other meteorological parameters (Chakraborty and Bondyopadhaya 1986, 1988). If we write
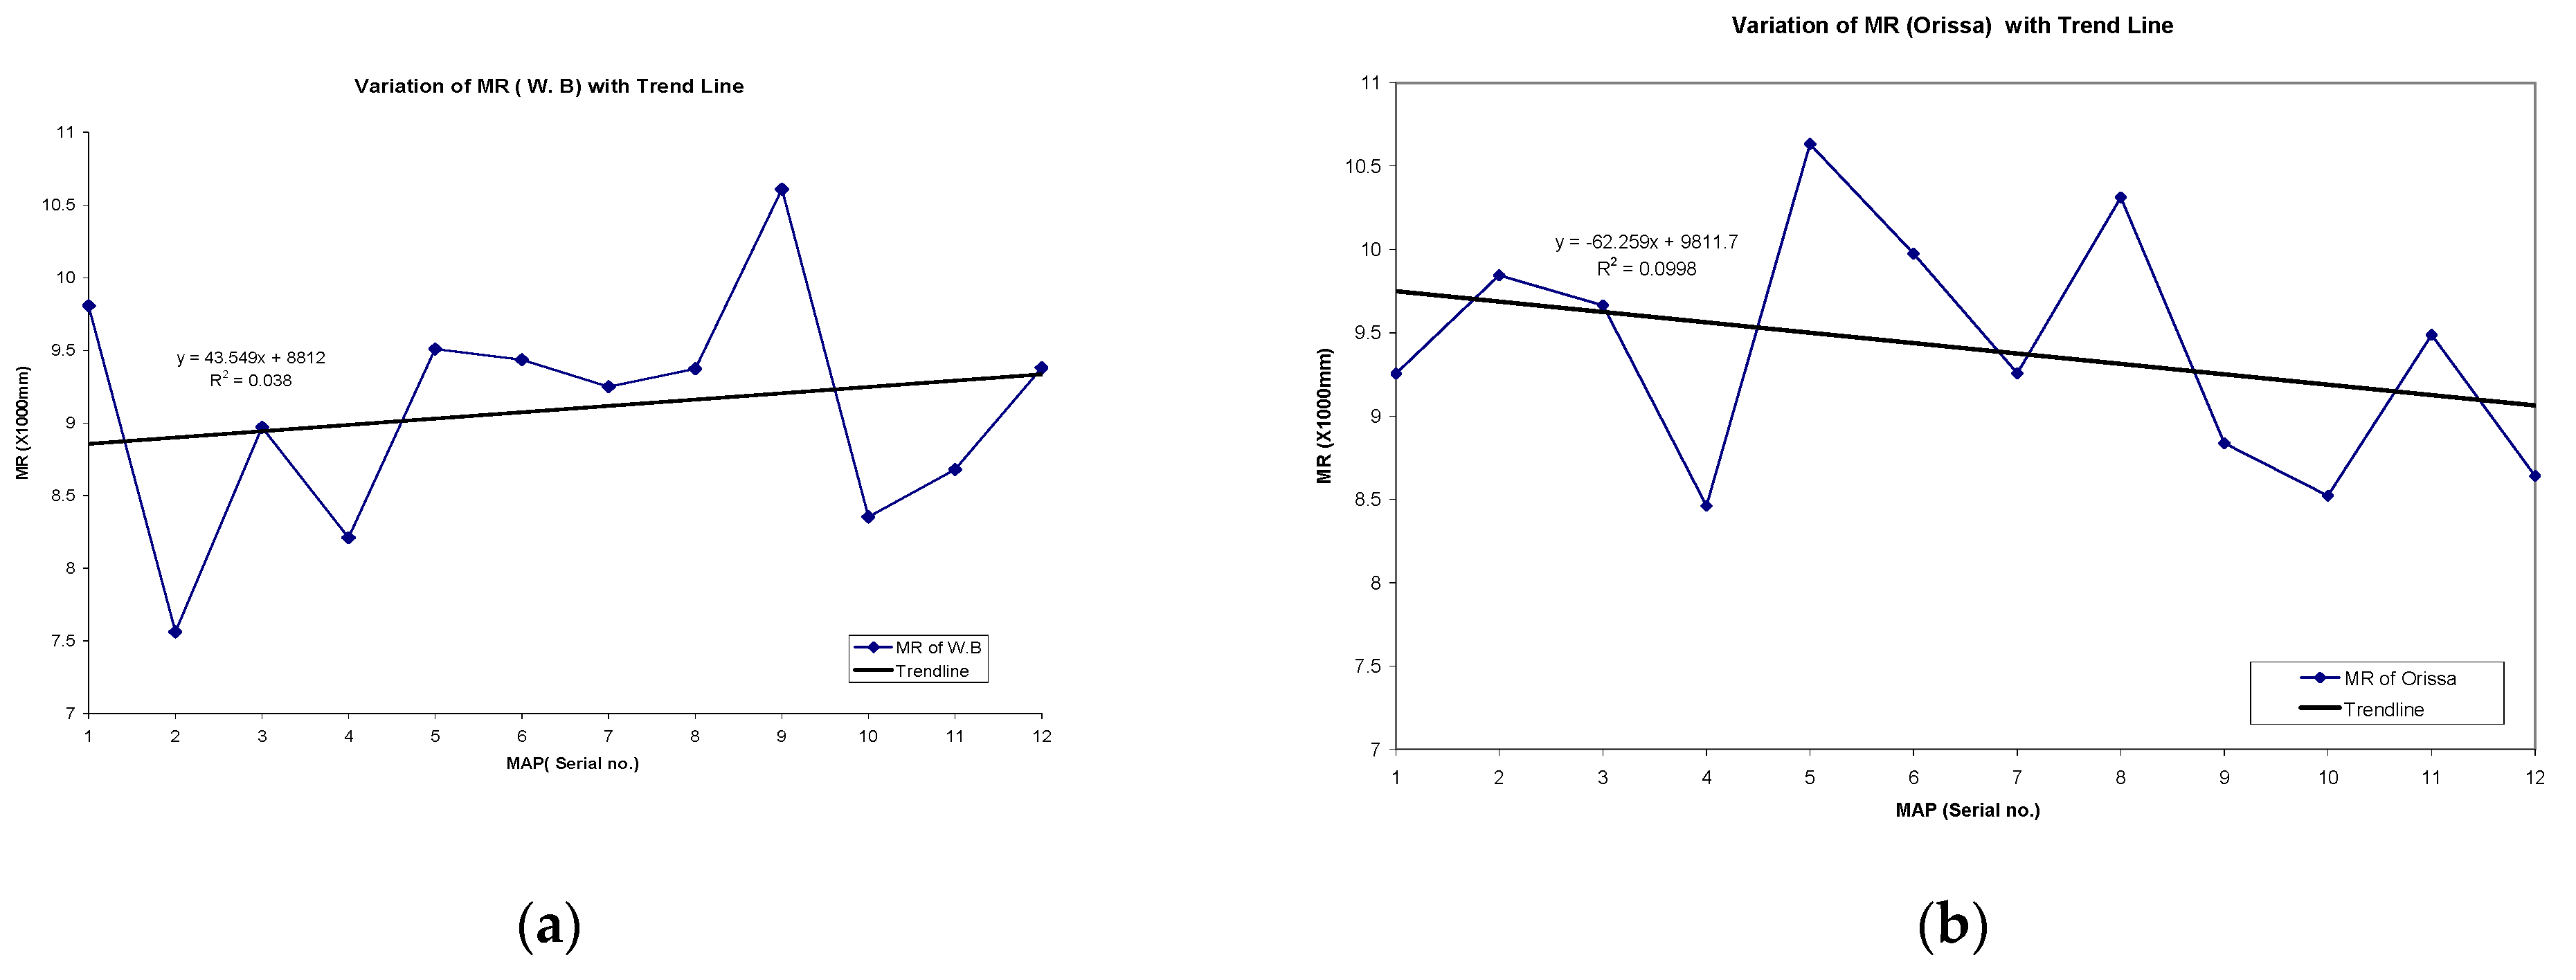
  • R = Southwest monsoon rainfall from July–September over W.B. and Orissa
  • S = Annual sunspot number
Then the above results can be expressed as
  • dR/dS < 0 when 90 < S < 130,
  • =fluctuating when S < 90,
  • >0 when S > 130
We can also observe that when the SSN exceeds 90 and is much greater than the critical range, solar influence appears to be of an inverse nature.

4. Conclusions

In this study we have discussed a correlative analysis of data over 124 years (1880–2003) on the sunspot and the monsoon rainfall over the Eastern Coastal (West Bengal and Orissa) part of India. From this study the significant conclusions are:
  • The MR over West Bengal and Orissa is not affected by the sunspot number until it reaches a critical range of SSN near 90. After that, the amount of MR decreases with the increase of SSN from 90 to the critical range of value near about 130, beyond which a reverse effect may occur.
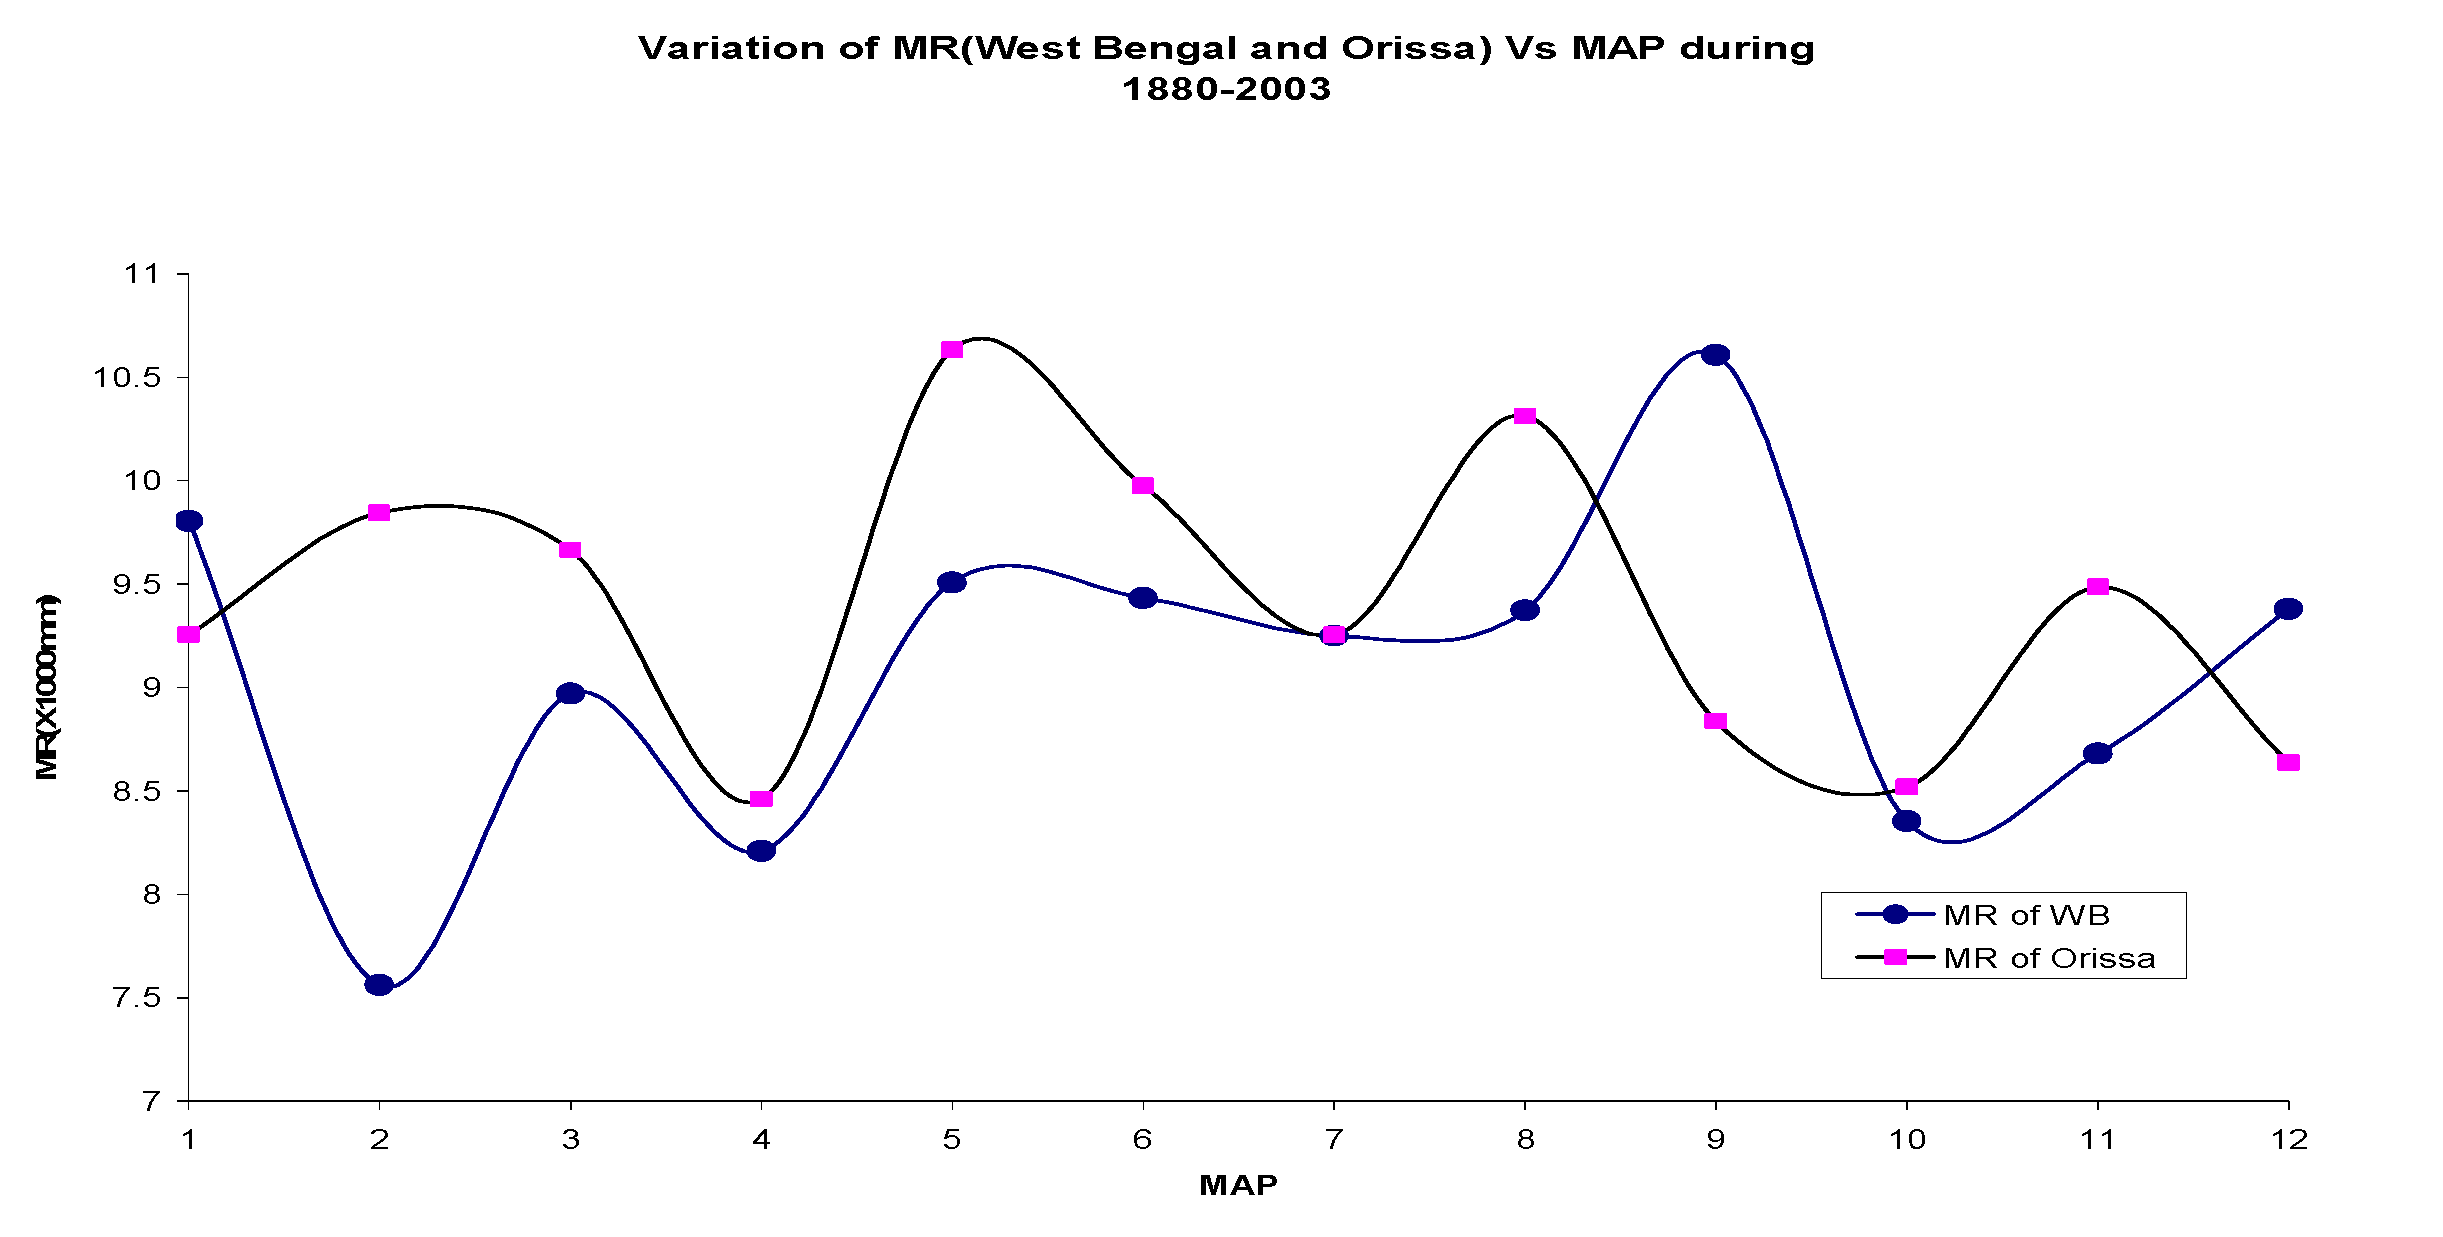
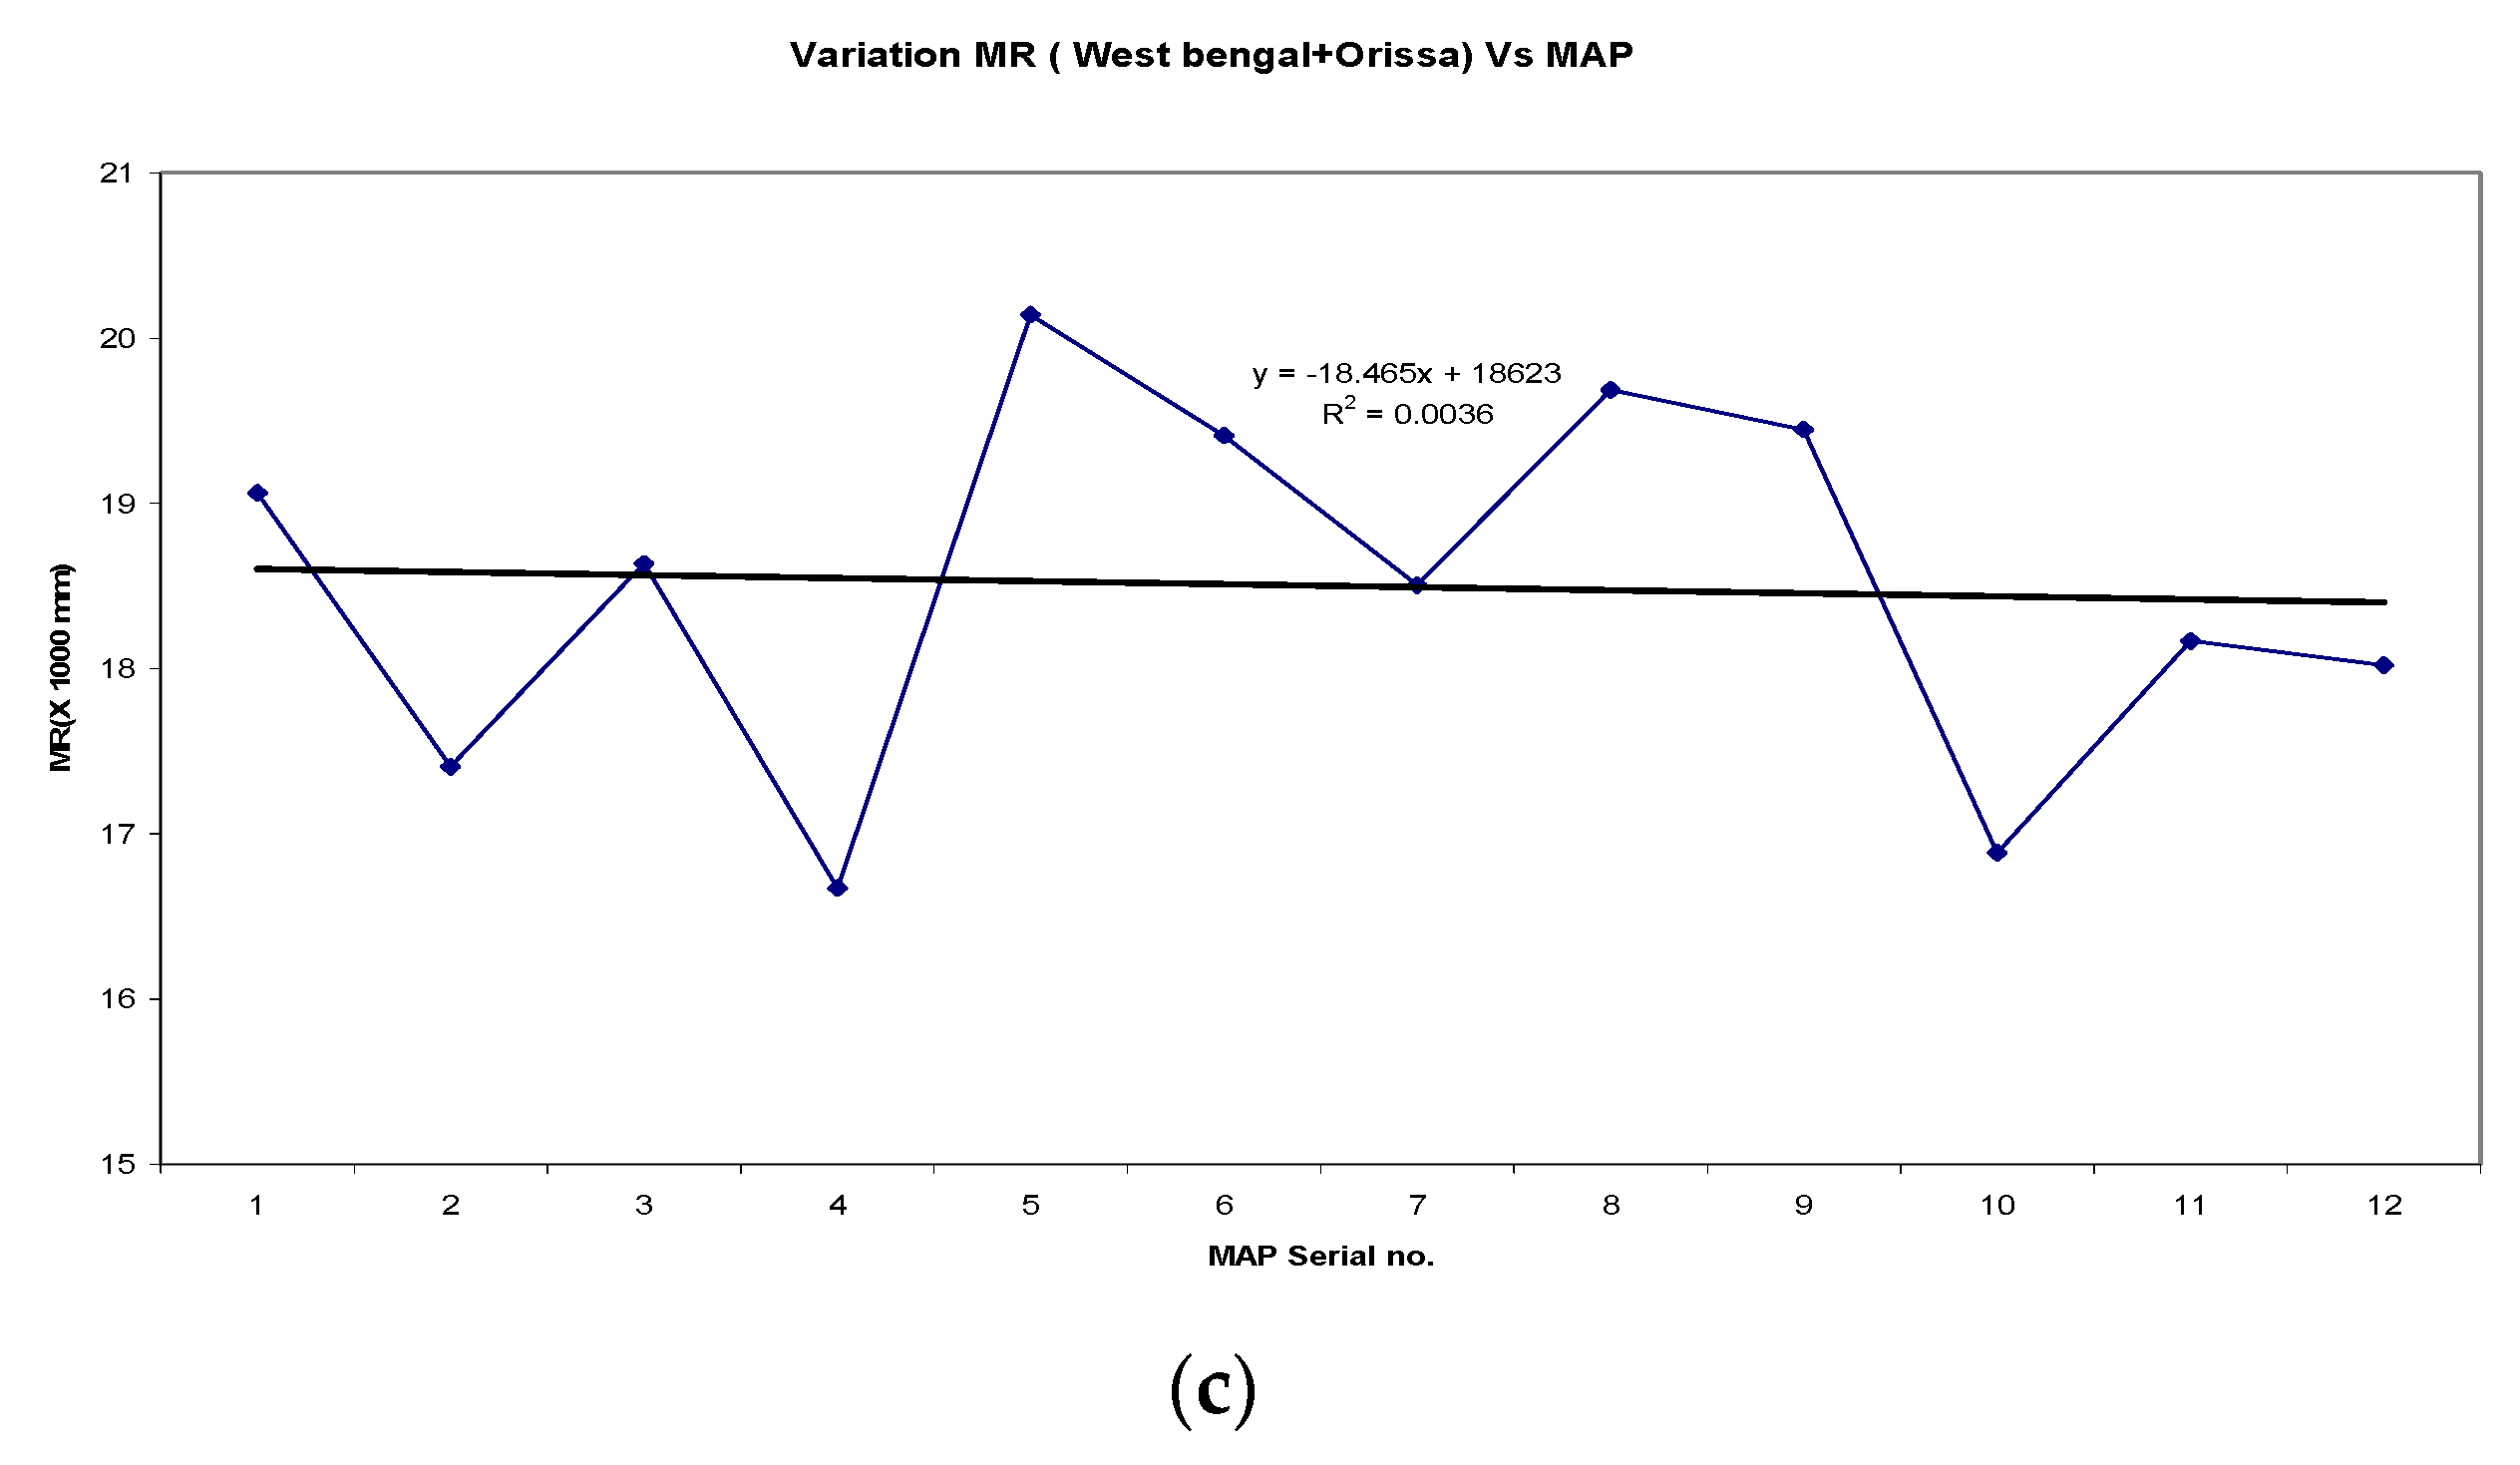
  • The total MR of West Bengal and Orissa has not changed during 1880–2003, i.e., with the temporal variation of the MAP (More Active Period) (Figure 4). This means that the change of MR in one state might have been compensated by another state.

Author Contributions

The conceptualization part was suggested by R.B., who is the co-author of this paper. D.B. found the methodology, use different software and do formal analysis here. Finally do the original draft preparation. D.B. also did writing, review and editing. All authors have read and agreed to the published version of the manuscript.

Funding

This research received no external funding.

Institutional Review Board Statement

Not applicable.

Informed Consent Statement

Not applicable.

Data Availability Statement

Indian Meterological Department data has been used in this paper.

Conflicts of Interest

The authors declare no conflict of interest.

References

  1. Bondyopadhaya, R.; Chakraborty, P.K. 1988 Variation of Pre-Monsoon Temperature Eastern India and the Solar activity. Proc. Indian Natl. Sci. Acad. 1988, 54A, 106–113. [Google Scholar]
  2. Anantakrishna, R.; Gopalchari, S. Pattern of Monsoon rainfall Distribution Over India and Neighborhood. In Proceedings of the Symposium on Tropical Meteorology, Rotorua, New Zealand, 5–13 November 1963. [Google Scholar]
  3. Jagannathan, P.; Bhalme, H.N. Change in the pattern of distribution of Southwest Monsoon Rain Fall over India associated with Sunspot. Mon. Weath. Rev. 1973, 101, 691–700. [Google Scholar] [CrossRef]
  4. Chakraborty, P.K.; Bondyopadhaya, R. Solar effect on Rainfall in West Bengal. Mausam 1986, 37, 251–258. [Google Scholar] [CrossRef]
  5. Ananthakrishnan, R.; Parthasarathy, B. Indian rainfall in relation to the sunspot cycle: 1871–1978. J. Climatol. 1984, 4, 149–169. [Google Scholar] [CrossRef]
  6. Hiremath, K.M.; Mandi, P.I. Influence of solar activity on the Indian Monsoon rainfall. New Astron. 2004, 9, 651–662. [Google Scholar] [CrossRef]
  7. Parker, E.N. Sunny side of global warming. Nature 1999, 399, 416. [Google Scholar] [CrossRef]
  8. Hiremath, K.M.J. Influence of solar activity on the rainfall over India. J. Astrophys. Astr. 2006, 9, 651. [Google Scholar]
Figure 1. Variation Sunspot number and More active period.
Environsciproc 19 00048 g001
Figure 2. Variation of average monsoon rain fall of West Bengal and Orissa with Sunspot number.
Environsciproc 19 00048 g002aEnvironsciproc 19 00048 g002b
Figure 3. Variation of MR (West Bengal + Orissa) and MAP during 1880–2003.
Environsciproc 19 00048 g003
Figure 4. Variation of Monsoon Rain fall (MR) and More active period (MAP).
Environsciproc 19 00048 g004aEnvironsciproc 19 00048 g004b
Table 1. Sunspot number (SSN) of MAP and corresponding monsoon rainfall (MR) over West Bengal, Orissa, and combined.
Group No. of MAPAverage Sunspot No.MR of West BengalMR of OrissaTotal MR
(WB + Orissa)
1549807925519,062
2757563984417,407
3538971966418,635
4778210846116,671
559950810,63320,141
6929434997619,410
71169250925618,506
8157937410,31319,687
99110,604883719,446
101298354852016,804
111288681948618,167
12939380863918,019
Table 2. Correlation coefficient for different ranges of SNN.
SSN RangeC.C
30–190−0.067
30–89−0.077
90–130−0.44
Publisher’s Note: MDPI stays neutral with regard to jurisdictional claims in published maps and institutional affiliations.

