Proceeding Paper

Particulate Matter (PM2.5) Concentration Forecasting through an Artificial Neural Network in Port City Environment †

by
Bárbara A. Macías-Hernández
1,*,
Edgar Tello-Leal
1,
Ulises Manuel Ramirez-Alcocer
2 and
Jaciel David Hernandez-Resendiz
2
1
Faculty of Engineering and Science, Autonomous University of Tamaulipas, Victoria 87000, Mexico
2
Multidisciplinary Academic Unit Reynosa-Rodhe, Autonomous University of Tamaulipas, Reynosa 88779, Mexico
*
Author to whom correspondence should be addressed.
Presented at the 5th International Electronic Conference on Atmospheric Sciences, 16–31 July 2022; Available online: https://ecas2022.sciforum.net/.
Environ. Sci. Proc. 2022, 19(1), 31; https://doi.org/10.3390/ecas2022-12856
Published: 25 July 2022
(This article belongs to the Proceedings of The 5th International Electronic Conference on Atmospheric Sciences)

Abstract

:
This study aims to analyze maritime traffic’s effect on air quality through multiple regression analysis using recurrent neural networks (RNN), allowing one to forecast the daily concentration of PM2.5. The data set used the hourly average of the pollutant concentration levels and meteorological factors from 1 May 2021 to 31 January 2022, and the entry and exit of cargo ships and petroleum tankers to the port area in the same range of dates. The regression model based on the ANN reaches an acceptable accuracy with a root-mean-squared error (RMSE) of 5.9554 and a mean absolute error (MAE) of 4.5732.

1. Introduction

Urbanization has brought with it the conglomeration of the population into small spaces where various anthropogenic activities are carried out. Metropolitan areas share socioeconomic activities and the demand for services increases, such as transport, housing, food, sources of employment, industry, and businesses. Therefore, the emission of pollutants into the air also increases, reducing the quality of the environment and the health of the inhabitants [1]. According to the World Health Organization (WHO) (2022), 99% of the population breathes polluted air. Particulate matter (PM) is considered one of the pollutants we should be concerned about because particles with diameters less than 2.5 µm (PM2.5) can penetrate deep into the lungs and reach the bloodstream. The impact it has on other organs has recently been evaluated. PM2.5 has been reported to cause serious health concerns not only in long-term exposure but also in short-term exposure [2]. Studies have reported the association between respiratory problems and exposure to PM2.5 [3]. It is known to reduce life expectancy at birth by around 1.2–1.9 years; this was observed in highly polluted areas such as Asia and Africa [4]. Moreover, PM2.5 can cause allergies in children and is associated with nasal, ocular, and skin symptoms [5]. The association between hypertension and death of cardiometabolic diseases and PM2.5 levels is greater in places where pollution concentration levels are very high [6,7].
Ambient particulate matter with an aerodynamic diameter of 2.5 (PM2.5) is mainly emitted from traffic combustion, road dust, soil, and mass burning [8,9,10]. The chemical composition of the particles varies according to the source and the environment in which it is produced; for instance, exhaust emissions were found to be the higher contributor to traffic PM2.5 emissions showing a diurnal variation [8]. Ports are a gateway to world trade. It is a multifunctional area that provides services to industries and businesses, so we can find a combination of transportation that connects supplies to the main consumption centers. [11]. Although the contribution of emissions from ships in a city port has not been extensively studied, there is concern about the impact they have on air quality, mainly because of the proximity that the ports have to the population [12,13,14]. However, the correlation between air pollution and port traffic has been troubled, mainly due to the scanty information related to port management, granting a degree of uncertainty to the correlation coefficients [15,16]. Moreover, the sample size of PM2.5 data to run the models in some harbors is not large enough to improve prediction [17].
Maritime transport emissions are mostly NOx, SOx, volatile organic compounds (VOC), PM1, PM2.5, PM10, black carbon (BC), and some trace elements bounded in PM1 and PM2.5 [18]. However, it has been observed that the primary source of PM1 and PM2.5 is ship exhaust emissions emitted by the combustion of heavy oil [5,11,15,19]. Another PM source is dust generated by coal and iron ore handling and dispersed by wind [20]. Therefore, ship emissions are established as a primary pollutant emitted directly from the source or through the precursor formation. Moreover, ship emissions are the main contributor to this formation [21]. Weather in ports plays an essential role in the dispersion and distribution of pollutants; air quality data from specific areas should be considered, including the effects of breeze circulation, the formation of the boundary layer, and the impact of humidity. Primary emissions have been reported during the cold season and show low diurnal variation between port sites and city monitoring stations, suggesting no change in the air mass [14,19,22]. Moreover, air pollution mass correlated with open sea traffic is correlated with PM measures on the coast, observing the influence of air transportation [19]. Air pollution in ports has also been correlated with the size of containers as ships spend more time loading and unloading the goods if the contents are weightier [12]. The efficiency of port management has also been evaluated, such as port logistics, infrastructure, and policies, as well as the efforts to reduce air emissions. Some ports have adopted green technologies and energy programs, including the use of technologies that improve the operational efficiency of engines, resulting in fewer air emissions [20,23,24].
This paper presents an air quality analysis with data from 9 months, with average hourly concentrations of pollutants (PM1, PM2.5, PM10, CO, and O3) and meteorological factors (temperature and relative humidity) in a port city. On the one hand, we analyze the relationship between variables considered in the study using Spearman’s correlation coefficient to measure the effect of cargo ship traffic and oil tankers on the concentration of pollutants in the port area. On the other hand, a recurrent neural network (RNN) is implemented to perform a multivariate linear regression analysis to predict the daily concentration of PM2.5.

2. Materials and Methods

2.1. Area of Study

Tampico is one of the main ports on the east coast of Mexico, holding imports and exports for mining products, petrochemicals, steel, minerals, agricultural bulk, and large structures, among other industrial products. It has a total of 11 berth positions with 2147 linear meters in its public terminals and specialized equipment to handle various merchandise. The Port of Tampico offers extensive regular shipping line services that connect it with more than 100 countries worldwide. The port city is part of the metropolitan area along with four other towns situated on the banks of the Panuco River. Tampico city has a population of 297,562, an annual average temperature range of 22–26 °C, and a yearly rainfall average of 900 to 1100 mm. The climate is classified as a warm sub-humid climate with rains in summer and average humidity (100%). The land use is divided into agriculture (8%), body of water (16%), and urban zone (45%), within an approximate area of 114.5 Km2. The site registers stronger winds from October to June, averaging 16.6 km/h, while from June to October, the wind speed decreases, recording an annual average of 12.3 km/h.

2.2. Data Collection and Analysis

Concentration levels of pollutants in the air and meteorological factors were statistically analyzed using the Kolmogorov–Smirnov Lilliefors test to determine the normality of the data. The data sets were identified as non-parametric distribution, for which it was determined to apply a Spearman correlation analysis. Spearman’s correlation coefficient was used to examine the relationship between variables considered in our study. A linear regression analysis was performed using a recurrent neural network architecture for predicting the daily concentration of particulate matter (PM2.5) using an hourly average of the pollutant concentration levels, meteorological factors, and the departures and exit of ships to the port area on the same dates. Moreover, a descriptive analysis was performed by calculating the median, interquartile range (IQR), and minimum and maximum values for the continuous variables of concentrations of air pollutants and meteorological factors.

3. Results and Discussion

3.1. Descriptive Analysis

The concentration levels obtained from the continuous monitoring of air pollutants in the port of Tampico, Tamaulipas were analyzed to forecast the levels of fine mass in the air (PM2.5), using a database of 9 months of monitoring from 1 May 2021 to 31 January 2022. Table 1 shows the descriptive analysis of the monthly concentrations of particulate matter. According to the results, a higher concentration was observed during December 2021 for ultrafine particles (PM1), with a median (IQR) of 17.06 (8.65) µg/m3; 24.56 (14.1) µg/m3 for fine particles (PM2.5); and 29.35 (18.1) µg/m3 for coarse particles (PM10). However, particulate matter was detected at high levels during May (2021) and January (2022). According to previous studies, PM has been reported to be higher during spring and winter [18,25]. The maximum median value was observed during December, with 34.6, 51.97, and 63.36 µg/m3 for PM1, PM2.5, and PM10, respectively. PM2.5 levels were below the detection limits established by Mexican normativity, considering the acute exposure, the set concentration of which is 45 µg/m3. However, the median concentration was above the standard value of 12 µg/m3 reported as an exposure limit for chronic exposure (annual).
Meteorological conditions showed steady behavior for temperature and relative humidity throughout the study period, with median temperature ranging between 28 and 30 °C, with higher values during September and a temperature decrease to 20 °C during May. On the other hand, relative humidity (RH) fluctuates between 80% and 100%; however, during December, RH drops to 73%. Favorable weather conditions will result in a good dispersion or dilution of pollutants; these conditions can also affect air quality, so emissions can fluctuate [25]. Several studies have reported a possible association between relative humidity and PM2.5, and their finding suggests that the abrupt increase in PM2.5 concentrations is strongly correlated with fluctuations in relative humidity. In contrast, environments with constant humidity do not contribute to the increase in PM2.5 levels [26]. According to our results, relative humidity in Tampico was steady, and the higher PM2.5 concentration was observed during December when RH decreased to 70%.

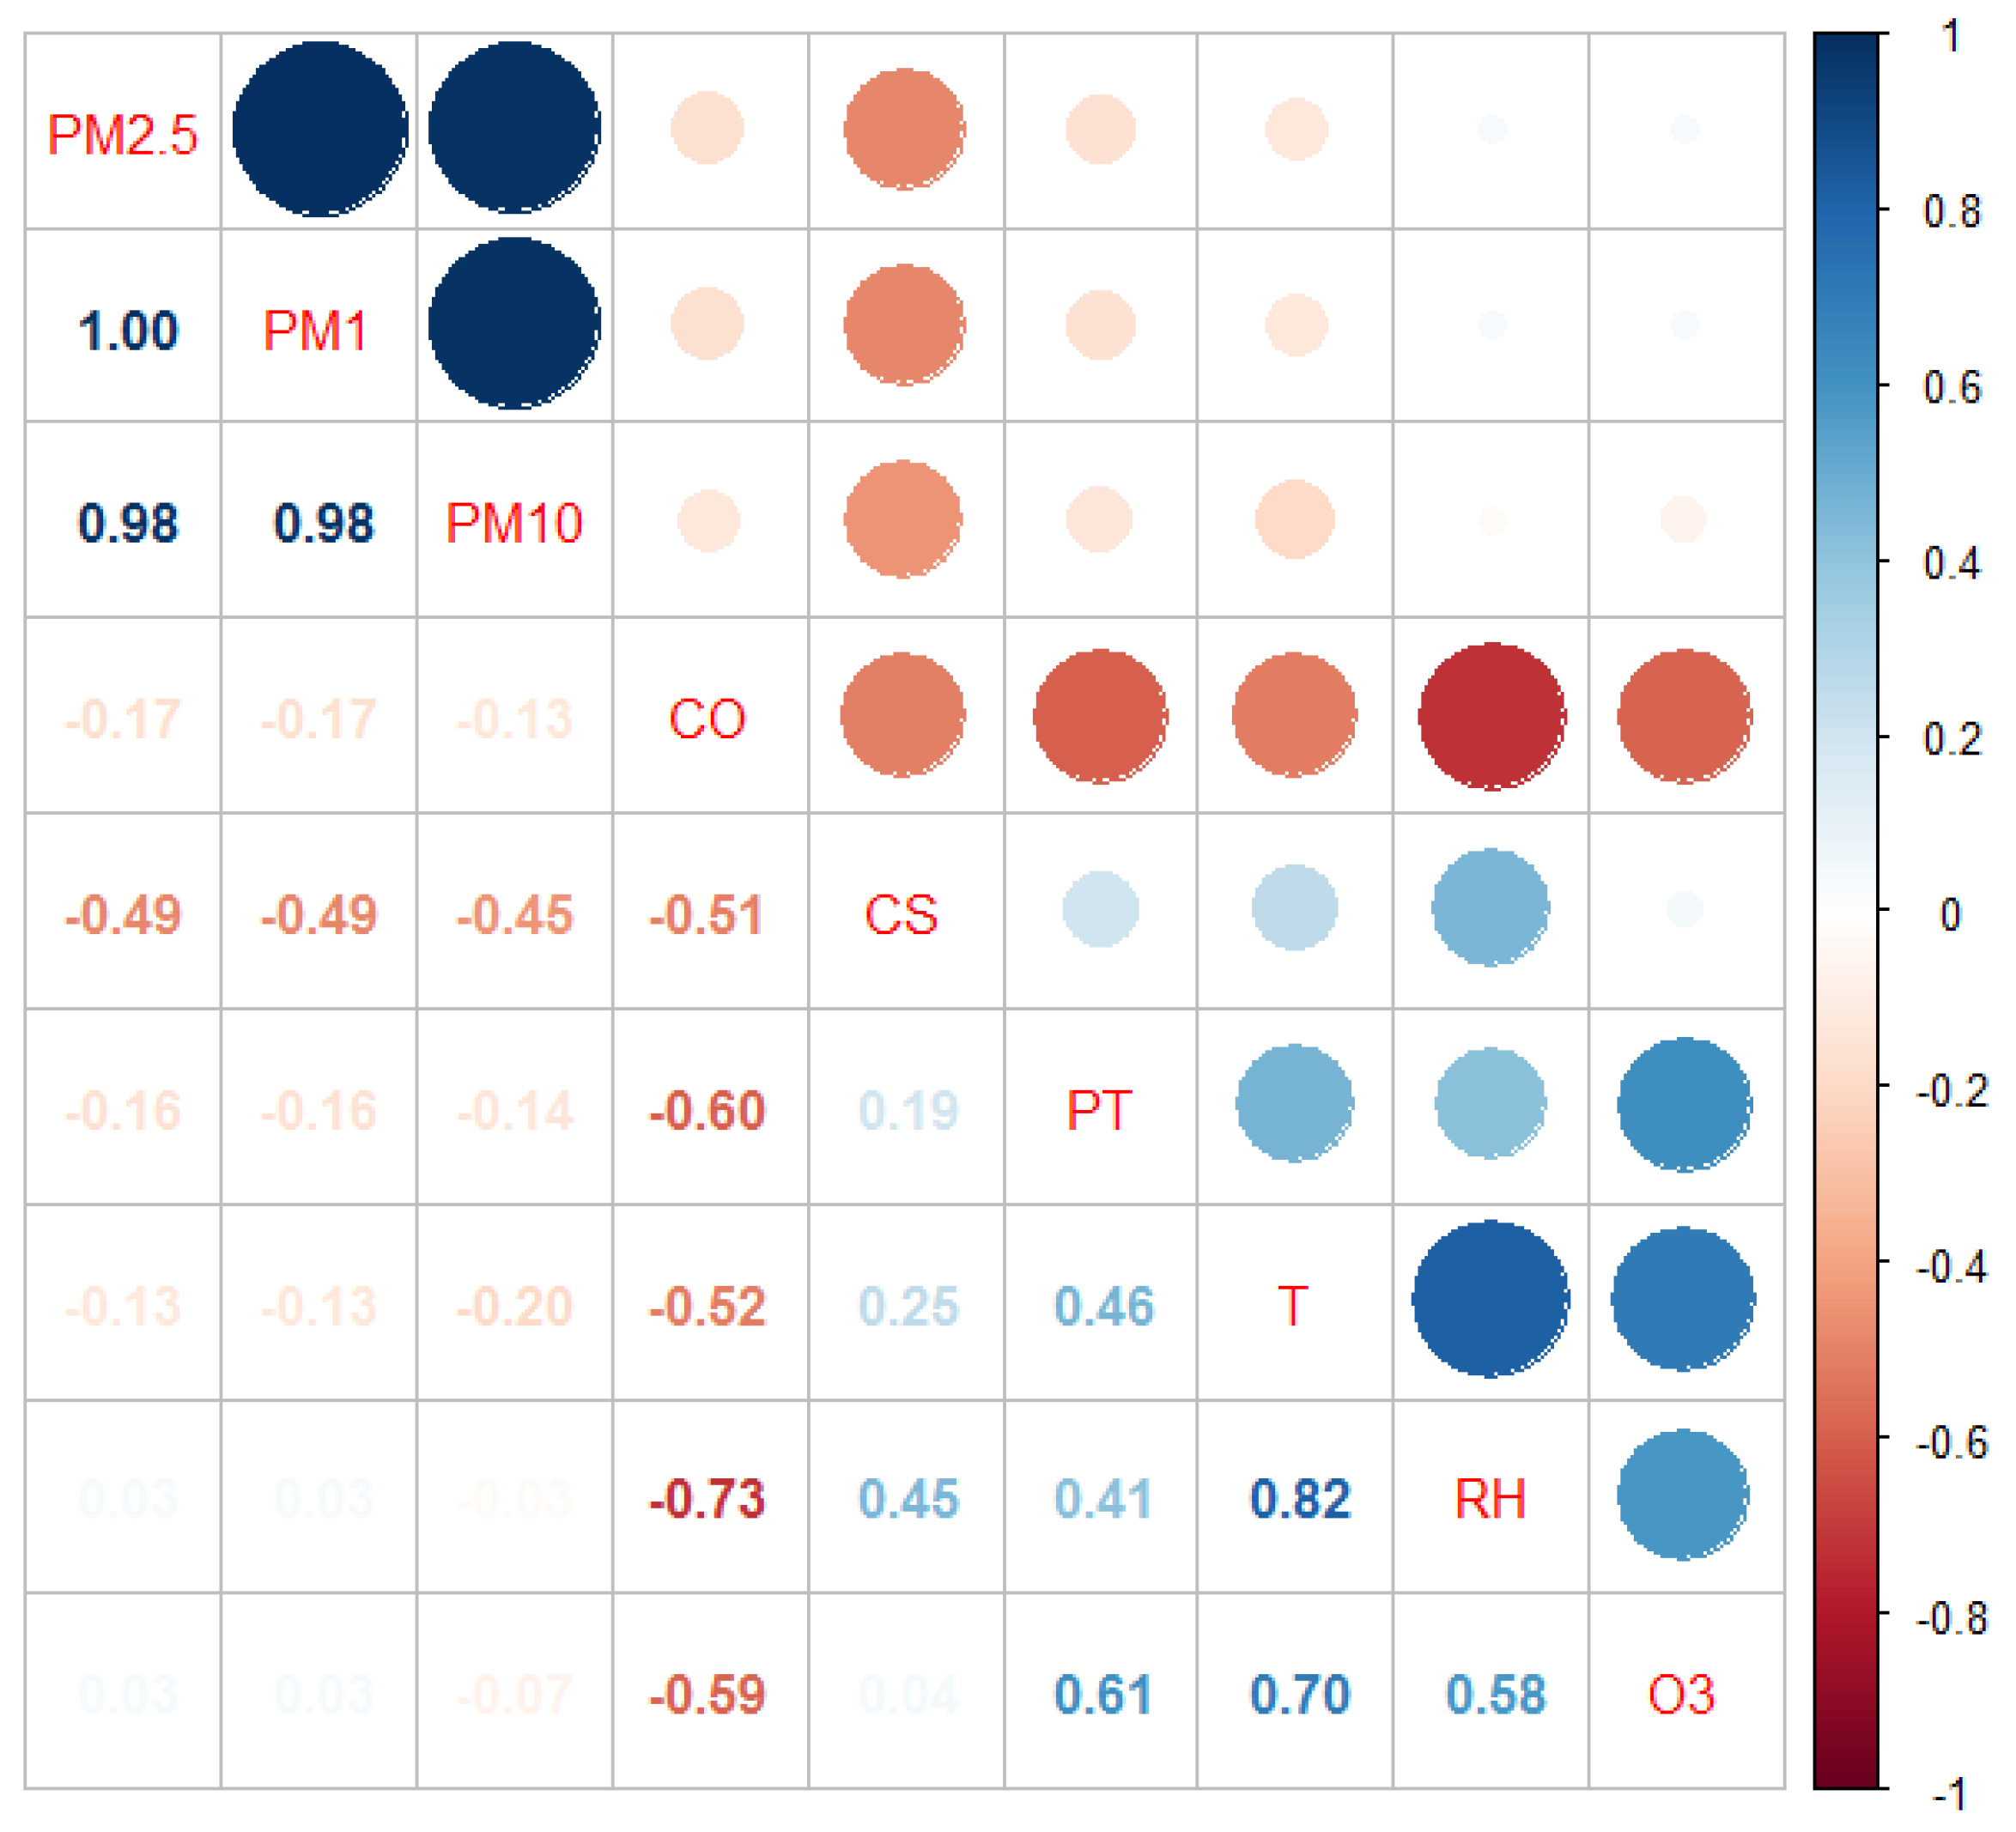
3.2. Correlation Analysis

Spearman’s analysis revealed a strong positive correlation between the smallest fraction of particles (PM1, PM2.5, and PM10), showing a correlation coefficient (r) of 1 with a p-value less than 0.05 (see Figure 1). Moreover, a correlation between temperature and RH is strong (r = 0.82); these variables do not correlate with the concentration levels of the particulate material displaying values of r < 0.20 (see Figure 1). However, there is good correlation with r = −0.73 and r = −0.58 between RH with CO, and RH with O3, respectively. This way, temperature presents a correlation of r = −0.52 and r = 0.70 with CO and O3. In all cases, a p-value < 0.05 shows high statistical significance. Although gases (CO and O3) were not correlated with PM2.5, it is essential to consider that temperature and relative humidity, alongside other pollutants such as CO and O3, are responsible for PM2.5 formation. The correlation between gases and PM had seasonal variation; thus, a temporal scale should be considered [25]. Furthermore, the correlation analysis shows a negative moderated association between PM2.5 and cargo ships (CS) with r = −0.49 (see Figure 1). According to the inventory report, the CS has been reported to be the main PM contributor, followed by containers and tankers [21]. Moreover, there is no association between the particulate matter and the entry and exit of the petroleum tankers (−0.14 < r < −0.16). Finally, moderated negative association of cargo ships and petroleum tankers (PT) with CO was r = −0.51 and r = −0.60, respectively. Petroleum tankers and O3 were correlated with an r = 0.061.

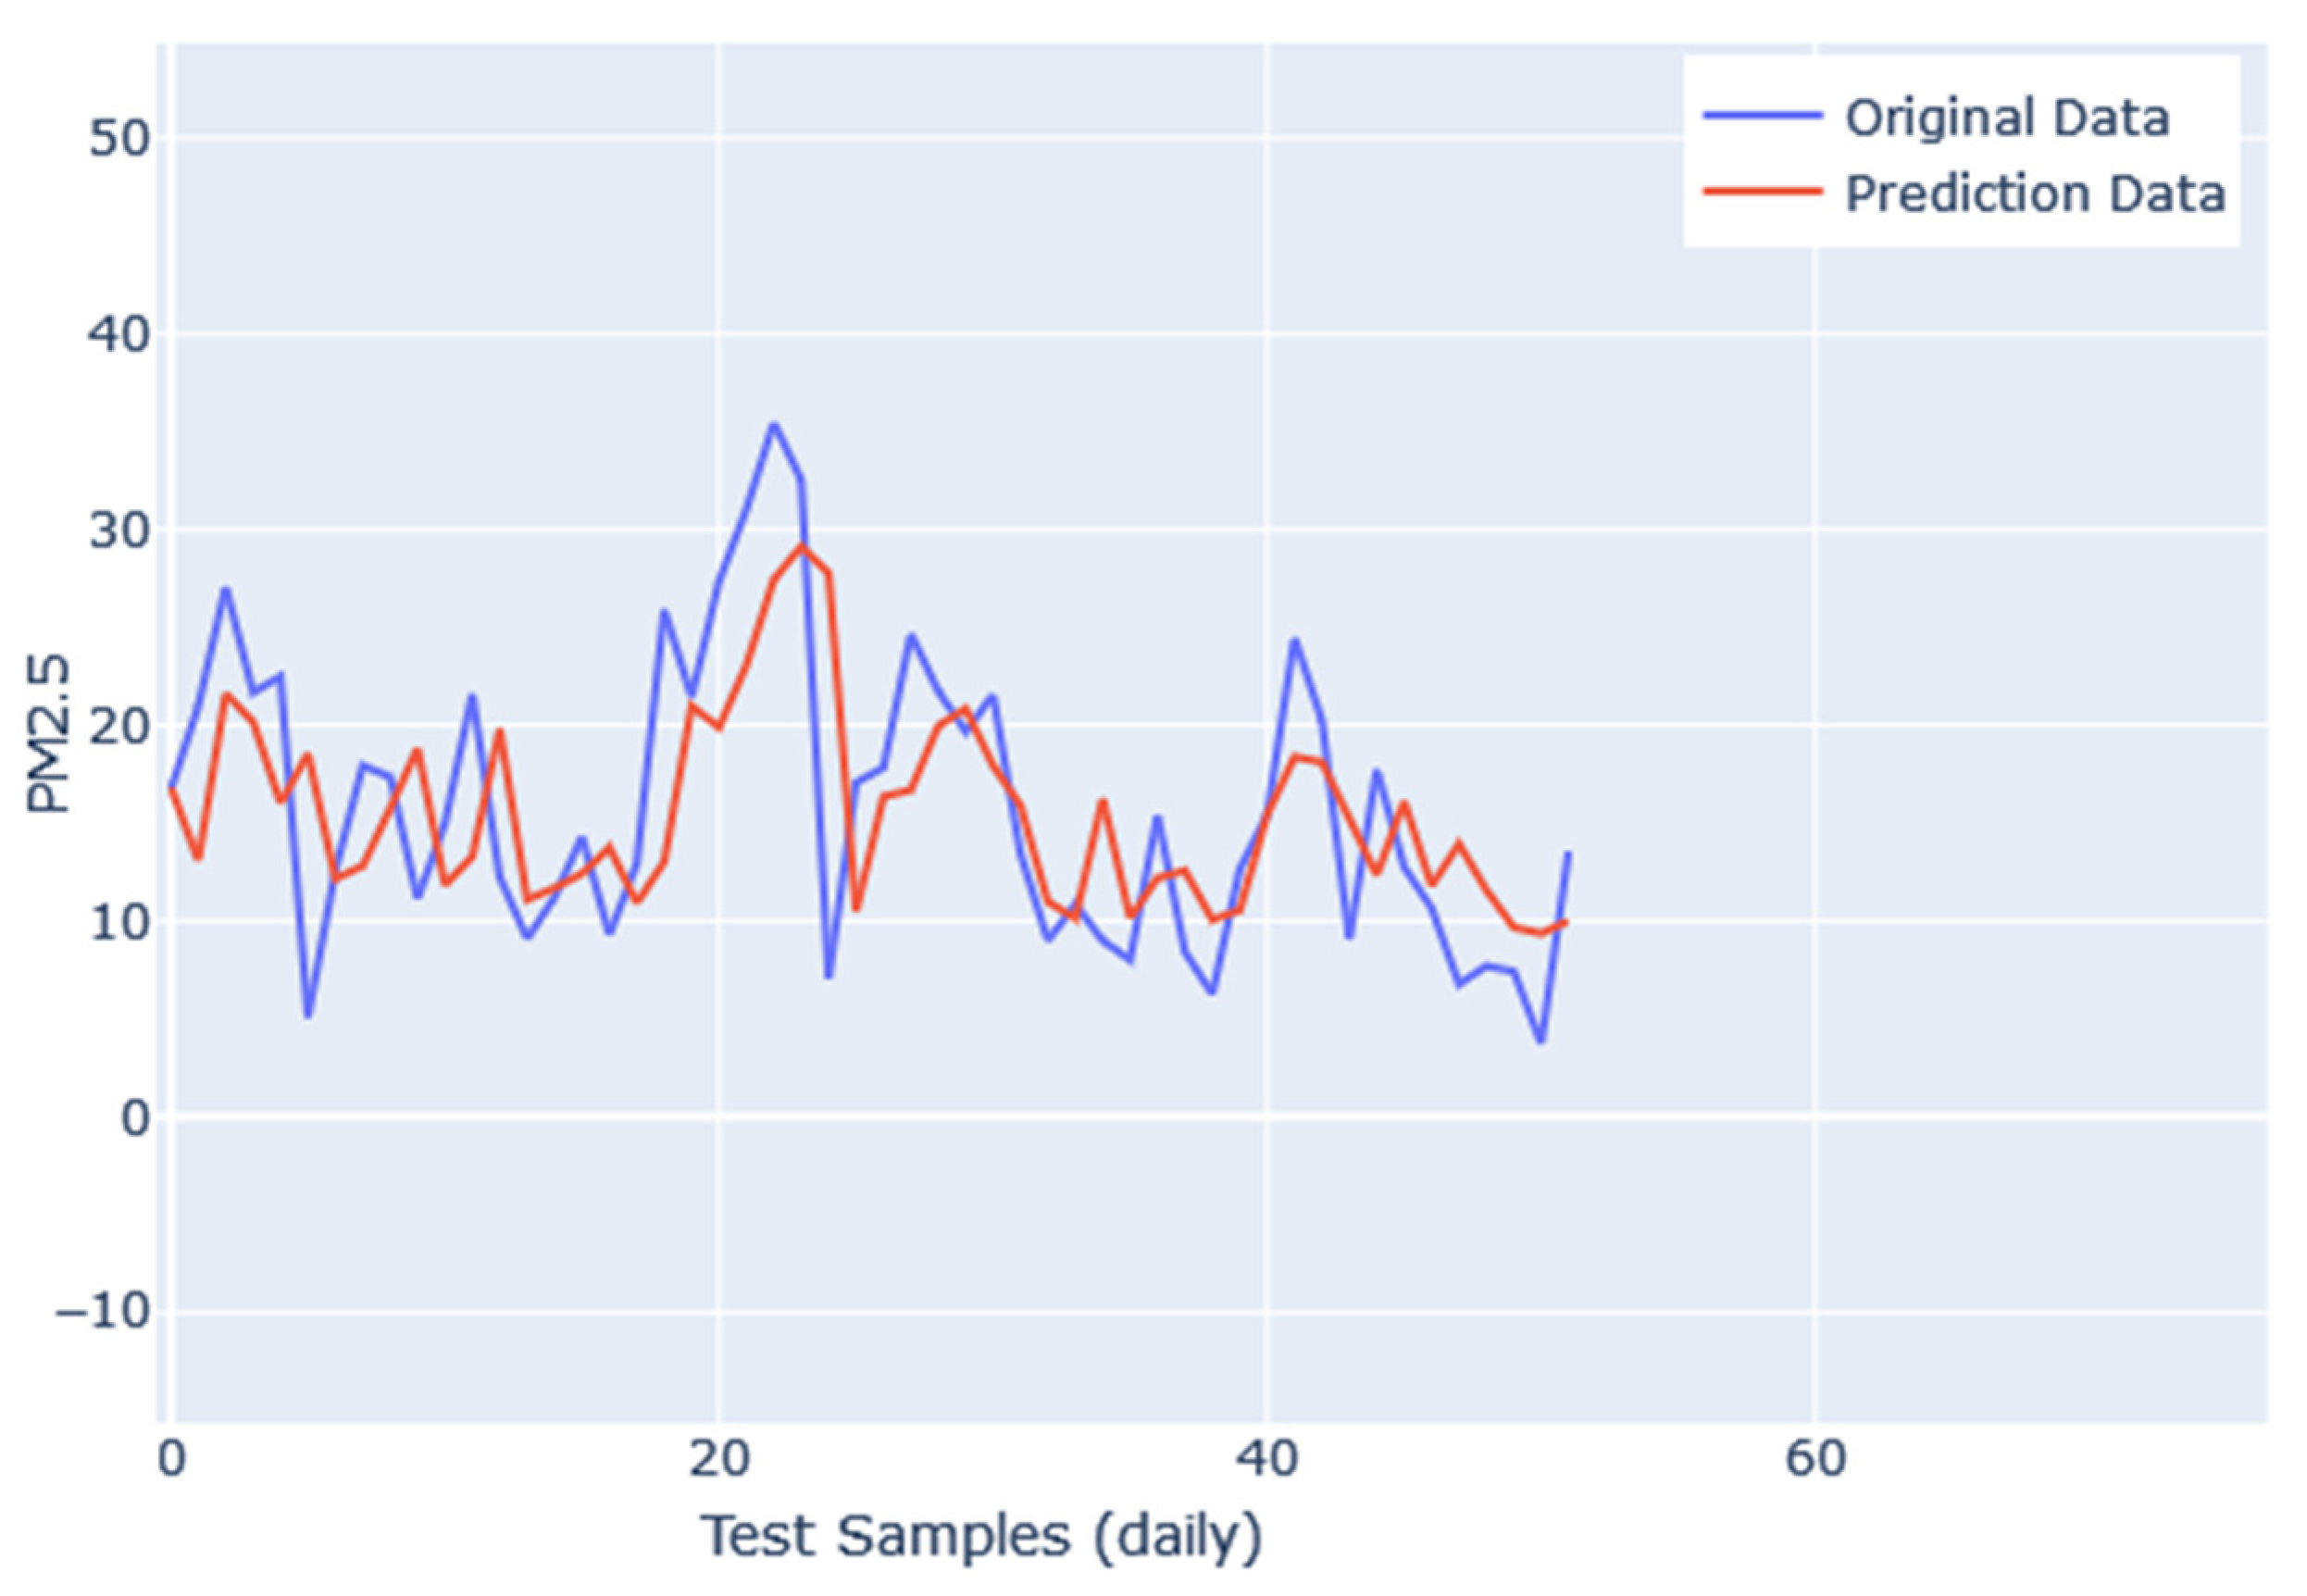
3.3. Regression Analysis

The predictive model is evaluated with the remaining 20% of the data set instances. The RNN predictive model obtains an RMSE value of 5.9554, indicating that the concentration level of the data in the regression line has an acceptable fit, with a minimum distance from the data points of the regression line. Furthermore, the difference between the predicted and actual values is moderate, with an MAE of 4.5732, indicating that the average forecast is acceptable. Regarding the mean absolute percentage error (MAPE) metric, a value reached 39.9516, which suggests that the average difference between the predicted and current values is high.
Figure 2 shows the daily prediction of the concentration of PM2.5 generated by the model based on the proposed RNN. The prediction line follows the pattern defined by the real data but with a significant lag, which causes the error metrics to be moderate. The difference between the current and predicted data could be observed to be smaller, but this is because the concentration levels of PM2.5 in the monitored area are low. These data would have a high error percentage, as shown by the value obtained in the MAPE metric. An important aspect to consider is that the relative humidity is high (close to 100%) on most of the days considered in the study, for which this variable does not support the prediction of the contaminant.

4. Conclusions

This study analyzed the concentration levels of particulate matter, CO, O3, and meteorological factors in the port of Tampico, Mexico. Correlation coefficient analysis confirmed a very high relationship between the three types of particulate matter. In addition, the contaminant CO presents a high negative association with relative humidity. In the case of cargo ships, they show a moderate negative relationship with PM1, PM2.5, PM10, and CO. The petroleum tankers have a moderately negative relationship with CO (r = −0.60). Finally, linear regression analysis generated by the RNN prediction model obtains acceptable RMSE and MAE values. However, with a high MAPE metric, the daily prediction of PM2.5 concentration should be considered to have moderate performance and accuracy.

Author Contributions

Conceptualization, B.A.M.-H. and E.T.-L.; methodology, B.A.M.-H.; software, U.M.R.-A. and E.T.-L.; validation, B.A.M.-H., E.T.-L. and U.M.R.-A.; formal analysis, U.M.R.-A.; investigation, B.A.M.-H. and E.T.-L.; resources, B.A.M.-H.; data curation, J.D.H.-R.; writing—original draft preparation, B.A.M.-H. and E.T.-L.; writing—review and editing, B.A.M.-H.; visualization, J.D.H.-R.; supervision, B.A.M.-H.; project administration, E.T.-L.; funding acquisition, E.T.-L. All authors have read and agreed to the published version of the manuscript.

Funding

This research received no external funding.

Institutional Review Board Statement

Not applicable.

Informed Consent Statement

Not applicable.

Data Availability Statement

Not applicable.

Acknowledgments

The authors are grateful to the Autonomous University of Tamaulipas, Mexico, and the Municipal Government of Tampico (Mexico) for supporting this work.

Conflicts of Interest

The authors declare no conflict of interest.

References

  1. Janarthanan, R.; Partheeban, P.; Somasundaram, K.; Elamparithi, P.A.N. Deep learning approach for prediction of air quality index in a metropolitan city. Sustain. Cities Soc. 2021, 67, 102720. [Google Scholar] [CrossRef]
  2. Yu, W.; Guo, Y.; Shi, L.; Li, S. The association between long-term exposure to low-level PM2.5 and mortality in the state of Queensland, Australia: A modelling study with the difference-in-differences approach. PLoS Med. 2020, 17, e1003141. [Google Scholar] [CrossRef] [PubMed]
  3. Zhang, Y.; Ding, Z.; Xiang, Q.; Wang, W.; Huang, L.; Mao, F. Short-term effects of ambient PM1 and PM2.5 air pollution on hospital admission for respiratory diseases: Case-crossover evidence from Shenzhen, China. Int. J. Hyg. Environ. Health 2020, 224, 113418. [Google Scholar] [CrossRef]
  4. Apte, J.S.; Brauer, M.; Cohen, A.J.; Ezzati, M.; Pope, C.A. Ambient PM2.5 Reduces Global and Regional Life Expectancy. Environ. Sci. Technol. Lett. 2018, 5, 546–551. [Google Scholar] [CrossRef]
  5. Sugiyama, T.; Ueda, K.; Seposo, X.T.; Nakashima, A.; Kinoshita, M.; Matsumoto, H.; Ikemori, F.; Honda, A.; Takano, H.; Michikawa, T.; et al. Health effects of PM2.5 sources on children’s allergic and respiratory symptoms in Fukuoka, Japan. Sci. Total Environ. 2020, 709, 136023. [Google Scholar] [CrossRef] [PubMed]
  6. Wu, Y.; Ye, Z.; Fang, Y. Spatial analysis of the effects of PM2.5 on hypertension among the middle-aged and elderly people in China. Int. J. Environ. Health Res. 2021, 31, 729–740. [Google Scholar] [CrossRef] [PubMed]
  7. Yang, X.; Liang, F.; Li, J.; Lia, J.; Chena, J.; Liua, F.; Huanga, K.; Caoa, J.; Chena, S.; Xiaoc, Q.; et al. Associations of long-term exposure to ambient PM2.5 with mortality in Chinese adults: A pooled analysis of cohorts in the China-PAR project. Environ. Int. 2020, 138, 105589. [Google Scholar] [CrossRef]
  8. Jeong, C.H.; Wang, J.M.; Hilker, N.; Debosz, J.; Sofowote, U.; Su, Y.; Noble, M.; Healy, R.M.; Munoz, T.; Dabek-Zlotorzynska, E.; et al. Temporal and spatial variability of traffic-related PM2.5 sources: Comparison of exhaust and non-exhaust emissions. Atmos. Environ. 2019, 198, 55–69. [Google Scholar] [CrossRef]
  9. Janta, R.; Sekiguchi, K.; Yamaguch, R.; Sopajaree, K.; Pongpiachan, S.; Chetiyanukornkul, T. Ambient PM2.5, polycyclic aromatic hydrocarbons and biomass burning tracer in Mae Sot District, western Thailand. Atmos. Pollut. Res. 2020, 11, 27–39. [Google Scholar] [CrossRef]
  10. Lai, A.M.; Carter, E.; Shan, M.; Ni, K.; Clark, S.; Ezzati, M.; Wiedinmyer, C.; Yang, X.; Baumgartner, J.; Schauer, J.J. Chemical composition and source apportionment of ambient, household, and personal exposures to PM2.5 in communities using biomass stoves in rural China. Sci. Total Environ. 2019, 646, 309–319. [Google Scholar] [CrossRef]
  11. Dragović, B.; Tzannatos, E.; Tselentis, V.; Meštrović, R.; Škurić, M. Ship emissions and their externalities in cruise ports. Transp. Res. Part D Transp. Environ. 2018, 61, 289–300. [Google Scholar] [CrossRef]
  12. Rødseth, K.L.; Schøyen, H.; Wangsness, P.B. Decomposing growth in Norwegian seaport container throughput and associated air pollution. Transp. Res. Part D Transp. Environ. 2020, 85, 102391. [Google Scholar] [CrossRef]
  13. Saraga, D.E.; Tolis, E.I.; Maggos, T.; Vasilakos, C.; Bartzis, J.G. PM2.5 source apportionment for the port city of Thessaloniki, Greece. Sci. Total Environ. 2019, 650, 2337–2354. [Google Scholar] [CrossRef] [PubMed]
  14. Bachvarova, E.; Spasova, T.; Marinski, J. Air Pollution and Specific Meteorological Conditions at the Adjacent Areas of Sea Ports. IFAC-PapersOnLine 2018, 51, 378–383. [Google Scholar] [CrossRef]
  15. Toscano, D.; Murena, F. Atmospheric ship emissions in ports: A review. Correlation with data of ship traffic. Atmos. Environ. X 2019, 4, 100050. [Google Scholar] [CrossRef]
  16. Cammin, P.; Yu, J.; Heilig, L.; Voß, S. Monitoring of air emissions in maritime ports. Transp. Res. Part D Transp. Environ. 2020, 87, 102479. [Google Scholar] [CrossRef]
  17. Tularam, H.; Ramsay, L.F.; Muttoo, S.; Naido, R.N.; Brunekreef, B.; Meliefset, K.; Hoogh, K. Harbor and Intra-City Drivers of Air Pollution: Findings from a Land Use Regression Model, Durban, South Africa. Int. J. Environ. Res. Public Health 2020, 15, 5406. [Google Scholar] [CrossRef] [PubMed]
  18. Bagtasa, G.; Cayetano, M.G.; Yuan, C.S. Seasonal variation and chemical characterization of PM in northwestern Philippines. Atmos. Chem. Phys. 2018, 18, 4965–4980. [Google Scholar] [CrossRef]
  19. Bencs, L.; Horemans, B.; Buczyńska, A.J.; Deutsch, F.; Degraeuwe, B.; Poppel, M.V.; Grieken, R.V. Seasonality of ship emission related atmospheric pollution over coastal and open waters of the North Sea. Atmos. Environ. X 2020, 7, 100077. [Google Scholar] [CrossRef]
  20. Twrdy, E.; Zanne, M. Improvement of the sustainability of ports logistics by the development of innovative green infrastructure solutions. Transp. Res. Procedia 2020, 45, 539–546. [Google Scholar] [CrossRef]
  21. Lv, Z.; Liu, H.; Ying, Q.; Fu, M.; Meng, Z.; Wang, Y.; Wei, W.; Gong, H.; He, K. Impacts of shipping emissions on PM2.5 pollution in China. Atmos. Chem. Phys. 2018, 18, 15811–15824. [Google Scholar] [CrossRef]
  22. Fabregat, A.; Vázquez, L.; Vernet, A. Using Machine Learning to estimate the impact of ports and cruise ship traffic on urban air quality: The case of Barcelona. Environ. Model. Softw. 2021, 139, 104995. [Google Scholar] [CrossRef]
  23. Alamoush, A.S.; Ballini, F.; Ölçer, A.I. Ports’ technical and operational measures to reduce greenhouse gas emission and improve energy efficiency: A review. Mar. Pollut. Bull. 2020, 160, 111508. [Google Scholar] [CrossRef]
  24. An, J.; Lee, K.; Park, H. Effects of a Vessel Speed Reduction Program on Air Quality in Port Areas: Focusing on the Big Three Ports in South Korea. J. Mar. Sci. Eng. 2021, 9, 407. [Google Scholar] [CrossRef]
  25. Fu, H.; Zhang, Y.; Liao, C.; Mao, L.; Wang, Z.; Hong, N. Investigating PM2.5 responses to other air pollutants and meteorological factors across multiple temporal scales. Sci. Rep. 2020, 10, 15639. [Google Scholar] [CrossRef]
  26. Zhang, L.; Cheng, Y.; Zhang, Y.; He, Y.; Gu, Z.; Yu, C. Impact of Air Humidity Fluctuation on the Rise of PM Mass Concentration Based on the High-Resolution Monitoring Data. Aerosol. Air Qual. Res. 2017, 17, 543–552. [Google Scholar] [CrossRef]
Figure 1. Correlation matrix of variables of air pollution, meteorological parameters, CS and PT.
Environsciproc 19 00031 g001
Figure 2. Prediction accuracy comparison between actual and predicted data.
Environsciproc 19 00031 g002
Table 1. Descriptive statistics of meteorological factor data and particulate matter concentration.
MonthPM1 (µg/m3)PM2.5 (µg/m3)PM10 (µg/m3)
MedianIQRMaxMinMedianIQRMaxMinMedianIQRMaxMin
May12.6510.529.445.9117.1815.342.537.3619.7716.751.438.71
June9.44.9526.981.9112.016.8339.662.5158.2148.393.47
July9.775.6322.152.5712.748.8431.913.1314.1210.837.463.93
August10.584.0326.833.5213.596.1539.74.2715.256.7148.065.1
September10.3910.4232.1413.4114.535.392.7114.9415.241.433.51
October10.798.4131.163.413.3913.146.444.6314.9515.156.946.08
November8.4855.726.352.9111.228.2237.683.3413.149.7544.493.87
December17.068.6534.64.5724.5614.151.975.9329.3518.163.367.7
January *12.778.5524.923.2317.5813.335.623.9321.4516.142.294.7
* This month correspond to 2022.
Publisher’s Note: MDPI stays neutral with regard to jurisdictional claims in published maps and institutional affiliations.

