Proceeding Paper

Statistical Correction of the Distribution of Solar Radiation, Estimated by the Heliosat Method for Cuba †

by
Krystine Naranjo-Villalón
* and
Israel Borrajero-Montejo
Atmospheric Physics Center, Institute of Meteorology, Havana 11700, Cuba
*
Author to whom correspondence should be addressed.
Presented at the 5th International Electronic Conference on Atmospheric Sciences, 16–31 July 2022; Available online: https://ecas2022.sciforum.net/.
Environ. Sci. Proc. 2022, 19(1), 25; https://doi.org/10.3390/ecas2022-12862
Published: 1 August 2022
(This article belongs to the Proceedings of The 5th International Electronic Conference on Atmospheric Sciences)

Abstract

:
In this work, a statistical correction of the distribution of solar radiation in Cuba estimated by the Heliosat method is obtained, using images collected from the GOES-13 satellite for the period 2012–2017. A need has arisen for an improvement in the updating of the distribution of solar radiation in the country, because when the average annual maps of solar radiation estimated by the Heliosat method are compared with data from stations where solar radiation is measured, and when compared with the Annual Average Map of solar radiation published by the firm Solargis, an overestimation of solar radiation values was noted, as if the effect of cloud cover attenuation, as calculated by Heliosat, was less than the effect of real cloud attenuation. Therefore, it is necessary to improve the updating of the behavior of solar radiation in Cuba due to the relevance of this information related to solar radiation as a renewable source of energy, and due to its use in the evaluation of the country’s helioenergetic potential.

1. Introduction

In Cuba, a project was carried out in 2018 in which the characterization of solar radiation in Cuba was presented from images of GOES-13, using the method known as Heliosat-2, adapted to visible images from this satellite during the period 2012–2017. The most conveniently located geostationary satellite for the selected study period and for our geographical location is the one mentioned above. This has been the source of images used in the development of research taking advantage of an existing file in the INSMET (Institute of Meteorology of Cuba), of GOES images with a temporal frequency of approximately 15 min, covering the period from 2012 to the end of the year 2017. From each daytime image, the corresponding radiation map is calculated, estimated by the Heliosat method. In a very general way, this is a method that allows calculating the distribution of solar radiation in a region ( W / m 2 ) using information from a visible satellite image. In the research carried out by Borrajero; Peláez and Hinojosa [1], monthly average maps and the annual average map of solar radiation were prepared, and the results obtained were validated with data from automatic stations. When the values of the maps made were compared with data from stations where solar radiation is measured, and also compared with the Annual Average Map of solar radiation published by the firm Solargis, an overestimation of the values of solar radiation was noted, as if the cloudiness attenuation effect, as calculated by Heliosat, was less than the actual cloudiness attenuation effect. Therefore, it is necessary to improve the updating of solar radiation in Cuba due to the relevance of this information to solar radiation as a renewable source of energy, and also for the evaluation of helioenergetic potential in Cuba [2].
This type of systematic error is very common in different estimations and forecasting methods, and the practical solution is the elaboration of statistical correction methods. As the main objective of this research, a correction was implemented to the solar radiation maps, made with the Heliosat method, using the saved satellite images of GOES-13. To make the correction, it was necessary to calculate the daily radiation sums, adding the values every fifteen minutes, for each day and for each selected station, using scripts written in the Python programming language. Then, the values estimated by the method were compared with real data measured at the selected stations, which have good quality measurements and good calibration. Having established a functional relationship between station measurements and Heliosat method estimates, this relationship was applied to the estimates and rectified values of the estimated values were obtained. In the work presented by Borrajero; Peláez and Hinojosa [1] the calculation of solar radiation was made for each image during the daytime period for the entire interval, and from these the hourly means, daily sums and monthly and annual mean values were calculated; this research was the basis of our work. The maps obtained by Borrajero; Peláez and Hinojosa [1] reflect the main characteristics of the behavior of the variable in question. An increase in solar radiation was observed towards coastal regions, and areas of the keys, with a decrease in mountainous regions (Figure 1). The behavior throughout the year showed a double maximum in the months of May and July, with a slight decrease in June [1].

2. Methods

2.1. Description of the Heliosat Method

Heliosat-2 is the method used to estimate solar irradiance on earth. This method was originally developed for visible images of the Meteosat geostationary satellite, which makes it unusable in our region. Therefore, the satellite used in question was GOES-13. From files obtained for the daily sum by the Heliosat method, which are maps with a resolution of 1   km 2 , the values corresponding to the positions of the stations were extracted. The tuning of the Heliosat-2 method for GOES-13 was carried out using public information available on the technical specifications of this satellite and the work carried out by Borrajero; Peláez and Hinojosa [1]. Its evaluation was carried out using reports of hourly and daily sums of a group of automatic meteorological stations of the INSMET network for the years 2014 and 2015. In the implementation of the Heliosat-2 method for the GOES-13 satellite, the conversion relationship between pixel values and reflectance and the time variation of the radiometer calibration constant (ageing) typical of this satellite were taken into account. The modifications made include a change in the calibration formula and in the calculation of cloud albedo [3,4]. After pairing the daily sum data at the stations with the values calculated at those positions by Heliosat, a regression equation was calculated.

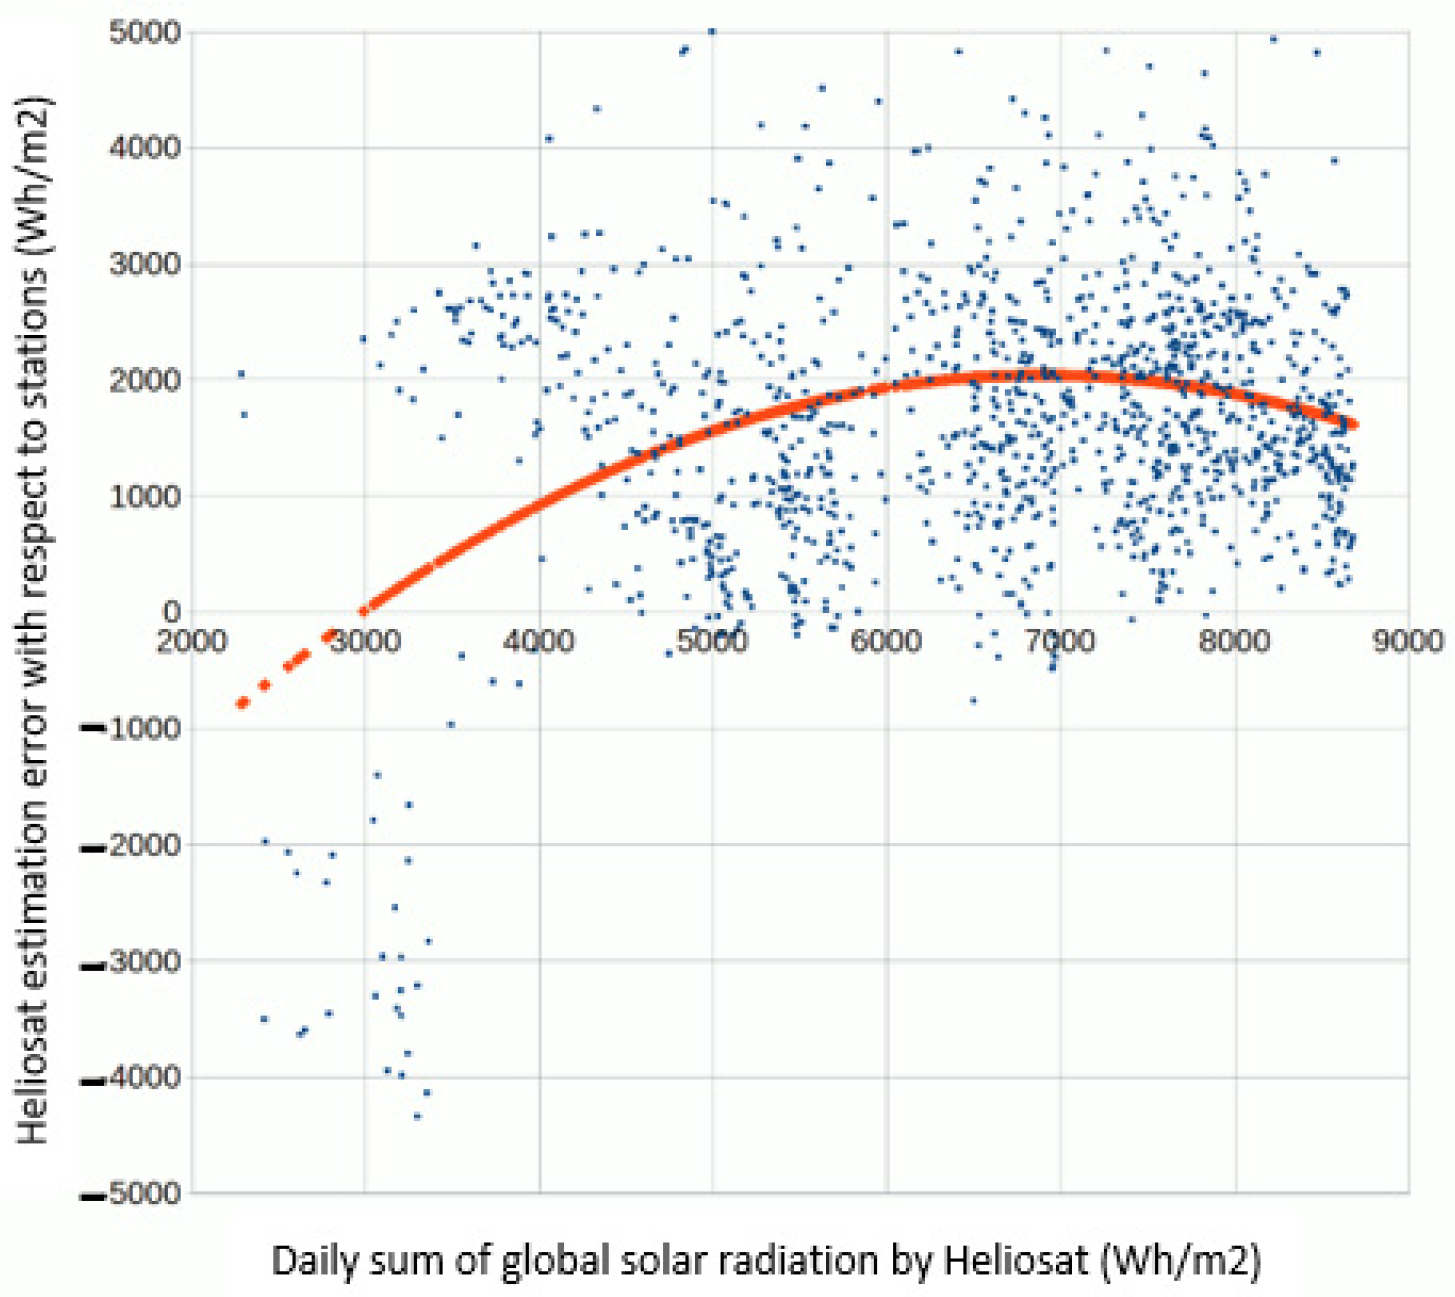
2.2. Obtaining the Regression Equation

The adjustment function proposed in the research is a second-degree equation, as shown in Figure 2. This figure corresponds to the behavior of the error depending on the values estimated by Heliosat; an error that each estimated value must have with respect to the reported data. The predominance of cases of overestimation of global solar radiation can be seen, which reflects a marked insufficiency in the implementation of the method for the selected study area, where the calculated cloudiness index does not modulate with sufficient weight the radiation calculated by the clear sky model. For the highest estimated daily sum values, corresponding to days that were mostly clear, the calculated error tends to decrease, as is clearly reflected in the adjustment obtained. This situation, in which the calculated errors are maximum when the values of the daily sum of estimated solar radiation are around 7000 Wh / m 2 , and decrease both for the highest values of estimated global radiation and for the lowest values of radiation, the use of a quadratic fit as more suitable for the correction than a linear fit.
The equation has the form:
y = A x 2 + B x + C
where, y is the estimation of the error of the Heliosat method with respect to the values reported in the stations, x is the daily sum value of solar radiation estimated by the Heliosat method, A is the quadratic coefficient = 1.3291499549153310 4 , B is the linear coefficient = 1.83384712813072 , and C is the independent term = 4.28220731194757 × 10 3 .

2.3. Description of the Adopted Programming Language and Employed Statisticians

Obtaining new Heliosat maps and applying the correction to them was done with a set of scripts developed in the Python programming language. In the calculations, the Python language was used with a set of general modules that are normally included, such as “numpy”, “math”, “datetime”, “PIL”, and the Python Image Library, for reading the images of the GOES in the formats tiff and “matplotlib”. Specialized modules were also used, such as “ESRA”, which implemented the calculation of solar radiation fluxes under clear skies according to the methodology of the European Solar Radiation Atlas (ESRA), “daily_LINKE” allowed us to obtain the index of Linke of turbidity of the air according to the geographical position and the time of the year and “SatCoords” for georeferencing the images of the GOES satellite.
Statistics evaluated:
• Bias: • Correlation: • Dispersion: [5]
B I A S = Σ i ( y i x i ) n
r = Σ ( x i x ¯ ) ( y i y ¯ ) Σ ( x i x ¯ ) 2 Σ ( y i y ¯ ) 2
σ = Σ i N ( X i X ¯ ) 2 N

3. Results and Discussion

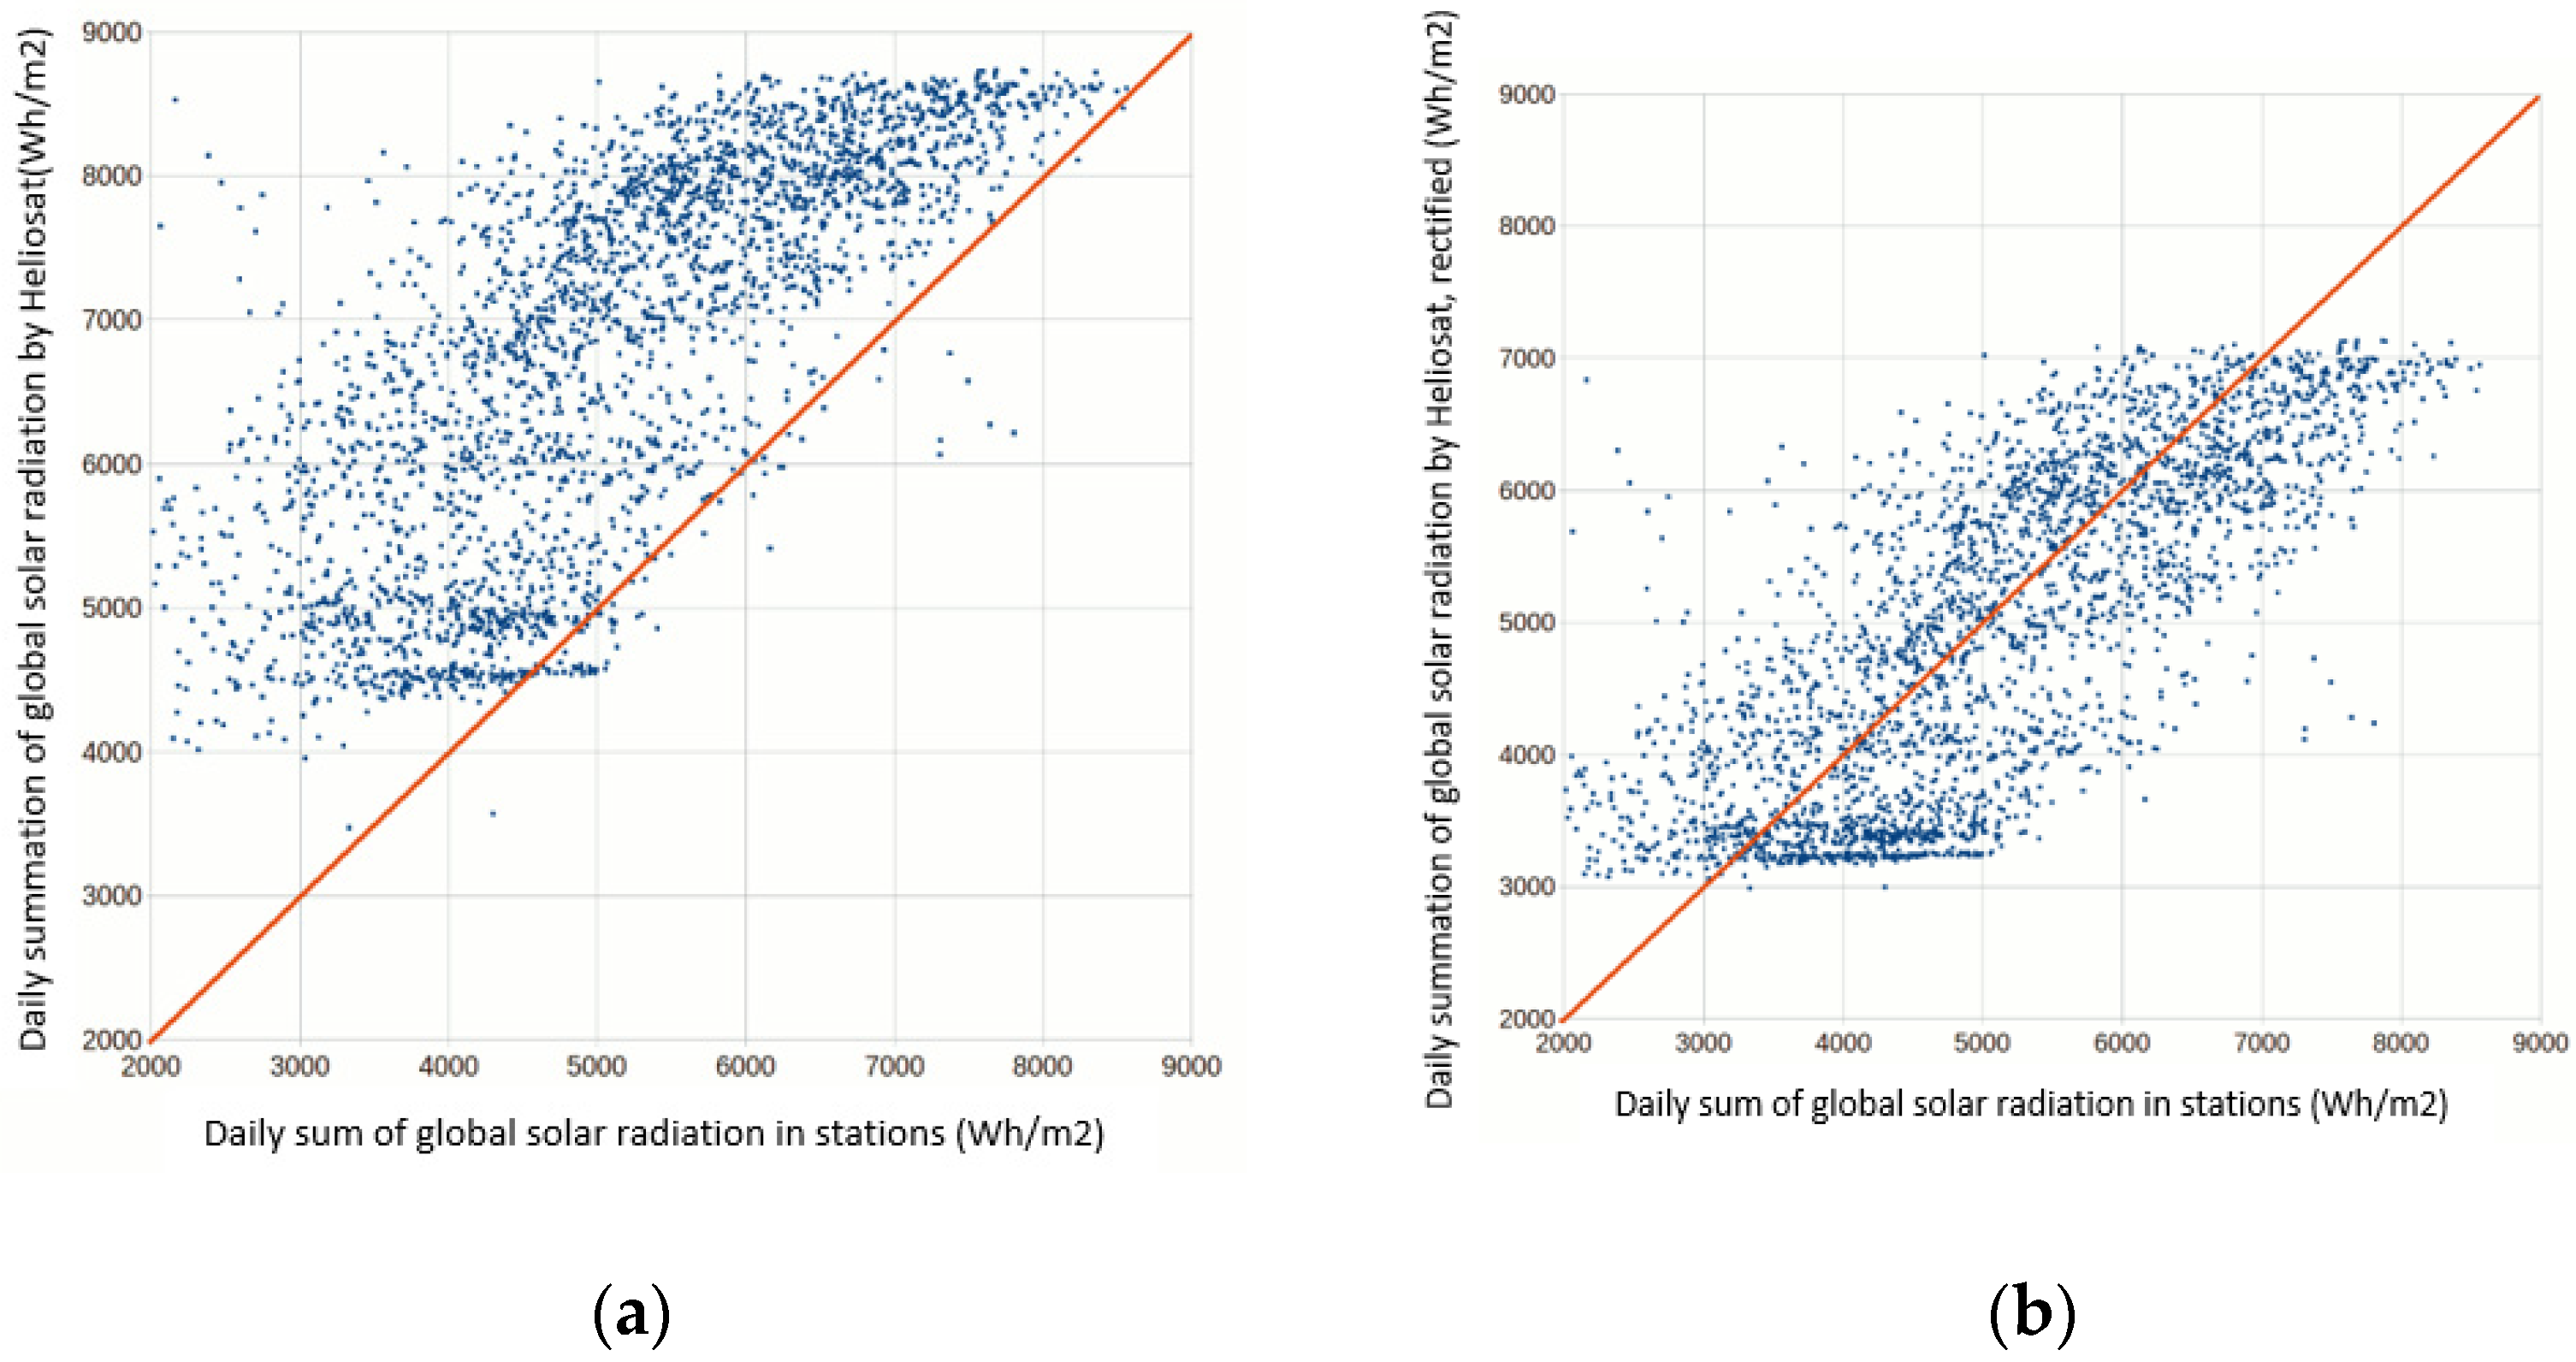
3.1. Selection of Stations and Comparison of Estimated and Reported Global Radiation Values

Of the set of automatic stations that were installed in the period between 2014 and 2015 period, a selection was made based on a comparison between the reported data and the output data of the WRF model under clear skies. The WRF model simultaneously returns the value of solar radiation before a clear sky and the value of “real” radiation, which in addition to depending on the previous elements, includes the effect of cloudiness. When there is a very high correlation for one day between the hourly summation data of solar radiation reported at a station and the model’s clear-sky solar radiation data, this high correlation means that it is a really clear day and in that case, the daily sums of solar radiation of the station and the model must coincide very closely. This proposed analysis does not occur on days with cloudy intervals, because the cloudiness predicted by the model does not exactly coincide with the actual cloudiness, which introduces an additional error to the analysis. In the cases of clear days, the presence of a significant difference between the values of the daily sums of the model and the values reported in the station indicates a problem with the station. In this way, appropriate stations for the study were selected.
The daily sum value used is obtained by integrating the values estimated by the method throughout the daytime period. On the other hand, automatic actinometric stations report instantaneous values with an original frequency of 1 min at the position of the station in question. The daily sum in this case is obtained by integrating the reported values over time. To determine the values of the maps generated by Heliosat in the position of the stations, an interpolation of the values in their positions was performed, using the nearest neighbor interpolation criterion. Table 1 shows a fragment of the list of values of daily sums of global solar radiation by days and by seasons. Values are reported at the station against values estimated for that point by Heliosat.
Once the list of simultaneous values was obtained (a list for each station), it was separated into two samples. The days between the first and the tenth of each month constituted the sample with which the calculation of the adjustment function was made between the difference or error (Heliosat–stations) and the values estimated by the Heliosat method. This error is important because it reveals the extent to which the estimate is different from the real value reported. The other sample (made up of the days between the 11th of the month and the end of each month) was not included in the adjustment obtained and was only used as an independent sample to evaluate it. The fit obtained had a coefficient of determination of 0.64407 and a standard error of 1335.4.

3.2. Analysis of Rectified Values

By subtracting the error estimated by the adjustment Equation (1) from the value produced by Heliosat, a better approximation of the results to the values reported at the stations was obtained, as can be seen in Figure 3. This evaluation of the adjustment obtained was carried out using the data of the selected independent sample, corresponding to day eleven of each month until the end of each month.
From this comparison it could be determined to what extent the error (deviation) of the sample decreased, and how the rectified estimated values approximated with greater precision the slope y = x . Statistics calculated for the original estimate with Heliosat and for the rectified estimate (independent sample) were as follows. For the Heliosat method the correlation was 0.681, the standard error was 1225.3, and the bias was 1795.0. For the rectified Heliosat method the correlation was 0.685, the standard error was 1196.6 and the bias was 6.170. The improvements in the correlation and the standard error were marginal, which can explained by the method of determining the adjustment obtained and grouping all the stations and dates. The statistics were influenced by the fact that there were a number of cases where the values of the stations were incorrect. The main benefit of this research lies in the considerable reduction in the bias value obtained, which is very useful in rectifying the maps.

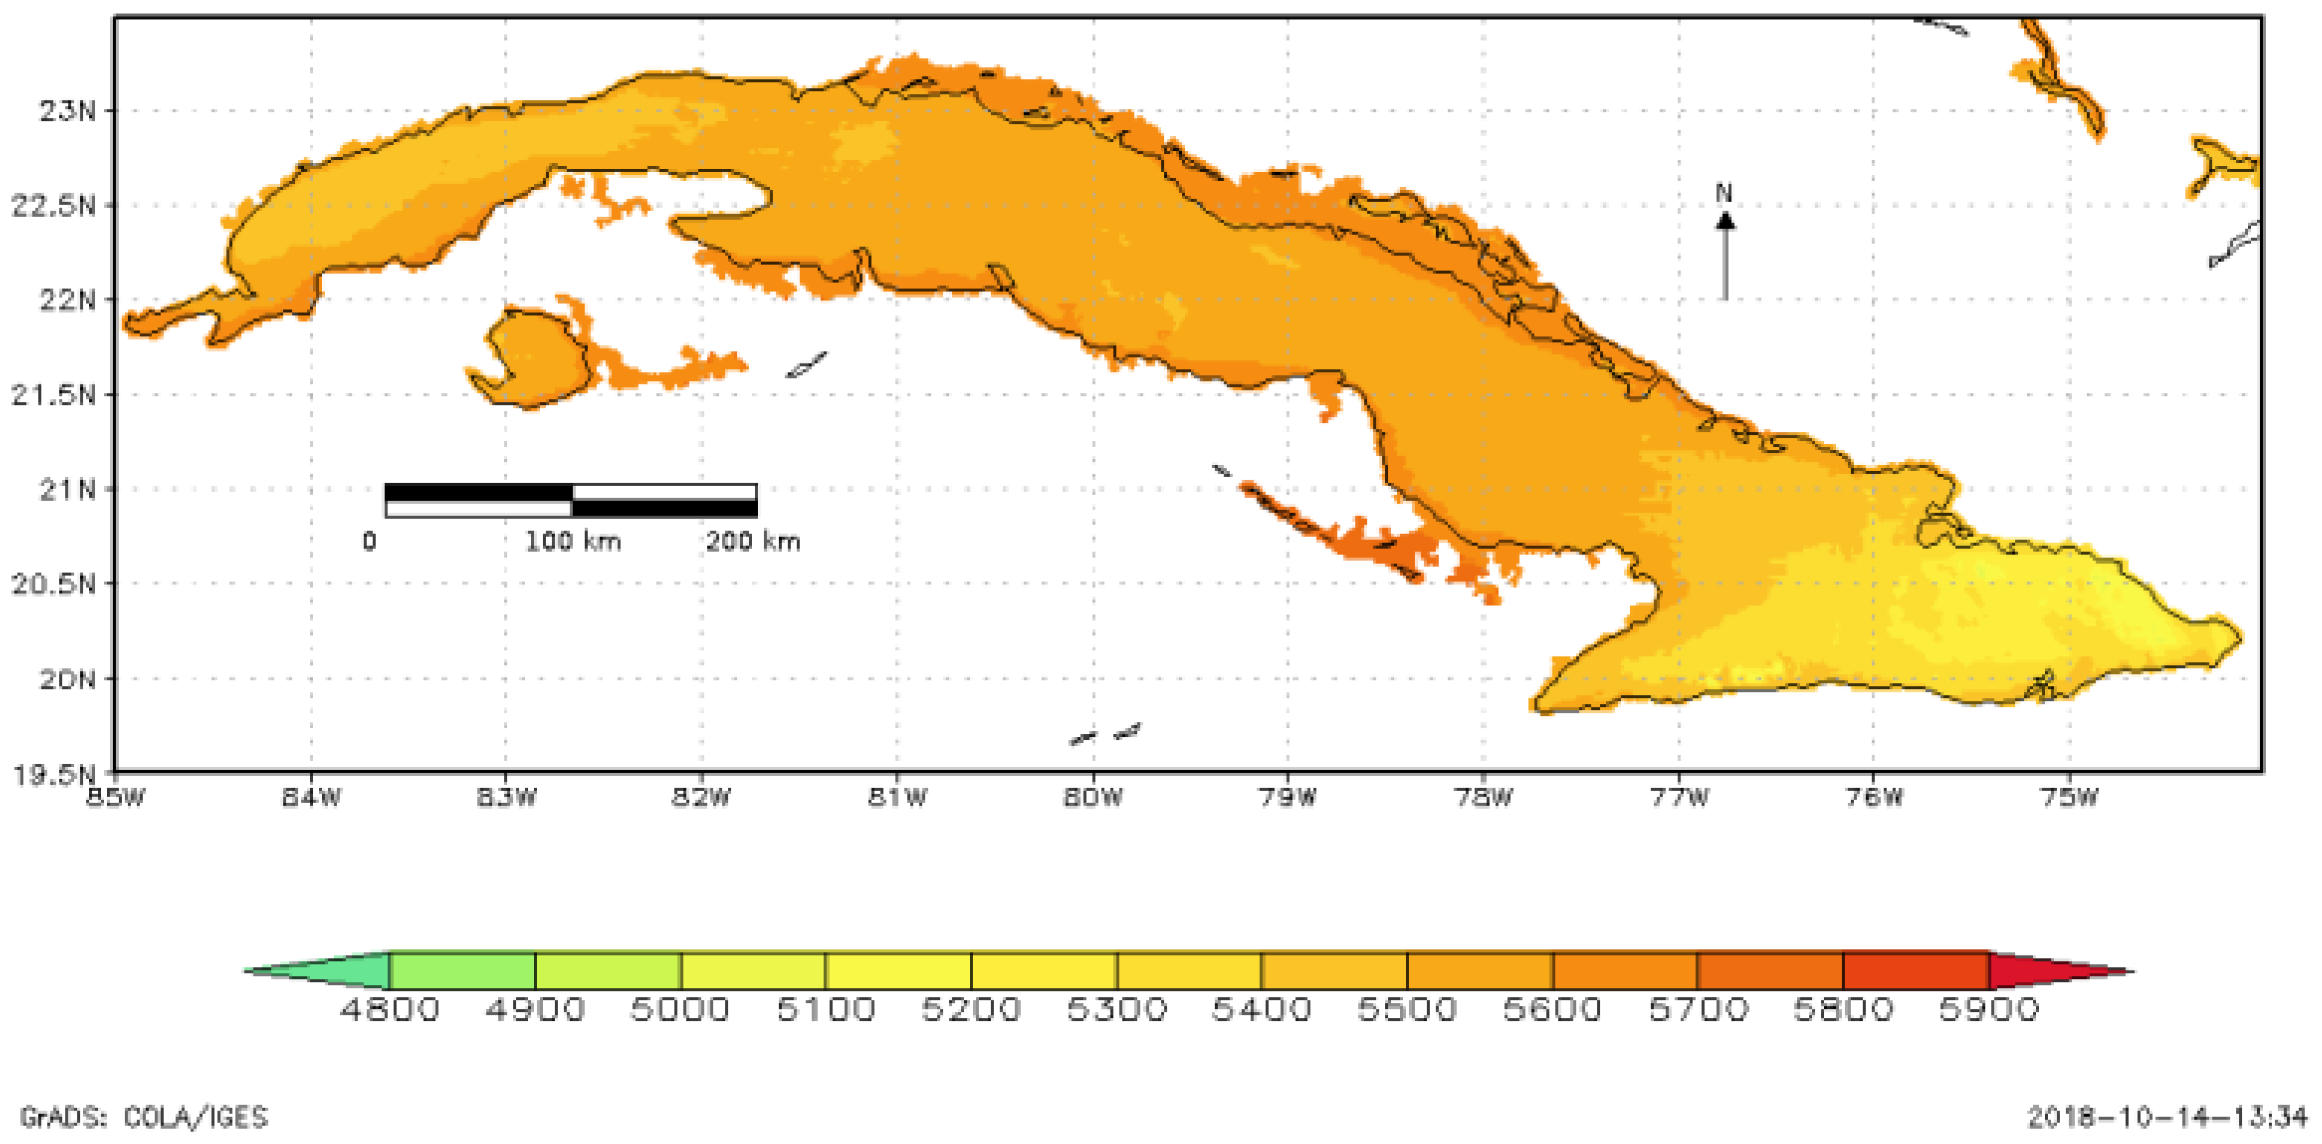
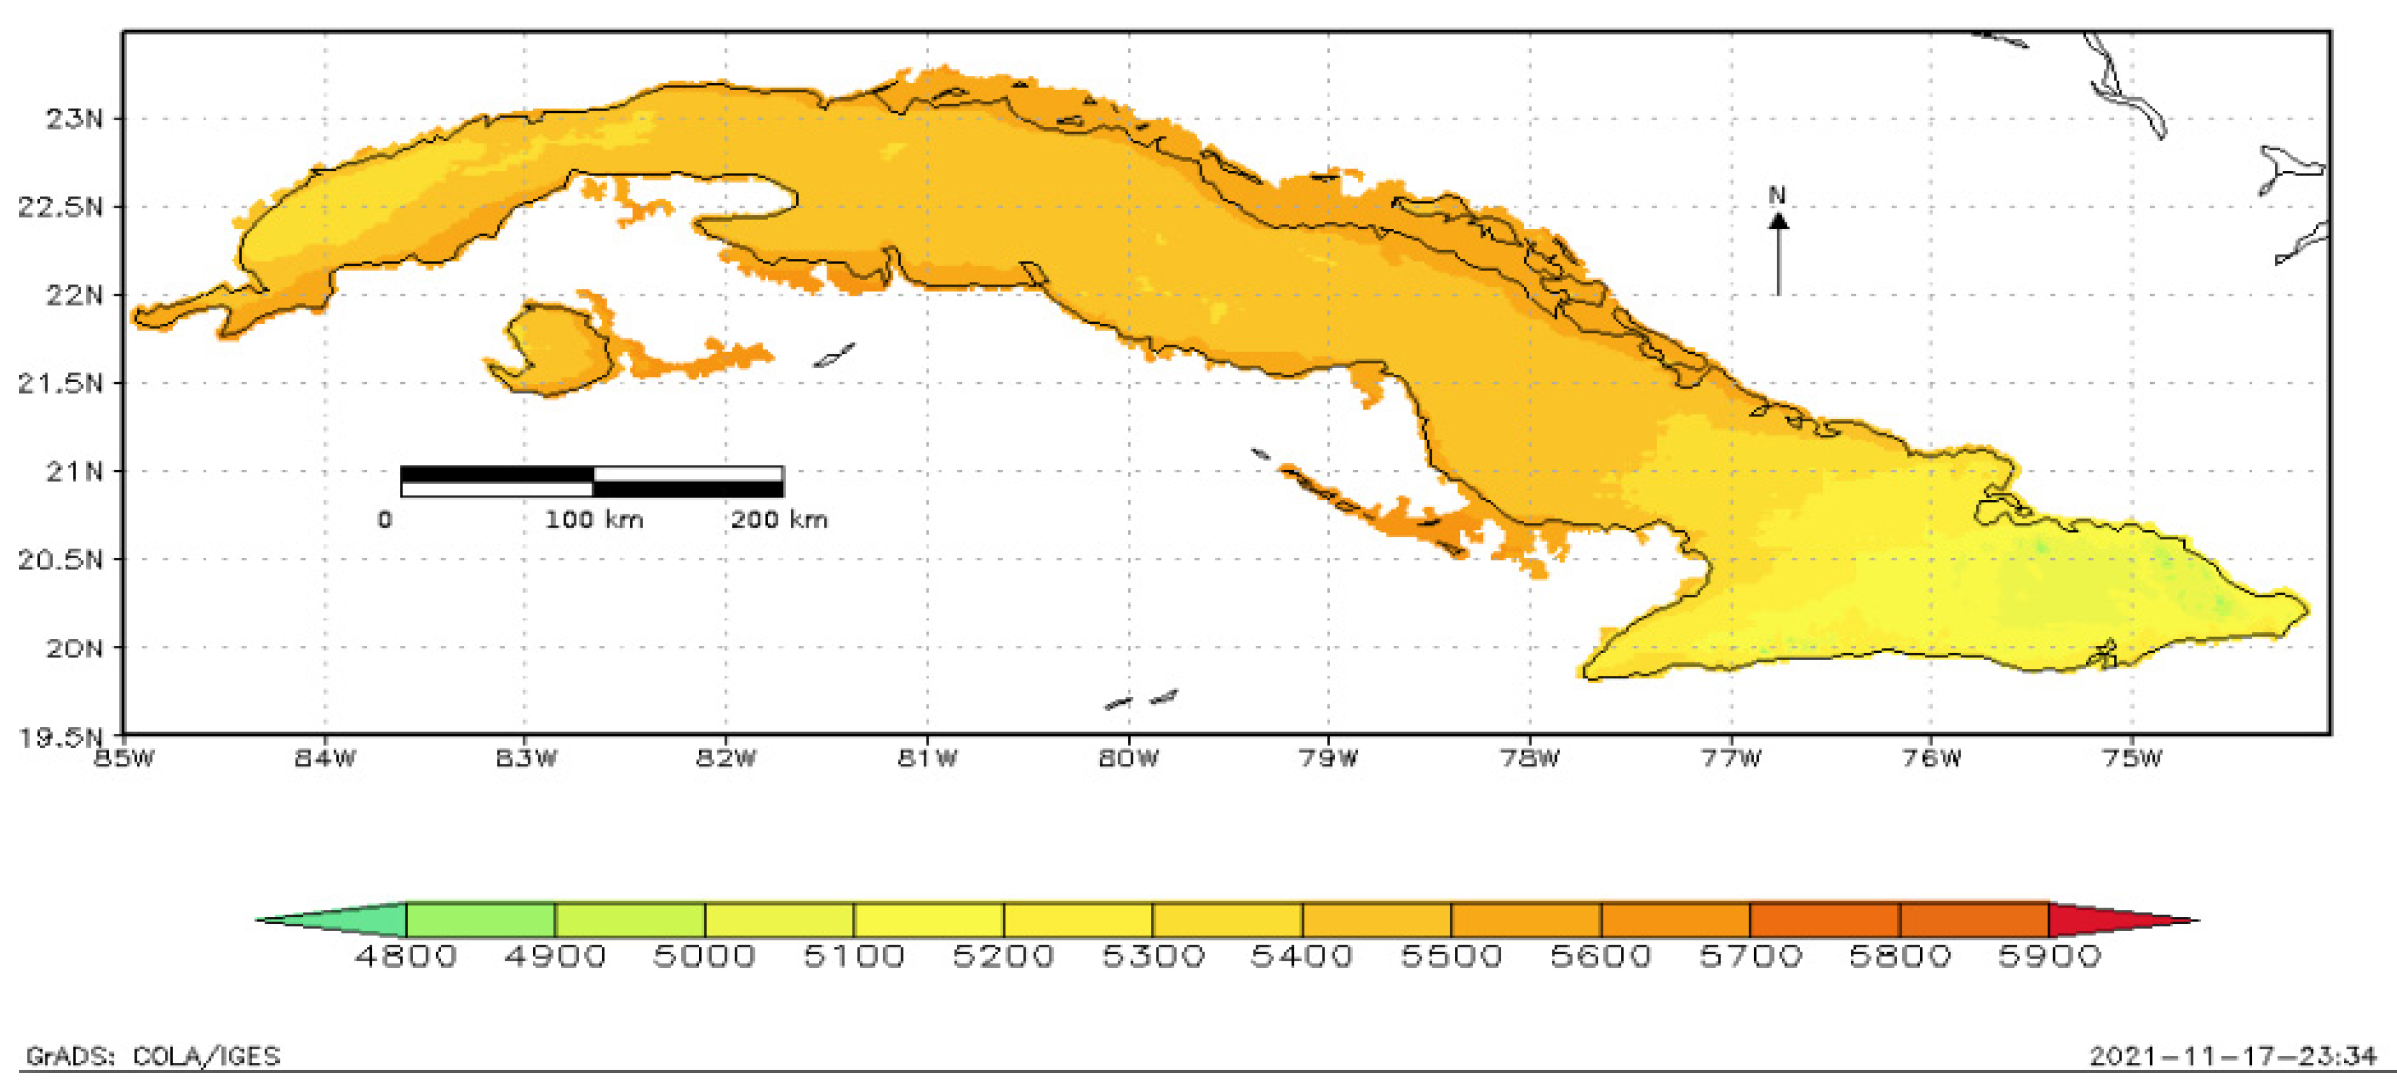
3.3. Comparison of Annual Maps

When comparing the annual mean map of global solar radiation estimated by the Heliosat method (Figure 1 and Figure 4); the maps of Figure 4, shows the global solar radiation map rectified using the adjustment obtained in the investigation. It can be seen that the main characteristics of the distribution of solar radiation in Cuba were maintained, that is, an increase for coastal areas and keys, and a decrease in mountainous regions. The greatest difference in the maps lies in the appreciable decrease in the distribution of the values estimated by the method in the rectified annual mean map, where a negative variation of the values of solar radiation is observed, compared to the distribution of the values of the annual mean map of global solar radiation without rectification (Figure 1).

4. Conclusions

Taking into account the error related to the Heliosat values, an appropriate regression equation was obtained, achieving a better fit of the function. With the application of this adjustment it was possible to identify the predominance of cases of overestimation, which reflected an insufficiency in the implementation of the method, where the calculated cloudiness index did not accurately reflect the radiation calculated by the clear sky model. By subtracting the error estimated by the regression equation from the value produced by Heliosat, a better approximation to the values reported at the stations was obtained.

Author Contributions

Conceptualization, K.N.-V. and I.B.-M.; methodology, K.N.-V.; software, I.B.-M.; validation, K.N.-V. and I.B.-M.; formal analysis, K.N.-V. and I.B.-M.; investigation, K.N.-V.; resources, K.N.-V. and I.B.-M.; data curation, I.B.-M.; writing—original draft preparation, K.N.-V.; writing—review and editing, K.N.-V. and I.B.-M.; visualization, K.N.-V.; supervision, I.B.-M. All authors have read and agreed to the published version of the manuscript.

Funding

This research received no external funding.

Institutional Review Board Statement

Not applicable.

Informed Consent Statement

Not applicable.

Data Availability Statement

Not applicable.

Acknowledgments

The authors would like to thank the team at the Atmospheric Physics Center for providing us with the data collected from visible images of the GOES-13 geostationary satellite, despite it being out of service.

Conflicts of Interest

The authors declare no conflict of interest.

References

  1. Borrajero, I.; Peláez, J.C.; Hinojosa, M. Characterization of Solar Radiation in Cuba from Visible Images of GOES-E Using Heliosat 2 for the Period 2012–2017; Technical Report; Atmospheric Physics Center, Institute of Meteorology: Havana, Cuba, 2018. [Google Scholar]
  2. Borrajero, I.; Peláez, J.C.; Hinojosa, M. Forecast of Solar Radiation and Power to Be Generated in Photovoltaic Plants Connected to the National Electricity Grid; Technical Report; Atmospheric Physics Center, Institute of Meteorology: Havana, Cuba, 2018. [Google Scholar]
  3. Batista, L.M. Image Forecasting System Based on Extrapolation Methods for Very Short—Term Radiation Estimation. Bachelor’s Thesis, Higher Institute of Technology and Applied Sciences, Havana, Cuba, 2017. [Google Scholar]
  4. OSCAR, Observing Systems Capability Analysis and Review Tool. Available online: https://space.oscar.wmo.int/satellites/view/goes_13 (accessed on 29 May 2022).
  5. SPC Consulting Group. Available online: https://spcgroup.com.mx/estudio-de-bias-en-sistemas-de-medicion/ (accessed on 28 May 2022).
Figure 1. Annual mean map of global solar radiation ( Wh / m 2 ).
Environsciproc 19 00025 g001
Figure 2. Error distribution (Heliosat-Stations) based on the value estimated by Heliosat and the adjusted second-degree equation.
Environsciproc 19 00025 g002
Figure 3. (a) Dispersion diagram for the independent sample of the daily sum values of global solar radiation estimated by Heliosat and reported at the stations. The values are shown without rectification. (b) Dispersion diagram for the independent sample of the daily sum values of global solar radiation estimated by Heliosat and reported at the stations. The rectified values are shown.
Environsciproc 19 00025 g003
Figure 4. Annual mean map of rectified global solar radiation.
Environsciproc 19 00025 g004
Table 1. List of daily sum values of global solar radiation reported at the stations and estimated by Heliosat ( Wh / m 2 ).
Station NameDateStation ValueHeliosatVariance
Bahía Honda26 December 2015350645261020
Bahía Honda27 December 20153808.34505696.7
Bahía Honda28 December 201543624567205
Bahía Honda29 December 201539714563592
Bahía Honda30 December 20154016.74577560.3
Bahía Honda31 December 20154081.24562480.8
Publisher’s Note: MDPI stays neutral with regard to jurisdictional claims in published maps and institutional affiliations.

