Proceeding Paper

Long-Term (2012–2021) Variation in Carbonaceous Aerosols of PM2.5 at an Urban Site of Megacity Delhi Situated over Indo-Gangetic Plain of India †

1
CSIR-National Physical Laboratory, Dr. K S Krishnan Road, New Delhi 110012, India
2
Academy of Scientific and Innovative Research (AcSIR), Ghaziabad 201002, India
*
Author to whom correspondence should be addressed.
Presented at the 5th International Electronic Conference on Atmospheric Sciences, 16–31 July 2022; Available online: https://ecas2022.sciforum.net.
Environ. Sci. Proc. 2022, 19(1), 10; https://doi.org/10.3390/ecas2022-12860
Published: 31 July 2022
(This article belongs to the Proceedings of The 5th International Electronic Conference on Atmospheric Sciences)

Abstract

:
A long-term (January 2012 to December 2021) study on carbonaceous aerosols of fine particulates (PM2.5) was conducted over the megacity of Delhi, India, to evaluate their seasonal and yearly variations. During the entire study period, the observed annual mean levels (µg m−3) of PM2.5 and its carbonaceous components (OC, POC, SOC, EM, EC, TCM, and TC) were recorded as 126 ± 72, 15.6 ± 11.6, 9.3 ± 6.3, 6.4 ± 5.1, 8.2 ± 5.6, 7.3 ± 5.1, 33.2 ± 21.9, and 23.1 ± 16.5, respectively. On average, the CAs/TCM ratio accounts for 26% of PM2.5 concentrations. During the monsoon (minimum) and post-monsoon (maximum) season, significant seasonal variability in PM2.5 and its carbonaceous species (OC, EC, POC, SOC, and TCM) was observed. Based on the linear association (OC vs. EC) and ratios (OC/EC as well as EC/TC) of species, three significant sources of CAs (vehicular emissions (VE), fossil fuel combustion (FFC), and biomass burning (BB)) were identified.

1. Introduction

Carbonaceous aerosols (CAs) are the primary contributors of ambient particulates, accounting for up to 70% of fine aerosol mass [1], and they substantially influence atmospheric chemistry, climate, and human health [2]. Majorly, the emission of CAs occurs from fossil fuel combustion, biomass burning, and biogenic emissions [3]. Numerous studies have been carried out in the recent past on CAs of PM2.5 and their potential sources in urban [4,5], rural, remote [6], as well as high-altitude atmospheres [7] of the Indian region with a yearlong dataset or less, but limited studies are available on a long-term basis. Therefore, to comprehend a more detailed knowledge of fine aerosols (PM2.5) and their atmospheric processes and sources, the long-term research of CAs is crucial in the Indo-Gangetic plain (IGP) region of India. The seasonal and annual changes in PM2.5 and its carbonaceous components, such as organic carbon (OC), primary organic carbon (POC), secondary organic carbon (SOC), elemental carbon (EC), total carbonaceous matter (TCM), and total carbon (TC), at the urban site of Delhi were reported in this paper, along with their possible sources.

2. Materials and Methods

Periodic sampling (2 samples a week) of PM2.5 was performed from January 2012 to December 2021 at the CSIR-National Physical Laboratory (28°38′ N, 77°10′ E; 218 m above mean sea level). Delhi, the capital of India, is surrounded by different climatic zones and is considered one of the most polluted megacities in the world [8]. The meteorology of Delhi demonstrates four distinct seasons, which are winter (January to February; temperature: ~3 °C), summer (March to May; temperature: 47 °C), monsoon (June to September; rain: 800 mm), and post˗monsoon (October to December). A detailed description of the sampling location is available in our earlier publication [9].
PM2.5 samples were collected on quartz filters (size: 47 mm) using a fine particle sampler (flow rate: 1 m3 h−1) for 24 h. A Thermo-optical carbon analyzer (Model: DRI 2001A) was used to measure OC and EC following the IMPROVE-A protocol [10]. Detailed operating procedures of the instrument are available in Sharma et al. [9]. The TCM concentration can be computed by the addition of OM (OM = 1.6 × OC; 1.6 factor for PM2.5) and EM (EM = 1.1 × EC) of PM2.5 [11,12]. The EC tracer approach [13] was used for determining the SOC (Equation (1)):
SOC = OC − POC ([OC/EC]min × EC)

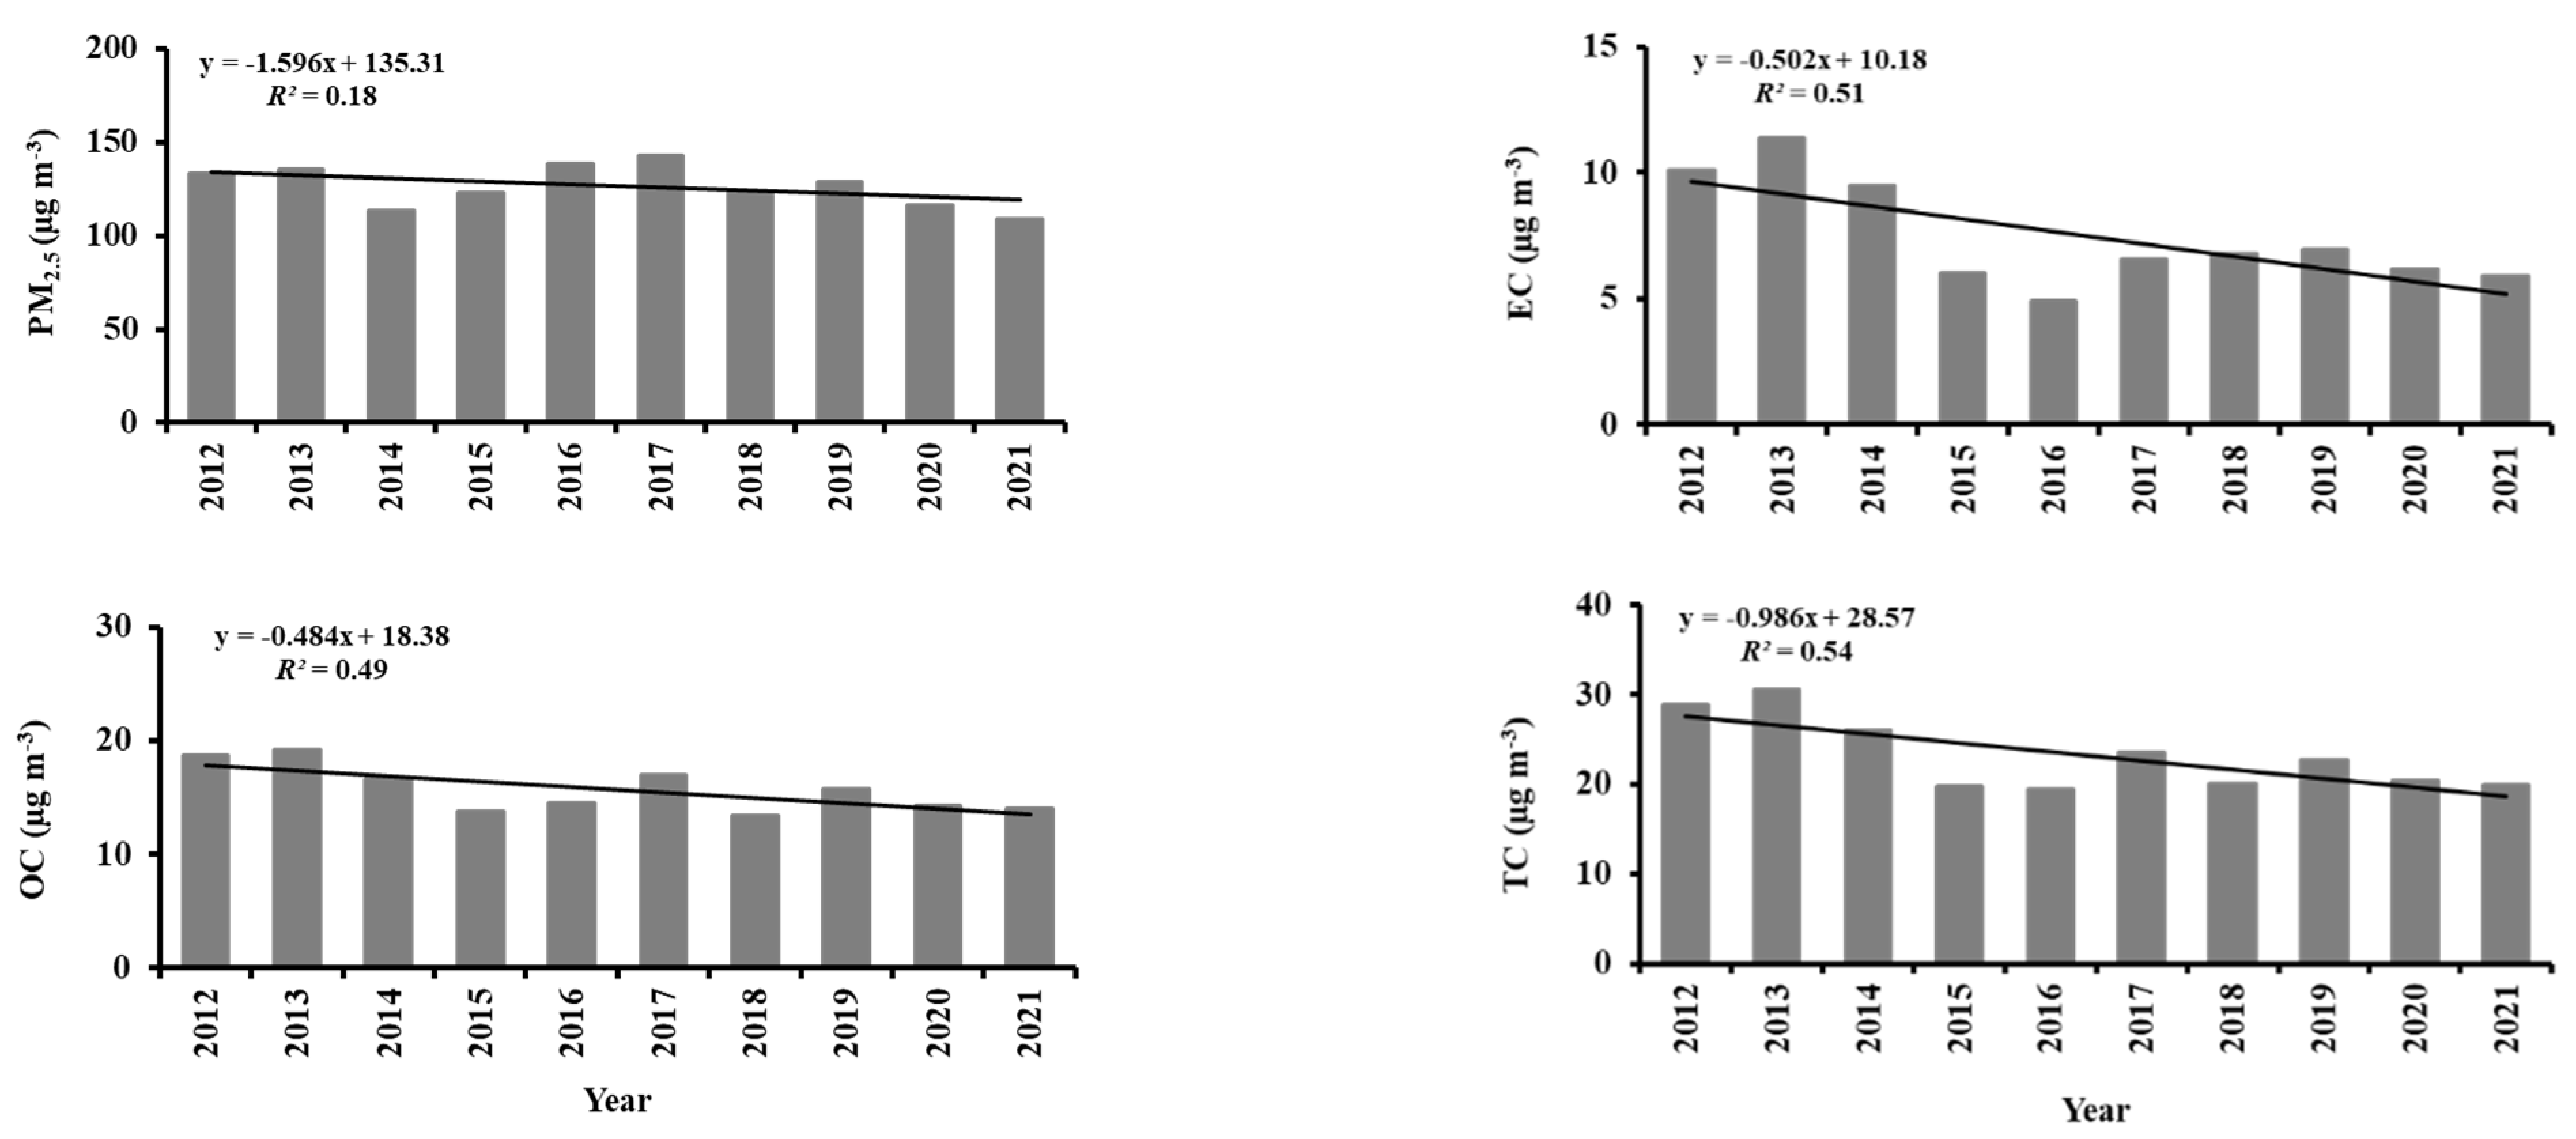
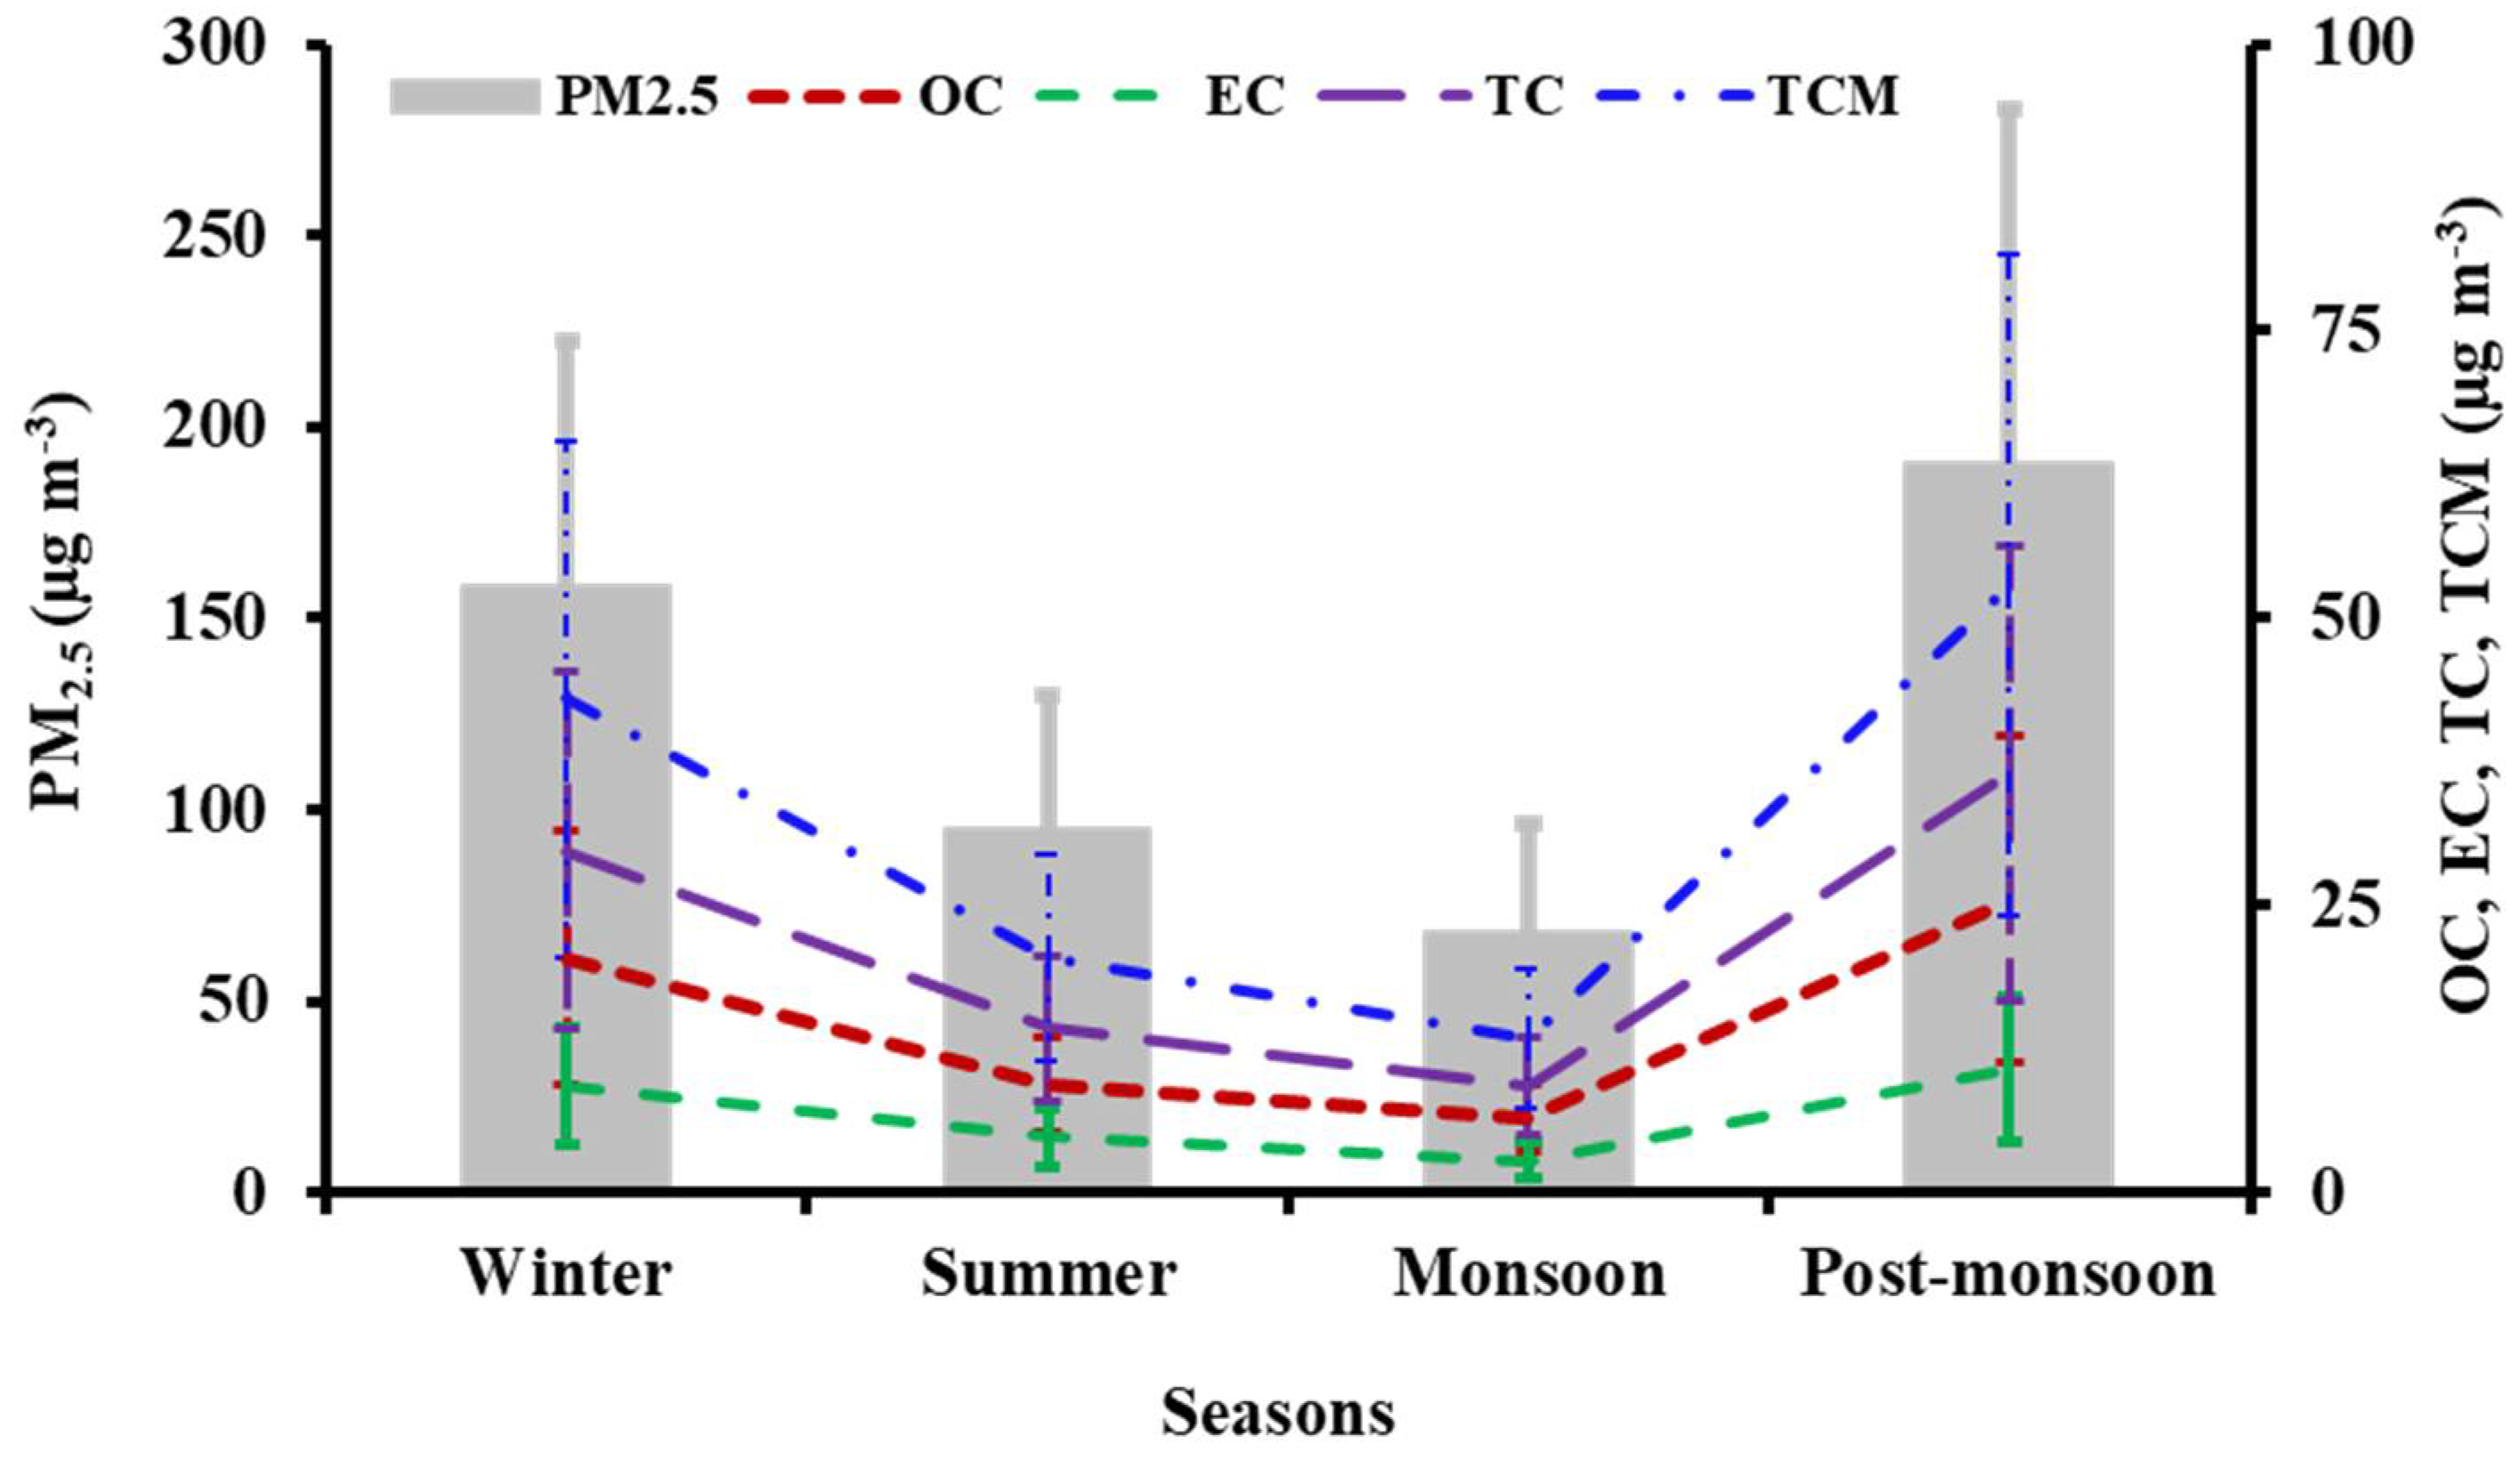
3. Results and Discussion

Figure 1 illustrates the annual changes in PM2.5 and their carbonaceous components (OC, EC, and TC) during the study period (January 2012 to December 2021). In this long-term study, the annual mean (± standard deviation) concentrations (µg m−3) of PM2.5 and their carbonaceous components (OC, POC, SOC, EM, EC, TCM, and TC) were recorded as 126 ± 72, 15.6 ± 11.6, 9.3 ± 6.3, 6.4 ± 5.1, 8.2 ± 5.6, 7.3 ± 5.1, 33.2 ± 21.9, and 23.1 ± 16.5, respectively. Among the species, the contribution (with regard to annual mean level) to PM2.5 was observed highest by TCM (~26%), followed by OC (~12%) and EC (~6%). Similar observations were also stated by Jain et al. [5], with ~25% of TCM, ~12% of OC, and ~5.5% of EC to PM2.5 over Delhi.
Figure 2 illustrates the seasonal variability in PM2.5 and its carbonaceous species (OC, EC, TC, and TCM). PM2.5 and its CAs (OC, EC, TCM, POC, and SOC) were recorded as minimum and maximum during the monsoon and post-monsoon season, respectively (Table 1). This might be owed to the source intensity of PM2.5, prevailing meteorological circumstances, and the long-distance movement of pollutants from Punjab and Haryana to the receptor location [8].
The mass ratio of OC/EC has been used to identify the possible sources of CAs in most studies [14,15]. The higher value of the OC/EC ratio that ranges from 4 to 12 indicates the dominance of biomass burning (BB) [15]. On the other hand, when the OC/EC ratio ranges between 1.4 and 4, it indicates the occurrence of VE together with BB [16]. During the study period, the observed average ratio of OC/EC of PM2.5 were 2.3 ± 0.7, 2.1 ± 0.6, 2.2 ± 0.8, and 2.5 ± 0.8 during winter, summer, monsoon, and post-monsoon seasons, respectively (Table 1). From the observed OC/EC mass ratio, BB and FFC are the major sources of CAs over study site in Delhi. Jain et al. [5] have also reported that BB, FFC, and VE are the main sources of PM2.5 in the megacity Delhi. Sharma et al. [17] investigated the stable carbon and nitrogen isotope of aerosols at a Delhi metropolitan location and revealed that the VE, BB, and FFC are the most likely main sources of aerosols in the city. These sources are also influenced by regional and long-distant transport of pollutants in Delhi.

4. Conclusions

In the present study of a 10-year long-term dataset, the annual and seasonal mean concentrations of PM2.5 and all carbonaceous species vary significantly in the megacity Delhi. In total, about 26% of CAs account for the PM2.5 mass concentration. A substantial variability in the seasonal concentrations of PM2.5 and its associated Cas were observed as follows: post-monsoon > winter > summer > monsoon seasons. A linear relationship was observed between OC and EC, which demonstrates that pollutants are generated from similar combustion sources in Delhi, India. In addition, BB, VE, and FFC are the prominent sources of CAs of PM2.5 suggested by the OC/EC, as well as EC/TC ratios. Thus, the observed results state the significant effect of CAs from different sources.

Author Contributions

Conceptualization and the first draft of the manuscript was prepared by S.K.S. PM2.5 samples collection and chemical analysis were performed by S.K.S., R.B., A.R., M.R. and T.K.M. All the authors read and reviewed the manuscript before communication. All authors have read and agreed to the published version of the manuscript.

Funding

The authors also acknowledge the CSIR-NPL, New Delhi, for the financial support (OLP-200332) for this study.

Institutional Review Board Statement

Not applicable.

Informed Consent Statement

Not applicable.

Data Availability Statement

The datasets are available with corresponding author and will be provided on reasonable request.

Acknowledgments

The authors are thankfully acknowledging to the Director, CSIR-NPL, New Delhi, and Head, ES&BMD, CSIR-NPL, New Delhi, for their support of this study.

Conflicts of Interest

The authors declare no conflict of interest.

References

  1. Lelieveld, J.; Evans, J.S.; Fnais, M.; Giannadaki, D.; Pozzer, A. The contribution of outdoor air pollution sources to premature mortality on a global scale. Nature 2015, 525, 367–371. [Google Scholar] [CrossRef] [PubMed]
  2. Dockery, D.W.; Stone, P.H. Cardiovascular risks from fine particulate air pollution. N. Engl. J. Med. 2007, 356, 511–513. [Google Scholar] [PubMed]
  3. Venkataraman, C.; Habib, G.; Eiguren-Fernandez, A.; Miguel, A.H.; Friedlander, S.K. Residential biofuels in south Asia: Carbonaceous aerosol emissions and climate impacts. Science 2005, 307, 1454–1456. [Google Scholar] [CrossRef] [PubMed]
  4. Sharma, S.K.; Mandal, T.K.; Jain, S.; Saraswati; Sharma, A.; Saxena, M. Source apportionment of PM2.5 in Delhi, India using PMF model. Bull. Environ. Contam. Toxicol. 2016, 97, 286–293. [Google Scholar] [CrossRef] [PubMed]
  5. Jain, S.; Sharma, S.K.; Vijayan, N.; Mandal, T.K. Seasonal characteristics of aerosols (PM2.5 and PM10) and their source apportionment using PMF: A four year study over Delhi, India. Environ. Poll. 2020, 262, 114337. [Google Scholar] [CrossRef] [PubMed]
  6. Begam, G.R.; Vachaspati, C.V.; Ahammed, Y.N.; Kumar, K.R.; Reddy, R.R.; Sharma, S.K.; Saxena, M.; Mandal, T.K. Seasonal characteristics of water soluble inorganic ions and carbonaceous aerosols in total suspended particulate matter at a rural semi-arid site, Kadapa (India). Environ. Sci. Poll. Res. 2017, 24, 1719–1734. [Google Scholar] [CrossRef] [PubMed]
  7. Sharma, S.K.; Mukherjee, S.; Choudhary, N.; Rai, A.; Ghosh, A.; Chatterjee, A.; Vijayan, N.; Mandal, T.K. Seasonal variation and sources of carbonaceous species and elements of PM2.5 and PM10 over the eastern Himalaya. Environ. Sci. Poll. Res. 2021, 28, 51642–51656. [Google Scholar] [CrossRef]
  8. Sharma, S.K.; Banoo, R.; Mandal, T.K. Seasonal characteristics and sources of carbonaceous components and elements of PM10 (2010–2019) in Delhi, India. J. Atmos. Chem. 2021, 78, 251–270. [Google Scholar] [CrossRef]
  9. Sharma, S.K.; Mandal, T.K.; Saxena, M.; Rashmi; Rohtash; Sharma, A.; Gautam, R. Variation of OC, EC, WSIC and trace metals of PM10 in Delhi. J. Atmos. Sol. Terr. Phy. 2014, 113, 10–22. [Google Scholar] [CrossRef]
  10. Chow, J.C.; Watson, J.G.; Chen, L.W.A.; Arnott, W.P.; Moosmuller, H. Equivalence of elemental carbon by thermal/optical reflectance and transmittance with different temperature protocols. Environ. Sci. Technol. 2004, 38, 4414–4422. [Google Scholar]
  11. Amato, F.; Pandolfi, M.; Escrig, A.; Querol, X.; Alastuery, A.; Pey, J.; Perez, N.; Hopke, P.K. Quantification of road dust resuspension in urban environment by multilinear engine: A comparison with PMF2. Atmos. Environ. 2009, 43, 2770–2780. [Google Scholar] [CrossRef]
  12. Malm, W.C.; Schichtel, B.A.; Pitchford, M.L.; Ashbaugh, L.L.; Eldred, R.A. Spatial and monthly trends in speciated fine particle concentration in the United States. J. Geophy. Res. Atmos. 2004, 109. [Google Scholar] [CrossRef]
  13. Castro, L.M.; Pio, C.A.; Harrison, R.M.; Smith, D.J.T. Carbonaceous aerosol in urban and rural European atmospheres: Estimation of secondary organic carbon concentrations. Atmos. Environ. 1999, 33, 2771–2781. [Google Scholar] [CrossRef]
  14. Ram, K.; Sarin, M.M.; Tripathi, S.N. One-year record of carbonaceous aerosols from an urban location (Kanpur) in the Indo-Gangetic Plain: Characterization, sources and temporal variability. J. Geophys. Res. 2010, 115. [Google Scholar] [CrossRef]
  15. Szidat, S.; Jenk, T.M.; Synal, H.A.; Kalberer, M.; Wacker, L.; Hajdas, I.; Kasper-Gieblt, A.; Baltensperger, U. Contribution of fossil fuel, biomass burning and biogenic emissions to carbonaceous aerosols in Zurich as traced by 14C. J. Geophys. Res. 2006, 111, D07206. [Google Scholar] [CrossRef]
  16. Salameh, D.; Detournay, A.; Pey, J.; Pérez, N.; Liguori, F.; Saraga, D.; Bove, M.C.; Brotto, P.; Cassola, F.; Massabò, D.; et al. PM2.5 chemical composition in five European Mediterranean cities: A 1-year study. Atmos. Res. 2015, 155, 102–117. [Google Scholar] [CrossRef]
  17. Sharma, S.K.; Karapurkar, S.G.; Shenoy, D.M.; Mandal, T.K. Stable carbon and nitrogen isotopic characteristics of PM2.5 and PM10 in Delhi, India. J. Atmos. Chem. 2022, 79, 67–79. [Google Scholar] [CrossRef]
Figure 1. Annual trend in PM2.5, EC, OC, and TC levels over Delhi.
Environsciproc 19 00010 g001
Figure 2. Seasonal mean of (error bar: ± SD) OC, EC, TC, and TCM of PM2.5 in Delhi.
Environsciproc 19 00010 g002
Table 1. Seasonal mean of PM2.5 and their carbonaceous species (µg m−3) in Delhi.
SpeciesSeasons
Winter Summer Monsoon Post-Monsoon
PM2.5157 ± 6494 ± 3566 ± 28189 ± 92
OC 20.6 ± 10.99.4 ± 4.36.7 ± 2.825.8 ± 14.2
EC 9.3 ± 5.24.9 ± 2.72.8 ± 1.510.8 ± 6.5
TC 29.7 ± 15.514.4 ± 6.59.5 ± 4.336.5 ± 19.4
POC 11.8 ± 5.96.2 ± 3.13.4 ± 1.713.2 ± 7.1
SOC 8.3 ± 6.63.5 ± 1.83.0 ± 1.612.3 ± 8.6
OC/EC2.3 ± 0.72.1 ± 0.62.2 ± 0.82.5 ± 0.8
Publisher’s Note: MDPI stays neutral with regard to jurisdictional claims in published maps and institutional affiliations.

