Proceeding Paper

Integrated Ground-Based and Satellite Remote Sensing of the Earth’s Surface and Atmosphere in East and West Antarctica with Lidar and Radiometric Systems †

by
Aleksey Malinka
1,*,
Anatoli Chaikovsky
1,
Alexander Prikhach
1,
Eugeny Ilkevich
1,
Andrey Bril
1,
Vladislav Peshcharankou
1,
Natallia Miatselskaya
1,
Vladimir Dick
1,
Mikhail Korol
1,
Vladislav Basylevich
1,
Alexander Kalevich
1,
Igor Alekseev
1,
Fiodar Asipenka
1,
Burcu Ozsoy
2,
Mahmut Oguz Selbesoglu
3,
Ozgun Oktar
2,
Bahadir Celik
4 and
Mustafa Fahri Karabulut
5
1
Institute of Physics, National Academy of Sciences of Belarus, 220072 Minsk, Belarus
2
Tubitak Marmara Research Center, Polar Research Institute, 41470 Kocaeli, Turkey
3
Department of Geomatics Engineering, Faculty of Civil Engineering, Istanbul Technical University, 34467 İstanbul, Turkey
4
Department of Geomatics Engineering, Faculty of Engineering, Osmaniye Korkut Ata University, 80000 Osmaniye, Turkey
5
Department of Geomatics Engineering, Faculty of Civil Engineering, Yildiz Technical University, 34349 Beşiktaş, Turkey
*
Author to whom correspondence should be addressed.
Presented at the 5th International Electronic Conference on Atmospheric Sciences, 16–31 July 2022; Available online: https://ecas2022.sciforum.net.
Environ. Sci. Proc. 2022, 19(1), 11; https://doi.org/10.3390/ecas2022-12808
Published: 14 July 2022
(This article belongs to the Proceedings of The 5th International Electronic Conference on Atmospheric Sciences)

Abstract

:
We have developed remote ground-based and satellite methods and hardware and software for studying atmospheric aerosols, clouds, and the underlying surface in Eastern and Western Antarctica. The ground-based equipment includes: (1) a CIMEL solar spectrum photometer, which measures the spectrum of solar radiation transmitted and scattered by the atmosphere, (2) a multi-wavelength Raman lidar, which measures the vertical backscatter profile, (3) an albedometer, which measures the spectral albedo of the surface, primarily snow, and (4) a reflectometer, which measures the directional spectral reflectance of snow. The ground-based measurement data were integrated with data from satellite radiometers MODIS or OLCI and the satellite lidar CALIOP. A synergy of the manifold data results in retrieval of various atmosphere and surface characteristics such as the aerosol optical depth, profiles of concentration of the fine and coarse aerosol fractions, spatial distribution of the effective snow grain size, fraction of outcrops, etc.

1. Introduction

Research by Belarusian scientists in Antarctica began in 2006, when the Belarusian scientific group began measuring the ozone content in the atmosphere as part of the 52nd Russian Antarctic Expedition. In 2008, Belarusian scientists created the radiometric sounding station Vechernaya Hill (67.66° S, 46.16° E) near Mount Vechernyaya [1], which became part of the AERONET global radiometric network [2,3].
In 2011–2015, the program of observations at the Belarusian scientific station, in addition to the solar radiometric observations, included measurements of the altitude dependence of optical parameters of the atmosphere by means of a lidar. A spectral albedometer for measuring the reflectance spectra of the earth’s surface was also built, and its performance was successfully tested in Antarctica [4].
Turkey has been conducting regular expeditions to the Antarctic since 2016 and plans to establish a stationary research station on the Antarctic Peninsula [5,6].
An important role in the formation of a monitoring system for the atmosphere and underlying surface in Antarctica is assigned to space observation systems. Algorithms to retrieve parameters of the snow surface from satellite measurements were developed [7,8]. The degree of coverage of the territory by snow and its average spectral albedo, as well as the level of pollution and the size of snow granules are the most important parameters that determine the radiation balance of polar regions. These data are necessary for studying the metamorphism of the snow and ice cover of Antarctica.

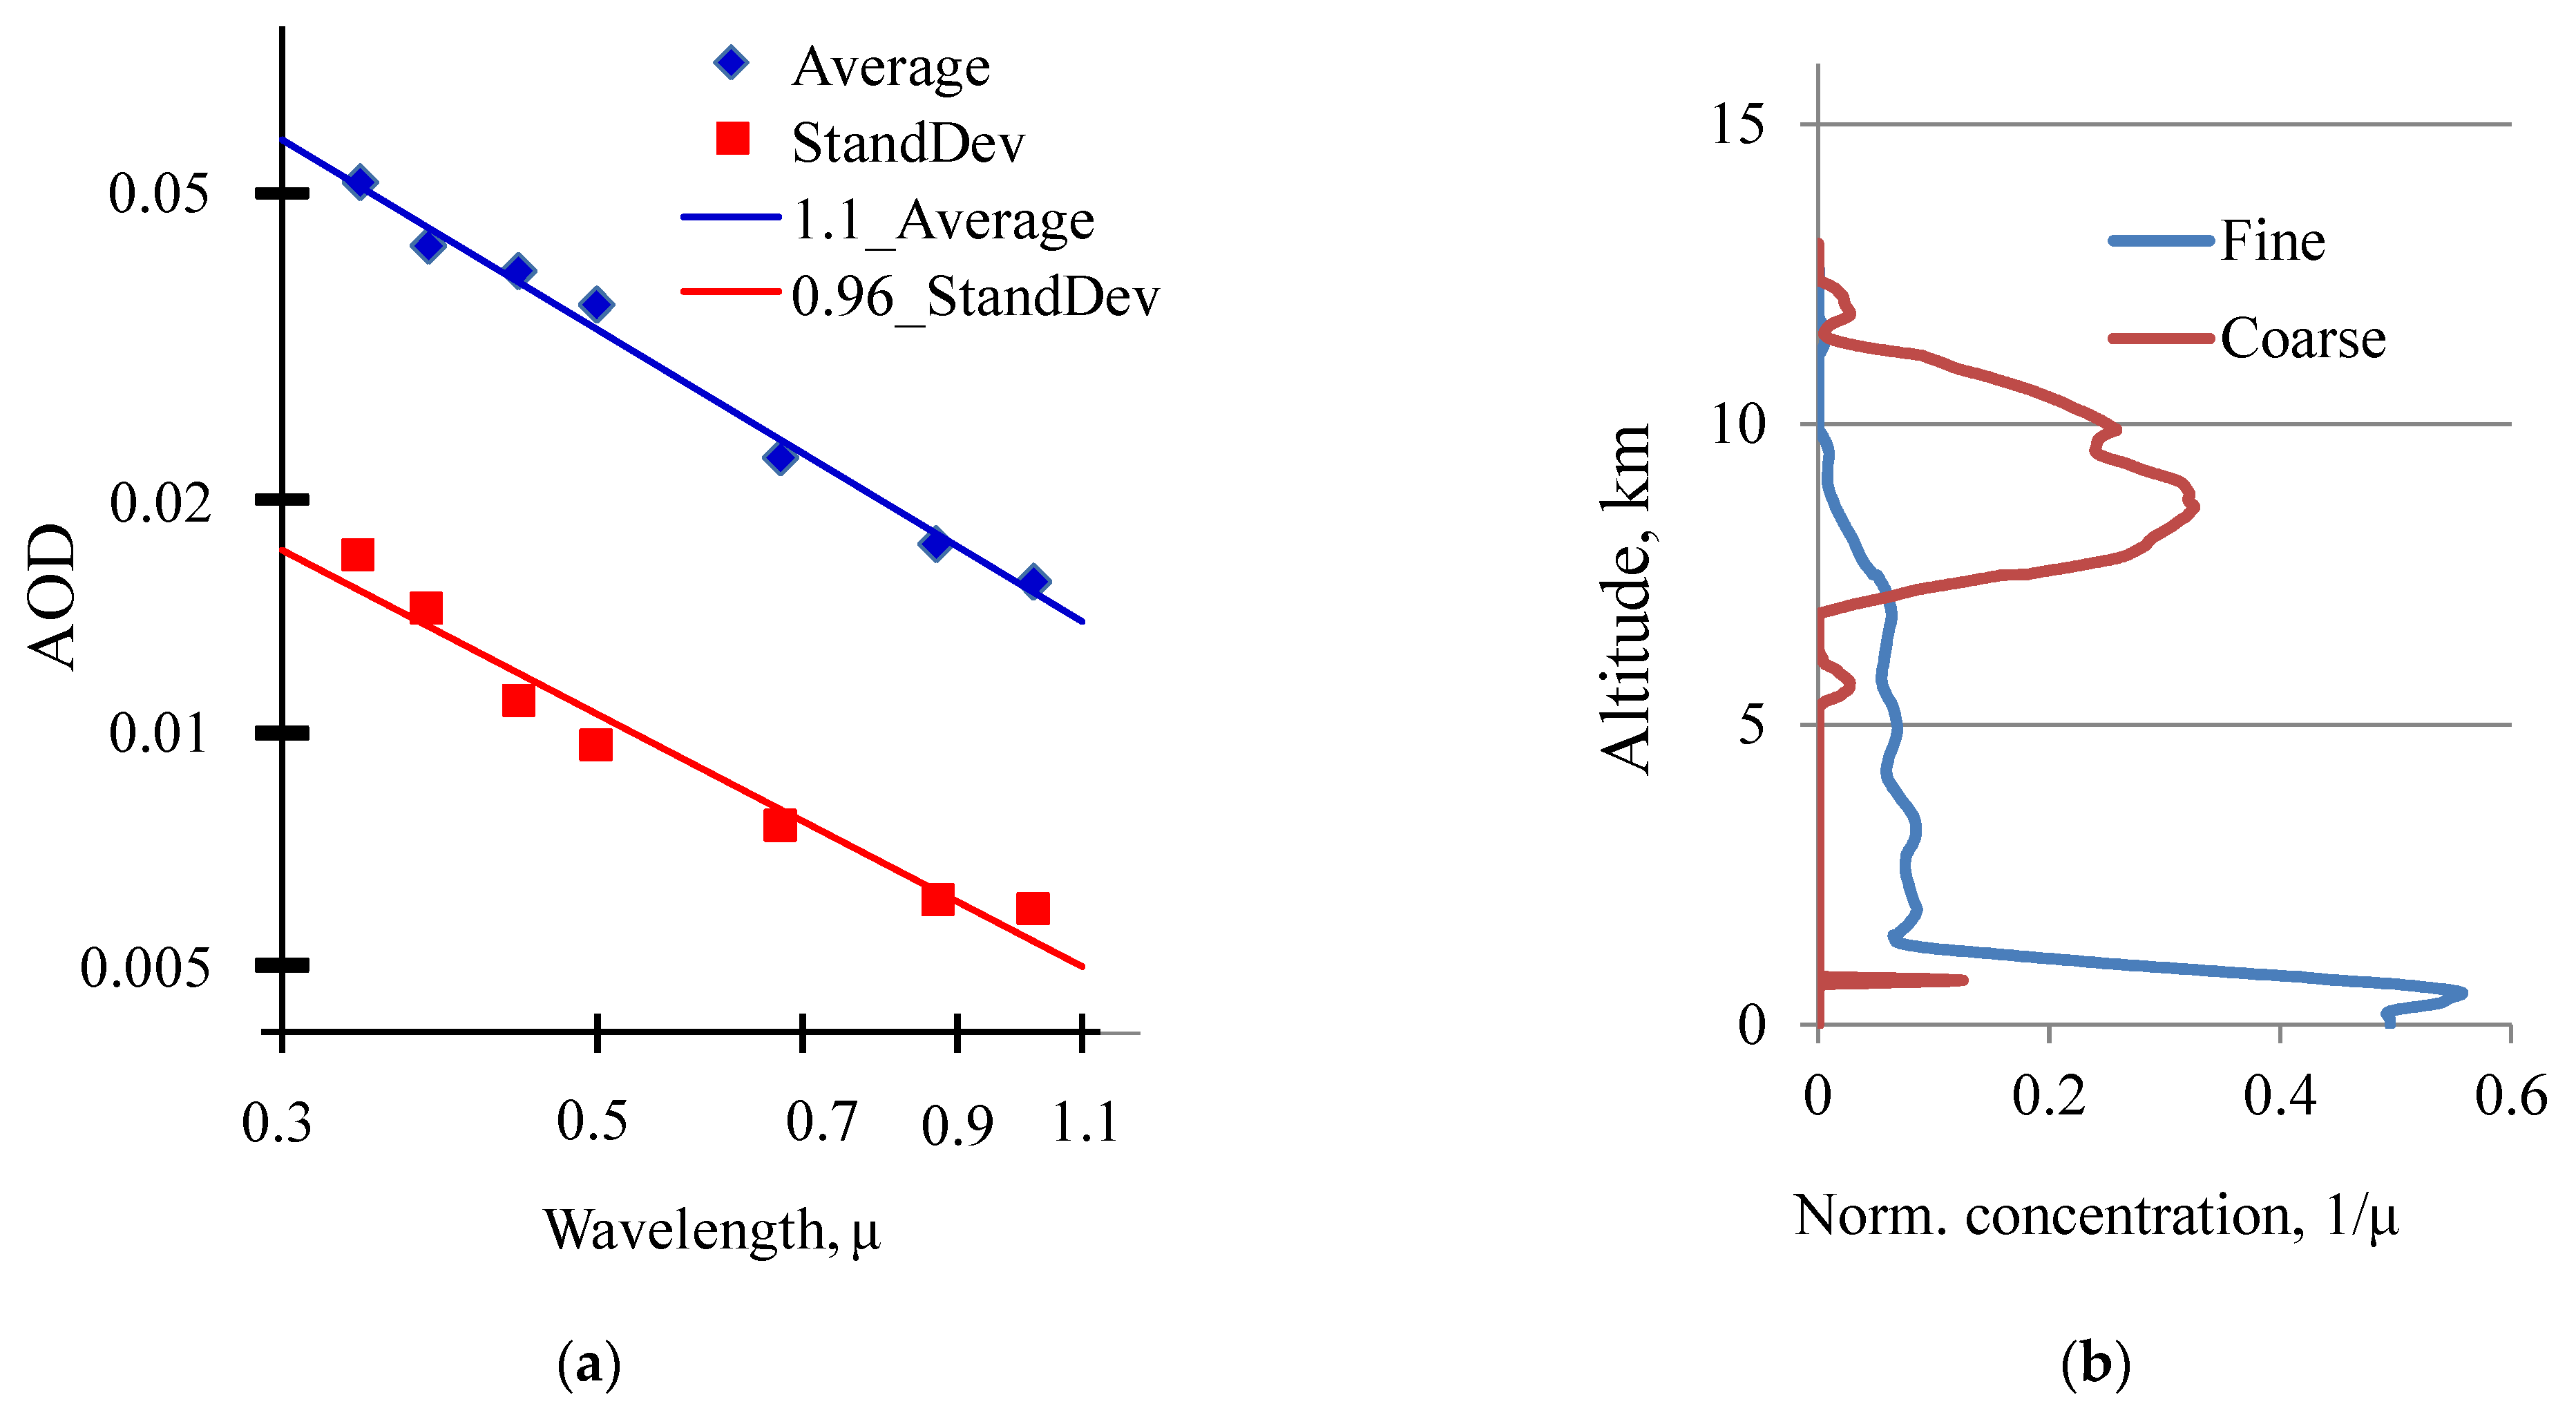
2. Combined Ground-Based and Satellite Investigations of Atmospheric Aerosols in the Region of Belarusian Antarctic station Gora Vechernyaya

The methodology for aerosol sounding with ground- and satellite-based lidars and solar spectrometric systems (hereinafter called LRS, for Lidar & Radiometer Sounding) uses a synergistic approach to the organization of measurements and development of algorithms to process the combined data. The result of a complex experiment is a complete set of parameters of an optical aerosol model required to describe the process of radiative transfer in an aerosol layer stratified along height [9,10,11]. Whereas the sources of radiometric data in the LRS are stations of the AERONET, lidar data are provided by stations of lidar networks (EARLINET, AD-Net, CIS-LiNet) and the satellite lidar CALIOP. Currently, the LRS is successfully used to study Eurasian aerosols [12]. In 2018, the first LRS measurements in Antarctica to study long-range smoke transport to Enderby Land were performed at the Belarusian Antarctic station Gora Vechernyaya [13]; since then, the LRS has become a part of the regular observations in Belarusian Antarctic expeditions.
Figure 1 shows some results of optical observations at the Gora Vechernyaya station.
Observation seasons usually last from December to early March. The spectral distribution of the AOD (Aerosol Optical Depth) have been averaged first across a season and then across years. The standard deviation refers to the dispersion of the season-averaged values over years. The spectral dependences are approximated by a power law and represented in the plot by straight lines, the line slope shown in the legend is the exponent of the power law.
Figure 1b presents the average height profiles of the volume concentration of fine and coarse particles according to the terminology used in AERONET [2]. In this plot, the concentration profiles are normalized by the column amount, which is an integral of the concentration over height.
The average column amount of the fine fraction is about 0.05 μm as compared to 0.005 μm for the coarse one, i.e., the column amount of the fine mode at the region of Mount Vechernyaya is about 10 times higher than that of the coarse one.

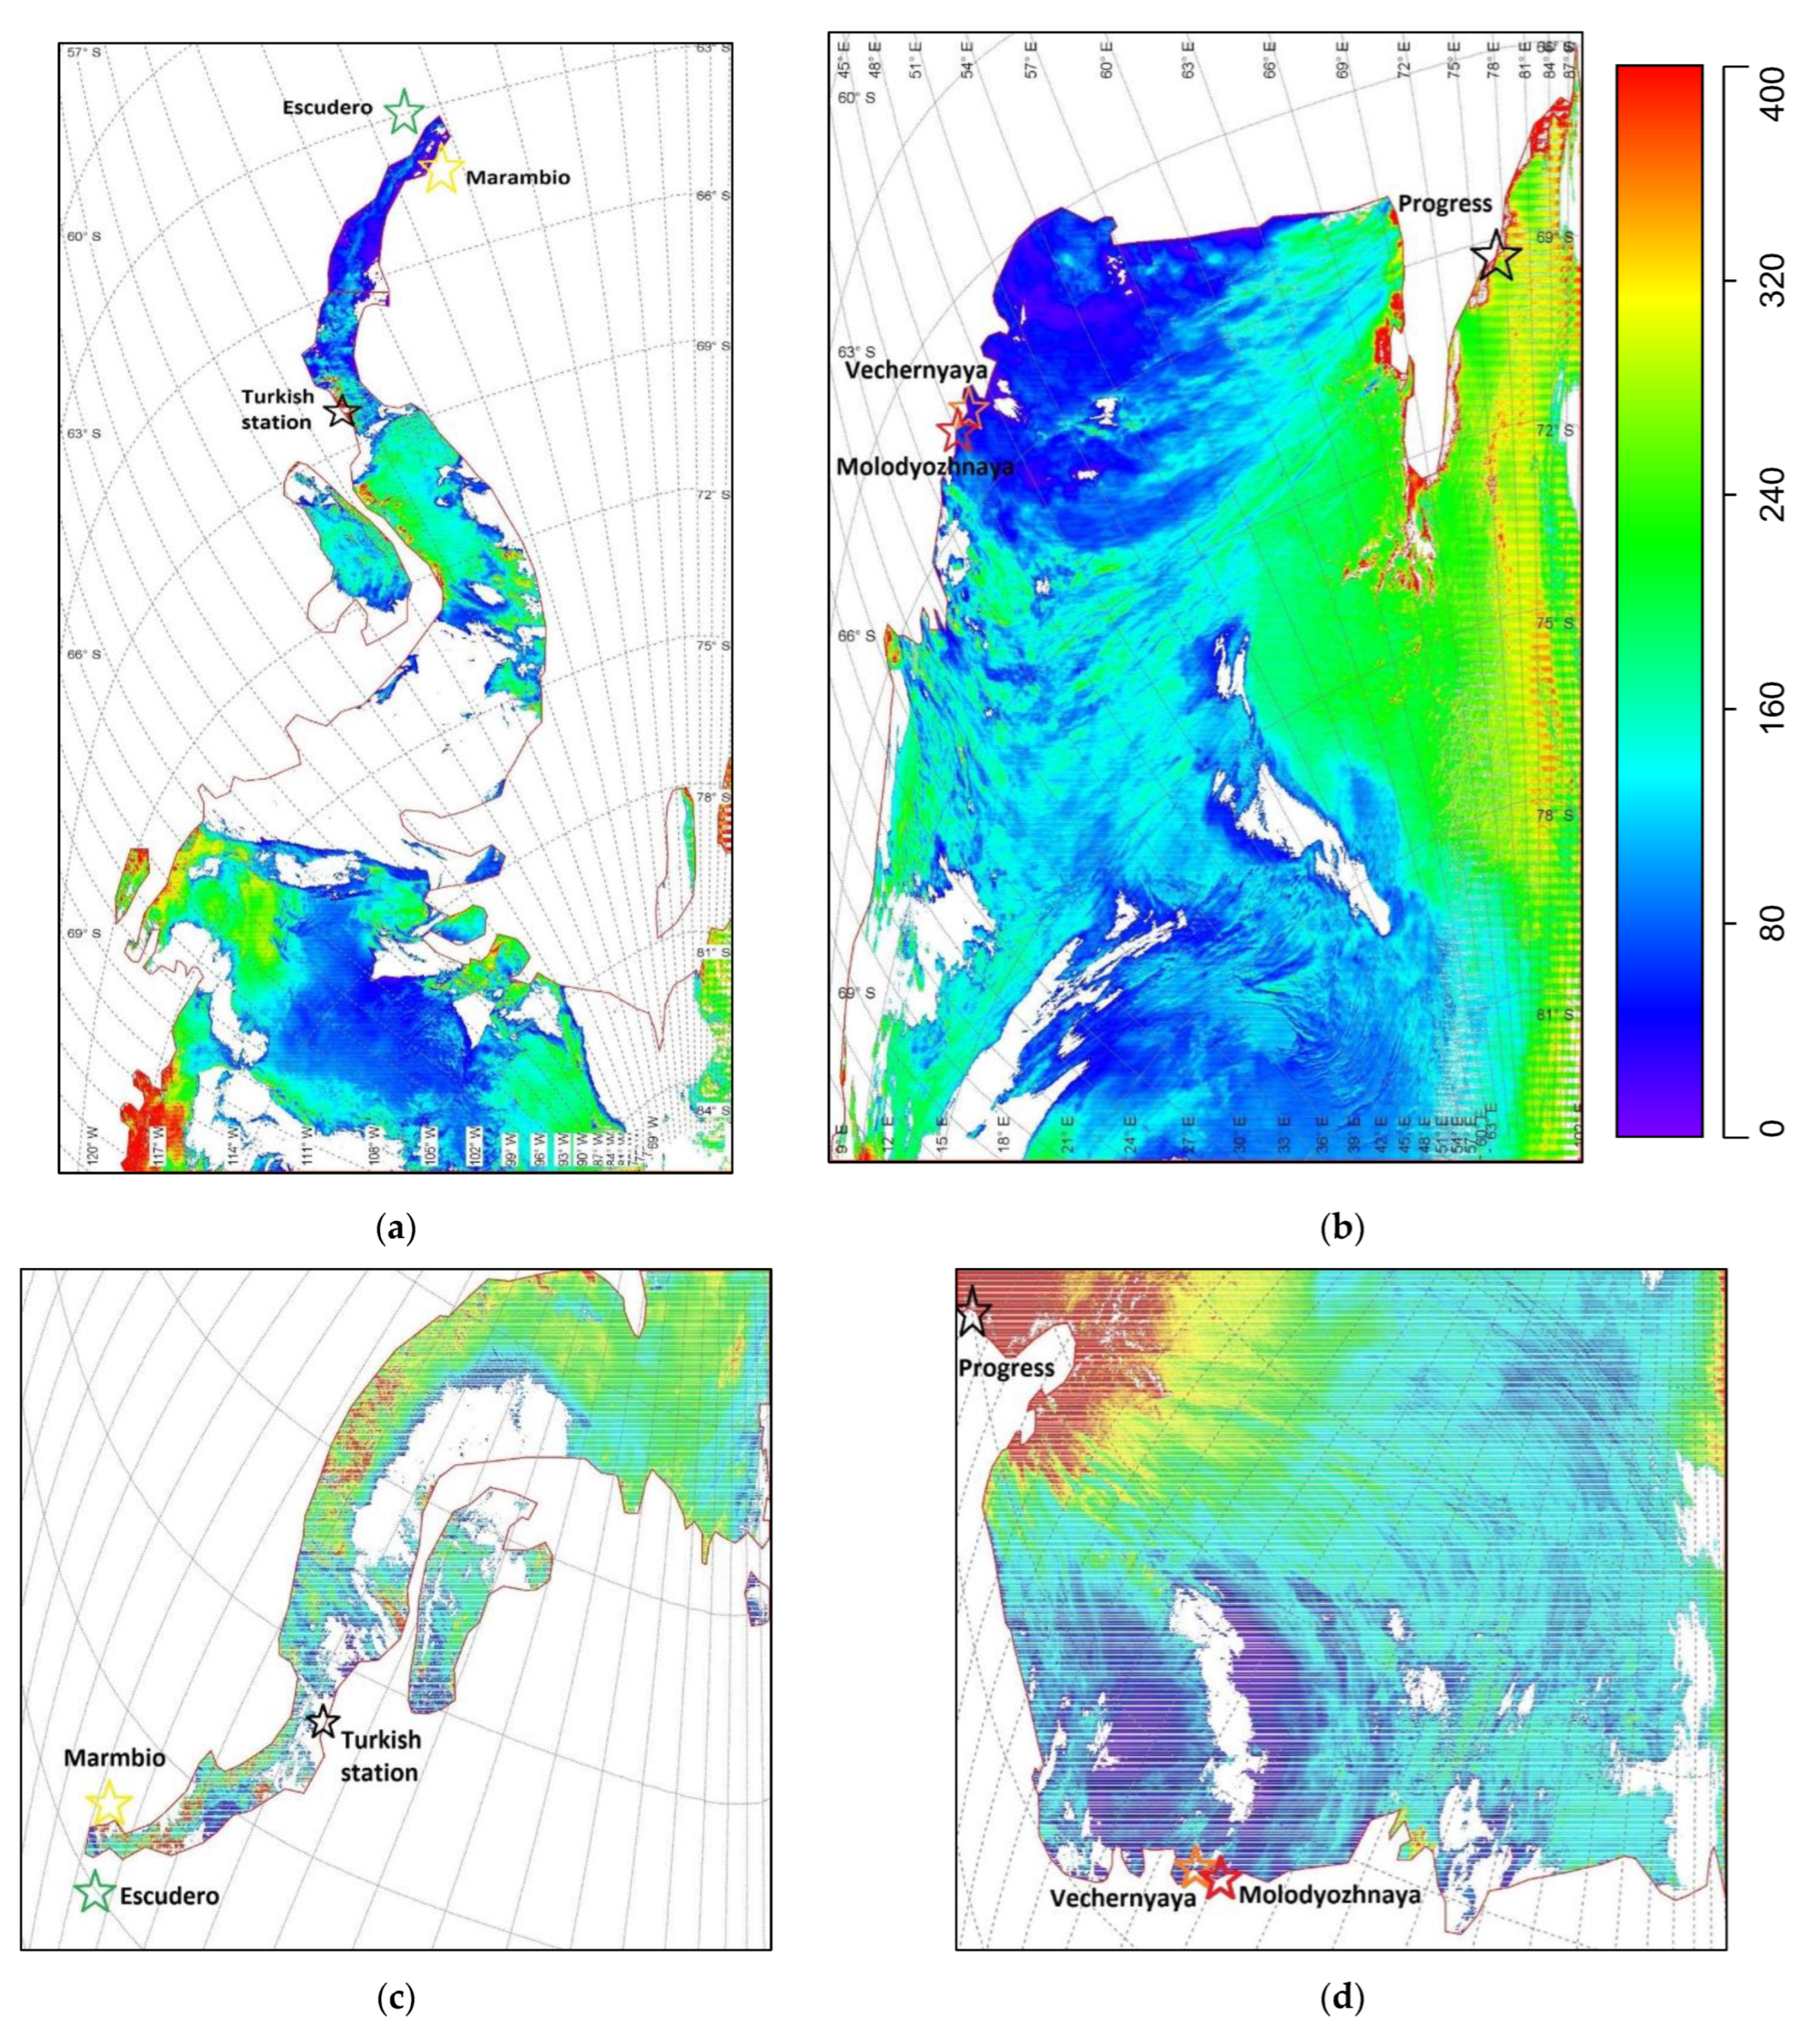
3. Snow Cover Studies in the Regions of East and West Antarctica Using Satellite Data

3.1. Algorithm ASAR

The snow cover has a significant influence on the Earth’s albedo and, accordingly, on its climate. The development of satellite sensing methods, in particular, monitoring of snow age, degree of pollution, and grain size, becomes especially important for the polar regions, where direct measurements are difficult.
The main feature of the snow cover of Antarctica is its purity. According to [14], the average concentrations of black carbon are 0.1–0.3 ng/g at the South Pole station and 0.6 ng/g at the Vostok station (coast). The peak concentration at the Vostok station reached 7 ng/g, which is still too low to show up in optical measurements.
On the other hand, strong winds over Antarctica in winter, as well as snowmelt in summer, result in rock outcrops. The outcrops can be fragmented, i.e., occupy limited areas of several hundred square meters. Since satellite radiometers, such as MODIS, have a spatial resolution of about 1 × 1 km2, a pixel may be mixed: partly occupied by snow, partly by rocks, which can significantly reduce the pixel albedo in the visible range. Thus, to correctly determine the size of snow grains, it is required to estimate the fraction of a pixel that is free of snow.
An algorithm to retrieve the effective snow grain size, rock fraction, and albedo of a mixed snow/rock pixel from satellite data over Antarctica was developed at the Institute of Physics of NAS of Belarus and implemented in the form of the ASAR code (Antarctic Snow Albedo Retriever).
The first feature of the ASAR algorithm is to consider the purity of the snow cover in Antarctica. In this modification of the algorithm, the concentration of black carbon is assumed to be zero. The second feature is that the rock fraction per pixel is estimated from satellite data. For such a bright surface as snow, the angular dependence of reflectance may be significant, because of the anisotropy of the phase function of light scattering by snow grains. Since the shape of the snow grain is not known a priori, the angular dependence of reflectance cannot be predicted either; therefore, it should be estimated from the satellite data as well. This comprises the third feature. Data on the angular distribution of reflectance by rocks are rather scarce; however, their albedo is quite low, and the contribution of reflectance from rocks is much lower than that from snow. Thus, reflection from rocks is considered to obey Lambert’s law.
The algorithm does not use any specific snow model or a priori information about the shape of snow grains. It uses only the spectral information obtained by a satellite radiometer and is based on the asymptotic dependence of the bidirectional reflectance of a semi-infinite snow layer on the particle size [7,8].
This implementation of the method, the results of which are presented herein, uses the MODIS spectroradiometer [15], but a version that processes the OLCI [16] data has also been developed. Herein, MODIS channels no. 2, 3, and 5 are used, because rocks reduce albedo mainly in the visible range (#3, 469 nm), while snow noticeably absorbs light in the near infrared (#5, 1.24 µm). Channel 2 (859 nm) is an additional channel that eliminates the uncertainty associated with the angular dependence of the snow brightness. In addition, none of these channels matches the absorption bands of atmospheric gases, in particular, ozone.

3.2. Spatial Distribution of the Snow Grain Size in East and West Antarctica

MODIS radiometer data are available on the official website of the LAADS (The Level-1 and Atmosphere Archive & Distribution System) [17]. The original MODIS data files in the HDF4 format, after being converted to the modern HDF5 format, are processed by the ASAR software package. As a result of processing, a set of statistical information is obtained in the form of maps of various parameters of the underlying surface, such as the effective size of snow grains, rock fraction, and average pixel albedo. The retrieved data are saved in the HDF5 format and can be used for further processing and analysis.
Figure 2 show maps of the spatial distribution of snow grain sizes in West and East Antarctica, retrieved with the ASAR algorithm from satellite data related to the beginning of 2022. The red line on the maps indicates the coastline of Antarctica. Note that in the images taken by the Terra satellite, the north is at the bottom of the map, whereas in the images taken by the Aqua satellite, it is at the top, because Terra and Aqua move in opposite directions.
Figure 2 demonstrates significant differences in the state of the snow cover of Antarctica depending on the region. According to Terra data (Figure 2b), the size of snow grains in Enderby Land (the area of Molodyozhnaya and Gora Vechernyaya stations) does not exceed 100 µm, which corresponds to fresh snow that has not undergone metamorphism [18]. On the Antarctic Peninsula (Figure 2a,c), snow grains are much larger, especially on the western coast of the peninsula, including the location of the Turkish station (about 300 µm and above), which indicates significant metamorphism due to melting, temperature gradient, and other reasons [18,19]. However, the largest grains (larger than 400 µm) are observed on the coast of the Prydz Bay (Figure 2b, the Progress station area). Such values could have been taken as an “artifact” associated with the data unreliability at the edge of the satellite image; however, the data from the MODIS Aqua radiometer (Figure 2d) confirm the anomalously high values of the snow grain size in this area. Hence, the difference in the effective size of snow grains in these regions during the current Antarctic summer can be considered reliably established. Probably, this difference may be due to the ocean influence, which is stronger in the “more maritime” regions of the Antarctic Peninsula and Prydz Bay than in the “more continental” Enderby Land.

Author Contributions

Conceptualization, methodology, writing, A.M. and A.C.; software A.P.; instrument design, V.P., V.D., M.K., V.B., A.K. and F.A.; measurements, I.A., M.O.S. and O.O.; data processing, A.M., A.C., E.I., A.B., N.M., B.C. and M.F.K.; supervision, A.M. and B.O. All authors have read and agreed to the published version of the manuscript.

Funding

This study is a result of the bilateral cooperation projects between the Scientific and Technological Research Council of Turkey (TUBITAK, project no. 119N650) and the National Academy of Sciences of Belarus (NAS) and the Belarusian Republican Foundation for Fundamental Research (project no. F22TUB-001).

Conflicts of Interest

The authors declare no conflict of interest. The funders had no role in the design of the study; in the collection, analyses, or interpretation of data; in the writing of the manuscript; or in the decision to publish the results.

References

  1. Zege, E.; Katsev, I.; Korol, M.; Goloub, F.; Ivanov, A.; Blarel, L.; Denisov, S.; Dick, V.; Malinka, A.; Osipenko, E.; et al. Optical studies of the atmosphere and surface in Antarctic. In Belarus in Antarctic: On the 10th Anniversary of the Beginning of Scientific and Expeditional Research; Loginov, V.F., Ed.; Belaruskaya Navuka: Minsk, Belarus, 2016; pp. 50–101. [Google Scholar]
  2. AERONET: The Aerosol Robotic Network. Available online: http://aeronet.gsfc.nasa.gov/ (accessed on 10 June 2022).
  3. Holben, B.N.; Eck, T.F.; Slutsker, I.; Tanré, D.; Buis, J.P.; Setzer, A.; Vermote, E.; Reagan, J.A.; Kaufman, Y.J.; Nakajima, T.; et al. AERONET—A federated instrument network and data archive for aerosol characterization. Remote Sens. Environ. 1998, 66, 1–16. [Google Scholar]
  4. Chaikovsky, A.P.; Malinka, A.V.; Korol, M.M.; Zege, E.P.; Katsev, I.L.; Prikhach, A.S.; Bril, A.I.; Dick, V.P.; Basylevich, V.A.; Denisov, S.V.; et al. Ground-based and space studies of the atmosphere and Earth’s surface in the Antarctic. In Scientific Research of Belarus in the Antarctic; Loginov, V.F., Ed.; Belaruskaya Navuka: Minsk, Belarus, 2021; pp. 36–54. [Google Scholar]
  5. Yavaşoğlu, H.; Karaman, H.; Özsoy, B.; Bilgi, S.; Tutak, B.; Gengeç, A.G.; Oktar, Ö.; Yirmibeşoğlu, S. Site selection of the Turkish Antarctic Research station using Analytic Hierarchy Process. Polar Sci. 2019, 22, 100473. [Google Scholar] [CrossRef]
  6. Wenger, M. Turkey plans its own Antarctic station. Polar J. 2021. Available online: https://polarjournal.ch/en/2021/02/25/turkey-plans-its-own-antarctic-station/ (accessed on 10 June 2022).
  7. Zege, E.; Katsev, I.; Malinka, A.; Prikhach, A.; Polonsky, I. New algorithm to retrieve the effective snow grain size and pollution amount from satellite data. Ann. Glaciol. 2008, 49, 139–144. [Google Scholar] [CrossRef]
  8. Zege, E.; Malinka, A.; Katsev, I.; Prikhach, A.; Heygster, G.; Istomina, L.; Birnbaum, G.; Schwarz, P. Algorithm to retrieve the melt pond fraction and the spectral albedo of Arctic summer ice from satellite optical data. Rem. Sens. Environ. 2015, 163, 153–164. [Google Scholar] [CrossRef]
  9. Calbet, X. Assessment of adequate quality and collocation of reference measurements with space-borne hyperspectral infrared instruments to validate retrievals of temperature and water vapour. Atmos. Meas. Tech. 2016, 9, 1–8. [Google Scholar] [CrossRef]
  10. Newchurch, M.J.; Alvarez, R.J.; Berkoff, T.A.; Carrion, W.; DeYoung, R.J.; Ganoe, R.; Gronoff, G.; Kirgis, G.; Kuang, S.; Langford, A.O.; et al. Lidar&radiometer inversion code (LIRIC) for synergetic processing of EARLINET, AERONET and CALIPSO lidar data. EPJ Web Conf. 2018, 176, 08007. [Google Scholar] [CrossRef]
  11. Chaikovsky, A.P.; Bril, A.I.; Fedarenka, A.S.; Peshcharankou, V.A.; Denisov, S.V.; Dick, V.P.; Asipenka, F.P.; Miatselskaya, N.S.; Balin, Y.S.; Kokhanenko, G.P.; et al. Synergy of Ground-Based and Satellite Optical Remote Measurements for Studying Atmospheric Aerosols. J. Appl. Spectrosc. 2020, 86, 1092–1099. [Google Scholar] [CrossRef]
  12. Chaikovsky, A.; Bril, A.; Dubovik, O.; Fedarenka, A.; Goloub, P.; Hu, Q.; Lopatin, A.; Lapyonok, T.; Miatselskaya, N.; Torres, B.; et al. Synergetic observations by ground-based and space lidar systems and AERONET sun-radiometers: A step to advanced regional monitoring of large-scale aerosol changes. EPJ Web Conf. 2020, 237, 02035. [Google Scholar] [CrossRef]
  13. Malinka, A.; Blarel, L.; Chaikovskaya, L.; Chaikovsky, A.; Denishchik-Nelubina, N.; Denisov, S.; Dick, V.; Fedaranka, A.; Goloub, P.; Katsev, I.; et al. Ground-Based and Satellite Optical Investigation of the Atmosphere and Surface of Antarctica. EPJ Web Conf. 2018, 176, 10006. [Google Scholar] [CrossRef]
  14. Grenfell, T.C.; Warren, S.G.; Mullen, P.C. Reflection of solar radiation by the Antarctic snow surface at ultraviolet, visible, and near-infrared wavelengths. J. Geophys. Res. 1994, 99, 18669–18684. [Google Scholar] [CrossRef]
  15. MODIS (Moderate Resolution Imaging Spectroradiometer). Available online: https://modis.gsfc.nasa.gov/ (accessed on 10 June 2022).
  16. Sentinel-3. Available online: https://earth.esa.int/web/guest/missions/esa-future-missions/sentinel-3 (accessed on 10 June 2022).
  17. LAADS (The Level-1 and Atmosphere Archive & Distribution System). Available online: https://ladsweb.modaps.eosdis.nasa.gov/search/ (accessed on 10 June 2022).
  18. Krol, Q.; Löwe, H. Analysis of local ice crystal growth in snow. J. Glaciol. 2016, 62, 378–390. [Google Scholar] [CrossRef]
  19. Flin, F.D.R.; Brzoska, J.-B.; Lesaffre, B.; Ou, C.C.C.; Pieritz, R.A. Full three-dimensional modelling of curvature-dependent snow metamorphism: First results and comparison with experimental tomographic data. J. Phys. D 2003, 36, A49–A54. [Google Scholar] [CrossRef]
Figure 1. Results of optical measurements at station Gora Vechernyaya: (a) AOD spectrum. Markers denote the measured spectral AOD and its standard deviations for the measurement period 2008–2021. Straight lines are the linear regression of the spectral dependences in the logarithmic scale; the slopes are indicated in the legend. (b) Altitude distributions of the fine and coarse fractions averaged over 2018–2019.
Environsciproc 19 00011 g001
Figure 2. Maps of the effective grain size: (a) Antarctic Peninsula, Terra, 01/07/2022; (b) East Antarctica, Terra, 01/07/2022; (c) Antarctic Peninsula, Aqua, 01/08/2022; (d) East Antarctica, Aqua, 01/07/2022. The color scale is in micrometers.
Environsciproc 19 00011 g002
Publisher’s Note: MDPI stays neutral with regard to jurisdictional claims in published maps and institutional affiliations.

