Article

A Pre-Trial Study to Identify Species of Origin in Halloumi Cheese Utilising Chemometrics with Near-Infrared and Hyperspectral Imaging Technologies

1
Department of Chemistry, Faculty of Pure and Applied Science, University of Cyprus, P.O. Box 20537, CY-1678 Nicosia, Cyprus
2
National Measurement Laboratory, Centre of Excellence in Agriculture and Food Integrity, Institute for Global Food Security, School of Biological Sciences, Queen’s University Belfast, 19 Chlorine Gardens, Belfast BT9 5DL, UK
3
School of Food Science and Technology, Faculty of Science and Technology, Thammasat University, 99 Mhu 18, Pahonyothin Road, Khong Luang 12120, Thailand
*
Authors to whom correspondence should be addressed.
Analytica 2024, 5(1), 17-27; https://doi.org/10.3390/analytica5010002
Submission received: 12 October 2023 / Revised: 6 November 2023 / Accepted: 18 December 2023 / Published: 9 January 2024

Abstract

:
Halloumi cheese has recently gained a Protected Designation of Origin (PDO) indicator, which is related to the place (Cyprus) in which halloumi cheese is made. The PDO label is linked with several requirements, e.g., milk species, quantities, etc.; thus, it is important to study this product regarding authenticity. The utility of using two spectroscopic techniques, hyperspectral imaging (HSI) (400–1000 nm) and conventional near-infrared spectroscopy (NIR) (800–2500 nm) were assessed for the discrimination of 17 Cypriot halloumi cheese types, which could be categorized as of cow or goat–sheep origin. The aim of this study was to obtain spectral information for halloumi cheese using other promising infrared and imaging spectroscopic techniques as a comparison to a previously acquired mid-infrared (MIR) spectroscopy dataset. NIR and HSI are both fast and easy techniques in application, both of which provide significant information in food analysis. Chemometric analysis was crucial for interpreting the spectroscopic data by applying the unsupervised methods: principal component analysis (PCA) and hierarchical cluster analysis (HCA). The HSI model was found to be based intuitively on the appearance of cheese samples after freeze-drying (e.g., color; yellow/white, and texture; oily/dry), while the NIR grouping of samples was determined to be based on composition, mainly fat, protein and lactose content of the cheese samples. The HSI model returned distinct clusters of the two halloumi cheese types, cow and goat–sheep origin, with one outlier (16/17 accuracy; 94%), while the NIR model proved less accurate (13/17; 76%).

1. Introduction

There is emerging interest in products that are made using goat milk, as this type of milk has the potential to improve digestibility and enhance nutritional characteristics or value whilst reducing symptoms from exposure to allergens commonly found in cow milk [1,2]. The total protein content of milk consists of true proteins (e.g., casein and albumin) and non-protein nitrogenous compounds. Possible differences in the content or physical structure of true proteins and differences in the ratio of true protein and non-protein nitrogen in milk are usually due to samples that have been collected from different animals [3]. Amino acid composition, the secondary structure of proteins, alongside fat globules, are the main factors influencing the differences between milk of goat and cow origin [4,5,6]. The milk used to produce halloumi is usually a combination of goat–sheep or cow–goat–sheep milk. Dairy products of goat origin are more expensive than those of cow origin due to the above characteristics as well as the lower production of goat-origin milk due to lower yield. Therefore, the economically motivated adulteration (EMA) of goat-origin products with water, whey, urea, cow-origin milk, starch [7,8,9], and milk powder [10] has been reported.
To assess quality or adulteration issues, chemical analyses are often conducted by using laboratory-based techniques such as chromatography (e.g., gas chromatography, liquid chromatography) and mass spectrometry (MS) to precisely identify and quantify specific components or contaminants in a sample. Physical attributes of products, such as texture, viscosity, density, and color, are measured using techniques such as rheology, viscometry, densitometry, and colorimetry. In terms of microbiological analysis, to detect the presence of harmful microorganisms or assess the microbial quality of products, industries often use techniques such as agar plate culturing and polymerase chain reaction (PCR). In addition, techniques such as adulterant-specific chemical tests, microscopy, and elemental analysis have been used to identify the presence of contaminants, diluents, or substitute materials in products. They are valuable tools in food analysis due to their versatility, and high separation capabilities, and can augment the ability of hyphenated MS techniques to detect and quantify a wide range of analytes. However, these techniques, especially MS, have not always performed optimally resulting from sample complexity (containing a wide range of compounds, including fats, proteins, carbohydrates, vitamins, minerals, and various additives), co-elution of compounds, matrix interferences, and difficulty in achieving baseline separation. Furthermore, the especially complex matrix of food samples can impact chromatographic separations by causing ion suppression or enhancement, interfering with analyte detection, or affecting column performance. Thus, extensive sample preparation steps are often required, such as extraction, purification, and concentration, before MS analysis. Sample preparation can be time-consuming and labor-intensive, and may introduce potential sources of error or loss of analytes. Matrix effects can lead to decreased sensitivity, reduced chromatographic resolution, or inaccurate quantification. In addition, some food components, such as vitamins, flavors, or volatile compounds, can be sensitive to heat, light, or oxidative degradation [11,12].
Chromatographic techniques that involve high temperatures or prolonged analysis times may result in analyte degradation, leading to inaccurate quantification or loss of valuable information. Moreover, food samples encompass a wide variety of analytes, including polar and nonpolar compounds with different chemical properties and chromatographic techniques may not offer universal selectivity, requiring the use of different columns or methods to analyze different classes of compounds and this is time-consuming and expensive. Furthermore, chromatographic methods used in food analysis require rigorous validation to ensure accuracy, precision, selectivity, and robustness. Method validation can be time-consuming, and resource-intensive, and necessitates the availability of appropriate reference materials and standards [12,13,14].
A challenge of recent times is in the development of non-destructive, low-cost, rapid, and automated analytical techniques to determine the various adulterations in cheese products that can cause discrepancies in the products compared to their label [5,7,9,10]. Automations are now available due to new technological achievements, particularly the use of chemometrics to facilitate the interpretation of analytical data [5,9,15,16,17]. Currently, the fingerprinting and profiling methods including spectroscopic techniques and e-sensors, in combination with chemometrics, are deemed more suitable for determining authenticity, with marker-based methods such as MS techniques reserved for more precise adulteration detection [13]. However, the advancement of spectroscopic techniques, their instrumentation, and algorithmic means of analyses continues apace and offers the portable capability and, in some circumstances, even a viable lab-based alternative to MS. Vibrational spectroscopy techniques, particularly near-infrared spectroscopy (NIR), a popular technique for many years in food analysis, and combination with chemometric tools have given rise to many recent research studies [5,18,19,20,21,22,23].
Several studies that have been performed to assess quality issues or adulteration in cheese using NIR technology are presented in Table 1. Ripening with a rind content of a maximum 18% in Parmigiano Reggiano cheese is well classified where the subregion 4243–4566 cm−1 was found to be important for both research groups: Alinovi et al. [20] and Cevoli et al. [19]. Karoui et al. [24] found that the region of 8000–10000 cm−1 was important when classifying Emmental cheese samples regarding geographical origin, which is commonly based on chemical properties, such as fat and total nitrogen. Ayvaz et al. [18] studied chemical properties such as protein, fat, salt, dry matter, moisture, and ash in Ezine cheese by applying NIR, and they found the spectrum from 10000 to 4000 cm−1 to be critical for accurate classification. It has also been reported previously that the determination of cow milk adulteration in goat cheese exploits the significant peaks at 9043, 9286, 9353, and 9632 cm−1 [5]. However, to determine other adulterants, unrelated to milk greater subregions should be used, such as water, urea, and bovine whey as in the findings of da Paixão Teixeira et al. [9], alongside cellulose, silicon dioxide, wheat flour, wheat semolina, and sawdust as documented by Visconti et al. [22]. Similarly, by using a pocket-sized NIR system, Manuelian et al. [21] studied chemical parameters such as total nitrogen, soluble nitrogen, ripening index, major minerals content (Ca, K, Mg, Na, and P), and fatty acid profile, proving that the performance was comparable to benchtop devices and confirming the potential for a breakthrough of NIR technology in the dairy industry.
Several studies which have been performed using HSI technology are highlighted in Table 2. Calvini et al. [25] focused on the quantification of rind amount in grated Parmigiano Reggiano cheese by taking into consideration spectral information at wavelengths of 1195–1225, 1330–1340, and 1400 nm. In a similar study, Calvini et al. [26], quantified the rind amount (8, 18, 28%), and investigated the influence of fat content and grater type in grated Parmigiano Reggiano cheese. Due to the lipids’ presence from 1320 to 1390 nm and at 1070 nm, the highest percentage of rind, 28%, was determined. The lowest percentage of rind, 8%, was detectable at 1420–1520 nm due to protein content and bound water and proteins, respectively. The study by Darnay et al. [27] was related to ripening and used wavelengths for the detection of enzyme treatment (1387 nm) and for fat content (1190 nm, 1234 nm). Similarly, Vásquez et al. [17] studied a Swiss-type cheese regarding ripening based on hardness, and the region 650–1000 nm was studied. Malegori et al. [28] used various Italian-type cheese samples to study ripening through proteolytic maturation, lipolytic reactions, and surface dehydration by observing bands at 1690 nm (due to the secondary structure of proteins), 2140 nm (due to the ester bond in lipids) and 1360–1500 nm (due to O-H stretching of water), respectively. In terms of adulterants, Barreto et al. [7] used HSI to identify starch in cheese where the most significant wavelengths for this investigation were at 584 nm and between 976 and 1000 nm. The subregion between 976 and 1000 nm is correlated to water content in cheese since starch has a high-water absorption capacity.
This study aimed to evaluate two spectroscopic techniques, i.e., HSI and NIR. In a previous study [16], the same sample set was also measured using MIR spectroscopy (4000–400 cm−1). Thus, the overall aim of this study was to compare the results from all three spectroscopic techniques (e.g., MIR, NIR and HSI) which have been used to analyze the same halloumi cheese sample set. To the best of our knowledge, there is no other publication that characterizes halloumi cheese using these spectroscopy-based measurements. The cheeses in this study were grated, as also studied previously by Calvini et al. [26], since grated type cheese may be easily adulterated with lower-value cheese.

2. Materials and Methods

2.1. Sample Collection

In total, 17 commercial halloumi cheese samples purchased across Cyprus were used in this study. Their physical appearance is presented in Table 3. All samples contain milk from a known origin (i.e., cow and goat–sheep) due to a study conducted previously by Tarapoulouzi et al. [16]. Nine of the samples were from goat or sheep, and the remaining eight were from cows. The samples were chosen because they were produced during the same season of the year to avoid any discrepancies or possible influences from environmental conditions on the production of the milk. For the same reason, the samples had the same geographical origin and aging time.

2.2. Preparation of Samples

The samples were freeze-dried, as described by Tarapoulouzi et al. [16]. A Christ Alpha 1–2 freeze drier was used, with the condenser temperature at 233 K; the final pressure in the drying chamber was 3 Pa. The samples were all frozen using liquid nitrogen. Five grams of each halloumi cheese sample was treated for 5 hr. After freeze-drying, the samples were all grated with a drum grater (Ghizzoni mod. GS electric, Retsch, Haan, Germany). One sample was grated using a knife mill (Grindomix GM 200, Retsch, Haan, Germany). The reason was to find the best way to treat the samples, and treatment with a drum grater was more efficient; eventually, the use of a knife mill was abandoned. After freeze-drying, the appearance of the samples was not homogeneous, regarding colour and texture; this was due to different milk species. Ground samples were kept in sealed plastic containers at room temperature.

2.3. NIR Analysis

NIR measurements were performed using an iS50 benchtop NIR (Thermo Fisher Scientific, Dublin, Ireland) operated in the spectral range of 833–2500 nm (12,000–4000 cm−1) with 32 scans and a resolution of 8 cm−1 in triplicate. The samples were poured into the sample cup (diameter: 3.2 cm, height: 1.5 cm) spinner on the integrating sphere module of the instrument prior to analysis. Background measurements were taken before each sample.

2.4. HSI Analysis

Measurements were performed in triplicate using a HinaLea 4250 VNIR HSI camera (HinaLea Imaging, Emeryville, CA, USA) with a spectral resolution of 4 nm (full width half maximum) and 2.3 MegaPixel color sensor with 300 spectral channels (wavelengths) analyzed via a linear variable filter across a 400–1000 nm range. The HSI camera was mounted on a stand with two adjacent halogen light bulbs. Prior to analysis, on HinaLea TruScope software, v. 1.1.17, background (dark) and reference (white) spectra were acquired. The camera gap, exposure, gain, and focus were all optimized prior to measurement. Approximately 10 g of each sample was placed onto a neutral background for measurement. Point spectra were studied before averaged spectral rectangular regions were delineated and output as csv files for chemometric analysis.

2.5. Chemometric Analysis

The development of chemometric models took place using SIMCA 17 (Sartorius, Umeå, Sweden). Unit variance (UV) scaling was used throughout. Several pre-processing strategies such as multiplicative scatter correction (MSC), standard normal variate (SNV), first-order derivatives (1DER), and Savitzky–Golay (SG) were first evaluated. Subsequently, the combination of SNV and SG were used based on internal cross-validation results conducted in SIMCA. Following this, the unsupervised technique principal component analysis (PCA) was used to obtain a general overview of the samples, as well as to obtain the PCA loadings, which highlight the most important variables. In addition, another unsupervised technique, hierarchical cluster analysis (HCA), was applied for clustering analysis.

3. Results

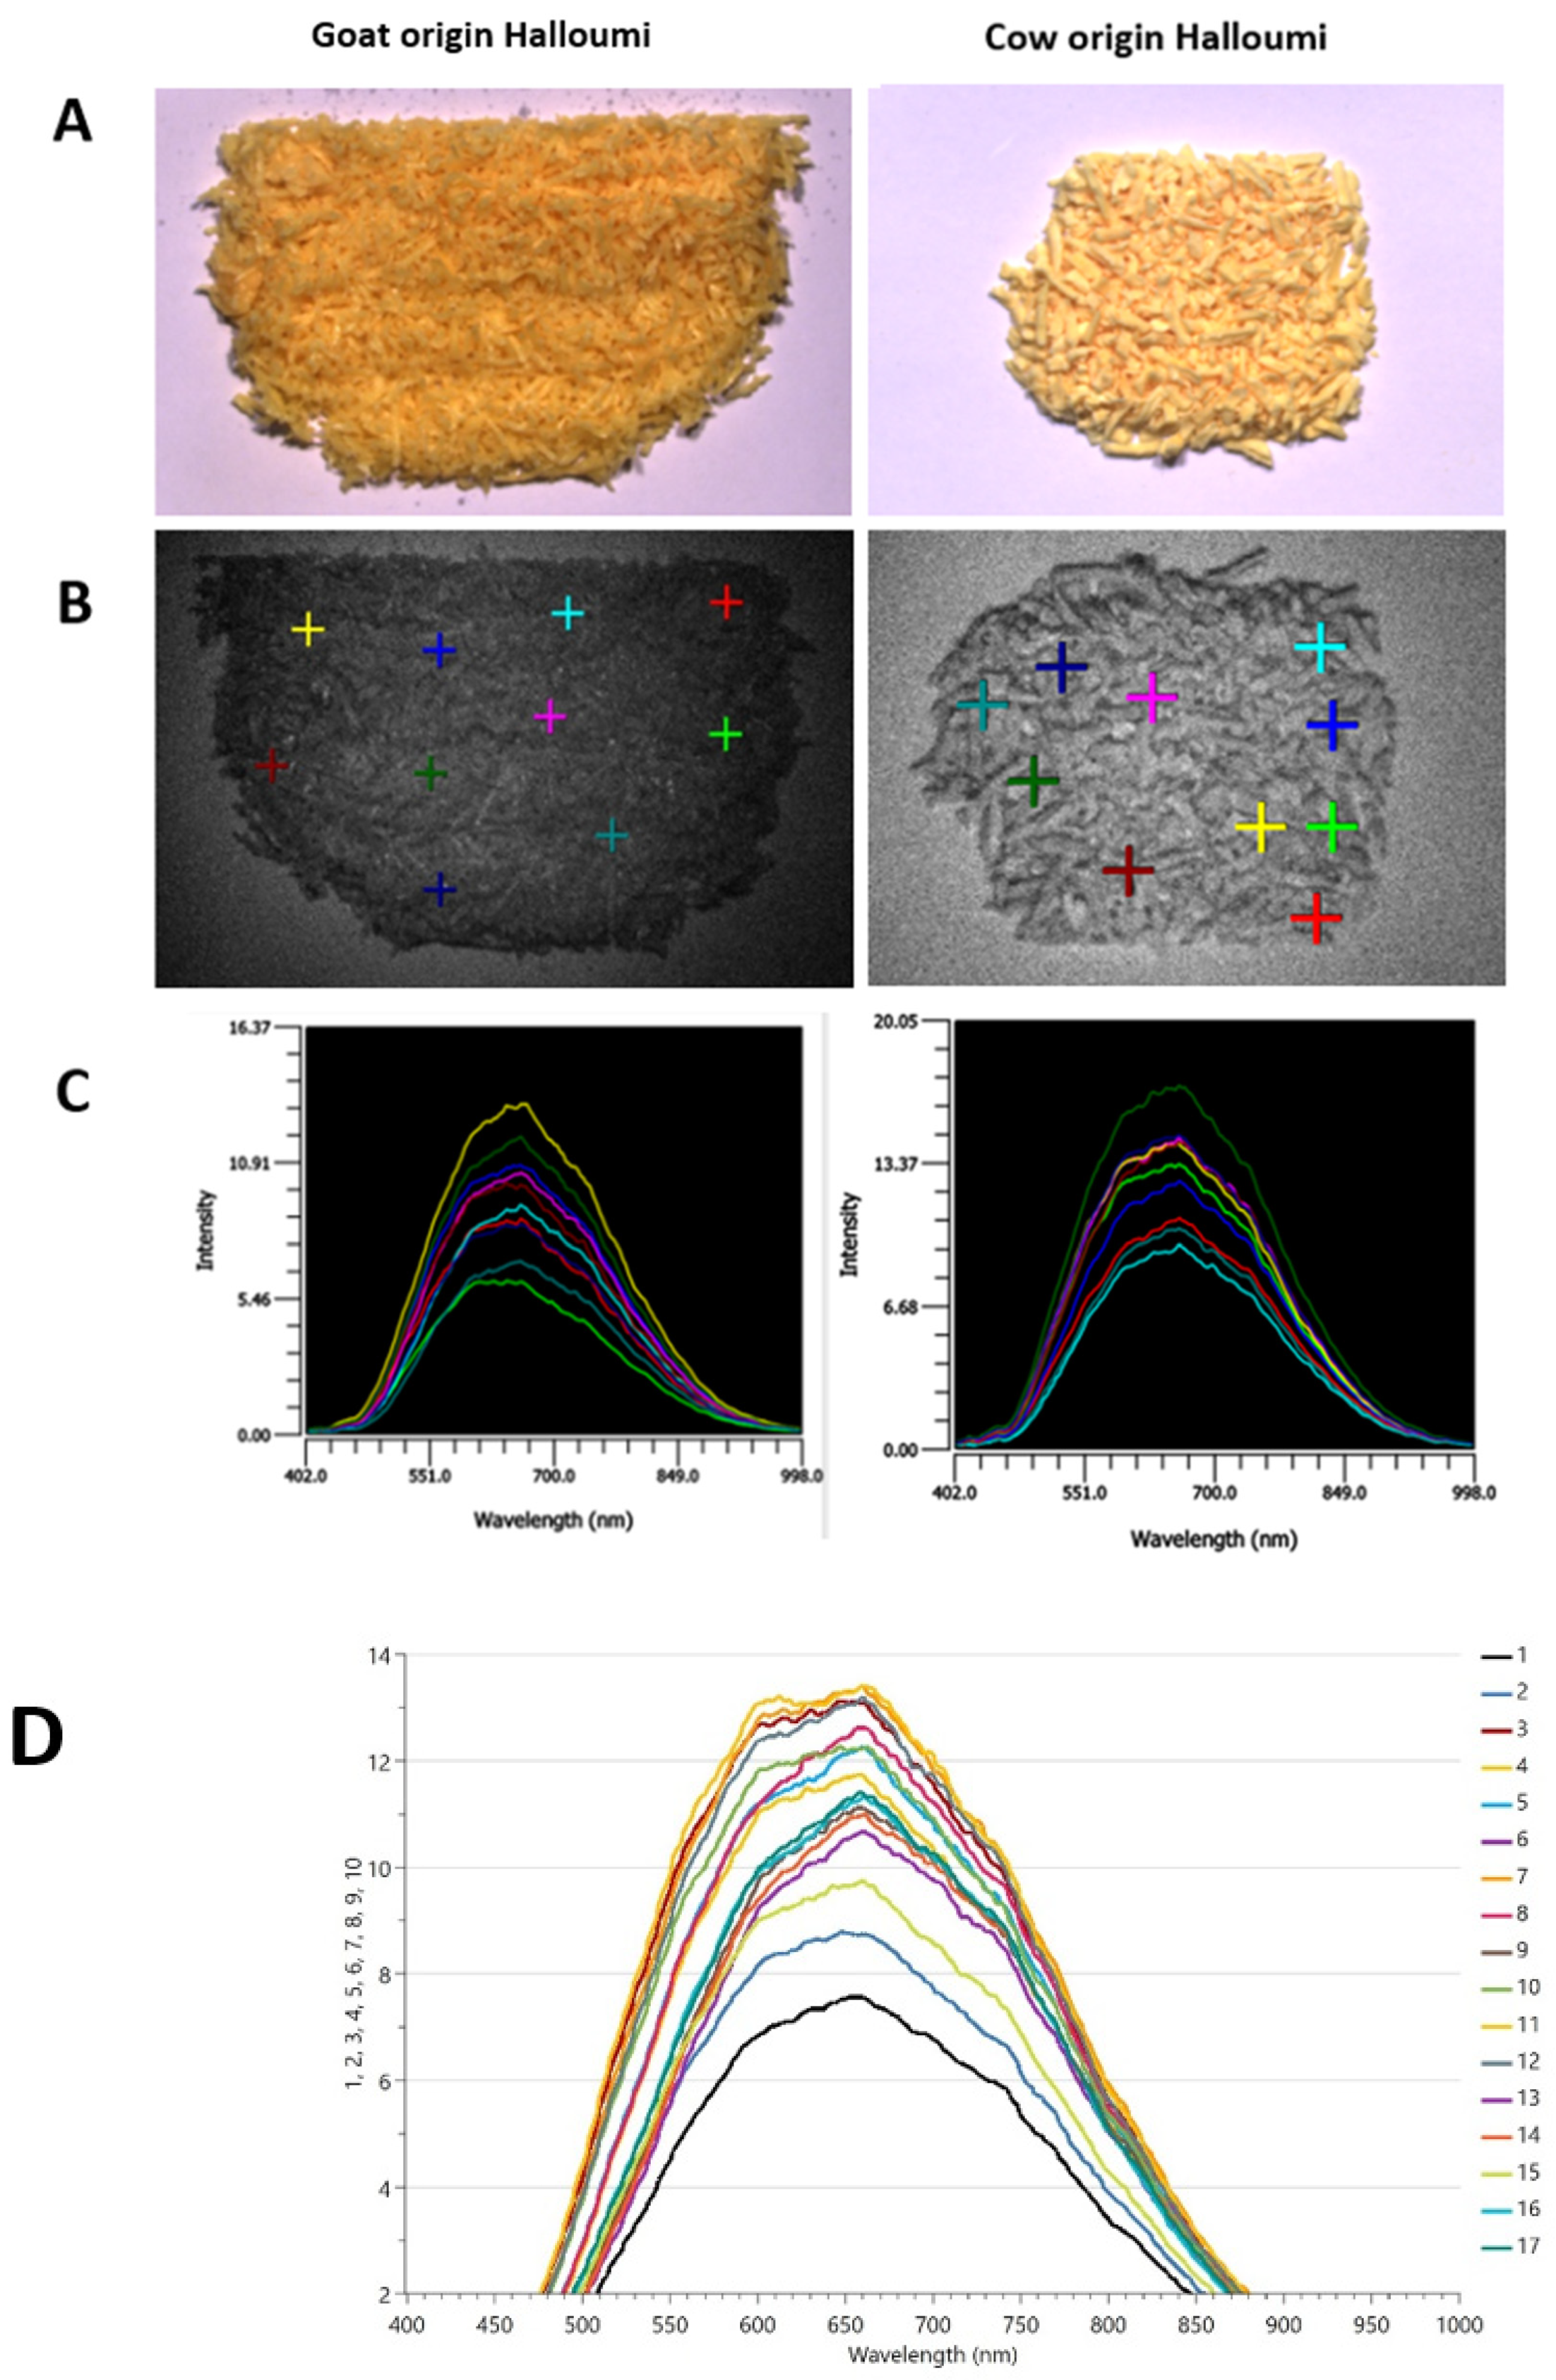
3.1. Spectral Analysis of Halloumi Cheese Using HSI Spectroscopy

The particle size and distribution of grated halloumi cheese were influenced by the texture of each sample, as shown in Figure 1A. Samples with an oilier texture produced smaller particles, whilst a dry texture produced more heterogeneous particles; thus, different particle sizes were obtained after grating. In addition, the appearance, colour, and texture of the samples are related to the milk species’ origin; thus, goat or goat–sheep-origin samples have a yellow-oily appearance compared to cow-origin samples which are white-dry. The region 400–1000 nm has been covered during HSI measurements, as presented in Figure 1C.
Vásquez et al. [17] noted that publications that have used HSI in cheese are scarce; however, the studies that were found are presented in Table 2. The paper by Vásquez et al. [17] is the closest to our study, as it took measurements within the range of 400–1000 nm. Other available studies have measured above 1000 nm either to detect an adulterant or to quantify ripening in cheese.

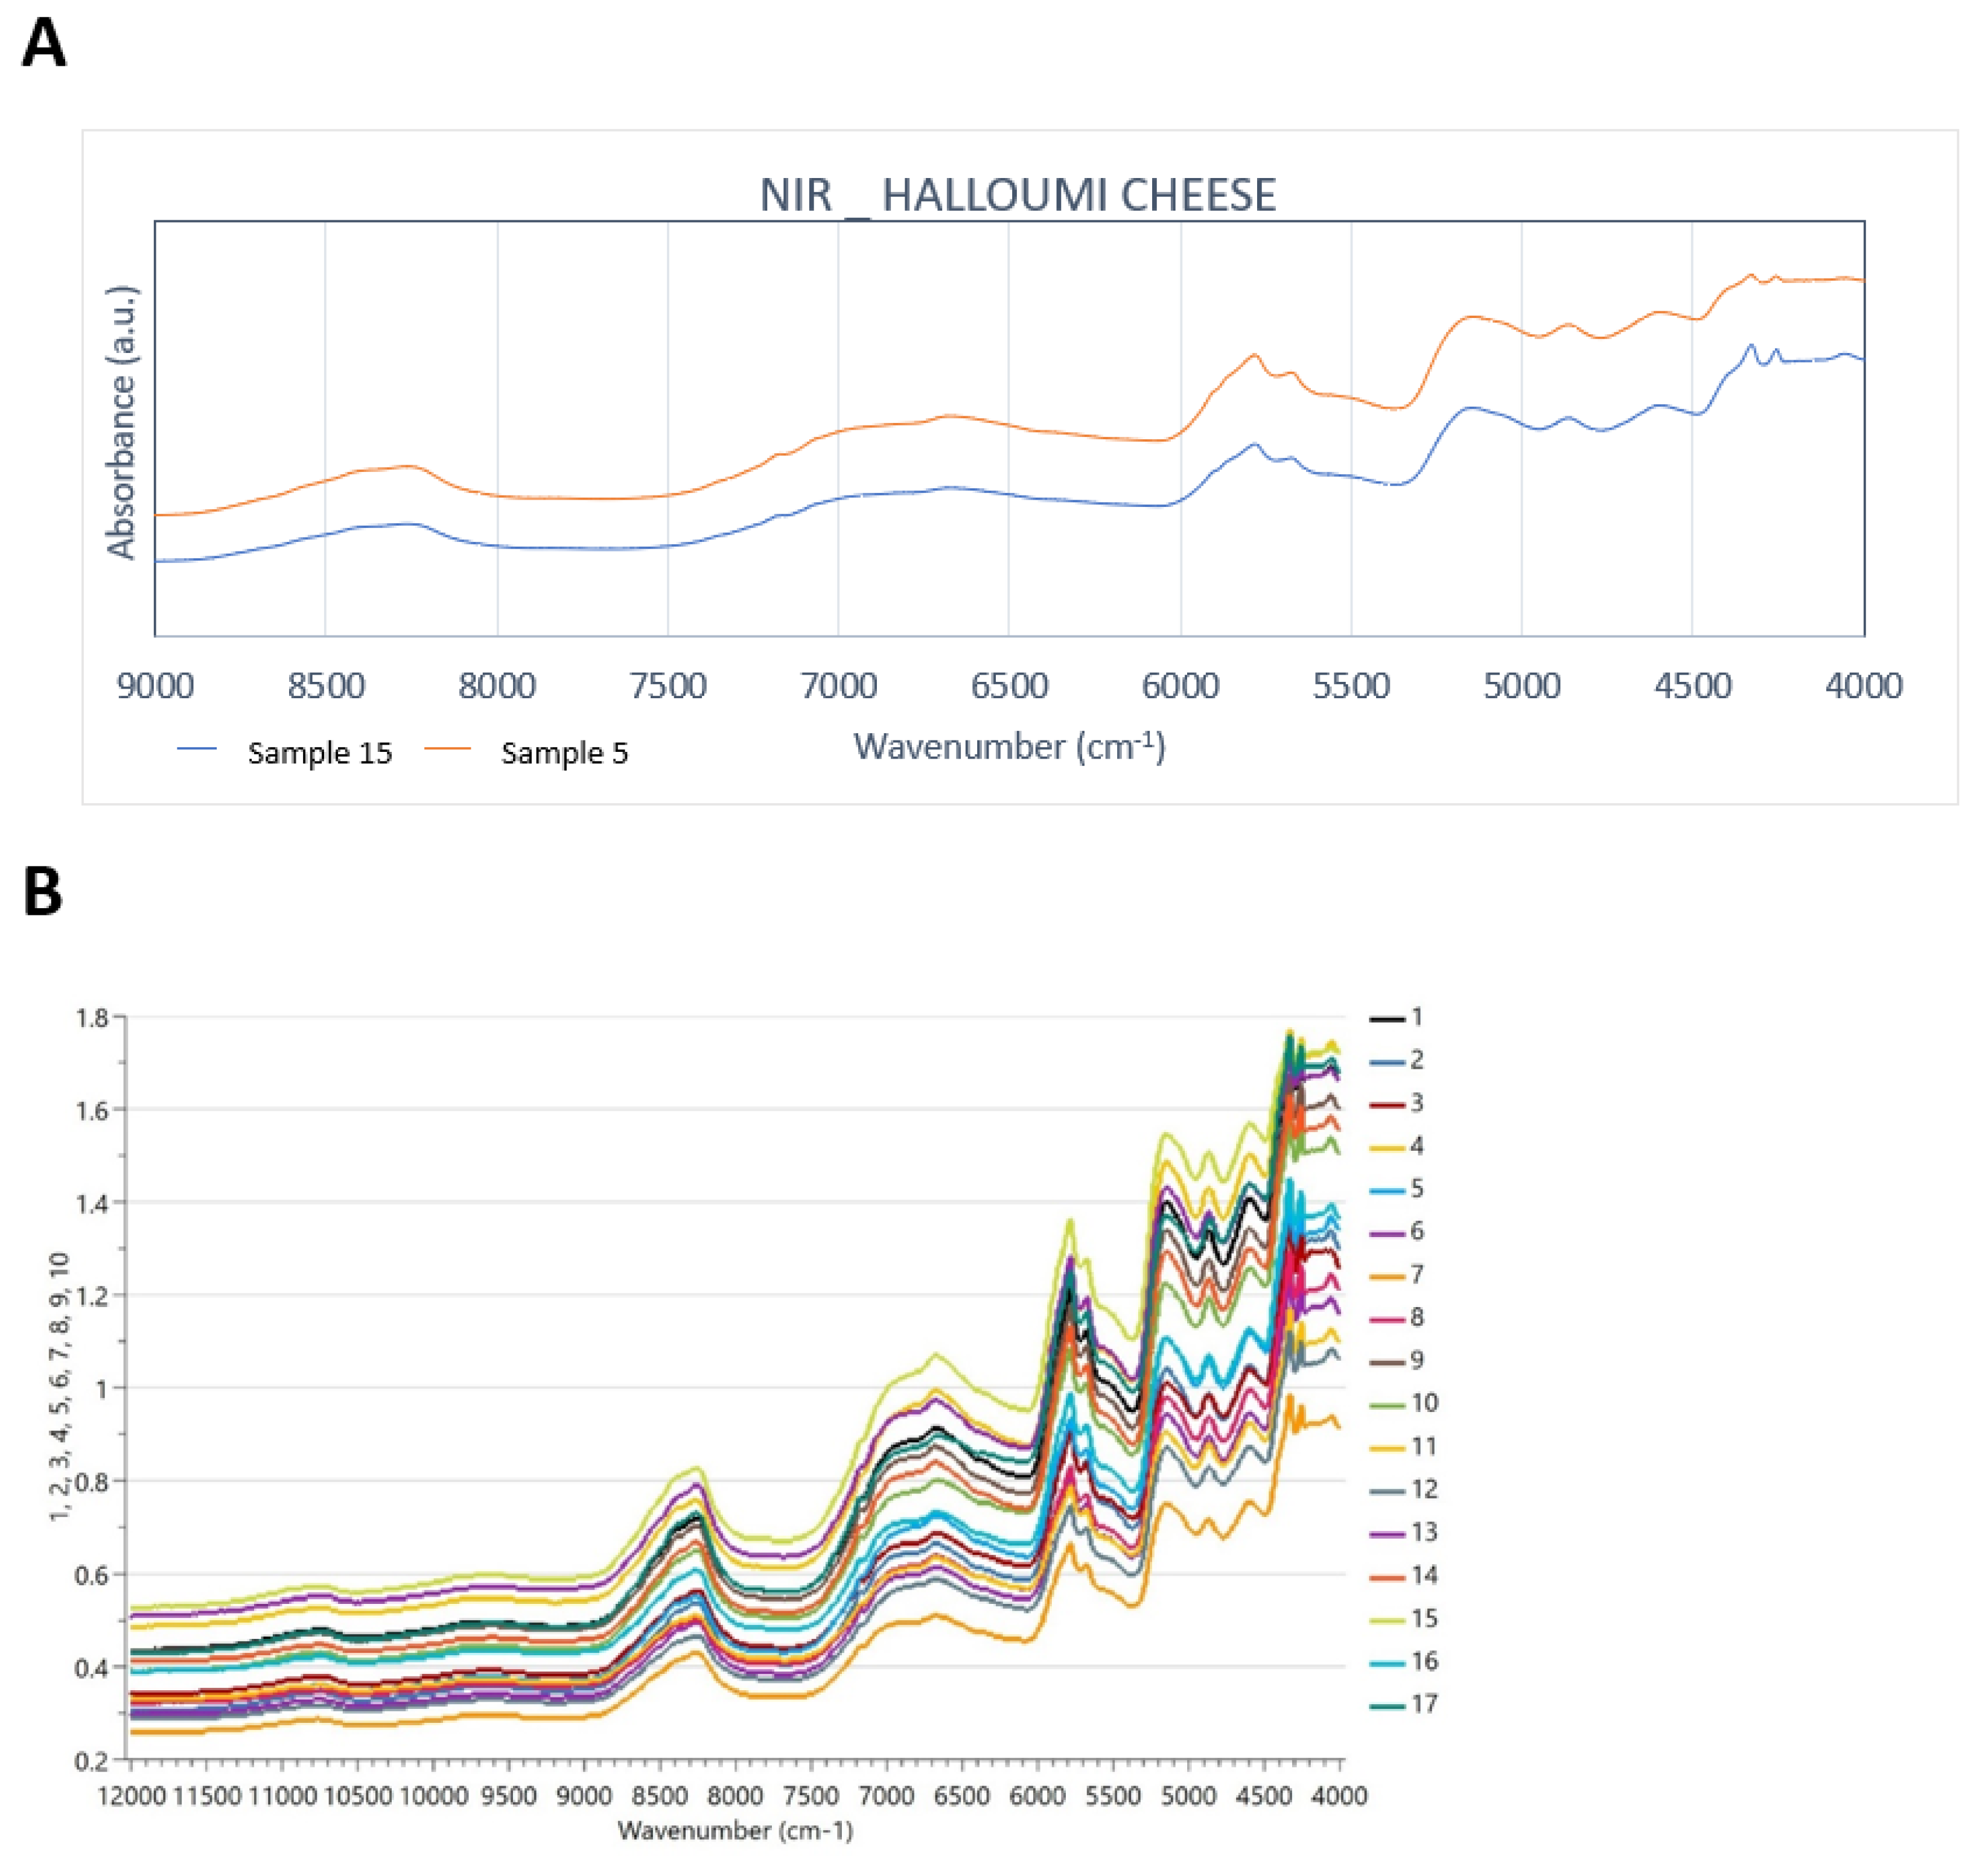
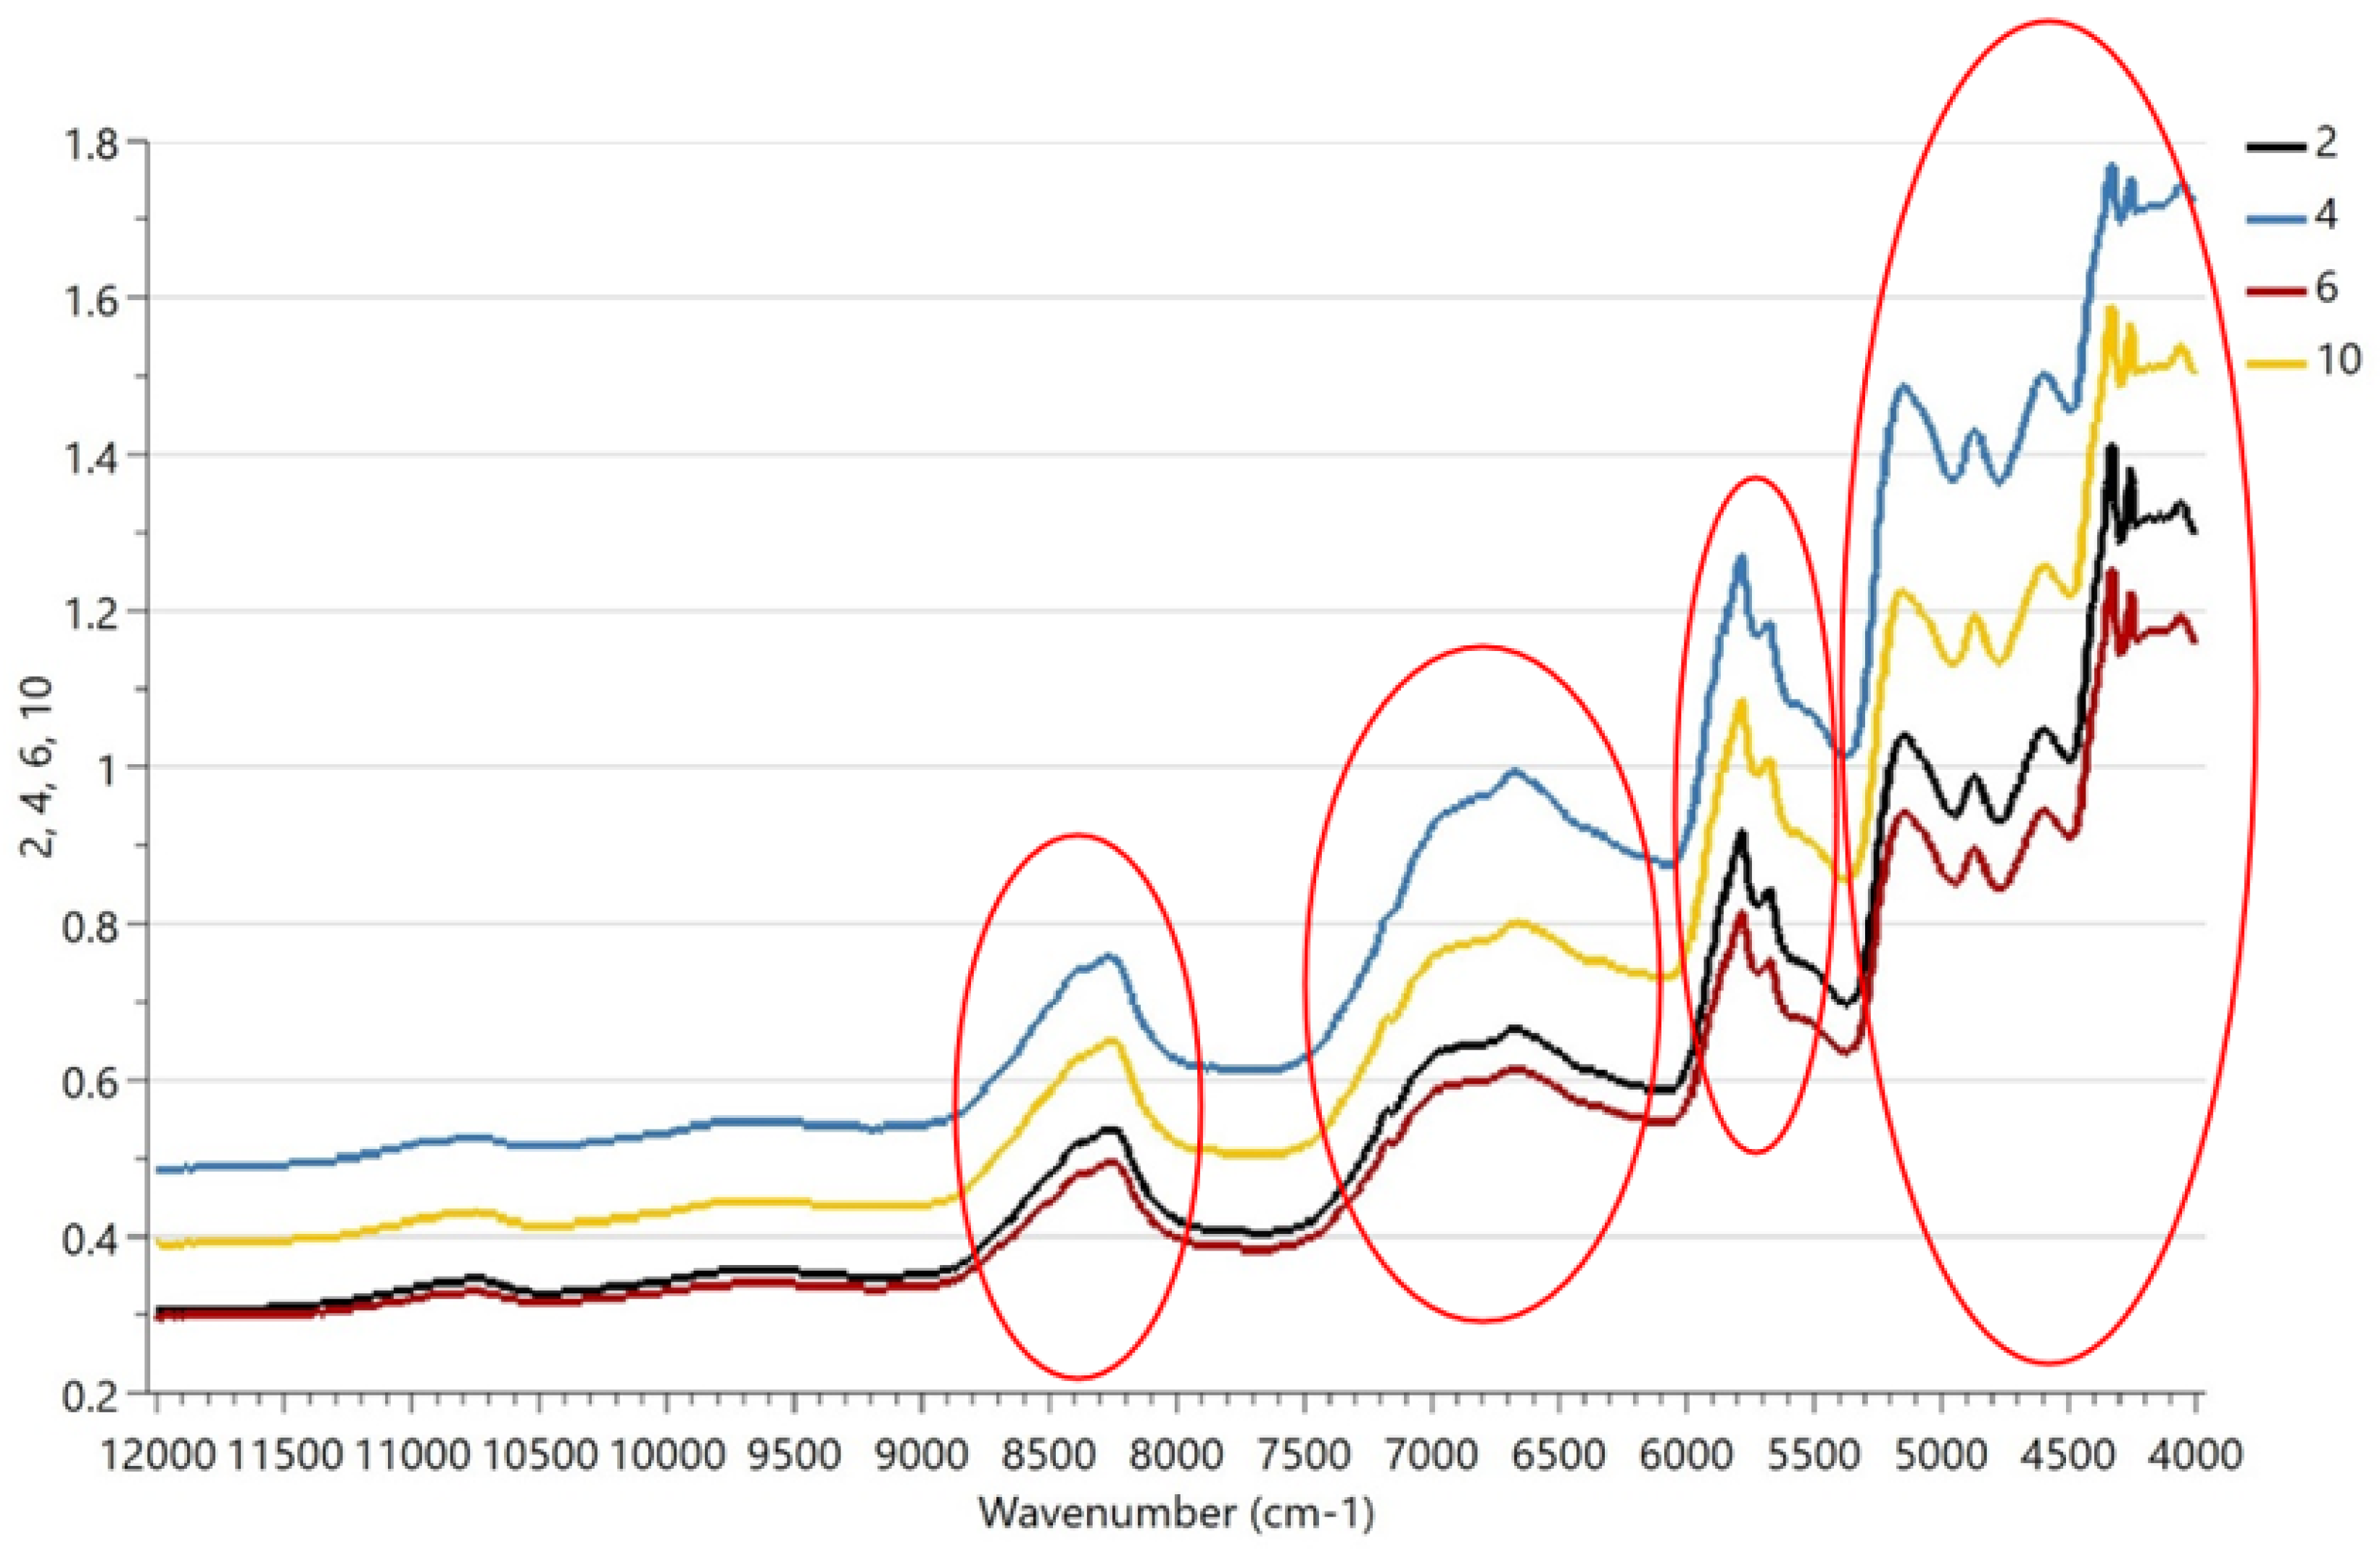
3.2. Spectral Analysis of Halloumi Cheese Using NIR Spectroscopy

The overtone and combination bands in the NIR spectra occur because of the C-H, N-H, and O-H bonds. Weak water absorption (due to freeze-drying application) takes place at around 6800 and 5200 cm−1 due to the first overtone stretching of the free O-H group and OH combination bands from the water, respectively. Lactose is present at 4740 cm−1 [3,29]. Goat milk contains less lactose than cow milk [30], as shown in Figure 2A. The presence of CH2 group gives two bands in the 4600–4200 cm−1 region, and in lipids and/or protein at 4250 and 4600 cm−1, respectively. The absorptions which are present at 4260 and 4330 cm−1 are derived due to the combination bands of C-H and C-O stretching vibrations in fats, and at 4980 cm−1 due to the amides of proteins. The first overtone of the C-H stretching vibration of fats gives the absorptions at around 5670 and 5780 cm−1 as well and the second overtone of the C-H stretching vibration of fats is responsible for the absorptions between 8700 and 8100 cm−1, as shown in Figure 2B. These findings agree with Karoui et al. [18] and Ayvaz et al. [24]. Goat milk has more medium-chain fatty acids than cow milk, and, as Silanikove et al. [30] stated, they provide the “goaty” odour in cheese products. In addition, it is very important that the differences in the spectral region between 8700 and 7350 cm−1 are identified as being related to the N-H second overtone, and this is directly linked with the fact that the protein contents of cow and goat milk are different [5].
Figure 3 shows that the spectra of samples 2 and 6 and 4 and 10 are similar and the four spectral subregions showing the important differences are related to protein, fat, and lactose. Additionally, it is difficult to determine the similarity by eye, hence the reason we need chemometrics. Spectral features appeared between 8620 and 4250 cm−1 due to C-H bond absorption of proteins and/or lipids; at 4740 cm−1 due to O-H bond in lactose; and at 8400–4385 cm−1 due to N-H absorption of proteins. As the NIR technique is well-known for focusing on protein, fat, and lactose composition in the dairy sector [3,5,18], small changes in the proportions of milk species (i.e., ovine-to-caprine ratio or bovine-to-caprine–ovine ratio) may affect the spectral subregions of these nutrients as well as cheese composition, as stated in Tarapoulouzi et al. [16].
Moreover, the observed differences in the four spectral regions shown in Figure 3 could take place due to the effect of milk proteins on milk fat determination, as proteins are included in the native fat globule membrane that surrounds the lipid droplets. Diffuse reflection occurred because of the uneven cheese surface. In addition, individual differences in the milk proteins of each animal have affected similar studies due to the ratio of true protein and nonprotein nitrogen in the milk. This is observed in differences occurring in the spectral region 5130–4760 cm−1, which is influenced by nitrogenous components in the milk [3].

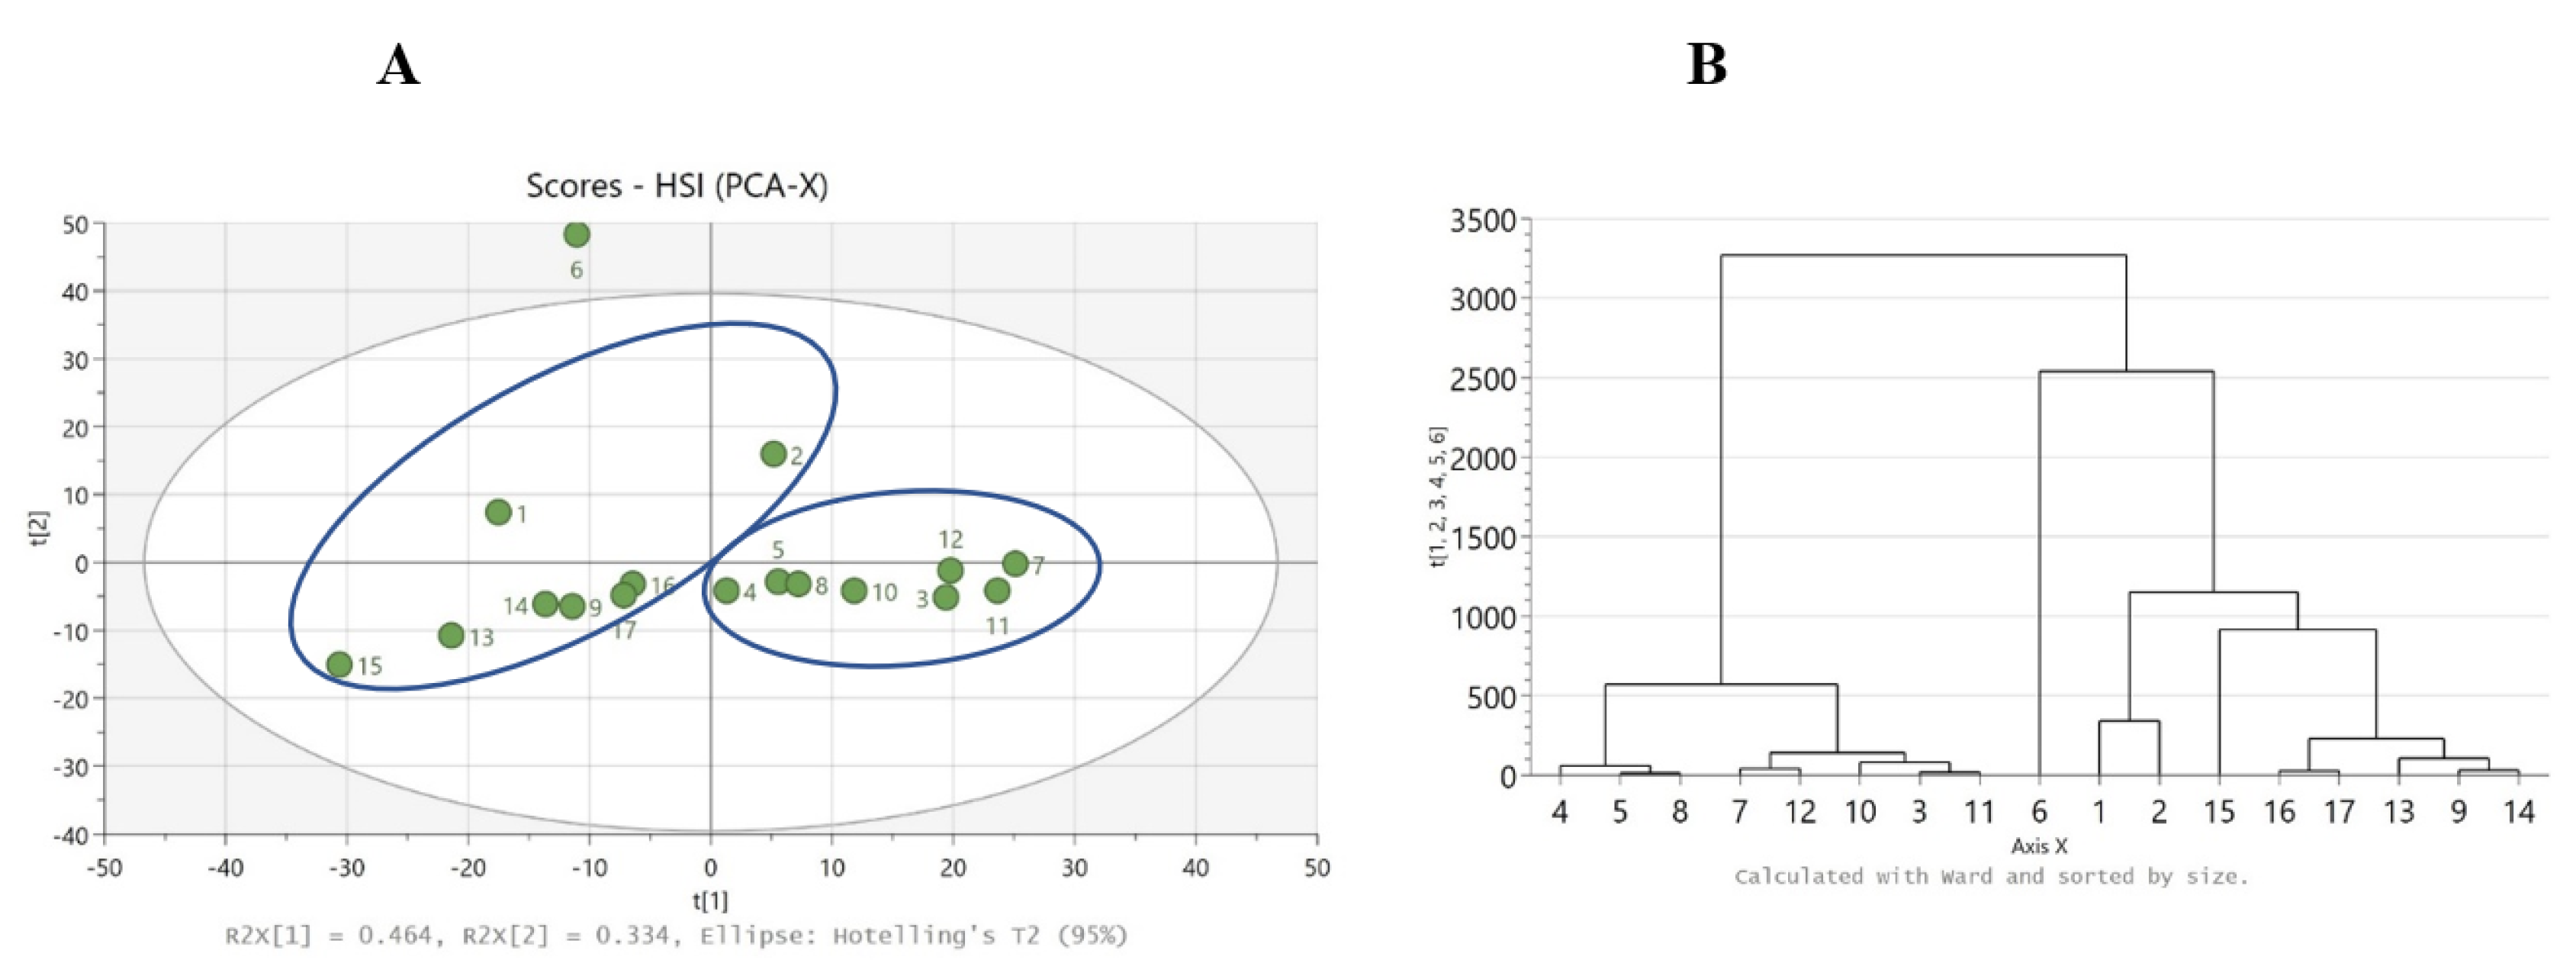
3.3. Chemometric Modelling

Data analysis of HSI measurements revealed that samples 4, 5, 8, 7, 12, 10, 3, and 11 are grouped together and in the left-hand side group (white appearance and dry texture) by the chemometric method HCA. Similarly, samples 6, 1, 2, 15, 16, 17, 13, 9, and 14 fall in the right-hand side group (yellow appearance and oily texture), as seen in Figure 4B.
PCA was used to obtain a general overview of the samples. The HCA chemometric method revealed that samples 7, 6, 12, 3, 5, 2, 8, and 11 are grouped together and in the left-hand side group (cow origin) by the chemometric method HCA, and this result is the same as results found using PCA clustering. Similarly, samples 15, 4, 13, 9, 1, 17, 16, 10, and 14 fall in the right-hand side group (goat–sheep origin), as seen in Figure 4A. A total of 4 out of 17 samples have the “wrong grouping”: 2 from cow origin (nos. 2 and 6) and 2 from goat–sheep origin (nos. 4 and 10), as indicated in Figure 4B, thus resulting in a classification accuracy of 13/17 (76%). Sample 6 had the smallest dimensions of particles due to grating with a knife mill. However, sample 6 was not an outlier in the NIR model, and the exclusion of sample 6 from the model did not improve the grouping of the other three samples (nos. 2, 4, and 10). More investigation is needed regarding the influence of particle size in NIR analysis. To investigate the “wrong grouping” of the four samples, more research must be conducted and maybe another sample preparation method should be implemented, for instance, Raman spectroscopy with an emphasis on fats.

4. Conclusions

The samples used in this study come from an authentic database built using the spectral information obtained by MIR in Tarapoulouzi et al. [16]. The main aim of this study was to compare MIR and HSI data using these two techniques, based largely on correctly identifying the milk species’ origin in 16 out of 17 of the samples by using the HSI technique. In terms of comparing MIR and NIR data, 4 samples out of 17 analyzed by NIR were incorrectly grouped, which was unexpected. This challenge requires further studies on halloumi cheese using NIR spectroscopy to increase the size of the sample set and build more robust models, as the number of samples tested was small. The appearance of the samples after freeze-drying was associated with the milk species; thus, color and texture influenced the groupings within the model. The appearance of the samples was found to be an important parameter that drives the clustering of the samples when measured using HSI. Calvini et al. [26] concluded that different grater types gave different shapes and dimensions of particles in their study with HSI measurements, and the dimension of particles in grated cheese samples may be an important factor for the HSI model, as sample 6 appeared to be an outlier. This pre-trial study to identify species of origin in halloumi cheese utilising chemometrics with NIR and HSI technologies seems to be an important addition in halloumi cheese research. Further experimentation is required to elucidate the potential impact of cheese particle size on spectroscopic response. On the other hand, the NIR model gave the wrong clustering position regarding sample 6, alongside three other incorrectly classified cheese samples.

Author Contributions

Conceptualization, M.T. and C.R.T.; methodology, M.T., N.L., H.M. and M.H.; software, M.T. and C.R.T.; formal analysis, M.T.; investigation, M.T.; data curation, M.T.; writing—original draft preparation, M.T.; writing—review and editing, N.L., H.M., M.H. and S.A.H.; supervision, S.A.H., C.T.E. and C.R.T.; project administration, M.T. All authors have read and agreed to the published version of the manuscript.

Funding

This research received no external funding.

Data Availability Statement

Data are contained within the article.

Conflicts of Interest

The authors declare no conflicts of interest.

References

  1. Kumar, S.; Kumar, B.; Kumar, R.; Kumar, S.; Khatkar, S.K.; Kanawjia, S. Nutritional features of goat milk—A review. Indian J. Dairy Sci. 2012, 65, 266–273. [Google Scholar]
  2. Pal, M.; Dudhrejiya, T.P.; Pinto, S.; Brahamani, D.; Vijayageetha, V.; Reddy, Y.; Kate, P. Goat milk products and their significance. Beverage Food World 2017, 44, 21–25. [Google Scholar]
  3. Tsenkova, R.; Atanassova, S.; Itoh, K.; Ozaki, Y.; Toyoda, K. Near infrared spectroscopy for biomonitoring: Cow milk composition measurement in a spectral region from 1100 to 2400 nanometers. J. Anim. Sci. 2000, 78, 515–522. [Google Scholar] [CrossRef] [PubMed]
  4. Clark, S.; García, M.B.M. A 100-year review: Advances in goat milk research. J. Dairy Sci. 2017, 100, 10026–10044. [Google Scholar] [CrossRef] [PubMed]
  5. da Paixao Teixeira, J.L.; dos Santos Carames, E.T.; Baptista, D.P.; Gigante, M.L.; Pallone, J.A.L. Rapid adulteration detection of yogurt and cheese made from goat milk by vibrational spectroscopy and chemometric tools. J. Food Compos. Anal. 2021, 96, 103712. [Google Scholar] [CrossRef]
  6. Hodgkinson, A.J.; Wallace, O.A.; Boggs, I.; Broadhurst, M.; Prosser, C.G. Gastric digestion of cow and goat milk: Impact of infant and young child in vitro digestion conditions. Food Chem. 2018, 245, 275–281. [Google Scholar] [CrossRef] [PubMed]
  7. Barreto, A.; Cruz-Tirado, J.P.; Siche, R.; Quevedo, R. Determination of starch content in adulterated fresh cheese using hyperspectral imaging. Food Biosci. 2018, 21, 14–19. [Google Scholar] [CrossRef]
  8. Calvano, C.D.; De Ceglie, C.; Monopoli, A.; Zambonin, C.G. Detection of sheep and goat milk adulterations by direct MALDI–TOF MS analysis of milk tryptic digests. J. Mass Spectrom. 2012, 47, 1141–1149. [Google Scholar] [CrossRef]
  9. da Paixao Teixeira, J.L.; dos Santos Carames, E.T.; Baptista, D.P.; Gigante, M.L.; Pallone, J.A.L. Vibrational spectroscopy and chemometrics tools for authenticity and improvement the safety control in goat milk. Food Control 2020, 112, 107105. [Google Scholar] [CrossRef]
  10. Munir, M.T.; Wilson, D.I.; Yu, W.; Young, B.R. An evaluation of hyperspectral imaging for characterising milk powders. J. Food Eng. 2018, 221, 1–10. [Google Scholar] [CrossRef]
  11. Alinovi, M.; Wiking, L.; Corredig, M.; Mucchetti, G. Effect of frozen and refrigerated storage on proteolysis and physicochemical properties of high-moisture citric mozzarella cheese. J. Dairy Sci. 2020, 103, 7775–7790. [Google Scholar] [CrossRef] [PubMed]
  12. Cortese, M.; Gigliobianco, M.R.; Magnoni, F.; Censi, R.; Di Martino, P. Compensate for or minimize matrix effects? Strategies for overcoming matrix effects in liquid chromatography-mass spectrometry technique: A tutorial review. Molecules 2020, 25, 3047. [Google Scholar] [CrossRef] [PubMed]
  13. Dou, X.; Zhang, L.; Yang, R.; Wang, X.; Yu, L.; Yue, X.; Ma, F.; Mao, J.; Wang, X.; Zhang, W. Mass spectrometry in food authentication and origin traceability. Mass Spectrom. Rev. 2022, 42, 1772–1807. [Google Scholar] [CrossRef] [PubMed]
  14. Esteki, M.; Simal-Gandara, J.; Shahsavari, Z.; Zandbaaf, S.; Dashtaki, E.; Vander Heyden, Y. A review on the application of chromatographic methods, coupled to chemometrics, for food authentication. Food Control 2018, 93, 165–182. [Google Scholar] [CrossRef]
  15. Lei, T.; Lin, X.; Sun, D. Rapid classification of commercial Cheddar cheeses from different brands using PLSDA, LDA, and SPA–LDA models built by hyperspectral data. J. Food Meas. Charact. 2019, 13, 3119–3129. [Google Scholar] [CrossRef]
  16. Tarapoulouzi, M.; Kokkinofta, R.; Theocharis, C.R. Chemometric analysis combined with FTIR spectroscopy of milk and Halloumi cheese samples according to species’ origin. Food Sci. Nutr. 2020, 8, 3262–3273. [Google Scholar] [CrossRef] [PubMed]
  17. Vásquez, N.; Magán, C.; Oblitas, J.; Chuquizuta, T.; Avila-George, H.; Castro, W. Comparison between artificial neural network and partial least squares regression models for hardness modeling during the ripening process of Swiss-type cheese using spectral profiles. J. Food Eng. 2018, 219, 8–15. [Google Scholar] [CrossRef]
  18. Ayvaz, H.; Mortas, M.; Dogan, M.A.; Atan, M.; Yildiz Tiryaki, G.; Karagul Yuceer, Y. Near-and mid-infrared determination of some quality parameters of cheese manufactured from the mixture of different milk species. J. Food Sci. Technol. 2021, 58, 3981–3992. [Google Scholar] [CrossRef]
  19. Cevoli, C.; Gori, A.; Nocetti, M.; Cuibus, L.; Caboni, M.F.; Fabbri, A. FT-NIR and FT-MIR spectroscopy to discriminate competitors, non compliance and compliance grated Parmigiano Reggiano cheese. Food Res. Int. 2013, 52, 214–220. [Google Scholar] [CrossRef]
  20. Alinovi, M.; Mucchetti, G.; Tidona, F. Application of NIR spectroscopy and image analysis for the characterization of grated Parmigiano-Reggiano cheese. Int. Dairy J. 2019, 92, 50–58. [Google Scholar] [CrossRef]
  21. Manuelian, C.L.; Ghetti, M.; De Lorenzi, C.; Pozza, M.; Franzoi, M.; De Marchi, M. Feasibility of pocket-sized near-infrared spectrometer for the prediction of cheese quality traits. J. Food Compos. Anal. 2022, 105, 104245. [Google Scholar] [CrossRef]
  22. Visconti, L.G.; Rodríguez, M.S.; Di Anibal, C.V. Determination of grated hard cheeses adulteration by near infrared spectroscopy (NIR) and multivariate analysis. Int. Dairy J. 2020, 104, 104647. [Google Scholar] [CrossRef]
  23. Ozaki, Y. Near-infrared spectroscopy—Its versatility in analytical chemistry. Anal. Sci. 2012, 28, 545–563. [Google Scholar] [CrossRef] [PubMed]
  24. Karoui, R.; Mouazen, A.M.; Dufour, E.; Pillonel, L.; Schaller, E.; Picque, D.; De Baerdemaeker, J.; Bosset, J. A comparison and joint use of NIR and MIR spectroscopic methods for the determination of some parameters in European Emmental cheese. Eur. Food Res. Technol. 2006, 223, 44–50. [Google Scholar] [CrossRef]
  25. Calvini, R.; Michelini, S.; Pizzamiglio, V.; Foca, G.; Ulrici, A. Evaluation of the effect of factors related to preparation and composition of grated Parmigiano Reggiano cheese using NIR hyperspectral imaging. Food Control 2022, 131, 108412. [Google Scholar] [CrossRef]
  26. Calvini, R.; Michelini, S.; Pizzamiglio, V.; Foca, G.; Ulrici, A. Exploring the potential of NIR hyperspectral imaging for automated quantification of rind amount in grated Parmigiano Reggiano cheese. Food Control 2020, 112, 107111. [Google Scholar] [CrossRef]
  27. Darnay, L.; Králik, F.; Oros, G.; Koncz, Á.; Firtha, F. Monitoring the effect of transglutaminase in semi-hard cheese during ripening by hyperspectral imaging. J. Food Eng. 2017, 196, 123–129. [Google Scholar] [CrossRef]
  28. Malegori, C.; Oliveri, P.; Mustorgi, E.; Boggiani, M.A.; Pastorini, G.; Casale, M. An in-depth study of cheese ripening by means of NIR hyperspectral imaging: Spatial mapping of dehydration, proteolysis and lipolysis. Food Chem. 2021, 343, 128547. [Google Scholar] [CrossRef]
  29. Ozturk, M.; Dogan, M.A.; Menevseoglu, A.; Ayvaz, H. Infrared spectroscopy combined with chemometrics as a convenient method to detect adulterations in cooking/stretching process in commercial cheese. Int. Dairy J. 2022, 128, 105312. [Google Scholar] [CrossRef]
  30. Silanikove, N.; Leitner, G.; Merin, U.; Prosser, C.G. Recent advances in exploiting goat’s milk: Quality, safety and production aspects. Small Rumin. Res. 2010, 89, 110–124. [Google Scholar] [CrossRef]
Figure 1. HSI measurements: representative samples of goat–sheep origin; sample no. 15 (left)—oily texture, yellow color, and the representative sample of cow origin; sample no. 5 (right)—dry texture, white color. (A) Samples under white light, (B) samples under dark light and the regions of interest (ROIs) we selected (10 individual points) to obtain the corresponding spectral information in (C); (C) HSI point spectra are raw data and averaged internally, and (D) all HSI spectra.
Analytica 05 00002 g001
Figure 2. (A) Truncated NIR spectra of representative samples 5 and 15 of cow and goat–sheep origin, respectively (9000–4000 cm−1), and (B) all NIR spectra over the full spectral range (12000–4000 cm−1).
Analytica 05 00002 g002
Figure 3. NIR spectra of representative samples 2, 4, 6 and 10. Four important regions are shown at 8620–8100, 7280–6100, 6000–5460, and 5200–4250 cm−1 and are related to protein, fat, and lactose.
Analytica 05 00002 g003
Figure 4. (A) PCA score scatter plot where right-hand side group (goat–sheep origin) and left-hand side group (cow origin), and (B) HCA dendrogram, for the HSI data.
Analytica 05 00002 g004
Table 1. Overview of near-infrared (NIR) spectroscopy techniques for the determination of quality and adulteration in cheese.
Cheese TypeIntended UseSelected Wavenumbers (cm−1)/Wavelengths (nm) Reference
Parmigiano ReggianoRipening based on rind percentage—extra rind content and defects of the PDO cheese, due to moisture and lipid profiles which are affected by proteolysis and lipolysis (affect nitrogen fraction and the lipid content) 5882–5656, 5305, 4322–4243, and 4566 cm−1/1700–1768, 2314–2357, and 2190 nm [19]
Parmigiano-ReggianoRipening based on rind content, as different textures, and moisture content between the inner and the rind zones of the cheese were observed 9398–7491, and 5173–4243 cm−1/1064–1335, and 1933–2357 nm [20]
EmmentalGeographical origin based on chemical properties, such as fat and total nitrogen 10000–8000 cm−1/1000–1250 nm [24]
Ezine Chemical properties such as protein, fat, salt, dry matter, moisture, and ash 10000–4000 cm−1/1000–2500 nm [18]
Minas Detection of adulteration (different concentrations of cow milk) based on protein profile 9043, 9286, 9353, and 9632 cm−1/1106, 1077, 1069, and 1038 nm[5]
-Detection of adulterants, i.e., water, urea, bovine whey, and cow origin milk in goat samples with concentrations of 0 (control), 1, 5, 10, 15, and 20% v/v. 10000–5268, 5037–4163 cm−1/1000–1898, 1985–2402 nm[9]
Commercial grated cheeses Detection of adulterants, i.e., cellulose, silicon dioxide, wheat flour, wheat semolina, and sawdust in grated cheese 4000–5000 and 6000–7000 cm−1/2500–2000, 1667–1429 nm[22]
Soft and semi-hard cheeses (Caciotta, Mozzarella, Mozzarella Pizza, Primo sale, Ricotta siero, and Scarmorza) Total nitrogen, soluble nitrogen, ripening index, major minerals content (Ca, K, Mg, Na, and P), and fatty acid profile -[21]
Table 2. Overview of hyperspectral imaging (HSI) techniques for the determination of quality and adulteration in cheese.
Cheese TypeIntended UseSelected Wavenumbers (cm−1)/Wavelengths (nm) Reference
Parmigiano ReggianoQuantification of rind amount in grated cheese 8368–8163, 7519–7463, 7143 cm−1/1195–1225, 1330–1340 and
1400 nm
[25]
Parmigiano Reggiano Quantification of rind amount (8, 18, 28%), and investigation of the influence of fat content and grater type in grated cheese 28% amount of rind: 7576–7194 cm−1/1320–1390 nm
8% amount of rind: 9346, 7042–6579 cm−1/1070 nm and 1420–1520 nm
[26]
Semi-hard cheese made from 3.5% and 5% fat cow milk Ripening based on the effect of transglutaminase and fat content 7210, 8403, 8104 cm−1/1387,
1190, 1234 nm
[27]
Swiss-type cheese Ripening based on hardness 15385–10000 cm−1/650–1000 nm [17]
Proteolytic maturation: Asiago, Casera, Parmigiano Reggiano, Lipolytic reactions: Aventino, Camoscio d’ Oro, President, Gorgonzola, Biochemical behavior: Morbidezza, Formaggetta, Bel Paese
Biochemical mapping over time: Formaggetta
Ripening based on surface dehydration, proteolysis, and lipolysis Proteolytic maturation: 5917 cm−1/1690 nm,
Lipolytic reactions: 4673 cm−1/2140 nm,
Surface dehydration-water contribution:
7353–6667 cm−1/1360–1500 nm
[28]
Fresh cheese Adulterant: starch based on water content 17123, 10276–10000 cm−1/584, 976–1000 nm [7]
Table 3. Physical appearance and nutritional content of the halloumi cheese samples.
No. of Sample Species’ Origin (Also Confirmed by FTIR)Colour and Texture * (Appearance after Freeze-Drying)Fat (g/100 g)Protein (g/100 g)
1 Goat–sheep Yellow 31.430
2 Goat–sheep Yellow 3027
3 CowWhite 2423
4 CowWhite 2523
5 CowWhite 2523
6 Goat–sheep Yellow 3024
7 CowWhite 2325
8 CowWhite 2622
9 Goat–sheep Yellow 3231
10 CowWhite 2524
11 CowWhite 2422
12 CowWhite 2522
13 Goat–sheep Yellow 3023
14 Goat–sheep Yellow 3025
15 Goat–sheep Yellow (most oily) 3130
16 Goat–sheep Yellow 3028
17 Goat–sheep Yellow2826
* Yellow colour samples usually have an oily appearance, while white colour samples are always dry.
Disclaimer/Publisher’s Note: The statements, opinions and data contained in all publications are solely those of the individual author(s) and contributor(s) and not of MDPI and/or the editor(s). MDPI and/or the editor(s) disclaim responsibility for any injury to people or property resulting from any ideas, methods, instructions or products referred to in the content.

