Article

1H-NMR-Based Chemometric Analysis of Echinacea Species to Predict Effectors of Myeloid Progenitor Stimulation

by
Suresh K. Nagumalli
1,*,
Joshua T. Salley
1 and
Jeffrey D. Carstens
2
1
School of Basic Pharmaceutical and Toxicological Sciences, College of Pharmacy, University of Louisiana at Monroe, Monroe, LA 71291, USA
2
United States Department of Agriculture-Agricultural Research Service (USDA-ARS), North Central Regional Plant Introduction Station (NCRPIS), Ames, IA 50014, USA
*
Author to whom correspondence should be addressed.
Analytica 2024, 5(1), 28-53; https://doi.org/10.3390/analytica5010003
Submission received: 19 December 2023 / Revised: 10 January 2024 / Accepted: 10 January 2024 / Published: 13 January 2024
(This article belongs to the Section Chemometrics)

Abstract

:
Echinacea, a herbaceous, perennial flowering plant from the Compositae (Asteraceae) family, exhibits stimulating effects on myeloid progenitors (CFU-GMs) in rat bone marrow, as demonstrated in our previous study using a 75% (v v−1) ethanol extract of aerial parts. Expanding on this work, we have investigated eleven different Echinacea samples that belong to three species for their myeloid progenitor-stimulating activity. Simultaneously, we employed 1H-NMR spectroscopy (400 MHz, 0.02–10.02 ppm) and chemometric analysis to predict constituents responsible for activity. Female Sprague–Dawley rats received oral doses of ethanol extracts (0–200 mg extract dry weight kg−1 body weight) of Echinacea for seven days. Bone marrow cells were then cultured with CFU-GM growth factors. Extracts showing a statistically significant (p < 0.05) increase in CFU-GM, compared to the control, were considered active. Significant CFU-GM increases were observed in rats treated with seven Echinacea samples, ranging from 39% to 91% higher than the control, while four samples were inactive. All five Echinacea purpurea samples showed myeloid progenitor-stimulating activity, while one sample each of Echinacea angustifolia and Echinacea pallida also exhibited the same activity. By applying orthogonal partial least squares discriminant analysis (OPLS-DA) to the 1H-NMR spectra, we identified specific spectral bins (0.70–1.98 ppm aliphatic and 6.38–7.76 ppm aromatic) correlating with myelopoiesis stimulation. These findings highlight the potential of chemometric analysis using 1H-NMR spectroscopy to infer the chemical classes that could be responsible for the bioactive properties of complex herbal mixtures, like Echinacea.

1. Introduction

Echinacea species, belonging to the Compositae (Asteraceae) family [1], are herbaceous, perennial flowering plants native to North America. They rank among the top ten preferred dietary supplements in the U.S. [2]. Traditionally, Echinacea purpurea (L.) Moench, Echinacea angustifolia DC., and Echinacea pallida (Nutt.) Nutt. have been used in herbal medicine, primarily to improve or prevent viral upper respiratory infections. However, clinical trials assessing the treatment of these diseases, particularly rhinovirus infections, have yielded mixed results [3]. The inconsistent performance of Echinacea samples in clinical trials may be attributed to inadequate characterization and standardization of the test formulations.
Comprehensive profiling of the abundant constituents specific to each Echinacea species and the particular plant parts used (typically aerial parts or roots) holds significant importance. This profiling helps establish a certain level of standardization [4]. By conducting such profiling, a more consistent and reliable assessment of the therapeutic potential of Echinacea samples can be achieved. This, in turn, could lead to better-informed clinical trials and enhanced efficacy in treating various diseases. However, for optimal therapeutic effects, it is crucial to identify and calibrate the active principles to facilitate comparative evaluation of different samples.
Echinacea samples used for herbal medicine and dietary supplements are relatively crude and, hence, complex mixtures. The identification of active constituents of complex mixtures that exhibit therapeutic activity is usually achieved through bioassay-guided fractionation. Even though bioassay-guided fractionation has been proven effective in the past, it has several limitations [5,6]. During the fractionation process, there can be a potential loss of synergistic properties among the constituents present in the crude extracts. The process of chemical separation often leads to a reduction in material, posing challenges in isolating trace constituents. Moreover, the methodology tends to prioritize the identification of dominant peaks within each fraction or extract, potentially overlooking the bioactive constituents present in low abundance [7]. Additionally, the whole process is time-consuming and labor-intensive.
In recent years, there has been significant progress in the field of multivariate statistical analysis and chemometrics, offering valuable tools for interpreting spectra obtained from complex mixtures. These techniques allow for the correlation and potential identification of chemical constituent classes responsible for the observed biological activity of the mixtures [8,9]. Among the analytical techniques available, nuclear magnetic resonance (NMR) spectroscopy stands out as a highly effective method capable of detecting a wide range of metabolites [10]. In particular, 1H-NMR-based chemometrics have emerged as a powerful analytical approach for studying biological systems [11]. Furthermore, 1H-NMR-based chemometrics have been successfully applied in identifying bioactive constituents from plant extracts [12,13,14].
The successful identification and isolation of bioactive constituents from plant extracts necessitate a comprehensive understanding of the chemical constituents present in the extract. Several chemical classes have been characterized for Echinacea, and members of these classes have been shown to mediate pharmacological effects consistent with the herbal medicine’s potential therapeutic effects. Alkylamides of Echinacea, for example, show anti-inflammatory properties [15,16], caffeic acid derivatives (CADs) that possess antioxidant properties [17,18], and polysaccharide-rich fractions that stimulate macrophages [19,20]. Specifically, a homogenous polysaccharide derived from E. purpurea has been shown to suppress tumor progression in vivo by facilitating M1 macrophage polarization [21]. Polyacetylenes and polyenes have been shown to decrease the viability of colorectal adenocarcinoma cells [22]. Echinacea also exhibits several other pharmacological effects, although the specific constituent class responsible for these effects has yet to be identified [23,24], and interactions between the classes of constituents are rarely considered [25].
In our previous study [26], we demonstrated that Echinacea stimulates myelopoiesis activity. Specifically, we observed an increase in myeloid progenitor cells (Colony-Forming Units–Granulocytes, Macrophages, CFU-GMs) in the bone marrow of female Sprague–Dawley rats following daily oral administration of an ethanol extract (EtOH, 75% v v−1) derived from the aerial parts of Echinacea for a duration of 7 days.
Building on the findings from our previous study [26], in this study, we investigated the effects of aerial parts from eleven Echinacea samples belonging to three different species, including ten samples obtained from the United States Department of Agriculture-Agricultural Research Service (USDA-ARS) Germplasm Resources Information Network (GRIN)-North Central Regional Plant Introduction Station (NCRPIS) and one commercial Echinacea purpurea sample from Monterey Bay Spice Co., Watsonville, CA, on the production of CFU-GMs from the bone marrow of treated rats. To investigate the specific target and underlying mechanisms of Echinacea’s stimulation of CFU-GMs, we evaluated an active sample’s impact on Colony-Forming Units–Granulocytes, Erythrocytes, Megakaryocytes, Macrophages (CFU-GEMMs) and explored potential changes in Blast Forming Units–Erythrocytes (BFU-Es). Additionally, untargeted high-density profiling of the constituents in the crude plant extracts was performed using 1H-NMR spectroscopy. The obtained spectra were binned, and the relative signals of the extracts were correlated with the stimulation of myelopoiesis activity using multivariate statistical techniques to identify the chemical classes that most likely contributed to the observed bioactivity. Knowledge gained from this approach can be used to guide the selection of optimal Echinacea sources and design efficient bioassay-guided fractionation.

2. Materials and Methods

2.1. Plant Materials

This study utilized aerial parts from ten samples, representing three Echinacea species: Echinacea purpurea (E. purpurea), Echinacea angustifolia (E. angustifolia), and Echinacea pallida (E. pallida). Specifically, these included E. purpurea samples PI-631307, PI-633668, and PI-649040, which were grown under two distinct conditions: in the field (FG) and a shade house (SH) with approximately 50% shading density. E. angustifolia samples included PI-649026, PI-649029, and PI-633654, and E. pallida samples included PI-631300, PI-597603, and PI-633661. All samples were obtained from the seed repository of the USDA-ARS NCRPIS, cultivated, harvested, and dried by a USDA-ARS horticulturalist (JDC), and then transported to our Monroe, LA laboratory for the preparation of ethanol extracts.
In addition to the samples we obtained from USDA-ARS, we also incorporated MISS 82127, a pre-minced and dried commercial product of E. purpurea procured from the Monterey Bay Spice Company. The product was labeled “Echinacea purpurea herb, c-s Echinacea purpurea 1 lb. (454 g) Lot# 16F155-985”. Both the samples from USDA-ARS and the commercial product were kept at −20 °C until used for the study. A voucher specimen from the sample MISS 82127 was sampled and deposited at the University of Mississippi, Thomas M. Pullen Herbarium (MISS). Supplementary Information File S1 (File S1: Plant Sample Photodocumentation) provides a photographic record of the utilized plant samples.

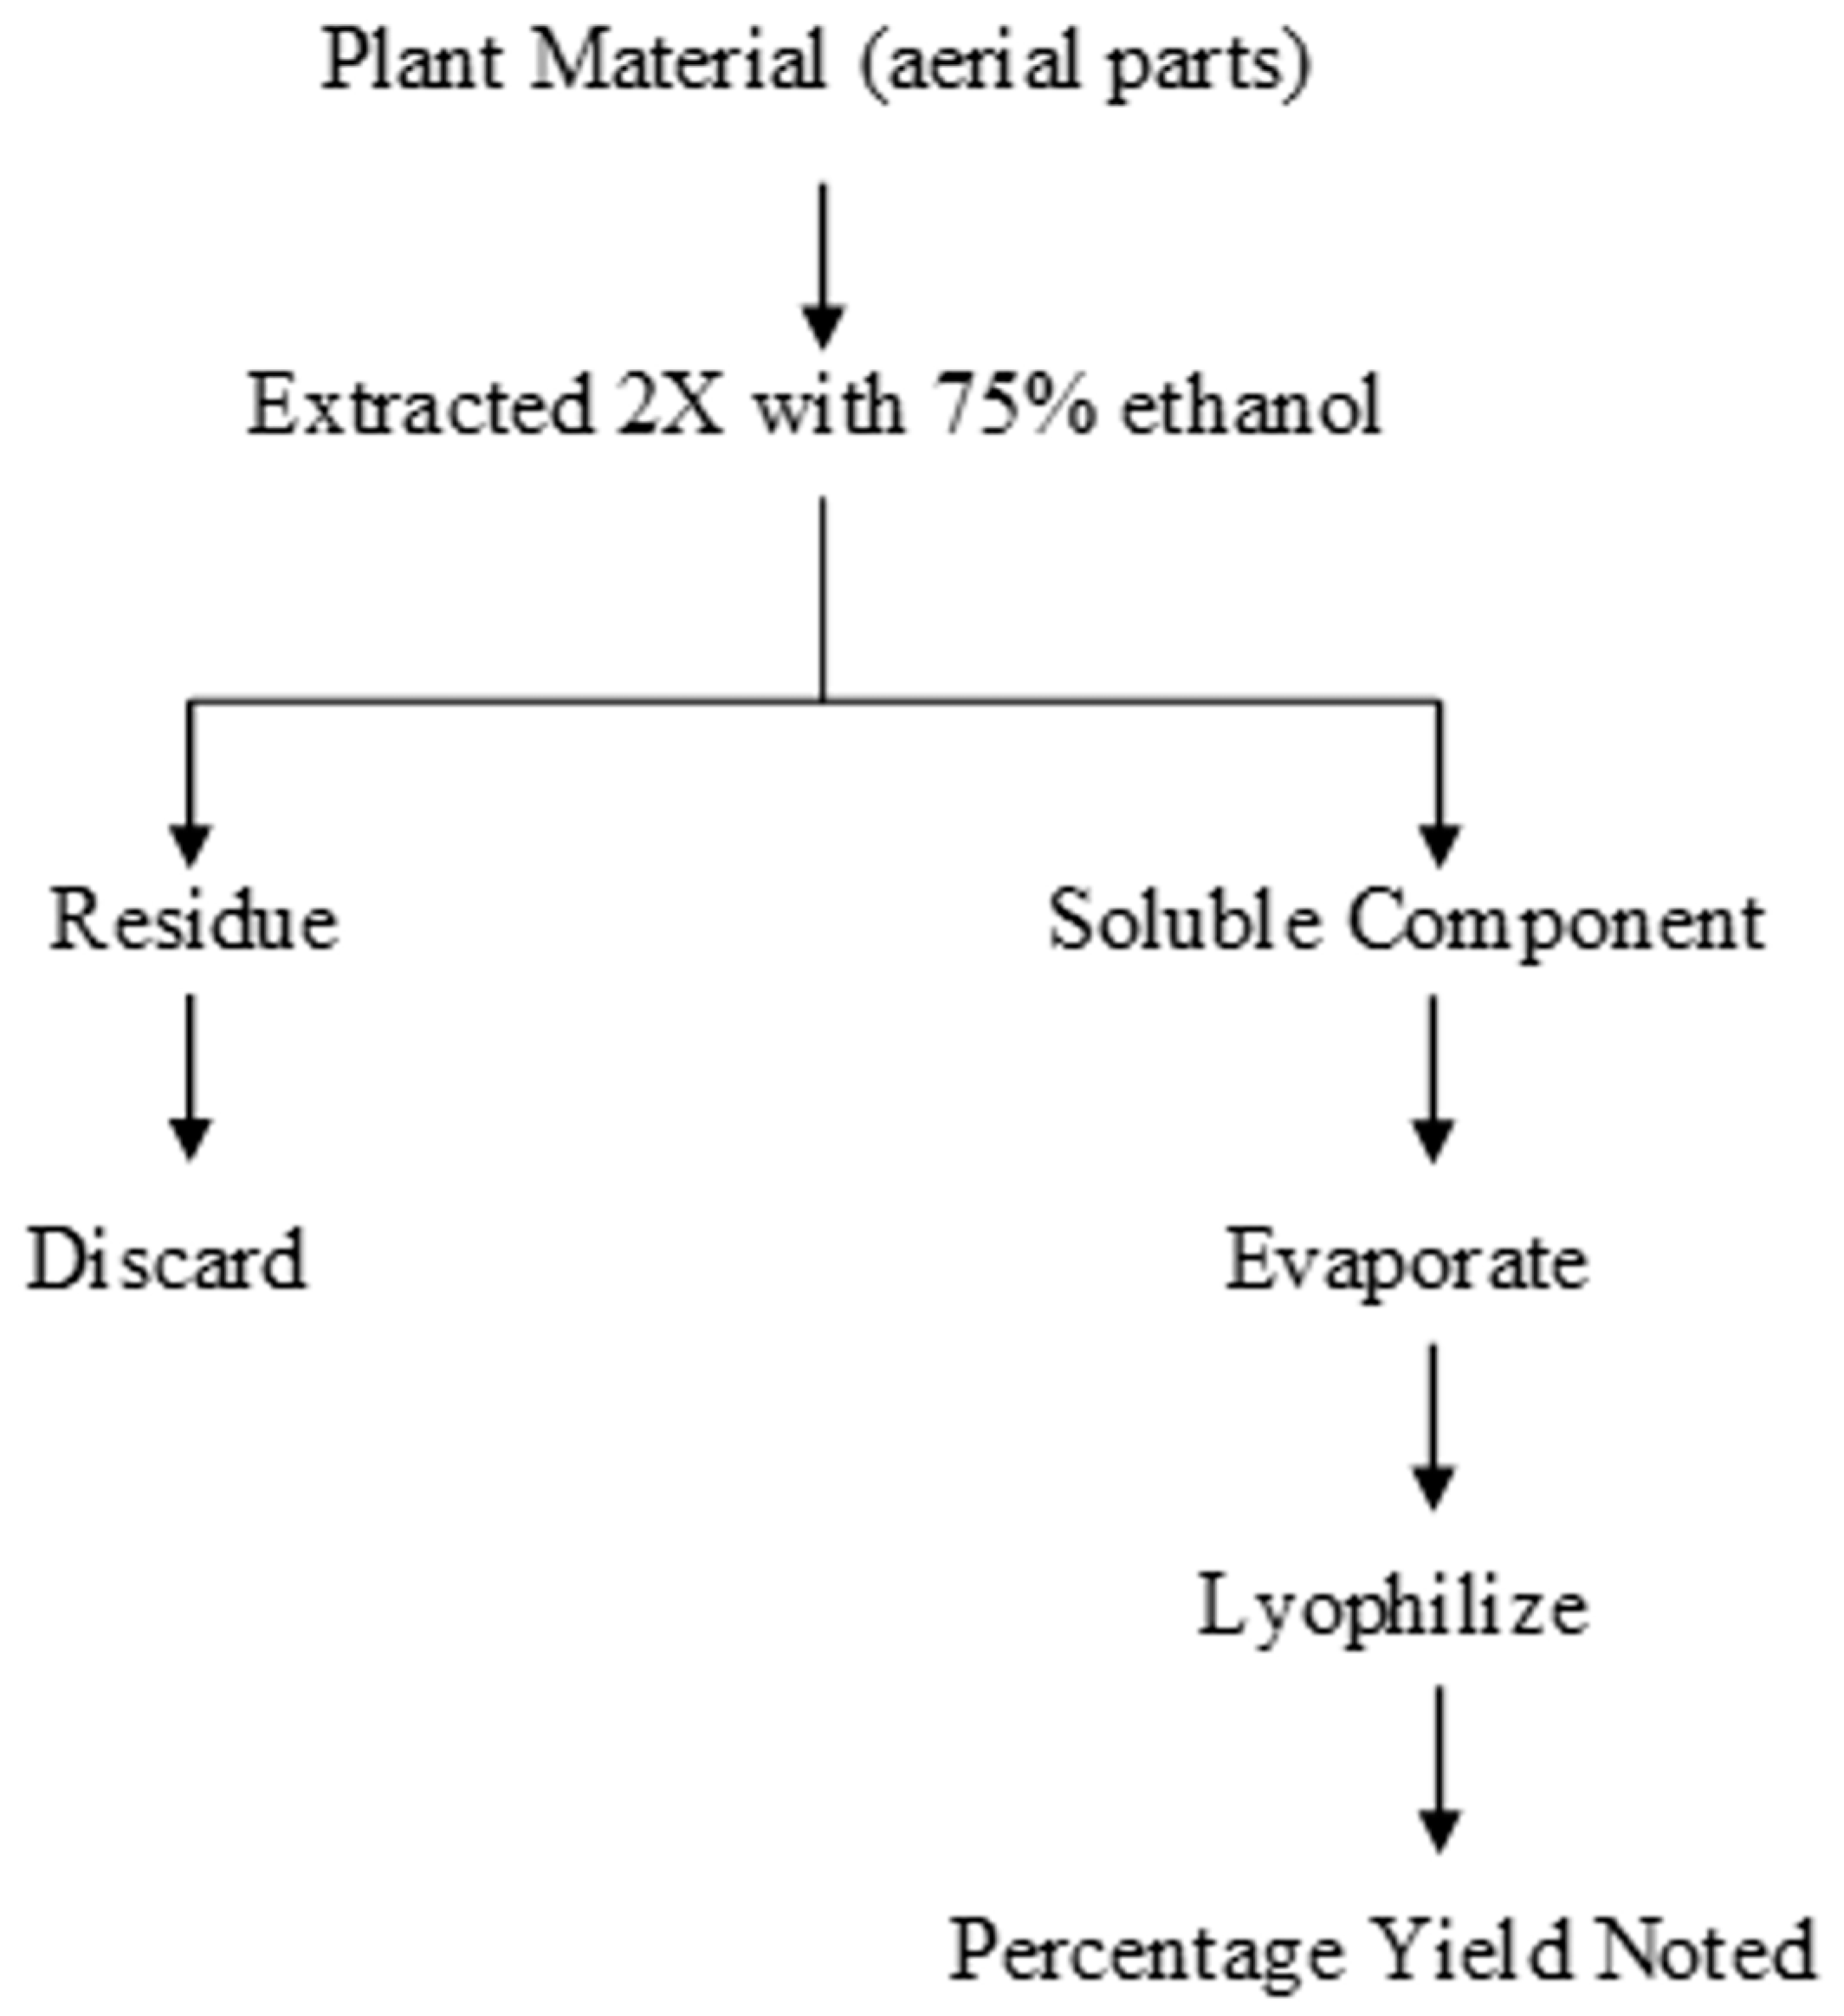
2.2. Extraction Schemes

The dried aerial parts of the plants were first processed into a fine powder using a blender, followed by filtration through a 20 Mesh sieve (850 microns) to ensure consistency. The resulting plant powder was then macerated in a solution of 75% ethanol (0.05 g dry weight mL−1; Pharmco-AAPER, Irvine, CA, USA) for a period of 24 h at room temperature. This process was facilitated by continuous agitation using a magnetic stirrer. After maceration, the mixture was filtered and subjected to a second round of maceration using a fresh batch of 75% ethanol for an additional day. The resulting extracts from both macerations were pooled and subsequently dried using a rotary evaporator with a vacuum pump at a temperature of 40 °C. The remaining residue underwent lyophilization to yield a semi-solid extract (Figure 1). The percentage yield of this extraction process was calculated (Table 1) and ranged from 9.2 to 17.8% (w w−1) of the initial aerial part weight (Table 1).

2.3. Animal Husbandry and Treatment

Female Sprague–Dawley (SD) rats (approximately 6–9 weeks old; 175–230 g) were obtained either from a breeding colony at the University of Louisiana at Monroe (ULM) animal facility or acquired from Harlan-Sprague Dawley Inc. (Madison, WI, USA). Prior to the study, the rats were allowed a one-week acclimation period, during which they were housed two per cage in polycarbonate cages lined with wood chip bedding (Sani-chips, Harlan Teklad, Madison, WI, USA) with free access to rodent chow food (No 7001, Harlan Teklad) and tap water. The housing conditions were maintained at a controlled temperature (21 ± 1 °C) and humidity (50 ± 10%), with a 12 h light–dark cycle. All animal husbandry and handling procedures adhered to the Guide for Use and Care of Animals (National Research Council, 2011) [27], and the study protocols received prior approval from ULM’s Institutional Animal Care and Use Committee (IACUC) under approval number 13OCT-SAM-01.
Rats were randomly assigned to different treatment groups, each consisting of 4 to 6 animals. The control group received a DMSO (5% v v−1 in corn oil) solution. The other groups were administered specific doses of the dried 75% ethanol extracts, namely 25 mg kg−1 d−1, 50 mg kg−1 d−1, 100 mg kg−1 d−1, or 200 mg kg−1 d−1, each initially dissolved in a DMSO (5% v v−1 in corn oil) solution. All animals were subjected to daily visual inspections throughout the dosing period to monitor for any signs of overt toxicity; no adverse symptoms were detected. The extracts were orally administered to the rats via gavage daily over a seven-day period, with a dosage volume of 10 mL kg−1. Twenty-four hours following the final dosage, the animals were weighed and then euthanized under CO2 anesthesia. Immediately after, the femurs were excised to isolate bone marrow cells.

2.4. Bone Marrow Cell Isolation

Both femurs from each rat were dissected from the carcass and cleaned of tissue. Proximal and distal ends of the femurs were removed, and bones were flushed with 3 mL of filter (0.2 µm)-sterilized Iscove’s Modified Dulbecco Medium (IMDM; Life Technologies, Waltham, MA, USA) containing 0.2% BSA (bovine serum albumin; Sigma-Aldrich, St. Louis, MO, USA) and 1% antibiotic, antimycotic (Life Technologies, Waltham, MA, USA) using an 18 ½ gauge needle. Femurs were inverted and flushed again with the same 3 mL medium, and media from both femurs were pooled (6 mL per rat). Hereafter, all procedures were performed under sterile conditions. Cells were filtered through sterile nylon mesh and centrifuged at 250× g for 10 min at room temperature. Pelleted cells were resuspended in 3 mL medium, and bone marrow cells were counted using a hemocytometer.

2.5. Mononuclear Cell Isolation

Mononuclear cells in IMDM were isolated from bone marrow cells at the interface after centrifugation (400× g, 30 min) over histopaque-1077 (6 mL; Sigma-Aldrich, St. Louis, MO, USA). After isolation, the mononuclear cells were transferred to a clean 20 mL centrifuge tube and diluted with 10 mL medium, pelleted by centrifugation (400× g, 10 min), resuspended in 5 mL medium, and pelleted two more times. Finally, the cell pellet was resuspended in 0.25 mL medium. The number of cells was determined by a hemocytometer, and the cell dilutions were made equivalent to 2 × 10⁶ cells mL−1.

2.6. Colony-Forming Units–Granulocytes, Macrophages (CFU-GM) Assay

A CFU-GM assay was performed as described previously [26]. The CFU-GM assay was performed using the CAMEO kits (cat # KCO1-GM1-1R) as per the supplier’s instruction (HemoGenix, Colorado Springs, CO, USA). Briefly, 20,000 mononuclear cells in 15 µL IMDM medium were mixed with 540 µL master mix containing methylcellulose and growth factors: 20 ng mL−1 Granulocyte Macrophage–Colony-Stimulating Factor (GM-CSF), 10 ng mL−1 Interluekin-3 (IL-3), and 50 ng mL−1 Stem Cell Factor (SCF). The mixture was plated (100 µL) in each well of a 96-well plate. The plates were then incubated in a humidified 5% CO2 incubator at 37 °C for 5 days. CFU-GM colonies were measured based on ATP content, quantitated as luminescence produced from luciferase, and calibrated against a standard curve generated on the same day. Luminescence was measured using a Synergy H1 hybrid reader (BioTek, Winooski, VT, USA).

2.7. Limulus Amebocyte Lysate (LAL) Assay

The presence of lipopolysaccharides (LPS, bacterial endotoxin) in the extracts was determined via the Limulus Amebocyte Lysate (LAL) assay, specifically using a Pyrochrome® LAL kit (Associates of Cape Cod, Inc., East Falmouth, MA, USA). This assay is based on the principle that LPS in the sample triggers the activation of factors in the LAL, leading to the cleavage of a peptide in Pyrochrome® LAL and the production of para-nitroaniline (pNA). Subsequently, pNA reacted with nitrite in HCl and N-(1-Naphthyl)-ethylenediamine (NEDA) to form a diazotized magenta product, which exhibited an absorbance in the optical density range of 540–550 nm. This absorbance was directly proportional to the amount of LPS present.
The LAL assay was performed using only endotoxin-free materials. Extracts (10 mg dry wt mL−1) were diluted in LAL reagent water (LRW), combined with Pyrochrome (reconstituted with 3.2 mL Glucasheild, a (1→3)-β-D-Glucan Inhibiting Buffer) at a 1:1 ratio, and incubated at 37 °C for 27 min, as per the supplier’s instructions. Post-incubation, the mixture was treated with 50 µL each of reconstituted sodium nitrite in HCl, ammonium sulfamate in water, and N-(1-Naphthyl)-ethylenediamine (NEDA) in water. The absorbance was measured at 550 nm, and the quantity of LPS, expressed as Endotoxin Units per gram (EUs g−1), was calculated via interpolation into the standard curve (concentration: 0.05–2.5 EU mL−1) generated on the same day, with LAL reagent water (LRW) serving as a negative control. To eliminate interfering glucan from bacterial-origin cellulosic material present in plant extracts, Glucasheild was employed. Each sample was analyzed in triplicate.

2.8. Statistics

The effects of Echinacea extracts on CFU-GMs were analyzed using a one-way analysis of variance (ANOVA). The normality and equality of variances were confirmed using the Shapiro–Wilk and Brown–Forsythe tests, respectively. A post hoc comparison of treatment means against the vehicle control was performed using Dunnett’s test with a significance level of p = 0.05 (GraphPad Prism 4, GraphPad Software, Inc., San Diego, CA, USA).

2.9. 1H-NMR Spectra

1H-NMR spectra were acquired using a JEOL Eclipse ECS-400 MHz NMR spectrometer, equipped with a 5 mm proton multi-frequency, z-axis pulsed field gradient NMR probe. The acquisition parameters are 13,107 original points count, 7503 sweep widths (Hz), and 16 transients, with an acquisition time of 1.7469 s at room temperature. Calibration was achieved using the solvent residual methyl proton signal (δ = 3.31 ppm). Extracts were dissolved in methanol (HPLC grade; Sigma-Aldrich, USA) at a concentration of 20 mg mL−1, followed by 10 min of sonication, filtration through Whatman filter paper, and complete evaporation under a stream of nitrogen gas. The resultant residue was then redissolved in 700 µL of deuterated methanol (MeOD-d4; Cambridge Isotope Laboratories, Andover, MA, USA). Samples were prepared, and spectra were acquired on the same day.

2.10. Chemometric Analysis

The 1H-NMR spectra were automatically reduced to ASCII files. The spectra were phased and baseline-corrected automatically to reduce manual error and maintain consistency. Solvent regions methanol (3.29–3.32 ppm) and water (4.80–5.00 ppm) were removed from the analysis, and spectral intensities were referenced to the residual non-deuterated methanol signal (3.31 ppm). Each spectrum was integrated into 244 bins corresponding to 0.04 ppm bins across the chemical shift range (0.02–10.02 ppm), and the resultant (non-negative; 194) values were divided by the total spectral intensity to normalize the values, resulting in a total of 194 variables. The data were analyzed using the ACD NMR processor academic version [28,29].
Further data analysis was conducted using R software, version 4.3 [30]. The factoextra and FactoMineR packages were used for visualizing Principal Component Analysis (PCA). The ropls package facilitated the modeling of Orthogonal Partial Least Squares-Discriminant Analysis (OPLS-DA). The area under the ROC curve (AUC) was plotted using the pROC package, and the caret package was employed for the generation of the confusion matrix. Standard univariate scaling was used for all analyses.

3. Results

3.1. CFU-GM Results

In line with our primary objective of substantiating our preliminary findings on the myelopoiesis-stimulating properties of Echinacea, as well as identifying the most effective source material, we conducted an analysis of CFU-GM activity across 11 Echinacea samples. Ethanolic (75%, v v−1) extracts of aerial parts of each sample were administered via oral gavage as seven daily doses, ranging from 0 (vehicle) to 200 mg of dry weight per kg of body weight. Subsequently, the colony-forming capabilities of femur myeloid progenitor cells were evaluated after five days of suspension culture, supported by the growth factors GM-CSF, IL-3, and SCF.
Treatment with all five E. purpurea samples resulted in a statistically significant increase in CFU-GMs relative to vehicle control (Figure 2). Among these, the commercial sample, MISS 82127, demonstrated remarkable efficacy, stimulating myelopoiesis significantly at a dosage of 25 mg kg−1 d−1 and reaching a peak response with a 91% increase over the concurrent vehicle control.
The E. purpurea samples, PI-631307 and PI-633668, showed (Figure 2) monotonic dose responses, achieving maximum increases of 66% and 56%, respectively, over the vehicle at a dosage of 200 mg kg−1 d−1. Contrastingly, PI-649040 demonstrated a biphasic response, with peak increases at a dosage of 100 mg kg−1 d−1. The increases observed were 43% for the plants grown in the shade house (SH) and 39% for those cultivated in the field (FG).
In contrast to the E. purpurea samples, only one sample each from the species E. angustifolia and E. pallida showed (Figure 2) statistically significant activity. Specifically, E. angustifolia PI-649026 yielded an 87% increase at a dosage of 200 mg kg−1 d−1, while E. pallida PI-597603 displayed a significant 76% increase at a dosage of 100 mg kg−1 d−1 compared to vehicle control.
The CFU-GM assay results revealed variations, attributable to alterations made to the formulation of the CAMEO kits (HemoGenix) throughout the duration of the study. To account for these variations, we have presented the data relative to the vehicle controls, which were conducted concurrently with the treatment samples (Figure 3; Table 2).

3.2. LAL Assay Results

We evaluated the LPS content within the 11 Echinacea samples to explore any potential correlation between LPS content and their respective CFU-GM activity. The LPS content (Figure 4), expressed in Endotoxin Units per gram (EUs g−1), varied across the samples, ranging from 99 to 221 EUs g−1.
The LPS content of the 11 Echinacea samples was assessed for any potential correlation with the percent increase in CFU-GM activity relative to vehicle control. Figure 5 illustrates that there was no significant relationship between LPS content and CFU-GM activity of the Echinacea samples, as substantiated by a low R2 value (correlation coefficient) of 0.0149.

3.3. 1H-NMR of Eleven Samples

The 1H-NMR spectra of the 11 Echinacea samples were acquired in MeOD-d4 (20 mg per 700 µL) using a JEOL Eclipse ECS-400 MHz NMR spectrometer. Subsequently, the spectra were phased, baseline-corrected, and referenced to the residual non-deuterated methanol signal (3.31 ppm). Figure 6 illustrates the overlay of the 1H-NMR spectra obtained from the 11 Echinacea samples.

3.4. Chemometric Analysis

3.4.1. Principal Component Analysis (PCA) Analysis

A PCA analysis was performed using 194 variables to identify group structure. PCA score plots of the 11 samples of Echinacea were generated, focusing on both major and minor principal components. The major principal components (Dim 1 and Dim 2) account for 50.6% of the total variation, while the minor principal components (Dim 2 and Dim 4) capture 32.43% of the total variation, as shown in Figure 7 and Figure 8, respectively.
The PCA score plot in Figure 8, focusing on the minor principal components (Dim 2 and Dim 4), revealed a distinctive grouping of the samples based on the presence or absence of CFU-GM activity. Notably, Figure 8 illustrated the separation of five active samples (PI-631307, PI-633668, PI-649040 SH, PI-649040 FG, and PI-597603) along Dim 2, while two active samples (PI-649026 and MISS 82127) were segregated along Dim 4 from the cluster of four inactive samples (PI-631300, PI-633661, PI-633654, and PI-649029).

3.4.2. OPLS-DA Activity Differentiation

OPLS-DA modeling for activity differentiation (Table 3) was used to identify variables correlating with CFU-GM activity exhibited by Echinacea. To perform OPLS-DA modeling, the samples needed to be divided into classes. Initially, the PCA score plot (Figure 8) had suggested the possibility of dividing the samples into three classes, consisting of five, two, and four samples; however, it is important to note that having a sample size of only two samples in one of the classes is insufficient to conduct validation tests in a discriminant analysis (DA). Consequently, to ensure robust analysis, the Echinacea samples were grouped into two classes based on the presence (active) or absence (inactive) of activity in the CFU-GM assay. By dividing the Echinacea samples into two groups based on the presence or absence of activity in the CFU-GM assay, two class sizes, consisting of seven (for active) and four (for inactive), were achieved. This allowed for robust validation to be conducted in the subsequent OPLS-DA modeling. This approach ensured reliable statistical analysis by addressing the limitations posed by sample size and facilitated rigorous validation of the model.

3.4.3. OPLS-DA Score Plot and Loading Plot

The OPLS-DA score plot, as depicted in Figure 9, demonstrated that the samples are distinctly separated based on their activity along the first predictive component and is a valuable tool for identifying patterns and trends within the dataset. The plot (Figure 9) reveals that two samples, MISS 82187 and PI-649026, diverge distinctly from the remaining active samples along the first orthogonal component. This observation aligns with the findings presented in the PCA score plot with minor principal components (Figure 8).
The OPLS-DA loading plot, presented in Figure 10, provided insights into the variables that contribute to the observed separation in the score plot. Each of the 244 variables, denoted as X1 through X244, represents distinct bins with a size of 0.04 ppm. The plot (Figure 10), however, only showcases 194 of these variables, omitting those associated with zero values. The loading plot highlights the significance and influence of individual variables within the dataset. Through the loading plot, we can identify the variables associated with the distinct grouping of samples observed in the score plot. This aids in the identification of important variables that drive the separation of samples.
Both the score plot and loading plot in multivariate analysis are correlated, as they offer complementary information about the dataset. In this context, the active samples positioned on the left side (negative scale) of the OPLS-DA score plot are associated with the variables on the corresponding left side (negative scale) of the OPLS-DA loading plot. This correlation strengthened the interpretation of the results and helped establish connections between the behavior of the samples and the underlying variables that contribute to the observed patterns.

3.4.4. Number of Misclassifications (NMC) and Area under the ROC Curve (AUC)

The OPLS-DA model was employed to predict the activity of the 11 samples, and the predicted activity was then compared with the original activity, leading to the generation of a confusion matrix (Table 4). The OPLS-DA model was validated with the Number of Misclassifications (NMCs) and area under the ROC curve (AUC). NMC and AUC values were calculated based on the confusion matrix.
The Receiver Operating Characteristics (ROC) [31] curve illustrates the relationship between specificity (true negatives found as a percentage of all negatives) and sensitivity (true positives found as a percentage of all positives) across various discrimination thresholds. The AUC value is commonly used as diagnostic statistics for OPLS-DA models. The AUC values range from 1 (perfect discrimination between classes) to 0 (0.5 and lower means no discrimination at all). Based on the ROC curve depicted in Figure 11 and an AUC value of 1.0, the OPLS-DA model exhibited perfect discrimination between active and inactive samples.

3.4.5. PCA Score Plot of 71 Variables (VIP ≥ 1.0) Contributing to Activity Differentiation

A total of 71 variables, each with a VIP (Variable Importance in Projection) value greater than or equal to 1.0, were identified through OPLS-DA modeling. For visualization purposes, a PCA score plot was generated using these selected 71 variables. As depicted in Figure 12, the selected 71 variables, chosen based on their VIP values (VIP ≥ 1.0), effectively differentiate active samples from inactive samples along the first principal component. Noteworthily, the samples in the PCA score plot (Figure 12) with 71 variables exhibit similar grouping patterns observed in the PCA score plot with minor principal components (Figure 8) generated with all 194 variables. The Supplementary Excel sheet (File S3 VIP values) provides a comprehensive list of the variables, along with their corresponding VIP values, and the spectral resonances (0.04 ppm bins) they represent.

3.4.6. Identification of Variables Correlating with CFU-GM Activity

The 1H-NMR signals with VIP values greater than or equal to 1.0, which significantly contributed to the differentiation of active samples (as indicated by their correlation in the loading plot), are listed in Table 5.
The 1H-NMR signals with VIP values greater than or equal to 1.0, which contributed significantly to the differentiation of active samples, as observed in the loading plot, were identified specifically on the highest active sample, MISS 82127 (Figure 13). Figure 14a represents the identified variables in the upfield region, Figure 14b depicts the variables near 3.00 ppm, and Figure 14c displays the variables in the downfield region. Based on Figure 13 and Figure 14a–c, it could be inferred that structures with aromatic, alkyne, and alkane protons, possibly phenolics, potentially correlated with the observed myeloid progenitor-stimulating activity demonstrated by Echinacea.

4. Discussion

Hematopoiesis is a tightly regulated event with each division, leading to the production of further cells in the lineage thereby giving rise to mature blood cells [32]. All mature blood cells in the hematopoietic system originate from Hematopoietic Stem Cells (HSCs) that give rise to multipotent progenitors (MPPs). MPPs further give rise to oligopotent progenitors, such as common myeloid progenitors and common lymphoid progenitors (CMPs and CLPs, respectively). CMPs advance to erythrocyte progenitors (BFU-Es), granulocyte, macrophage progenitors (CFU-GMs), and megakaryocyte precursors (CFU-megs) that mature to blood effector cells erythrocytes, granulocytes and macrophages, and platelets, respectively [32,33]. The proliferation of progenitor cells in the hematopoietic system is regulated by three factors: hematopoietic cytokines, transcription factors, and the Jak-Stat pathway [34].
A number of herbal samples have been shown to stimulate bone marrow progenitor cells, including polysaccharides from Angelica sinensis [35], a medicinal herbal cocktail Bojungbangdocktong (BJBDT) [36], a polysaccharide fraction from black soybean [36], and total saponins of Panax ginseng cells (TSPGs) [37]. We are the first to describe the stimulation of myelopoiesis activity by aerial parts of Echinacea species in female Sprague–Dawley rats [26].
In our present study, we extended our investigation to identify the effects of the eleven samples that belong to three species of Echinacea on CFU-GMs. Additionally, we studied the effects of E. angustifolia PI-649026, which exhibited significant CFU-GM-stimulating activity, on the bone marrow upstream progenitor cells to CFU-GMs, i.e., CFU-GEMMs, as well as the erythroid lineage progenitor cells, i.e., BFU-Es. These investigations aimed to uncover the specific stage within the myeloid pathway at which Echinacea exerts its effects (Supplementary Information File S2, File S2 CFUGEMM BFUE).
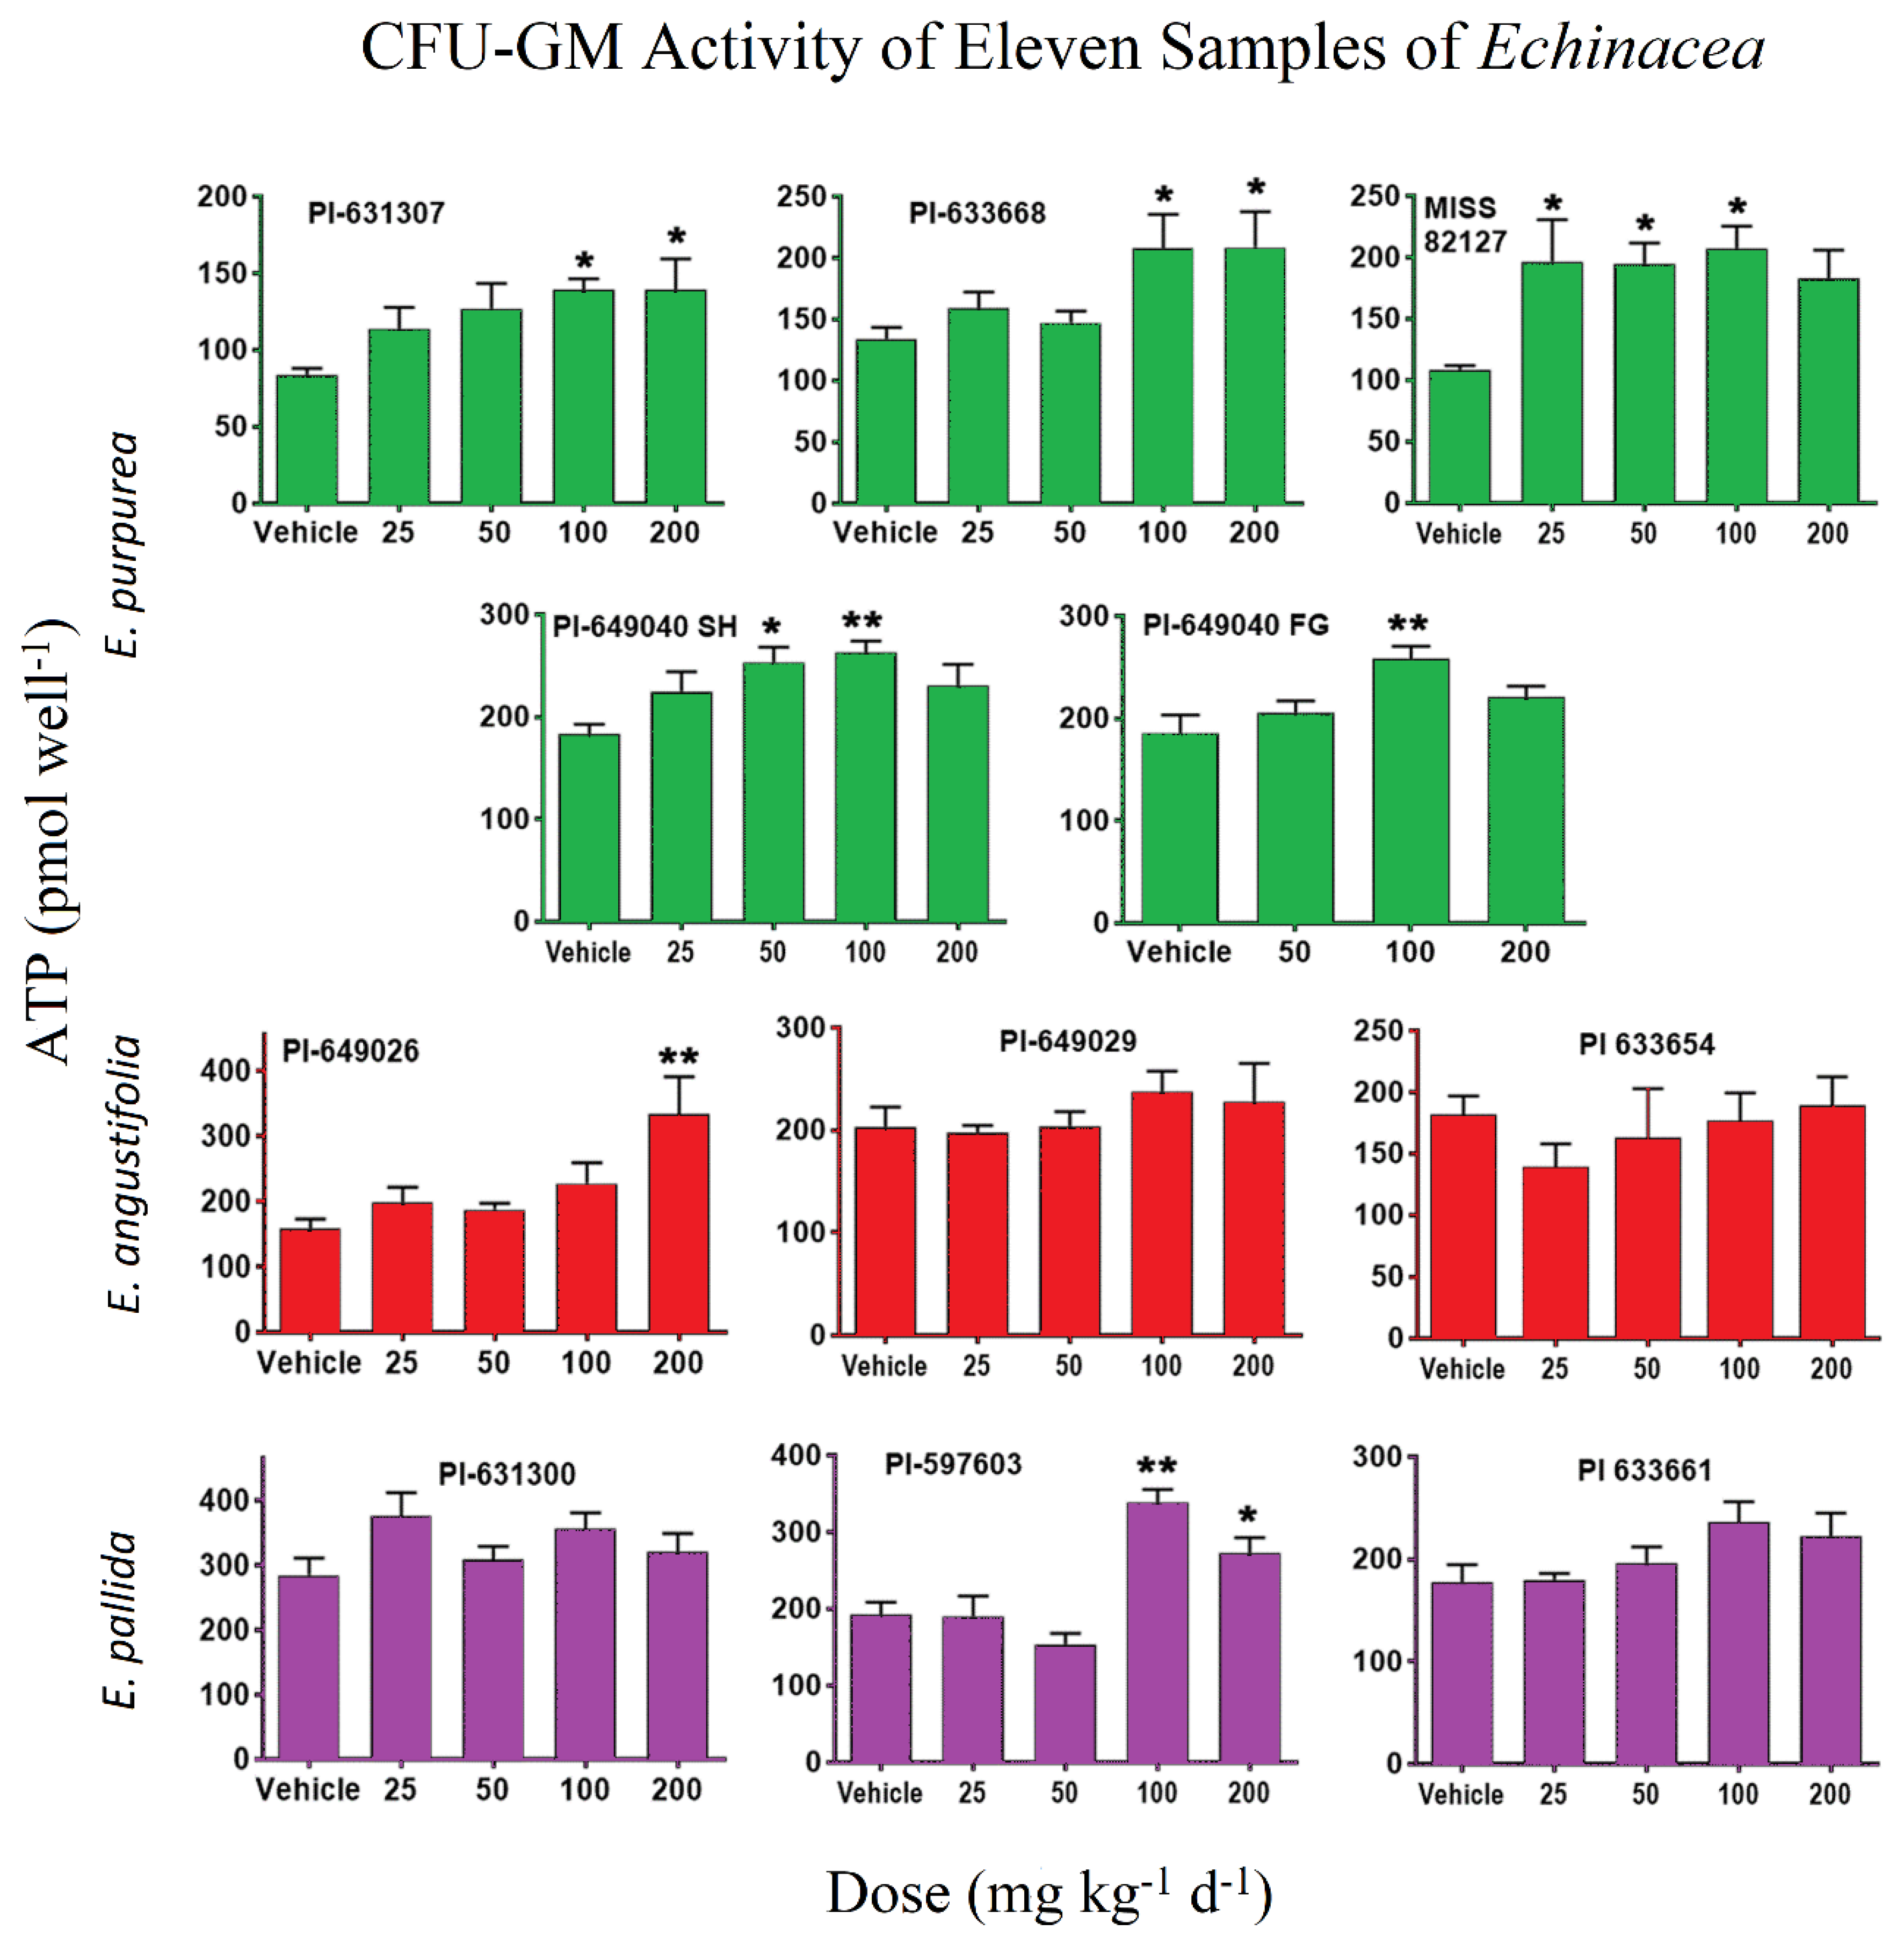
Among the five samples tested from E. purpurea species, MISS 82127 (Figure 2) exhibited the highest activity (91% increase) at 100 mg kg−1 d−1, and MISS 82127 was the only sample that showed activity at the lowest dose, i.e., 25 mg kg−1 d−1. PI-631307 and PI-633668 showed statistically significant increases in CFU-GMs at 100 mg kg−1 d−1 and 200 mg kg−1 d−1, with activity plateauing at 100 mg kg−1 d−1 for PI-631307 and PI-633668. A statistically significant increase in CFU-GMs was observed for PI-649040 SH and PI-649040 FG at 100 mg kg−1 d−1; however, the activity diminished at higher concentrations, i.e., at 200 mg kg−1 d−1 (Figure 2).
Only one E. angustifolia sample, PI-649026, showed a statistically significant increase in CFU-GMs at the doses tested, while the other samples, PI-649029 and PI-633654, did not exhibit any statistically significant increase in CFU-GMs. We observed a statistically significant increase in CFU-GMs at 200 mg kg−1 d−1 with PI-649026 (Figure 2). We have investigated the effects of E. pallida samples on CFU-GMs for the first time, and we found a statistically significant increase in CFU-GMs at 100 mg kg−1 d−1 and 200 mg kg−1 d−1 for PI-597603. However, the observed effect at 200 mg kg−1 d−1 decreased from 100 mg kg−1 d−1. The samples PI-631300 and PI-633661 did not show any effect on CFU-GMs (Figure 2). These results demonstrate that the effects of Echinacea on CFU-GMs are not species-specific and extend across all three species examined. In each of these species, there was at least one sample that showed significant activity in the CFU-GM assay, which aligns with the findings from our previous study [26].
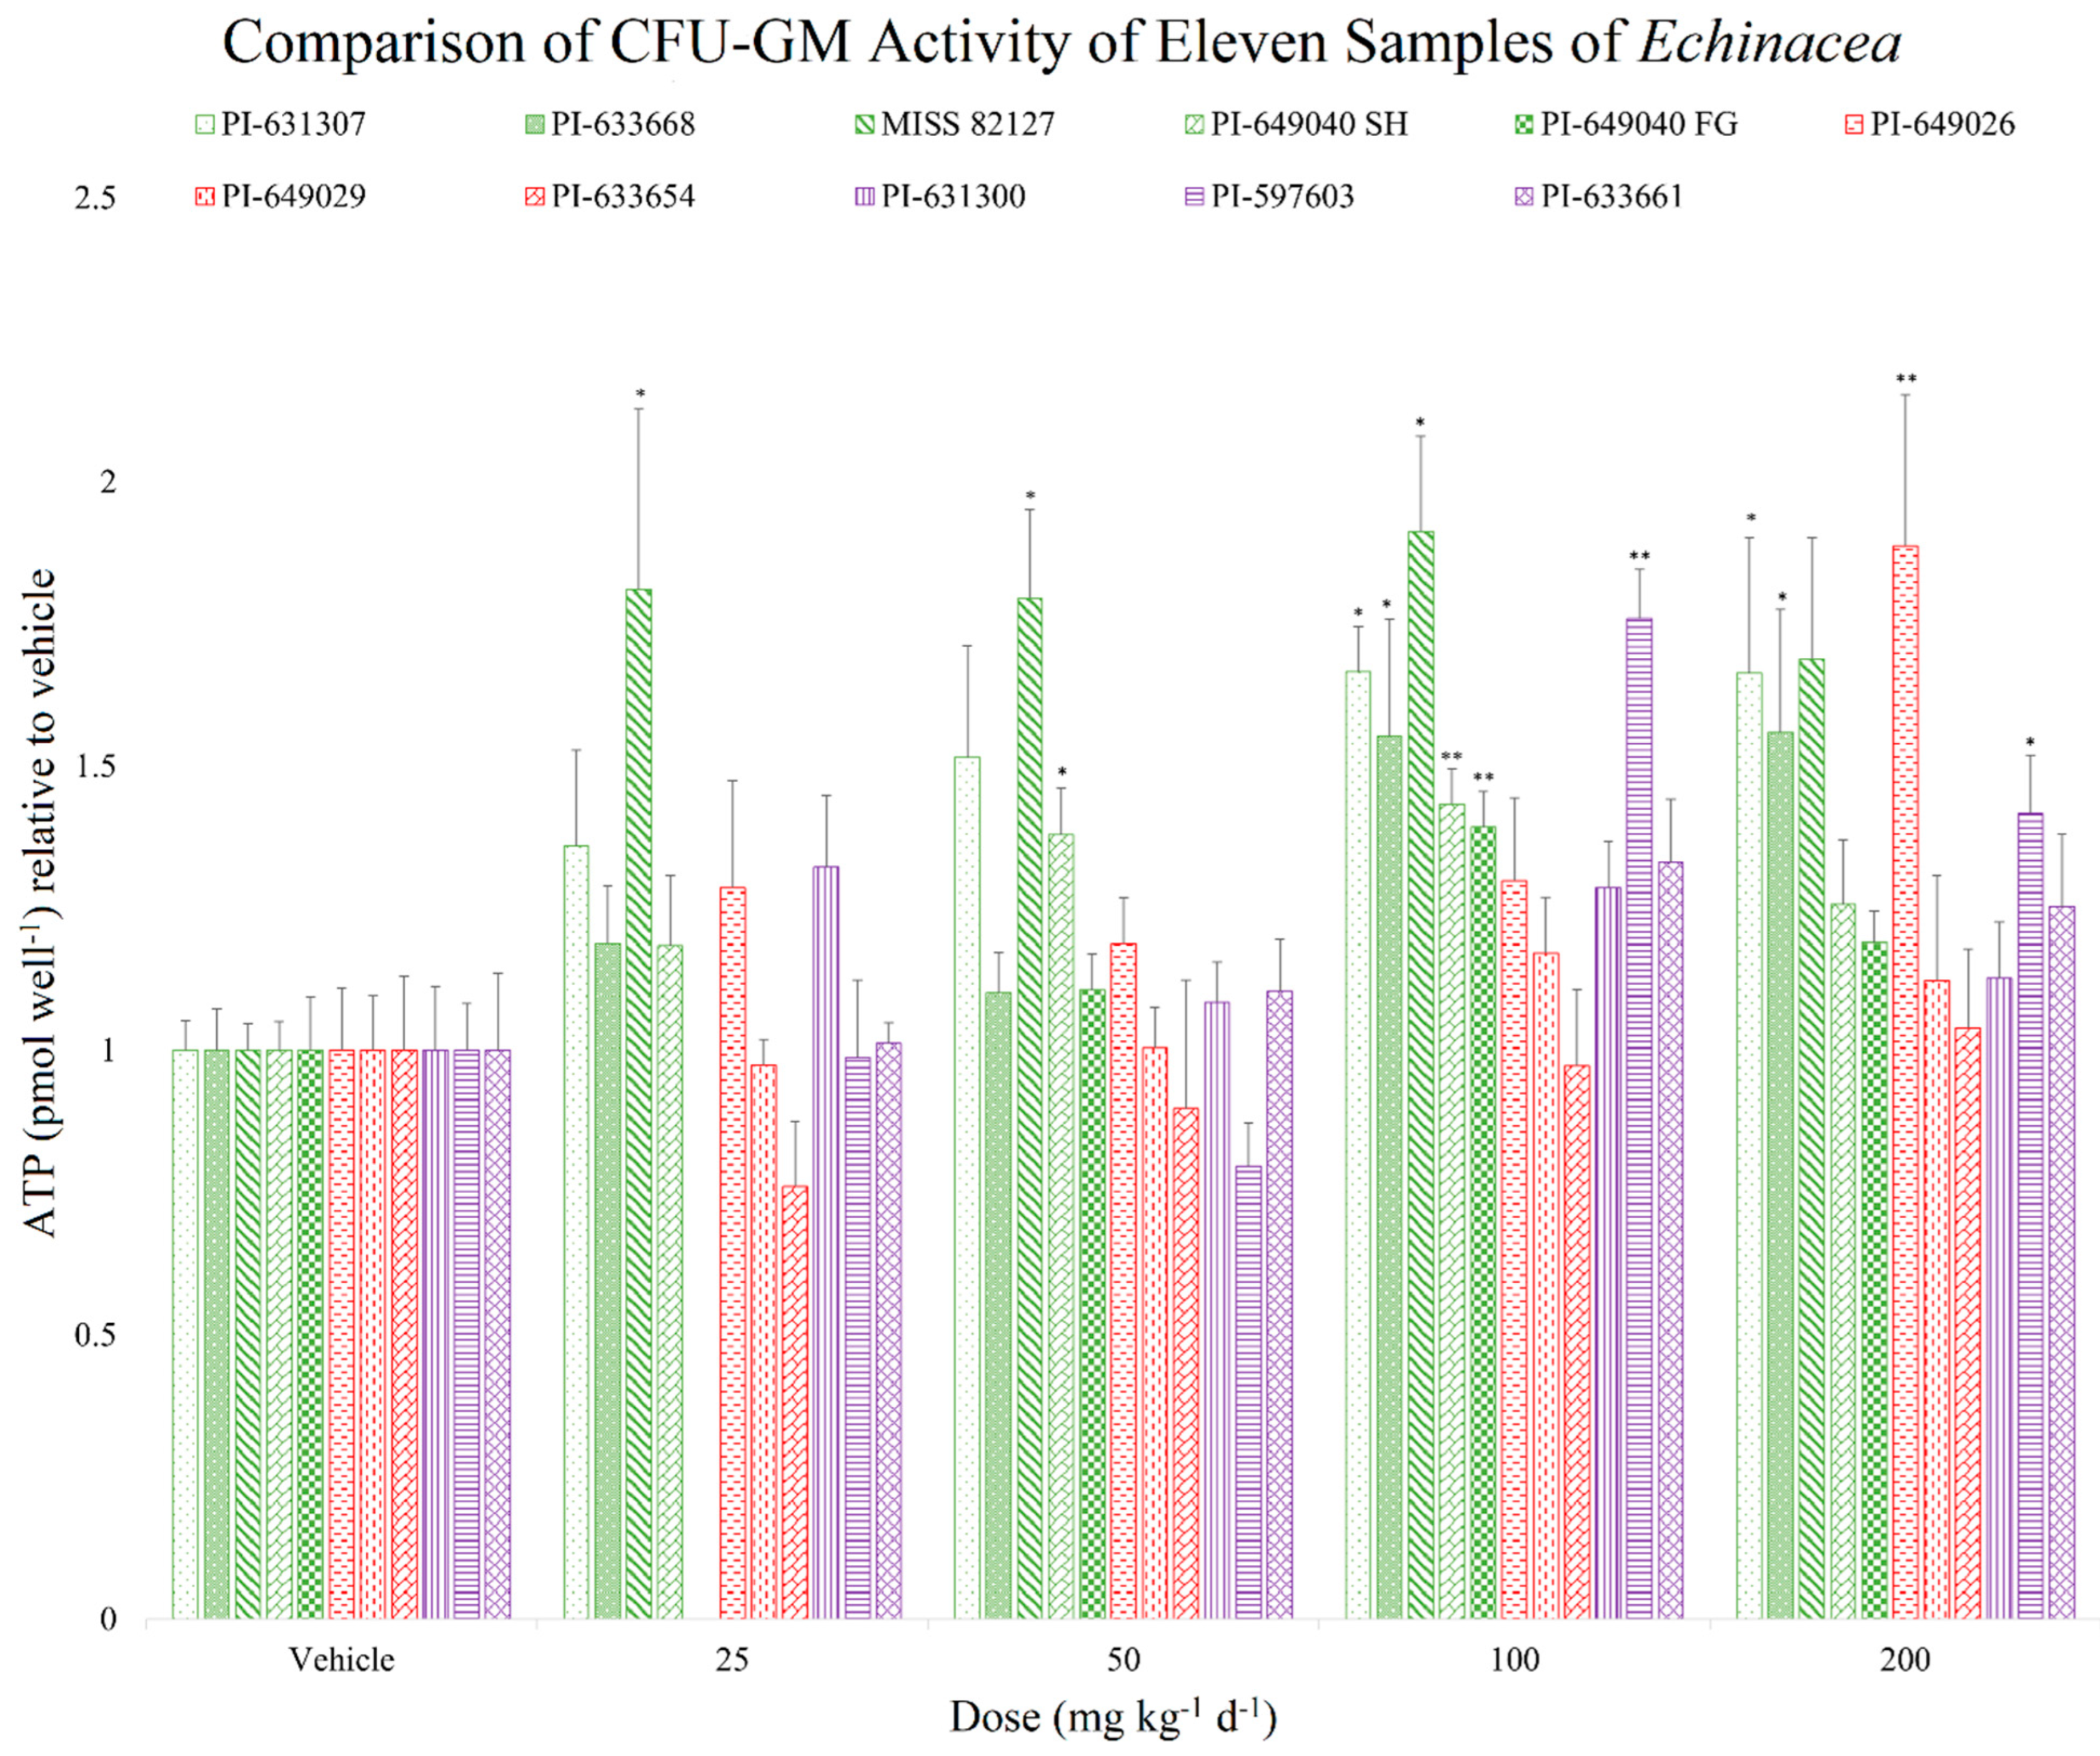
Seven out of the eleven samples tested showed a statistically significant effect on CFU-GMs at either 100 mg kg−1 d−1 or 200 mg kg−1 d−1, while the remaining four samples did not show any statistically significant increase in activity. The decreasing order of CFU-GM activity of the eleven samples, based on the maximum percent increase in CFU-GMs from vehicle control for each sample, is as follows (Figure 3; Table 2): MISS 82127 > PI-649026 > PI-597603 > PI-631307 > PI-633668 > PI-649040 SH > PI-649040 FG > PI-633661 > PI-631300 > PI-649029 > PI-633654.
Interestingly, PI-649026 and PI-649029 samples obtained from different harvests were studied previously for their effect on CFU-GM cells [26]. The individual effects at 100 mg kg−1 d−1 and 200 mg kg−1 d−1 for PI-649026 differed compared to the previous study; however, similar results were obtained regarding the activity or inactivity of these samples in the CFU-GM assay. This suggests that Echinacea samples grown across different time periods and different harvesting conditions will give similar results regarding their effect on CFU-GM cells. Hence, a large part of the factors driving the stimulation of myelopoiesis appears to be intrinsic to the plant and retained in the germplasm.
A key factor when assessing how Echinacea stimulates CFU-GMs is that the CAMEO culture media is formulated with excess cytokines that stimulate the clonal growth and maturation of in vivo affected hematopoietic stem and myeloid progenitor cells. There are three types of cytokines that are involved in this procedure: IL-3, GM-CSF, and SCF [35], with IL-3 and GM-CSF being pleiotropic [34,38], meaning that they act on two different types of progenitor cells (CFU-GEMMs and CFU-GMs). Therefore, the CAMEO CFU-GM assay is not able to distinguish which cell populations (CFU-GEMM or CFU-GM) are targeted by Echinacea.
E. angustifolia PI-649026 was chosen to investigate the potential effects of Echinacea on CFU-GEMM cells because this sample is known to demonstrate CFU-GM activity in both the present and previous studies. Specifically, we examined the impact of PI-649026 on CFU-GEMM cells at high dosage levels of 100 mg kg−1 d−1 and 200 mg kg−1 d−1. As shown in Figure S2a, CFU-GEMM cells are unaffected by PI-649026. These results indicate that Echinacea may influence the efficacy of the transition from CFU-GEMM to CFU-GM, potentially by altering transcription factors involved in the differentiation of common myeloid progenitor cells or inducing signal transduction pathways related to the development of myeloid progenitor cells.
Lineage programming with transcription factor antagonism (GATA-1 and PU.1 promote erythroid, megakaryocytic, eosinophil, and myeloid differentiation, respectively) determines lineage in hematopoietic progenitor differentiation [39]. To determine whether the effects of Echinacea are due to its effect on transcription factors, we studied the effects of the E. angustifolia sample, PI-649026, on BFU-Es at high doses of 100 mg kg−1 d−1 and 200 mg kg−1 d−1. Transcription factor antagonism would predict that if Echinacea’s effect on CFU-GMs is mediated through transcription factors, it would result in a decrease in BFU-Es. However, as demonstrated in Figure S2b, we did not observe any significant effect, neither an increase nor a decrease, of PI-649026 on BFU-Es. These findings suggest that the effects of Echinacea on myeloid progenitor cells are unlikely to result from a shift in commitment to the erythroid lineage via modification of lineage transcription factors.
Echinacea’s effects on myeloid progenitors (CFU-GMs) are not attributable to the induction of progenitors of CFU-GMs (increase in CFU-GEMMs) or transcription factor antagonism (decrease in BFU-Es), as illustrated in Figure S2a,b. This suggests that the Echinacea’s effect on myeloid progenitor cells is most likely due to the Jak-Stat signaling pathway. The Jak-Stat signaling pathway is the major pathway in hematopoietic progenitor cells that regulates the proliferation and differentiation of progenitor cells. Jak2 is known to have an effect on myeloid progenitors [40,41]. Moreover, the Jak2 Stat5 pathway has been implicated in the development of progenitor cells by BJBDT [36] and TSPG [37]. Further investigation is required to validate this hypothesis.
The myeloid progenitor-stimulating activity exhibited by some Echinacea samples (PI-631307, PI-633668) plateaued, while the activity of other samples (MISS 82127, PI-649040 SH, PI-649040 FG, PI-597603) decreased at higher doses (200 mg kg−1 d−1). The active Echinacea samples, as they are complex mixtures, may contain chemical constituents that do not stimulate myeloid progenitors, and at higher doses, may inhibit myeloid progenitor stimulation by other active chemical constituents. Consequently, it is crucial to identify and isolate the specific chemical constituent classes responsible for the myeloid progenitor-stimulating activity, which will contribute to the development of consistent and standardized Echinacea formulations for use in various therapeutic applications and further enhance our understanding of the mechanisms underlying its effects on myeloid progenitor cells.
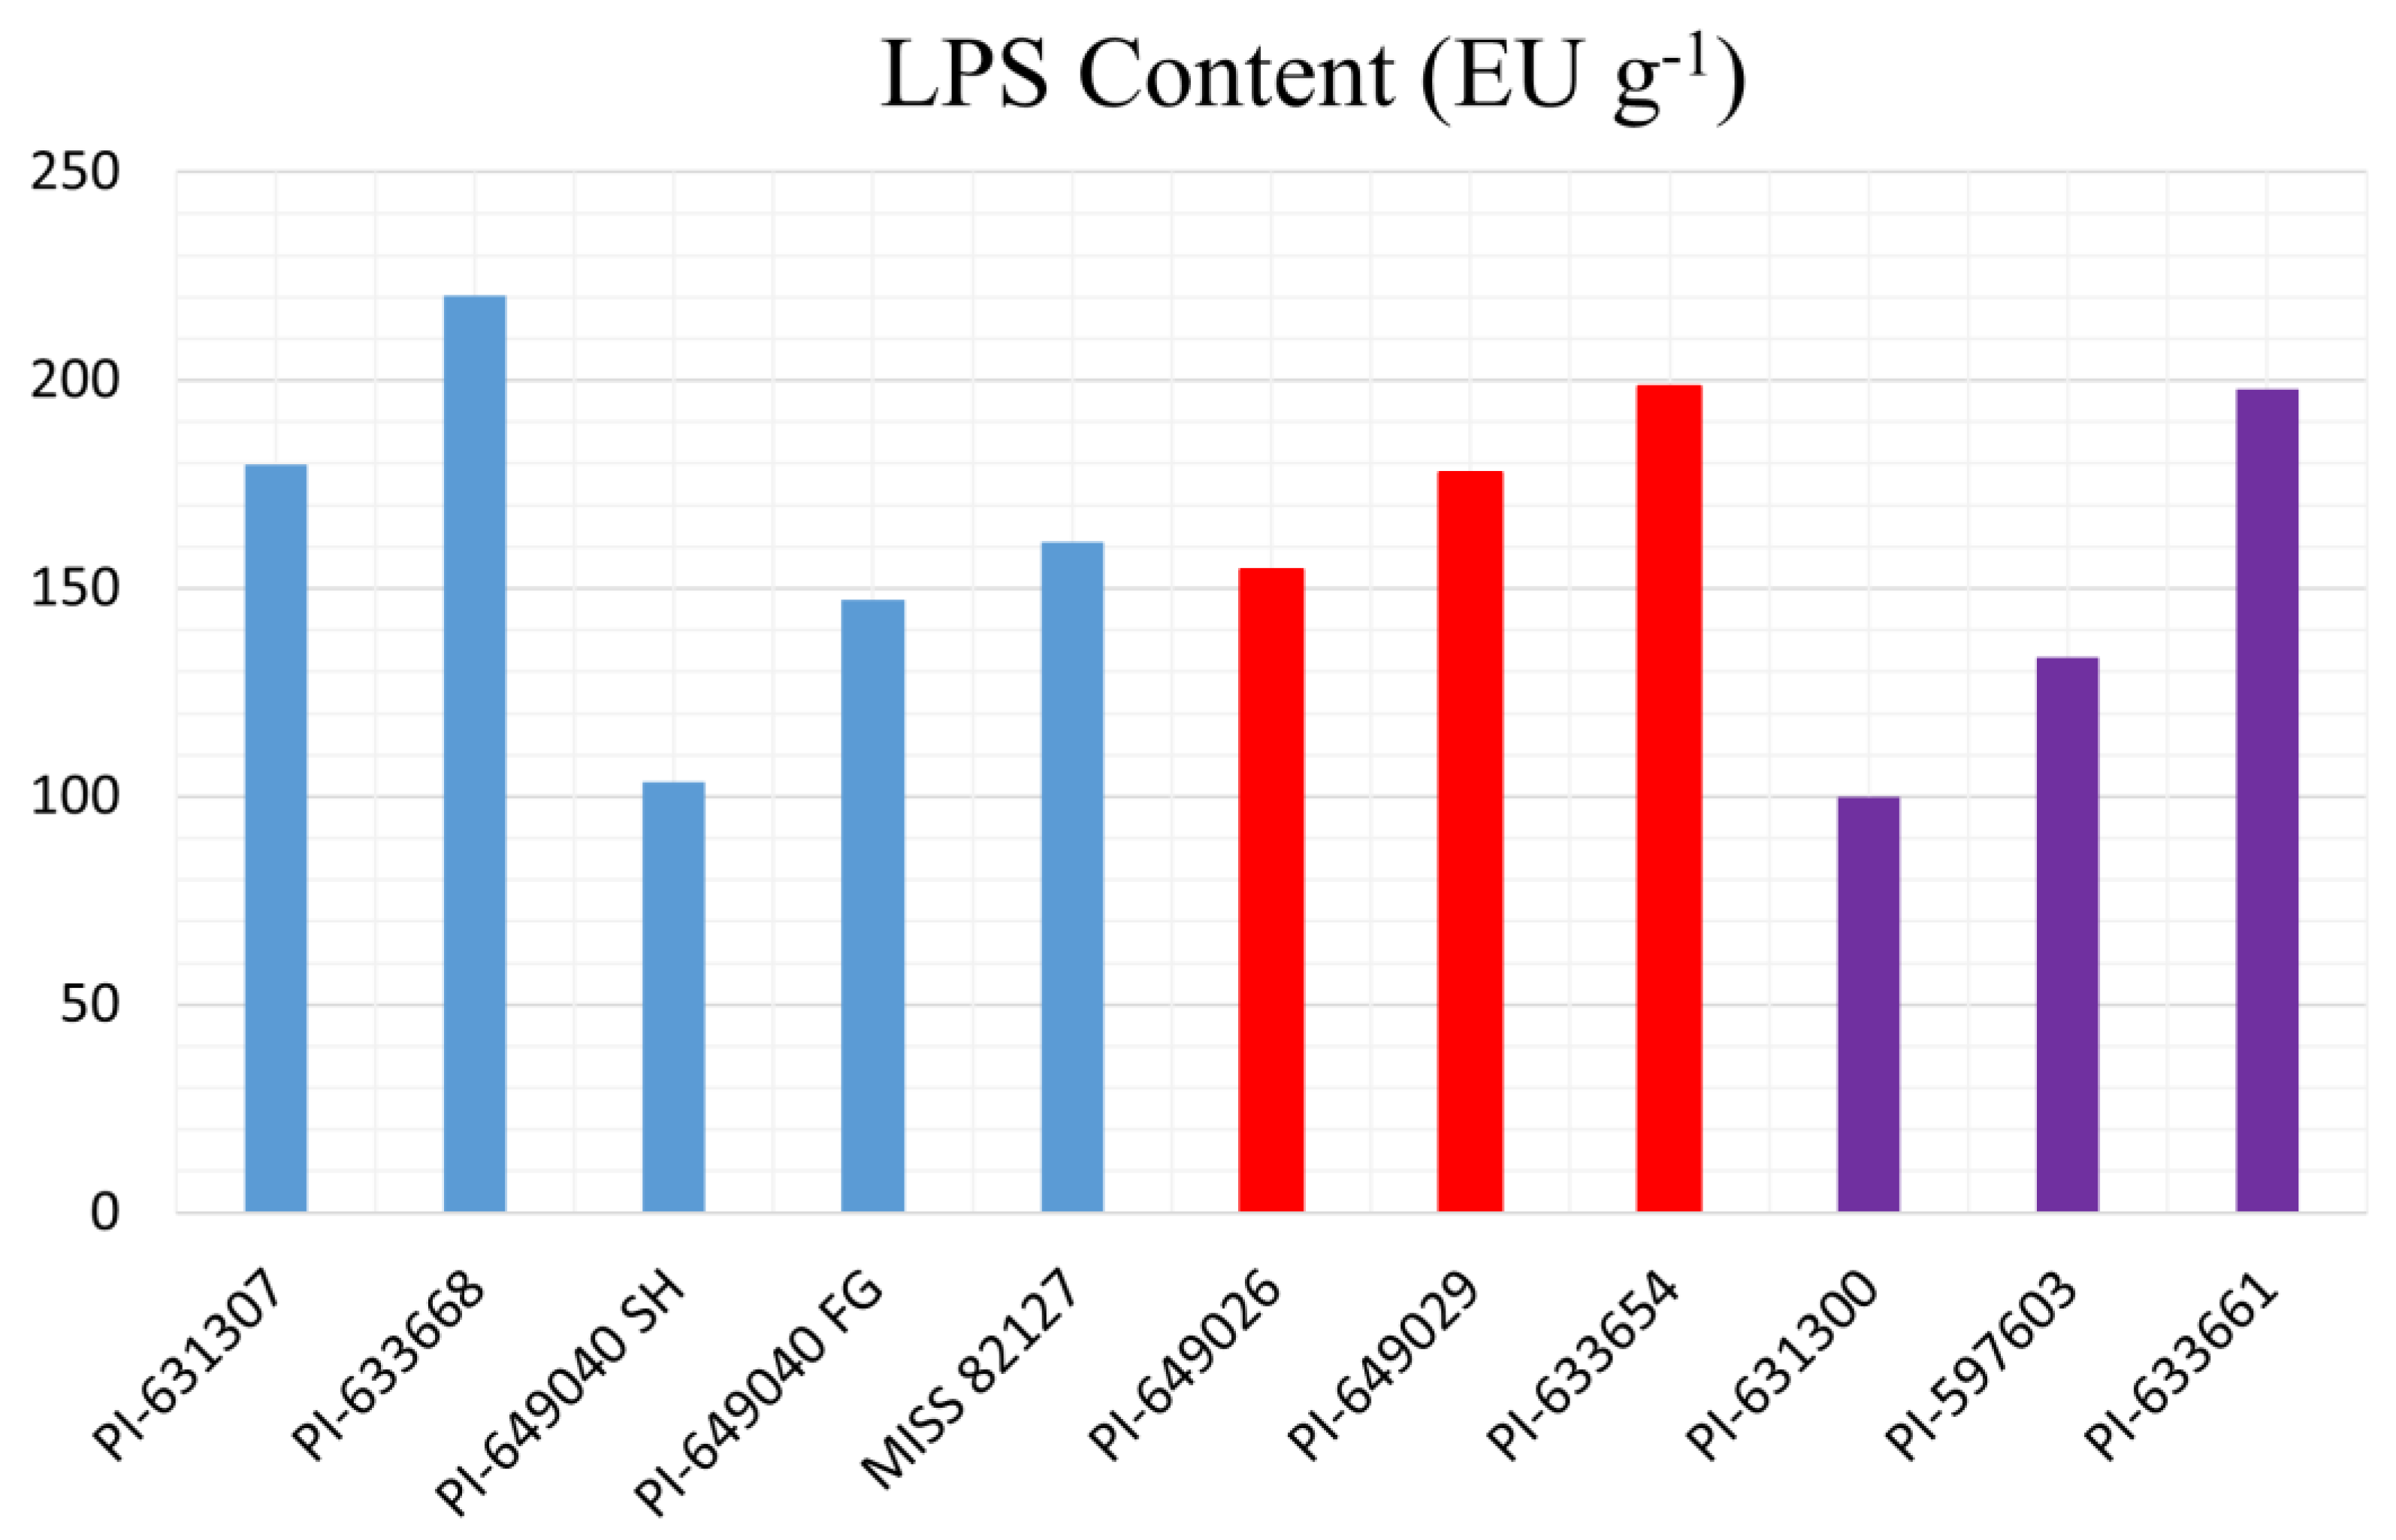
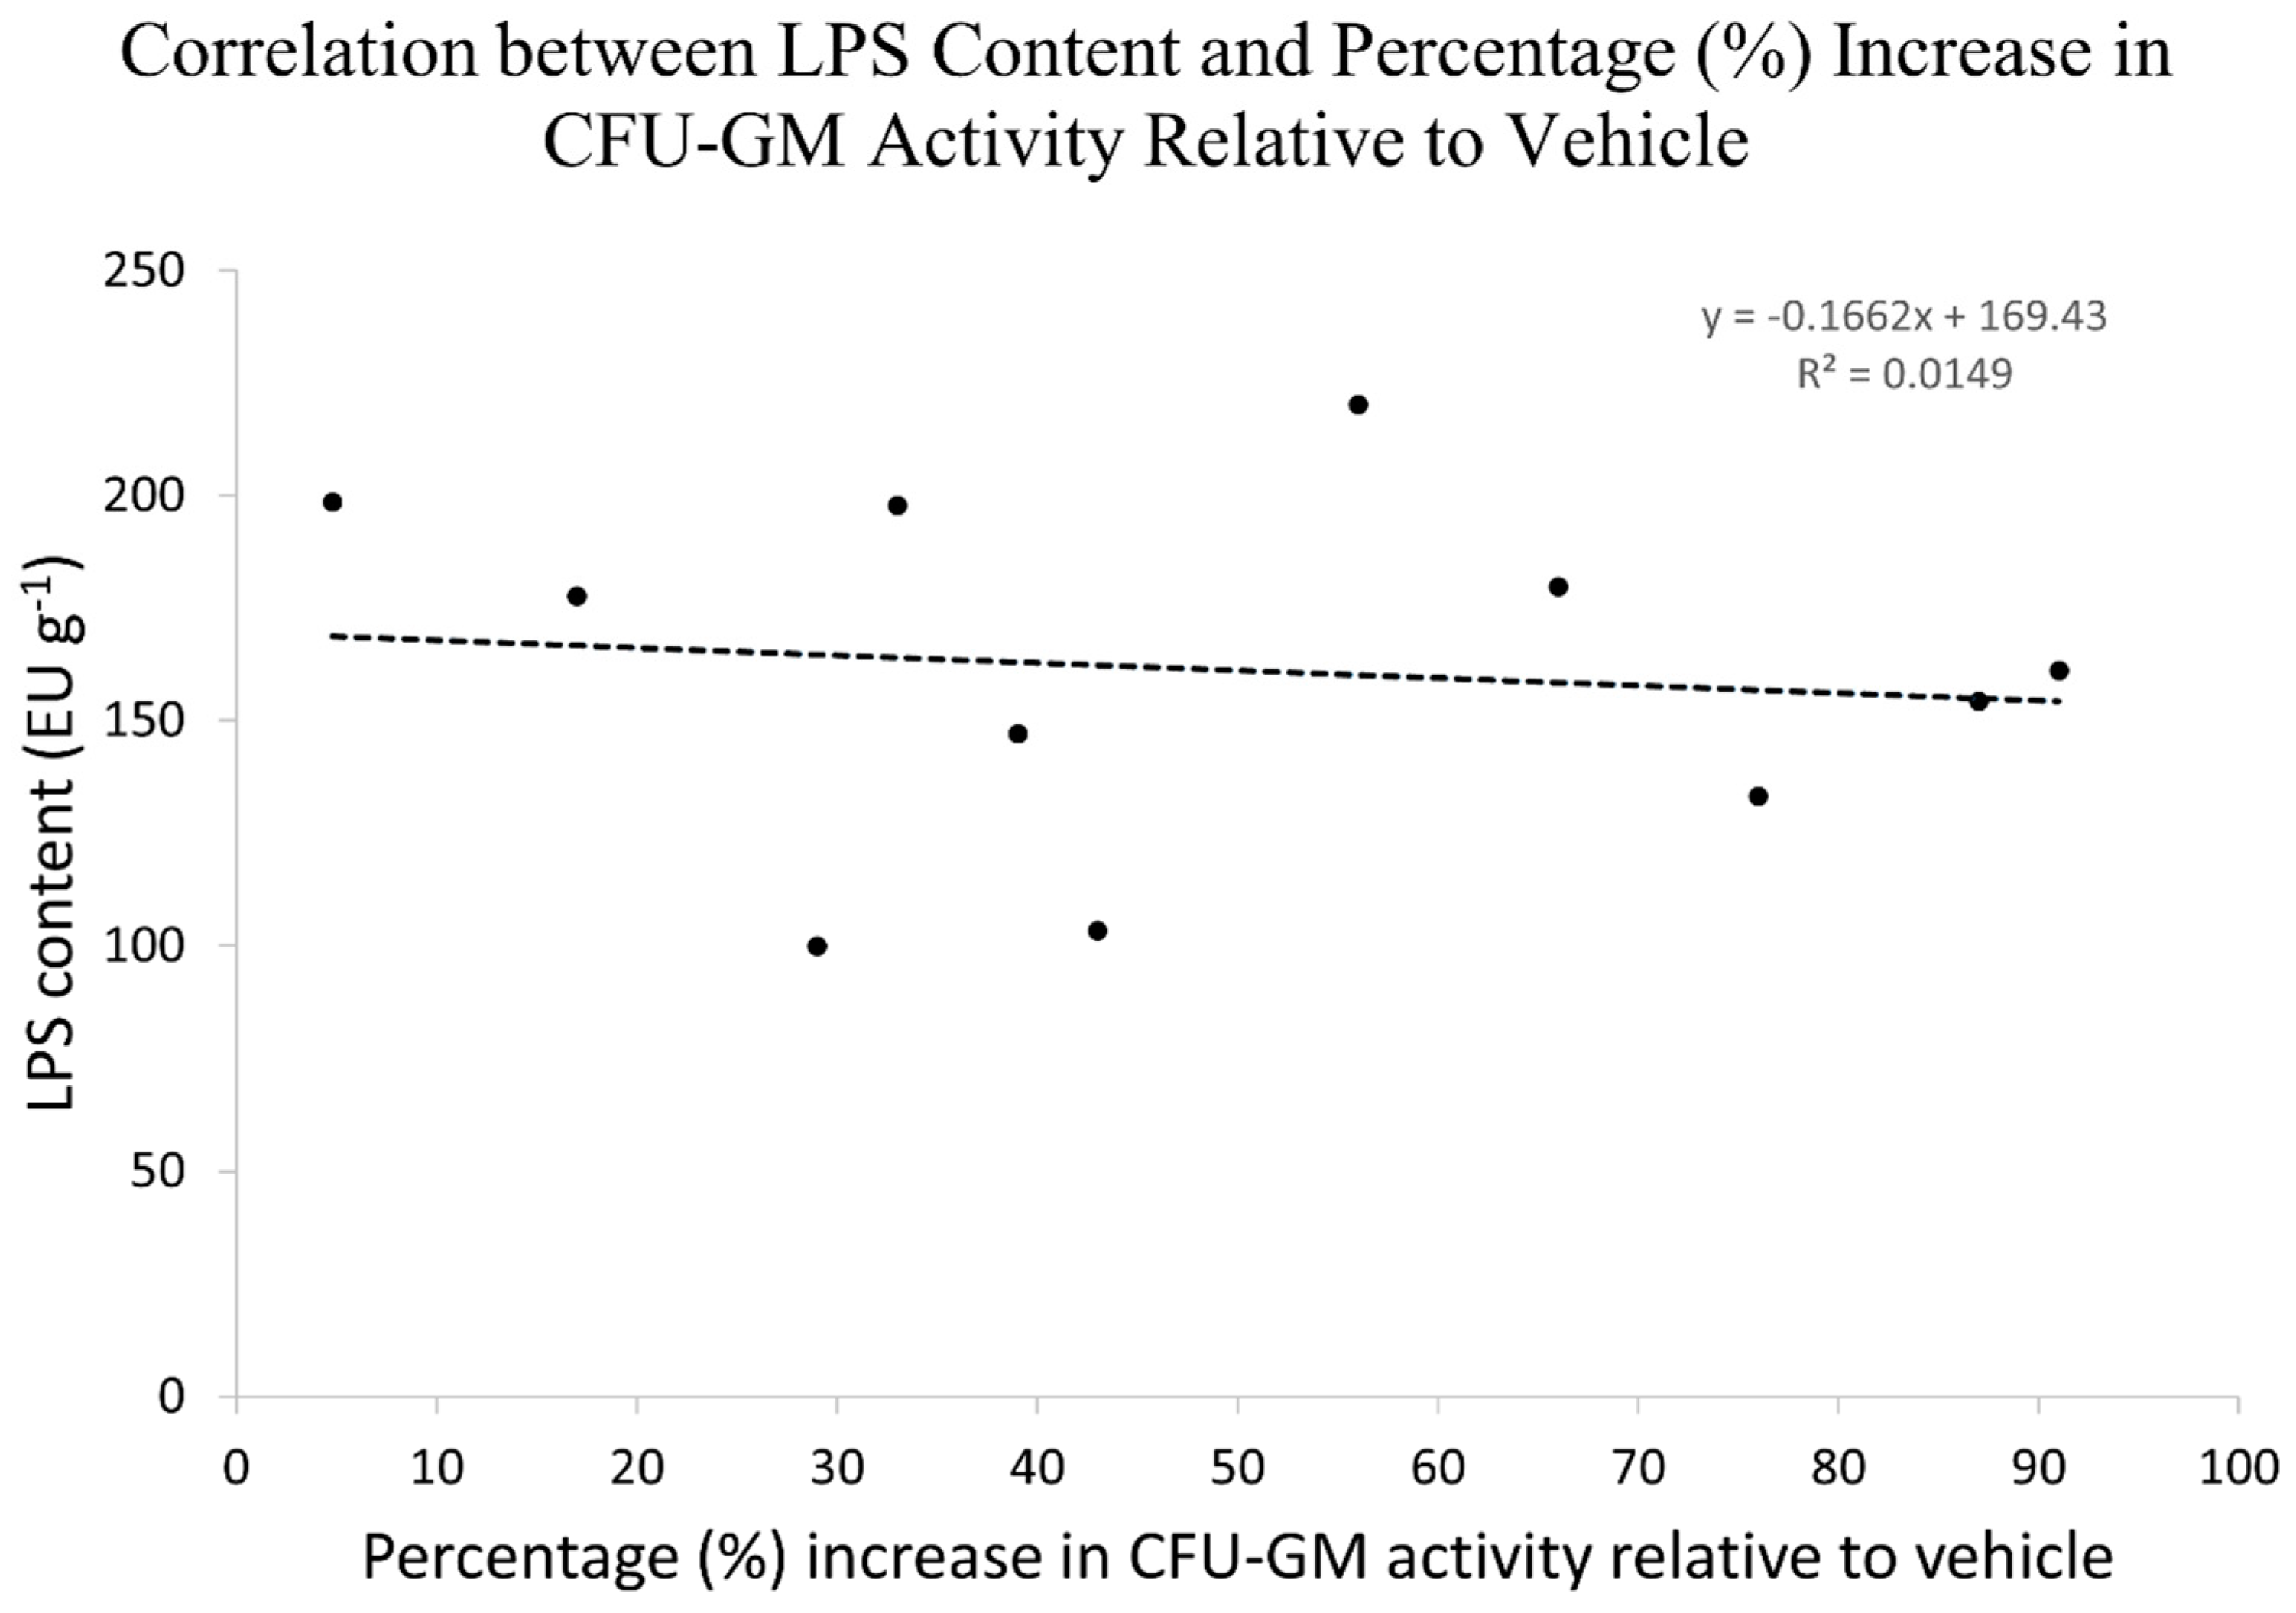
Several studies claimed to have shown that the majority of pharmacological activity exhibited by plant materials is not attributable to plants’ chemical constituents but is rather due to the bacteria and bacterial constituents (lipopolysaccharides) within plants [42,43,44]. A lipopolysaccharide (LPS) assay was conducted to measure the content of the LPS in plant samples. Based on the LPS assay results, the amount of LPS present in Echinacea species was too low (range 99–221 EUs g−1) to stimulate myelopoiesis. Moreover, there was no correlation between LPS content and percent activity exhibited by Echinacea samples (Figure 5), indicating that bacterial constituents were not responsible for the stimulation of myelopoiesis by Echinacea.
We applied an 1H-NMR-based chemometric approach to identify the chemical constituent classes correlated with the observed stimulation of myelopoiesis activity by Echinacea. The 
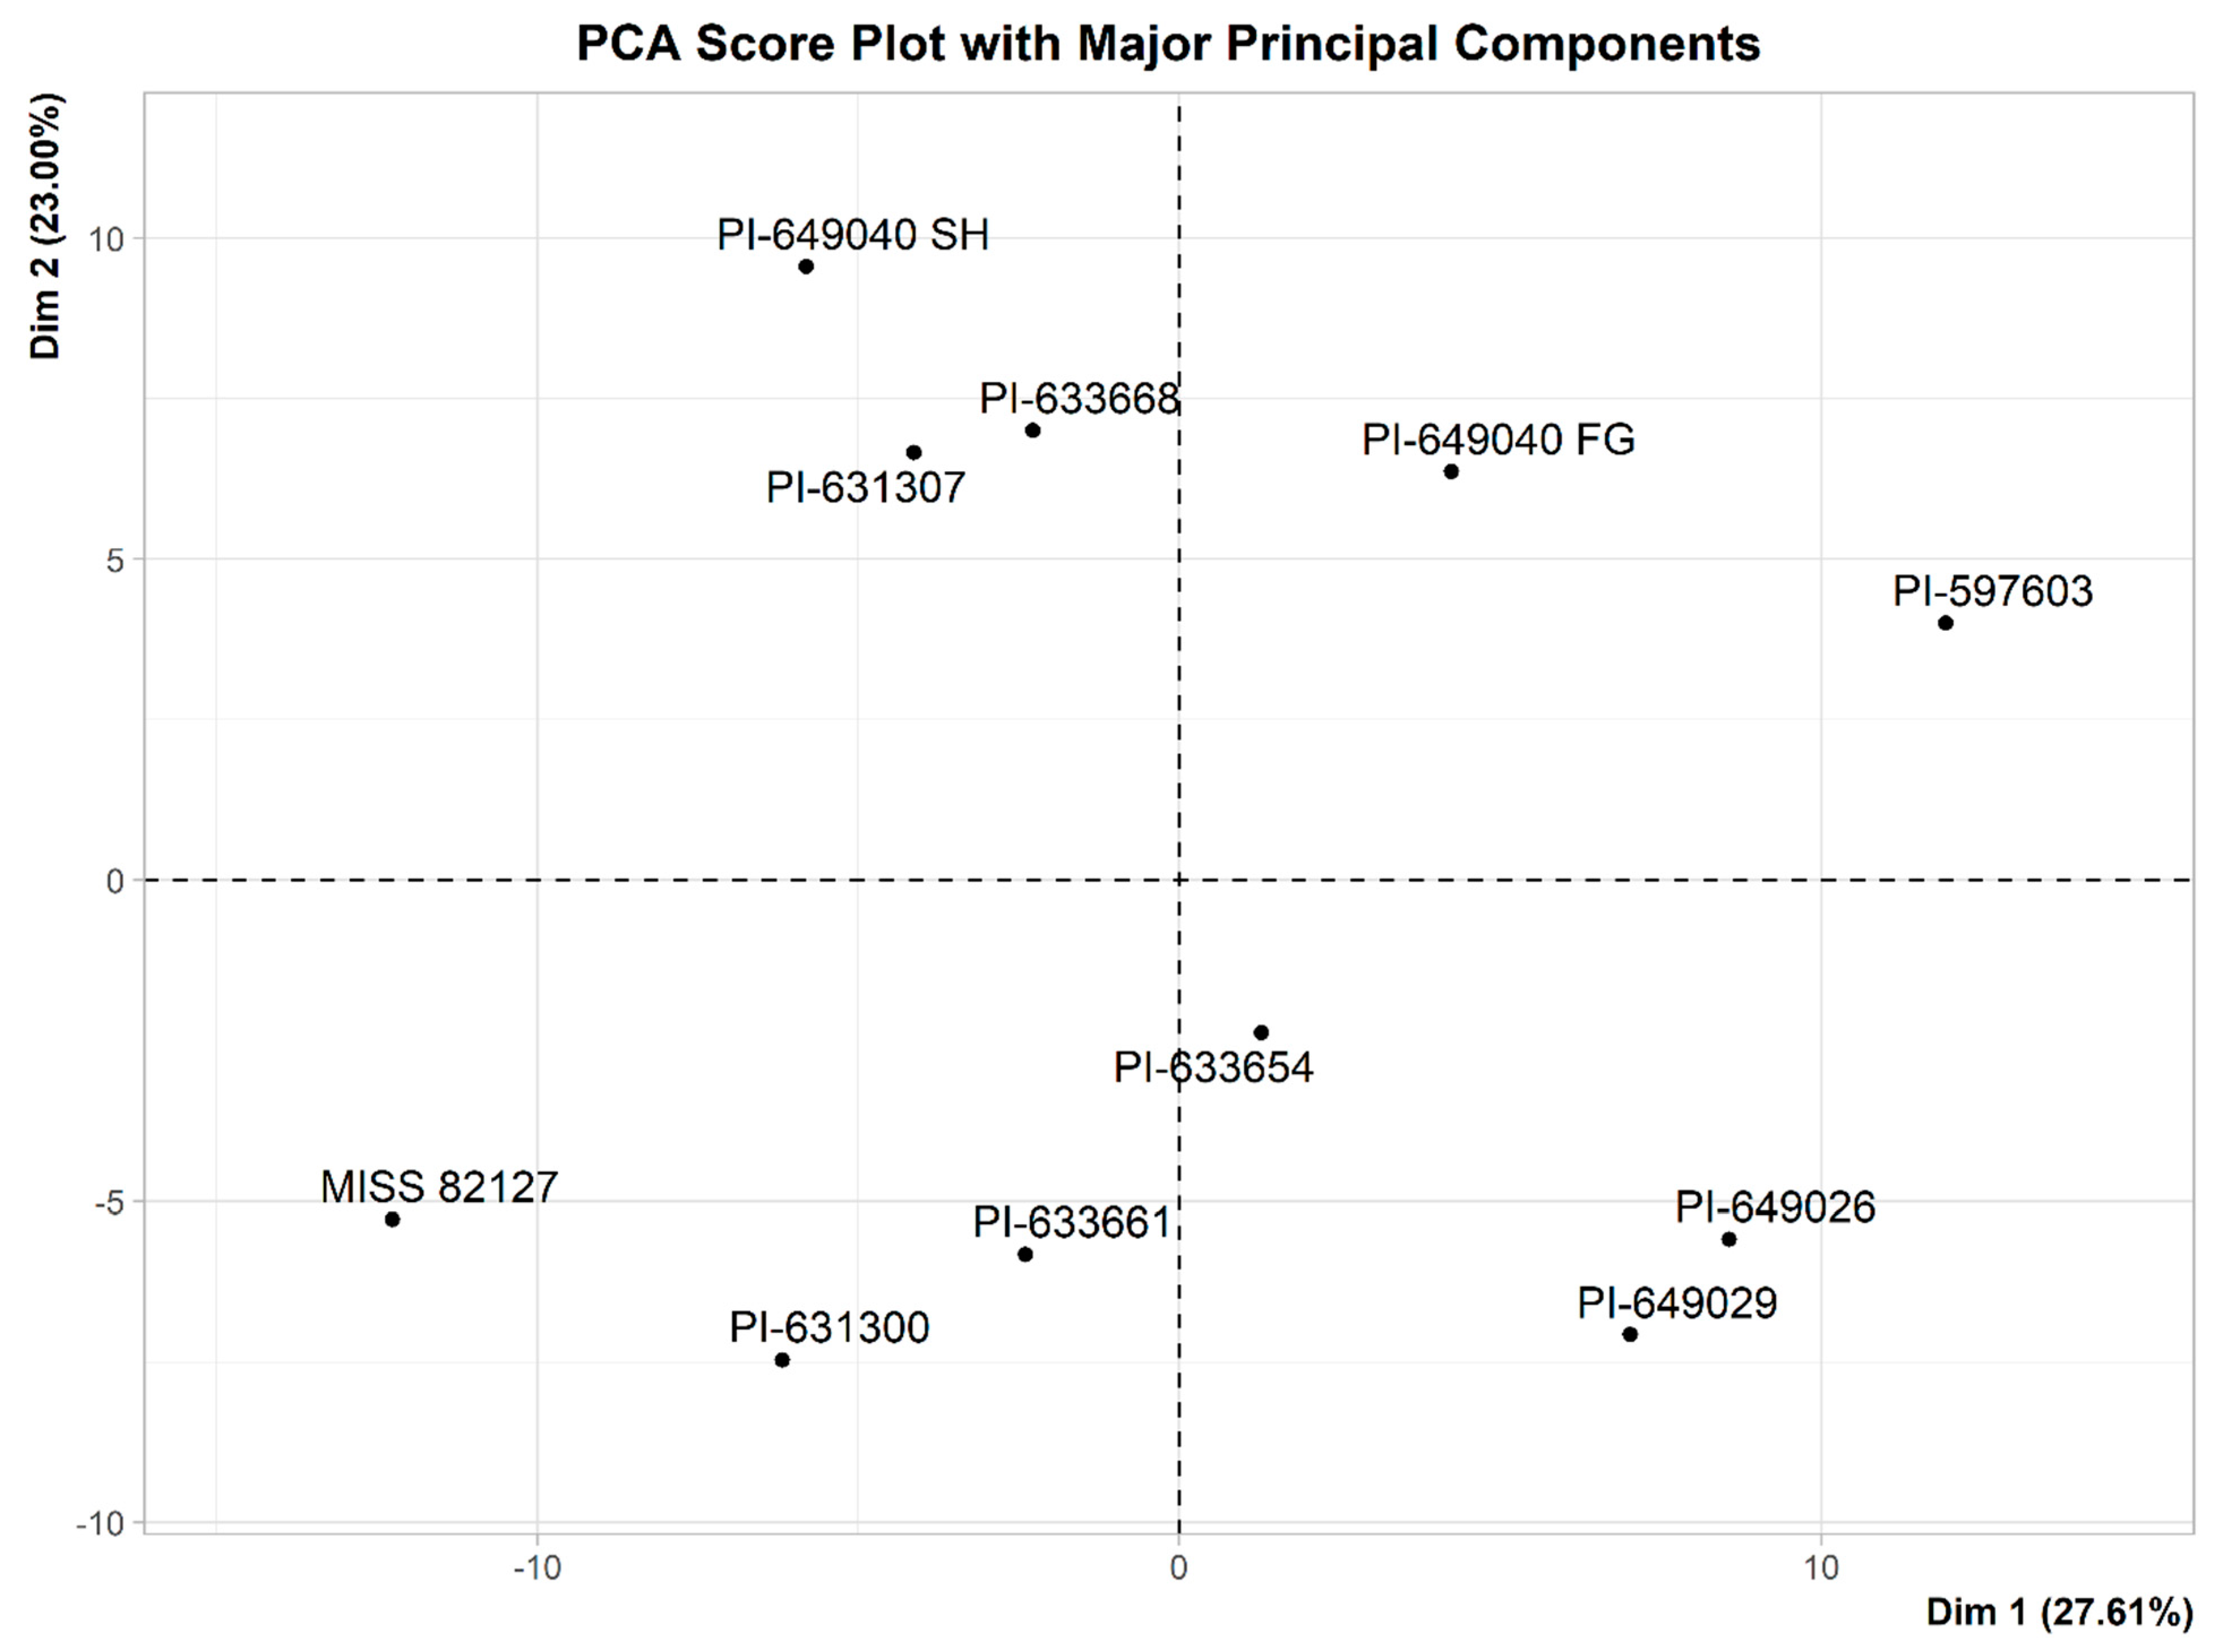
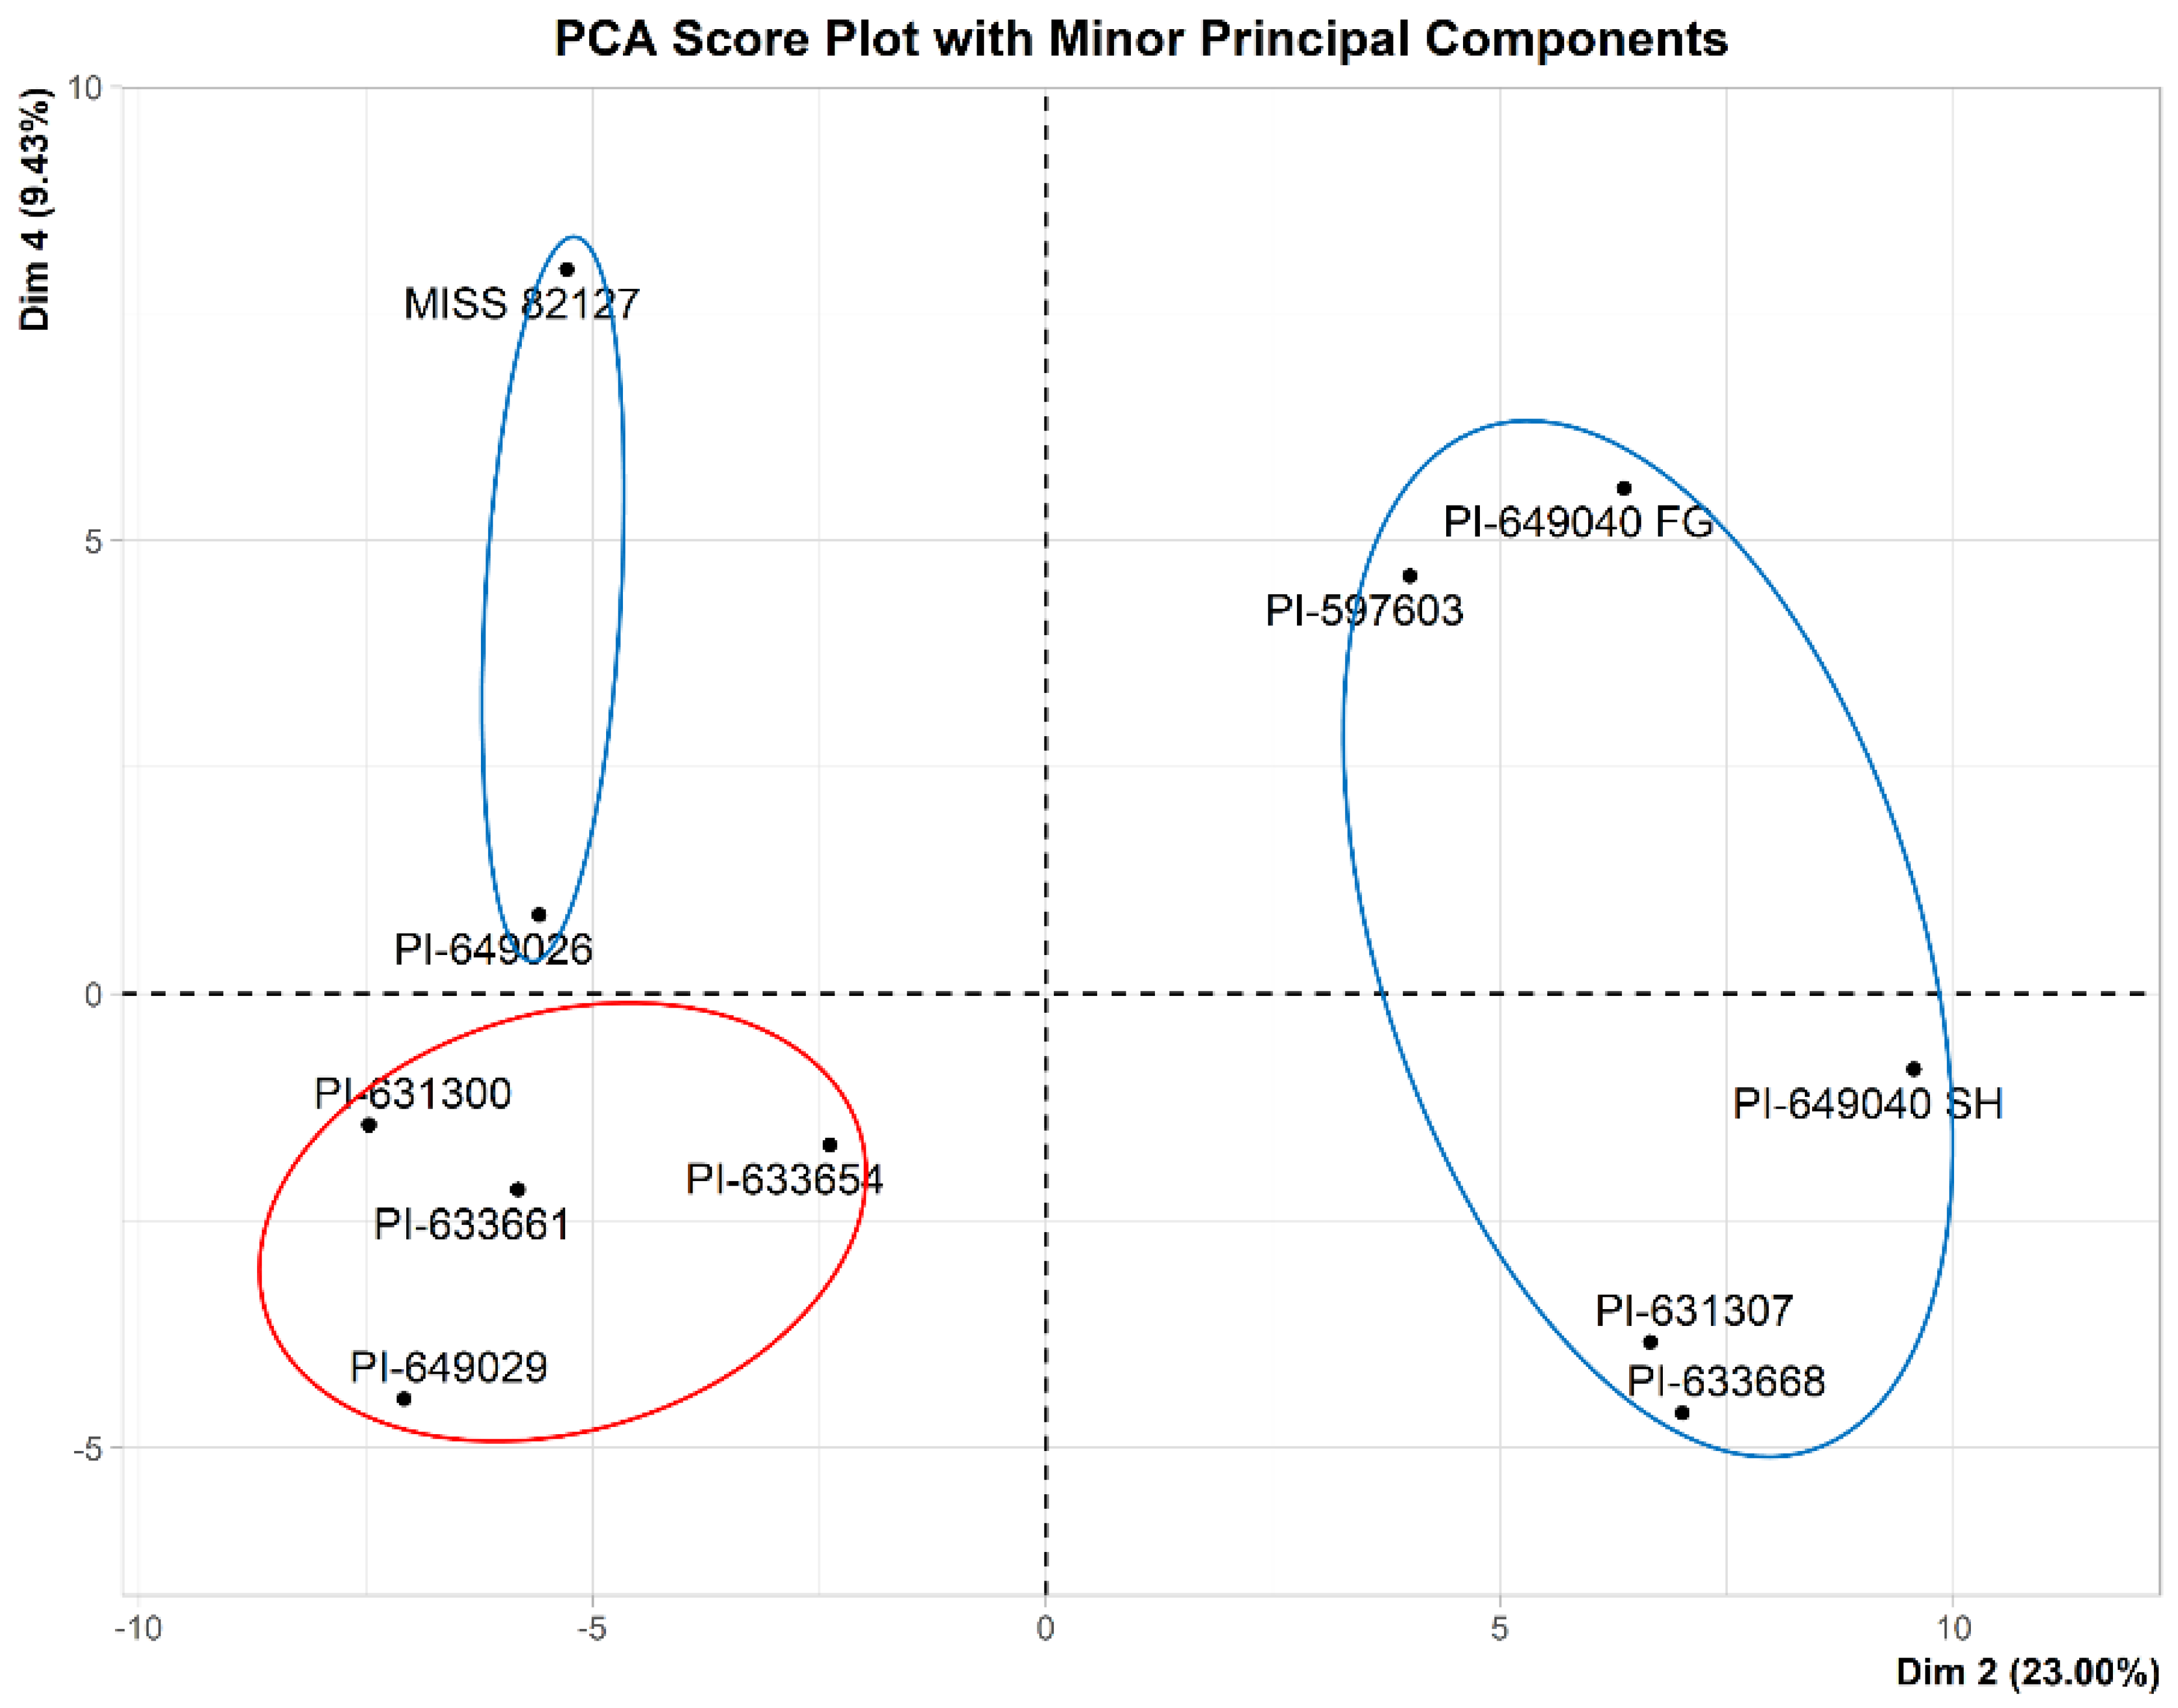
1H-NMR data of eleven samples were reduced to bin sizes of 0.04 ppm, resulting in 194 bins (excluding zeros). Using these 194 variables, a preliminary Principal Component Analysis (PCA) was performed to identify groups, trends, and outliers among the samples. A PCA score plot (Figure 7) showed that there were no outliers among the eleven samples, and there was no grouping of the samples based on two major principal components (Dim 1 and Dim 2). Further evaluation of other principal components indicated the grouping of the samples based on activity with Dim 2 and Dim 4 (Figure 8). PCA is an unsupervised approach, and its application only reveals group structure with major principal components when the within-group variation is sufficiently smaller than the between-group variation. Based on the score plots (Figure 7 and Figure 8), it is evident that the separation of inactive samples from active samples occurs primarily with the minor principal components (Dim 2 and Dim 4), which only account for 32.43% of the total variance. It is likely that this is due to the presence of variables in the data that do not separate samples based on activity. Thus, we used a supervised method, Orthogonal Partial Least Squares Discriminant Analysis (OPLS-DA), to identify variables responsible for the separation of samples based on activity.
Due to the high variability of the methylcellulose-based colony-forming unit assay and based on PCA score plots (Figure 7 and Figure 8), PLS regression [45] for activity using a continuous metric of percentage increase over control for the stimulation of myelopoiesis as the Y variable was determined not to be useful. Therefore, discriminant analysis (DA) was applied with either the presence or absence of activity in the CFU-GM assay as the Y variable. We used OPLS-DA modeling since OPLS-DA provides a better interpretation of the model, although it provides similar predictions to PLS-DA [28]. Additionally, OPLS-DA loadings and regression coefficients allow for a more realistic interpretation than PLS-DA since the systematic variation of predictors uncorrelated with the response variable is partitioned in a preprocessing step [46].
After a supervised model is developed, it is validated with R2Y and Q2 statistics. Regression models are considered to have excellent predictability as Q2 values approach 1 [47]. However, using R2Y and Q2 statistics as validation metrics for discriminant analysis is questionable since Q2 statistics are developed for regression models, not categorical models [48,49]. Moreover, it has been established that the Number of Misclassifications (NMCs) and area under the ROC curve (AUC) perform better than Q2 statistics in determining model validity for discriminant analysis [48,50,51].
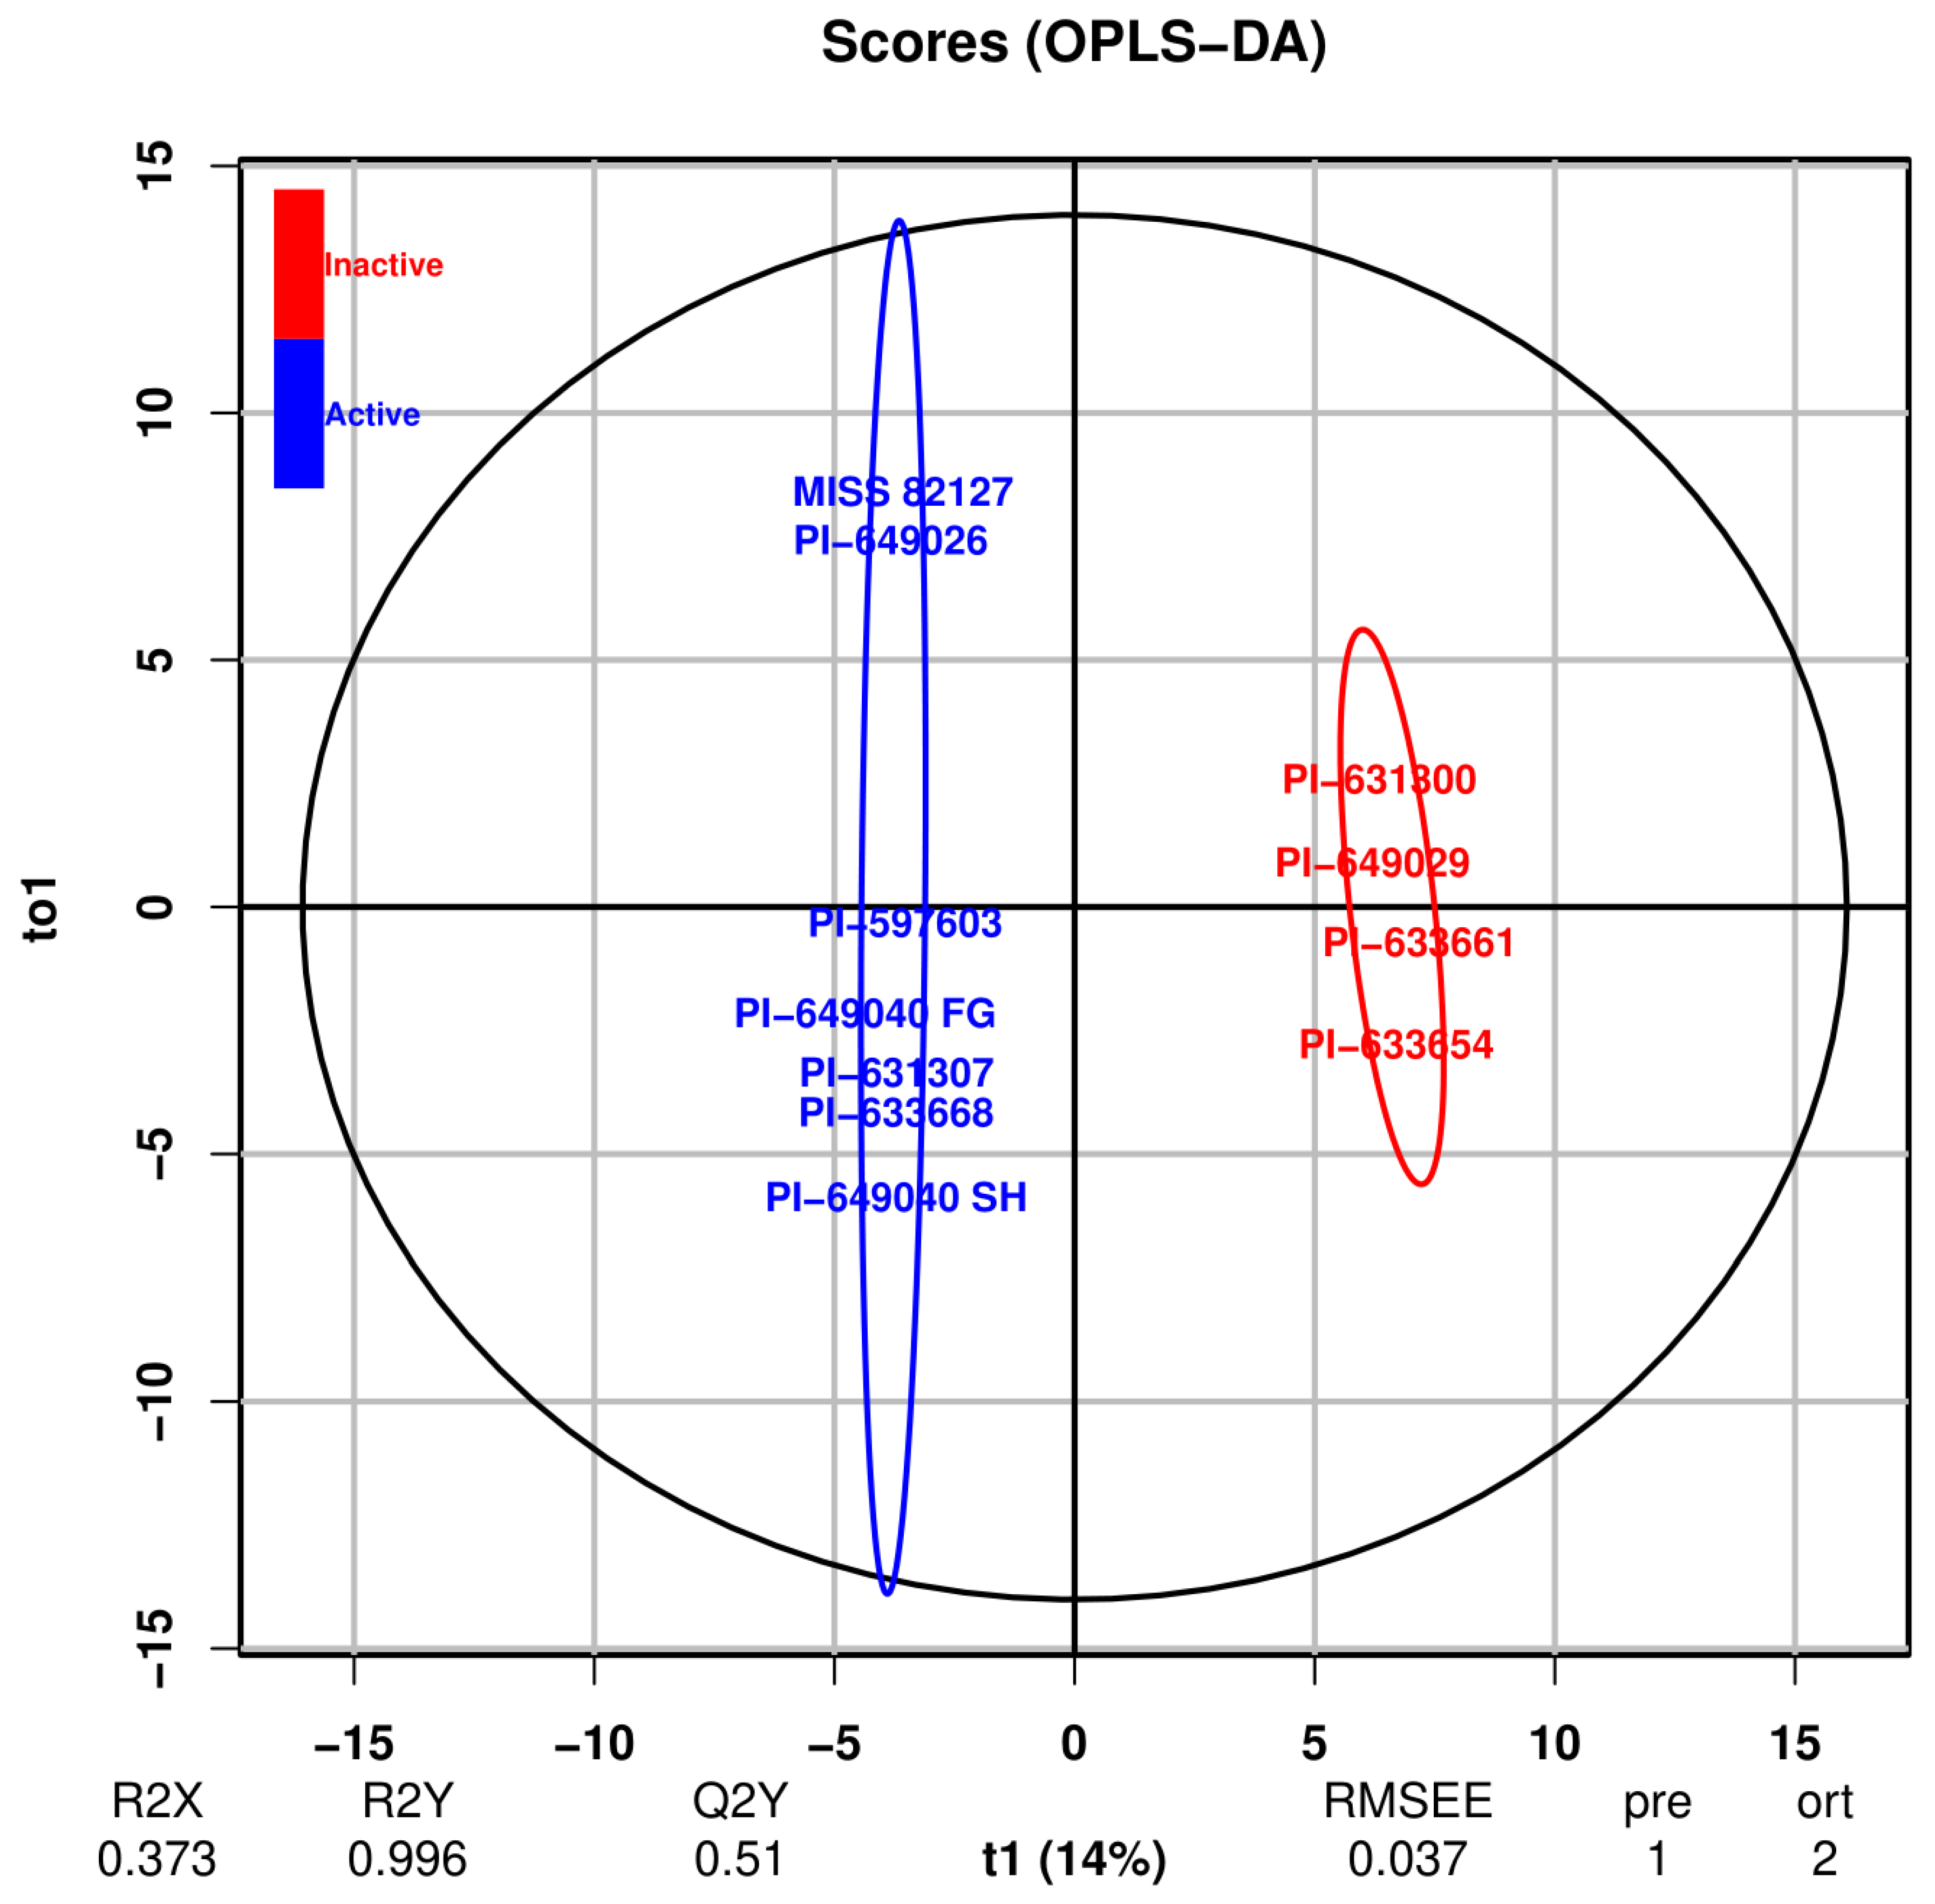
An OPLS-DA model, with the presence or absence of activity as the Y variable, was developed, and internal validation was performed using the NMCs and AUC. As shown in Figure 9, the OPLS-DA score plot (Figure 9) was able to distinguish active from inactive samples along the first predictive component. Interestingly, among active samples, MISS 82187 and PI-649026 are separated from other active samples along the first orthogonal component similar to the PCA score plot with minor principal components (Figure 8). Based on the confusion matrix (Table 4), the model is able to differentiate between active and inactive samples with an error rate of zero. The p-value from Fisher’s exact test [52] for the confusion matrix is 0.00303, indicating that the association between original and predicted groups is statistically significant. The AUC plot (
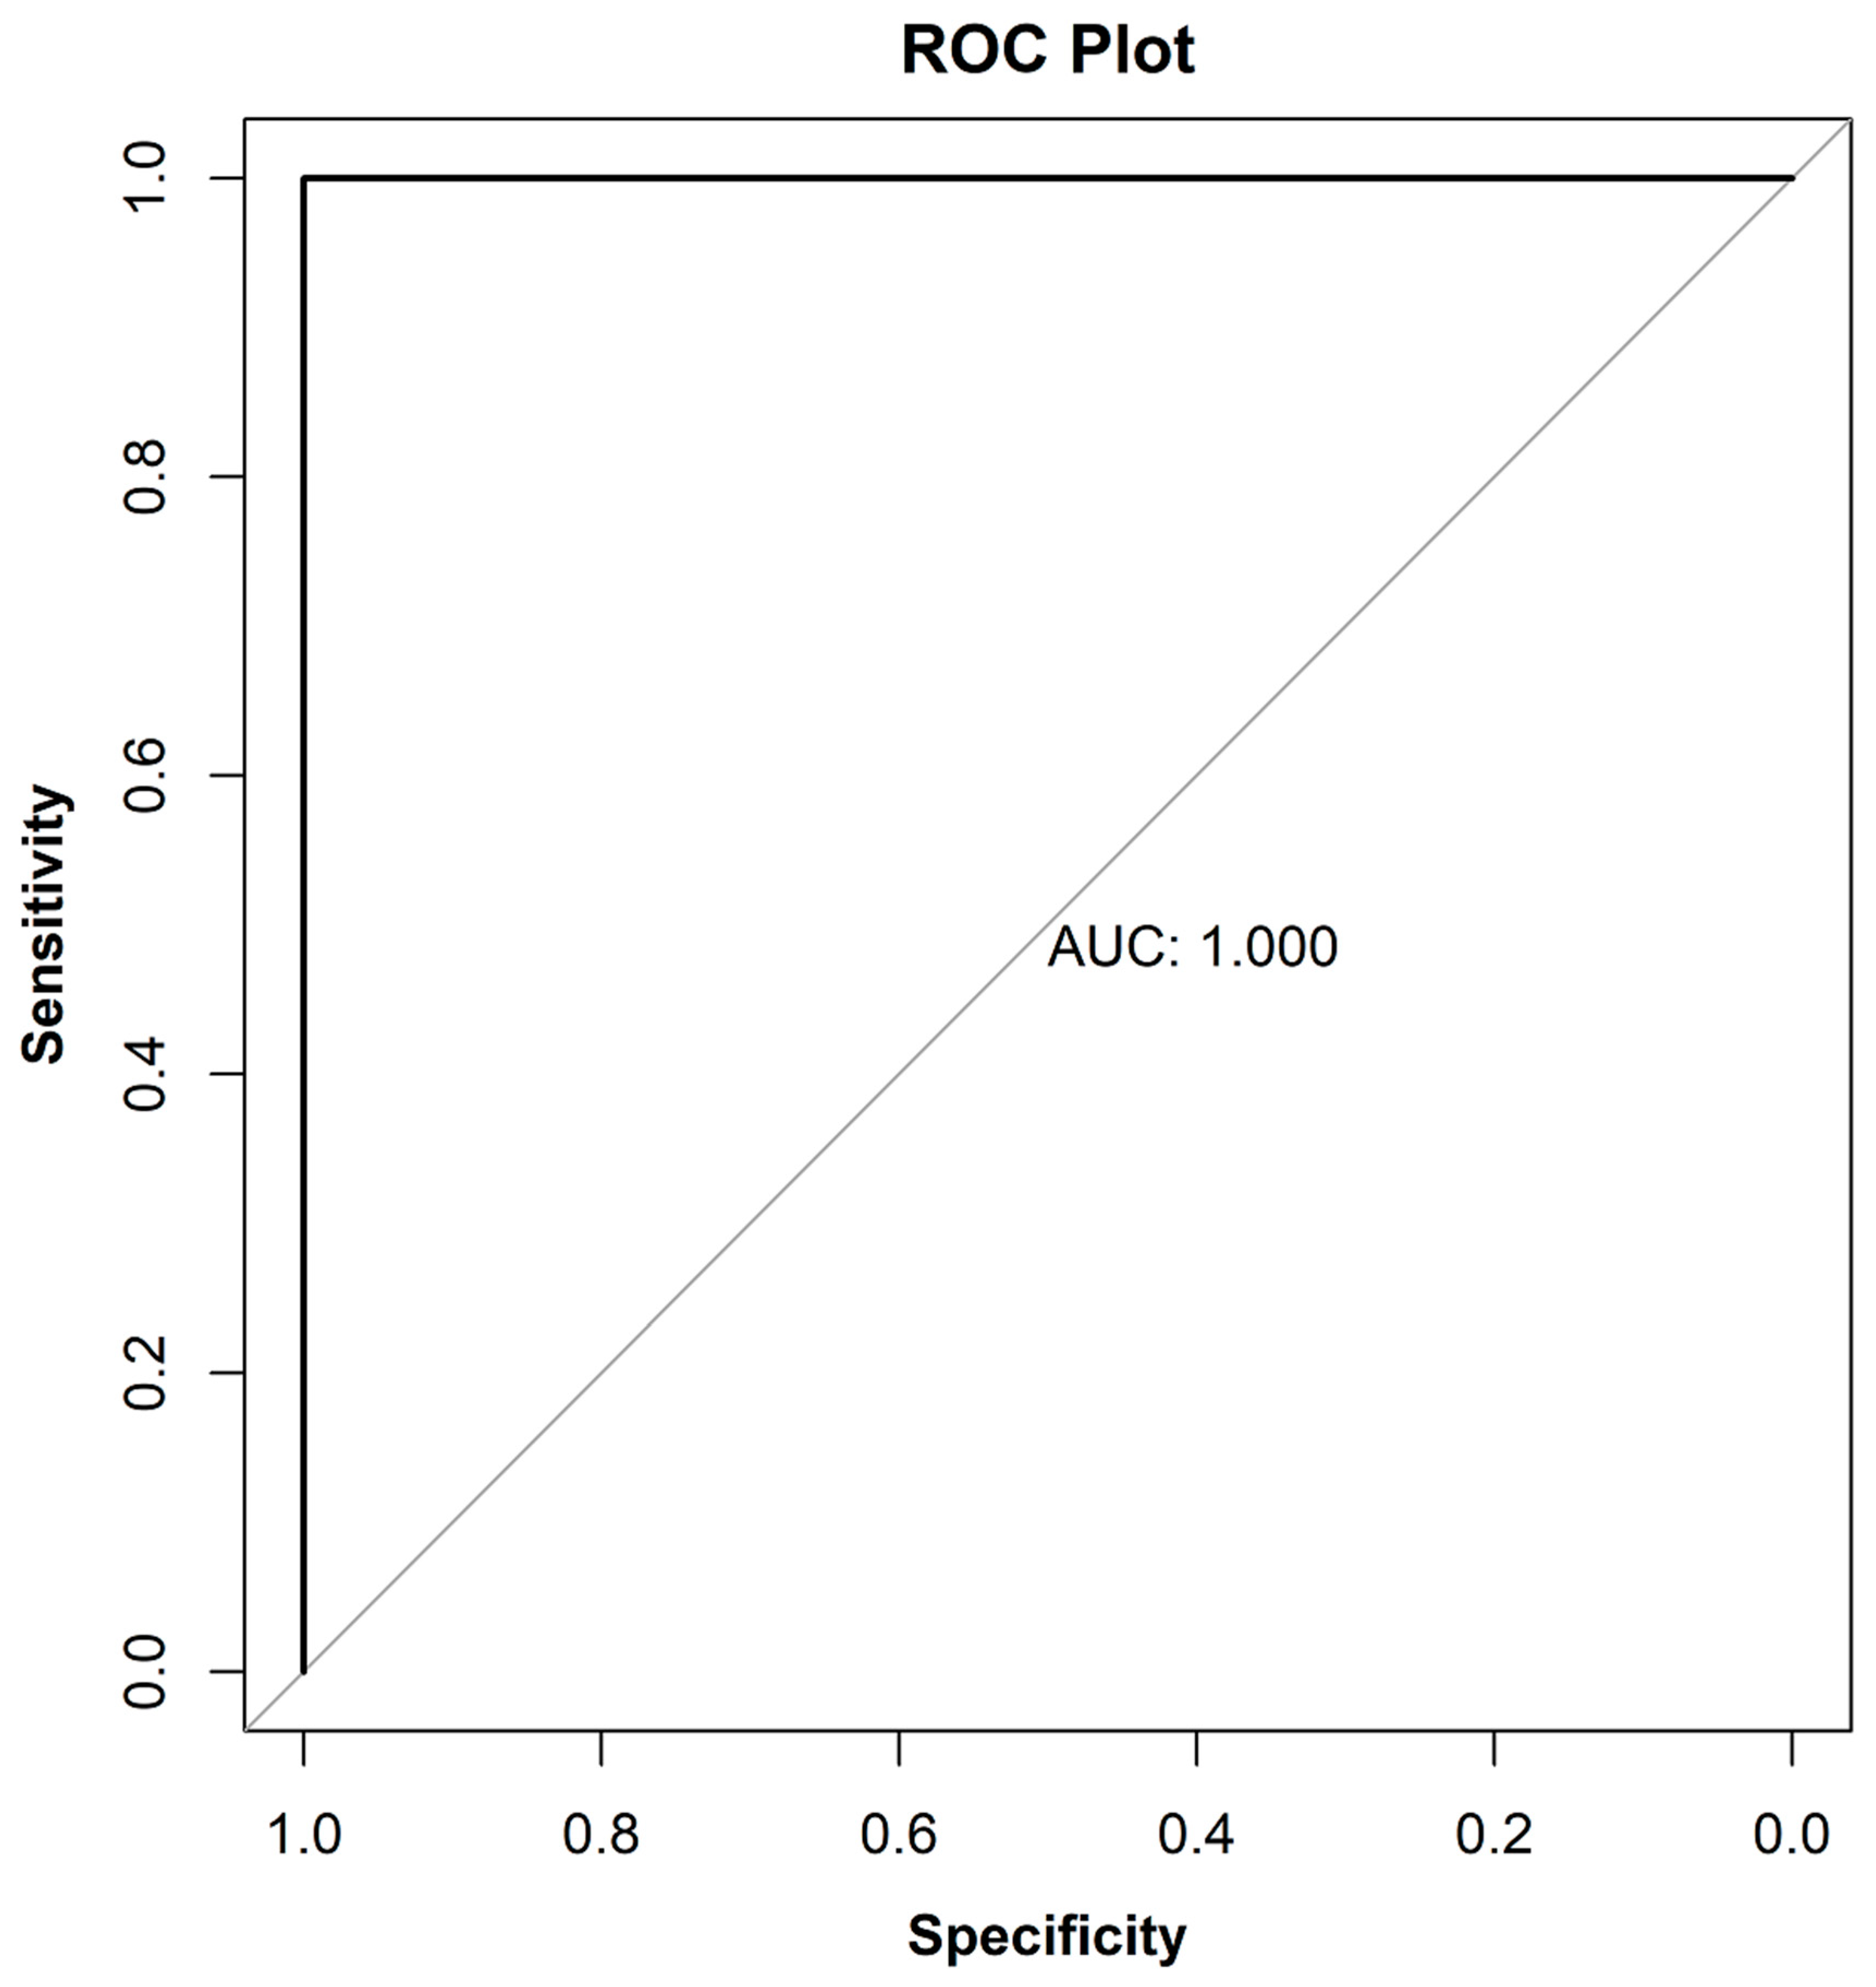
Figure 11) and AUC value (1.0) indicate perfect discrimination between active and inactive samples.
Variable Importance in Projection (VIP) is an important criterion for selecting variables with high significance in chemometrics. VIP is a combined measure of a variable’s contribution to the description of two sets of data: the dependent (Y) and the independent (X) variables. VIP is a weighted sum of squares of OPLS-DA weights that represent each variable’s influence on the model [53]. The weights in an OPLS-DA model reflect the covariance between the independent and dependent variables. When these weights are included, VIP values are able to reflect both the quality of the description of the dependent variable, as well as its significance for the independent variables in the model [
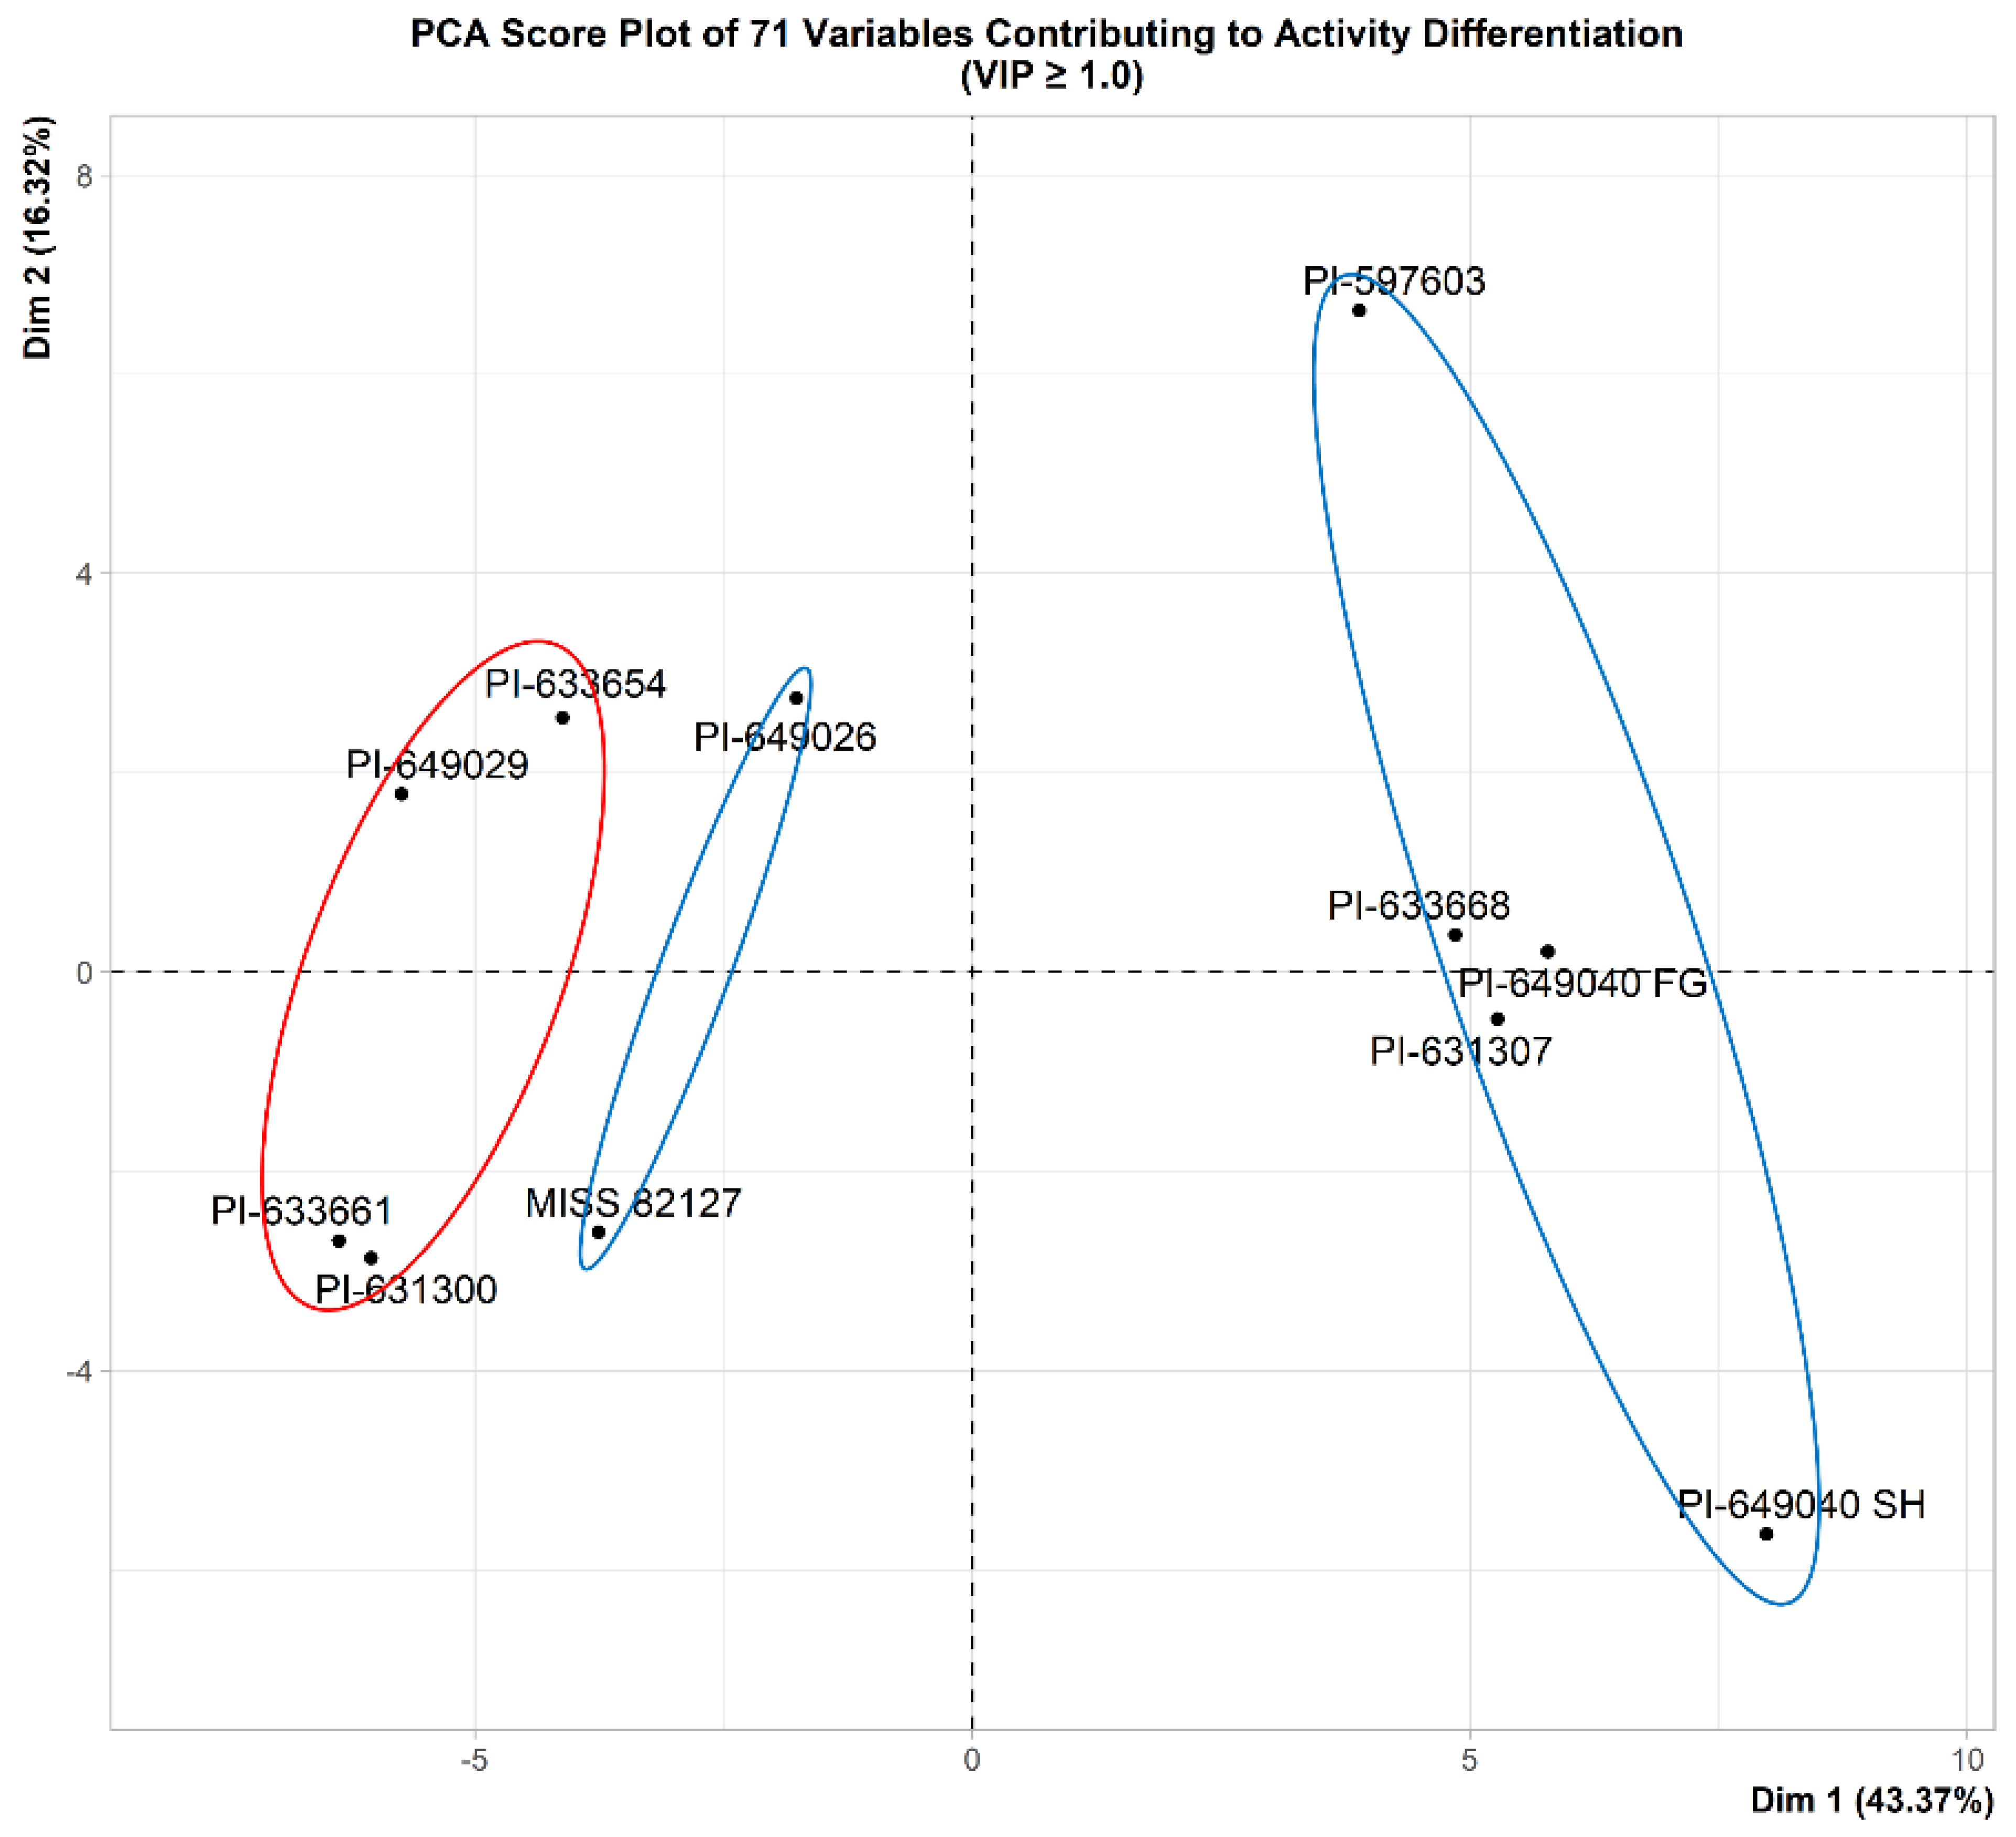
54]. VIP ≥ 1.0 is generally used as a factor to determine the importance of variables because the average sum of squares of VIP is equal to 1. We identified 71 variables with VIP ≥ 1.0 based on our OPLS-DA model.
When using OPLS-DA modeling, a sample size of 11 can be considered a limitation for identifying important variables. After selecting 71 variables with VIP ≥ 1.0, we used an unsupervised PCA with these variables to evaluate their effectiveness in distinguishing between active and inactive samples using major principal components. As depicted in Figure 12, the 71 selected variables distinctively separate active and inactive samples along the first principal component (Dim 1). This result aligns with findings from the OPLS-DA score plot (Figure 9). Uniquely, a novel aspect of our validation process was the comparison of the PCA score plot (Figure 12) with 71 variables to the PCA score plot with minor principal components (Figure 8), generated using all 194 variables. The similar grouping patterns observed validate the successful removal of variables that do not contribute to the segregation of samples based on their activity through the selection of variables with VIP ≥ 1.0. This innovative validation approach, therefore, substantiates the proficiency of the selected 71 variables in effectively discriminating between active and inactive samples.
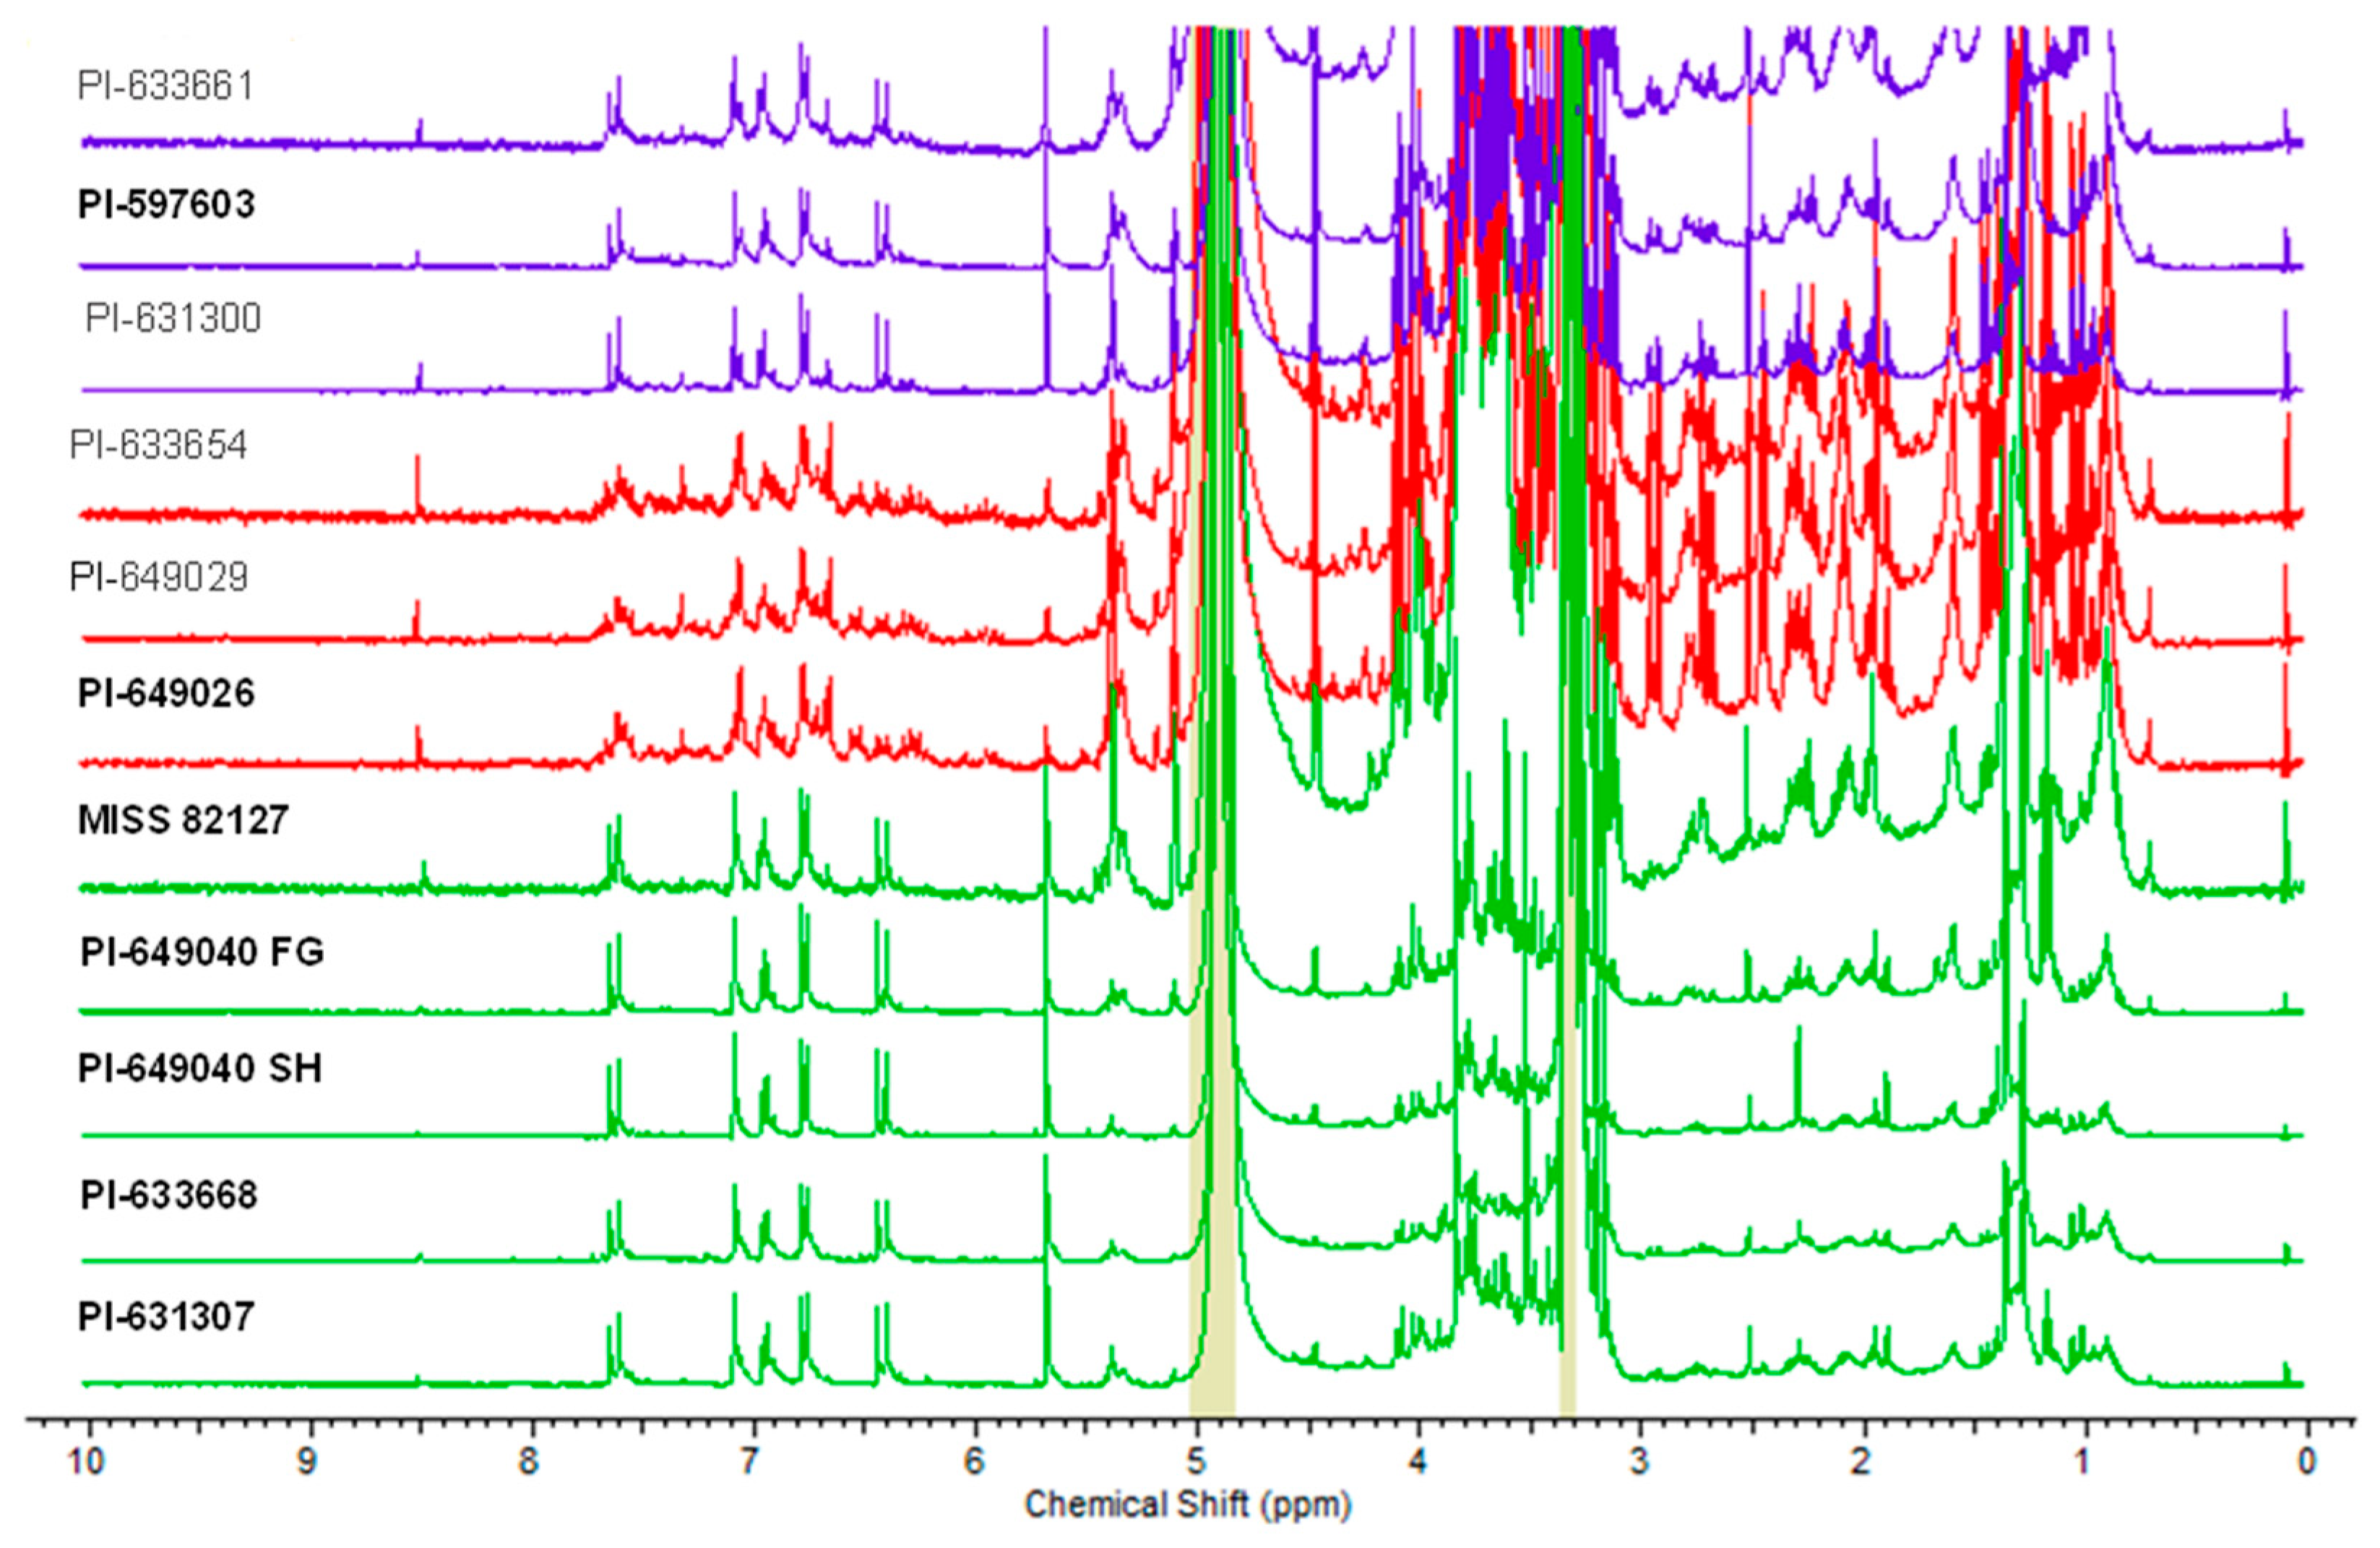
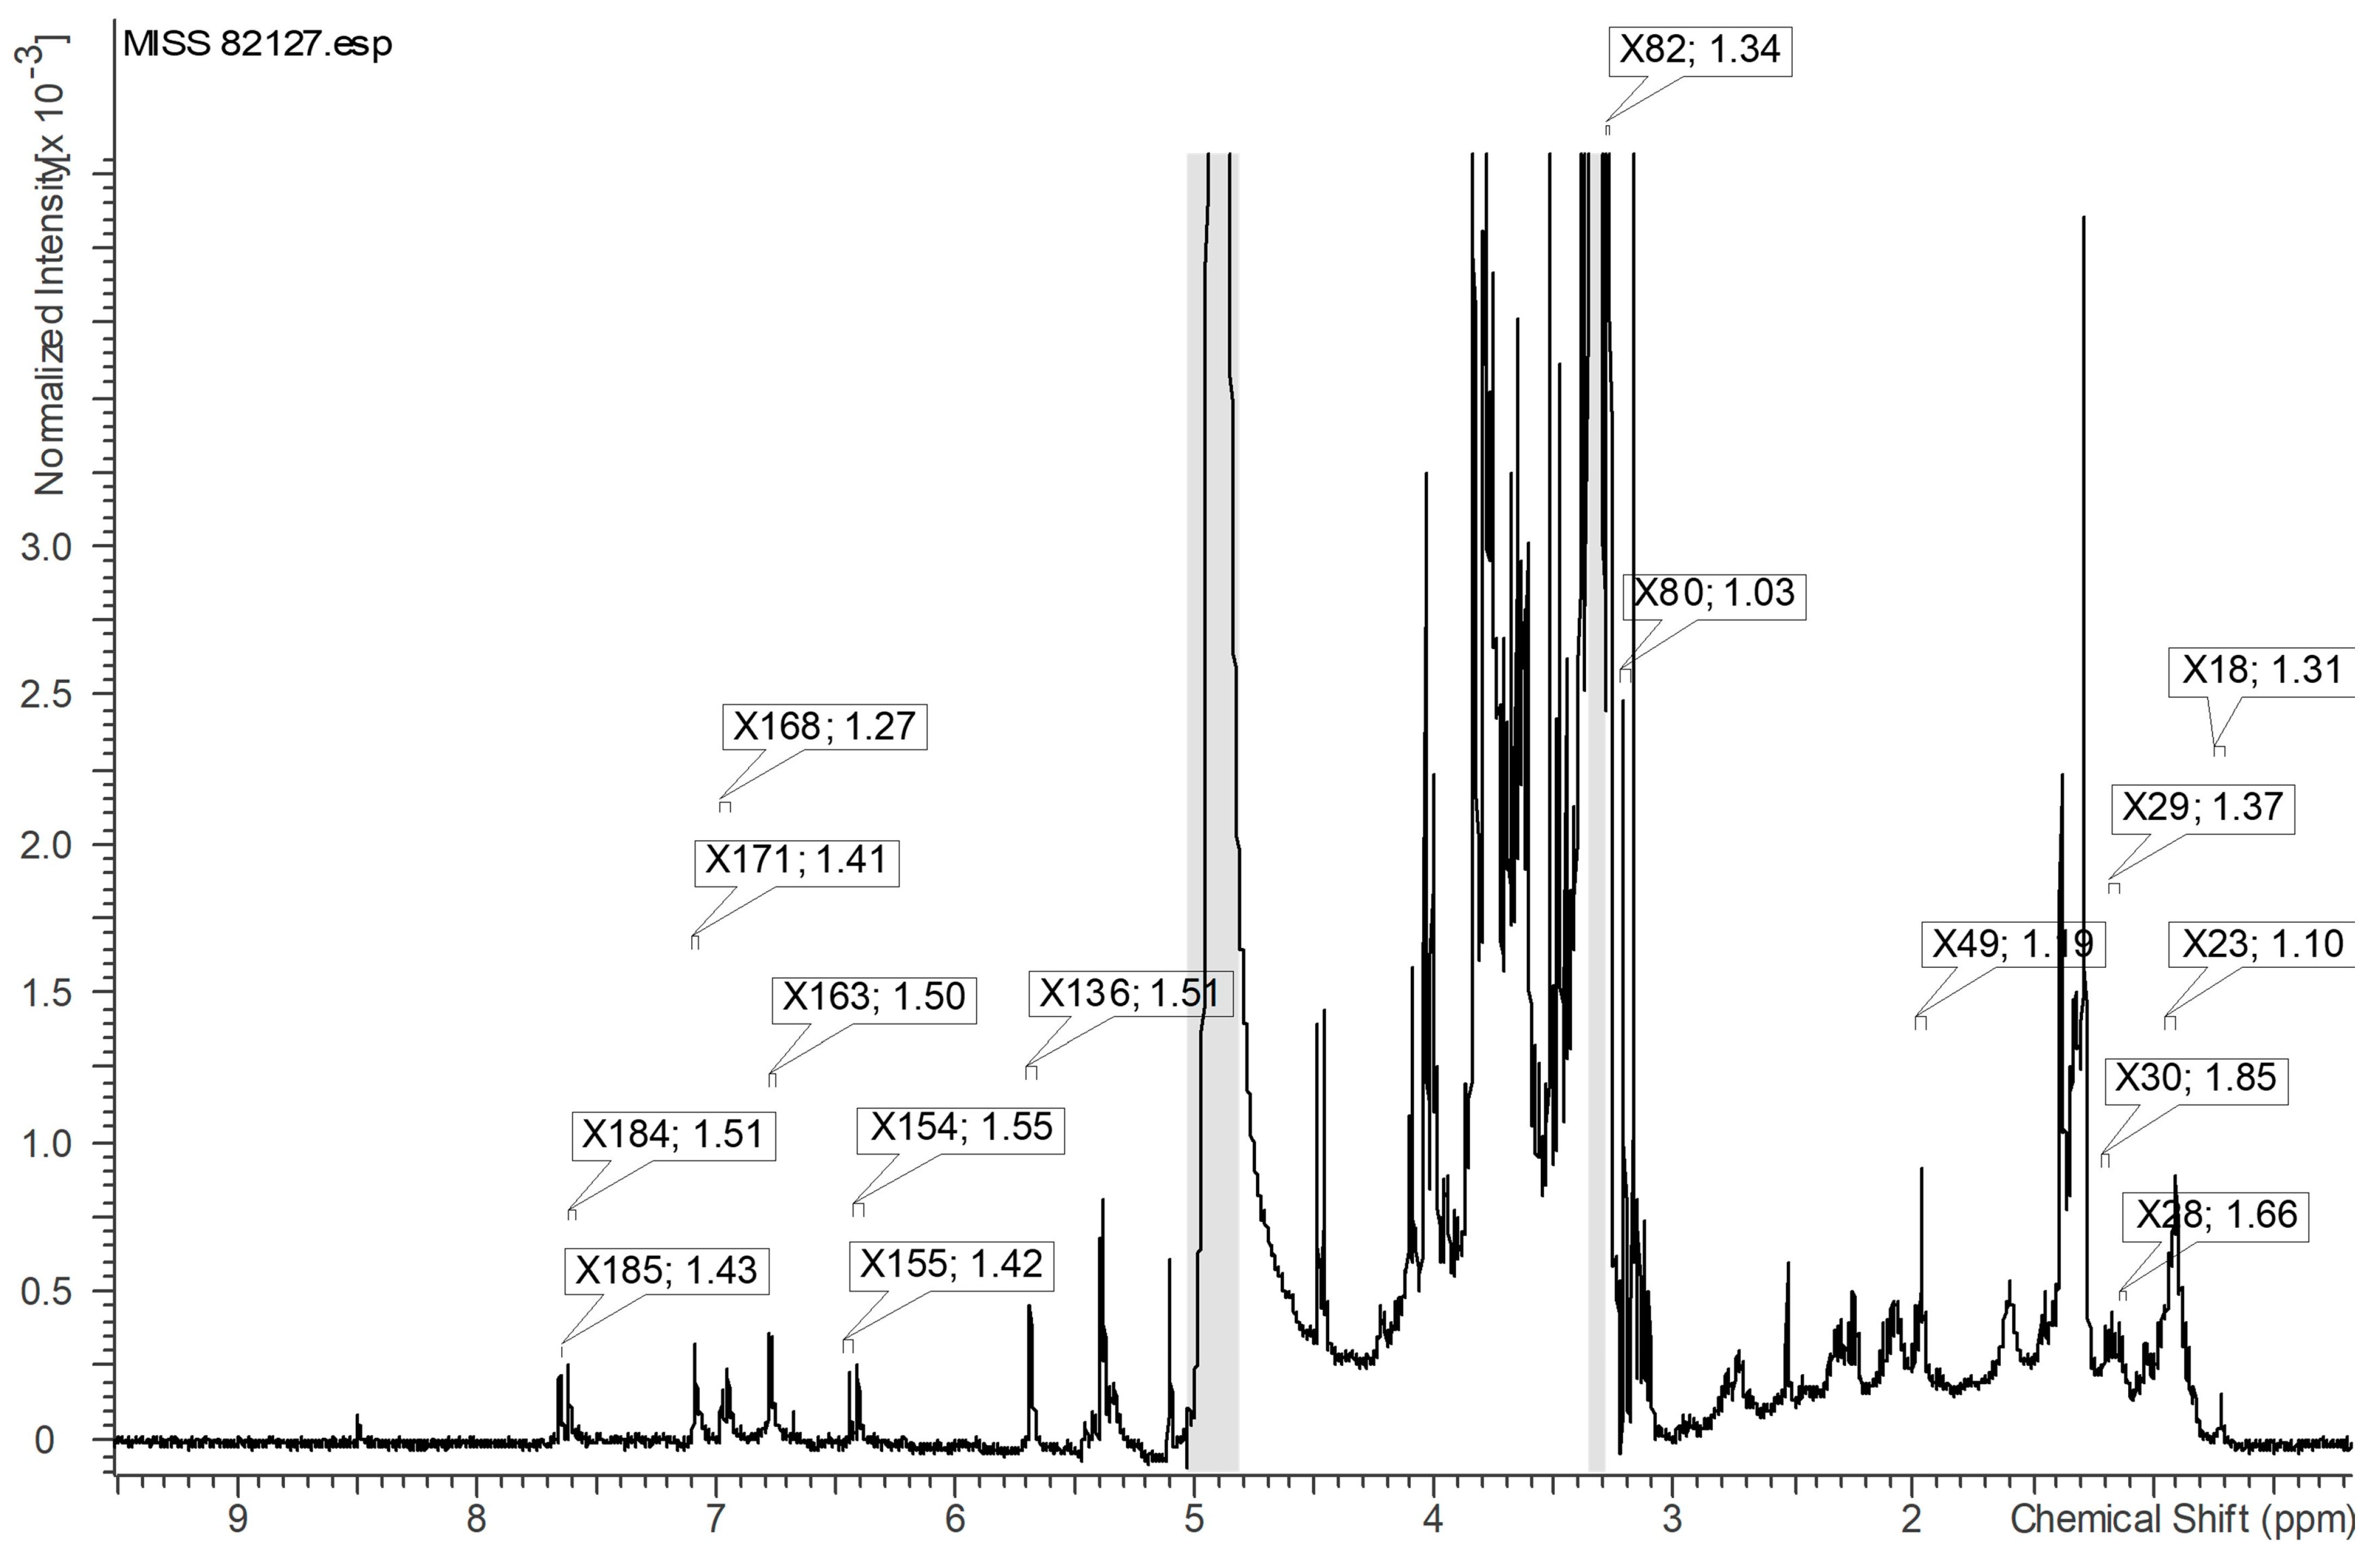
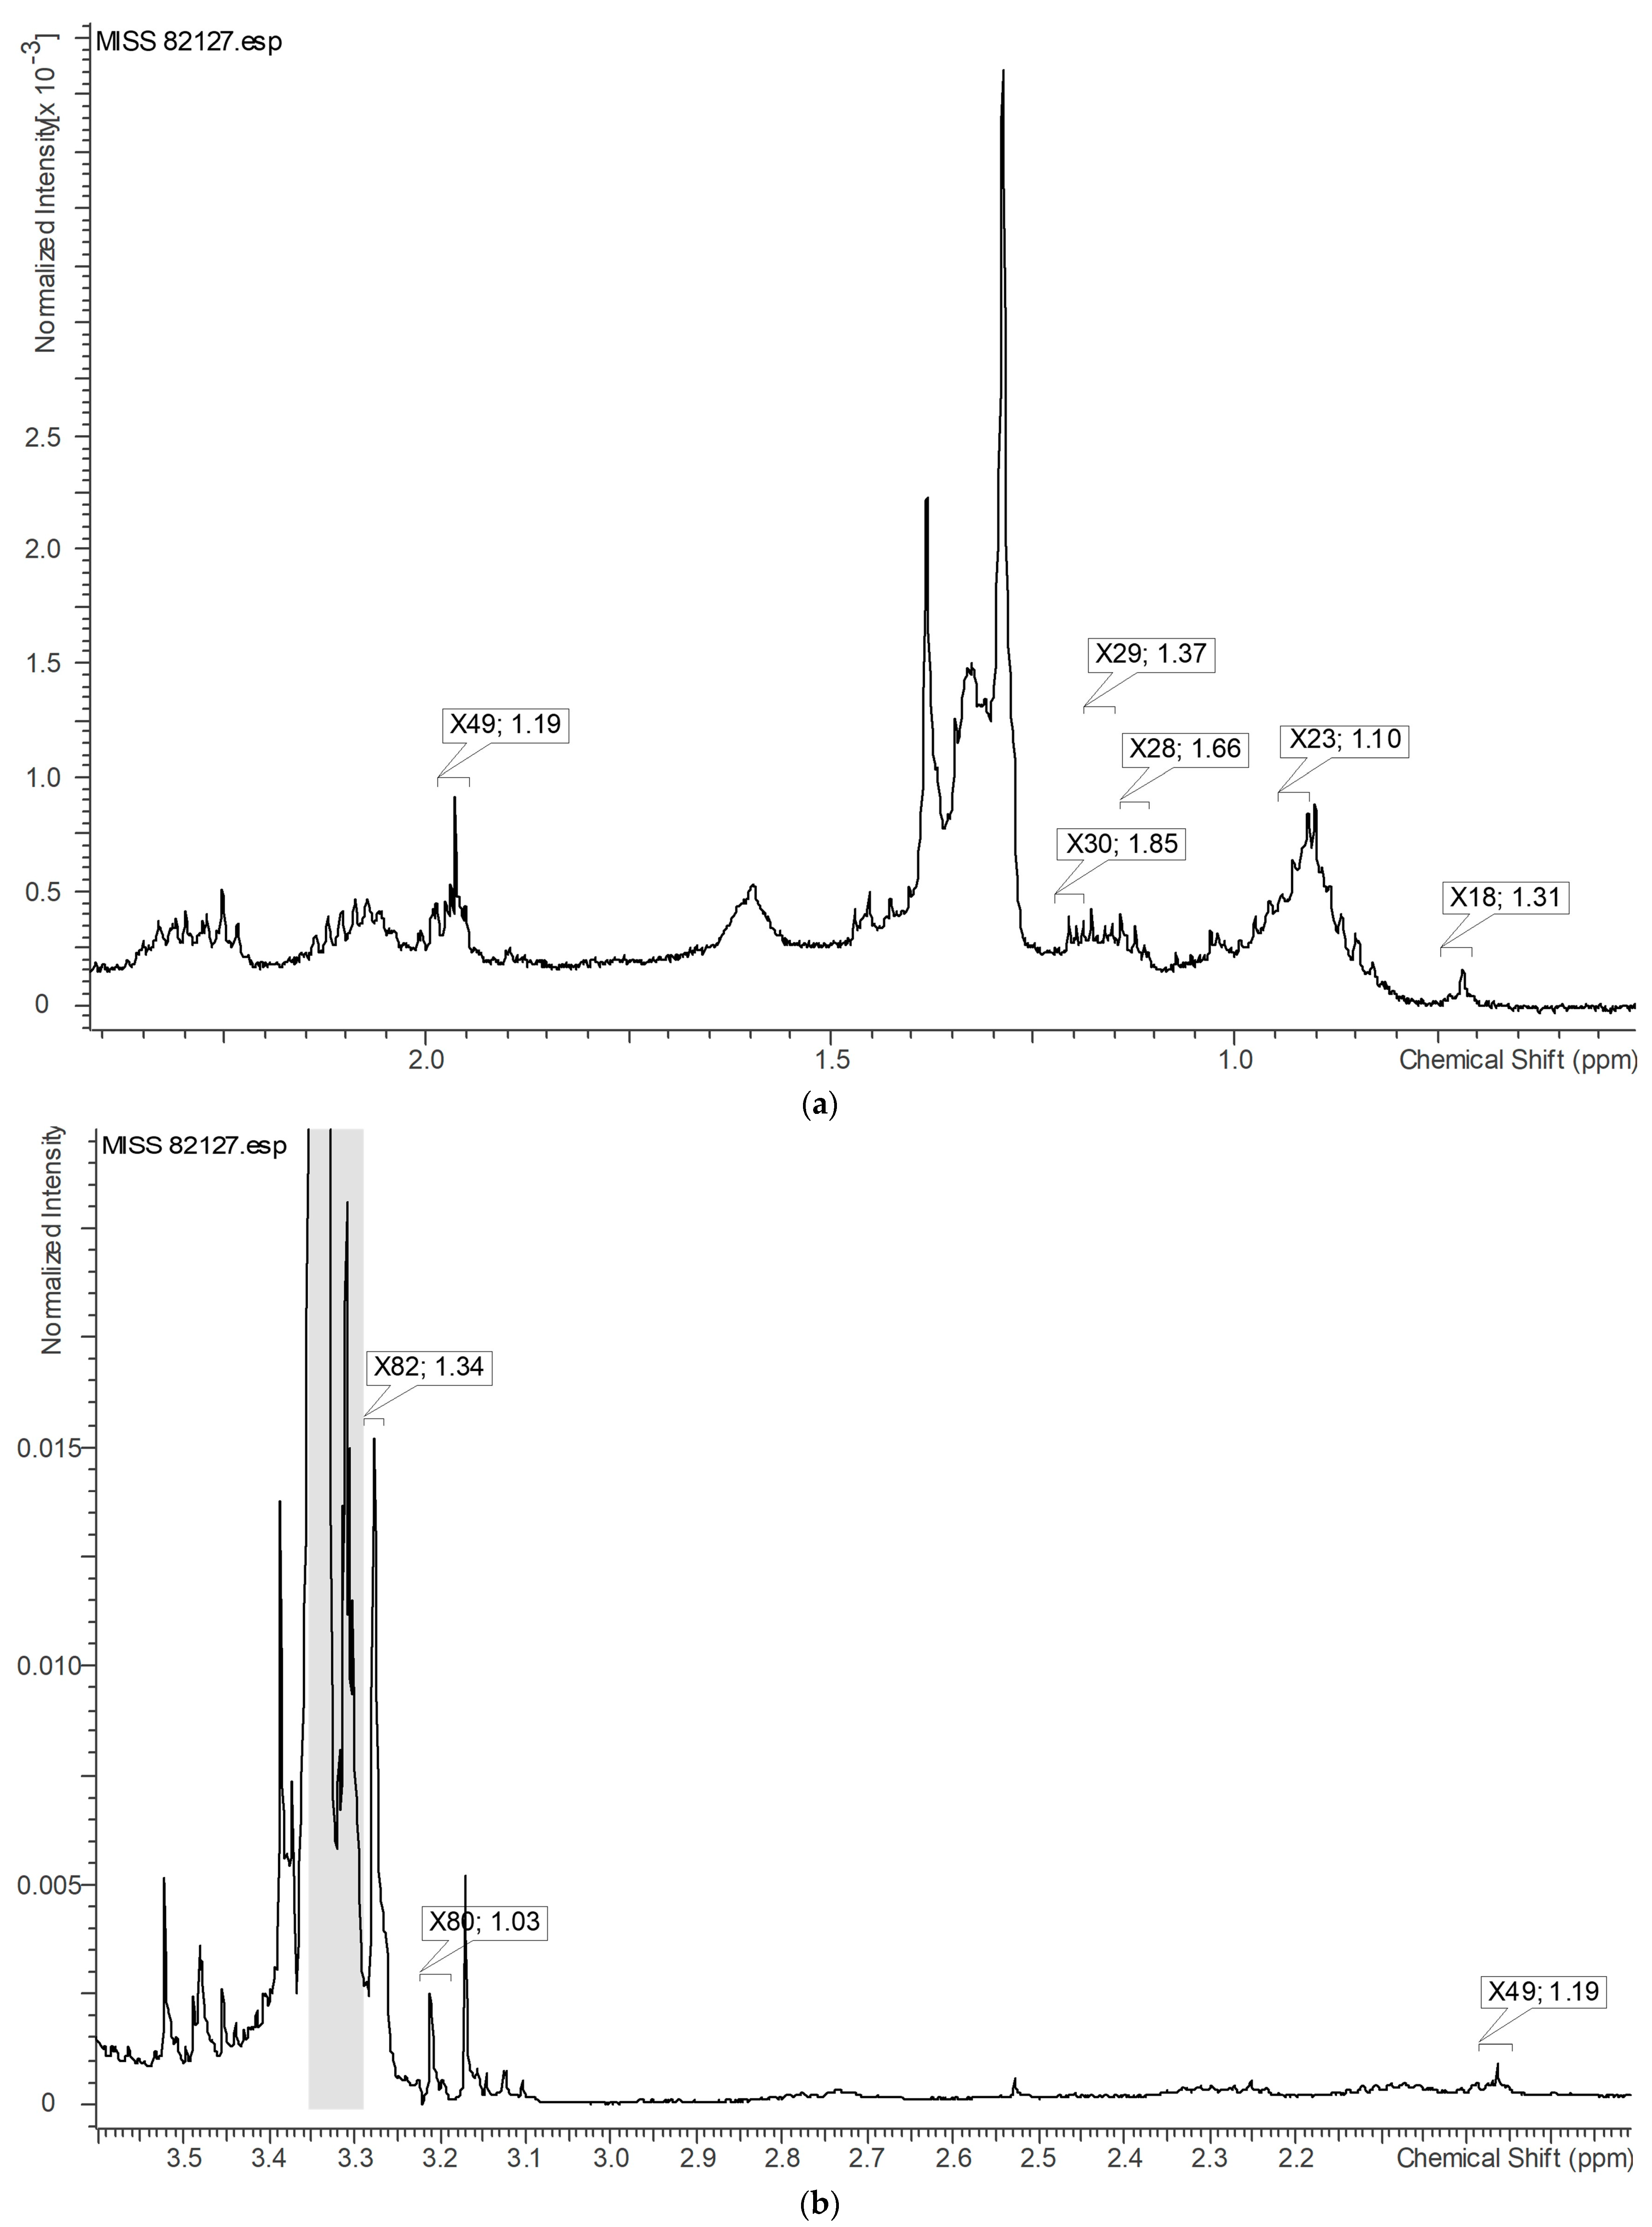
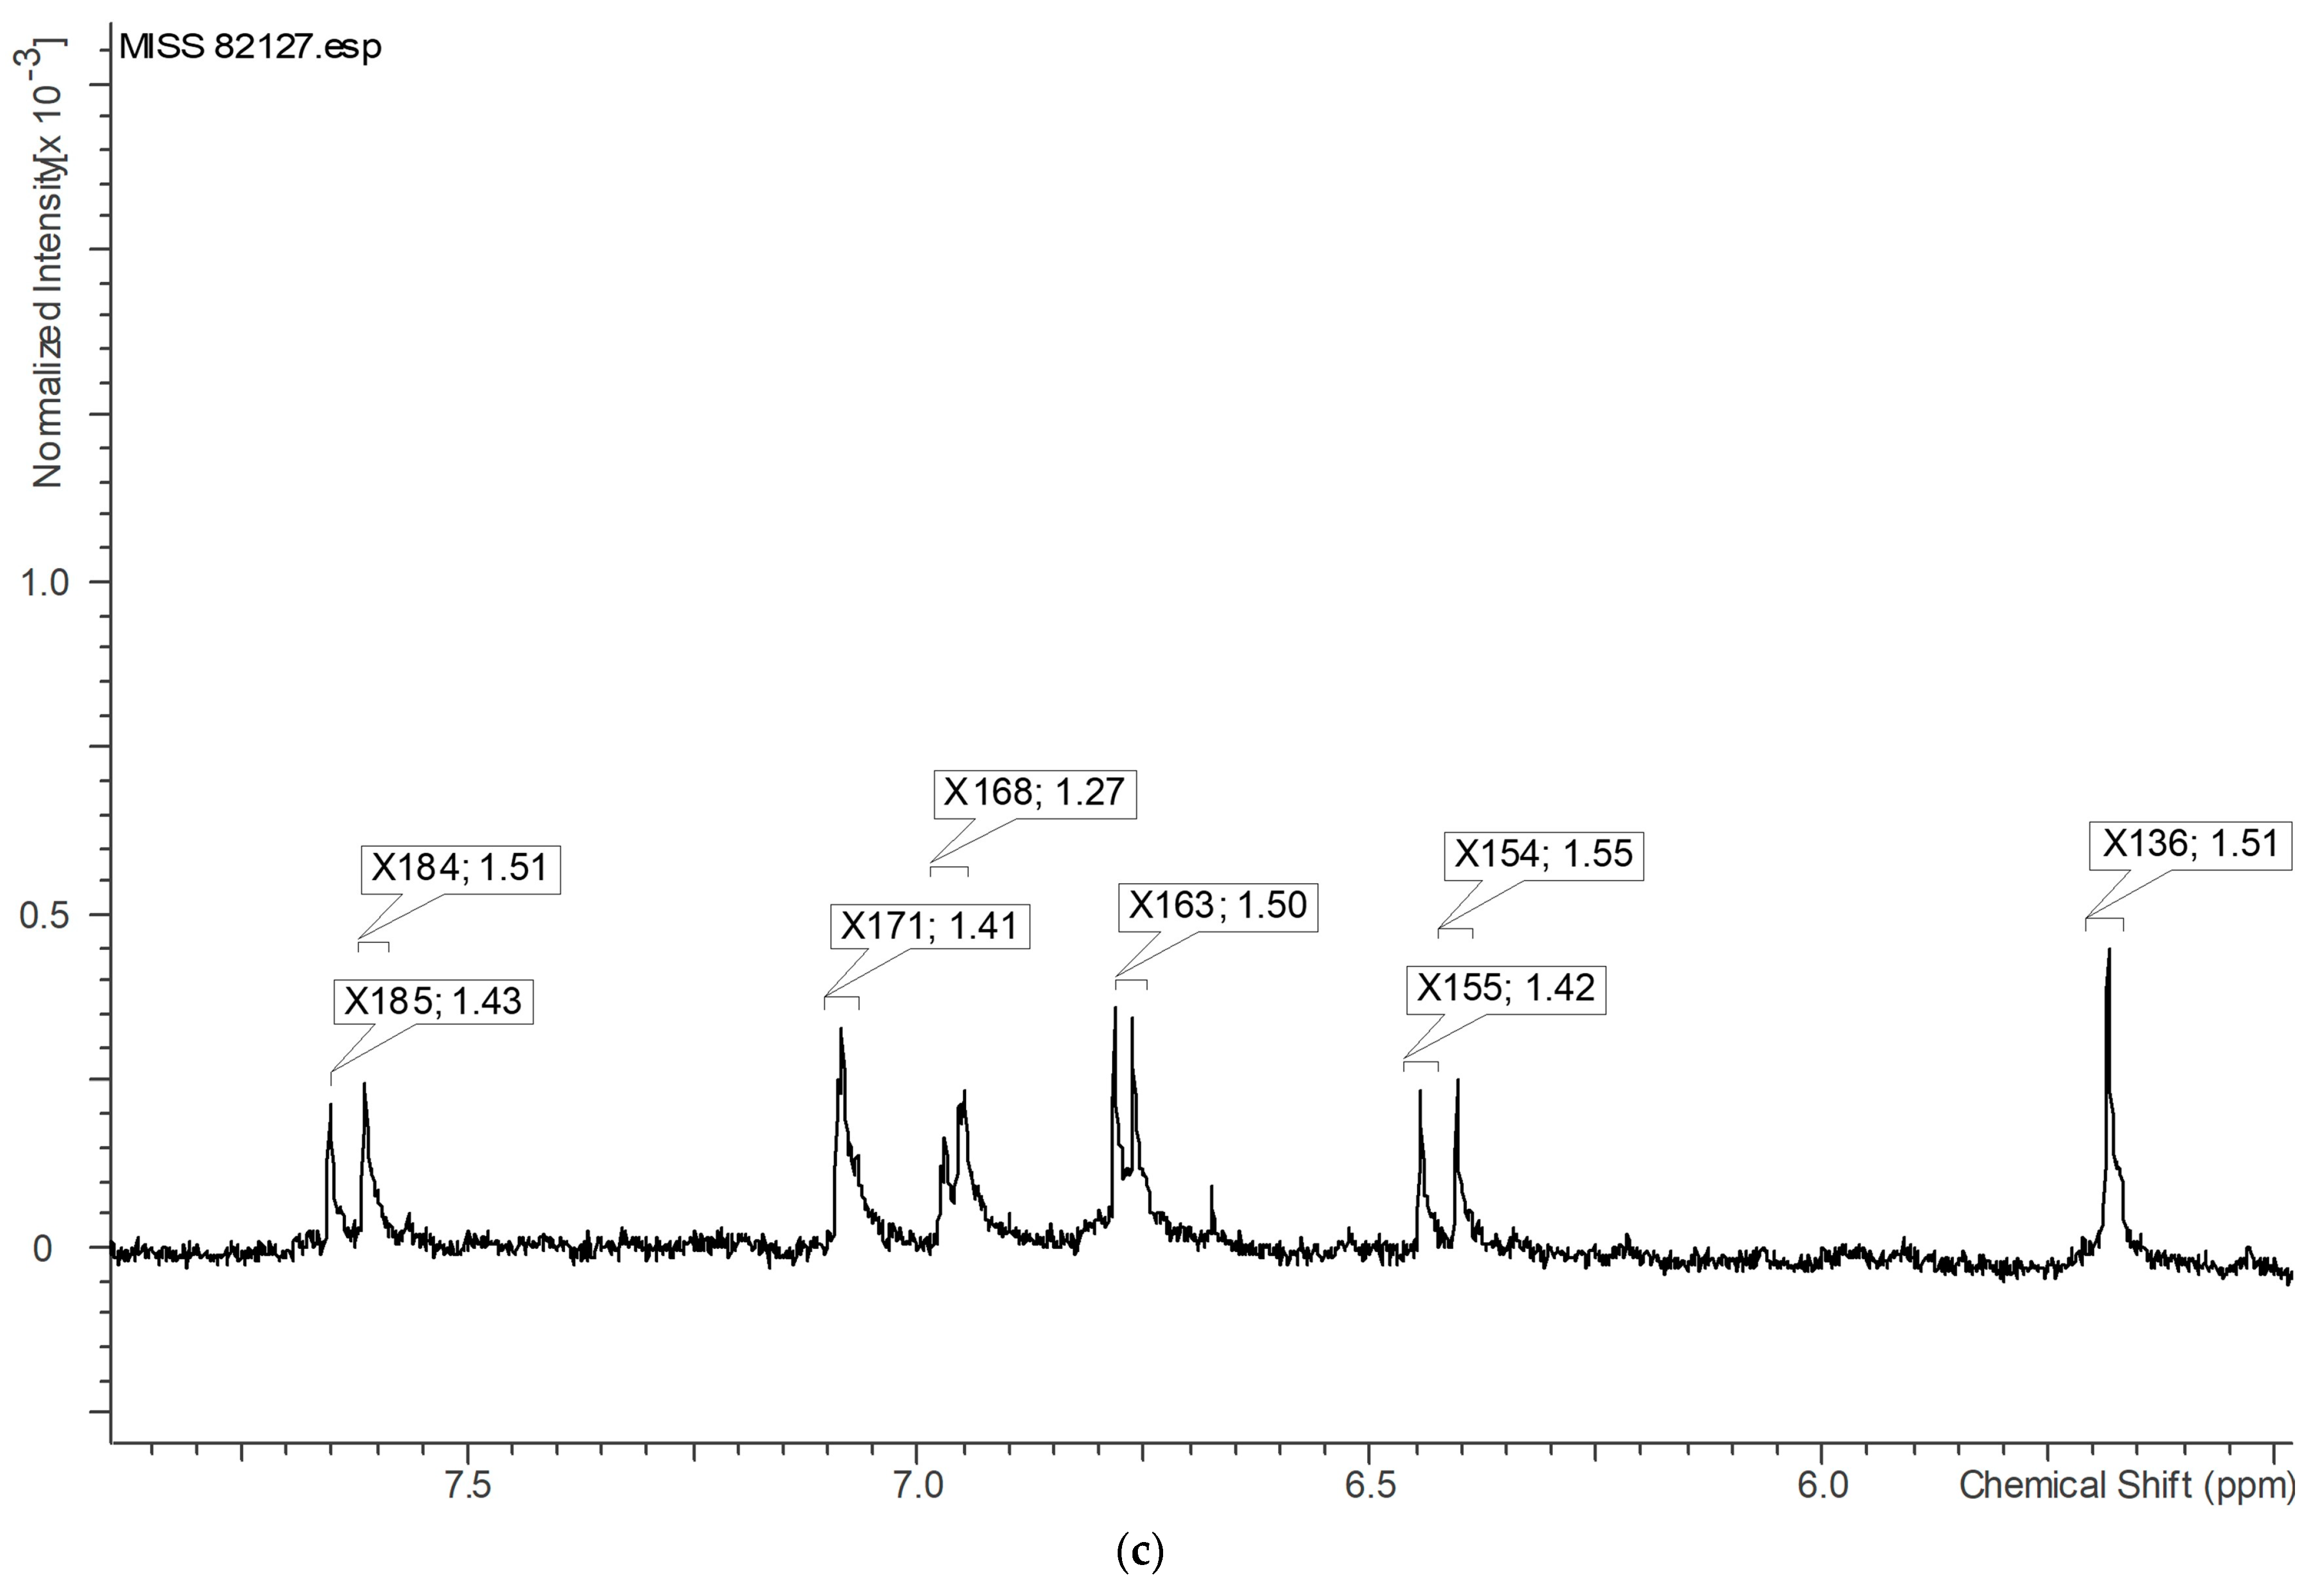
The variables correlated with active samples are identified based on loading plot and VIP scores, and subsequently mapped on the 1H-NMR spectrum of the most potent Echinacea sample, MISS 82127 (Table 5 Figure 13 and Figure 14a–c). Figure 13 and Figure 14a–c indicate that structures containing aromatic, alkyne, and alkane protons constitute the most prominent chemical class correlating with the observed stimulation of myelopoiesis activity exhibited by Echinacea. Previous investigations have demonstrated that the water fraction rich in polysaccharides has no impact on the CFU-GM assay [26]. Hence, we postulate that the aromatics possessing alkane or alkyl side chains, possibly phenolics, within Echinacea are responsible for the observed stimulating effect on myeloid progenitors.
It is highly unlikely that a single constituent accounts for the myeloid progenitor-stimulating effect. Rather, the activity may arise from synergistic interactions among multiple constituents, where specific constituents, side chains, and functional groups play crucial roles. In this context, the structural chemical attributes of Echinacea, such as the length of the side chain and the presence or absence of certain moieties, may significantly influence its activity, warranting further exploration of the structure–activity relationship.
A targeted phytochemical analysis of the aromatics with alkane and alkyl side chains provides a promising strategy to identify the active constituents responsible for myeloid progenitor stimulation. For example, lipophilic components are commonly extracted using solvents, such as hexane [55] or acetonitrile [56]. Under a typical extraction procedure, aerial parts are initially treated with hexane to remove alkylamides, and then sequentially processed with 100% ethanol and 70% ethanol to eliminate phenolic and phenolic glycosides, respectively [57]. Leveraging these extraction methodologies in future research could yield significant insights into the contribution of the aromatic fraction with alkane or alkyl side chains in the stimulation of myeloid progenitors. As such, comprehensive testing of this specific fraction within the CFU-GM assay in further investigations is crucial to deepen our understanding of these biological processes.
In summary, the utilization of chemometrics has proven instrumental in the successful identification of potential chemical constituent classes that contribute to the stimulation of myelopoiesis exhibited by Echinacea. Through the application of an advanced statistical modeling technique, OPLS-DA, we were able to pinpoint the key variables and discriminate between active and inactive samples based on their activity profiles. Subsequent validation using PCA of the selected variables provided robust confirmation of their efficacy in distinguishing between the two groups. Finally, the aromatic compounds with alkane and alkyl side chains, possibly phenolics, emerged as a promising direction for understanding the active constituents responsible for the observed myeloid progenitor-stimulating effects.

5. Conclusions

In this study, we evaluated the activity of 75% (v v1) ethanol extracts from the aerial parts of eleven Echinacea samples, representing three species (E. purpurea, E. angustifolia, and E. pallida), on myeloid progenitors in female Sprague–Dawley rats. Our analysis revealed that seven (with at least one sample from each species) out of these eleven samples significantly stimulated myeloid progenitors, indicating a sample-specific rather than species-specific activity within Echinacea. Furthermore, our findings suggest the Jak-Stat signaling pathway might be crucial in mediating Echinacea’s effect on myeloid progenitor cells. Employing an 1H-NMR-based chemometric approach, we identified aromatic compounds with alkane and alkyl side chains, potentially phenolics, as key bioactive constituents for myeloid progenitor activity exhibited by Echinacea. To conclude, these findings highlight the potential of chemometric analysis using 1H-NMR spectroscopy to infer the chemical classes responsible for the bioactive properties of complex herbal mixtures, like Echinacea.

Supplementary Materials

The following supporting information can be downloaded at https://www.mdpi.com/article/10.3390/analytica5010003/s1, File S1: Plant Sample Photodocumentation, File S2: CFUGEMM BFUE, File S3: VIP Values. Figure S1: Plant Sample Photodocumentation. Figure S2: Effects of 75% ethanolic extract of E. angustifolia PI-649026 on female SD rats’ (n = 4 to 6 per group) CFU-GEMMs (a) and BFU-Es (b).

Author Contributions

J.D.C. collected and provided plant samples from USDA-ARS NCRPIS. All authors designed the studies. S.K.N. and J.T.S. conducted the studies. All authors analyzed and interpreted the data. S.K.N. wrote the manuscript. All authors have read and agreed to the published version of the manuscript.

Funding

This research received no external funding.

Data Availability Statement

Data will be available upon reasonable request to the corresponding author.

Conflicts of Interest

The authors declare no conflicts of interest.

References

  1. McKeown, K.A. A review of the taxonomy of the genus Echinacea. In Perspectives on New Crops and New Uses; American Society for Horticultural Science Press: Alexandria, VA, USA, 1999; pp. 482–489. [Google Scholar]
  2. Clarke, T.C.; Black, L.I.; Stussman, B.J.; Barnes, P.M.; Nahin, R.L. Trends in the use of complementary health approaches among adults: United States, 2002–2012. Natl. Health Stat. Rep. 2015, 79, 1–16. [Google Scholar]
  3. Karsch-Volk, M.; Barrett, B.; Kiefer, D.; Bauer, R.; Ardjomand-Woelkart, K.; Linde, K. Echinacea for preventing and treating the common cold. Cochrane Database Syst. Rev. 2014, 2014, CD000530. [Google Scholar] [CrossRef] [PubMed]
  4. Reich, E.; Schibli, A.; DeBatt, A. Validation of high-performance thin-layer chromatographic methods for the identification of botanicals in a cGMP environment. J. AOAC Int. 2008, 91, 13–20. [Google Scholar] [CrossRef] [PubMed]
  5. Prince, E.K.; Pohnert, G. Searching for signals in the noise: Metabolomics in chemical ecology. Anal. Bioanal. Chem. 2010, 396, 193–197. [Google Scholar] [CrossRef]
  6. Kellogg, J.J.; Todd, D.A.; Egan, J.M.; Raja, H.A.; Oberlies, N.H.; Kvalheim, O.M.; Cech, N.B. Biochemometrics for Natural Products Research: Comparison of Data Analysis Approaches and Application to Identification of Bioactive Compounds. J. Nat. Prod. 2016, 79, 376–386. [Google Scholar] [CrossRef] [PubMed]
  7. Inui, T.; Wang, Y.; Pro, S.M.; Franzblau, S.G.; Pauli, G.F. Unbiased evaluation of bioactive secondary metabolites in complex matrices. Fitoterapia 2012, 83, 1218–1225. [Google Scholar] [CrossRef]
  8. Sidebottom, A.M.; Johnson, A.R.; Karty, J.A.; Trader, D.J.; Carlson, E.E. Integrated metabolomics approach facilitates discovery of an unpredicted natural product suite from Streptomyces coelicolor M145. ACS Chem. Biol. 2013, 8, 2009–2016. [Google Scholar] [CrossRef]
  9. Hoffmann, T.; Krug, D.; Bozkurt, N.; Duddela, S.; Jansen, R.; Garcia, R.; Gerth, K.; Steinmetz, H.; Muller, R. Correlating chemical diversity with taxonomic distance for discovery of natural products in myxobacteria. Nat. Commun. 2018, 9, 803. [Google Scholar] [CrossRef]
  10. Bingol, K.; Bruschweiler, R. Multidimensional approaches to NMR-based metabolomics. Anal. Chem. 2014, 86, 47–57. [Google Scholar] [CrossRef]
  11. Kim, H.K.; Choi, Y.H.; Verpoorte, R. NMR-based plant metabolomics: Where do we stand, where do we go? Trends Biotechnol. 2011, 29, 267–275. [Google Scholar] [CrossRef]
  12. Ali, K.; Iqbal, M.; Yuliana, N.D.; Lee, Y.J.; Park, S.; Han, S.; Lee, J.W.; Lee, H.S.; Verpoorte, R.; Choi, Y.H. Identification of bioactive metabolites against adenosine A1 receptor using NMR-based metabolomics. Metabolomics 2013, 9, 778–785. [Google Scholar] [CrossRef]
  13. Cardoso-Taketa, A.T.; Pereda-Miranda, R.; Choi, Y.H.; Verpoorte, R.; Villarreal, M.L. Metabolic profiling of the Mexican anxiolytic and sedative plant Galphimia glauca using nuclear magnetic resonance spectroscopy and multivariate data analysis. Planta Med. 2008, 74, 1295–1301. [Google Scholar] [CrossRef] [PubMed]
  14. Hernández-Bolio, G.I.; Kutzner, E.; Eisenreich, W.; de Jesús Torres-Acosta, J.F.; Peña-Rodríguez, L.M. The use of 1H–NMR Metabolomics to Optimise the Extraction and Preliminary Identification of Anthelmintic Products from the Leaves of Lysiloma latisiliquum. Phytochem. Anal. 2018, 29, 413–420. [Google Scholar] [CrossRef]
  15. Chicca, A.; Raduner, S.; Pellati, F.; Strompen, T.; Altmann, K.H.; Schoop, R.; Gertsch, J. Synergistic immunomopharmacological effects of N-alkylamides in Echinacea purpurea herbal extracts. Int. Immunopharmacol. 2009, 9, 850–858. [Google Scholar] [CrossRef] [PubMed]
  16. LaLone, C.A.; Hammer, K.D.; Wu, L.; Bae, J.; Leyva, N.; Liu, Y.; Solco, A.K.; Kraus, G.A.; Murphy, P.A.; Wurtele, E.S.; et al. Echinacea species and alkamides inhibit prostaglandin E2 production in RAW264.7 mouse macrophage cells. J. Agric. Food Chem. 2007, 55, 7314–7322. [Google Scholar] [CrossRef]
  17. Pellati, F.; Benvenuti, S.; Magro, L.; Melegari, M.; Soragni, F. Analysis of phenolic compounds and radical scavenging activity of Echinacea spp. J. Pharm. Biomed. Anal. 2004, 35, 289–301. [Google Scholar] [CrossRef]
  18. Tsai, Y.L.; Chiou, S.Y.; Chan, K.C.; Sung, J.M.; Lin, S.D. Caffeic acid derivatives, total phenols, antioxidant and antimutagenic activities of Echinacea purpurea flower extracts. Lwt-Food Sci. Technol. 2012, 46, 169–176. [Google Scholar] [CrossRef]
  19. Luettig, B.; Steinmuller, C.; Gifford, G.E.; Wagner, H.; Lohmann-Matthes, M.L. Macrophage activation by the polysaccharide arabinogalactan isolated from plant cell cultures of Echinacea purpurea. J. Natl. Cancer Inst. 1989, 81, 669–675. [Google Scholar] [CrossRef]
  20. Stimpel, M.; Proksch, A.; Wagner, H.; Lohmann-Matthes, M.L. Macrophage activation and induction of macrophage cytotoxicity by purified polysaccharide fractions from the plant Echinacea purpurea. Infect. Immun. 1984, 46, 845–849. [Google Scholar] [CrossRef]
  21. Ren, W.; Ban, J.; Xia, Y.; Zhou, F.; Yuan, C.; Jia, H.; Huang, H.; Jiang, M.; Liang, M.; Li, Z. Echinacea purpurea-derived homogeneous polysaccharide exerts anti-tumor efficacy via facilitating M1 macrophage polarization. Innovation 2023, 4, 100391. [Google Scholar] [CrossRef]
  22. Chicca, A.; Pellati, F.; Adinolfi, B.; Matthias, A.; Massarelli, I.; Benvenuti, S.; Martinotti, E.; Bianucci, A.M.; Bone, K.; Lehmann, R.; et al. Cytotoxic activity of polyacetylenes and polyenes isolated from roots of Echinacea pallida. Br. J. Pharmacol. 2008, 153, 879–885. [Google Scholar] [CrossRef]
  23. Modarai, M.; Gertsch, J.; Suter, A.; Heinrich, M.; Kortenkamp, A. Cytochrome P450 inhibitory action of Echinacea preparations differs widely and co-varies with alkylamide content. J. Pharm. Pharmacol. 2007, 59, 567–573. [Google Scholar] [CrossRef] [PubMed]
  24. Yale, S.H.; Glurich, I. Analysis of the inhibitory potential of Ginkgo biloba, Echinacea purpurea, and Serenoa repens on the metabolic activity of cytochrome P450 3A4, 2D6, and 2C9. J. Altern. Complement. Med. 2005, 11, 433–439. [Google Scholar] [CrossRef] [PubMed]
  25. Dalby-Brown, L.; Barsett, H.; Landbo, A.K.; Meyer, A.S.; Molgaard, P. Synergistic antioxidative effects of alkamides, caffeic acid derivatives, and polysaccharide fractions from Echinacea purpurea on in vitro oxidation of human low-density lipoproteins. J. Agric. Food Chem. 2005, 53, 9413–9423. [Google Scholar] [CrossRef] [PubMed]
  26. Ramasahayam, S.; Baraka, H.N.; Abdel Bar, F.M.; Abuasal, B.S.; Widrlechner, M.P.; Sayed, K.A.; Meyer, S.A. Effects of chemically characterized fractions from aerial parts of Echinacea purpurea and E. angustifolia on myelopoiesis in rats. Planta Med. 2011, 77, 1883–1889. [Google Scholar] [CrossRef] [PubMed]
  27. Garber, J.C.; Barbee, R.W.; Bielitzki, J.T.; Clayton, L.; Donovan, J.; Hendriksen, C.; Kohn, D.; Lipman, N.; Locke, P.; Melcher, J. Guide for the Care and Use of Laboratory Animals; The National Academic Press: Washington, DC, USA, 2011; Volume 8, p. 220. [Google Scholar]
  28. Cloarec, O.; Dumas, M.E.; Trygg, J.; Craig, A.; Barton, R.H.; Lindon, J.C.; Nicholson, J.K.; Holmes, E. Evaluation of the orthogonal projection on latent structure model limitations caused by chemical shift variability and improved visualization of biomarker changes in 1H NMR spectroscopic metabonomic studies. Anal. Chem. 2005, 77, 517–526. [Google Scholar] [CrossRef] [PubMed]
  29. Advanced Chemistry Development, Inc., ACD Labs. ACD/NMR Processor Academic Edition, 1997–2010; Advanced Chemistry Development, Inc., ACD Labs: Toronto, ON, Canada, 2010. [Google Scholar]
  30. R Core Team. R: A Language and Environment for Statistical Computing; R Foundation for Statistical Computing: Vienna, Austria, 2022. [Google Scholar]
  31. Davis, J.; Goadrich, M. The relationship between Precision-Recall and ROC curves. In Proceedings of the 23rd International Conference on Machine Learning, Pittsburgh, PA, USA, 25–29 June 2006; pp. 233–240. [Google Scholar]
  32. Robb, L. Cytokine receptors and hematopoietic differentiation. Oncogene 2007, 26, 6715–6723. [Google Scholar] [CrossRef]
  33. Chotinantakul, K.; Leeanansaksiri, W. Hematopoietic stem cell development, niches, and signaling pathways. Bone Marrow Res. 2012, 2012, 270425. [Google Scholar] [CrossRef]
  34. Kindt, T.J.; Goldsby, R.A.; Osborne, B.A.; Kuby, J. Kuby Immunology; Macmillan: New York, NY, USA, 2007. [Google Scholar]
  35. Liu, P.J.; Hsieh, W.T.; Huang, S.H.; Liao, H.F.; Chiang, B.H. Hematopoietic effect of water-soluble polysaccharides from Angelica sinensis on mice with acute blood loss. Exp. Hematol. 2010, 38, 437–445. [Google Scholar] [CrossRef]
  36. Lim, J.; Jeong, S.J.; Koh, W.; Han, I.; Lee, H.J.; Kwon, T.R.; Jung, J.H.; Kim, J.H.; Lee, H.J.; Lee, E.O.; et al. JAK2/STAT5 signaling pathway mediates Bojungbangdocktang enhanced hematopoiesis. Phytother. Res. 2011, 25, 329–337. [Google Scholar] [CrossRef]
  37. Chen, D.; Zuo, G.; Li, C.; Hu, X.; Guan, T.; Jiang, R.; Li, J.; Lin, X.; Li, F.; Luo, C.; et al. Total saponins of Panax ginseng (TSPG) promote erythroid differentiation of human CD34+ cells via EpoR-mediated JAK2/STAT5 signaling pathway. J. Ethnopharmacol. 2009, 126, 215–220. [Google Scholar] [CrossRef]
  38. Barreda, D.R.; Hanington, P.C.; Belosevic, M. Regulation of myeloid development and function by colony stimulating factors. Dev. Comp. Immunol. 2004, 28, 509–554. [Google Scholar] [CrossRef] [PubMed]
  39. Orkin, S.H.; Zon, L.I. Hematopoiesis: An evolving paradigm for stem cell biology. Cell 2008, 132, 631–644. [Google Scholar] [CrossRef] [PubMed]
  40. Kaushansky, K. Lineage-specific hematopoietic growth factors. N. Engl. J. Med. 2006, 354, 2034–2045. [Google Scholar] [CrossRef] [PubMed]
  41. Ward, A.C. The Jak-Stat Pathway in Hematopoiesis and Disease; Springer Science & Business Media: Berlin/Heidelberg, Germany, 2002; Volume 20. [Google Scholar]
  42. Tamta, H.; Pugh, N.D.; Balachandran, P.; Moraes, R.; Sumiyanto, J.; Pasco, D.S. Variability in In Vitro Macrophage Activation by Commercially Diverse Bulk Echinacea Plant Material Is Predominantly Due to Bacterial Lipoproteins and Lipopolysaccharides. J. Agric. Food Chem. 2008, 56, 10552–10556. [Google Scholar] [CrossRef]
  43. Pugh, N.D.; Jackson, C.R.; Pasco, D.S. Total Bacterial Load within Echinacea purpurea, Determined Using a New PCR-based Quantification Method, is Correlated with LPS Levels and In Vitro Macrophage Activity. Planta Medica 2013, 79, 9–14. [Google Scholar]
  44. Todd, D.A.; Gulledge, T.V.; Britton, E.R.; Oberhofer, M.; Leyte-Lugo, M.; Moody, A.N.; Shymanovich, T.; Grubbs, L.F.; Juzumaite, M.; Graf, T.N. Ethanolic Echinacea purpurea extracts contain a mixture of cytokine-suppressive and cytokine-inducing compounds, including some that originate from endophytic bacteria. PLoS ONE 2015, 10, e0124276. [Google Scholar] [CrossRef]
  45. Wold, H. Path models with latent variables: The NIPALS approach. In Quantitative Sociology; Elsevier: Amsterdam, The Netherlands, 1975; pp. 307–357. [Google Scholar]
  46. Trygg, J.; Wold, S. Orthogonal projections to latent structures (O-PLS). J. Chemom. 2002, 16, 119–128. [Google Scholar] [CrossRef]
  47. Ali, K.; Iqbal, M.; Korthout, H.A.; Maltese, F.; Fortes, A.M.; Pais, M.S.; Verpoorte, R.; Choi, Y.H. NMR spectroscopy and chemometrics as a tool for anti-TNFα activity screening in crude extracts of grapes and other berries. Metabolomics 2012, 8, 1148–1161. [Google Scholar] [CrossRef]
  48. Golbraikh, A.; Tropsha, A. Beware of q2! J. Mol. Graph. Model. 2002, 20, 269–276. [Google Scholar] [CrossRef]
  49. Mohamad, N.; Ismet, R.I.; Rofiee, M.; Bannur, Z.; Hennessy, T.; Selvaraj, M.; Ahmad, A.; Nor, F.; Abdul Rahman, T.; Md Isa, K.; et al. Metabolomics and partial least square discriminant analysis to predict history of myocardial infarction of self-claimed healthy subjects: Validity and feasibility for clinical practice. J. Clin. Bioinforma 2015, 5, 3. [Google Scholar] [CrossRef] [PubMed]
  50. Bradley, A.P. The use of the area under the roc curve in the evaluation of machine learning algorithms. Pattern Recognit. 1997, 30, 1145–1159. [Google Scholar] [CrossRef]
  51. Szymanska, E.; Saccenti, E.; Smilde, A.K.; Westerhuis, J.A. Double-check: Validation of diagnostic statistics for PLS-DA models in metabolomics studies. Metabolomics 2012, 8 (Suppl. 1), 3–16. [Google Scholar] [CrossRef] [PubMed]
  52. Fisher, R.A. On the interpretation of χ 2 from contingency tables, and the calculation of P. J. R. Stat. Soc. 1922, 85, 87–94. [Google Scholar] [CrossRef]
  53. Chong, I.G.; Jun, C.H. Performance of some variable selection methods when multicollinearity is present. Chemom. Intell. Lab. Syst. 2005, 78, 103–112. [Google Scholar] [CrossRef]
  54. Andersen, C.M.; Bro, R. Variable selection in regression-a tutorial. J. Chemom. 2010, 24, 728–737. [Google Scholar] [CrossRef]
  55. Bauer, R.; Remiger, P. TLC and HPLC Analysis of Alkamides in Echinacea Drugs1,2. Planta Med. 1989, 55, 367–371. [Google Scholar] [CrossRef]
  56. Perry, N.B.; vanKlink, J.W.; Burgess, E.J.; Parmenter, G.A. Alkamide levels in Echinacea purpurea: A rapid analytical method revealing differences among roots, rhizomes, stems, leaves and flowers. Planta Medica 1997, 63, 58–62. [Google Scholar] [CrossRef]
  57. Hall, C., 3rd. Echinacea as a functional food ingredient. Adv. Food Nutr. Res. 2003, 47, 113–173. [Google Scholar]
Figure 1. Schematic representation of Echinacea aerial parts extraction.
Analytica 05 00003 g001
Figure 2. Effects of 75% ethanolic extract from the 11 Echinacea samples on female SD rats’ (n = 4 to 6 per group) CFU-GMs. The extracts were administered at doses of vehicle (0), 25, 50, 100, or 200 mg kg−1 d−1, except for the PI-649040 FG sample, which received doses of vehicle (0), 50, 100, and 200 mg kg−1 d−1 orally over a period of 7 days. E. purpurea samples are colored in green, E. angustifolia samples are colored in red, and E. pallida samples are colored in purple. Data are presented as mean ± SEM for ATP (pmol well−1), and statistical significance is indicated as follows: * p < 0.05 and ** p < 0.01.
Analytica 05 00003 g002
Figure 3. Comparison of the effects of 75% ethanolic extract from 11 Echinacea samples on female SD rats’ (n = 4 to 6 per group) CFU-GMs, with values normalized to their respective vehicle controls. The extracts were administered at doses of vehicle (0), 25, 50, 100, or 200 mg kg−1 d−1, except for the PI-649040 FG sample, which received doses of vehicle (0), 50, 100, and 200 mg kg−1 d−1 orally over a period of 7 days. E. purpurea samples are colored in green, E. angustifolia samples are colored in red, and E. pallida samples are colored in purple. Data are presented as mean ± SEM relative to the vehicle for ATP (pmol well−1), and statistical significance is indicated as follows: * p < 0.05 and ** p < 0.01.
Analytica 05 00003 g003
Figure 4. LPS content of the 11 Echinacea samples expressed in Endotoxin Units per gram (EUs g−1). E. purpurea samples are colored in green, E. angustifolia samples are colored in red, and E. pallida samples are colored in purple.
Analytica 05 00003 g004
Figure 5. Correlation between LPS content and percentage (%) increase in CFU-GM activity relative to the vehicle.
Analytica 05 00003 g005
Figure 6. Overlaid 1H-NMR spectra of the 11 extracts of E. purpurea, E. angustifolia, and E. pallida recorded on a JEOL Eclipse ECS-400 MHz NMR spectrometer in MeOD-d4 (20 mg per 700 µL). E. purpurea samples are colored in green, E. angustifolia samples are colored in red, and E. pallida samples are colored in purple. Active samples in the CFU-GM assay are labeled with bold font.
Analytica 05 00003 g006
Figure 7. PCA score plot with major principal components of the 11 samples of Echinacea. Dim 1 (principal component 1) represents 27.61% of explained variance and Dim 2 (principal component 2) represents 23.00% of explained variance. Based on the PCA score plot (Figure 7), 50.61% of X-variation is captured by the major principal components.
Analytica 05 00003 g007
Figure 8. PCA score plot with minor principal components of the 11 samples of Echinacea. Dim 2 (principal component 2) represents 23.00% of explained variance and Dim 4 (principal component 4) represents 9.43% of explained variance. Based on the PCA score plot (Figure 8), 32.43% of X-variation is captured by the minor principal components. Active samples are indicated by blue circles, while inactive samples are represented by a red circle.
Analytica 05 00003 g008
Figure 9. OPLS-DA score plot based on activity. R2X and R2Y represent the fraction of variation of the X and Y variables explained by the model, respectively, while Q2 represents the predictive performance of the model. RMSEE indicates the root-mean-squared error of estimation. The “pre” parameter denotes the number of predictive components used (for a single response model it is 1), and “ort” denotes the number of orthogonal components removed for building the model. In the score plot, the x-axis is labeled “t1 (14%)”, representing the first predictive component that explains 14% of the variance. The y-axis is labeled “to1”, representing the first orthogonal component. The term “Active” signifies the active samples in the CFU-GM assay, while “Inactive” represents the inactive samples. Active samples are indicated by a blue circle, while inactive samples are represented by a red circle.
Analytica 05 00003 g009
Figure 10. OPLS-DA loading plot based on activity. X1 to X244 represent variables, each corresponding to unique bins with a size of 0.04 ppm. In the loading plot, the x-axis is labeled “t1 (14%)”, representing the first predictive component that explains 14% of the variance. The y-axis is labeled “to1”, representing the first orthogonal component.
Analytica 05 00003 g010
Figure 11. ROC plot for OPLS-DA activity differentiation.
Analytica 05 00003 g011
Figure 12. PCA score plot of 71 variables (VIP ≥ 1.0) contributing to activity differentiation. Dim 1 (principal component 1) represents 43.37% of the explained variance and Dim 2 (principal component 2) represents 16.32% of the explained variance. Active samples are indicated by blue circles, while inactive samples are represented by a red circle.
Analytica 05 00003 g012
Figure 13. VIP ≥ 1.0 proton NMR signals contributing to the separation of active samples (in the loading plot) are identified on the highest active sample, MISS 82127. Figure 14a–c provide expanded views of specific regions within Figure 13.
Analytica 05 00003 g013
Figure 14. (a) Expanded view of the upfield region within Figure 13. VIP ≥ 1.0 proton NMR signals contributing to the separation of active samples (in the loading plot) are identified on the highest active sample, MISS 82127. X49 and 1.19 represent the variable and VIP value, respectively. (b) Expanded view near 3.00 ppm within Figure 13. VIP ≥ 1.0 proton NMR signals contributing to the separation of active samples (in the loading plot) are identified on the highest active sample, MISS 82127. X82 and 1.34 represent the variable and VIP value, respectively. (c) Expanded view of the downfield region within Figure 13. VIP ≥ 1.0 proton NMR signals contributing to the separation of active samples (in the loading plot) are identified on the highest active sample, MISS 82127. X184 and 1.51 represent the variable and VIP value, respectively.
Analytica 05 00003 g014aAnalytica 05 00003 g014b
Table 1. Percentage yield of Echinacea samples.
NumberEchinacea SamplesPercentage (%) Yield
1E. purpurea PI-63130717.77
2E. purpurea PI-63366814.29
3E. purpurea PI-649040 SH13.47
4E. purpurea PI-649040 FG13.20
5E. purpurea MISS 8212710.00
6E. angustifolia PI-64902613.30
7E. angustifolia PI-64902912.41
8E. angustifolia PI-63365411.68
9E. pallida PI-6313009.23
10E. pallida PI-59760311.53
11E. pallida PI-63366111.07
Table 2. Summary of the increase in CFU-GMs with aerial parts of Echinacea samples.
NumberEchinacea SamplesCFU-GM Assay Vehicle Control
(ATP, pmol well−1)
Order of Activity
(Maximal % Increase from Vehicle Control)
1E. purpurea PI-63130783.6966% at 200 mg kg−1 d−1
2E. purpurea PI-633668133.8056% at 200 mg kg−1 d−1
3E. purpurea PI-649040 SH176.0743% at 100 mg kg−1 d−1
4E. purpurea PI-649040 FG185.7039% at 100 mg kg−1 d−1
5E. purpurea MISS 82127108.4091% at 100 mg kg−1 d−1
6E. angustifolia PI-649026157.9687% at 200 mg kg−1 d−1
7E. angustifolia PI-649029202.9217% at 100 mg kg−1 d−1
8E. angustifolia PI-633654180.384.8% at 50 mg kg−1 d−1
9E. pallida PI-631300284.6429% at 100 mg kg−1 d−1
10E. pallida PI-597603192.5276% at 100 mg kg−1 d−1
11E. pallida PI-633661177.5833% at 100 mg kg−1 d−1
Samples that showed statistically significant outcomes in the CFU-GM assay are highlighted in bold typeface.
Table 3. Summary of model metrics OPLS-DA activity differentiation.
R2X (cum)R2Y (cum)Q2 (cum)RMSEEPreOrt
Total0.3730.9960.5190.036912
R2X and R2Y represent a fraction of the variation of the X and Y variables explained by the model, respectively, while Q2 represents the predictive performance of the model. RMSEE indicates the root-mean-squared error of estimation. Pre indicates the number of predictive components used (for a single response model, it is 1), while Ort indicates the number of orthogonal components removed for building the model. Based on Table 3, this model is able to explain 37.3% of the X variance (dependent variable) and 99.6% of the Y variance (independent variable).
Table 4. Confusion matrix for OPLS-DA activity differentiation.
Predicted
ActiveInactive
OriginalActive70
Inactive04
Active represents active samples in the CFU-GM assay, and Inactive represents inactive samples in the CFU-GM assay. Based on Table 4, the OPLS-DA model can predict active and inactive samples accurately. The error rate and NMC for the confusion matrix are zero.
Table 5. Sixteen variables with VIP ≥ 1.0 proton NMR signals contributed to the activity.
NumberVariableTypeJ (Hz)ppm RangeVIP Values
1X18m-[0.70–0.74]1.31
2X23m-[0.90–0.94]1.10
3X28m-[1.10–1.14]1.66
4X29m-[1.14–1.18]1.37
5X30br.s-[1.18–1.22]1.85
6X49s-[1.94–1.98]1.19
7X80s-[3.18–3.22]1.03
8X82s-[3.26–3.29]1.34
9X136s-[5.66–5.70]1.51
10X154d15.58[6.38–6.42]1.55
11X155--[6.42–6.46]1.42
12X163d8.25[6.74–6.78]1.50
13X168d1.83[6.94–6.98]1.27
14X171dd8.25, 1.83[7.06–7.10]1.41
15X184d15.58[7.58–7.62]1.51
16X185--[7.62–7.66]1.43
The “Variable” column represents specific bins, “Type” corresponds to the type of proton NMR signal (m represents multiplet, br.s represents broad singlet, s represents singlet, d represents doublet, and dd represents doublet of doublet), “ppm range” indicates the range of proton shift in parts per million, “VIP values” correspond to the VIP scores, and “J (Hz)” denotes the coupling constants in Hertz.
Disclaimer/Publisher’s Note: The statements, opinions and data contained in all publications are solely those of the individual author(s) and contributor(s) and not of MDPI and/or the editor(s). MDPI and/or the editor(s) disclaim responsibility for any injury to people or property resulting from any ideas, methods, instructions or products referred to in the content.

