
Determination of Capecitabine and Its Metabolites in Plasma of Egyptian Colorectal Cancer Patients

 , and
, and
Abstract
:1. Introduction
2. Materials and Methods
2.1. HPLC Method Development for the Determination of Capecitabine and Its Metabolites Using HPLC-UV
2.1.1. Chemicals and Reagents
2.1.2. Equipment and Software
2.1.3. The Choice of Column and Method Development Strategy

| Run | Column | Tg (Min) | T (°C) | Mobile Phase A | Mobile Phase B | %B Range | Detection | Flow Rate | Injection Volume |
|---|---|---|---|---|---|---|---|---|---|
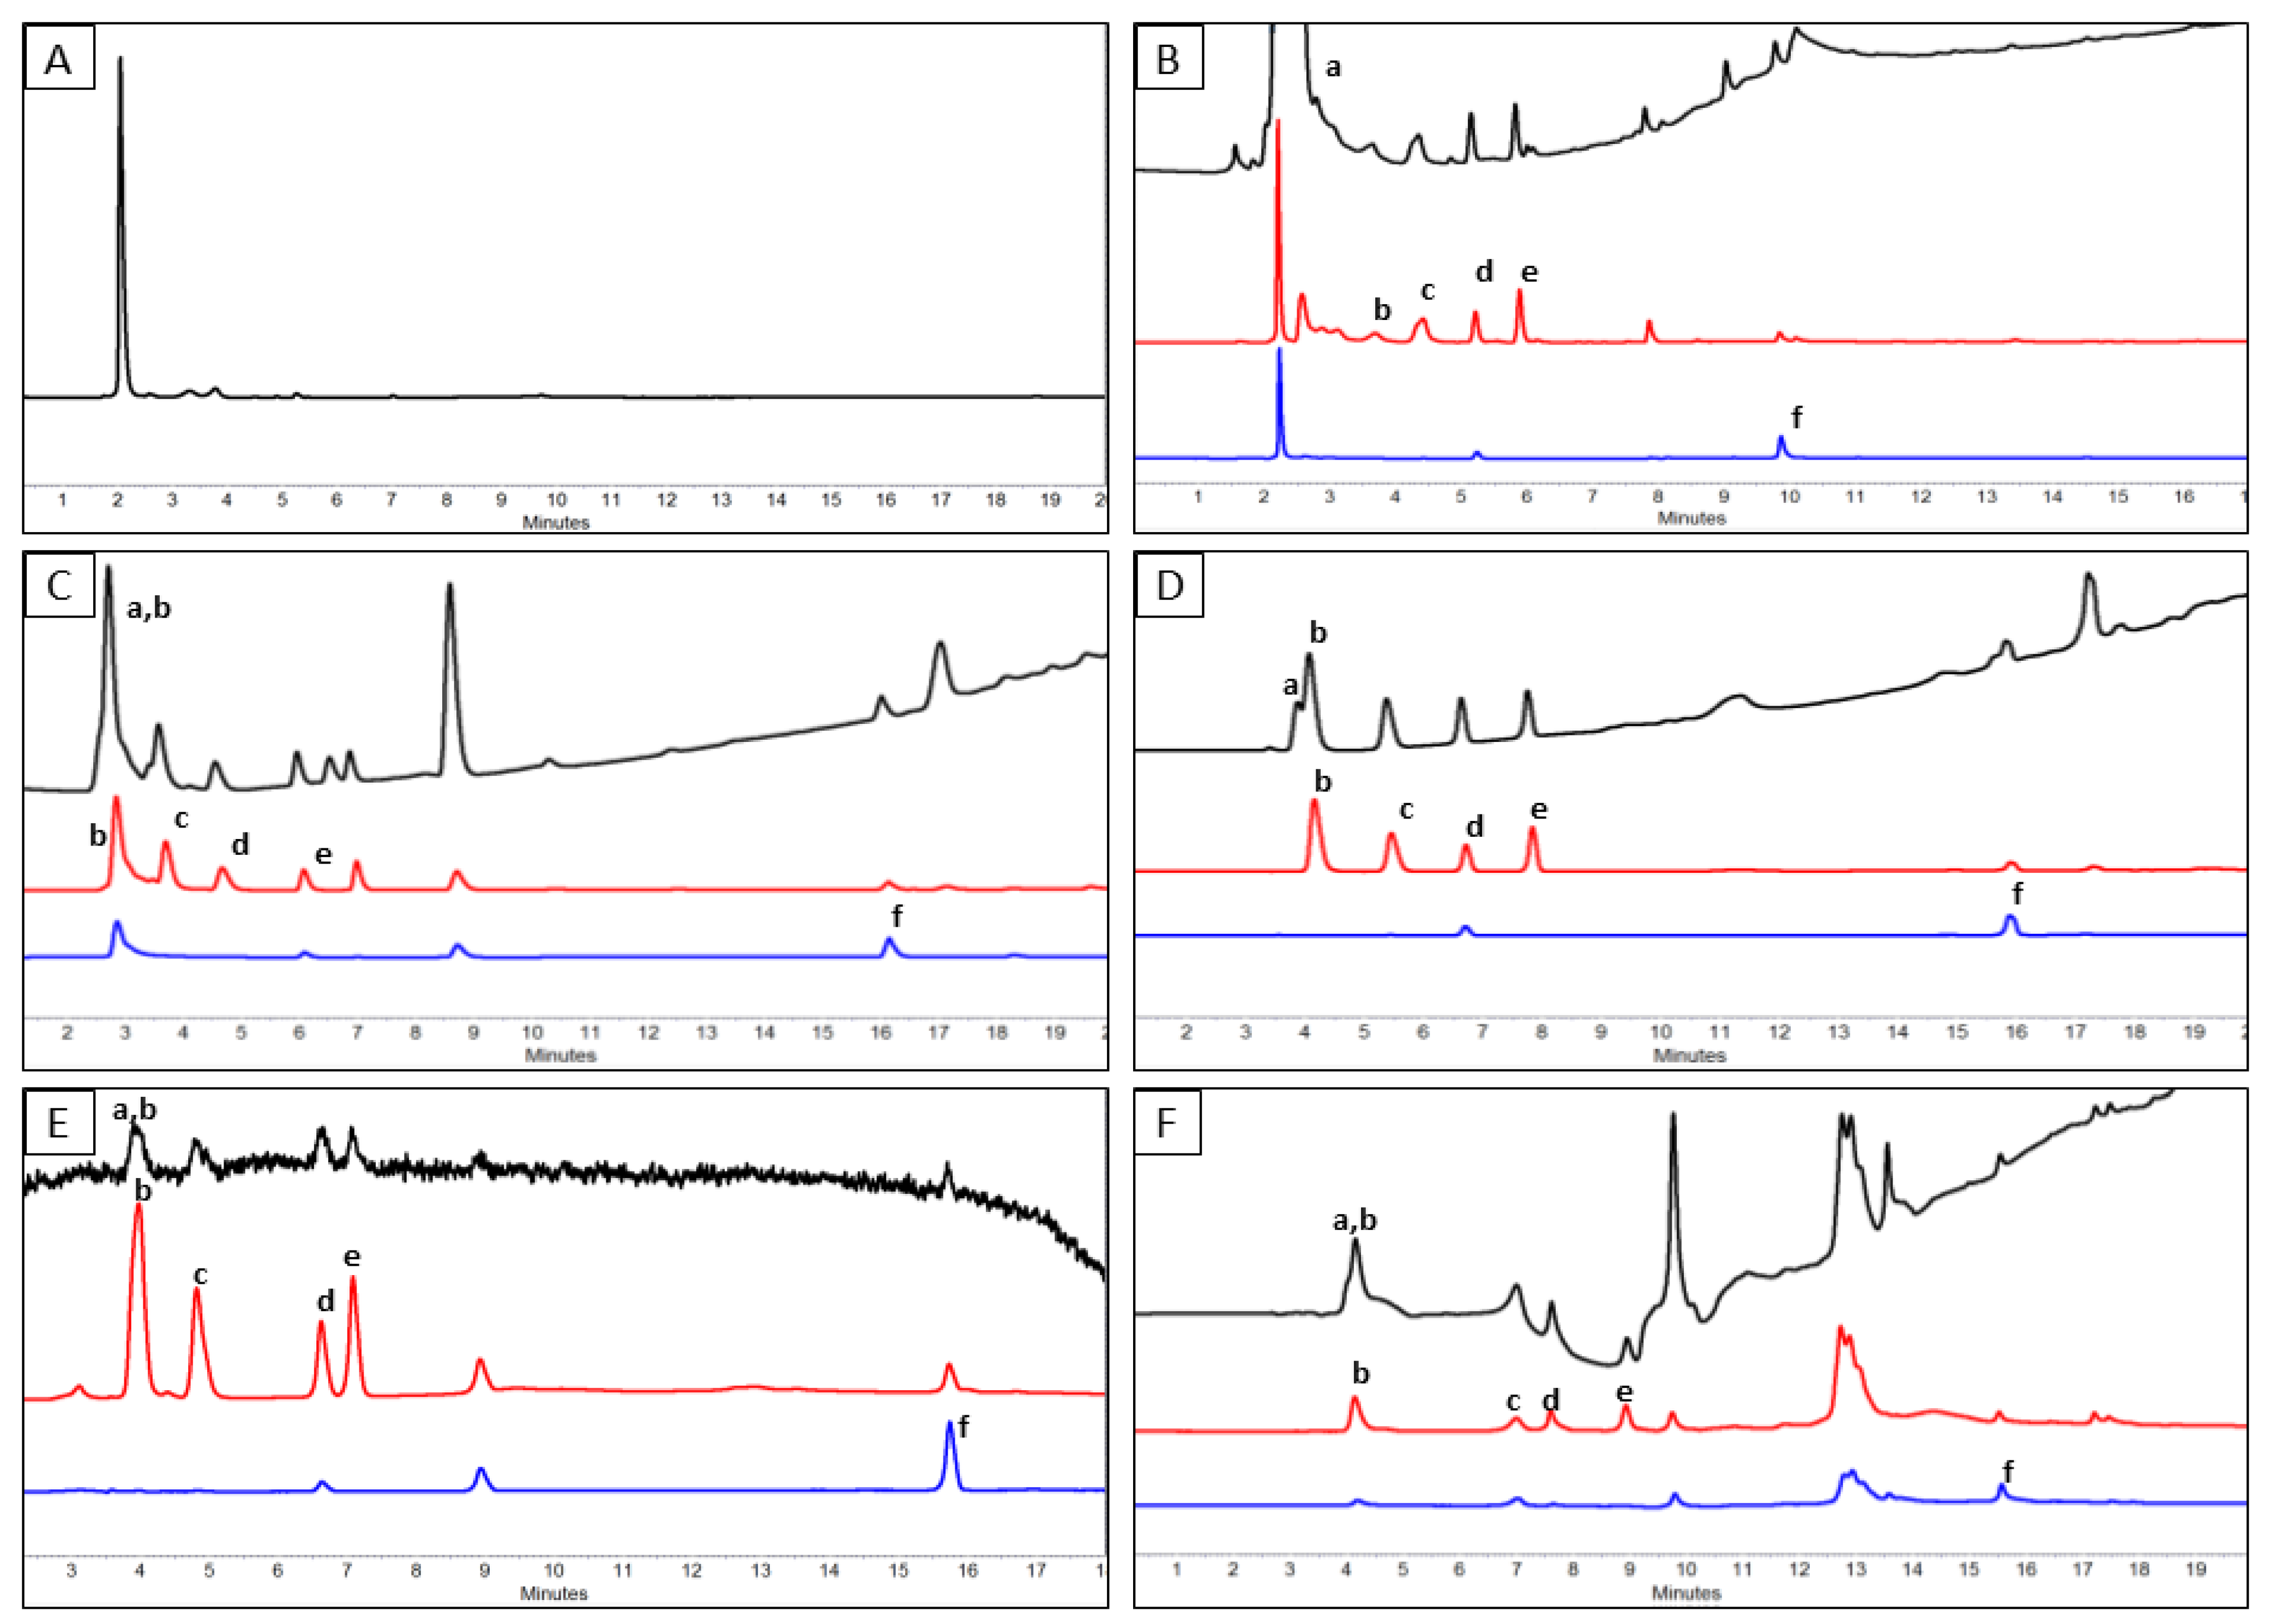
| RUN 1 (Figure 3C) | Hypersil Gold C18 | 20 | 25 | Acidified water with phosphoric acid, pH 2.6 | Methanol | 5–100% B | 205, 266, 310 (nm) | 1 (mL/min) | 25 (µL) |
| RUN 2 (Figure 3D) | Hypersil Gold C8 | 20 | 25 | ||||||
| RUN 3 (Figure 3E) | 20 | 25 | 20 mM ammonium acetate at pH 4.0 | ||||||
| RUN 4 (Figure 3F) | 20 | 25 | 5.0 mM tetrabutylammonium hydrogen sulfate at pH 8.0 | ||||||
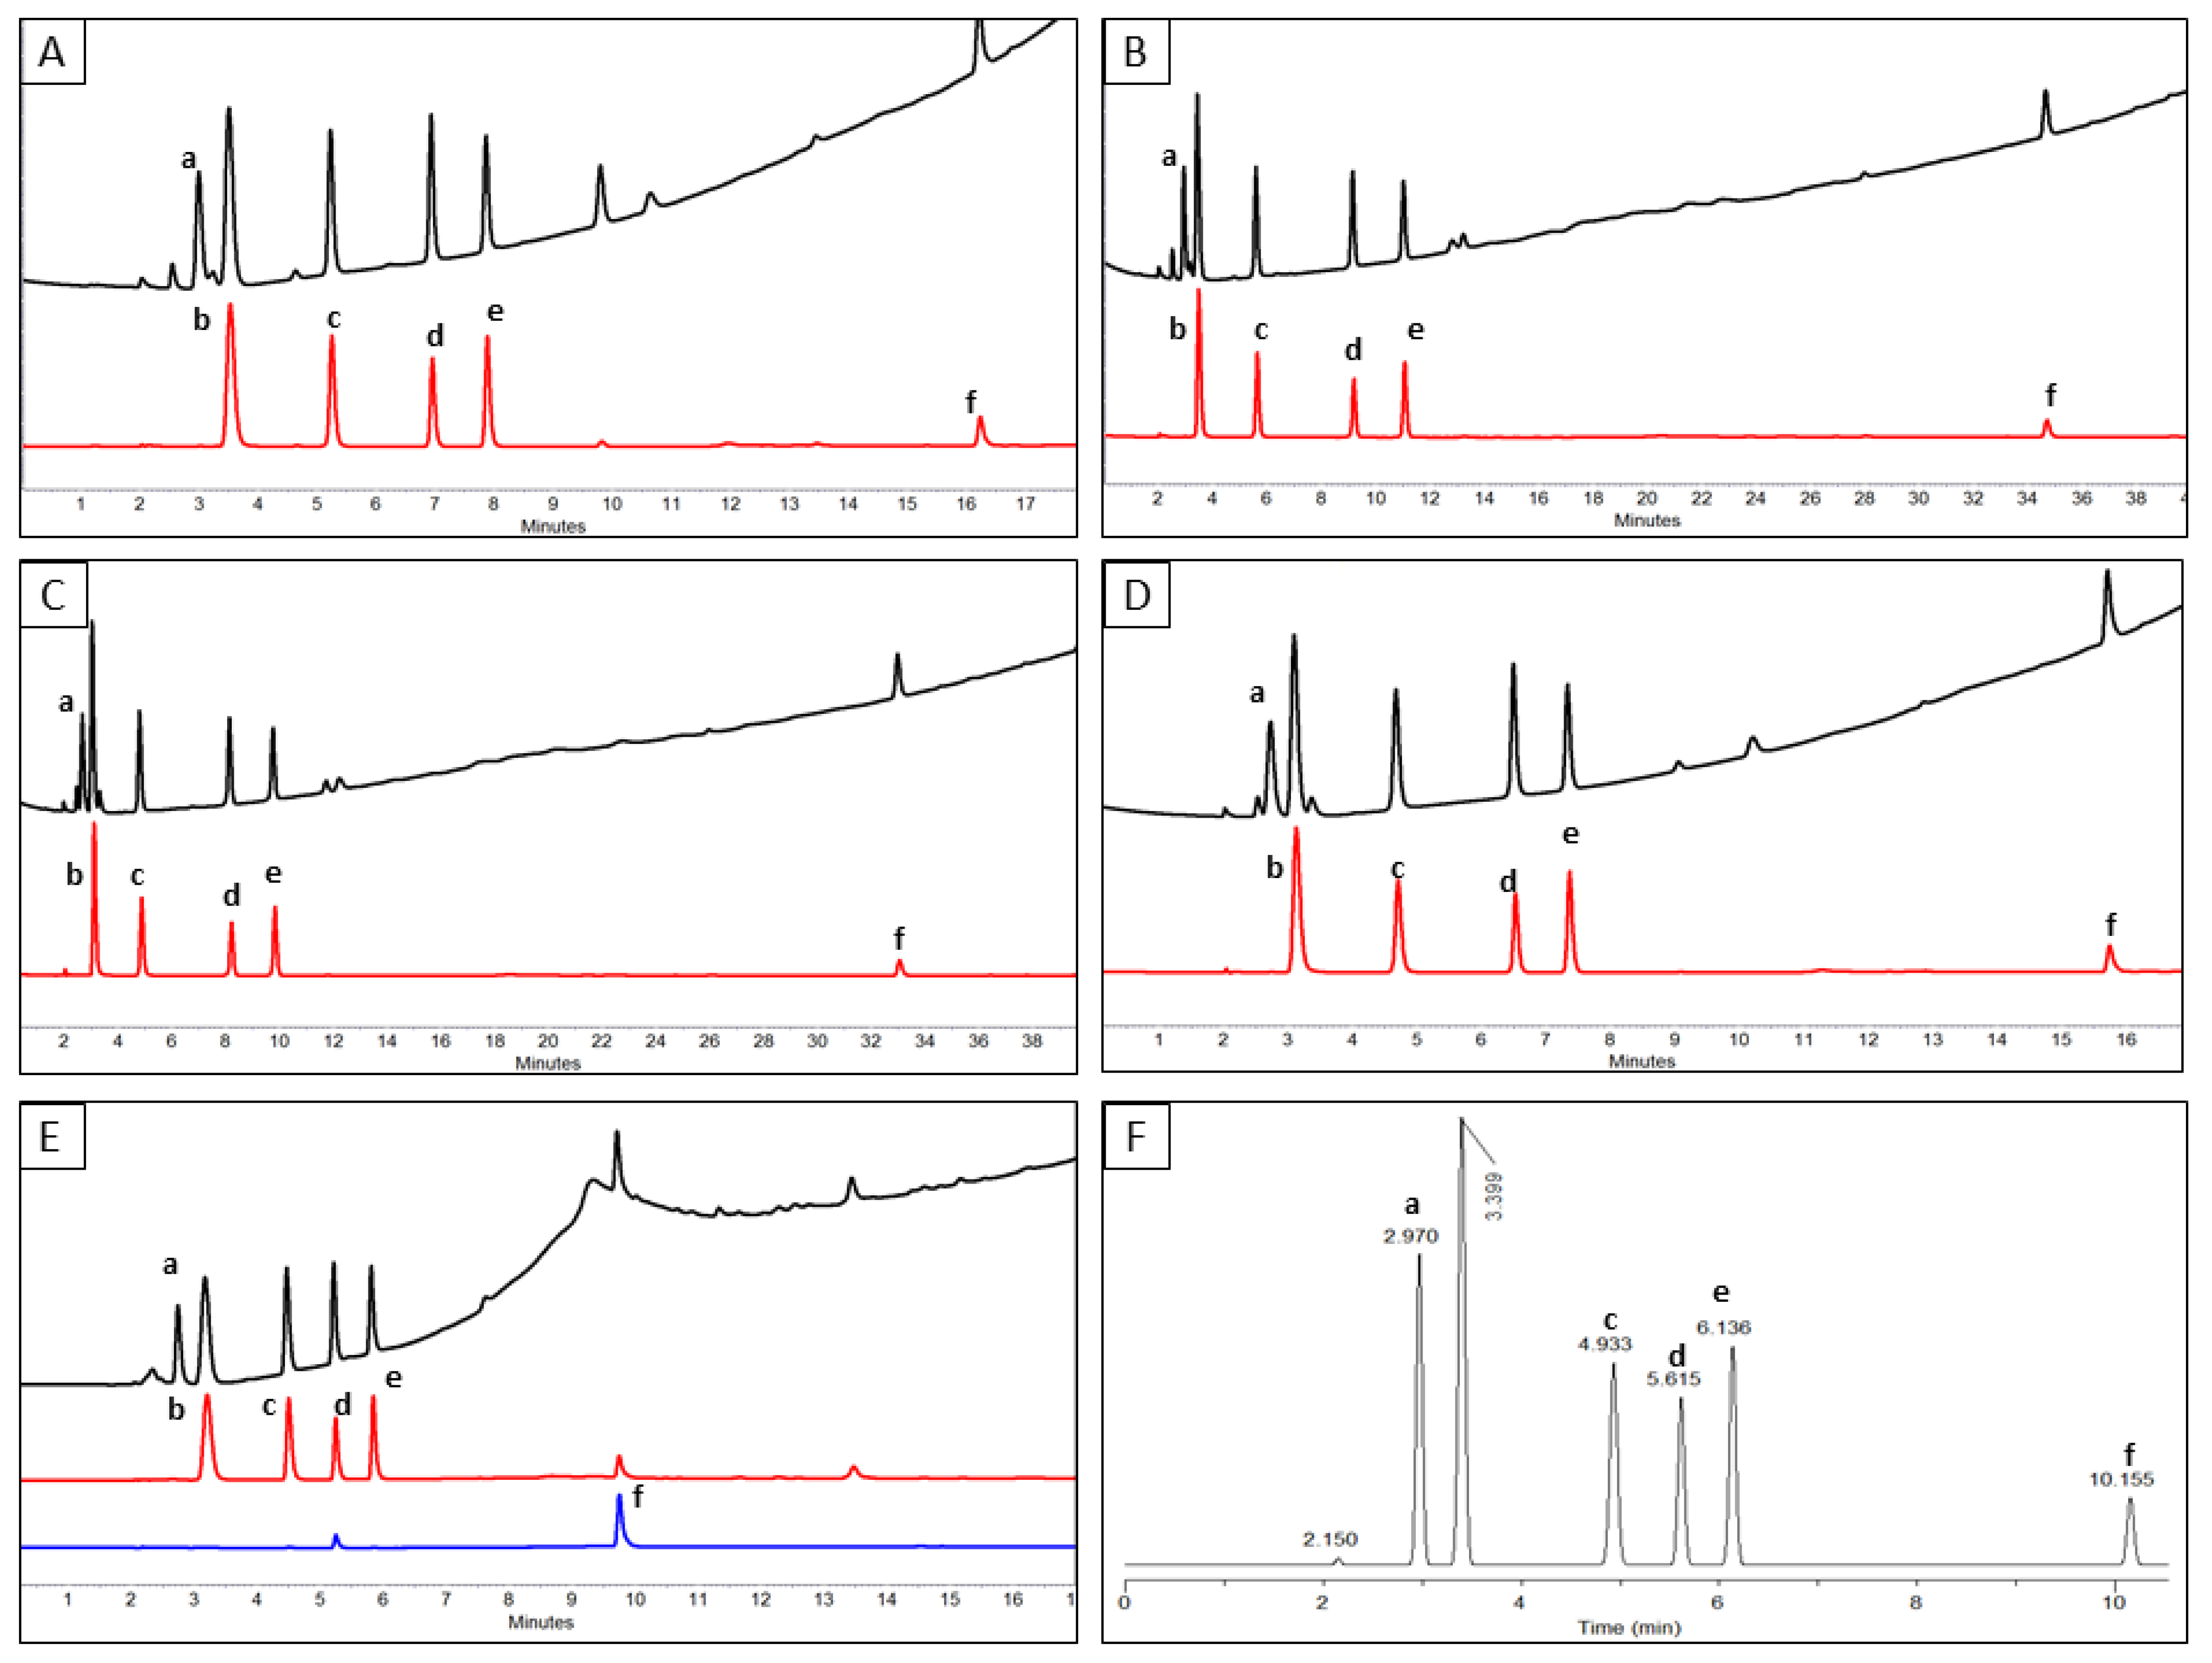
| DRYLAB1 (Figure 4A) | synergi fusion RP | 20 | 25 | Acidified water with phosphoric acid, pH 2.6 | |||||
| DRYLAB2 (Figure 4B) | 60 | 25 | |||||||
| DRYLAB3 (Figure 4C) | 60 | 45 | |||||||
| DRYLAB4 (Figure 4D) | 20 | 45 | |||||||
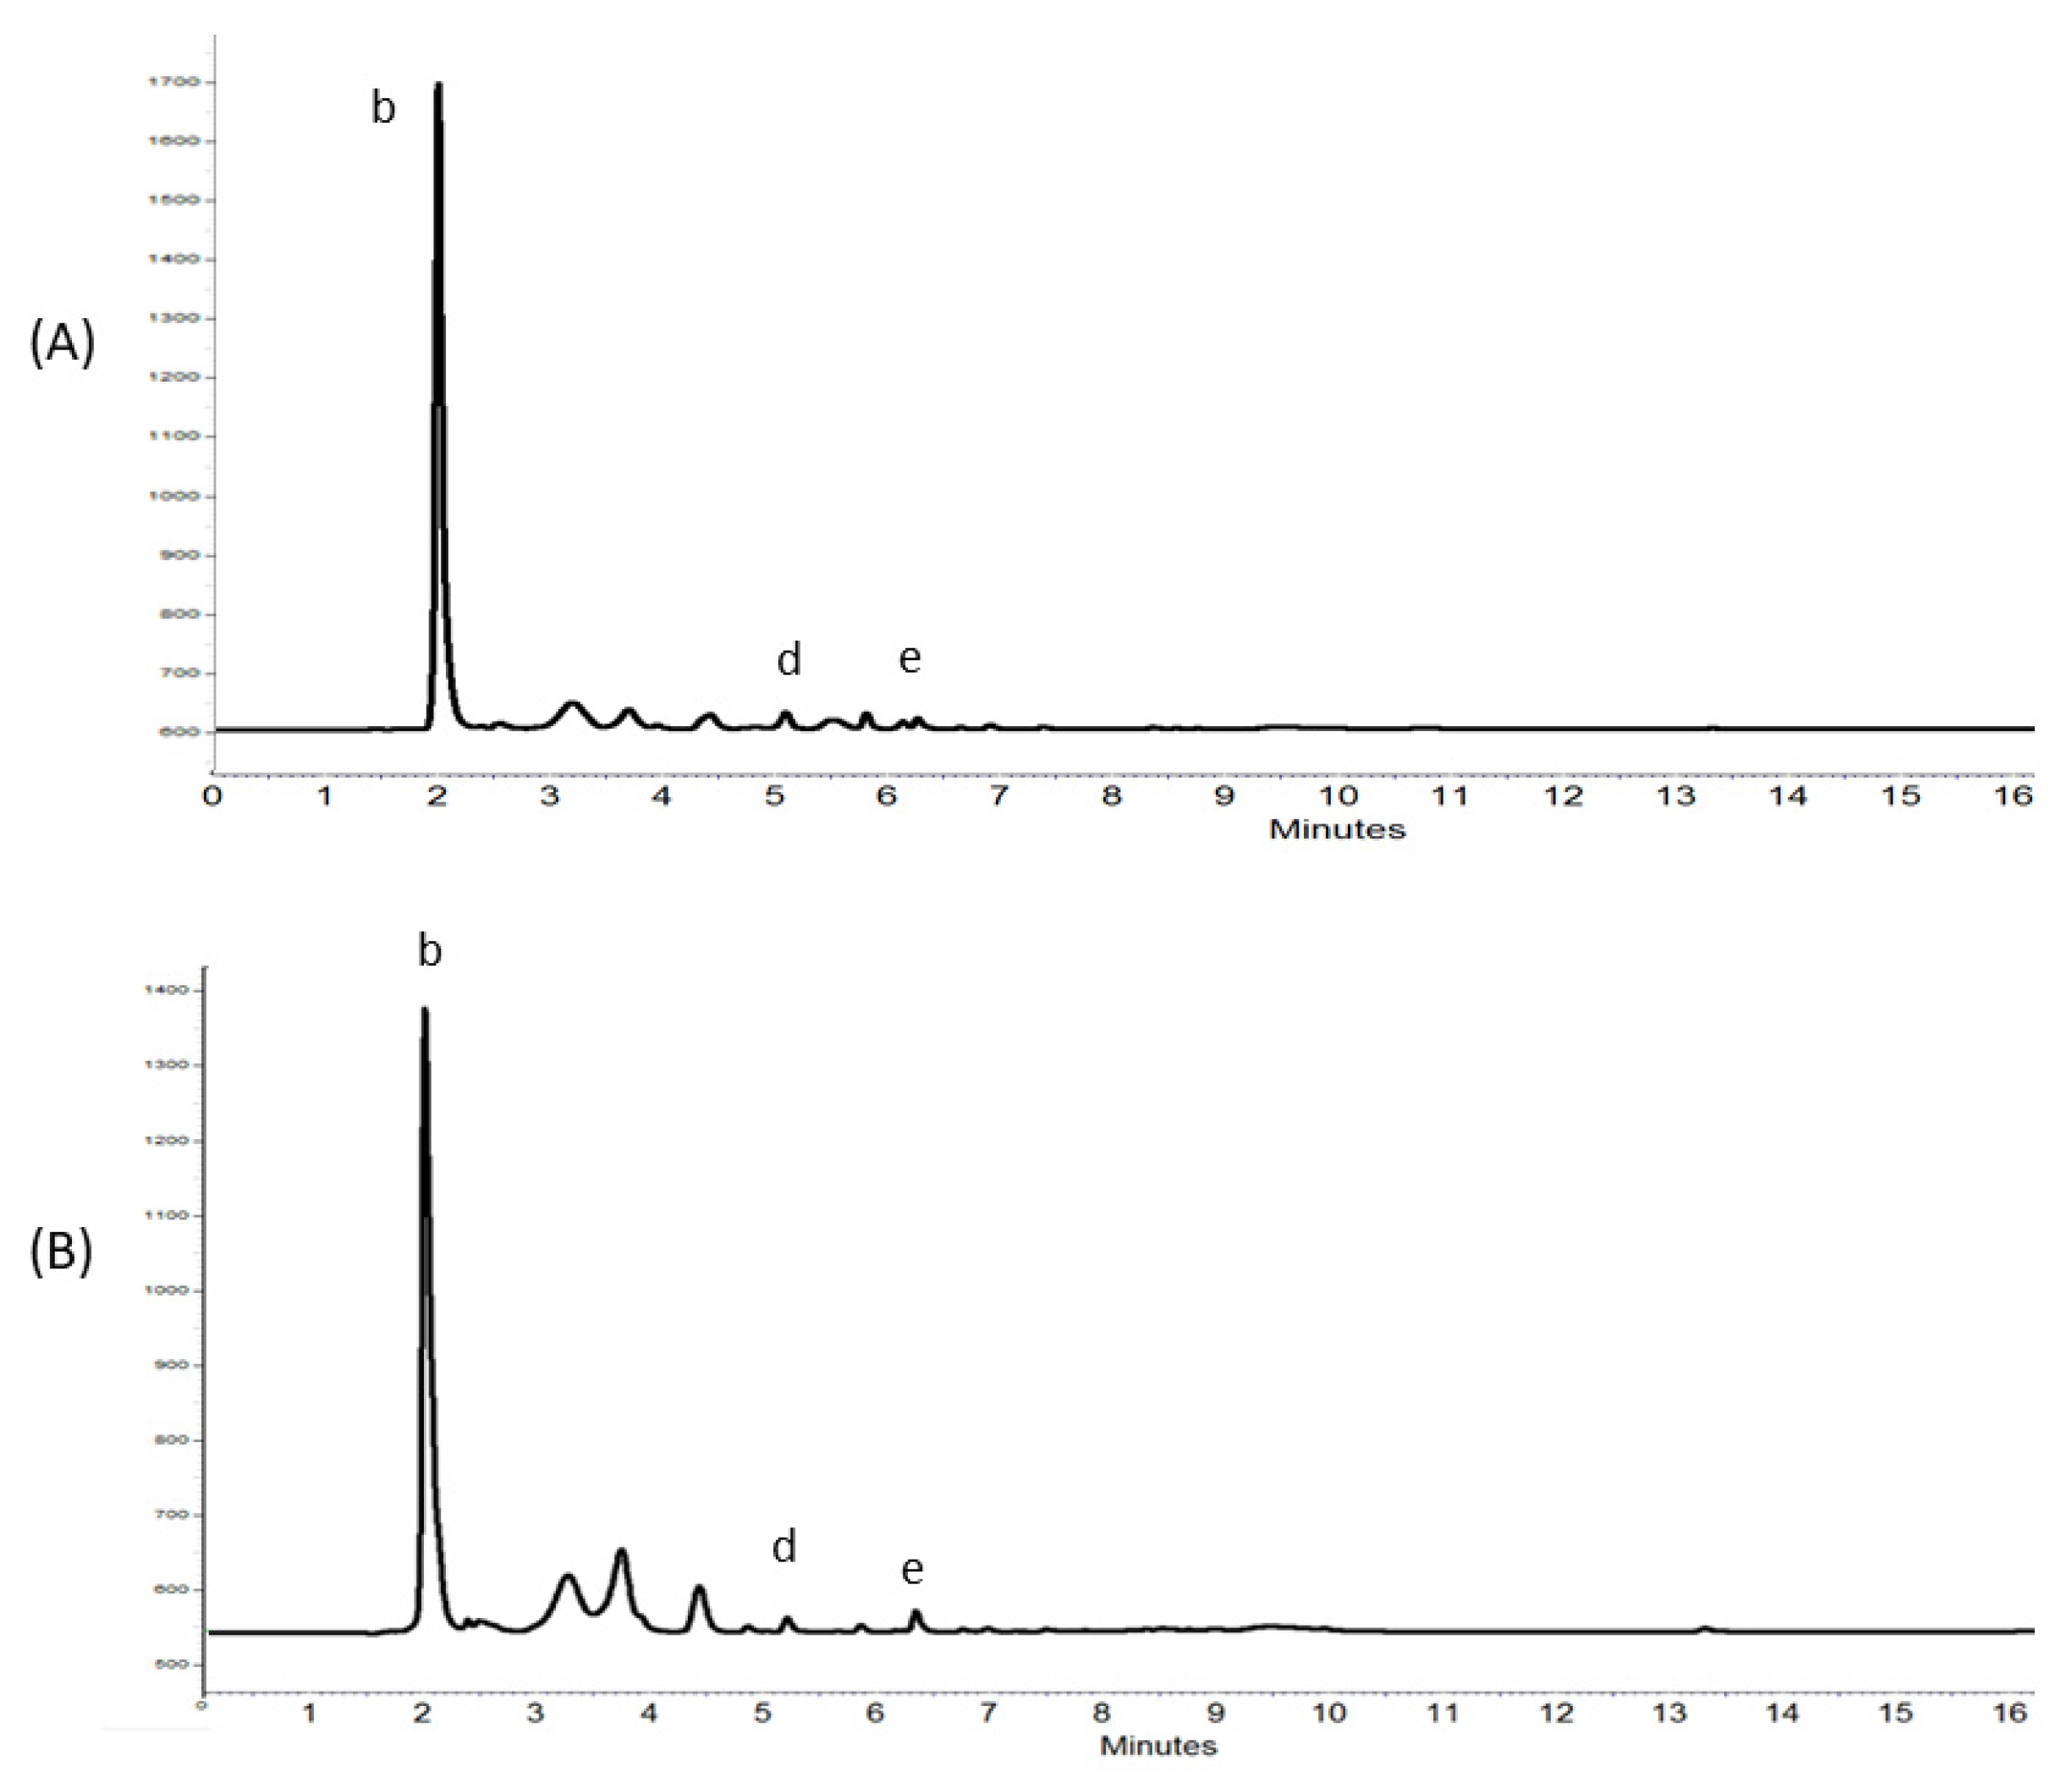
| OPTIMUM (Figure 4E) | 27 | 45 | 0–7 min (5–75% B), 7–20 min (75–100% B) |


2.2. Validation of the Newly Developed HPLC Method
2.3. Analytes Extraction from Plasma and Assay Application to Patient Plasma Samples
3. Results
3.1. Analytical Method Development
3.1.1. Preliminary Trials for the Choice of a Suitable Analytical Column
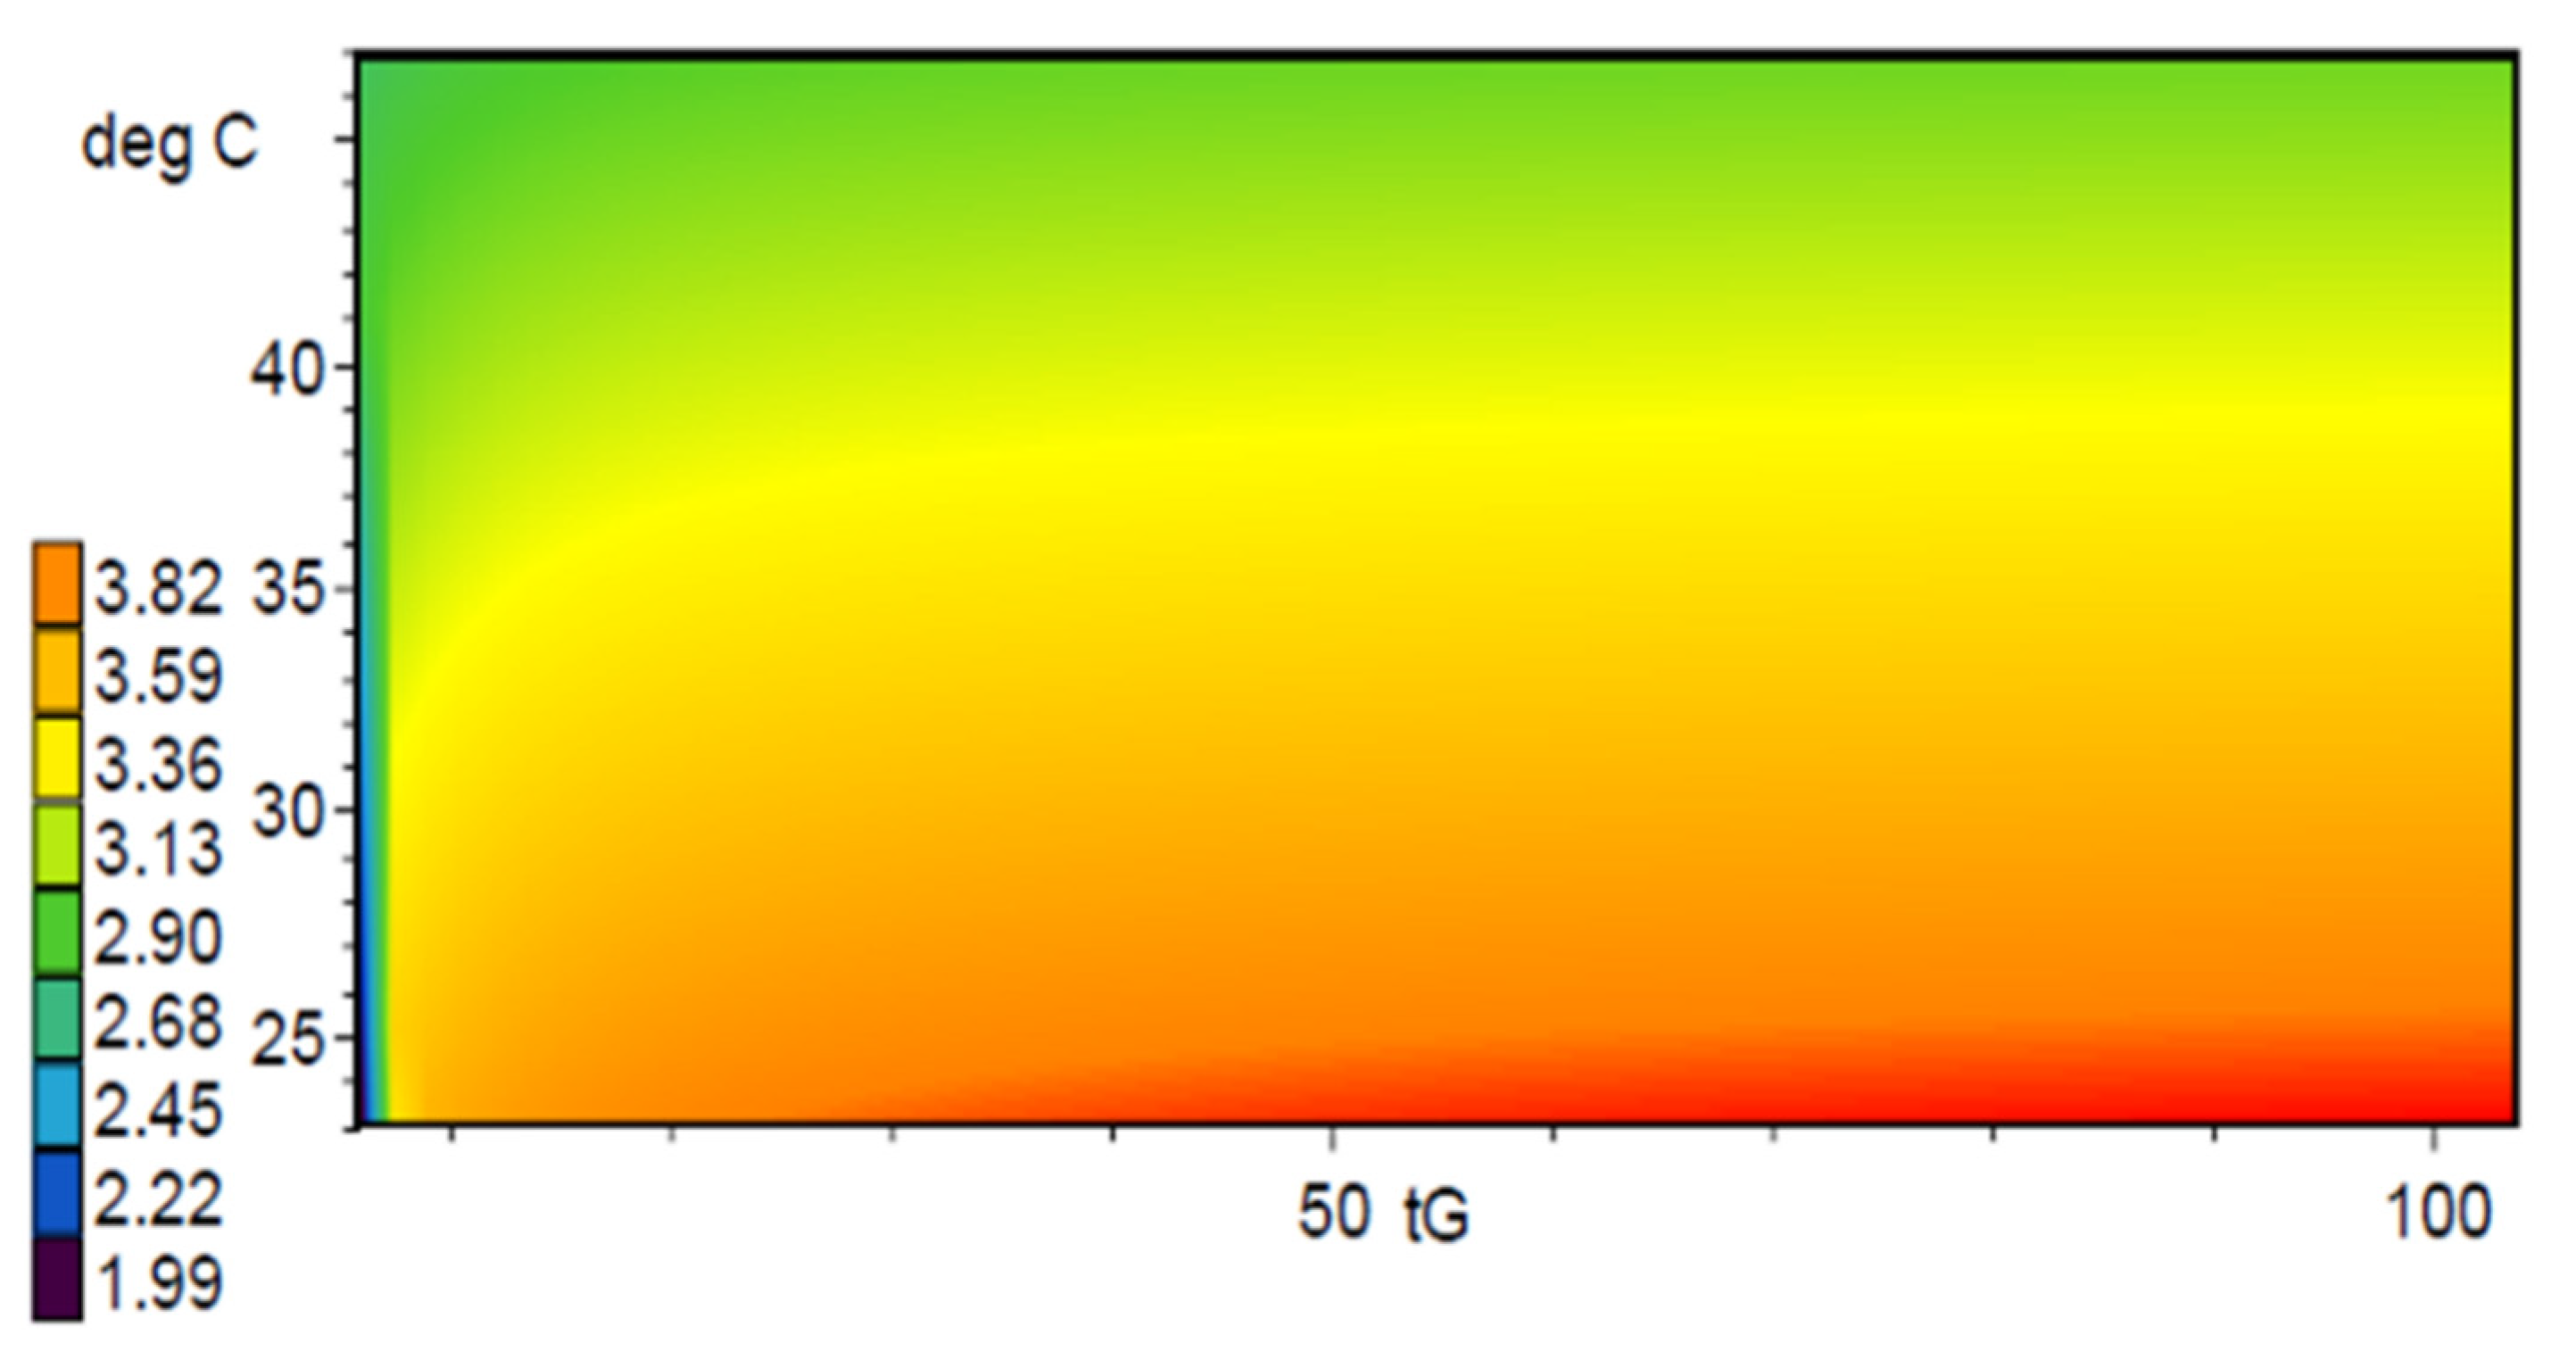
3.1.2. Computer-Assisted Analytical Method Optimization
3.2. Validation of the Developed HPLC Method
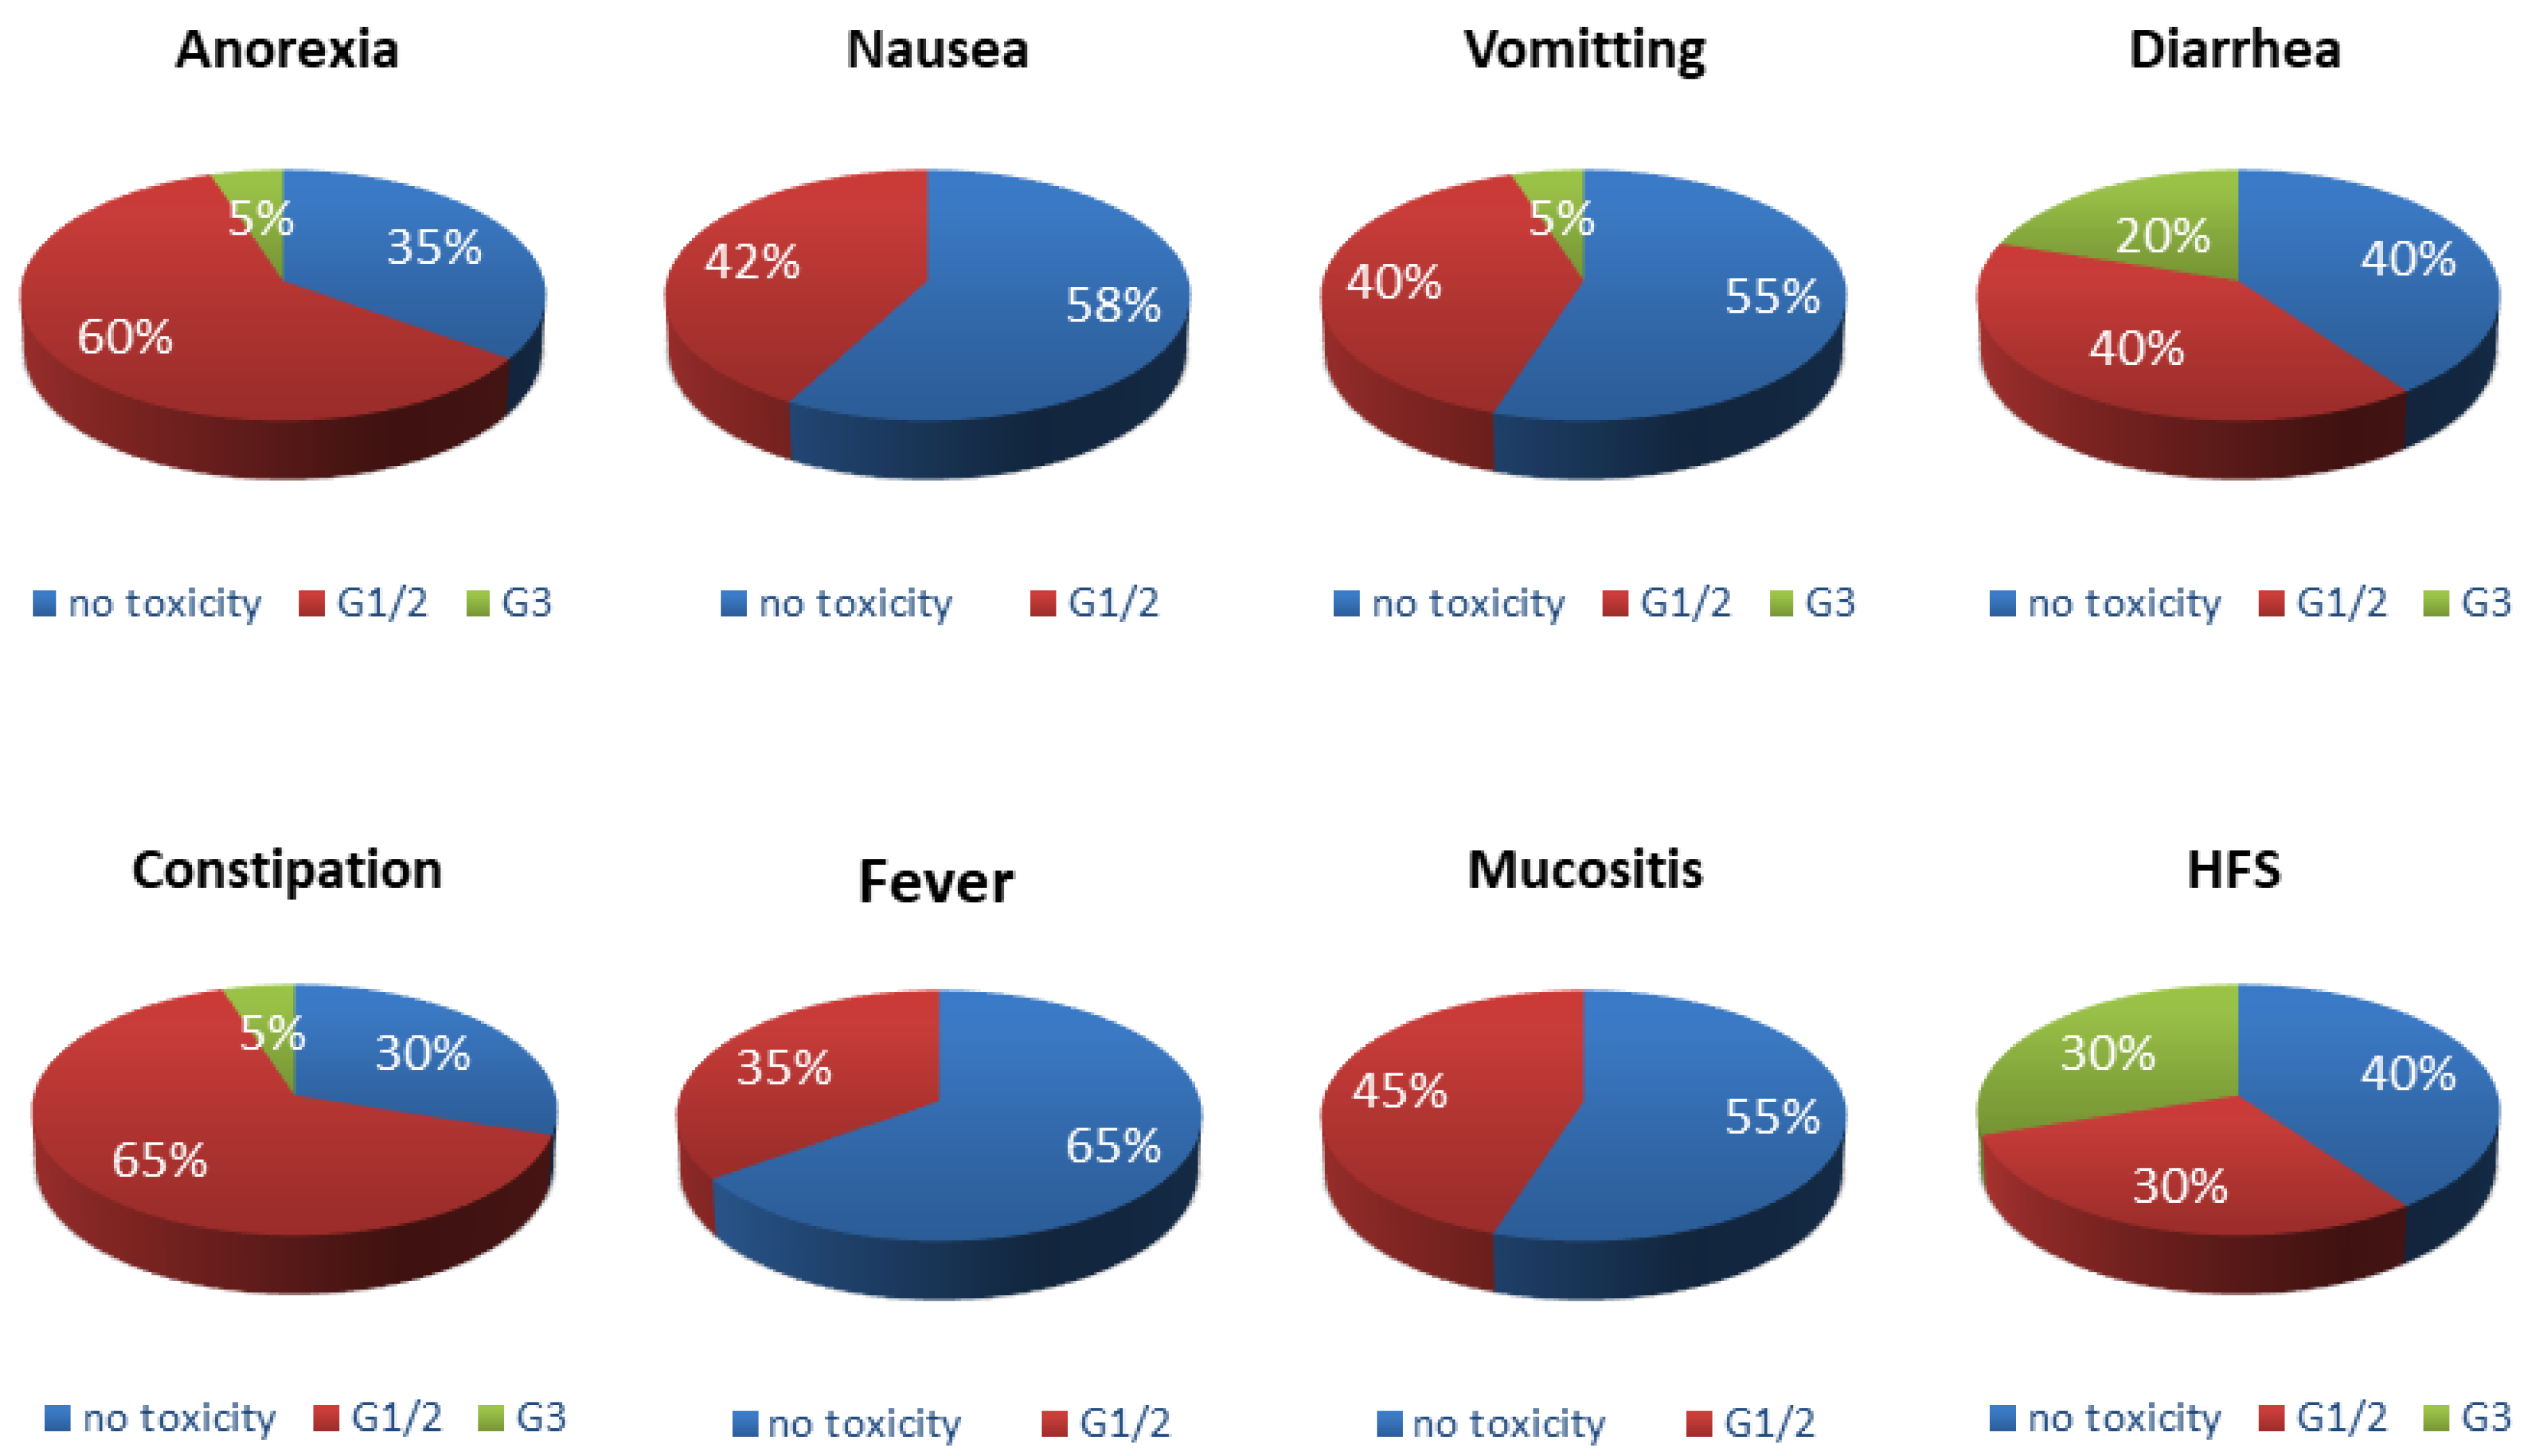
3.3. A Prospective Study on Egyptian Colorectal Cancer Patients
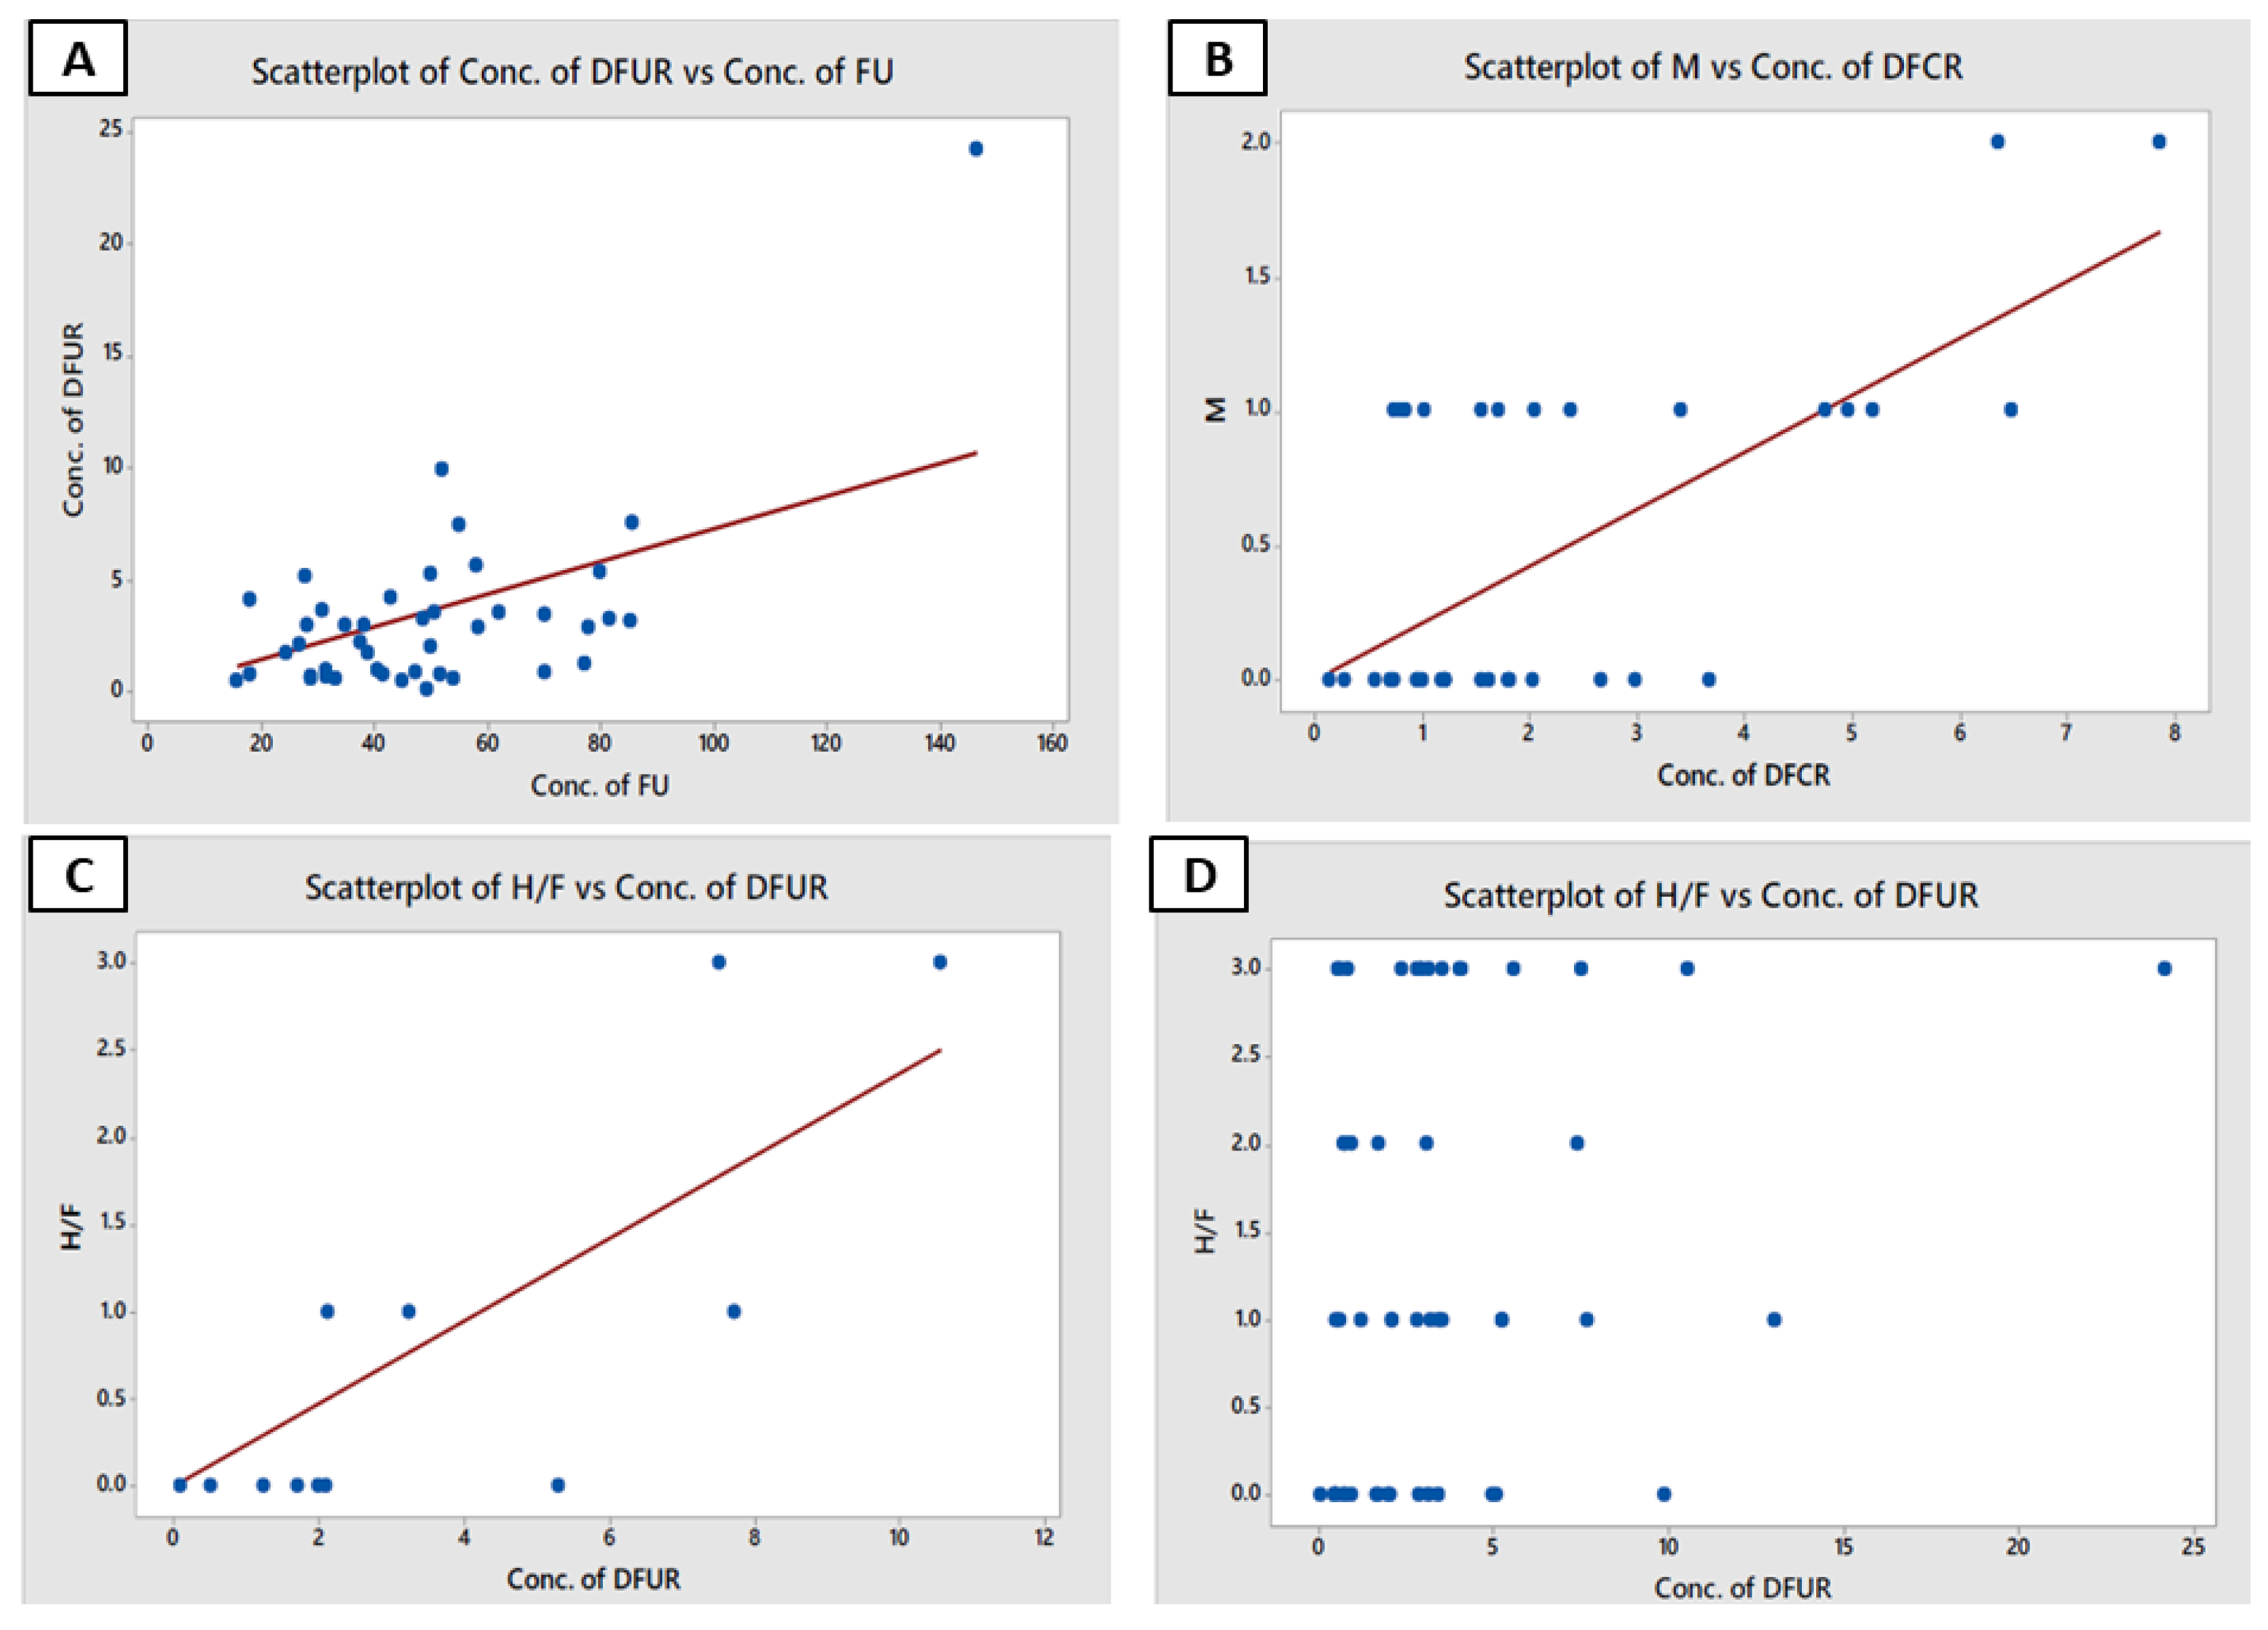
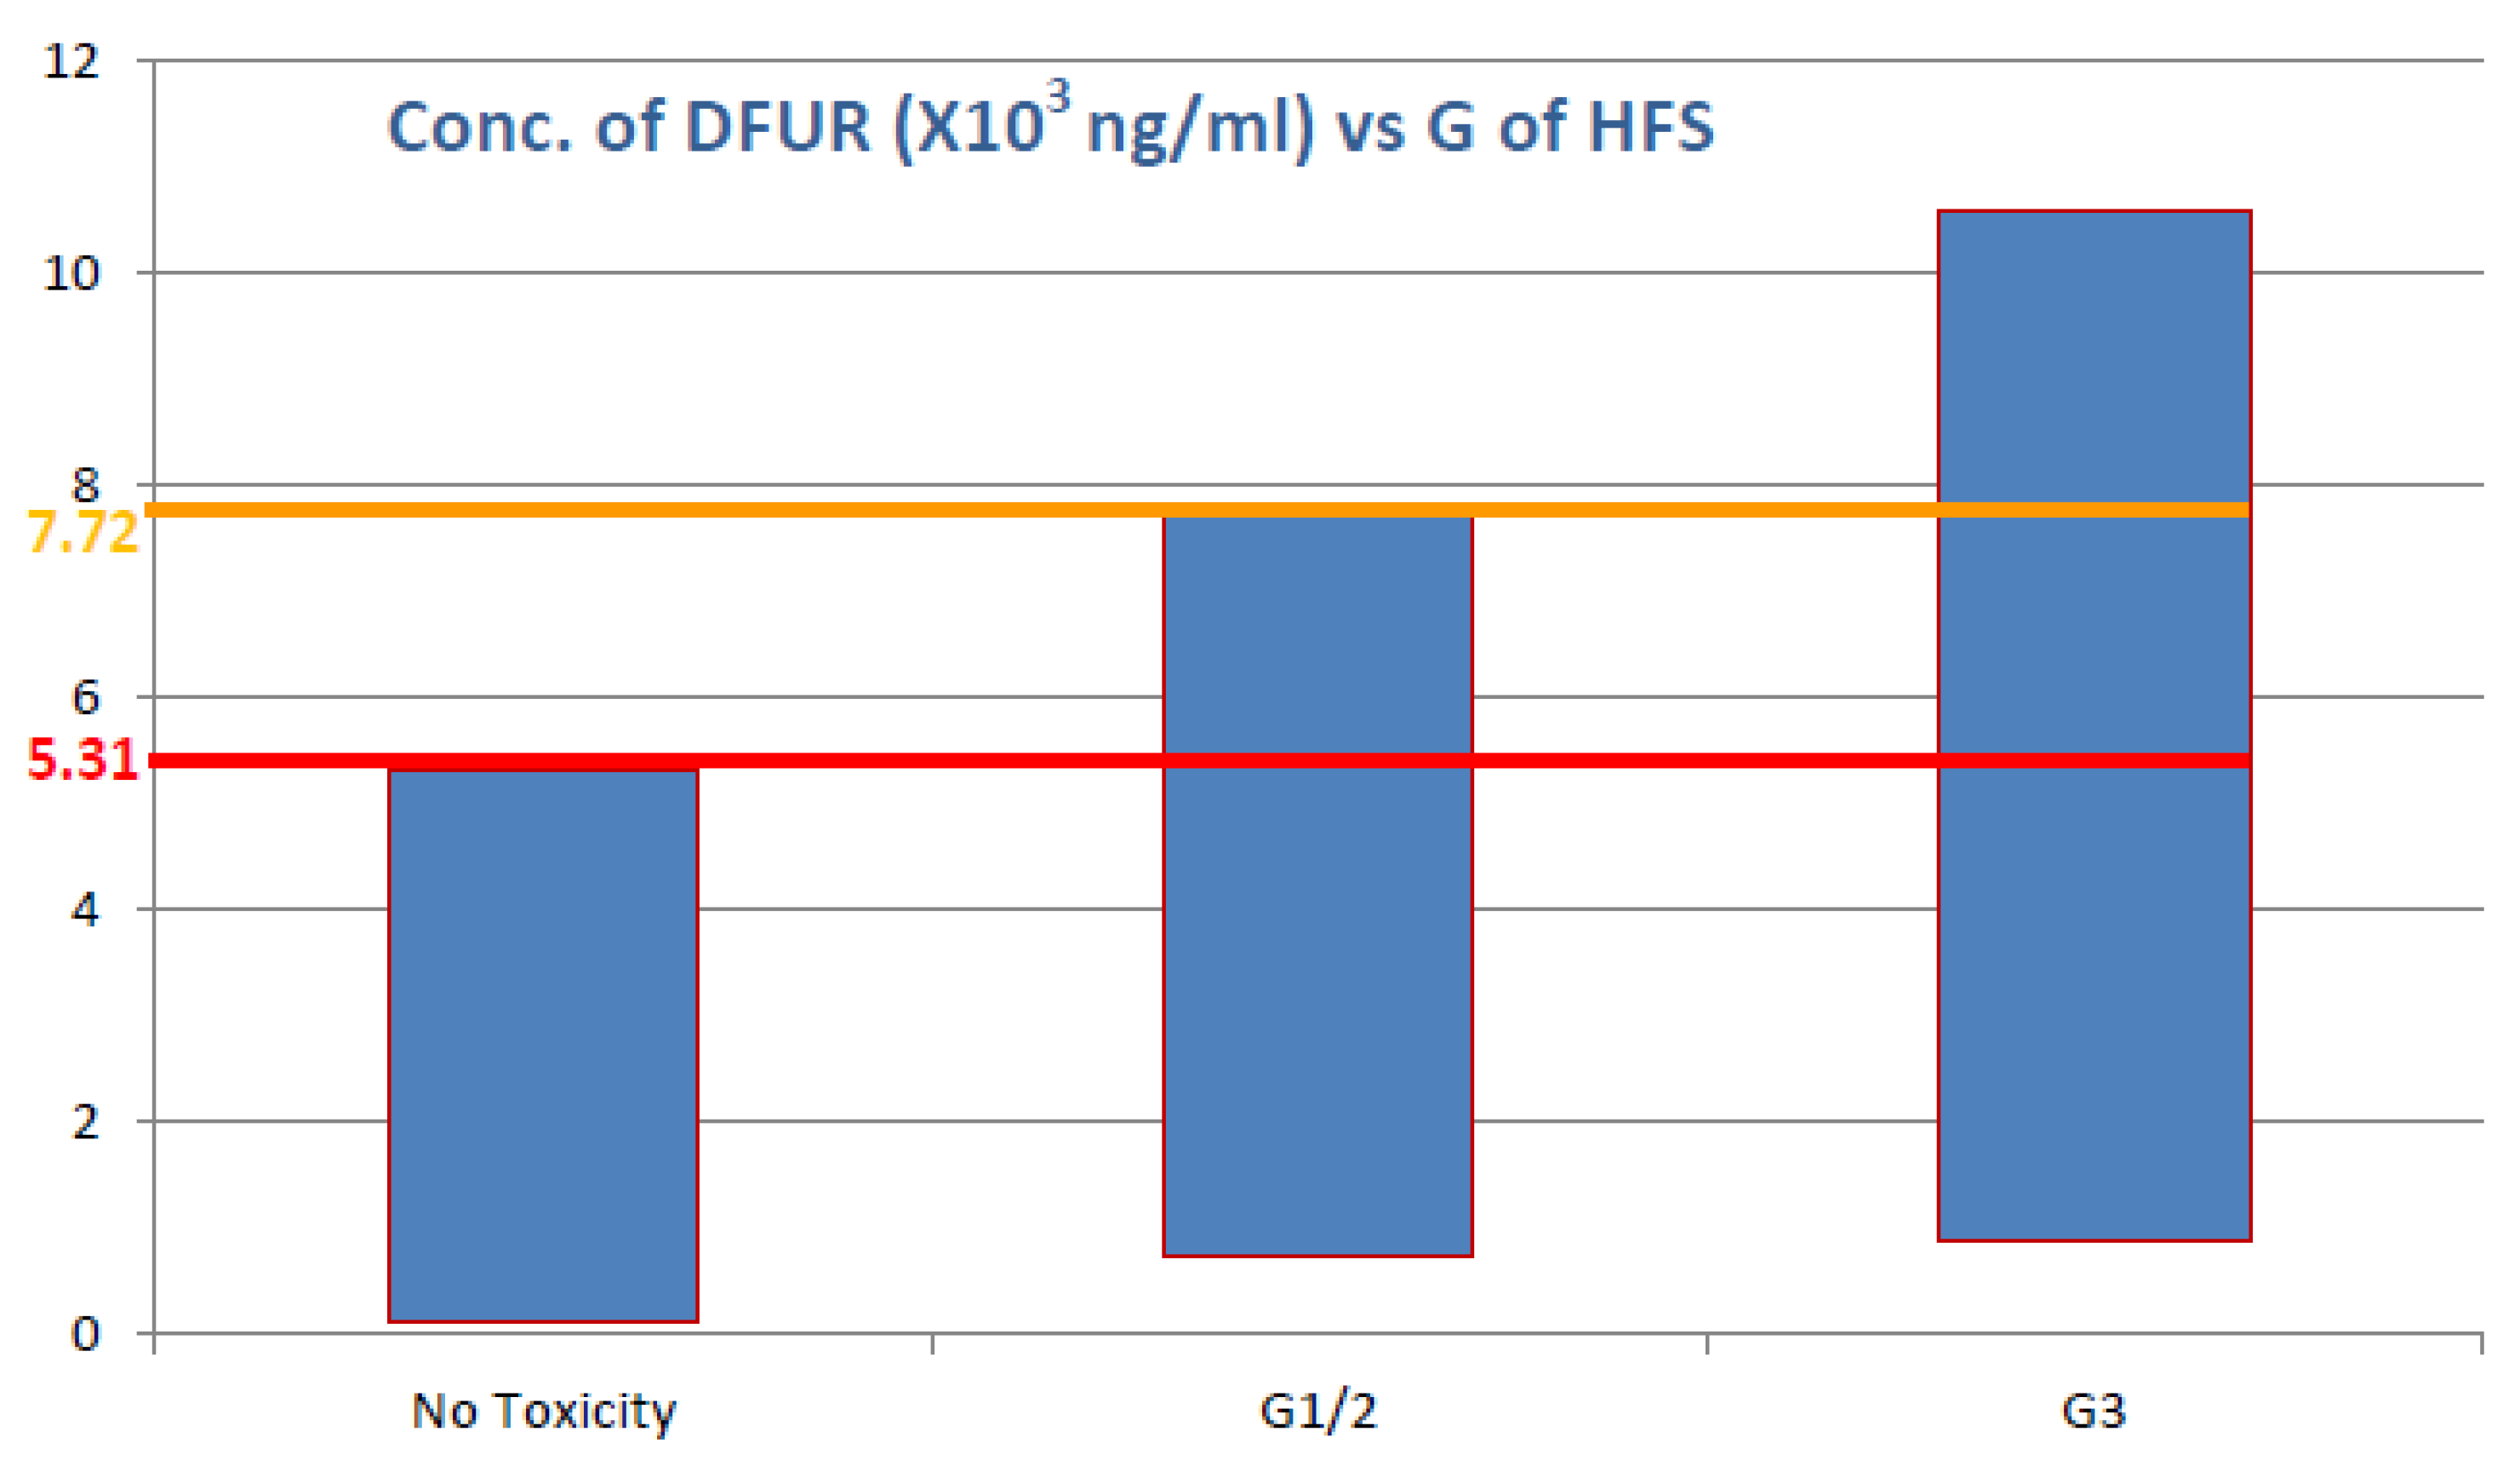
3.4. Correlations between Plasma Concentration of FU, DFCR, DFUR and Toxicity
4. Discussion
5. Conclusions
6. Recommendations
Author Contributions
Funding
Institutional Review Board Statement
Data Availability Statement
Acknowledgments
Conflicts of Interest
Abbreviations
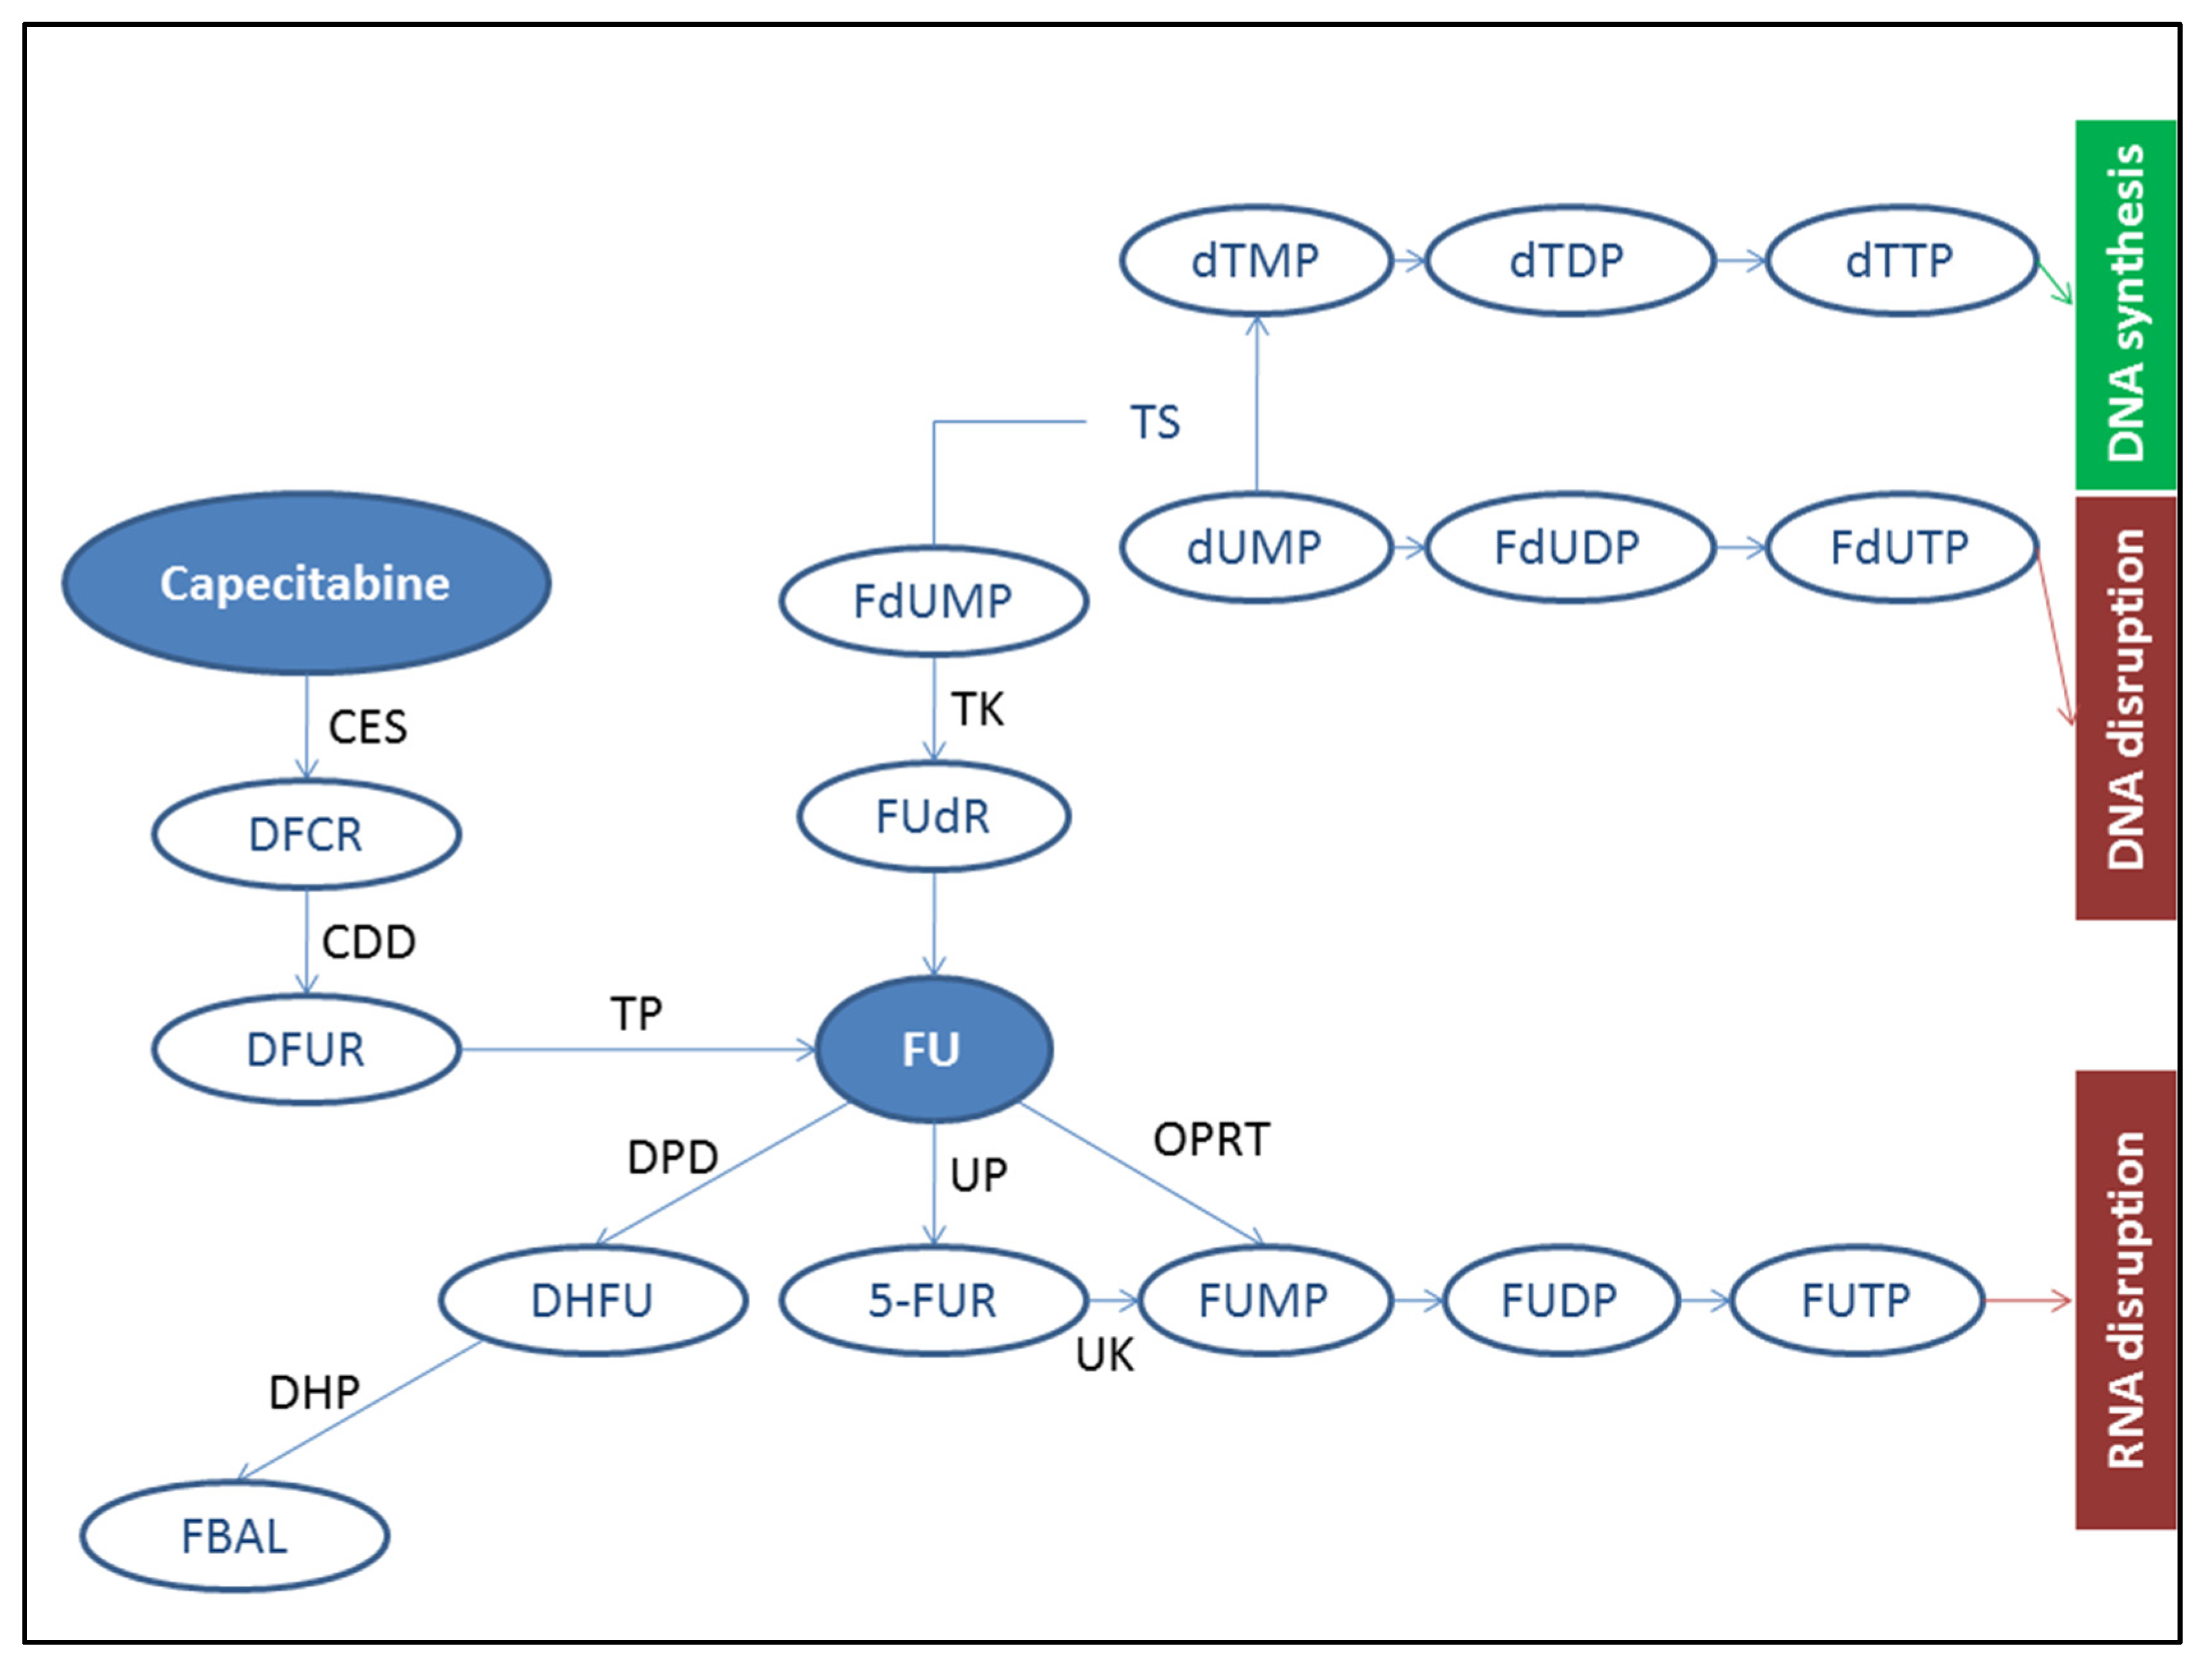
| CCB | Capecitabine |
| CDD | cytidine deaminase |
| CLU | 5-Chlorouracil |
| DFCR | 5′-deoxy-5-fluorocytidine |
| CES | carboxylesterase |
| DFUR | 5′-deoxy-5-fluorouridine |
| DHFU | 5,6-dihydro-5-fluorouracil |
| DPD | Dihydropyrimidine Dehydrogenase |
| HPLC | high-pressure liquid chromatography |
| FBAL | α-fluoro-β-alanine |
| FU | 5-Fluorouracil |
| FUPA | 5-fluoro-ureidopropionic acid |
| IS | internal standard |
| LC | liquid chromatography |
| SNPs | single nucleotide polymorphisms |
| TP | thymidine phosphorylase |
References
- EMA. Capecitabine Teva. Available online: https://www.ema.europa.eu/en/medicines/human/EPAR/capecitabine-teva (accessed on 5 February 2023).
- Su, C.; Olsen, K.A.; Bond, C.E.; Whitehall, V.L.J. The Efficacy of Using Patient-Derived Organoids to Predict Treatment Response in Colorectal Cancer. Cancers 2023, 15, 805. [Google Scholar] [CrossRef] [PubMed]
- Czejka, M.; Schueller, J.; Hauer, K.; Ostermann, E. Pharmacokinetics and Metabolism of Irinotecan Combined with Capecitabine in Patients with Advanced Colorectal Cancer. Anticancer Res. 2005, 25, 2985–2990. [Google Scholar] [PubMed]
- Ge, C.; Huang, X.; Zhang, S.; Yuan, M.; Tan, Z.; Xu, C.; Jie, Q.; Zhang, J.; Zou, J.; Zhu, Y.; et al. In Vitro Co-Culture Systems of Hepatic and Intestinal Cells for Cellular Pharmacokinetic and Pharmacodynamic Studies of Capecitabine against Colorectal Cancer. Cancer Cell Int. 2023, 23, 14. [Google Scholar] [CrossRef] [PubMed]
- Paolo, A.D.; Danesi, R.; Ciofi, L.; Vannozzi, F.; Bocci, G.; Lastella, M.; Amatori, F.; Martelloni, B.M.; Ibrahim, T.; Amadori, D.; et al. Improved Analysis of 5-Fluorouracil and 5,6-Dihydro-5-Fluorouracil by HPLC With Diode Array Detection for Determination of Cellular Dihydropyrimidine Dehydrogenase Activity and Pharmacokinetic Profiling. Ther. Drug Monit. 2005, 27, 362–368. [Google Scholar] [CrossRef] [PubMed]
- Zhang, X.; Sun, B.; Lu, Z. Evaluation of Clinical Value of Single Nucleotide Polymorphisms of Dihydropyrimidine Dehydrogenase Gene to Predict 5-Fluorouracil Toxicity in 60 Colorectal Cancer Patients in China. Int. J. Med. Sci. 2013, 10, 894–902. [Google Scholar] [CrossRef] [PubMed]
- Alqahtani, S.; Alzaidi, R.; Alsultan, A.; Asiri, A.; Asiri, Y.; Alsaleh, K. Clinical Pharmacokinetics of Capecitabine and Its Metabolites in Colorectal Cancer Patients. Saudi Pharm. J. 2022, 30, 527–531. [Google Scholar] [CrossRef] [PubMed]
- Shindoh, H.; Kawashima, A.; Shishido, N.; Nakano, K.; Kobayashi, K.; Horii, I. Relationship between AUC of 5’-DFUR and Toxicity of Capecitabine, Fluoropyrimidine Carbamate Analogs, and 5’-DFUR in Monkeys, Mice, and Rats. J. Toxicol. Sci. 2006, 31, 265–285. [Google Scholar] [CrossRef] [PubMed]
- Gieschke, R.; Burger, H.-U.; Reigner, B.; Blesch, K.S.; Steimer, J.-L. Population Pharmacokinetics and Concentration-Effect Relationships of Capecitabine Metabolites in Colorectal Cancer Patients. Br. J. Clin. Pharmacol. 2003, 55, 252–263. [Google Scholar] [CrossRef] [PubMed]
- Pivot, X.; Chamorey, E.; Guardiola, E.; Magné, N.; Thyss, A.; Otto, J.; Giroux, B.; Mouri, Z.; Schneider, M.; Milano, G. Phase I and Pharmacokinetic Study of the Association of Capecitabine-Cisplatin in Head and Neck Cancer Patients. Ann. Oncol. Off. J. Eur. Soc. Med. Oncol. 2003, 14, 1578–1586. [Google Scholar] [CrossRef] [PubMed]
- Vainchtein, L.D.; Rosing, H.; Schellens, J.H.M.; Beijnen, J.H. A New, Validated HPLC-MS/MS Method for the Simultaneous Determination of the Anti-Cancer Agent Capecitabine and Its Metabolites: 5’-Deoxy-5-Fluorocytidine, 5’-Deoxy-5-Fluorouridine, 5-Fluorouracil and 5-Fluorodihydrouracil, in Human Plasma. Biomed. Chromatogr. BMC 2010, 24, 374–386. [Google Scholar] [CrossRef] [PubMed]
- Guichard, S.M.; Mayer, I.; Jodrell, D.I. Simultaneous Determination of Capecitabine and Its Metabolites by HPLC and Mass Spectrometry for Preclinical and Clinical Studies. J. Chromatogr. B Analyt. Technol. Biomed. Life. Sci. 2005, 826, 232–237. [Google Scholar] [CrossRef] [PubMed]
- Dhananjeyan, M.R.; Liu, J.; Bykowski, C.; Trendel, J.A.; Sarver, J.G.; Ando, H.; Erhardt, P.W. Rapid and Simultaneous Determination of Capecitabine and Its Metabolites in Mouse Plasma, Mouse Serum, and in Rabbit Bile by High-Performance Liquid Chromatography. J. Chromatogr. A 2007, 1138, 101–108. [Google Scholar] [CrossRef] [PubMed]
- Zufía, L.; Aldaz, A.; Giráldez, J. Simple Determination of Capecitabine and Its Metabolites by Liquid Chromatography with Ultraviolet Detection in a Single Injection. J. Chromatogr. B Analyt. Technol. Biomed. Life. Sci. 2004, 809, 51–58. [Google Scholar] [CrossRef] [PubMed]
- Phenomenex. HPLC Column. Synergi. Available online: https://www.phenpreview.com/products/detail/Synergi (accessed on 5 February 2023).
- Reversed-Phase Chromatography for Neutral Samples. In Introduction to Modern Liquid Chromatography; John Wiley & Sons, Ltd.: Hoboken, NJ, USA, 2009; pp. 253–301. ISBN 978-0-470-50818-3.
- Wiley. Modern HPLC for Practicing Scientists. Available online: https://www.wiley.com/en-be/Modern+HPLC+for+Practicing+Scientists+-p-9780471973102 (accessed on 20 June 2023).
- Wiley. Practical HPLC Method Development. Available online: https://onlinelibrary.wiley.com/doi/book/10.1002/9781118592014 (accessed on 20 June 2023).
- Hanafi, R.; Spahn, H.; Mahran, L.; Heikal, O.; Hanafy, A.; Rieger, H.-J.; Molnár, I.; Aboul-Enein, H. Computer-Assisted HPLC Method Development for Determination of Tolmetin and Possible Kinetic Modulators of Its Oxidative Metabolism in Vivo. Chromatographia 2012, 469–477. [Google Scholar] [CrossRef]
- EMA ICH Q8 (R2) Pharmaceutical Development—Scientific Guideline. Available online: https://www.ema.europa.eu/en/ich-q8-r2-pharmaceutical-development-scientific-guideline (accessed on 29 June 2023).
- Farkouh, A.; Ettlinger, D.; Schueller, J.; Georgopoulos, A.; Scheithauer, W.; Czejka, M. A Rapid and Simple HPLC Assay for Quantification of Capecitabine for Drug Monitoring Purposes. Anticancer Res. 2010, 30, 5207–5211. [Google Scholar] [PubMed]
- Boqué, R.; Maroto, A.; Riu, J. Validation of Analytical Methods. Grasas Aceites 2002, 53. [Google Scholar] [CrossRef]
- Caronia, D.; Martin, M.; Sastre, J.; de la Torre, J.; García-Sáenz, J.A.; Alonso, M.R.; Moreno, L.T.; Pita, G.; Díaz-Rubio, E.; Benítez, J.; et al. A Polymorphism in the Cytidine Deaminase Promoter Predicts Severe Capecitabine-Induced Hand-Foot Syndrome. Clin. Cancer Res. Off. J. Am. Assoc. Cancer Res. 2011, 17, 2006–2013. [Google Scholar] [CrossRef] [PubMed]
- Ribelles, N.; López-Siles, J.; Sánchez, A.; González, E.; Sánchez, M.J.; Carabantes, F.; Sánchez-Rovira, P.; Márquez, A.; Dueñas, R.; Sevilla, I.; et al. A Carboxylesterase 2 Gene Polymorphism as Predictor of Capecitabine on Response and Time to Progression. Curr. Drug Metab. 2008, 9, 336–343. [Google Scholar] [CrossRef] [PubMed]
- Loganayagam, A.; Arenas Hernandez, M.; Corrigan, A.; Fairbanks, L.; Lewis, C.M.; Harper, P.; Maisey, N.; Ross, P.; Sanderson, J.D.; Marinaki, A.M. Pharmacogenetic Variants in the DPYD, TYMS, CDA and MTHFR Genes Are Clinically Significant Predictors of Fluoropyrimidine Toxicity. Br. J. Cancer 2013, 108, 2505–2515. [Google Scholar] [CrossRef] [PubMed]


| Column Type | Source | Particle Size | Dimensions (Mm) | Features |
|---|---|---|---|---|
| HYPERSIL GOLD C18 | Thermo Scientific, Waltham, MA, USA | 3 μm | 150 × 4.6 | C18 (Commonly used in pharmaceutical and biomedical applications) |
| HYPERSIL GOLD C8 | Thermo Scientific | 5 μm | 250 × 4.6 | C8 |
| SYNERGI FUSION-RP | Phenomenex, Torrance, CA, USA | 4 μm | 150 × 4.6 | Polar embedded ligand and hydrophobic ligand, Tetramethylsilane (TMS) end capping. Stable within a pH range of 1.5–10.0 [15] |
| Analyte | DHFU | FU | DFCR | DFUR | CCB |
|---|---|---|---|---|---|
| Conc 1 (ng/mL) | 10 | 1 | 1 | 1 | 10 |
| Conc 2 (ng/mL) | 1 ∗ 102 | 1 ∗ 102 | 1 ∗ 102 | 1 ∗ 102 | 1 ∗ 102 |
| Conc 3 (ng/mL) | 1 ∗ 103 | 1 ∗ 103 | 1 ∗ 103 | 1 ∗ 103 | 1 ∗ 103 |
| Conc 4 (ng/mL) | 1 ∗ 104 | 1 ∗ 104 | 1 ∗ 104 | 1 ∗ 104 | 1 ∗ 104 |
| Conc 5 (ng/mL) | 2 ∗ 104 | 2 ∗ 104 | 1 ∗ 105 | 2 ∗ 104 | 2 ∗ 104 |
| Parameter | DHFU | FU | DFCR | DFUR | CCB |
|---|---|---|---|---|---|
| LINEARITY RANGE (NG/ML) | From 10 to 2 × 10⁴ | From 1 to 2 × 10⁴ | From 1 to 1 × 10⁵ | From 1 to 2 × 10⁴ | From 10 to 2 × 10⁴ |
| CORRELATION COEFFICIENT (R) | >0.98 | >0.98 | >0.98 | >0.98 | >0.98 |
| INTRA-DAY PRECISION (CV%) | <15% | <15% | <15% | <15% | <15% |
| INTER-DAY PRECISION (CV%) | <10% | <10% | <10% | <10% | <10% |
| PRE-STUDY CALIBRATION CURVE CV% | 1.1–4.9% | 1.6–7.9% | 1.2–4.7% | 1.7–6.7% | 1.6–8.4% |
| ROUTINE QC SAMPLE CV% | 2.79–5.36% | 2.69–9.14% | 1.5–10.6% | 2.69–9.14% | 1.5–10.6% |
| PRE-STUDY CALIBRATION CURVE %BIAS | −4.7% to 5.5% | −3.6% to 6.8% | 1.5% to 6.6% | 1.2% to 3.2% | −3.8% to 3.5% |
| ROUTINE QC SAMPLE %BIAS | −7.2% to 8.9% | 1.7% to 4.2% | −1.27% to 5.7% | 1.7% to 4.2% | −1.27% to 5.7% |
| LOD (NG/ML) | 3 ng/mL | 0.3 ng/mL | 0.3 ng/mL | 0.3 ng/mL | 3 ng/mL |
| LOQ (NG/ML) | 10 ng/mL | 1 ng/mL | 1 ng/mL | 1 ng/mL | 10 ng/mL |
| P# | Sex | Age | Regimen | Conc. of FU (×103 ng/mL) | Conc. of DFCR (×103 ng/mL) | Conc. of DFUR (×103 ng/mL) | Toxicity Grade | |||||||||||||
|---|---|---|---|---|---|---|---|---|---|---|---|---|---|---|---|---|---|---|---|---|
| D1 C1 | D14 C1 | D1 C2 | D1 C1 | D14 C1 | D1 C2 | D1 C1 | D14 C1 | D1 C2 | A | N | V | D | C | F | M | H | ||||
| 1 | M | 46 | CCB | 43 | 37 | 33 | 2 | 6 | 0 | 4 | 11 | 1 | 0 | 1 | 0 | 2 | 1 | 0 | 1 | 3 |
| 2 | M | 44 | CAPOX | 55 | 52 | 31 | 14 | 1 | 2 | 7 | 1 | 1 | 1 | 1 | 0 | 3 | 1 | 1 | 1 | 2 |
| 3 | M | 63 | CAPOX | 58 | 98 | 0 | 3 | 1 | 0 | 3 | 2 | 0 | 2 | 1 | 2 | 1 | 0 | 0 | 0 | 1 |
| 4 | F | 55 | CAPOX | 44 | 26 | 0 | 0 | 2 | 0 | 13 | 8 | 0 | 0 | 0 | 0 | 0 | 1 | 0 | 1 | 1 |
| 5 | F | 60 | CCB | 122 | 50 | 41 | 1 | 2 | 514 | 3 | 2 | 1 | 1 | 1 | 0 | 1 | 0 | 0 | 0 | 0 |
| 6 | M | 31 | CAPOX | 70 | 85 | 132 | 2 | 4 | 0 | 1 | 3 | 2 | 0 | 1 | 1 | 0 | 1 | 1 | 0 | 2 |
| 7 | M | 33 | CCB | 50 | 80 | 0 | 12 | 5 | 0 | 4 | 5 | 0 | 0 | 0 | 0 | 0 | 0 | 0 | 0 | 0 |
| 8 | F | 36 | CAPOX | 52 | 0 | 70 | 5 | 0 | 6 | 10 | 0 | 3 | 1 | 0 | 2 | 0 | 0 | 0 | 0 | 0 |
| 9 | F | 51 | CAPOX | 28 | 81 | 37 | 1 | 698 | 1 | 1 | 3 | 2 | 1 | 1 | 2 | 2 | 2 | 0 | 0 | 1 |
| 10 | M | 70 | CAPOX | 50 | 77 | 62 | 8 | 1 | 6 | 5 | 1 | 3 | 2 | 0 | 0 | 0 | 3 | 0 | 2 | 0 |
| 11 | M | 32 | CAPOX | 24 | 27 | 28 | 0 | 2 | 3 | 2 | 2 | 3 | 3 | 0 | 3 | 2 | 2 | 0 | 1 | 0 |
| 12 | M | 64 | CCB | 78 | 47 | 0 | 21 | 0 | 0 | 3 | 1 | 0 | 0 | 1 | 2 | 0 | 1 | 1 | 1 | 3 |
| 13 | F | 62 | CAPOX | 102 | 48 | 31 | 2 | 2 | 0 | 2 | 3 | 1 | 1 | 1 | 0 | 1 | 1 | 1 | 0 | 3 |
| 14 | F | 47 | CAPOX | 35 | 38 | 18 | 1 | 2 | 1 | 3 | 3 | 4 | 2 | 2 | 2 | 3 | 1 | 1 | 2 | 3 |
| 15 | M | 37 | CAPOX | 28 | 39 | 45 | 3 | 1 | 1 | 5 | 2 | 1 | 1 | 0 | 0 | 0 | 0 | 0 | 0 | 0 |
| 16 | M | 48 | CAPOX | 31 | 86 | 146 | 5 | 9 | 1 | 4 | 8 | 24 | 0 | 1 | 0 | 1 | 2 | 0 | 1 | 3 |
| 17 | M | 58 | CAPOX | 13 | 16 | 18 | 5 | 1 | 1 | 5 | 1 | 1 | 2 | 1 | 0 | 3 | 1 | 1 | 1 | 0 |
| 18 | M | 73 | CAPOX | 54 | 0 | 0 | 1 | 0 | 0 | 1 | 0 | 0 | 0 | 0 | 0 | 3 | 0 | 0 | 0 | 0 |
| 19 | F | 54 | CAPOX | 40 | 49 | 29 | 2 | 1 | 1 | 1 | 0 | 1 | 1 | 1 | 1 | 2 | 1 | 1 | 0 | 0 |
| 20 | F | 68 | CAPOX | 58 | 0 | 0 | 1 | 0 | 0 | 6 | 0 | 0 | 2 | 1 | 1 | 0 | 1 | 0 | 0 | 3 |
Disclaimer/Publisher’s Note: The statements, opinions and data contained in all publications are solely those of the individual author(s) and contributor(s) and not of MDPI and/or the editor(s). MDPI and/or the editor(s) disclaim responsibility for any injury to people or property resulting from any ideas, methods, instructions or products referred to in the content. |
© 2023 by the authors. Licensee MDPI, Basel, Switzerland. This article is an open access article distributed under the terms and conditions of the Creative Commons Attribution (CC BY) license (https://creativecommons.org/licenses/by/4.0/).
Share and Cite
Shamseldin, S.; Botros, L.S.; Salem, S.E.; Abdel-Maksoud, S.; Gad, M.Z.; Hanafi, R.S. Determination of Capecitabine and Its Metabolites in Plasma of Egyptian Colorectal Cancer Patients. Analytica 2023, 4, 397-414. https://doi.org/10.3390/analytica4040029
Shamseldin S, Botros LS, Salem SE, Abdel-Maksoud S, Gad MZ, Hanafi RS. Determination of Capecitabine and Its Metabolites in Plasma of Egyptian Colorectal Cancer Patients. Analytica. 2023; 4(4):397-414. https://doi.org/10.3390/analytica4040029
Chicago/Turabian StyleShamseldin, Sara, Liza Samir Botros, Salem Eid Salem, Sahar Abdel-Maksoud, Mohamed Zakaria Gad, and Rasha Sayed Hanafi. 2023. "Determination of Capecitabine and Its Metabolites in Plasma of Egyptian Colorectal Cancer Patients" Analytica 4, no. 4: 397-414. https://doi.org/10.3390/analytica4040029