Article

Gold Nanoclusters Prepared in the Presence of Adenosine Monophosphate and Citrate: Factorial-Based Synthesis Optimization and Sensing Properties

by
Evgeny Karpushkin
*,
Ekaterina Mesnyankina
and
Vladimir Sergeyev
Department of Chemistry, Lomonosov Moscow State University, Moscow 119991, Russia
*
Author to whom correspondence should be addressed.
Analytica 2023, 4(4), 415-431; https://doi.org/10.3390/analytica4040030
Submission received: 14 September 2023 / Revised: 5 October 2023 / Accepted: 12 October 2023 / Published: 14 October 2023

Abstract

:
Gold nanoclusters are peculiar objects promising in view of qualitative and quantitative determination of various species, including heavy metal ions and biological molecules. We have recently discovered that introducing sodium azide in the reaction mixture during gold nanocluster synthesis in the presence of citrate and adenosine monophosphate can tune the product emission from blue to yellow. Taking advantage of the factorial design of the experiment, we have optimized the synthesis conditions to obtain pure blue and yellow emitters and investigate their sensitivity to a series of inorganic salts. The experiments have revealed selective quenching of the nanocluster’s fluorescence in the presence of mercury(II) ions.

Graphical Abstract

1. Introduction

Gold nanoclusters (AuNCs), peculiar objects built of up to several hundred gold atoms, close the gap between molecular species and conventional metal nanoparticles. Due to their small size (less than 2 nm), they can exhibit strong fluorescence in the absence of surface plasmon resonance absorption, which is typical of larger gold nanoparticles. Due to these optical properties, pronounced photostability, and low toxicity, AuNCs have been used for sensing, labeling, and imaging [1], as well as therapy, theranostics, and other biomedical applications [2]. In view of the attractive, functional properties of AuNCs, which have been found to be dependent on their size, shape, and the capping agent, different methods to synthesize AuNCs in the presence of various stabilizers (such as proteins, DNA, dendrimers, and thiolate species) have been reported [3]. Typical values of quantum yield of fluorescence of purified AuNCs are about 3–10% [1], although in certain cases, the much higher quantum yield of 41% (dendrimer-stabilized Au8 clusters, excitation wavelength 384 nm, emission wavelength 450 nm; [4]) has been reported
Analytical applications of fluorescent AuNCs have been reviewed [1,5,6]. Depending on the structure of the clusters, the nature of the capping ligands, and conditions of the analysis, selective sensing and quantitative determination of heavy metal ions (Hg2+, Cu2+, Fe3+, and Zn2+), anions (CN, NO2, and S2−), small molecules (glucose, dopamine, cysteine, and hydrogen peroxide), and high-molecular species (proteins and nucleic acids) have been reported. In the most striking examples, limits of detection as low as 1–10 nmol/L (Hg2+ and CH3Hg+ [7,8]), 75 nmol/L (CN [9]), and 1–5 μmol/L (Fe3+ [10]) have been achieved.
An interesting procedure for the synthesis of fluorescent AuNCs has been discussed [11,12]: aqueous solutions of HAuCl4 and adenosine monophosphate (AMP) are mixed with a citrate-buffered solution and incubated for several hours to several days at ambient or elevated temperature. The presence of citrate has been found essential to obtain fluorescent AuNCs via reduction of Au(III) into Au(I) and Au(0), whereas ionizable adenine derivatives (AMP and adenosine triphosphate) act as stabilizers preventing AuNC aggregation, owing to electrostatic repulsion. It has been found that the process is sensitive to the mixture stoichiometry, the order of mixing, and even UV illumination during the synthesis. Similar fluorescent AuNCs have been obtained in the presence of other nucleotides with ascorbic acid as a reducing agent [13]. Moreover, nucleotide-assisted synthesis can be used to better understand the mechanism of AuNC formation in the presence of DNA molecules without any external reducing agent, as recently reported in [14].
We have recently discovered [15] that the introduction of sodium azide (a well-known preservative inhibiting microbial activity [16] and thus widely used to stabilize aqueous buffered solutions during storage) in the reaction mixture during the preparation of AuNCs under the action of citrate and AMP leads to significant change in their optical properties. The addition of a large excess (about 100-fold with respect to HAuCl4) of NaN3 has completely suppressed the formation of the fluorescent products, whereas at intermediate concentrations of NaN3 (up to 20-fold molar excess), the blue-green fluorescence of the produced AuNCs was changed to yellow and weakened. Likely, azide ions act as a competing ligand, shifting the equilibrium of the complex formation between Au(III) and AMP. Slow formation of AuNCs in the mixture of HAuCl4, AMP, and NaN3 (in the absence of citrate) has suggested that azide ions can also act as weak reducing agents in the considered system.
In this study, we aimed to optimize the conditions of the AuNC synthesis to obtain the “blue” and “yellow” fluorescent AuNCs and to compare the sensitivity of their fluorescent properties to the presence of a series of heavy metal ions.

2. Materials and Methods

2.1. Chemicals

The chemicals were used as received: adenosine 5′-monophosphate disodium salt (AMP) purchased from Maclin (China); tetrachloroauric(III) acid trihydrate (HAuCl4) purchased from Sigma–Aldrich; sodium azide (NaN3), citric acid (CitrH), trisodium citrate (CitrNa), acetic acid, and sodium acetate purchased from Reakhim (Russia). Deionized water was used as a solvent. Stock solutions of inorganic salts were prepared via dissolution of the solid salts (chemical pure grade); their concentration was determined using titration and spectrophotometry.

2.2. General Synthesis Procedure

Calculated amounts of aqueous stock solutions of AMP (100 mmol/L), CitrH (200 mmol/L), CitrNa (200 mmol/L), and NaN3 (100 mmol/L) were mixed. The mixture was diluted with water to achieve the desired final concentrations and kept for 15 min at room temperature. Finally, the necessary amount of aqueous stock solution of HAuCl4 (24 mmol/L) was added; the mixture was heated in an oven at 90 °C for 3 h and then allowed to cool down to ambient temperature.

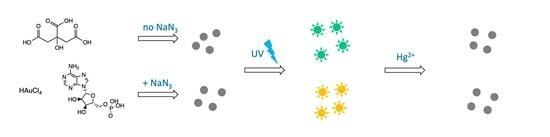
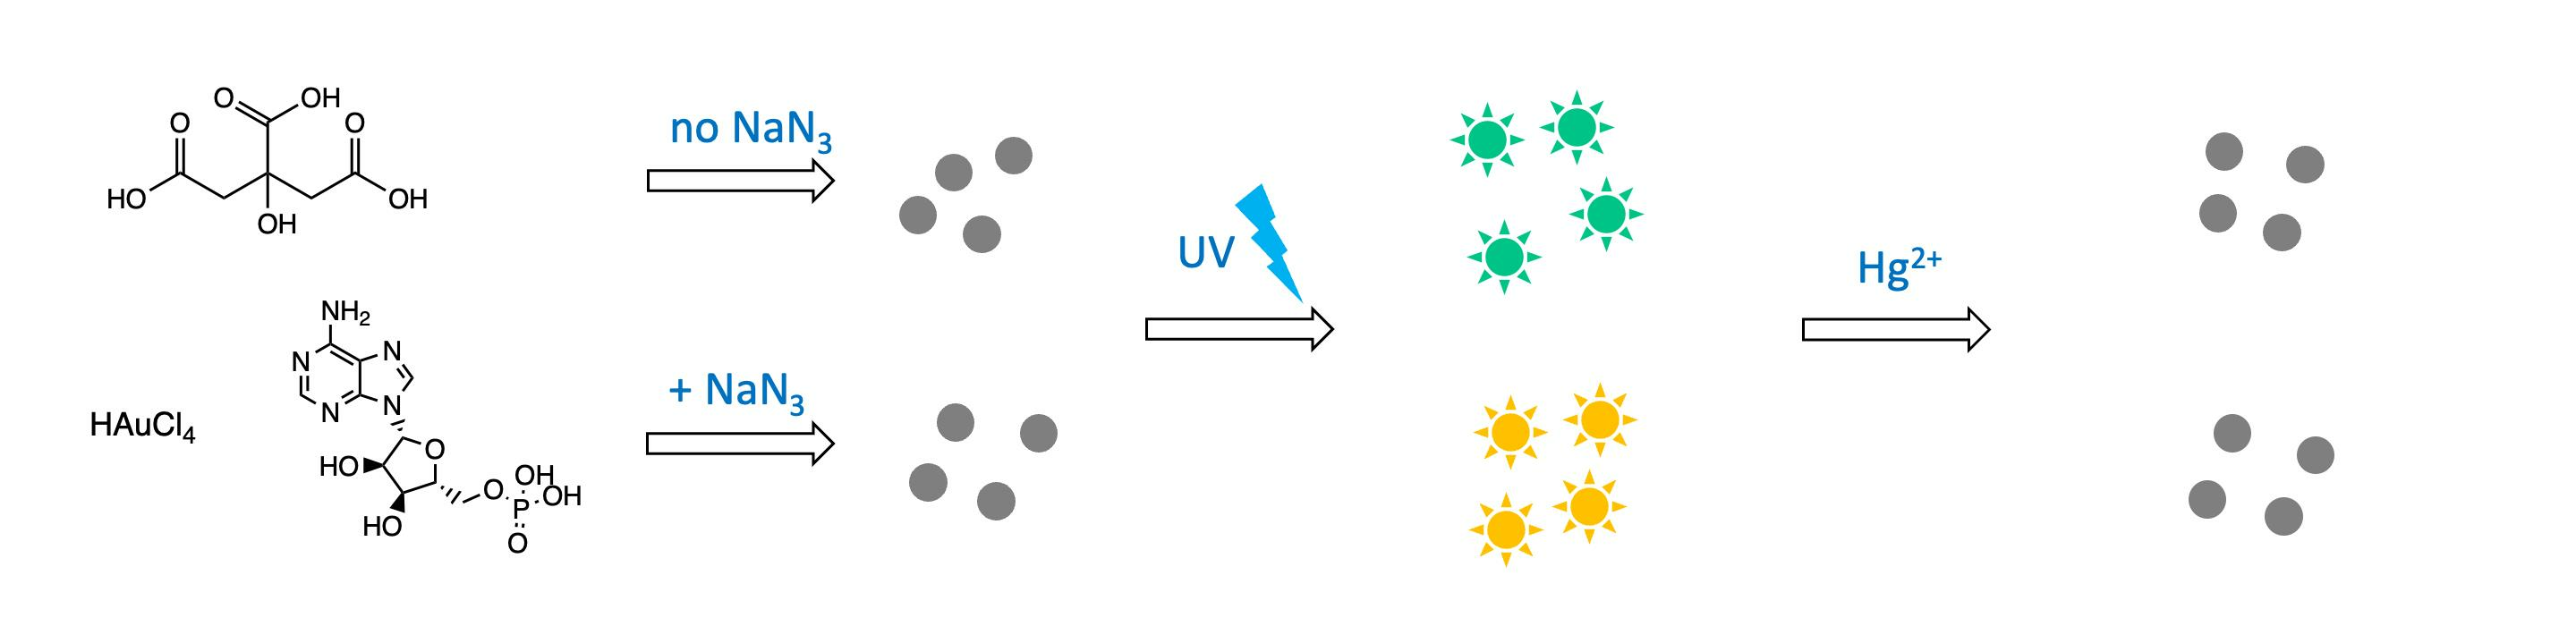
2.3. Order of Components Mixing

In certain experiments, the order of the component mixing described above was altered to elaborate a procedure insensitive to the order and timing of the reagents mixing, which would allow robust investigation of the effects of the components concentration rather than the synthesis routine.
One approach was to mix stock solutions of AMP, CitrH, CitrNa, and NaN3 in different orders, then dilute the mixture with an appropriate volume of water, and finally add a stock solution of HAuCl4 and start heating. Six samples were prepared following this approach. Another approach was to mix stock solutions of AMP, CitrH, CitrNa, and NaN3 in different orders, then add stock solutions of HAuCl4, and finally dilute the mixture with an appropriate volume of water and start heating. Six samples were prepared following this approach. The last approach was to initially take HAuCl4, add stock solutions of AMP, CitrH, CitrNa, and NaN3 in different orders, dilute the mixture with water, and start heating. In either approach, the components were added in sequence, with 15–20 min intervals between the additions.

2.4. Factorial Design of AuNCs Synthesis

To probe the effects of the component’s concentration on the optical properties of the produced AuNCs, we took advantage of a factorial-based design of the experiment. Within the main series of experiments, the following parameters of the initial mixture were varied: concentration of HAuCl4 (cAu), molar ratio of AMP to HAuCl4 (rAMP), molar ratio of NaN3 to HAuCl4 (razide), molar ratio of total citrate to HAuCl4 (rcitr), and molar fraction of sodium citrate in its mixture with citric acid (rNa/H). Each of the five listed parameters was varied in two levels (coded as −1 and 1); additionally, three replicates of the synthesis at razide = −1 or 0, other variables being at 0 level, were prepared to assess the process reproducibility. A complete list of the prepared samples and an explanation of the levels of the variables are given in Table A1. Using the obtained data, the statistical significance of the variables and their interactions was assessed using ANOVA, linear models of the response variables were built, and further optimization of the synthesis conditions was performed using response surface methodology.
Following this approach, two candidate compositions were determined to produce AuNCs exhibiting different emission properties. An auxiliary series of samples was prepared to verify the elucidated compositions with a smaller variation of the ratio of the components relative to the suggested composition.

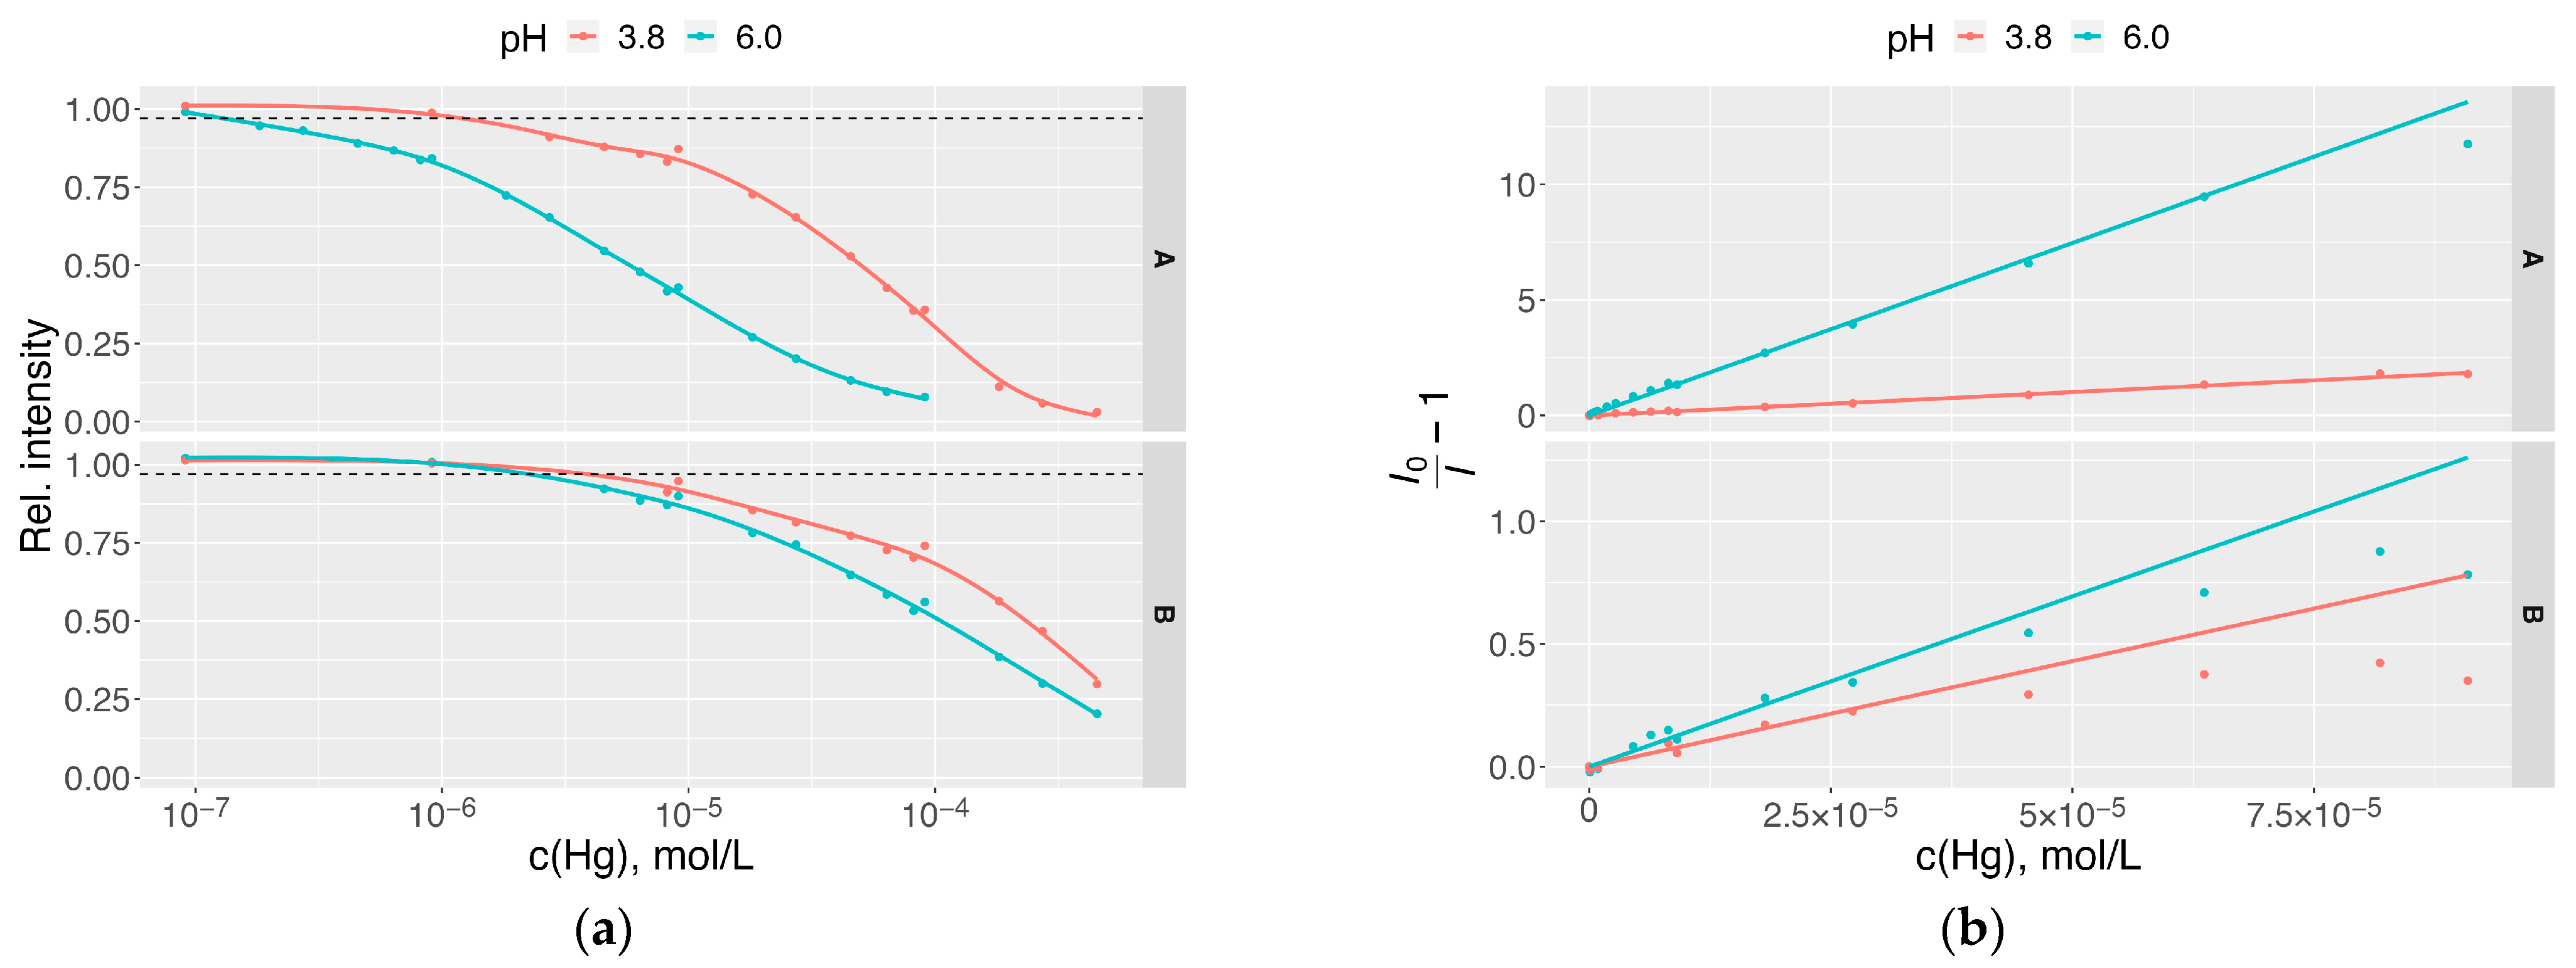
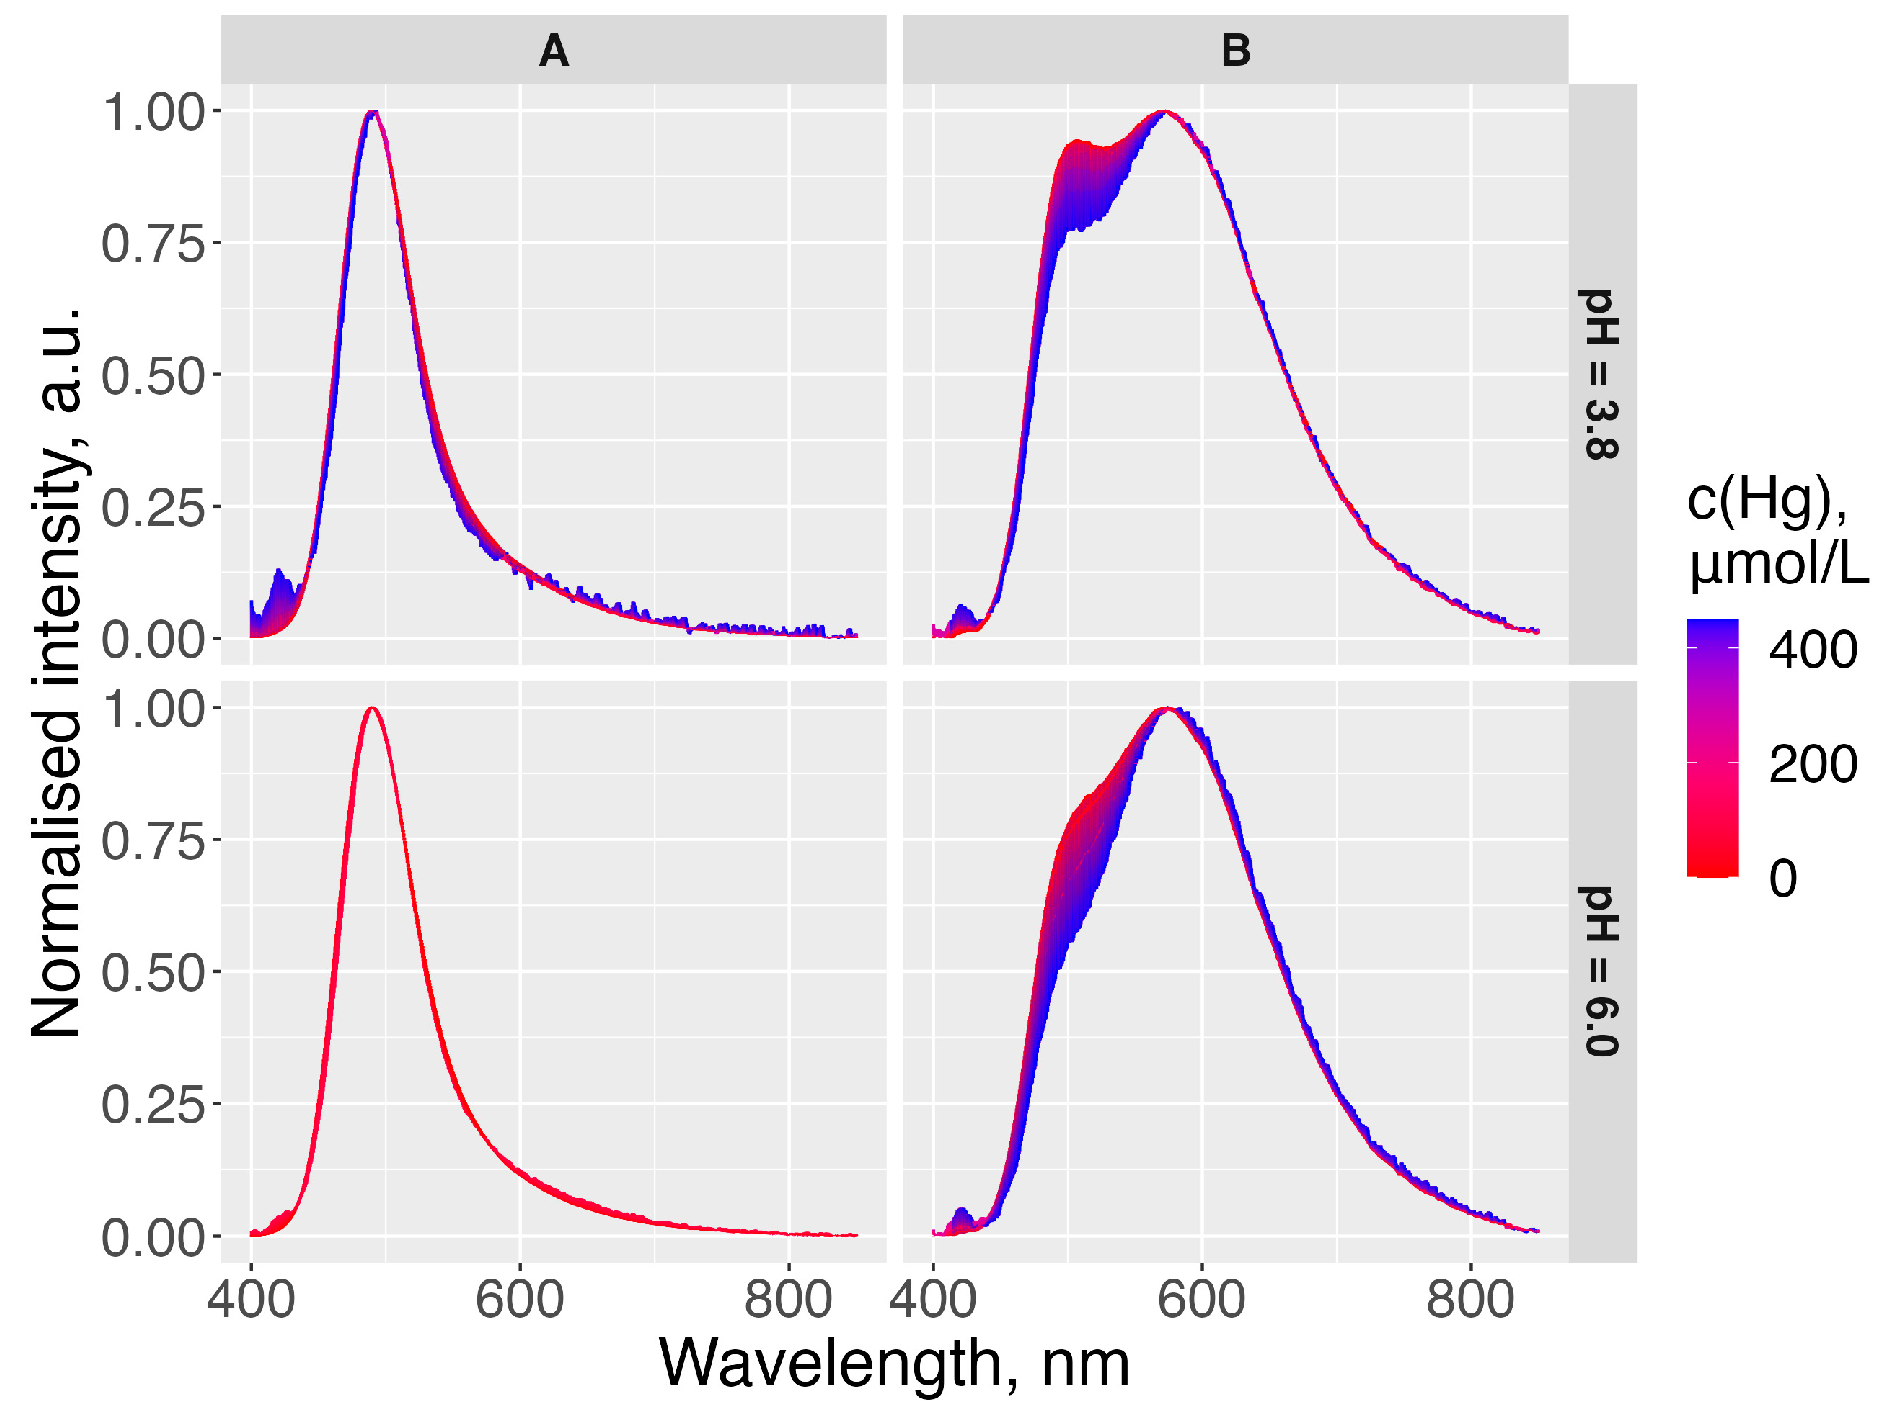
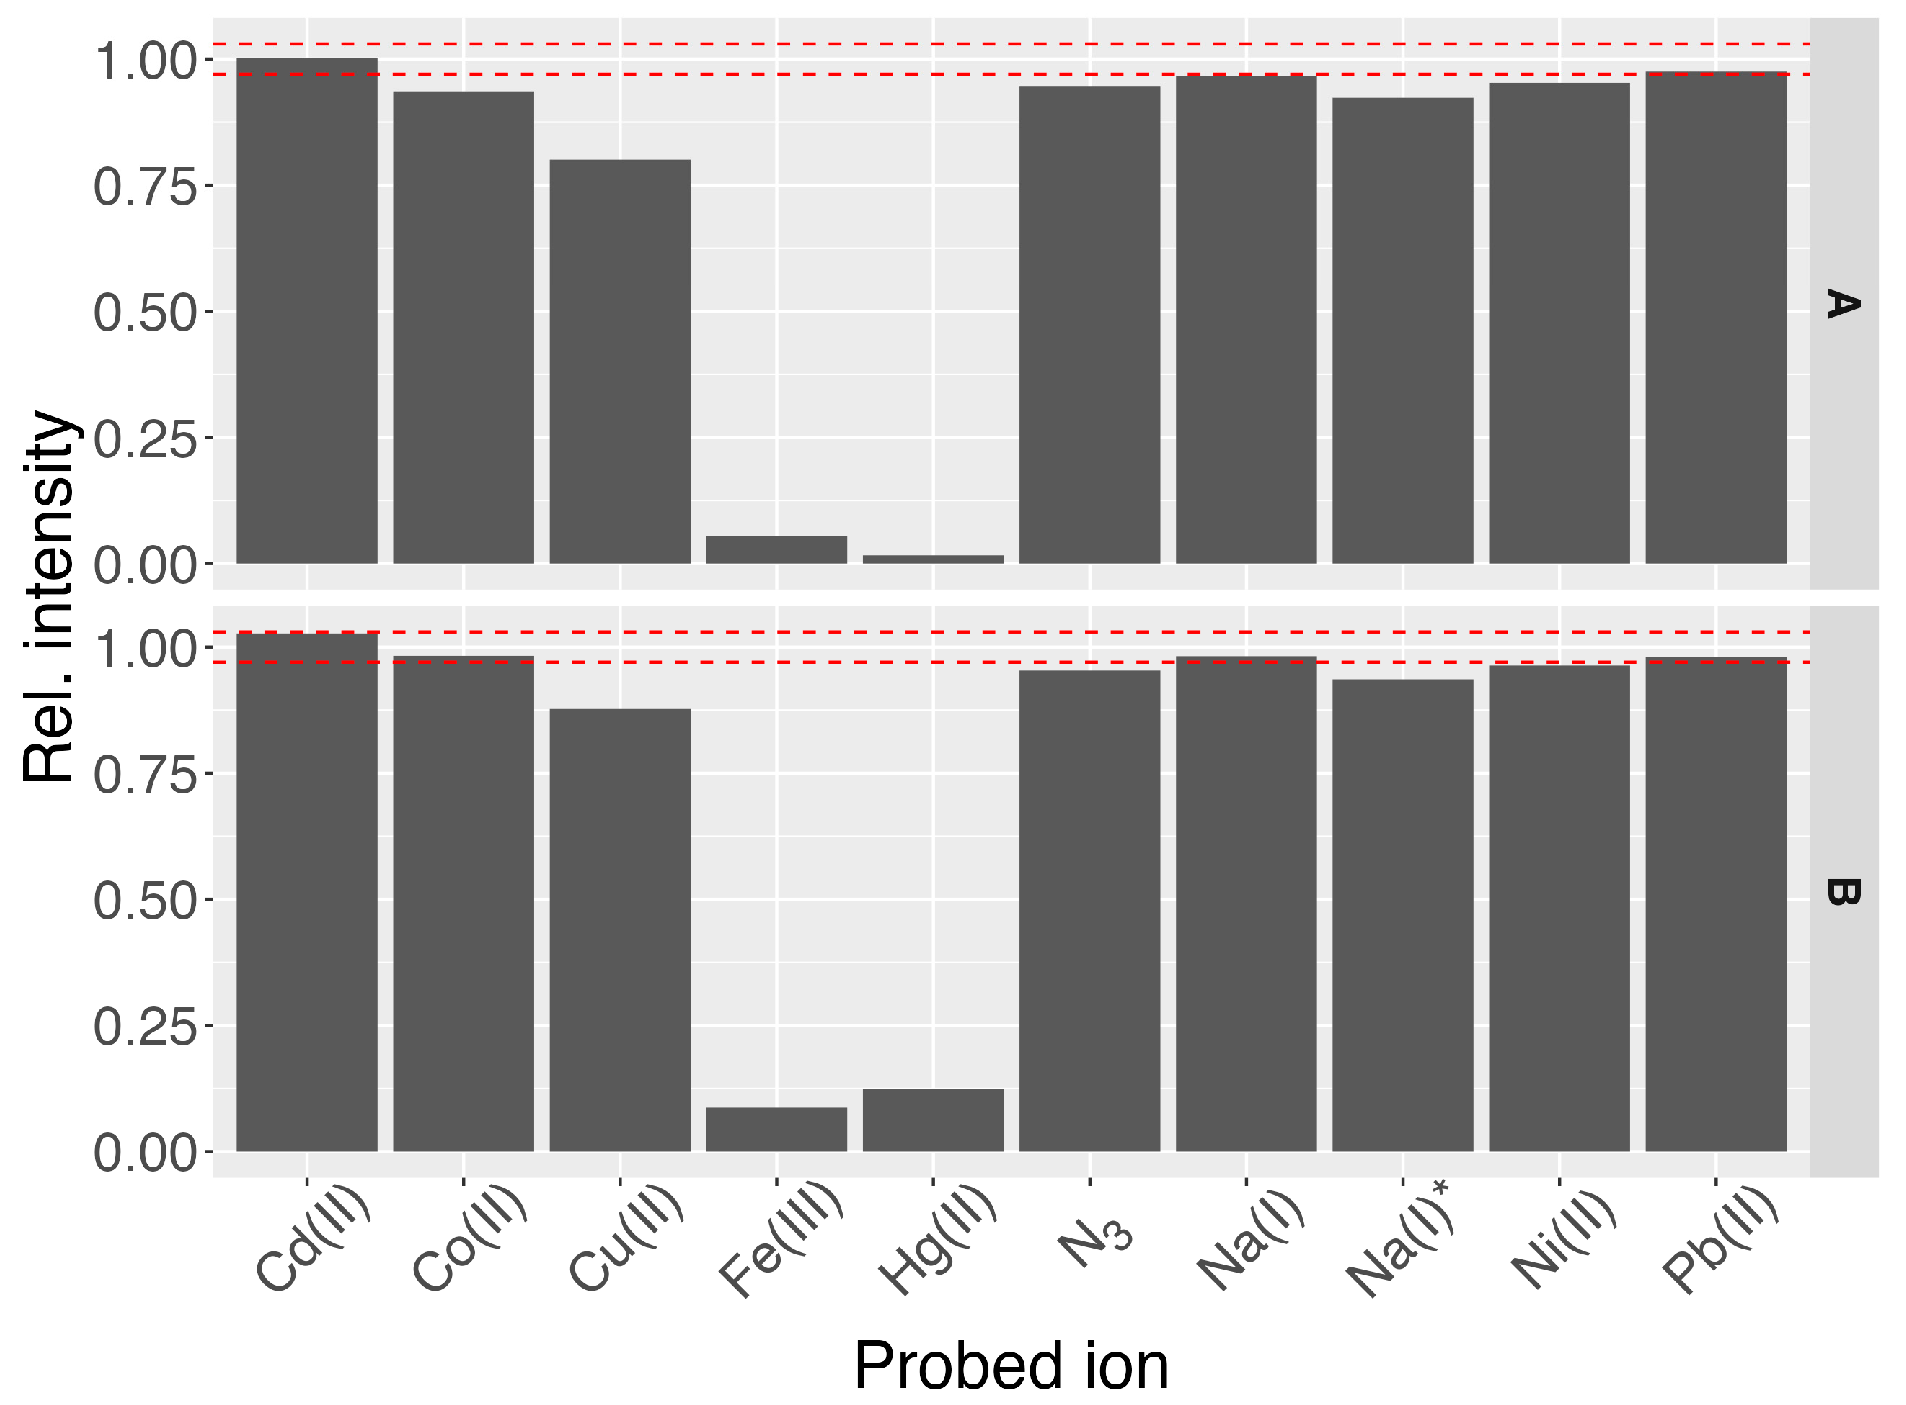
2.5. Sensitivity to Metal Ions

To probe the sensitivity of the AuNCs fluorescence to the presence of heavy metal ions, the as-synthesized AuNC samples were diluted with an acetate-buffered solution (pH 3.8 to 6.0) so that their fluorescence intensity was in the range of the instrument sensitivity. Then, a portion of aqueous solution of the metal salt was added, and the sample fluorescence was measured. For comparison, a reference measurement was performed upon the addition of the same volume of deionized water to an identical AuNC sample. Each sample was measured five times.

2.6. Characterization and Data Processing

The electronic absorption spectra and the emission spectra excited at 365 nm were recorded using a modular system, including a Maya 2000 Pro detector (Ocean Optics, Orlando, FL, USA) and a DH-2000 light source (absorption measurements) or a 365 nm diode (fluorescence measurements). The quantum yield of the samples’ fluorescence was determined with quinine sulfate as a reference using a conventional comparative technique [17].
Data processing, analysis, and the results visualization were performed using R script (base 4.2.1, tidyverse 1.3.2, and car 3.1-2 packages). The statistical significance of the hypotheses was verified using an ANOVA F-test of the factors’ significance in a linear model. If not stated otherwise, the effect was considered significant at p < 0.05 (corresponding to α 0.95). Other details of the applied statistical methods are given in the appropriate sections. The processing script and the complete dataset are available on GitHub: https://github.com/eukarr/AuNC (accessed on 13 September 2023).

3. Results

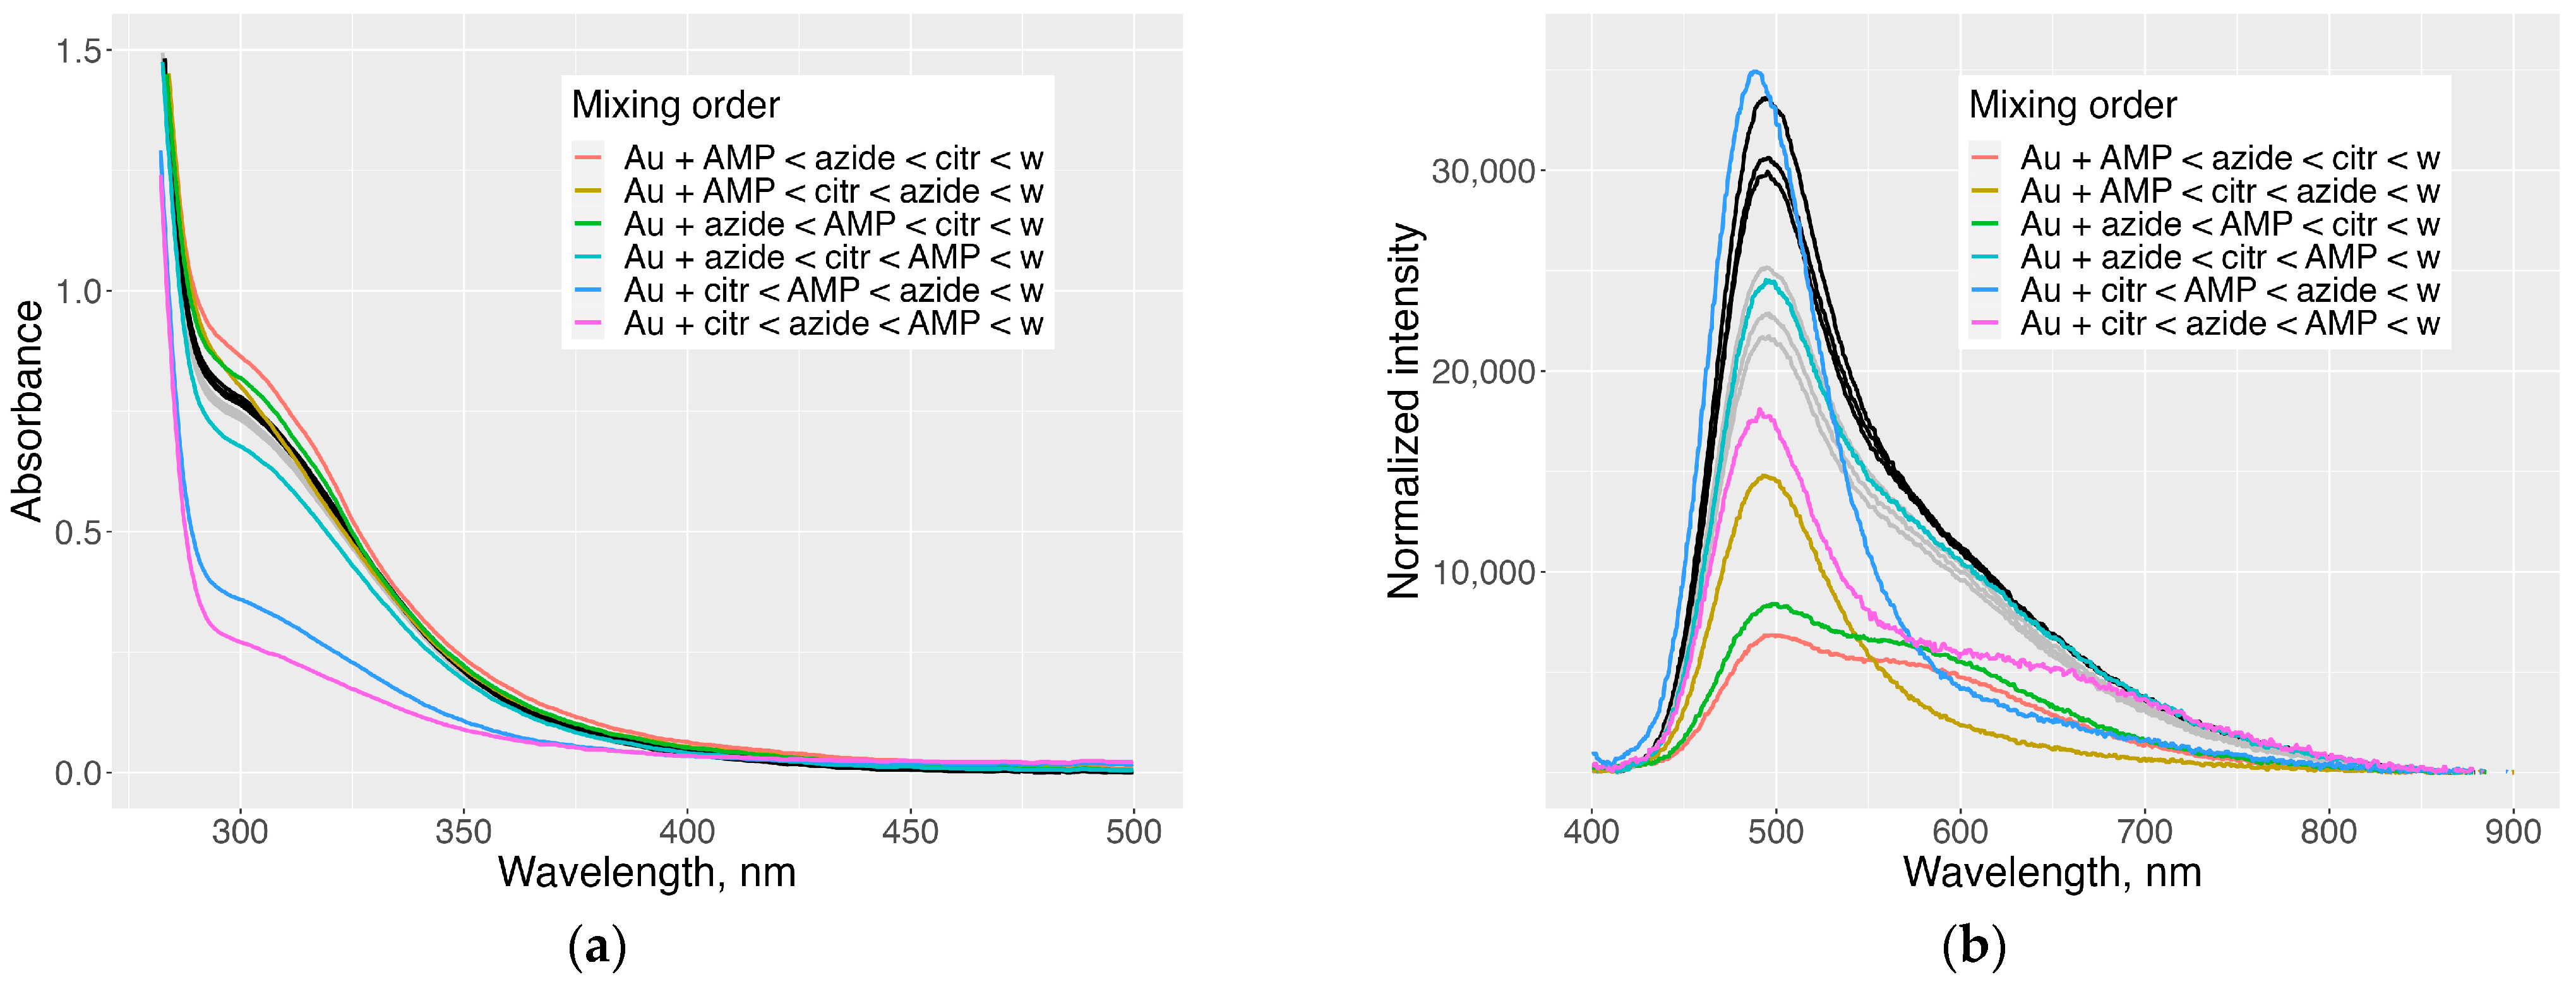
3.1. Order of Mixing

Since the reaction mixtures contained several components capable of interaction with HAuCl4 (namely, CitrNa, CitrH, NaN3, and AMP), the order of their mixing could affect the reaction outcome. We probed the effect of the mixing order at the following mixture composition: 0.1 mM. of HAuCl4, 5 mM. of CitrH, 15 mM. of CitrNa, 1 mM of AMP, and 0.2 mM. of NaN3. Six components of the mixture (including water) could be mixed in 5! = 120 different orders and it was virtually impossible to test them all. Therefore, we limited the experiment to certain characteristic cases (HAuCl4 as the first or the last reactant added to the mixture); the samples were kept for 15–20 min at room temperature before adding each component. The results are collected in Figure 1. Colored curves in Figure 1 correspond to different orders of adding AMP, NaN3, and citrate to HAuCl4 solution. In contrast, a series of grey and black curves correspond to different orders of mixing AMP, NaN3, and citrate, followed by the addition of HAuCl4 and dilution with water or dilution with water and the addition of HAuCl4, respectively.
Based on the obtained results, the following mixing order was chosen for further experiments: stock solutions of AMP, NaN3, CitrH, and CitrNa were mixed and diluted with water; then, a stock solution of HAuCl4 was added, and the mixture was heated to complete the reaction. That procedure provided the strongest reproducible fluorescence independent of the order of mixing of AMP, NaN3, and citrate.

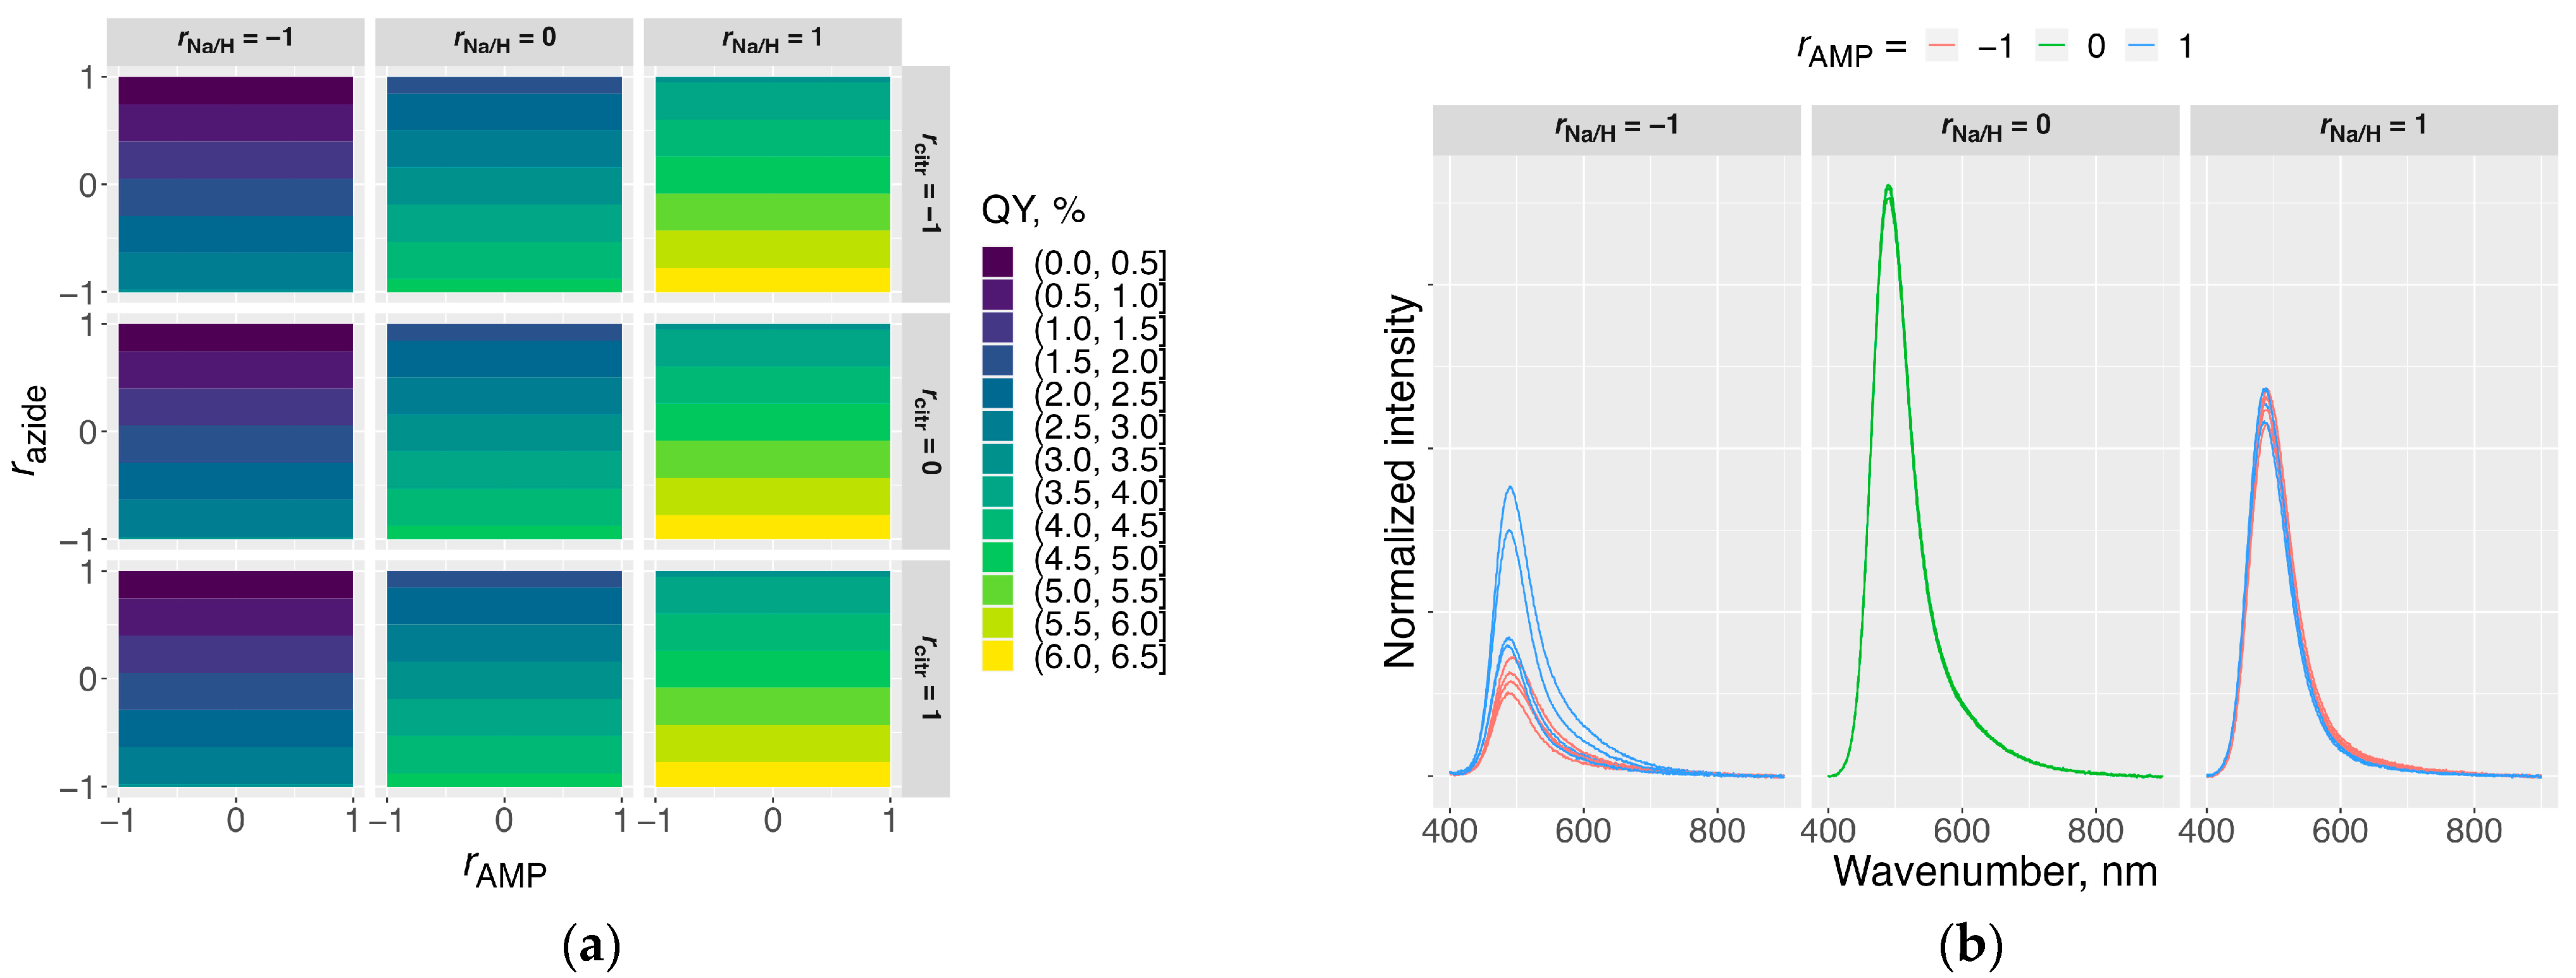
3.2. Factorial-Based Synthesis Design

The selected variables were varied in the 25 full factorial designs (compare the Experimental section and Table A1).
Depending on the ratio of the components, two emission bands appeared in the fluorescence spectra of the products: those with a maximum at about 490 nm (corresponding to blue-green fluorescence) and about 600 nm (corresponding to yellow-orange fluorescence), see Figure 2. The short-wave band was generally stronger, and the appearance of the long-wave one reduced the overall emission intensity. These bands hereafter will be referred to as “blue” and “yellow”.
Two response variables were selected for optimization: overall quantum yield QY of fluorescence and the ratio of emission intensities at 600 and 490 nm (I600/I490). The latter variable reflected the contribution of the yellow band to the AuNC emission.
The ANOVA of the data on QY (Table A3) revealed two statistically significant main effects: razide and rNa/H. Hence, starting concentrations of HAuCl4, AMP, overall citrate content, and second-order interactions of the factors did not significantly affect the QY of the produced AuNCs, as marked by the corresponding p-values exceeding 0.1.
When the statistically insignificant factors were excluded, the ANOVA procedure of the reduced linear model confirmed the statistical significance of the retained factors (razide and rNa/H). The corresponding linear relationship between QY and the synthesis conditions was
QY (%) = 3.23 − 1.45razide + 1.65rNa/H.
The obtained model was overall statistically significant (p-value: 1.1 × 10⁻⁹), but its quality was mediocre (adjusted R2: 0.675). That issue was considered in further optimization of the synthesis (Section 3.3).
The I600/I490 values for the samples exhibiting low emission efficiency were not reliable. Therefore, we removed the data for the samples with QY < 1% (8 out of 38 samples in the full dataset) prior to ANOVA (Table A4). When statistically insignificant factors were excluded, the ANOVA procedure of the reduced linear model confirmed the statistical significance of the retained factors. The corresponding linear relationship between quantum yield and the synthesis conditions was
I600/I490 = 0.504 − 0.007cAu − 0.067rAMP + 0.376razide + 0.011rcitr − 0.230rNa/H − 0.055rAMP:razide + 0.017razide:rcitr − 0.190razide:rNa/H.
The obtained model was overall statistically significant (p-value: <10−15), and its quality was high (adjusted R2: 0.994). Further analysis of this model is described in Section 3.4.

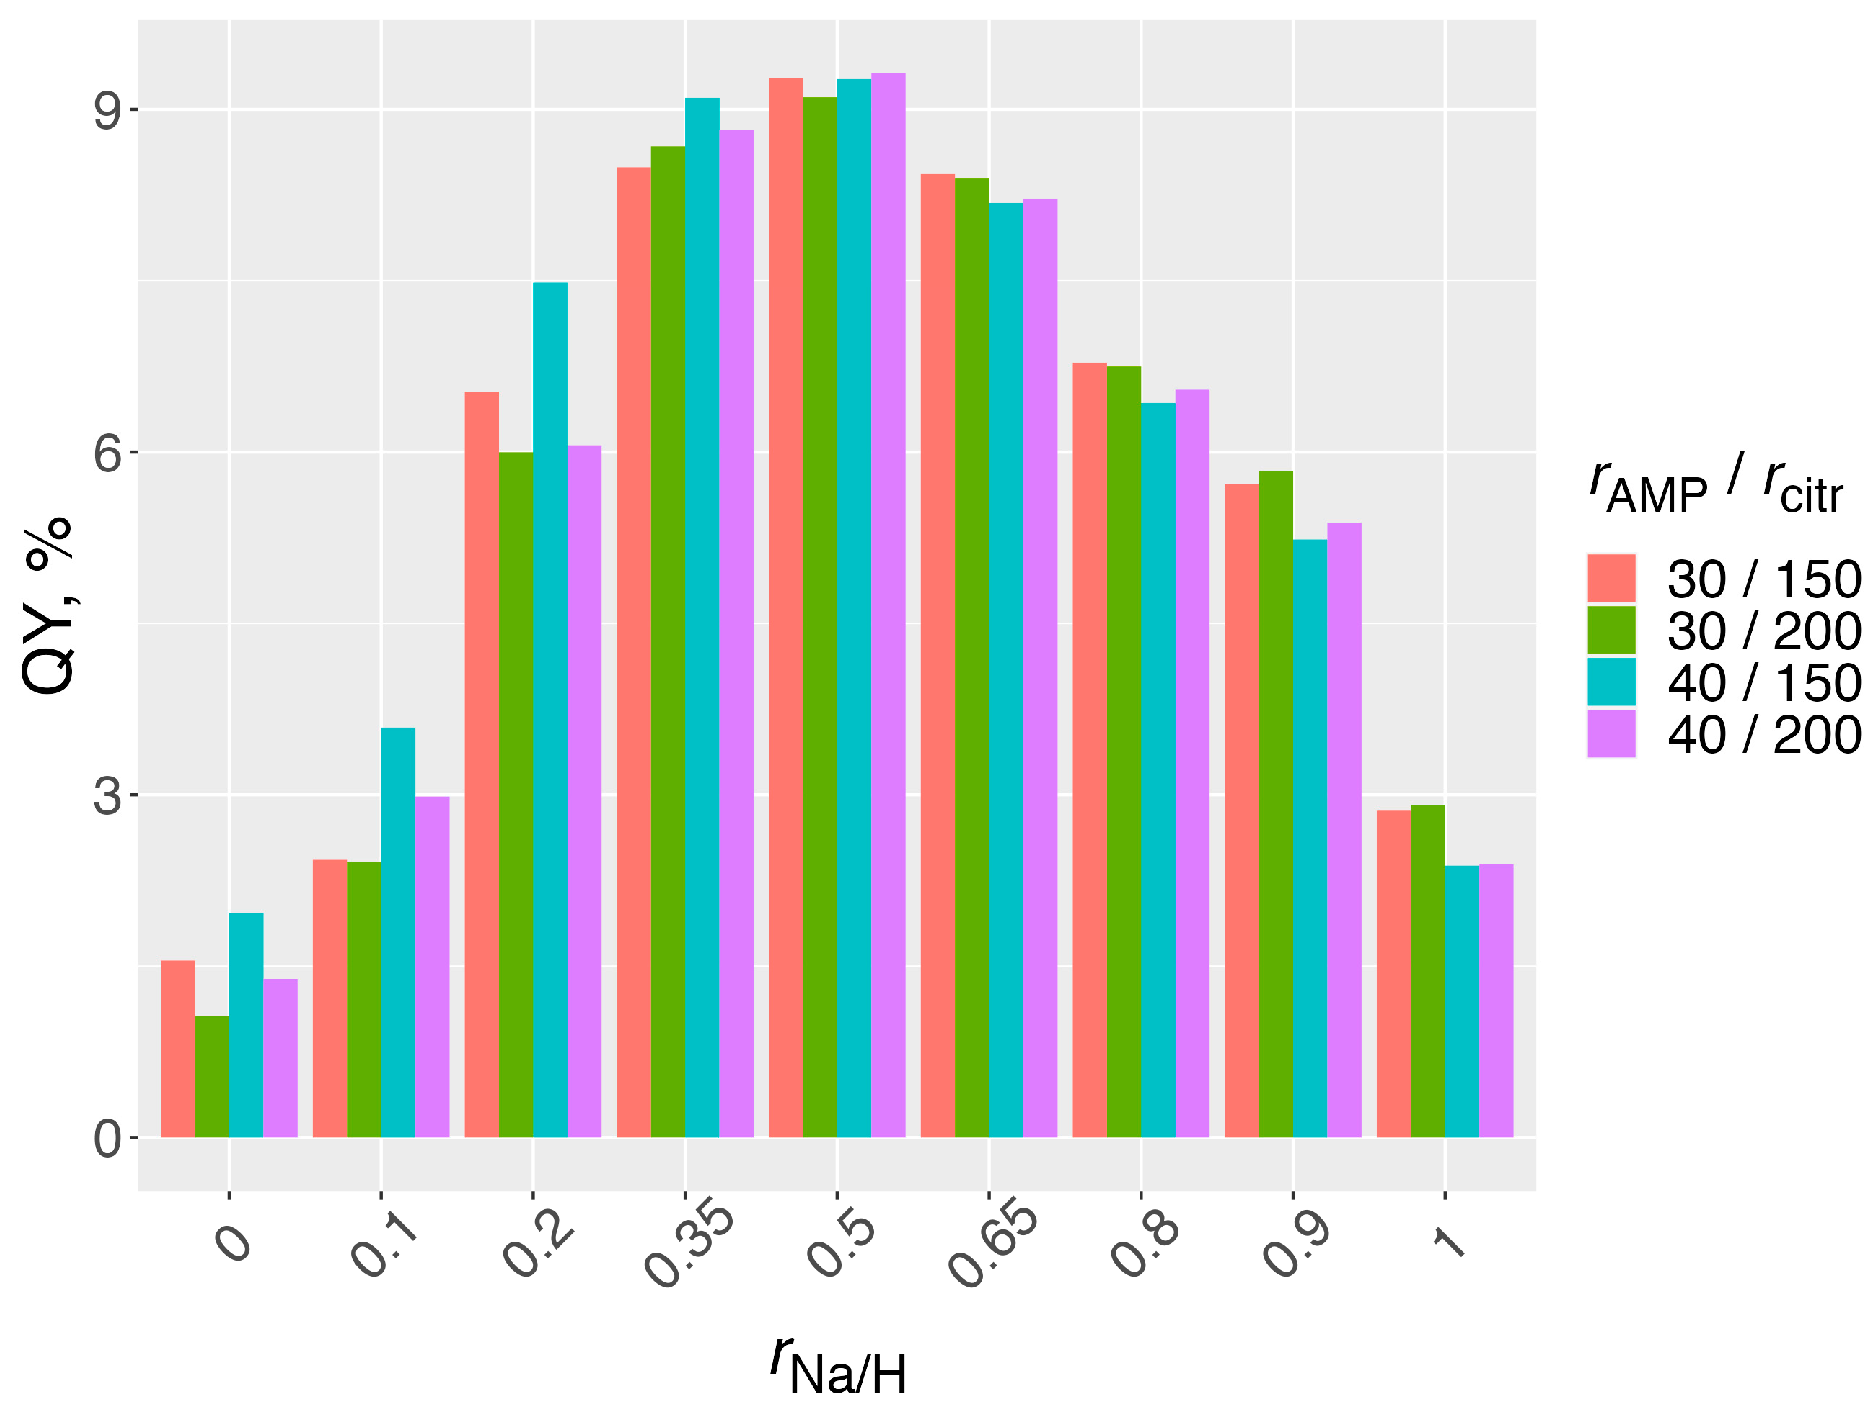
3.3. Optimization of the Synthesis Conditions to Maximize the Quantum Yield

The linear model (1) suggested that the QY of the produced AuNCs could be enhanced by decreasing razide and increasing rNa/H; the respective response surfaces are given in Figure 3a. The theoretical minimum of razide (corresponding to the absence of NaN3) was −1, whereas the theoretical maximum of rNa/H (corresponding to CitrNa as the only source of citrate) was 1.25 (recall that Equation (1) was written in the coded scale; compare footnote to Table A1). At those extreme values of the variables, model (1) predicted the highest QY = 6.74%.
However, closer examination of the emission spectra for the samples prepared in the absence of NaN3 (Figure 3b) revealed a nonlinear dependence of the normalized fluorescence intensity on rNa/H. The effect of rAMP was observed in the spectra at rNa/H = −1 (excess of CitrH), absent at rNa/H = 1, which suggested that the interaction of the rNa/H and rAMP factors should be active but was not recognized using the ANOVA of the linear model.
Thus, to maximize the quantum yield of AuNCs, we prepared a series of samples at rNa/H varied in smaller steps between 0 and 1 (in the natural scale) to cover the entire range of the CitrNa/CitrH ratios. In addition, rAMP and rcitr were varied at two levels each to reveal the effects of those factors possibly masked in model (1). The obtained data are shown in Figure 4. The highest QY was achieved at the equimolar ratio of CitrNa and CitrH in the reaction mixture (rNa/H = 0.5). At that rNa/H value, no pronounced effects of rAMP and rcitr were observed, although a slight increase in QY was favored by lower rcitr at low rNa/H or lower rAMP at high rNa/H.
The QY values for the described additional samples at rNa/H = 0.5 were 9.1–9.3%, higher than the prediction by the linear model (1).

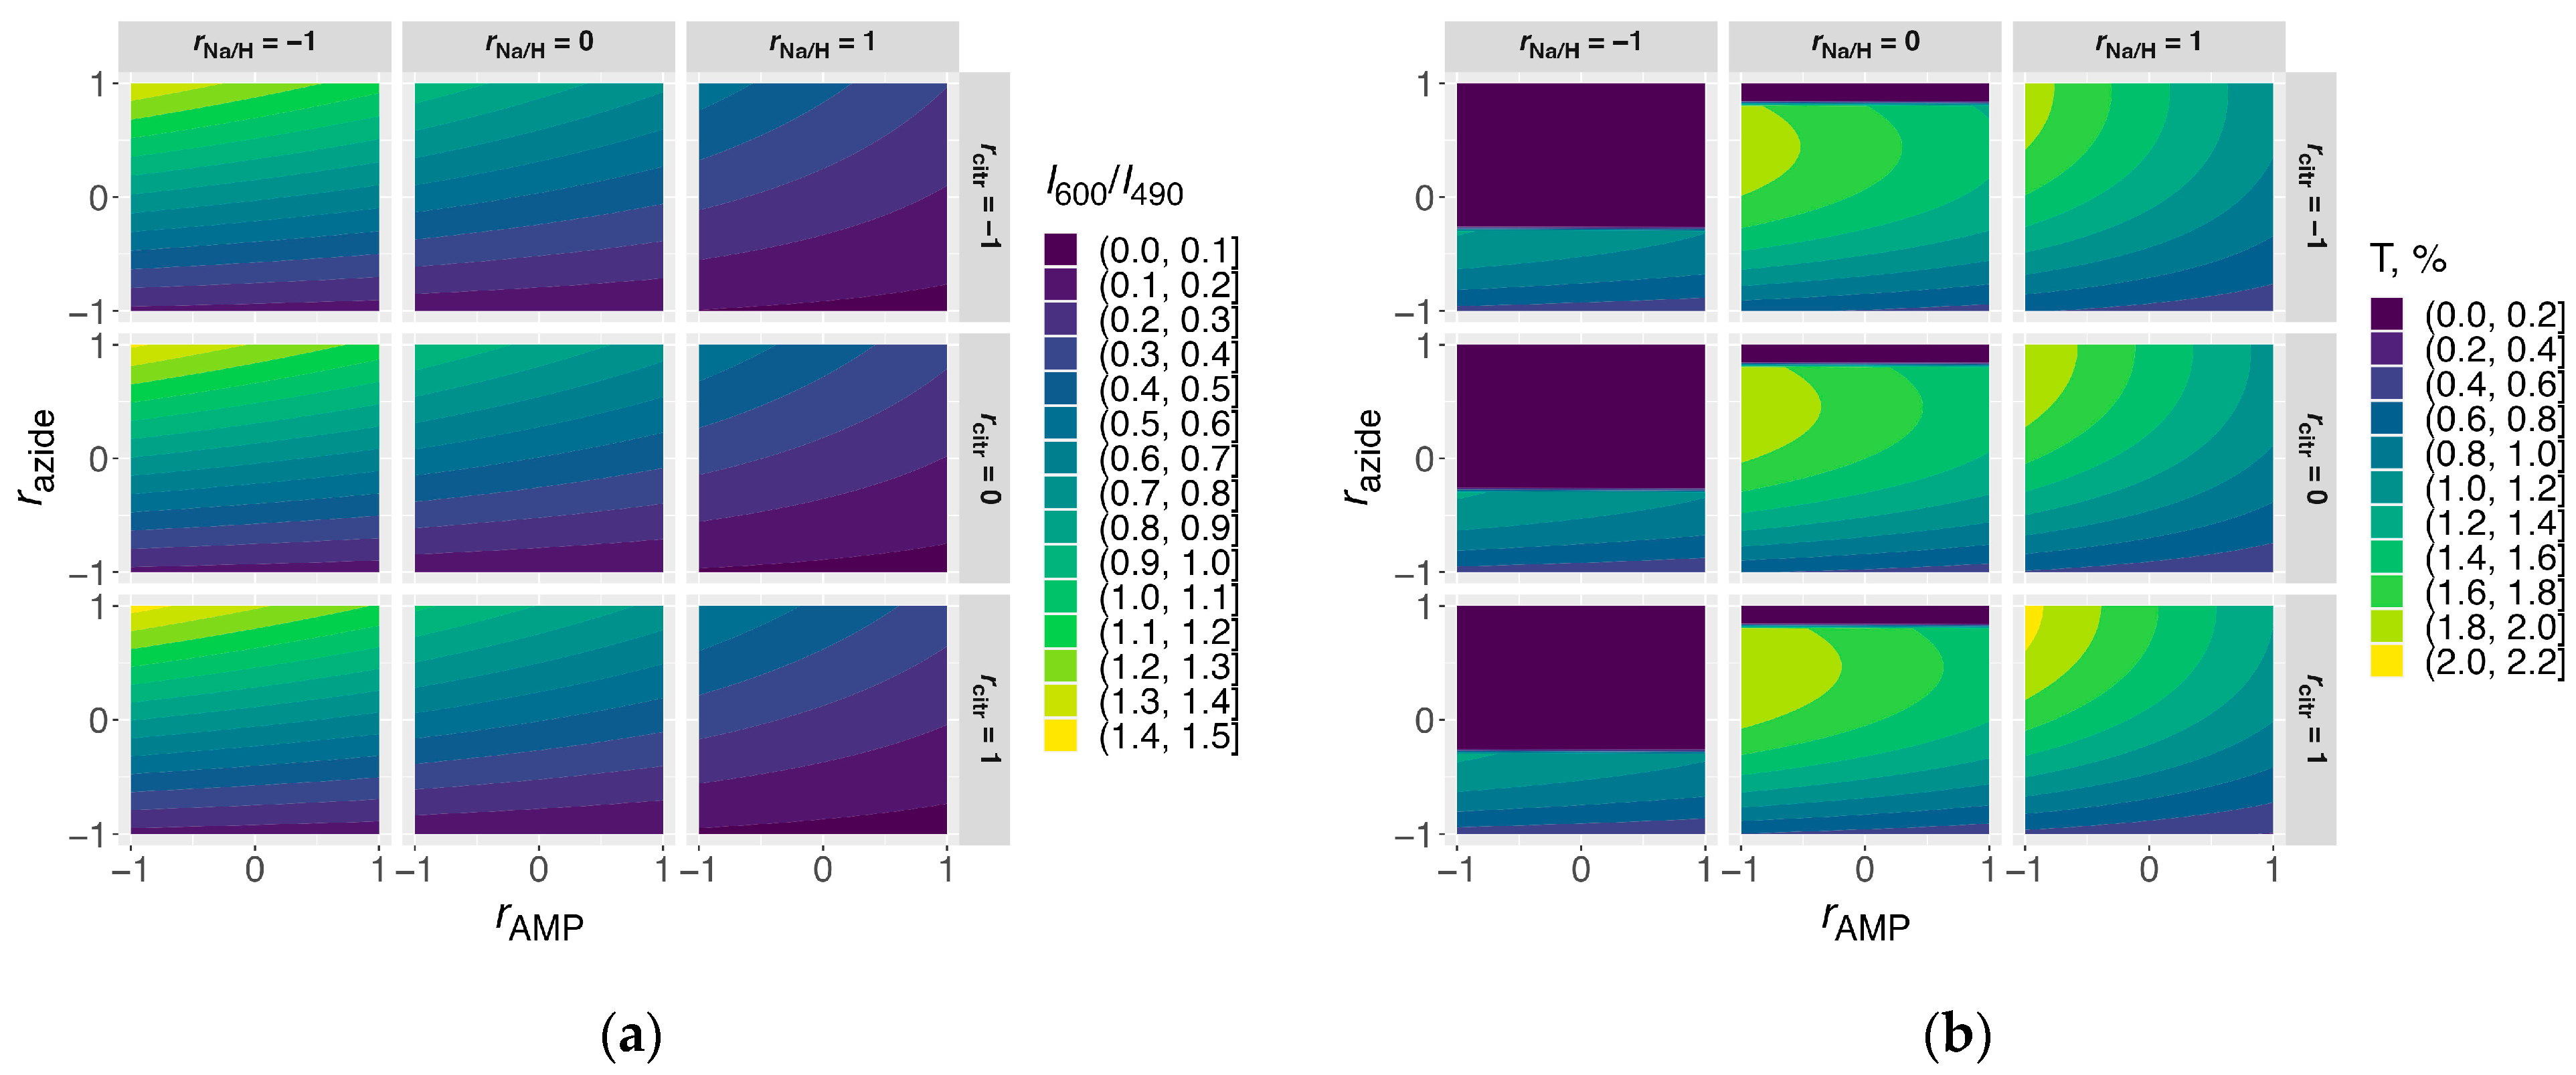
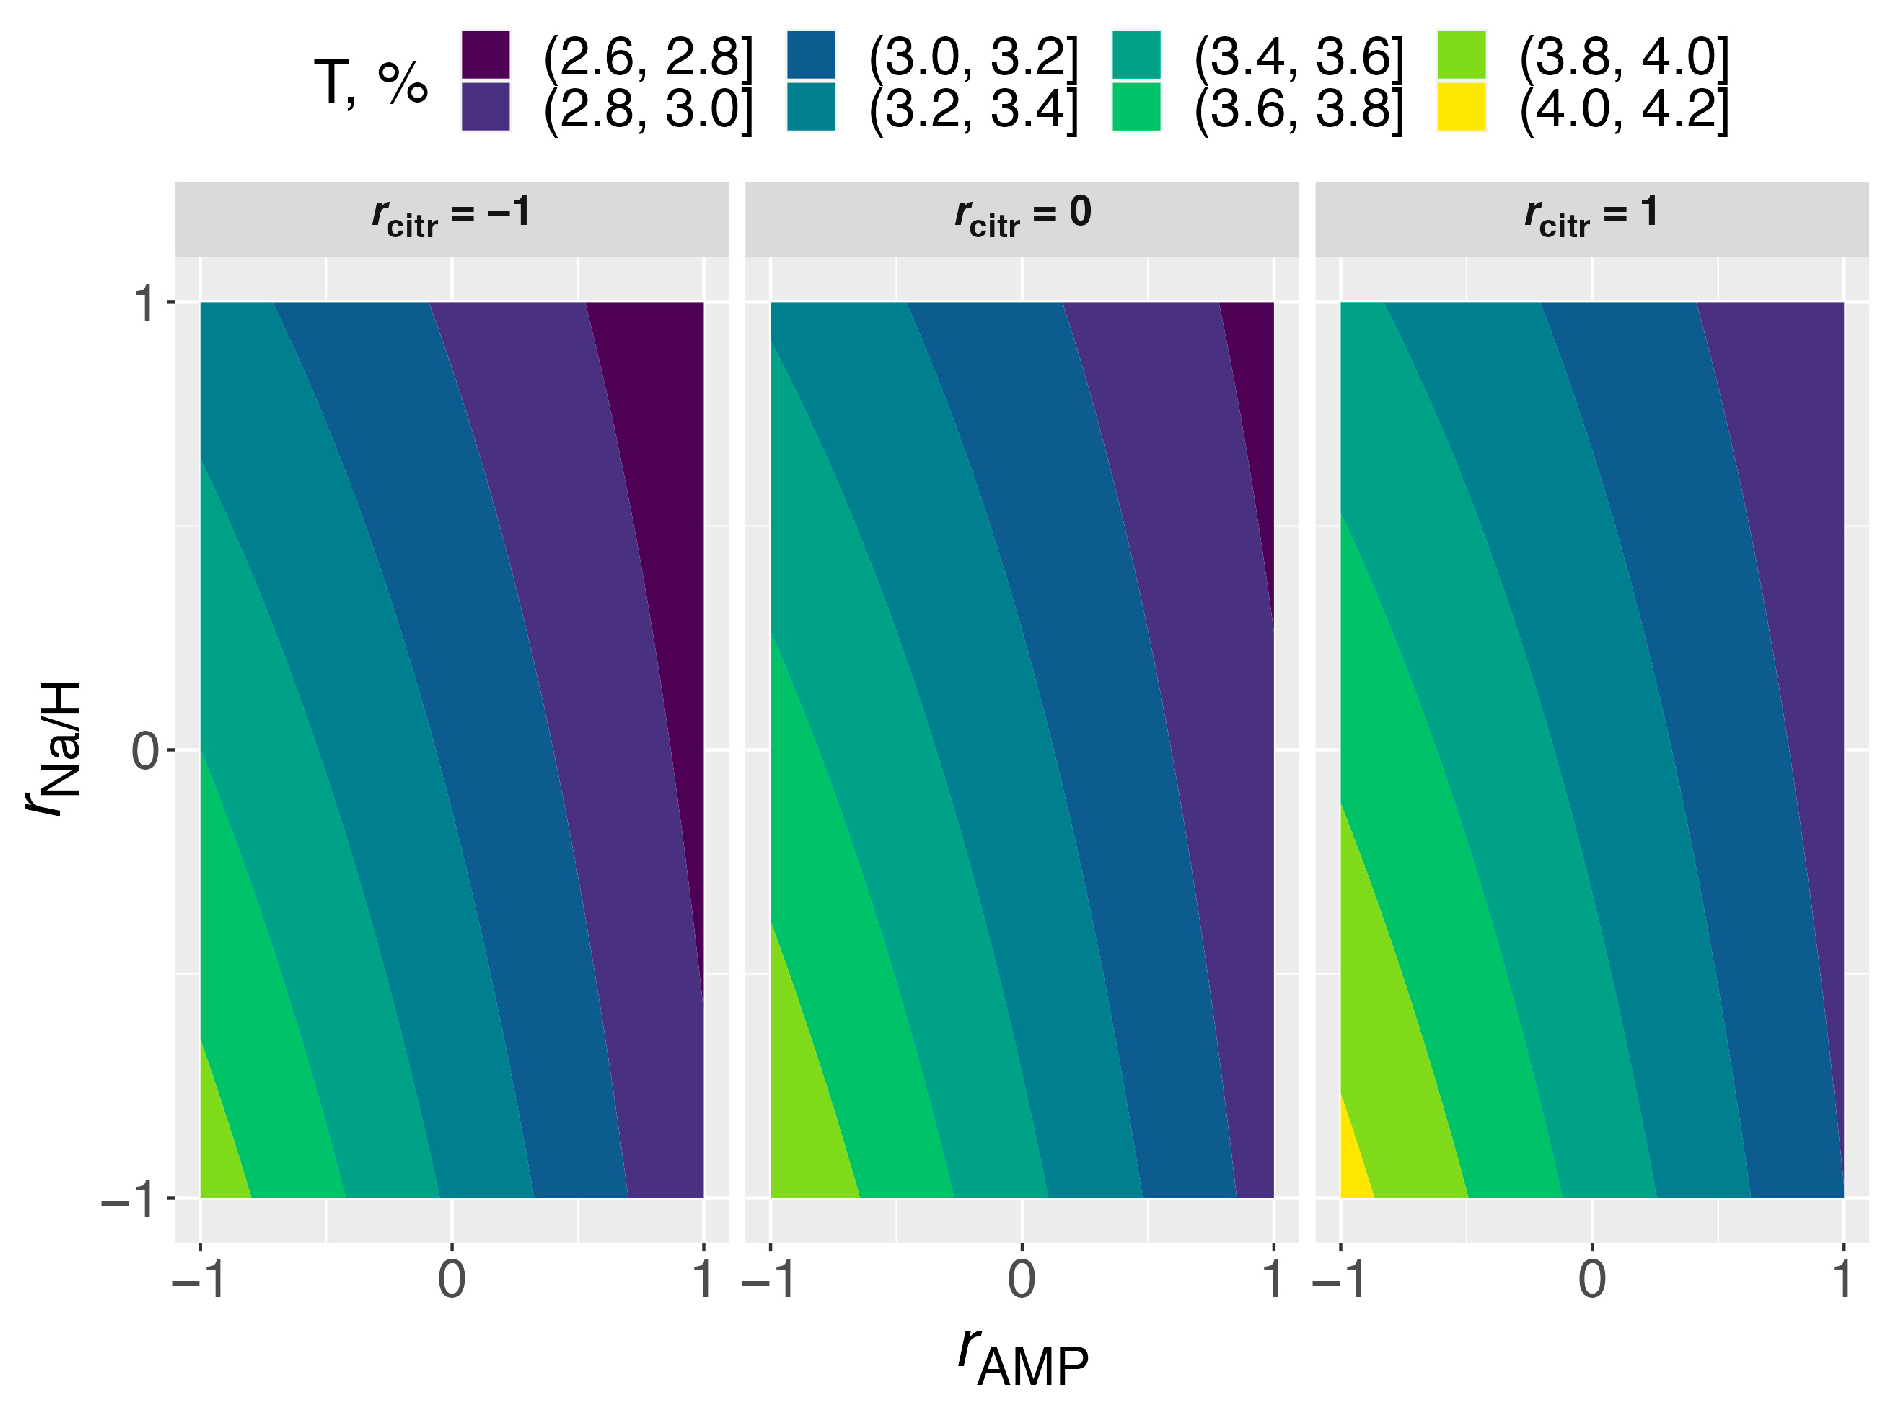
3.4. Optimization of the Synthesis Conditions to Maximize the Yellow Emission

The model describing the ratio of the emission intensities I600/I490 (2) was more complex and suggested the influence of all main effects and some of their second-order interactions. The corresponding response surface (Figure 5a) demonstrated that the strongest contribution of the yellow emission band was expected at a high concentration of NaN3 (razide → 1), a low fraction of sodium citrate (rNa/H → −1), and a low concentration of AMP (rAMP → −1), whereas the influence of concentration of HAuCl4 (cAu) and total concentration of citrate (rcitr) was negligible. However, those conditions simultaneously led to the lowest QY of fluorescence (cf. Figure 3a). To address that issue, we introduced an auxiliary target function T (3), which penalized low QY values. The response surface for this target function is presented in Figure 5b.
T = I 600 / I 490 · QY , QY 2 % 0 , QY > 2 % .
Analysis of the T values showed that the following combination could maximize the fraction of yellow emission (I600/I490 up to 0.74) while still keeping QY at a sufficiently high level (up to 3.2%): cAu = 0.2 mmol/L, rAMP = 7.5, razide = 9, rcitr = 250, and rNa/H = 0.8 (in the natural scale). To validate that suggestion, we performed additional syntheses, building a factorial design with a variation of rAMP, razide, rcitr, and rNa/H about that chosen set of conditions. A complete list of the prepared samples and an explanation of the levels of the variables are given in Table A2.
The ANOVA results for this dataset are collected in Table A5. When the statistically insignificant factors were excluded, the ANOVA procedure of the reduced linear model confirmed the significance of the retained factors. The corresponding linear relationship between the target function and the synthesis conditions was
T (%) = 3.25 − 0.43rAMP − 0.20rNa/H + 0.008rcitr + 0.11rAMP:rNa/H.
The obtained model was overall statistically significant (p-value: <10−9), and its quality was high (adjusted R2: 0.956). Response surfaces for the target function T plotted according to model (4) are shown in Figure 6.

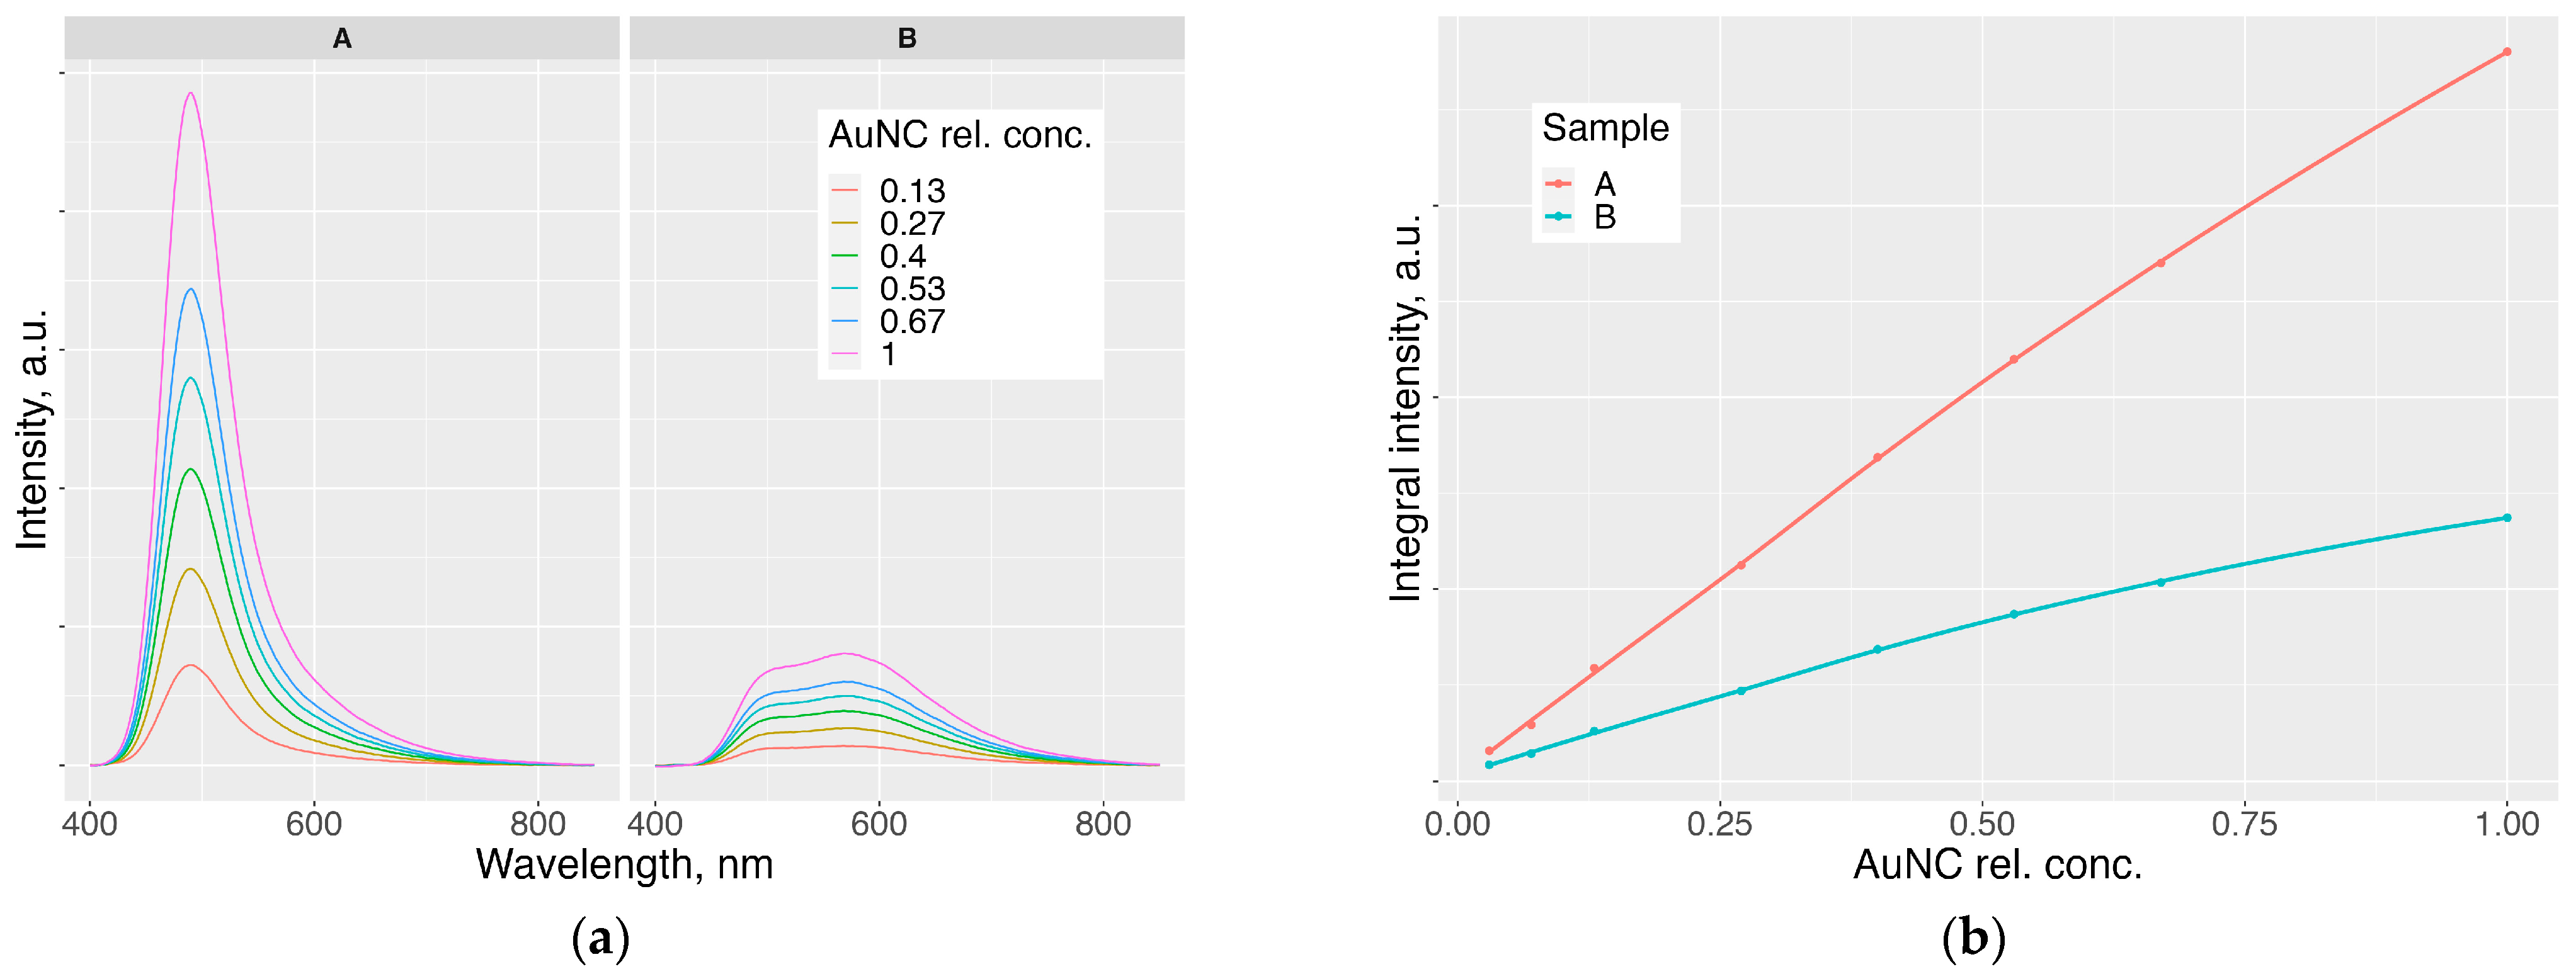
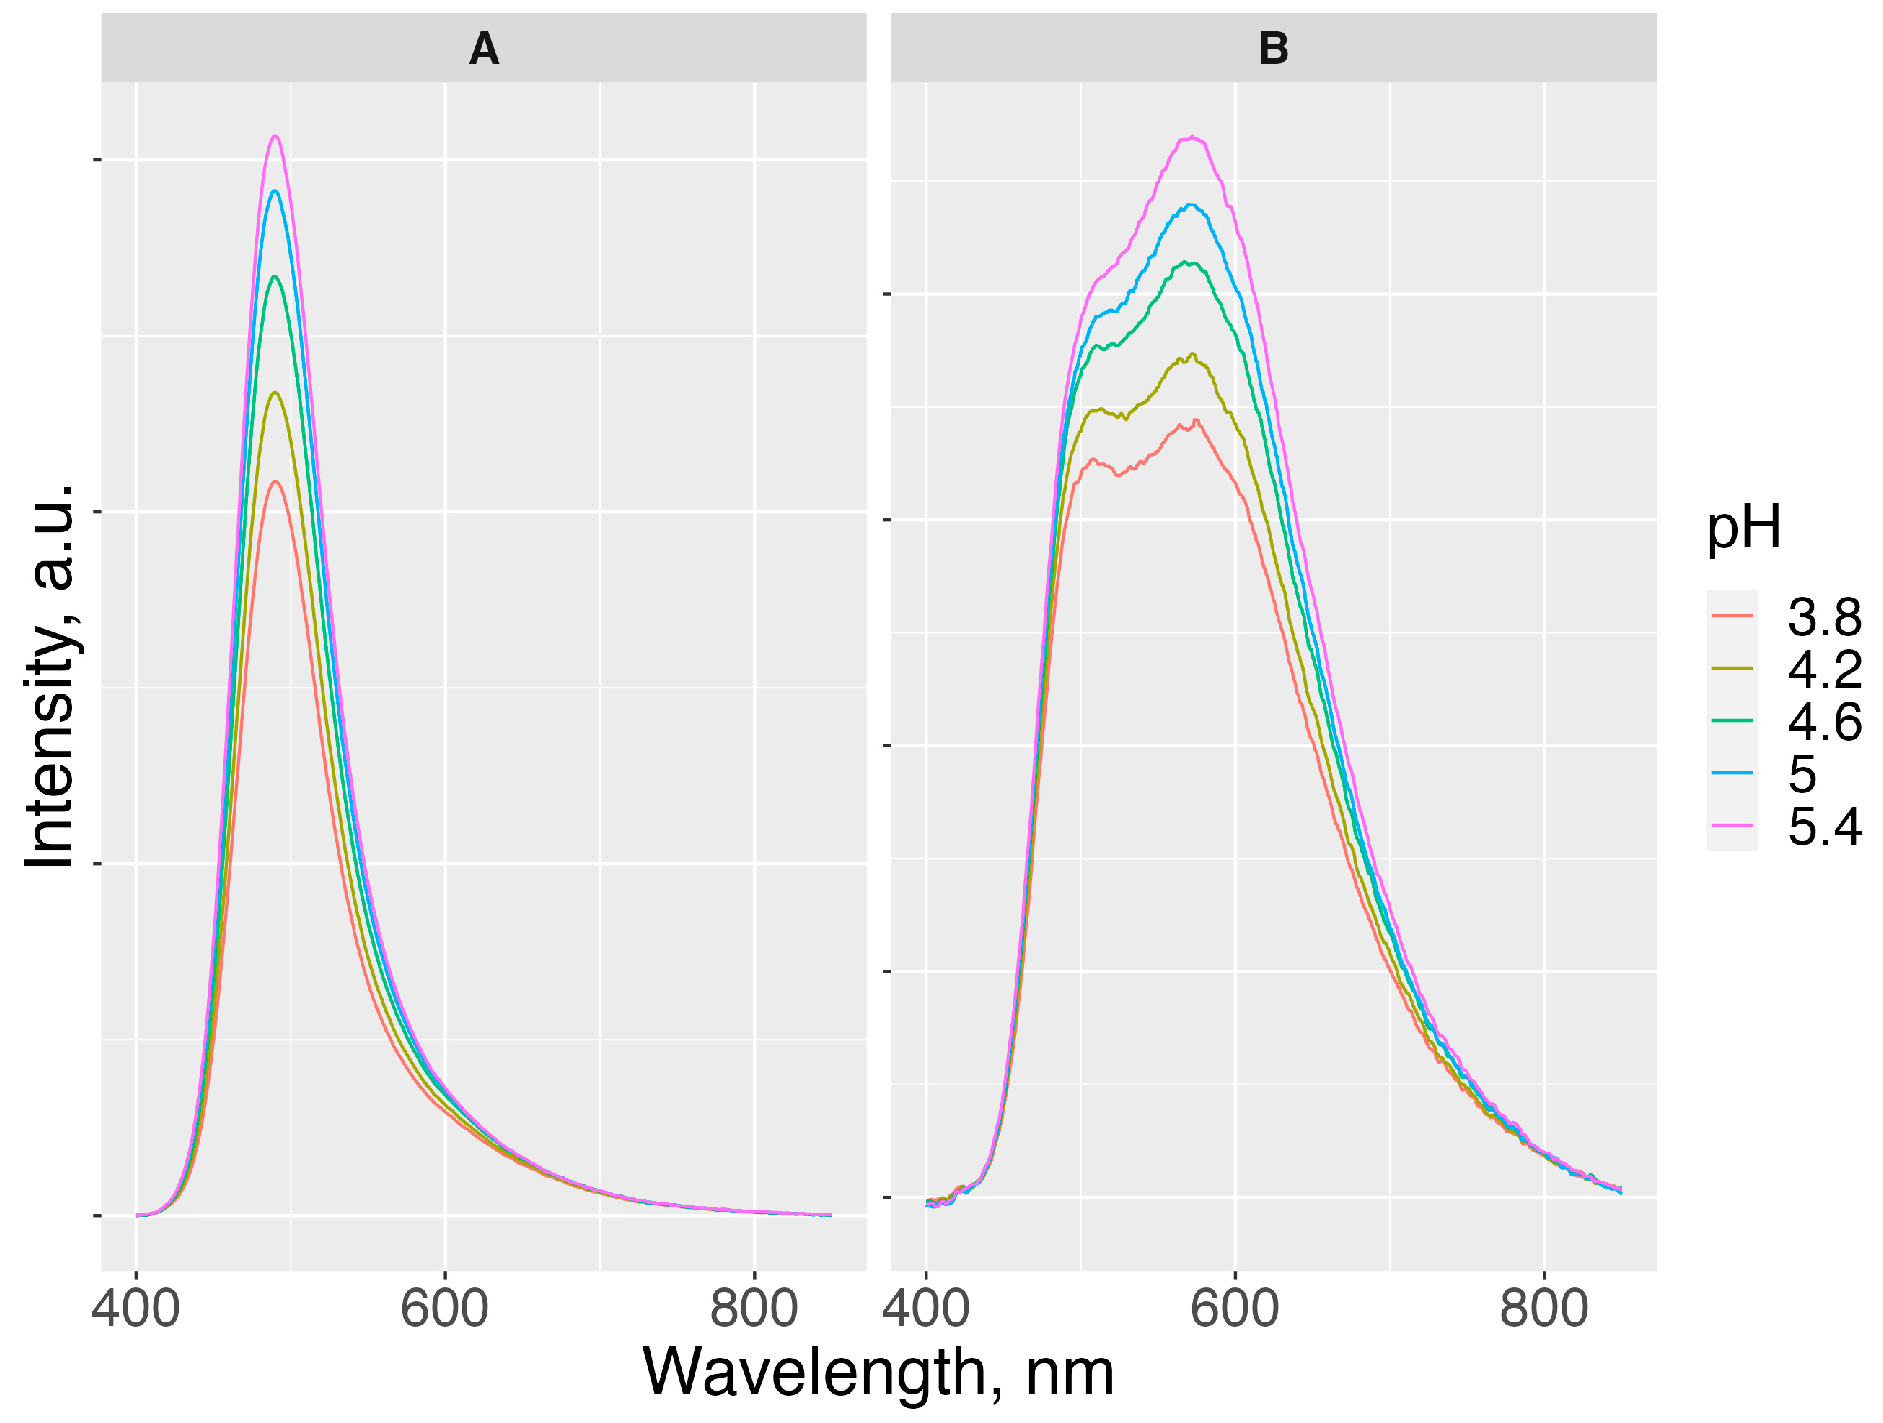
3.5. Blue and Yellow AuNCs Prepared under the Optimal Conditions

Based on the obtained results, the following synthesis conditions were chosen to prepare the samples with the maximum QY of fluorescence (A) and the strongest contribution of yellow emission at reasonably high QY (B) (the variables are in the natural scale):
  • Sample A—cAu 0.2 mmol/L, rAMP 40, razide 0, rcitr 200, and rNa/H 0.5;
  • Sample B—cAu 0.2 mmol/L, rAMP 5, razide 8.5, rcitr 275, and rNa/H 0.75.
The obtained spectra revealed strong blue fluorescence (sample A) or weaker yellow emission (sample B), as seen in Figure 7a. Due to fine optimization of the synthesis, sample B revealed sufficiently strong fluorescence, and the yellow emission band was stronger than the blue one.
To determine the acceptable range of the AuNC concentration for the application in sensing, we investigated the fluorescence response of the reaction mixtures upon dilution with water. The results are shown in Figure 7 (relative concentration equal to 1 corresponded to the reaction mixture without dilution). The fluorescence of sample A was stronger than that of sample B at equal dilution, and a linear increase in the intensity with concentration of the samples was observed until about twofold dilution of the reaction mixture. Thus, 1:1 dilution was used in further experiments.
The emission of samples A and B in acetate buffered solution was found to be pH-dependent; the pH increase led to noticeable fluorescence strengthening (Figure 8). The ratio of blue and yellow emission bands of sample B was also affected by pH: the increase in pH led to a stronger increase in the emission of the yellow band. Whereas at pH 3.8, the band intensities were almost equal, at pH 5.4, the blue band appeared as a short-wave shoulder at the major yellow band.
The fluorescence of samples A and B was quenched in the presence of mercury(II) ions. The experiments were performed at pH 3.8 and 6.0; the results are shown in Figure 9a. Sample A was more sensitive, and its response to the presence of mercury(II) was more pH-dependent. The limit of detection (estimated as the intersection of the calibration curve with the lower limit of the confidence interval for the mercury-free samples) for sample A was 0.2 μmol/L at pH 6.0 and 1.0 μmol/L at pH 3.8, being of 2–3 μmol/L for sample B, slightly affected by pH.
The data in Figure 9b show that the response of sample A to the presence of mercury(II) obeyed the Stern–Volmer equation up to 60–100 μmol/L of Hg(II), depending on pH. The quenching constant kqτ0 was 1.5 × 10⁵ L/mol at pH 6.0 and 2 × 10⁴ L/mol at pH 3.8. The response of sample B deviated from the Stern–Volmer equation even in the lowest concentration range. The shape of the fluorescence spectrum of sample A was not changed in the presence of mercury(II), whereas in the case of sample B, the blue emission band was quenched stronger than the yellow one (Figure 10).
Finally, we probed the selectivity of fluorescence intensity of samples A and B to the presence of other salts at pH 6.0 (Figure 11). The strongest decrease in the fluorescence intensity was observed in the cases of Hg(NO3)2 and Fe2(SO4)3. A weaker but still noticeable decrease in fluorescence intensity was observed for CuSO4. The presence of 1 mmol/L of other salts (NaN3, CdSO4, CoSO4, NaCl, NiCl2, and Pb(CH3COO)2) did not lead to a noticeable decrease in the fluorescence intensity.

4. Discussion

According to the data in Figure 1, spectral properties of the products prepared via mixing the “interacting species” (AMP, citrate, and NaN3) in different orders and then diluting with water and adding HAuCl4 or adding HAuCl4 and diluting with water (black and grey spectra, respectively) were only slightly dependent on the addittion order of AMP, citrate, and NaN3. When HAuCl4 was added to the diluted mixture of other species, the normalized emission spectra were somewhat stronger, probably due to less pronounced aggregation of the gold-containing species formed in more dilute systems.
When AMP, citrate, and NaN3 were added in different orders to the stock solution of HAuCl4, followed by dilution (colored spectra in Figure 1), the reaction products were strongly different:
  • If HAuCl4 was first mixed with citrate and then AMP and NaN3 were added, the absorption spectra were weaker in the 300–350 nm characteristic range, showing long-wave scattering (blue and pink curves in Figure 1a). The formation of larger gold species via the reduction of citrate in the absence of an efficient stabilizer (AMP) could explain that fact. Due to low absorbance at 365 nm, the normalized emission intensity was still comparable to other spectra (Figure 1b);
  • If NaN3 was added to the mixture after AMP and citrate, the long-wave yellow emission was suppressed (blue and brown curves in Figure 1a). Hence, although the AuNCs formation in the AMP + HAuCl4 + citrate system was complete only within 2–3 h at 90 °C (taking days at room temperature [11,12]), its initial stage was fast, and the formed intermediate was not sensitive to NaN3 which did not impart yellow emission in that case;
  • If citrate was the last component introduced prior to dilution and heating, the spectral properties of the product were independent of the order of AMP and NaN3 addition (red and green curves). Hence, the competing coordination of AMP and NaN3 with gold(III) before the reduction was fast, and the mixture came to equilibrium within 15 min after adding the components. On the other hand, our trials showed that the interaction of HAuCl4 with AMP alone was slower (yellow coloration due to the complex formation was developed within hours). Likely, the interaction of HAuCl4 with AMP was multistage: the initial coordination was relatively fast and could affect the AuNCs synthesis, whereas complete ligand exchange leading to the coloration was slower.
The order of the components mixing “HAuCl4 → NaN3 → citrate → AMP → water” gave the product emitting properties, which were identical to those of AuNCs obtained via mixing of NaN3, citrate, and AMP, followed by the addition of HAuCl4 and dilution (i.e., kinetic control over competing reactions of gold(III) with other reagents). Hence, the rate of the components’ interaction with HAuCl4 followed the NaN3 > citrate > AMP order, which coincided with our visual observations (immediate yellow coloration upon mixing of HAuCl4 and NaN3, darkening within 15–20 min upon mixing of HAuCl4 and citrate, and yellow coloration within hours upon mixing of HAuCl4 and AMP).
In view of the observations on the samples prepared using different orders of the components mixing, we selected the citrate → NaN3 → AMP → water → HAuCl4 order to be used in further experiments aiming to tune the spectral properties via optimization of the ratio of the components. The following synthetic variables were varied in the two-level full factorial design (Table A1): concentration of HAuCl4 (cAu), molar ratio of AMP to HAuCl4 (rAMP), molar ratio of NaN3 to HAuCl4 (razide), molar ratio of total citrate to HAuCl4 (rcitr), and molar ratio of sodium citrate to total citrate including citric acid (rNa/H). Let us briefly comment on the selection of the variables and their ranges.
The presence of citrate was essential to produce fluorescent AuNCs [10,14]. Its molar excess with respect to initial gold(III) (rcitr) was chosen high enough to accelerate the nucleation and to prevent the formation of larger gold nanoparticles as, for example, in the conventional Turkevich method (at rcitr ~ 1–10) [18,19]. The presence of AMP and NaN3 was necessary to stabilize the AuNCs against growth into insoluble precipitate and to trigger the appearance of yellow emission, respectively; their excess was chosen in trial experiments. Since the behavior of gold(III), AMP, and azide in the solution was pH-dependent, the fraction of CitrNa in the mixture with CitrH (rNa/H) was varied to adjust the mixture acidity; furthermore, due to great excess of citrate, the reaction mixture pH was maintained independent of the concentration of other components. Finally, the initial content of HAuCl4 was varied since the increase in gold(III) concentration could affect the coagulation of gold species and, thus, the optical properties of AuNCs [19,20].
Analysis of the series of the samples prepared as described in Table A1 revealed that the mixture acidity and excess of NaN3 were the principal factors affecting the overall QY of the AuNCs. Further experiments described in Section 3.3 demonstrated that the dependence on the mixture acidity was not linear, the optimal pH being 4.65. At that pH, the starting aurate complex existed in two forms, [AuCl4] and [AuCl3(OH)] in the ratio of 7:3 [21]. The increase or decrease in pH relative to the 4.65 value could increase the content of either form of the aurate but decreased QY of the produced AuNCs; therefore, it seems unlikely that the observed extremal dependence on pH was due to the effect on the form of the chloroaurate complex. For the same reason, the protonation of citrate could not be considered the primary reason for the observed behavior. As for AMP, its protonation constants are pKa,1 = 6.43 and pKa,2 = 3.93 [22]. Since, at the optimal pH, no effect of the AMP excess on QY of AuNCs was revealed (Figure 4), it is not likely that any of the AMP forms was stronger bound with gold(III) and thus influenced the synthesis. However, it is interesting to note that pH 4.65, optimal to maximize the QY, corresponded to the conditions of coexistence of equimolar amounts of the neutral and singly deprotonated forms of AMP, which have been found the most prone to self-stacking [23]. The AMP stacking was probably essential for efficiently stabilizing the forming AuNCs. This suggestion needs additional verification, which is beyond the scope of this study.
The QY values achieved in our study (up to 9.3% under the optimized conditions) were typical of AuNCs shown in other reports [1]. The QY can likely be improved via purification of the crude reaction mixtures considered herein since they could contain a fraction of absorbing but not emitting species. Furthermore, the excitation wavelength (365 nm) was chosen in view of the instrument availability and might not exactly correspond to the optimal excitation energy.
Optimization of the synthesis conditions to achieve the purest yellow emission possible in the scope of the considered procedure was trickier since the appearance of the yellow band was triggered by the introduction of NaN3, which at the same time reduced the overall QY of AuNCs. That complication was addressed in this study using the composite target function (3) accounting for both response variables, QY and I600/I490. Of course, the shape of that function (threshold value of QY below which the target function was zeroed and the strength of penalty) could be altered depending on the goal of the experiment and the available equipment, and the optimized conditions could be somewhat different from those derived in our study.
The dependence of the emission intensity of samples A and B on pH (Figure 8) could be explained by the ionization of the capping agent stabilizing the AuNCs (AMP). The increase in pH from 3.8 to 5.4 corresponded to deprotonation of the phosphate group in AMP [22]. The exact reason for the simultaneous increase in the emission intensity (suppression of AuNCs aggregation due to electrostatic repulsion or direct influence on the energy of the ground/excited states of AuNCs and/or the lifetime of the excited state) demands further investigation.
Both samples revealed stronger sensitivity to mercury(II) at pH 6.0 than at pH 3.8, possibly due to deprotonation of the capping agent (AMP), favoring electrostatic attraction of oppositely charged Hg2+ cations. The blue-emitting sample A was found to be more sensitive to the presence of mercury(II).
The data in Figure 10 revealed that in the case of yellow-emitting sample B, both emission bands were weakened in the presence of mercury(II), but the blue band exhibited stronger quenching. The fact that the quenching of the total emission of sample B did not follow the Stern–Volmer equation (Figure 9b) suggested different mechanisms of quenching via mercury(II) in the cases of blue and yellow emitters present in sample B.
The determined limit of detection of mercury(II) was 1–2 orders of magnitude higher in comparison with the best examples reported in the literature (compare Introduction section). However, there is still space for optimization of the procedure, primarily an increase in pH above 6.0, optimization of the AuNCs content, and purification of the AuNCs sample.
The data on selectivity (Figure 11) suggested that AuNC have a high specificity towards mercury(II) and iron(III). Moreover, quantitatively different responses of the blue and yellow emission bands to the presence of mercury(II) can be exploited in the development of ratiometric and color sensors. The observed decrease in the fluorescence efficiency in the presence of iron(III) was due to the inner filter effects rather than direct quenching [24].
It is important to notice that the introduction of up to 1 mmol/L of sodium azide to samples A and B after the synthesis did not result in fluorescence quenching, suggesting that NaN3 affected the early stages of the nanoclusters synthesis but did not act as a competing capping agent.

5. Conclusions

It was demonstrated that the introduction of sodium azide into the reaction mixture during the preparation of blue-emitting gold nanoclusters in the presence of citrate and adenosine monophosphate led to the appearance of a yellow emission band in the product spectrum. Fine-tuning the components’ ratio in the reaction mixture allowed the preparation of almost pure blue- and yellow-emitting gold nanoclusters.
The blue-emitting AuNC with the strongest emission were obtained at pH 4.5 in the absence of sodium azide, at citrate and adenosine monophosphate molar excess with respect to gold 200 and 40, respectively. The mixture acidity was the major factor affecting the fluorescence efficiency.
The yellow-emitting AuNC were obtained at pH 5.6, citrate, adenosine monophosphate, and sodium azide molar excess 275, 5, and 8.5, respectively. Fine adjustment of the reactant concentration was especially important in that case since the introduction of NaN3 reduced the overall emission intensity. Further experiments are in progress to clarify the mechanism of the NaN3 effect on the synthesis.
The experiments demonstrated selective quenching of the nanoclusters’ fluorescence in the presence of mercury(II) and iron(III) ions. The response of the blue and yellow AuNC to the presence of mercury(II) was clearly different.

Author Contributions

Conceptualization, E.K. and V.S.; methodology, E.K.; software, E.K.; validation, E.K. and E.M.; formal analysis, E.K. and E.M.; investigation, E.K. and E.M.; resources, E.K.; data curation, E.K.; writing—original draft preparation, E.K.; writing—review and editing, V.S.; visualization, E.K.; supervision, V.S.; project administration, V.S.; funding acquisition, V.S. All authors have read and agreed to the published version of the manuscript.

Funding

This research was funded by the Russian Science Foundation, grant number 21-73-20144.

Institutional Review Board Statement

Not applicable.

Informed Consent Statement

Not applicable.

Data Availability Statement

Spectral data presented in this study and the R script for its processing are openly available at https://github.com/eukarr/AuNC (accessed on 13 September 2022).

Conflicts of Interest

The authors declare no conflict of interest. The funders had no role in the design of the study, in the collection, analyses, or interpretation of data, in the writing of the manuscript, or in the decision to publish the results.

Appendix A

Table A1. Factorial design of the main series of samples. The variables are given in the coded scale 1.
Sample No.cAurAMPrcitrrNa/Hrazide
100000
200000
300000
40000−1
50000−1
60000−1
7−1−1−1−1−1
8−1−1−1−11
9−1−1−11−1
10−1−1−111
11−1−11−1−1
12−1−11−11
13−1−111−1
14−1−1111
15−11−1−1−1
16−11−1−11
17−11−11−1
18−11−111
19−111−1−1
20−111−11
21−1111−1
22−11111
231−1−1−1−1
241−1−1−11
251−1−11−1
261−1−111
271−11−1−1
281−11−11
291−111−1
301−1111
3111−1−1−1
3211−1−11
3311−11−1
3411−111
35111−1−1
36111−11
371111−1
3811111
1 cAu = c(HAuCl4): −1 for 0.15 mmol/L, 0 for 0.20 mmol/L, 1 for 0.25 mmol/L; rAMP = c(AMP)/c(HAuCl4): −1 for 10, 0 for 20, 1 for 30; rcitr = [c(CitrH) + c(CitrNa)]/c(HAuCl4): −1 for 150, 0 for 200, 1 for 250; rNa/H = c(CitrNa)/[c(CitrH) + c(CitrNa)]: −1 for 0.1, 0 for 0.5, 1 for 0.9; razide = c(NaN3)/c(HAuCl4): −1 for 0, 0 for 5, 1 for 10.
Table A2. Factorial design of additional series of samples prepared to maximize yellow emission. The variables are given in the coded scale 1.
Sample No.rAMPrcitrrNa/Hrazide
750000
760000
770000
78−1−1−1−1
791−1−1−1
80−11−1−1
8111−1−1
82−1−11−1
831−11−1
84−111−1
85111−1
86−1−1−11
871−1−11
88−11−11
8911−11
90−1−111
911−111
92−1111
931111
1 c(HAuCl4) = 0.2 mmol/L throughout the series; rAMP = c(AMP)/c(HAuCl4): −1 for 5, 0 for 7.5, 1 for 10; rcitr = [c(CitrH) + c(CitrNa)]/c(HAuCl4): −1 for 225, 0 for 250, 1 for 275; rNa/H = c(CitrNa)/[c(CitrH) + c(CitrNa)]: −1 for 0.75, 0 for 0.8, 1 for 0.85; razide = c(NaN3)/c(HAuCl4): −1 for 8.5, 0 for 9, 1 for 9.5.

Appendix B

Table A3. ANOVA results for quantum yield (%) of the product fluorescence depending on the synthesis conditions. Main factorial-based series; the variables notation follows Table A1 1.
Factor (Interaction)SSDFFP
cAu0.35210.1220.730
rAMP1.0410.3620.553
razide73.1125.54.7∙10−5
rcitr0.07110.0250.876
rNa/H86.9130.31.6∙10−5
cAu:rAMP0.00310.0010.974
cAu:razide0.07710.0270.872
cAu:rcitr0.07310.0250.875
cAu:rNa/H0.00110.00040.985
rAMP:razide0.59810.2080.653
rAMP:rcitr0.34310.1190.733
rAMP:rNa/H0.86910.3020.588
razide:rcitr1.32110.4600.505
razide:rNa/H0.49310.1720.683
rcitr:rNa/H2.52510.8790.359
Residuals63.222
1 SS—sum of squares, DF—number of degrees of freedom, F—value of the Fisher statistic, Pp-value of the significance of the F value. Overall statistics for the linear model, including all main effects and their second-order interactions: adjusted R2: 0.5399, F-statistic: 3.894 on 15 and 22 DF, p-value: 0.002.
Table A4. ANOVA results for the ratio of emission intensities at 600 and 490 nm (λex 365 nm) of the product depending on the synthesis conditions. Main factorial-based series; the variables notation follows Table A1 1.
Factor (Interaction)SSDFFP
cAu0.00115.450.035
rAMP0.05712572∙10−10
razide0.72013233<10−15
rcitr0.00113.500.082
rNa/H0.05012275∙10−10
cAu:rAMP<0.00110.6020.450
cAu:razide<0.00110.0510.824
cAu:rcitr<0.00110.0030.956
cAu:rNa/H<0.00111.020.330
rAMP:razide0.05112304∙10−10
rAMP:rcitr<0.00110.2620.617
rAMP:rNa/H<0.00111.100.312
razide:rcitr0.003115.50.001
razide:rNa/H0.09214119∙10−12
rcitr:rNa/H<0.00111.560.232
Residuals0.00314
1 SS—sum of squares, DF—number of degrees of freedom, F—value of the Fisher statistic, Pp-value of the significance of the F value. Overall statistics for the linear model, including all main effects and their second-order interactions: adjusted R2: 0.994, F-statistic: 296 on 14 and 15 DF, p-value: 8∙10−15.
Table A5. ANOVA results for the target function T (3) of the product depending on the synthesis conditions. Additional factorial-based series; the variables notation follows Table A2 1.
Factor (Interaction)SSDFFP
rAMP2.9312672∙10−7
razide0.02312.120.184
rcitr0.10619.660.014
rNa/H0.653159.66∙10−5
rAMP:razide<0.00110.0260.875
rAMP:rcitr0.00410.4090.540
rAMP:rNa/H0.181116.50.003
razide:rcitr0.01711.550.248
razide:rNa/H0.00310.2680.619
rcitr:rNa/H0.00110.0810.784
Residuals0.0888
1 SS—sum of squares, DF—number of degrees of freedom, F—value of the Fisher statistic, Pp-value of the significance of the F value. Overall statistics for the linear model, including all main effects and their second-order interactions: adjusted R2: 0.951, F-statistic: 35.75 on 10 and 8 DF, p-value: 1.5∙10−5.

References

  1. Qu, X.; Li, Y.; Li, L.; Wang, Y.; Liang, J.; Liang, J. Fluorescent gold nanoclusters: Synthesis and recent biological application. J. Nanomater. 2015, 2015, 784097. [Google Scholar] [CrossRef]
  2. van de Looij, S.M.; Hebels, E.R.; Viola, M.; Hembury, M.; Oliveira, S.; Vermonden, T. Gold nanoclusters: Imaging, therapy, and theranostic roles in biomedical applications. Bioconjugate Chem. 2022, 33, 4–23. [Google Scholar] [CrossRef] [PubMed]
  3. Cui, H.; Shao, Z.-S.; Song, Z.; Wang, Y.-B.; Wang, H.-S. Development of gold nanoclusters: From preparation to applications in the field of biomedicine. J. Mater. Chem. C 2020, 8, 14312–14333. [Google Scholar] [CrossRef]
  4. Zheng, J.; Petty, J.T.; Dickson, R.M. High quantum yield blue emission from water-soluble Au8 nanodots. J. Am. Chem. Soc. 2003, 125, 7780–7781. [Google Scholar] [CrossRef] [PubMed]
  5. Zheng, Y.; Wu, J.; Jiang, H.; Wang, X. Gold nanoclusters for theranostic applications. Coord. Chem. Rev. 2021, 431, 213689. [Google Scholar] [CrossRef]
  6. He, Z.; Shu, T.; Su, L.; Zhang, X. Strategies of luminescent gold nanoclusters for chemo-/bio-sensing. Molecules 2019, 24, 3045. [Google Scholar] [CrossRef] [PubMed]
  7. Xie, J.; Zheng, Y.; Ying, J.Y. Highly selective and ultrasensitive detection of Hg2+ based on fluorescence quenching of Au nanoclusters by Hg2+–Au+ interactions. Chem. Commun. 2010, 46, 961–963. [Google Scholar] [CrossRef] [PubMed]
  8. Lin, Y.-H.; Tseng, W.-L. Ultrasensitive sensing of Hg2+ and CH3Hg+ based on the fluorescence quenching of lysozyme type VI-stabilized gold nanoclusters. Anal. Chem. 2010, 82, 9194–9200. [Google Scholar] [CrossRef]
  9. Shojaeifard, Z.; Hemmateenejad, B.; Shamsipur, M. Efficient on–off ratiometric fluorescence probe for cyanide ion based on perturbation of the interaction between gold nanoclusters and a copper(II)-phthalocyanine complex. ACS Appl. Mater. Interfaces 2016, 8, 15177–15186. [Google Scholar] [CrossRef]
  10. Li, H.; Huang, H.; Feng, J.-J.; Luo, X.; Fang, K.-M.; Wang, Z.-G.; Wang, A.-J. A polypeptide-mediated synthesis of green fluorescent gold nanoclusters for Fe3+ sensing and bioimaging. J. Colloid Interface Sci. 2017, 506, 386–392. [Google Scholar] [CrossRef]
  11. Lopez, A.; Liu, J. Light-activated metal-coordinated supramolecular complexes with charge-directed self-assembly. J. Phys. Chem. C 2013, 117, 3653–3661. [Google Scholar] [CrossRef]
  12. Ungor, D.; Csapó, E.; Kismárton, B.; Juhász, Á.; Dékány, I. Nucleotide-directed syntheses of gold nanohybrid systems with structure-dependent optical features: Selective fluorescence sensing of Fe3+ ions. Colloids Surf. B 2017, 155, 135–141. [Google Scholar] [CrossRef] [PubMed]
  13. Nie, F.; Ga, L.; Ai, J. One-pot synthesis of nucleoside-templated fluorescent silver nanoparticles and gold nanoparticles. ACS Omega 2019, 4, 7643–7649. [Google Scholar] [CrossRef] [PubMed]
  14. Ivanova, N.K.; Karpushkin, E.A.; Lopatina, L.I.; Sergeyev, V.G. DNA as a template for synthesis of fluorescent gold nanoclusters. Mendeleev Commun. 2023, 33, 346–348. [Google Scholar] [CrossRef]
  15. Karpushkin, E.A.; Ivanova, N.K.; Mesnyankina, E.A.; Sergeyev, V.G. Synthesis of fluorescent gold nanoclusters in the presence of adenosine monophosphate: Effect of azide ions. Mendeleev Commun. 2023, submitted.
  16. Lichstein, H.C. Studies of the effect of sodium azide on microbic growth and respiration: III. The effect of sodium azide on the gas metabolism of B. subtilis and P. aeruginosa and the influence of pyocyanine on the gas exchange of a pyocyanine-free strain of P. aeruginosa in the presence of sodium azide. J. Bacteriol. 1944, 47, 239–251. [Google Scholar] [CrossRef] [PubMed]
  17. Brouwer, A.M. Standards for photoluminescence quantum yield measurements in solution (IUPAC Technical Report). Pure Appl. Chem. 2011, 83, 2213–2228. [Google Scholar] [CrossRef]
  18. Turkevich, J.; Stevenson, P.C.; Hillier, J. A study of the nucleation and growth processes in the synthesis of colloidal gold. Discuss. Faraday Soc. 1951, 11, 55–75. [Google Scholar] [CrossRef]
  19. Kimling, J.; Maier, M.; Okenve, B.; Kotaidis, V.; Ballot, H.; Plech, A. Turkevich method for gold nanoparticle synthesis revisited. J. Phys. Chem. B 2006, 110, 15700–15707. [Google Scholar] [CrossRef]
  20. Turkevich, J. Colloidal gold. Part I: Historical and preparative aspects, morphology and structure. Gold Bull. 1985, 18, 86–91. [Google Scholar] [CrossRef]
  21. Usher, A.; McPhail, D.C.; Brugger, J. A spectrophotometric study of aqueous Au(III) halide–hydroxide complexes at 25–80 °C. Geochim. Cosmochim. Acta 2009, 73, 3359–3380. [Google Scholar] [CrossRef]
  22. Tribolet, R.; Sigel, H. Self-association and protonation of adenosine 5′-monophosphate in comparison with its 2′- and 3′-analogues and tubercidin 5′-monophosphate (7-deaza-AMP). Eur. J. Biochem. 1987, 163, 353–363. [Google Scholar] [CrossRef]
  23. Tribolet, R.; Sigel, H. Self-association of adenosine 5′-monophosphate (5′-AMP) as a function of pH and in comparison with adenosine, 2′-AMP and 3′-AMP. Biophys. Chem. 1987, 27, 119–130. [Google Scholar] [CrossRef]
  24. Karpushkin, E.A.; Mesnyankina, E.A.; Tagirova, M.R.; Zaborova, O.V.; Sergeyev, V.G. How to enhance sensitivity of carbonaceous ultrafine particles to metal ions. Russ. J. Gen. Chem. 2022, 92, 2042–2046. [Google Scholar] [CrossRef]
Figure 1. Absorption spectra (a) and emission spectra normalized by absorbance at the excitation wavelength (λex 365 nm) (b) of the AuNCs obtained with different orders of the mixing. Grey spectra: mixing of AMP, NaN3, and citrate in different orders, then adding HAuCl4, finally dilution with water; black spectra: mixing of AMP, NaN3, and citrate in different orders, then dilution with water, finally adding HAuCl4; colored spectra: order of mixing is given in the legend (‘w’ stands for water, ‘citr’ stands for the CitrH + CitrNa mixture, and ‘Au’ stands for HAuCl4).
Analytica 04 00030 g001
Figure 2. Main series factorial-based syntheses: an overview of emission spectra of the products (λex 365 nm, emission intensity normalized by absorbance at λex). Blue curves are for azide-free samples; red curves are for the samples prepared in the presence of sodium azide.
Analytica 04 00030 g002
Figure 3. Response surfaces illustrating changes in the QY depending on the synthesis variables, plotted according to model (1) (a). Emission spectra of the AuNCs obtained in the absence of NaN3, normalized by absorbance at the excitation wavelength (λex 365 nm); the spectra are grouped in panels according to rNa/H, their color codes the level of rAMP (b). The synthesis variables are in the coded scale (Table A1).
Analytica 04 00030 g003
Figure 4. QY (λex 365 nm) of an additional series of samples prepared in the absence of NaN3. The synthesis variables are on a natural scale.
Analytica 04 00030 g004
Figure 5. Response surfaces illustrate the change in the fraction of yellow emission, I600/I490, depending on the synthesis variables, plotted according to Equation (2) (a). Response surfaces illustrate the change in the target function (3) depending on the synthesis variables, plotted according to models (1) and (2) (b). The synthesis variables are in the coded scale (Table A2).
Analytica 04 00030 g005
Figure 6. Response surfaces illustrate a change in the target function T (3) depending on the synthesis variables, plotted according to model (4). The synthesis variables are in the coded scale (Table A2).
Analytica 04 00030 g006
Figure 7. Fluorescence spectra (λ 365 nm) of samples A and B depending on the reaction mixture dilution (a) and integral intensity of the emission as a function of concentration (b). A relative concentration equal to 1 corresponds to a non-diluted reaction mixture.
Analytica 04 00030 g007
Figure 8. Emission spectra (λex 365 nm) of samples A and B at different pH levels created using acetate-buffered solutions (0.1 mol/L).
Analytica 04 00030 g008
Figure 9. The integral intensity of fluorescence (λex 365 nm) of samples A and B as a function of the concentration of mercury(II) nitrate in the sample: the intensity relative to the mercury-free sample (a) and the same data in the coordinates of Stern–Volmer equation (b). The lines in plots (a) are to guide the eye; the lines in plots (b) were obtained as linear regression of the data at c(Hg) < 25 μmol/L. Dashed lines in plots (a) mark the lower confidence interval limit for the mercury-free samples (the measurement at each mercury concentration was repeated five times to assess the standard deviation of the data).
Analytica 04 00030 g009
Figure 10. Emission spectra (λex 365 nm) of samples A and B, normalized to the peak intensity, at different concentrations of mercury(II) (color-coded).
Analytica 04 00030 g010
Figure 11. The relative intensity of emission (λex 365 nm) of samples A and B in the presence of 1 mmol/L of different ions at pH 6.0. Red dashed lines mark the confidence limits of the emission intensity in the absence of the ions. The Na* bar marks the sample containing a tenfold concentration of NaCl, 10 mmol/L.
Analytica 04 00030 g011
Disclaimer/Publisher’s Note: The statements, opinions and data contained in all publications are solely those of the individual author(s) and contributor(s) and not of MDPI and/or the editor(s). MDPI and/or the editor(s) disclaim responsibility for any injury to people or property resulting from any ideas, methods, instructions or products referred to in the content.

