Article

The Therapeutic Potential of Oxyhydrogen Gas in Oncology: A Study on Epstein–Barr Virus-Immortalised B-Lymphoblastoid (TK6) Cells

1
School of Applied Sciences, University of the West of England, Bristol BS16 1QY, UK
2
Water Fuel Engineering, Wakefield WF1 5QY, UK
*
Authors to whom correspondence should be addressed.
Hydrogen 2023, 4(4), 746-759; https://doi.org/10.3390/hydrogen4040047
Submission received: 4 September 2023 / Revised: 15 September 2023 / Accepted: 2 October 2023 / Published: 4 October 2023

Abstract

:
Cancer is a leading cause of mortality worldwide. B-cells are a keystone of the adaptive immune response and are essential for the presentation of tumor-associated antigens to various types of T-cells. Approximately 1.5% of global cancer cases, including breast and gastric carcinomas and both Hodgkin’s and non-Hodgkin’s lymphomas, are linked with prior Epstein–Barr Virus (EBV) infection. Such properties make EBV-infected lymphocytes ideal models for understanding the effect of oxyhydrogen gas on dysfunctional cell cycling. The aim of this study is to assess the effects of the direct infusion of oxyhydrogen gas on the replicative capacity of EBV-immortalised B-lymphocytes. Oxyhydrogen gas was directly infused into cell culture media. Cells were incubated in 95% air and 5% CO2 for up to 72 h. Cell enumeration was assessed with and without the addition of mitogenic growth stimuli, and subsequent cell-cycle analysis was performed. Cell enumeration: An initial trend of replicative inhibition of TK6 cells is noted with a single oxyhydrogen treatment at the 24 and 48 h time points. The daily addition of oxyhydrogen-infused media showed statistically relevant data at 24 and 48 h but not at 72 h. In mitogen-stimulated cells, a non-statistical trend of inhibition was observed at 24, 48 and 72 h. Analysis details a significant increase in DNA in the Sub G1 phase, indicating increased apoptosis.

1. Introduction

There is an increasing body of evidence that both molecular hydrogen (H2) and oxyhydrogen therapies are emerging as effective anti-inflammatory and antioxidant gases [1,2,3,4], which are physiologically well tolerated, as demonstrated in a comprehensive range of clinical trials [5,6,7,8,9].
Oxyhydrogen is a stiochemical mixture of molecular oxygen (33% O2) and molecular hydrogen (66% H2) that is generated through the electrolysis of water, typically in the presence of a catalyst such as potassium hydroxide (KOH). Research into the molecular and biological effects of oxyhydrogen per se is sparse and there are few comparative studies that delineate how the corresponding increase in O2 affects cellular activities. There is, however, a broad spectrum of both clinical and empirical studies that attest to H2 as having anti-allergic [10,11], anti-inflammatory [12,13] and antioxidant [14,15] properties. It is, therefore, reasonable to assume, that with an H2 content of 66% (v/v), oxyhydrogen administration may have similar effects to other hydrogen treatments. As oxyhydrogen gas production requires only a catalyst, electricity and water as consumables, it may provide a cost-effective and sustainable solution for the treatment of complex long-term conditions.
Through enhancing regulatory activities on redox chemistry and signalling, and modulating both adaptive and innate immune responses, H2 therapeutics have been shown to protect and restore homeostatic cellular function under empirical [16,17,18,19] and clinical scrutiny [5,6,7,8,9,20,21,22]. Numerous studies attest to the anti-inflammatory activity of H2, affirming that the levels of pro-inflammatory mediators, which include chemokines (e.g., monocyte chemotactic protein-1 (MCP-1)), cytokines (e.g., tumor necrosis factor-α (TNFα)) and transcription factors (e.g., nuclear factor kappa-light-chain-enhancer of activated B cells (NFκB)), are greatly reduced after H2 administration [14,23,24].
The inflammatory process is an innate immune response that includes the infiltration of white blood cells to a targeted area and the upregulated expression of pro-inflammatory messengers (e.g., cytokines and chemokines) alongside atypical tissue remodelling and hyperbolic angiogenesis. Inordinate amounts of inflammatory markers are often present in the microenvironment of neoplastic tissues, including those that cannot be directly related to hyper-inflammatory processes [25]. This is important to consider when assessing carcinogenic microenvironments, as during distinct stages of tumor initiation the immune system either identifies and destroys nascent cells or, alternatively, promotes the development from functional cells into neoplasms [26]. In addition to having positive effects on the native immune system, H2 has also been demonstrated to recover levels of CD8+ cytotoxic T-cells, responsible for the destruction of non-functional cells, thereby improving the prognosis of Stage IV carcinoma in colorectal cancer patients [7].
Carcinogenic development is influenced by oxidative stress and inflammation, with the consequences of aberrant reactive oxygen/nitrogen species (ROS/RNS, respectively) known to directly oxidatively modify DNA. Oxidative stress describes the disruption of cellular activity that occurs as a result of an increase in the levels of ROS/RNS which can lead to the initiation of apoptosis, membrane lipid oxidation, protein modifications that either inhibit or over-activate functional processes;or through directly targeting DNA, causing lesions and mutations in the genetic sequence [27]. During both carcinogenesis and the recovery process, levels of pro-oxidants including the hydroxyl radical (OH) and peroxynitrite ion (ONOO-) are heightened due to an increase in metabolic activity, a hypoxic environment (lacking O2) and/or, reactions to medications [28]. ROS/RNS are relatively unstable physiological molecules that act as second messengers, or intermediaries, in both apoptotic and survival-related cell signalling pathways. ROS-induced pathways (e.g., mitogen-activated protein kinase (MAPK) and protein tyrosine kinase (PTK) cascades), are also known to influence and enhance the metastatic potential of neoplastic cells [29,30].
Studies into the effects of H2 on malignant cell lines indicate that H2 likely has a dualistic role in redox signalling by (i) inhibiting oxidative activity and supporting metabolic homeostasis [31,32] and (ii) by promoting apoptosis via upregulating redox-induced signalling cascades [33,34]. Recent investigations into the effects of H2 treatments have demonstrated significant reductions in the physiological damage that results from oxidative stress and inflammation [2,35,36]. For example, in mammary tumor models in vitro, hydrogen-rich water (HRW) was shown to inhibit breast cancer cell viability by remediating oxidative distress and vascular endothelial growth factor-induced (VEGF) heteroclite angiogenesis via inflammatory response inhibition [37]. The same study also noted that dietary consumption of hydrogen-rich water delayed the development of human epidermal growth factor receptor-2 (HER2) mammary tumors in BALB-neuT mice, concluding that HRW can suppress breast cancer cell survival in human cells and mammalian hosts. The effects of oxyhydrogen (33% O2/66% H2) gas inhalation were further studied in a ’Real World’ survey of 82 Stage III and Stage IV cancer patients where patients inhaled oxyhydrogen for a minimum of 3 h a day, for 3 months or longer [38]. The evidence collated suggests there were substantial improvements in appetite, cognition, fatigue, pain and sleeplessness after four weeks of daily inhalation, although whether the results from these studies were due to increased apoptosis of malignant cells has yet to be fully elucidated.
As a potential revolutionary anti-inflammatory, antioxidant and anti-tumorigenic substance, interest in hydrogen therapies is rapidly gaining momentum from academic and commercial perspectives, particularly as an adjunctive to classical cancer treatments [38,39,40]. Therefore, effective therapies that target oxidative stress and errant immune responses and/or improve germane immune responses, particularly in oncological disease, are lauded as promising treatments.

2. Safety

In its gaseous state, H2 has a flammability range of 4–94% when combined with oxygen at standard pressure and temperature, therefore the H2-producing devices should not be used near any naked flame or potential sources of ignition.

3. Rationale

To date, the pro-apoptotic, anti-tumor effects of hydrogen therapies on solid tissue cancers have been relatively well-studied [7,8,23,29,40,41,42,43,44,45,46]. However, investigations into leukaemic and lymphoma cell lines remain largely unexplored. As approximately 1.5% of global cancer cases, including breast and gastric carcinomas and both Hodgkin’s and non-Hodgkin’s lymphomas, are linked with prior Epstein–Barr Virus (EBV) infection [47], EBV-immortalised immune cells (B-lymphocytes (TK6 cells)) were selected. Furthermore, TK6 cells are easy to culture, chromosomally stable, of human lineage, and retain expression of the tumor suppressor protein, p53. These properties make such cells ideal models for understanding the effect of oxyhydrogen gas on dysfunctional cell cycling.
In similarity with there being few studies observing the effects of hydrogen on non-solid tumors, research into the effects of oxyhydrogen for the management of cancer is also lacking. Therefore, to assess whether the addition of oxyhydrogen would have the same or comparable effects as H2 only on solid tumors, this original research utilised the HydroVitality™ oxyhydrogen generator (450 mL/min).
Treatment of long-term diseases such as malignancies (e.g., breast cancer, Hodgkin’s and non-Hodgkin’s lymphomas) can be challenging and costly with current pharmaceutical interventions [48,49]. To achieve a better understanding of whether oxyhydrogen could provide an alternative and sustainable therapy for oncological disease, a series of tests were implemented. Firstly, cell enumeration, to observe whether a single treatment or multiple treatments with oxyhydrogen had any noticeable effects on cellular behaviour, was assessed. Secondly, to evaluate whether the initial observations were repeated with the addition of growth stimulus (Concanavalin A), a comparative analysis was applied. Finally, to elucidate how cell cycling was affected by oxyhydrogen administration, flow cytometry analysis was performed.

4. Materials and Methods
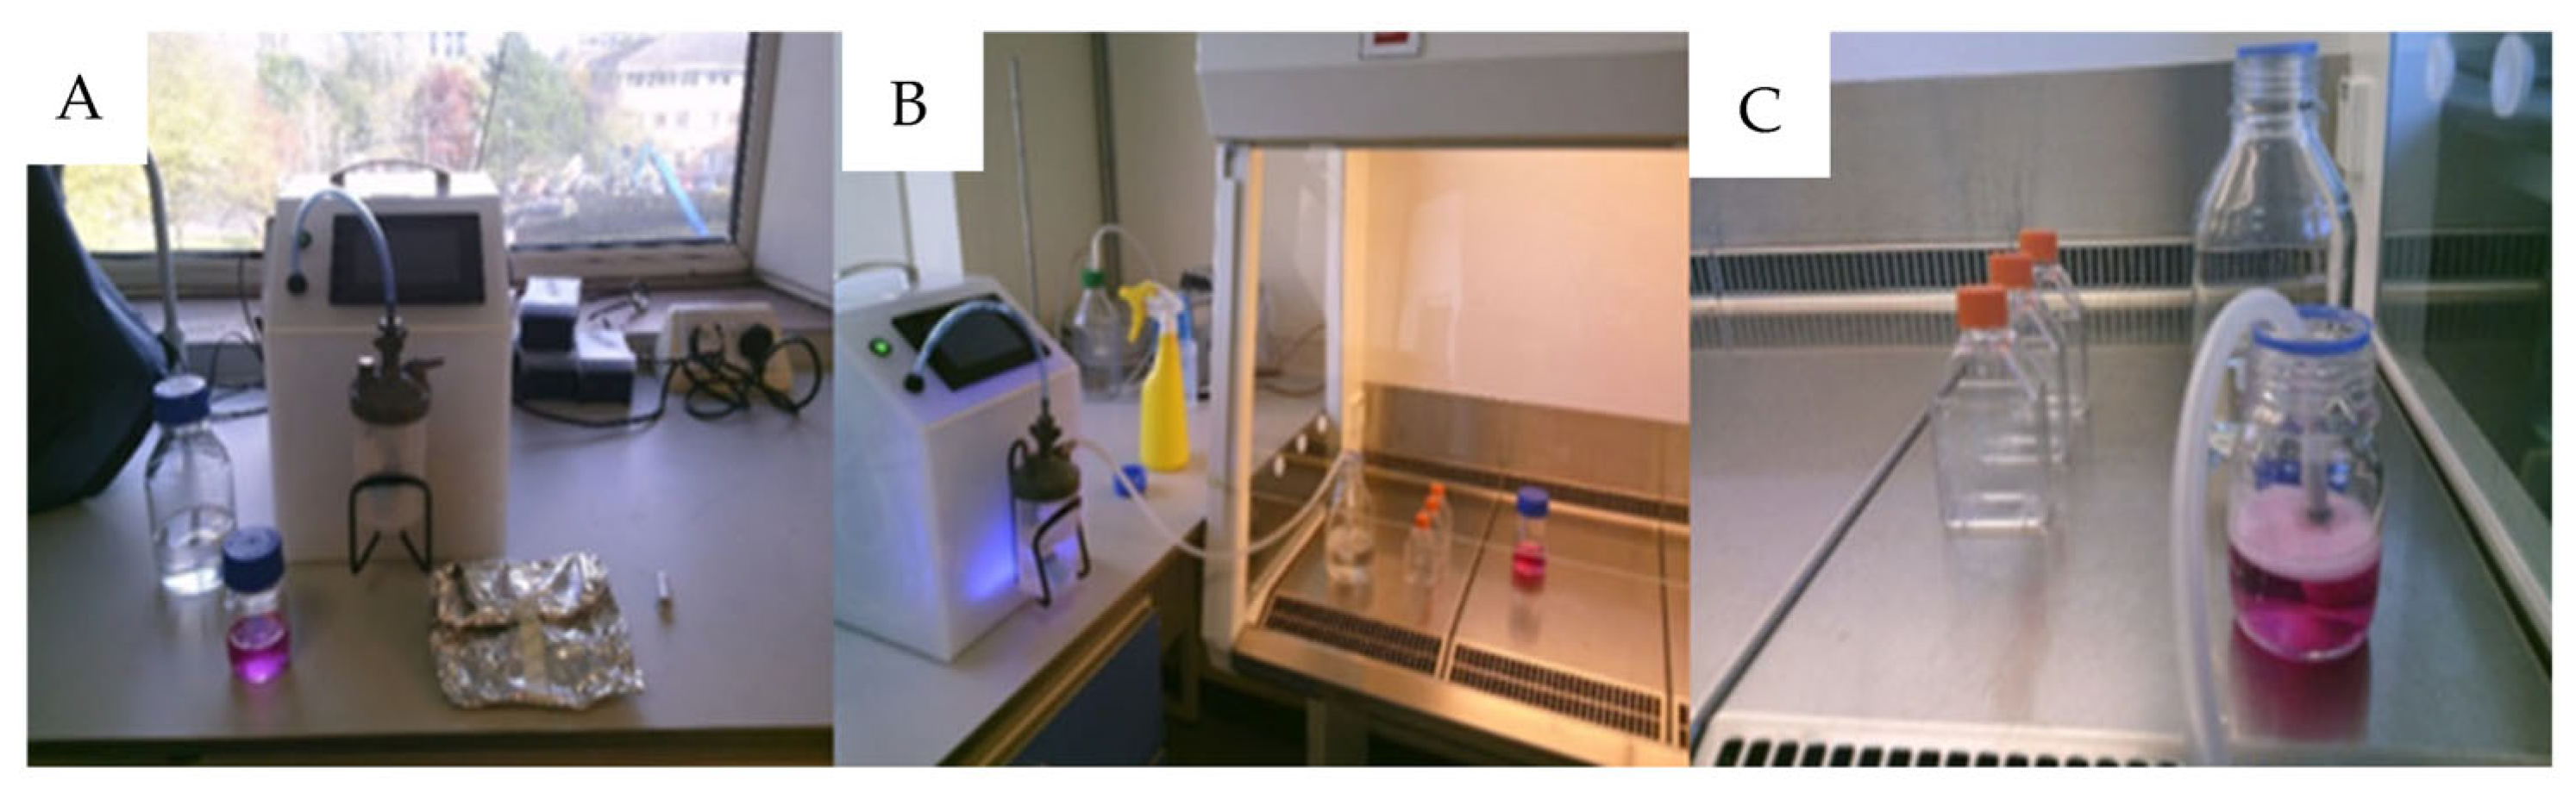
4.1. Sterilization

Aluminium-foil-wrapped silicon tubing was autoclaved at 1200 °C for 15 min and then placed in a drying rack for >1 h. The diffusion stone was placed in 100 mL of 70% ethanol inside the biological safety cabinet (Figure 1A–C), ensuring the diffusion stone was fully submersed in ethanol, and the HydroVitality™ (PWater Fuel Engineering, Wakefield, UK) oxyhydrogen generator was cycled for 2 min. With clean, gloved hands, the diffusion stone was removed from the tubing, wrapped with plastic film within the safety cabinet and stored alongside the tubing in an airtight container. All further processes were completed in a sterile environment, using aseptic techniques. The following are shown from left to right in Figure 1: (A) Identifies the equipment needed for sterilization and infusion (100 mL 70% ethanol; 60 mL Roswell Park Medical Institute 1640 (RPMI + L-glutamine) (Thermo Fisher Scientific, Waltham, MA, USA, Cat. #11875093) (RPMI) cell culture medium; HydroVitality oxyhydrogen generator; 6 mM silicon tubing (in foil) and 0.5-micron diffusion stone). (B) Shows how the equipment was sterilized. (C) Infusion of cell media.

4.2. Infusion

To assess whether the infusion of oxyhydrogen into cell culture media would have any effects on the viability and proliferation of TK6 cells, 60 mL of RPMI media was infused in sterilised glass 150 mL Duran bottles for 30 min using the HydroVitality™ oxyhydrogen generator (450 mL/min/oxyhydrogen). To increase the pressure and improve the infusion of oxyhydrogen into the media, the HydroVitality™ device was connected to a 0.5-micron stainless steel diffusion stone via 6 mM silicon tubing. A total of 10% foetal bovine serum (FBS) (Thermo Fisher Scientific, Waltham, MA, USA, Cat. #A3160501) was added post-infusion. As antibiotics can affect both gene expression and regulation [50], no antibiotic substances were added.

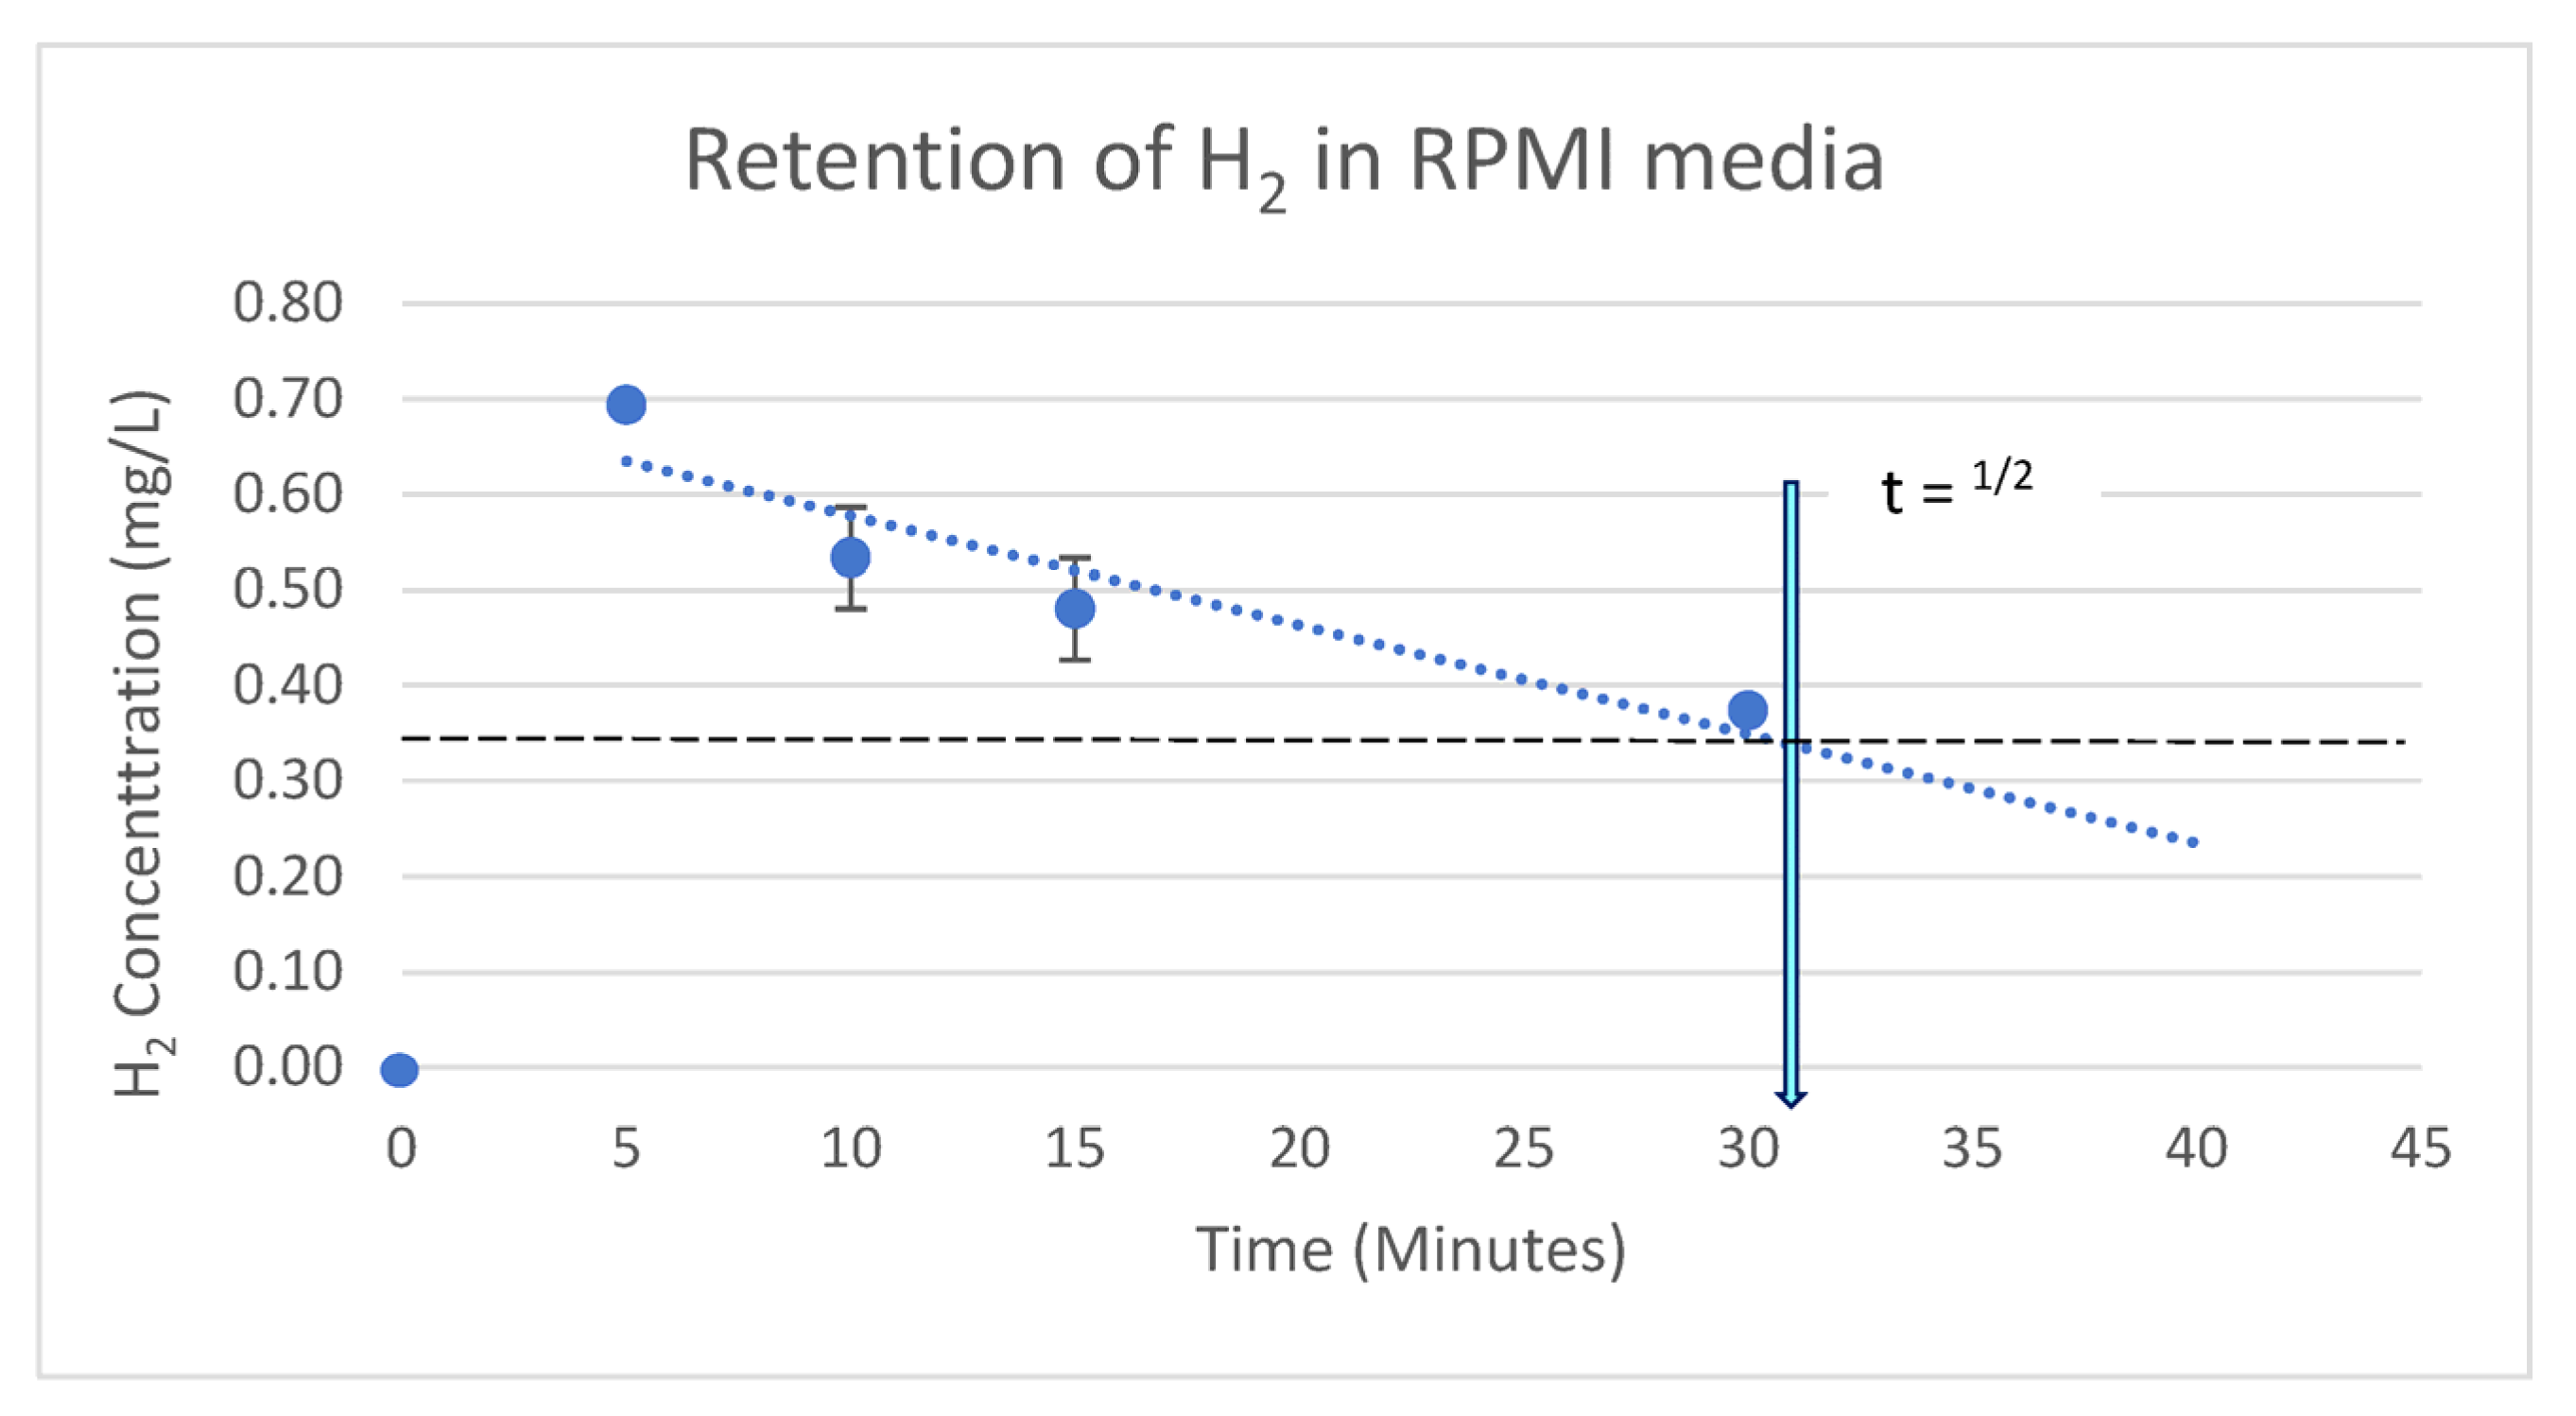
4.3. Retention of H2 in RPMI 1640 Cell Growth Medium

H2 measurements for oxyhydrogen were taken every 5 min for 15 min, and then again at 30 min, using the H2Blue™ (H2 Sciences Inc., Henderson, NV, USA) titration method. The measurements for oxyhydrogen were multiplied by the saturation point of H2 (1.6 mg/L, at 11 m elevation from sea level) to account for the displacement of H2 by O2 (personal communication, CEO, H2-analytics R. Sharpe). O2 measurements were obtained using an O2 electrode (Hannah Instruments Ltd., Bedfordshire, UK, Cat. #Opdo™ HI98198) immediately after infusion and at 5, 10,15 and 30 min.

4.4. Experimental Design: Acute (Single) Treatment

TK6 cells (ATCC CRL 8015) were kindly donated by Dr. A. Thomas, University of the West of England, Bristol, UK.
Control: T-25 flasks, each containing 20 mL of RPMI +10% Foetal Bovine Serum—FBS (complete RPMI (cRPMI)) media were seeded at 1.5 × 10⁵ cells per mL. Cells were incubated at 37 °C with 5% CO2 (LEEC, Nottingham, UK. Precision 190). All experiments were performed in triplicate.
Treatment: A total of 60 mL of non-complete RPMI (-− serum) media was infused with oxyhydrogen (300 mL/min/H2 + 150 mL/min/O2) gas for 30 min. A total of 6 mL of FBS was added post-infusion and 1.5 × 10⁵ cells per mL were added to T-25 flasks (20 mL cRPMI/flask). Cells were incubated at 37 °C with 5% CO2 and assessed each day at 24, 48 and 72 h time points. All experiments were performed in triplicate.

4.5. Experimental Design: Chronic (Daily) Treatment

For both the control and treatment groups, 20 mL of fresh media, i.e., cRPMI/oxyhydrogen-infused or unadulterated cRPMI, was added to the culture flask each day. Cells were incubated at 37 °C with 5% CO2 and assessed at 24 (one infusion), 48 (two infusions) and 72 h (three infusions) time points.

4.6. Cell Numeration Assay

Cells were gently agitated by hand before 1 mL was removed from the flask and added to a sterile centrifuge tube. The tubes were then centrifuged at 400× g (Avantor™/VWR™, Leicestershire, UK. Microstar 17) for 5 min, forming a pellet of cells in the bottom of the tube. A total of 20 µL of cells were removed and transferred into a 96-well plate. A total of 20 µL of Trypan Blue (Sigma Aldrich, St. Louis, MO, USA, #T8154-100ML) was added to the well and mixed well using the motion of the pipette. A total of 10 µL of this mixture was pipetted onto a glass haemocytometer and cell numeration and viability were assessed using the CytoSmart™ device and software (Axion Biosystems Inc., Atlanta, GA, USA).

4.7. Mitogen Treatment

Using a method adapted from Xu et al. (2006) and Wei et al. (2013), 16 µg/mL of the lymphocyte stimulant Concanavalin A (Sigma Aldrich, St. Louis, MO, USA. Cat. #C2010-25MG) was added to each T-25 flask immediately after infusion and before the addition of cells [51,52].

4.8. Flow Cytometry

A total of 1 mL of cell suspension was removed from each culture flask and transferred into 1.5 mL centrifuge tubes. Cells were centrifuged at 400× g for 5 min. Approximately 200,000 cells were counted and the corresponding volume for each culture was subsequently transferred to centrifuge tubes and centrifuged at 400× g for 5 min at 4 °C. The supernatant was removed, and 200 µL of ice-cold phosphate buffer saline (PBS) (Sigma Aldrich, St. Louis, MO, USA. Cat. #P4417) was added to each tube. Each cell suspension was transferred to cryovials. A total of 1 mL of ice-cold 80% ethanol was slowly added to each cryovial whilst being vortexed (Cole-Parmer, St. Neots, UK. V series Stuart, Cat. #WZ-04729-01). Samples were left in ice for 10 min to fix and stored at −20 °C for 24 h.
On the day of analysis, the samples were warmed to room temperature (21 °C) and 1 mL of PBS was added to the cells. Cells were then centrifuged at 600× g for 5 min and the supernatant removed. Each sample was resuspended in 478.5 µL of PBS along with 1.5 µL RNase A (Sigma Aldrich, St. Louis, MO, USA. Cat. #10109142001). This was incubated at room temperature for one hour. After incubation, 20 µL of propidium iodide stain (50 µg (PI)/1 mL (PBS)) (Thermo Fisher Scientific, Waltham, MA, USA. Cat. #P1304MP) was added to each sample and the centrifuge tubes covered in foil to prevent light access. Flow cytometry was conducted using the BD Accuri™ C6 Plus flow cytometer (BD Biosciences, Wokingham, UK).

4.9. Statistical Analysis

All data are reported as the mean (n = 3) and the standard error of the mean (mean ± SEM). Statistical analysis was performed using Microsoft Excel™ (2023) software (Microsoft 365 MSO (Version 2308 Build 16.0.16731.20182)). A paired two-sample t-test assuming equal variance was conducted to determine statistically significant differences between groups. Statistically significant data were defined as p < 0.05.

5. Results

5.1. pH

To assess the effects of oxyhydrogen infusion on the pH of the RPMI media, the pH was measured 5 min post-infusion with the Jenway 3510 apparatus at 19 °C (±2 °C). The results increased from 7.25 (manufacturer’s standard) to 8.3 after 30 min of infusion with the HydroVitality™ oxyhydrogen generator.

5.2. Retention of Infused H2 in Cell Media

To confirm that H2 had been dissolved into the media, Figure 2 illustrates the levels and retention of H2 in cRPMI. Before infusion, there were no detectable levels of dissolved H2 in the media. Infusion increased the H2 content of RPMI media to 0.69 mg/L/H2, and this gradually decreased over a 30 min time period demonstrating the half-life of H2 in RPMI media to be approximately 31 min (extrapolated data).
The blue line shows the trendline for dissolved levels of H2 in RPMI media following a 30 min infusion using the HydroVitality™ oxyhydrogen generator (300 mL/min/H2 + 150 mL/min/O2). n = 3 for all samples. The horizontal Black dotted line indicates a 50% drop in H2. The dotted Blue line represents the line of best fit, or trend, from the data produced. The intersection between the two, shown with the pale blue arrow, highlights the half-life (t1/2) of H2 in cRPMI (Figure 2).

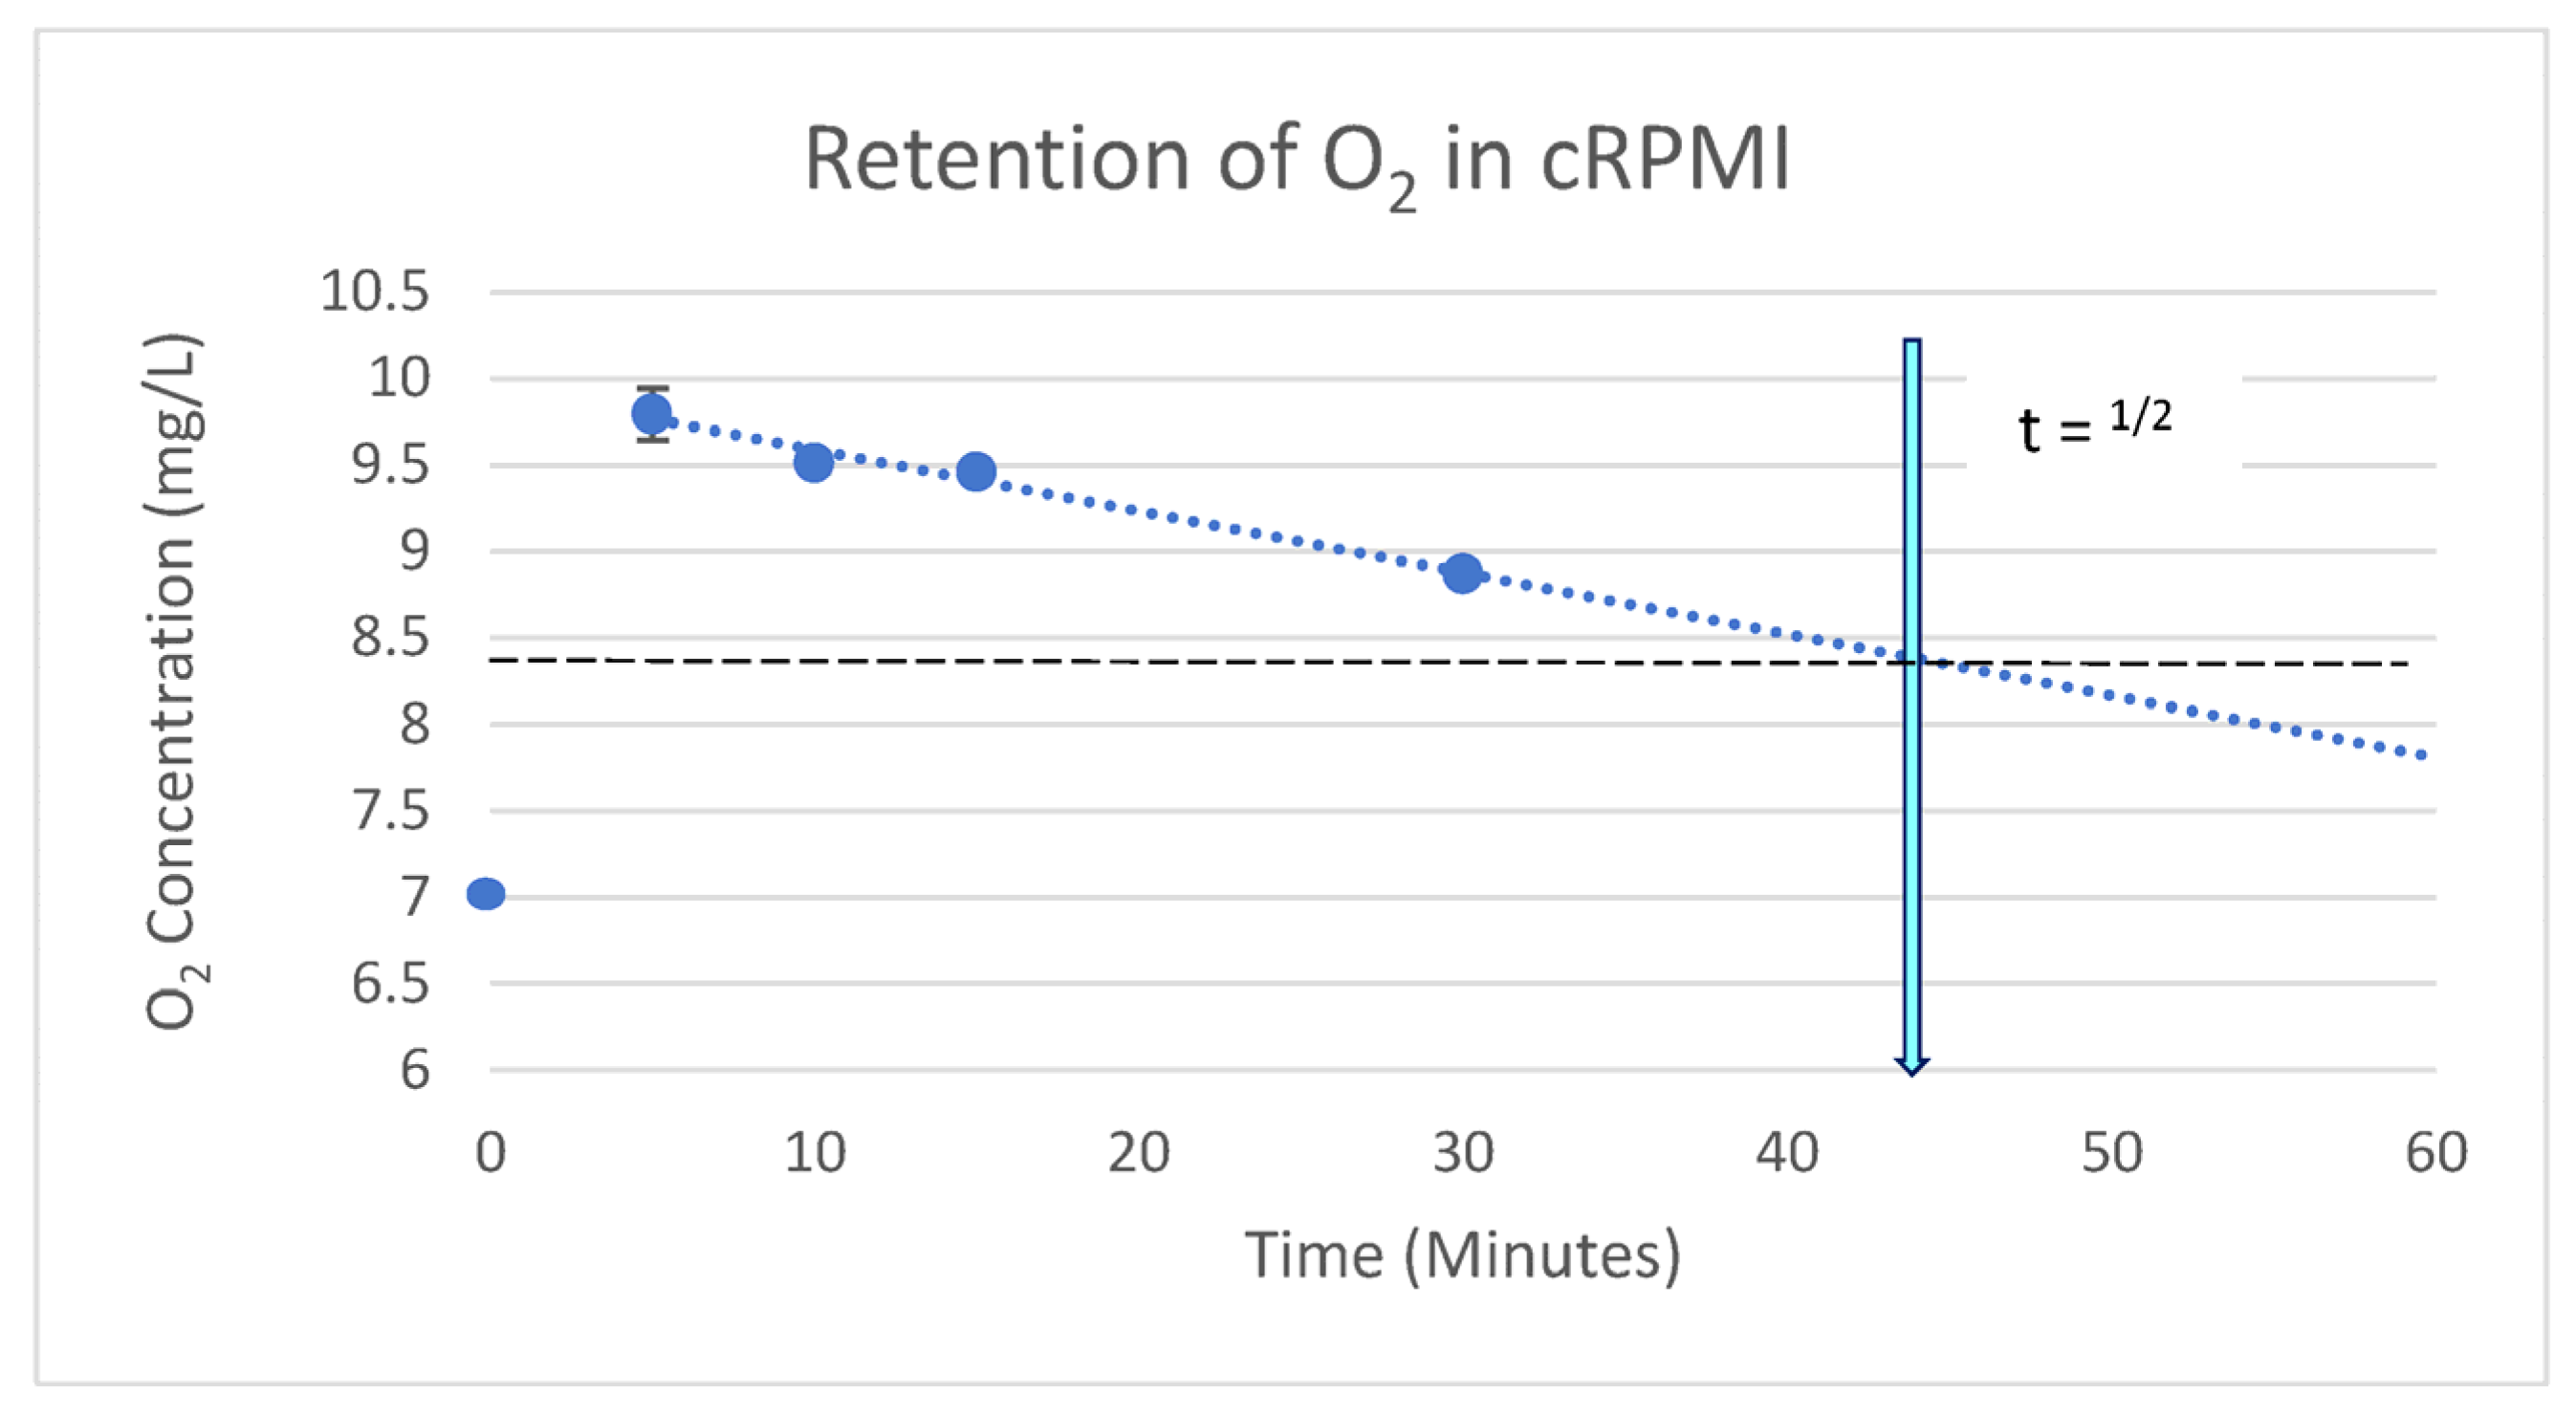
5.3. Retention of Infused O2 in Cell Media

To assess the dissolved oxygen content of the cRPMI media, Figure 3 illustrates the levels and retention of O2 in the RPMI media. Prior to infusion, the dissolved O2 content was recorded at 6.99 mg/L/O2. Infusion increased the O2 content to 9.79 mg/L/O2. This gradually depleted, indicating a half-life of approximately 45 min in the cRPMI media.
The blue line shows the trendline of dissolved levels of O2 in RPMI media following a 30 min infusion using the HydroVitality™ oxyhydrogen generator (300 mL/min/H2 + 150 mL/min/O2). n = 3 for all samples. The error bars denote ± SEM. The horizontal Black dotted line indicates a 50% drop in O2. The dotted Blue line represents the line of best fit, or trend, from the data produced. The intersection between the two, shown with the pale blue arrow, highlights the half-life (t1/2) of O2 in cRPMI (Figure 3).

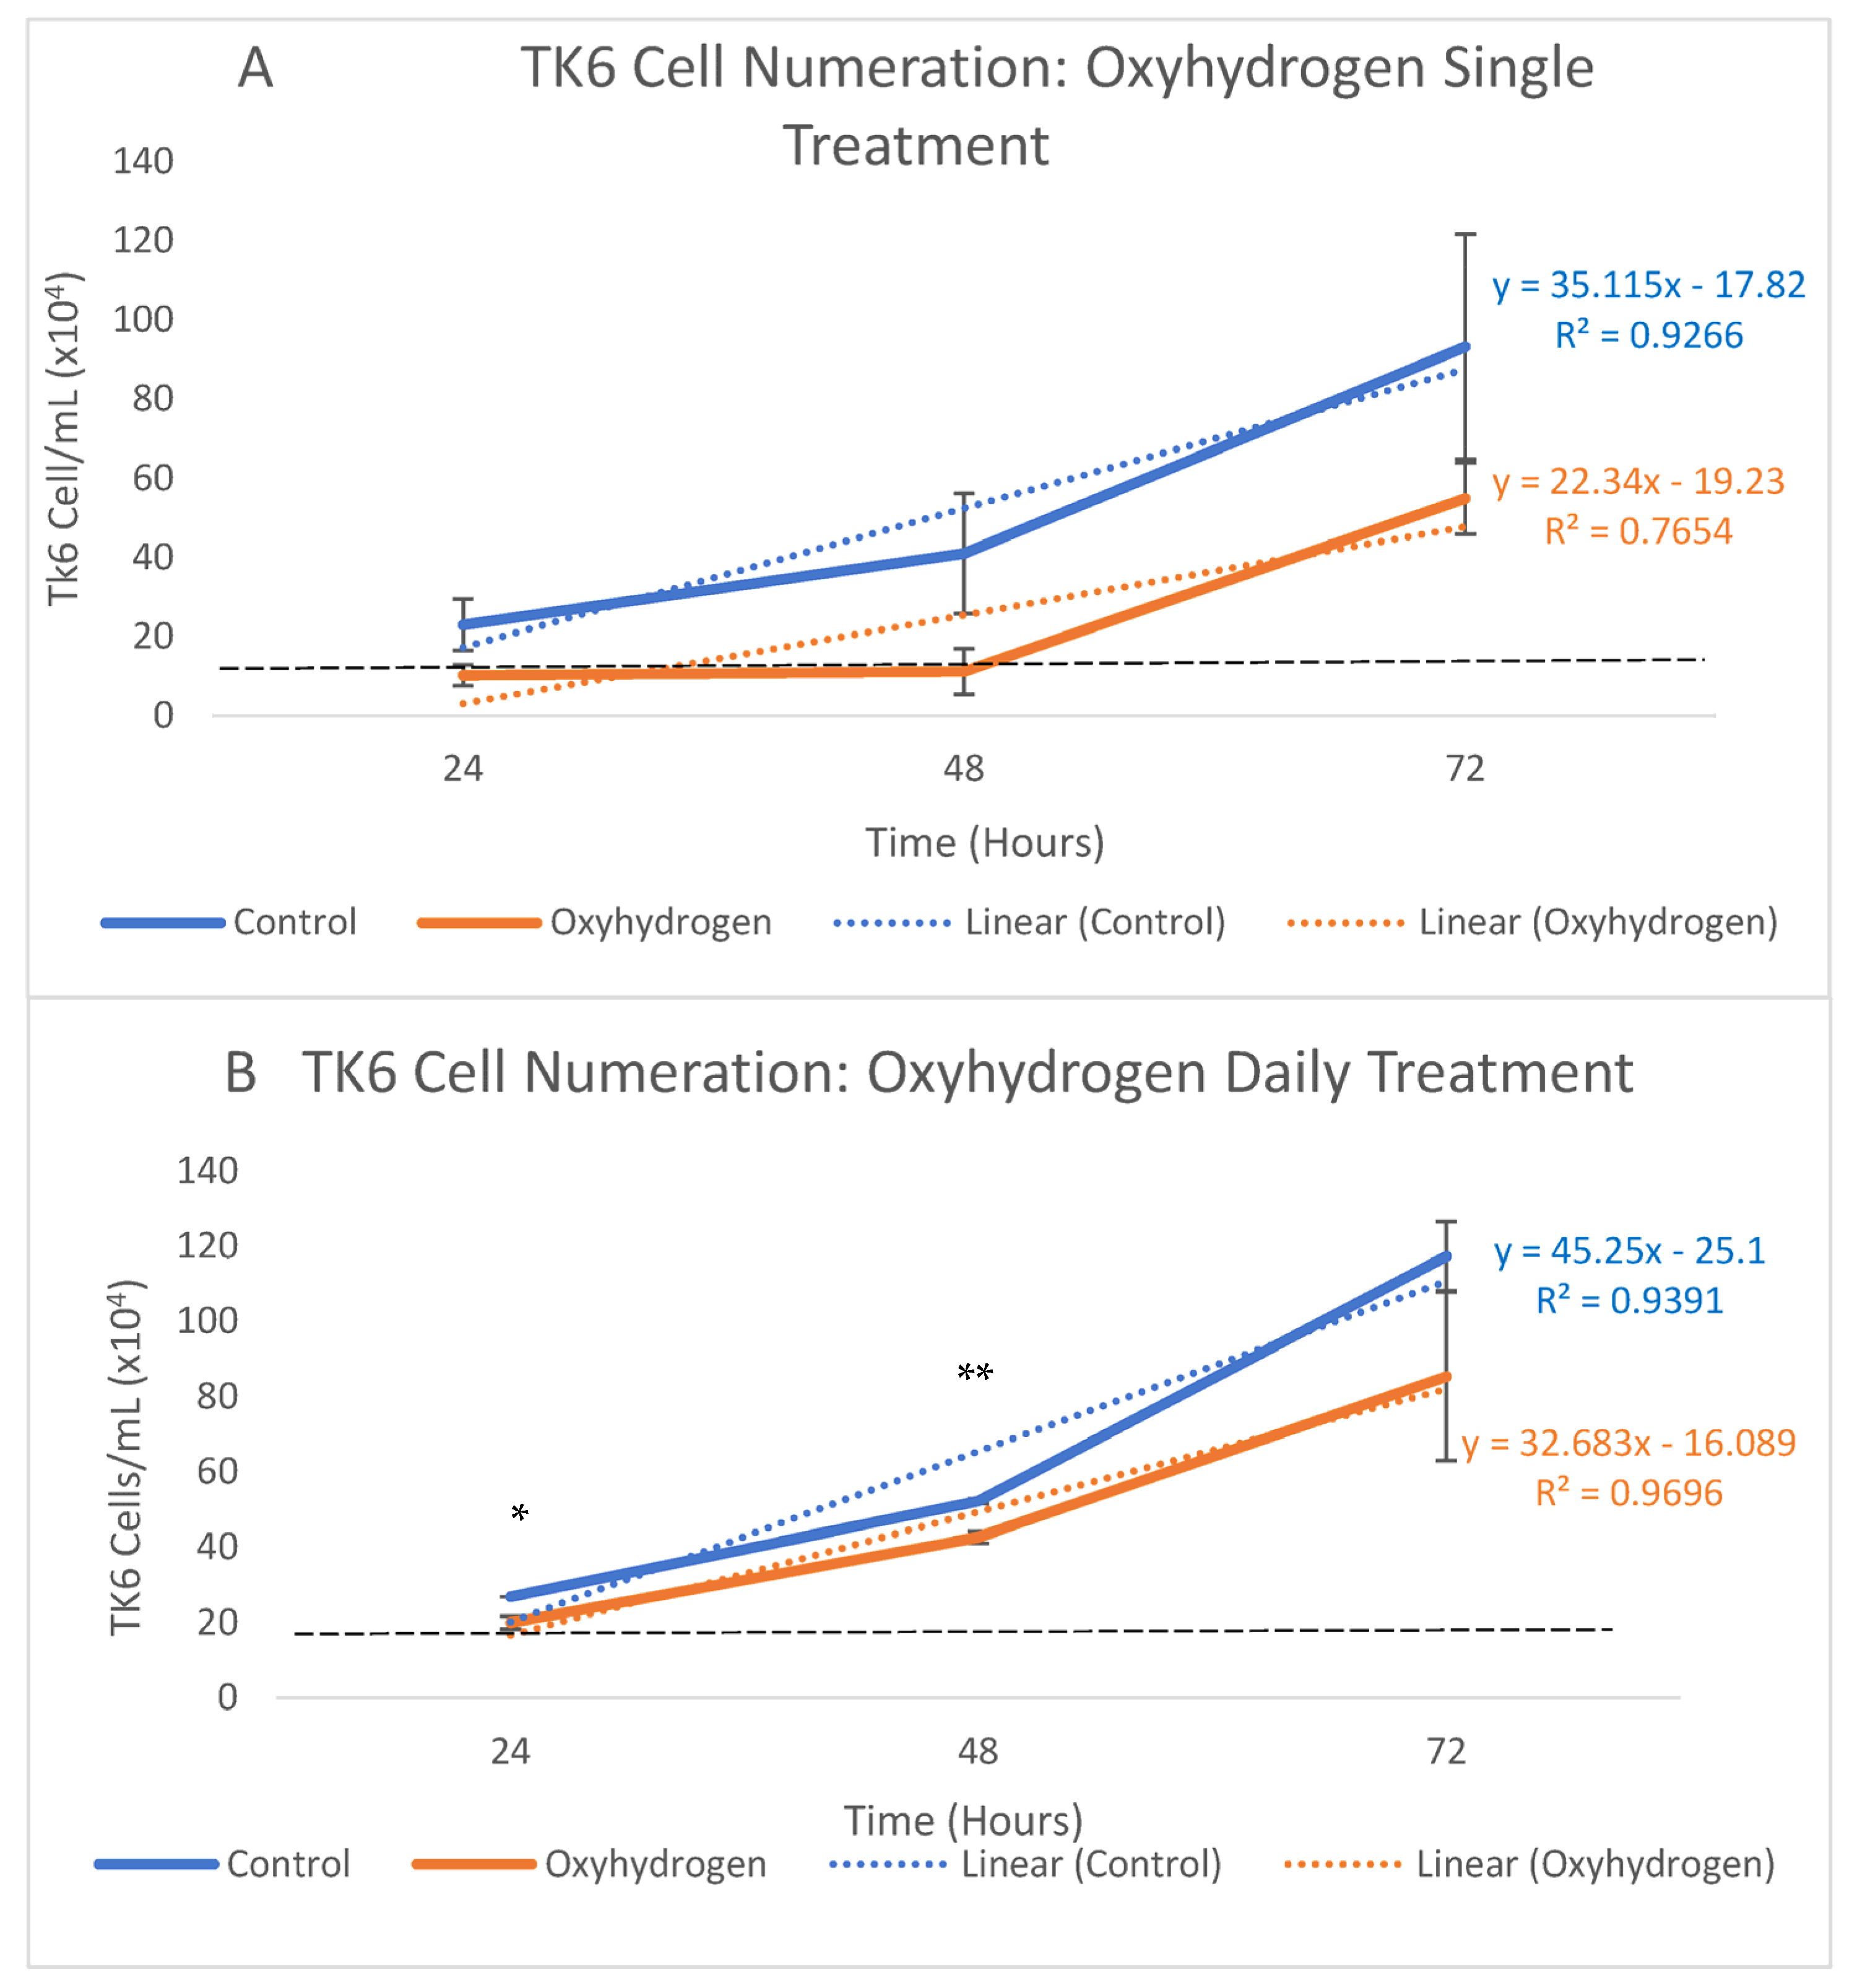
5.4. Cell Proliferation Assays

To analyse whether oxyhydrogen gas would affect the replicative capacity of TK6 cells, cell enumeration was initially assessed.
Notably, the mean concentration of cells in the control groups approximately doubled from the seeding quantities at 24 h (~150,000 → ~238,000 ± 64,000 cells), with the same pattern of events noted at the 48 h (~238,000 → ~427,000 ± 152,000 cells) and 72 h time points (~417,000 → ~930,000 ± 23,0000 cells) in accordance with expectations [53]. However, this initial period of growth and replication is not seen with the oxyhydrogen single treatment groups (24 h: ~150,000 → ~102,000 ± 26,000 cells; 48 h: ~102,000 → ~111,000 ± 58,000 cells; 72 h: ~111,000 → ~549,000 ± 91,000 cells) (Figure 4A). T-test statistical analysis describes no remarkable differences in cell density between the acute oxyhydrogen group and the control group at 24 h (p = 0.061, 95% CI [5.06, 15.44]), 48 h (p = 0.135, 95% CI [−0.22, 22.56]) and 72 h (p = 0.268, 95% CI [37.12, 72.74]) (Figure 4A). Instead, there is a non-statistical trend of replicative inhibition at all the time points, indicating inhibition of growth and/or of replicative ability. The rate of replication is typically recovered 72 h after acute oxyhydrogen exposure.
The same pattern of replication was noted with repeated applications (Figure 4B) in the control group (24 h: ~150,000 → ~268,000 ± 12,000 cells; 48 h: ~268,000 → ~521,000 ± 7000 cells; 72 h: ~521,000 → ~1,173,000 ± 92,000 cells). However, the daily addition of oxyhydrogen did produce significant data at both 24 and 48 h (24 h: Control ~268,000 vs. 199,000 ± 16,000 cells; 48 h: Control ~521,000 vs. ~426,000 ± 15,000 cells) but not at 72 h (Control: 1,173,000 vs. 854,000 ± 223,000 cells). Statistical analysis of the daily treatment with oxyhydrogen-infused media (Figure 4B) reveals significant differences between cell population numbers at 24 (p = 0.029, 95% CI [1.66, 2.32]) and 48 (p = 0.005, 95% CI [3.95, 4.57]) hours but not at 72 h (p = 0.257, 95% CI [4.15, 12.92]).
Figure 4A,B shows the measure of cell populations in the groups with a single (acute) oxyhydrogen treatment (A). Figure 4B identifies the cell populations of the daily oxyhydrogen-treated (chronic) groups. n = 3 for all samples. The error bars denote ± SEM. The Blue lines indicate the control groups (A &B). The Orange lines depict oxyhydrogen infusion (A/B) * (p ≤ 0.05), ** (p ≤ 0.01). The dashed Black lines represent the initial cell-seeding numeration. The Blue and Orange text (y=) indicate the rate of change and (R2) explains the target variance incorporated in the experimental outcomes.

5.5. Mitogen Stimulation Assay

To assess whether the inhibitory effects on cell replication seen in Figure 4A,B would be repeated in the mitogen-stimulated cells, thus giving an indication as to whether oxyhydrogen treatments can suppress the excessive proliferation of malignant cells, 16 µg/mL of Concanavalin A was added to the cell media. Figure 5 identifies the effects of oxyhydrogen infusion on the proliferating cells in the presence and absence of Concanavalin A.
Figure 5 shows the growth of the cell populations after mitogen stimulation (16 µg/Con A). Blue: Control group (−ve control). Orange: Oxyhydrogen-treated group (+ve control). Grey: Concanavalin A group. Dark Grey: Oxyhydrogen and Concanavalin A. n = 3 for all samples.
Figure 5 shows statistically meaningful reductions in the cell populations between the oxyhydrogen group (24 h: ~184,000 ± 5000 cells) and both the control (~341,000 ± 39,000 cells) and mitogen-spiked groups (~422,000 ± 71,000 cells); oxyhydrogen vs. control (p = 0.017, 95% CI [17.42, 19.51]) and oxyhydrogen vs. concanavalin A (p = 0.029, 95% CI [28.24, 56.23]) at 24 h show that oxyhydrogen alone was most effective at reducing cell proliferation, but no statistical relevance between any groups was determined at any other time point (p ≥ 0.05). However, a non-significant trend of replicative inhibition between the mitogen and the oxyhydrogen/mitogen groups is observed at all time points: 24 h (ConA: ~422,000 ± 71,000 vs. ~241,000 ± 10,000 cells) (p = 0.06, 95% CI [22.11, 26.08]), 48 h (ConA: ~1,214,000 ± 309,000 vs. ~560,000 ± 106,000 cells) (p = 0.12, 95% CI [35.17, 76.97]) and 72 h (Con A: ~2,246,000 ± 696,000 vs. ~948,000 ± 187,000 cells) (p = 0.15, 95% CI [58.19, 131.48]).
Although no statistically relevant data were produced when analysing the differences between the Concanavalin A-treated and the oxyhydrogen/Concanavalin A-treated groups, there is a clear trend of replicative inhibition in the oxyhydrogen/Concanavalin A-treated groups across each of the time points, making these groups worthy of further investigation.

5.6. Flow Cytometry

To identify the effects of oxyhydrogen gas on cell cycling, and to gain a better understanding of the mechanisms behind the antiproliferative effects observed in Figure 4A,B and Figure 5, flow cytometry analysis was performed. Figure 6 describes an average of the percentage of cells in each of the cell cycle phases 24 and 48 h after a single oxyhydrogen infusion.
Figure 6 shows the percentage of 3000 (±500) TK6 cells in each phase of the cell cycle. From left to right, the figure is as follows: Results from the control group 24 h. Results from oxyhydrogen group 24 h. Results from the control group 48 h. Results from oxyhydrogen group 48 h. From top to bottom, the figure is as follows: Pale Blue, Growth phase 2. Dark Grey, Synthesis phase. Orange, Growth phase 1. Pale Grey, Sub G1.
Interestingly, Figure 6 evinces a distinct increase in cells in the Sub G1 phase at 24 (Control: 9% vs. 46%) and 48 h (Control: 18% vs. 40%) after oxyhydrogen treatment, concomitant with marked decreases in growth phases 1 (24 h: Control: 39% vs. 25%; 48 h: Control: 37% vs. 31%) and 2 (24 h: Control: 28% vs. 10%; 48 h: Control: 19% vs. 10%). The Sub G1 phase does not form part of the cell cycle, as staining with propidium iodide (PI) shows degraded or fragmented DNA [54]. The cells in the Sub G1 phase have lower DNA content than in the recognised cell cycle phases (G1, G2 and the synthesis phases) and are associated with cellular apoptosis [54,55], a regulated form of cell death.
The oxyhydrogen treatment group showed statistically relevant differences from the control group at 24 h in the Sub G1 phase (p = < 0.001, 95% CI [37.68, 52.65]), G1 phase (p = 0.001, 95% CI [23.80, 24.66]) and G2 phase (p = 0.002, 95% CI [5.42, 11.58]). Analysis of the cells in the synthesis phase identifies no significant differences (p = 0.108, 95 CI [16.57, 20.76]). At 48 h, the significant differences in the oxyhydrogen-treated groups are noted in all phases, Sub G1 (p = 0.004, 95% CI [35.03, 47.51]), G1 (p = 0.002, 95% CI [32.18, 33.89]), S phase (p = 0.004, 95% CI [20.13, 23.41]) and G2 (p = 0.012, 95% CI [6.85, 14.21]). As oxyhydrogen administration reduces the abundance of cells in a population, significantly reducing cell numbers in both growth phases (G1 and G2), but markedly increases the volume of DNA in the Sub G1 phase, it is reasonable to assume that oxyhydrogen effectively promotes apoptosis in malignant B-cells.

6. Discussion

To date, a rapidly increasing amount of research into the physiological effects of consuming hydrogen gas (H2) has identified anti-allergy, anti-inflammatory and antioxidant potentials, which may be relevant for the treatment of numerous human-related diseases and disorders [1,2,3,4,22,23,24]. To assess whether oxyhydrogen would affect the cell viability and proliferation of immortalised immune cells (TK6—B-lymphocytes), this novel enquiry focused on the effects of infusing oxyhydrogen gas into cell culture media in an attempt to simulate the most likely dispersal and retention patterns of the aforementioned gas in the blood or serous fluids. Although it is recognised that an increase in pH may have influenced some aspects of cellular activity, the results of further analysis are congruent with early [56,57] and contemporary research [44,45,46].
The main findings of this report identify that dissolving oxyhydrogen into the cell media has an inhibitory effect on TK6 cell proliferation (Figure 4A,B) by upregulating apoptosis (Figure 6). These factors may be pertinent in the clinical treatment of numerous malignant conditions and perhaps more so with those associated with previous EBV infection (e.g., breast cancer, Hodgkin’s and non-Hodgkin’s lymphomas) [47].
The present study further shows that oxyhydrogen can mitigate cellular growth and replication stimulated by the addition of lymphocyte mitogen Concanavalin A (Figure 5), indicating a likely inhibitory effect on MAPK signalling. Although the scope of this research could not ascertain the molecular modality behind the effects seen, one factor that cannot be neglected is that the direct infusion of oxyhydrogen into the cell media altered the pH, which may account for some of the effects seen in this study. However, as both H2-only and oxyhydrogen administration are demonstrated to impart antioxidant, antiproliferative, antitumor and proapoptotic effects [44,45,46], it is unlikely that the effects observed in the present study are solely the result of the raised pH (7.25–8.30). It is interesting to note that the analysis of the present data corresponds with the findings of Chu et al. [45], and Zhu et al. [46], who identified that incubating malignant cell lines (HeLa (cervical) and MGC-803 (gastric), respectively) in oxyhydrogen gas inhibited proliferation and oxidative stress, and markedly increased apoptosis. In head-and-neck squamous cell carcinoma (HSC4) and fibrosarcoma (HT1080) cell lines, a neutral pH, H2-enriched, media suppressed both colony formation and proliferation of HSC4 cells, with HT1080 cells showing inhibited basement membrane invasion. In both cell lines, the accumulation of ROS was repressed, leading the authors [56] to conclude that H2 therapies could be used as an effective antioxidant and antitumor therapy.
In similarity with the present study, Yang et al. (2020), identified H2-enriched Dulbecco’s modified eagle medium (DMEM) (0.7 mg/L/H2) as upregulating ROS-stimulated pyroptotic pathways (ROS/Nod-like receptor family pyrin domain containing 3 (NLRP3)/caspase-1/Gasdermin D), inducing NFκB-regulated apoptosis [40]. Such findings are also consistent with investigations into non-small cell lung carcinoma cells (NSCLC), A549 and H1975, where in vitro analysis showed that the application of various levels of atmospheric H2 gas significantly reduced cell viability at 60% and 80% H2 [57]. Further evidence regarding the therapeutic efficacy of molecular hydrogen, as a saline infusion, suggests H2 may influence MAPK signalling via inhibition of the PI3K/Akt phosphorylation cascade [16]. Later enquiries also describe a pro-apoptotic effect of H2 gas administration (20%, 40% and 60%/H2 + 5% CO2), which observed a reduction in the cell surface receptor CD47 and decreased expression of the antiapoptotic B-cell lymphoma-2 (Bcl-2) protein [43].
In oncological disease specifically, H2 gas is noted to have antitumor effects via the regulation of MAPK-associated pathways, which can either inhibit or initiate apoptosis [58,59,60]. For example, You et al. [15] demonstrated a significant increase in MAPK protein production in malignant airway epithelial cells (A549 and NCI-H292) after mitogen stimulation, which was attenuated by H2. Additional studies, using multiple immortal cell lines, have shown that H2 may have a dualistic role in cell cycling, by either promoting apoptosis [58,59] or by enhancing cellular growth and proliferation, a factor noted to depend on the status of the mitochondrial unfolded protein response [61]. Therefore, how, with an increased O2 content, oxyhydrogen gas affects the proliferation of malignant immune cells is antecedent data. Whereas the acute protocol (single oxyhydrogen treatment), Figure 4A, recognised a non-significant reduction in cell enumeration, the chronic method (daily addition of media) details statistically relevant inhibition at 24 and 48 h (Figure 4B), suggesting, as do Meng et al. [43], that the efficacy of oxyhydrogen and/or H2 may be dose-dependent.
In accordance with other H2-related oncological studies [39,43,44,45,56,57,58,59,60,61], oxyhydrogen administration is noted to increase apoptosis in malignant cells. Figure 6 identifies a marked increase in cells in the Sub G1 phase, an indicator of fragmented DNA attributed to apoptotic cell debris [55] at both the 24 and 48 h time points. The data recognise that growth phases 1 and 2 (G1 and G2, respectively) were significantly restricted at both 24 and 48 h, with the effect notably lapsing over time.
Effects on the cells in the synthesis phase at 24 h were minimal, although the comparative data for this phase became statistically relevant at 48 h. Therefore, as the effects of oxyhydrogen were evidently more prominent in the growth phases (Figure 6) it is reasonable to assume that MAPK signalling as a key modulator of apoptotic, cell-growth, proliferation and inflammatory pathways, is involved in oxyhydrogen-modulated remediation of malignant activity in B-cell lymphoblasts.

7. Summary

At the forefront of empirical conceptualisation, this original study focused on p53-positive immortalised B-cells (TK6 cells) and assessed the effects of dissolved oxyhydrogen (33% O2 + 66% H2, 150 mL/min/O2 + 300 mL/min/H2) gas in the cell media. The study appraised the differences between both treatment groups and controls. Initially, to gain an understanding of how infusion may affect the composition of the media, the pH, oxygen and hydrogen contents were recorded (Figure 2 and Figure 3), determining increased levels of both substances and a slight increase in pH (pH 7.25–8.30). TK6 cells were incubated with oxyhydrogen-infused media and cell enumeration was assessed (Figure 4A,B), with the oxyhydrogen groups showing reduced cell density 24 and 48 h after administration. A similar pattern of replicative inhibition was noted when cells were stimulated with the mitogenic compound Concanavalin A (Figure 5). Aligning with previous studies [44,45] on flow cytometry analysis of TK6 cells, Figure 6 identifies reduced cell numbers in growth phases 1 and 2 and a marked increase in apoptosis (Sub G1), suggesting oxyhydrogen gas may be affecting MAPK signalling, although further research into the molecular modality of H2, in particular, is of paramount importance if the antitumor effect of H2 therapies is to be fully derived and exploited effectively. Moreover, as the demand for cancer services increases with a globally ageing population [62], healthcare services are under increased pressure to meet operational targets [63], meaning many patients will not be receiving optimal care. Therefore, there is an urgent need to prioritise, and invest in, both empirical research and robust large-scale clinical trials, if the efficacy of oxyhydrogen inhalation for the treatment of oncological disease is to benefit the global populace.

8. Conclusions

It is recognised that the information obtained in this report is modest; nevertheless, the findings begin to elucidate the modality behind the antitumor properties of oxyhydrogen gas, which may shape future research and the endeavours to have H2 therapies integrated into mainstream medical practices. Nevertheless, by contemporary research, this study identifies that the direct infusion of cell media with oxyhydrogen gas (66% H2/33% O2, 450mL/min) can negatively impact the population of rapidly replicating memory B-cells by promoting apoptosis.

Author Contributions

Conceptualization, G.R., A.D.T. and J.T.H.; methodology, G.R.; original draft preparation, G.R.; writing—review and editing, G.R., A.N., A.D.T., G.M. and J.T.H.; supervision, A.N., A.D.T. and J.T.H. All authors have read and agreed to the published version of the manuscript.

Funding

This research was co-funded by Water Fuel Engineering and the University of the West of England. Funding identification number 7096050. Project code: RDAS0184.

Data Availability Statement

Restrictions apply to the availability of these data. Data was obtained from University of the West of England and are available from grace.russell@uwe.ac.uk with the permission of Alexander Nenov, Water Fuel Engineering (nenov.alexander@waterfuelengineering.com).

Conflicts of Interest

A. Nenov is a board member of Water Fuel Engineering. The remaining authors have declared no conflicts of interest.

Abbreviations

DMEMDulbecco’s modified eagle medium
EBVEpstein–Barr Virus
HER2Human epidermal growth factor receptor-2
HRWHydrogen-rich water
MAPKMitogen-activated protein kinase
MCP-1Monocyte chemotactic protein-1
NFκBNuclear factor kappa-light-chain-enhancer of activated B cells
PTKProtein tyrosine kinase
ROS/RNSReactive oxygen/nitrogen species
RPMIRoswell Park Medical Institute 1640
TNFαTumor necrosis factor-α
VEGFVascular endothelial growth factor-induced

References

  1. Ohta, S. Molecular hydrogen as a novel antioxidant: Overview of the advantages of hydrogen for medical applications. Methods Enzymol. 2015, 555, 289–317. [Google Scholar]
  2. Kura, B.; Bagchi, A.K.; Singal, P.K.; Barancik, M.; LeBaron, T.W.; Valachova, K.; Šoltés, L.; Slezák, J. Molecular hydrogen: Potential in mitigating oxidative-stress-induced radiation injury. Can. J. Physiol. Pharmacol. 2019, 97, 287–292. [Google Scholar] [CrossRef] [PubMed]
  3. Nogueira, J.E.; Branco, L.G. Recent advances in molecular hydrogen research reducing exercise-induced oxidative stress and inflammation. Curr. Pharm. Des. 2021, 27, 731–736. [Google Scholar] [CrossRef] [PubMed]
  4. Deryugina, A.V.; Danilova, D.A.; Brichkin, Y.D.; Taranov, E.V.; Nazarov, E.I.; Pichugin, V.V.; Medvedev, A.P.; Riazanov, M.V.; Fedorov, S.A.; Smorkalov, A.Y.; et al. Molecular hydrogen exposure improves functional state of red blood cells in the early postoperative period: A randomized clinical study. Med. Gas Res. 2023, 13, 59. [Google Scholar]
  5. Kajiyama, S.; Hasegawa, G.; Asano, M.; Hosoda, H.; Fukui, M.; Nakamura, N.; Kitawaki, J.; Imai, S.; Nakano, K.; Ohta, M.; et al. Supplementation of hydrogen-rich water improves lipid and glucose metabolism in patients with type 2 diabetes or impaired glucose tolerance. Nutr. Res. 2008, 28, 137–143. [Google Scholar] [CrossRef]
  6. Nishimaki, K.; Asada, T.; Ohsawa, I.; Nakajima, E.; Ikejima, C.; Yokota, T.; Kamimura, N.; Ohta, S. Effects of molecular hydrogen assessed by an animal model and a randomized clinical study on mild cognitive impairment. Curr. Alzheimer Res. 2018, 15, 482–492. [Google Scholar] [CrossRef]
  7. Akagi, J.; Baba, H. Hydrogen gas restores exhausted CD8+ T cells in patients with advanced colorectal cancer to improve prognosis. Oncol. Rep. 2019, 41, 301–311. [Google Scholar] [CrossRef] [PubMed]
  8. Chen, J.; Kong, X.; Mu, F.; Lu, T.; Du, D.; Xu, K. Hydrogen–oxygen therapy can alleviate radiotherapy-induced hearing loss in patients with nasopharyngeal cancer. Ann. Palliat. Med. 2019, 8, 74651–74751. [Google Scholar] [CrossRef]
  9. Chen, J.B.; Kong, X.F.; Mu, F.; Lu, T.Y.; Lu, Y.Y.; Xu, K.C. Hydrogen therapy can be used to control tumor progression and alleviate the adverse events of medications in patients with advanced non-small cell lung cancer. Med. Gas Res. 2020, 10, 75. [Google Scholar]
  10. Itoh, T.; Fujita, Y.; Ito, M.; Masuda, A.; Ohno, K.; Ichihara, M.; Kojima, T.; Nozawa, Y.; Ito, M. Molecular hydrogen suppresses FcεRI-mediated signal transduction and prevents degranulation of mast cells. Biochem. Biophys. Res. Commun. 2009, 389, 651–656. [Google Scholar] [CrossRef]
  11. Niu, Y.; Nie, Q.; Dong, L.; Zhang, J.; Liu, S.F.; Song, W.; Wang, X.; Wu, G.; Song, D. Hydrogen attenuates allergic inflammation by reversing energy metabolic pathway switch. Sci. Rep. 2020, 10, 1962. [Google Scholar] [CrossRef]
  12. Rochette, L.; Zeller, M.; Cottin, Y.; Vergely, C. Antitumor activity of protons and molecular hydrogen: Underlying mechanisms. Cancers 2021, 13, 893. [Google Scholar] [CrossRef] [PubMed]
  13. Yang, W.C.; Li, T.T.; Wan, Q.; Zhang, X.; Sun, L.Y.; Zhang, Y.R.; Lai, P.C.; Li, W.Z. Molecular hydrogen mediates neurorestorative effects after stroke in diabetic rats: The TLR4/NF-κB inflammatory pathway. J. Neuroimmune Pharmacol. 2023, 18, 90–99. [Google Scholar] [CrossRef] [PubMed]
  14. Slezak, J.; Kura, B.; LeBaron, T.W.; Singal, P.K.; Buday, J.; Barancik, M. Oxidative stress and pathways of molecular hydrogen effects in medicine. Curr. Pharm. Des. 2021, 27, 610–625. [Google Scholar] [CrossRef] [PubMed]
  15. You, I.S.; Sharma, S.; Fadriquela, A.; Bajgai, J.; Thi, T.T.; Rahman, M.H.; Sung, J.; Kwon, H.U.; Lee, S.Y.; Kim, C.S.; et al. Antioxidant properties of hydrogen gas attenuates oxidative stress in airway epithelial cells. Molecules 2021, 26, 6375. [Google Scholar] [CrossRef]
  16. Jiang, Y.; Liu, G.; Zhang, L.; Cheng, S.; Luo, C.; Liao, Y.; Guo, S. Therapeutic efficacy of hydrogen-rich saline alone and in combination with PI3K inhibitor in non-small cell lung cancer. Mol. Med. Rep. 2018, 18, 2182–2190. [Google Scholar] [CrossRef]
  17. Iuchi, K.; Nishimaki, K.; Kamimura, N.; Ohta, S. Molecular hydrogen suppresses free-radical-induced cell death by mitigating fatty acid peroxidation and mitochondrial dysfunction. Can. J. Physiol. Pharmacol. 2019, 97, 999–1005. [Google Scholar] [CrossRef]
  18. Begum, R.; Kim, C.S.; Fadriquela, A.; Bajgai, J.; Jing, X.; Kim, D.H.; Kim, S.K.; Lee, K.J. Molecular hydrogen protects against oxidative stress-induced RAW 264.7 macrophage cells through the activation of Nrf2 and inhibition of MAPK signaling pathway. Mol. Cell. Toxicol. 2020, 16, 103–118. [Google Scholar] [CrossRef]
  19. Deryugina, A.V.; Danilova, D.A.; Pichugin, V.V.; Brichkin, Y.D. The Effect of Molecular Hydrogen on Functional States of Erythrocytes in Rats with Simulated Chronic Heart Failure. Life 2023, 13, 418. [Google Scholar] [CrossRef]
  20. Botek, M.; Krejčí, J.; McKune, A.J.; Sládečková, B.; Naumovski, N. Hydrogen rich water improved ventilatory, perceptual and lactate responses to exercise. Int. J. Sports Med. 2019, 40, 879–885. [Google Scholar] [CrossRef]
  21. Akagi, J.; Baba, H. Hydrogen gas activates coenzyme Q10 to restore exhausted CD8+ T cells, especially PD-1+ Tim3+ terminal CD8+ T cells, leading to better nivolumab outcomes in patients with lung cancer. Oncol. Lett. 2020, 20, 258. [Google Scholar] [CrossRef] [PubMed]
  22. Guan, W.J.; Wei, C.H.; Chen, A.L.; Sun, X.C.; Guo, G.Y.; Zou, X.; Shi, J.D.; Lai, P.Z.; Zheng, Z.G.; Zhong, N.S. Hydrogen/oxygen mixed gas inhalation improves disease severity and dyspnea in patients with Coronavirus disease 2019 in a recent multicenter, open-label clinical trial. J. Thorac. Dis. 2020, 12, 3448. [Google Scholar] [CrossRef] [PubMed]
  23. Wu, Y.; Yuan, M.; Song, J.; Chen, X.; Yang, H. Hydrogen gas from inflammation treatment to cancer therapy. ACS Nano 2019, 13, 8505–8511. [Google Scholar] [CrossRef] [PubMed]
  24. Radyuk, S.N. Mechanisms underlying the biological effects of molecular hydrogen. Curr. Pharm. Des. 2021, 27, 626–735. [Google Scholar] [CrossRef]
  25. Mantovani, A.; Marchesi, F.; Porta, C.; Sica, A.; Allavena, P. Inflammation and cancer: Breast cancer as a prototype. Breast 2007, 16, 27–33. [Google Scholar] [CrossRef]
  26. Jiang, X.; Shapiro, D.J. The immune system and inflammation in breast cancer. Mol. Cell. Endocrinol. 2014, 382, 673–682. [Google Scholar] [CrossRef]
  27. Ríos-Arrabal, S.; Artacho-Cordón, F.; León, J.; Román-Marinetto, E.; del Mar Salinas-Asensio, M.; Calvente, I.; Núñez, M.I. Involvement of free radicals in breast cancer. SpringerPlus 2013, 2, 404. [Google Scholar] [CrossRef]
  28. Perillo, B.; Di Donato, M.; Pezone, A.; Di Zazzo, E.; Giovannelli, P.; Galasso, G.; Castoria, G.; Migliaccio, A. ROS in cancer therapy: The bright side of the moon. Exp. Mol. Med. 2020, 52, 192–203. [Google Scholar] [CrossRef]
  29. Wang, H.; Luo, Y.H.; Shen, G.N.; Piao, X.J.; Xu, W.T.; Zhang, Y.; Wang, J.R.; Feng, Y.C.; Li, J.Q.; Zhang, Y.; et al. Two novel 1,4-naphthoquinone derivatives induce human gastric cancer cell apoptosis and cell cycle arrest by regulating reactive oxygen species-mediated MAPK/Akt/STAT3 signaling pathways. Mol. Med. Rep. 2019, 20, 2571–2582. [Google Scholar] [CrossRef]
  30. Fan, Q.; Liang, X.; Xu, Z.; Li, S.; Han, S.; Xiao, Y.; Xu, Q.; Yuan, R.; Yang, S.; Gao, H. Pedunculoside inhibits epithelial-mesenchymal transition and overcomes Gefitinib-resistant non-small cell lung cancer through regulating MAPK and Nrf2 pathways. Phytomedicine 2023, 116, 154884. [Google Scholar] [CrossRef]
  31. Delos Reyes, F.S.L.G.; Mamaril, A.C.C.; Matias, T.J.P.; Tronco, M.K.V.; Samson, G.R.; Javier, N.D.; Fadriquela, A.; Antonio, J.M.; Sajo, M.E.J.V. The search for the elixir of life: On the therapeutic potential of alkaline reduced water in metabolic syndromes. Processes 2021, 9, 1876. [Google Scholar] [CrossRef]
  32. Asgharzadeh, F.; Tarnava, A.; Mostafapour, A.; Khazaei, M.; LeBaron, T.W. Hydrogen-rich water exerts anti-tumor effects comparable to 5-fluorouracil in a colorectal cancer xenograft model. World J. Gastrointest. Oncol. 2022, 14, 242–252. [Google Scholar] [CrossRef] [PubMed]
  33. Tsai, C.F.; Hsu, Y.W.; Chen, W.K.; Ho, Y.C.; Lu, F.J. Enhanced induction of mitochondrial damage and apoptosis in human leukemia HL-60 cells due to electrolyzed-reduced water and glutathione. Biosci. Biotechnol. Biochem. 2009, 73, 280–287. [Google Scholar] [CrossRef] [PubMed]
  34. Al Zahrani, S.M.; Omar, U.M.; Rahimulddin, S.A.; Al-Ghafari, A.B.; Aldahlawi, A.M.; Al Doghaither, H.A. Antiproliferative and apoptotic effects of the natural alkaline water (Zamzam) in breast cancer cell line MCF-7. J. Cancer Res. Ther. 2019, 15, 1098–1104. [Google Scholar] [PubMed]
  35. LeBaron, T.W.; Kura, B.; Kalocayova, B.; Tribulova, N.; Slezak, J. A new approach for the prevention and treatment of cardiovascular disorders. Molecular hydrogen significantly reduces the effects of oxidative stress. Molecules 2019, 24, 2076. [Google Scholar] [CrossRef]
  36. Fang, W.; Tang, L.; Wang, G.; Lin, J.; Liao, W.; Pan, W.; Xu, J. Molecular hydrogen protects human melanocytes from oxidative stress by activating Nrf2 signaling. J. Investig. Dermatol. 2020, 140, 2230–2241. [Google Scholar] [CrossRef]
  37. Frajese, G.V.; Benvenuto, M.; Mattera, R.; Giampaoli, S.; Ambrosin, E.; Bernardini, R.; Giganti, M.G.; Albonici, L.; Dus, I.; Manzari, V.; et al. Electrochemically Reduced Water Delays Mammary Tumors Growth in Mice and Inhibits Breast Cancer Cells Survival In Vitro. Evid. Based Complement. Altern. Med. 2018, 2018, 4753507. [Google Scholar] [CrossRef]
  38. Chen, J.B.; Kong, X.F.; Lv, Y.Y.; Qin, S.C.; Sun, X.J.; Mu, F.; Lu, T.Y.; Xu, K.C. “Real world survey” of hydrogen-controlled cancer: A follow-up report of 82 advanced cancer patients. Med. Gas Res. 2019, 9, 115. [Google Scholar]
  39. Yang, Y.; Zhu, Y.; Xi, X. Anti-inflammatory and antitumor action of hydrogen via reactive oxygen species. Oncol. Lett. 2018, 16, 2771–2776. [Google Scholar] [CrossRef]
  40. Yang, Y.; Liu, P.Y.; Bao, W.; Chen, S.J.; Wu, F.S.; Zhu, P.Y. Hydrogen inhibits endometrial cancer growth via a ROS/NLRP3/caspase-1/GSDMD-mediated pyroptotic pathway. BMC Cancer 2020, 20, 28. [Google Scholar] [CrossRef]
  41. Dole, M.; Wilson, F.R.; Fife, W.P. Hyperbaric hydrogen therapy: A possible treatment for cancer. Science 1975, 190, 152–154. [Google Scholar] [CrossRef] [PubMed]
  42. Runtuwene, J.; Amitani, H.; Amitani, M.; Asakawa, A.; Cheng, K.C.; Inui, A. Hydrogen–water enhances 5-fluorouracil-induced inhibition of colon cancer. PeerJ 2015, 3, e859. [Google Scholar] [CrossRef]
  43. Meng, J.; Liu, L.; Wang, D.; Yan, Z.; Chen, G. Hydrogen gas represses the progression of lung cancer via down-regulating CD47. Biosci. Rep. 2020, 40, BSR20192761. [Google Scholar] [CrossRef] [PubMed]
  44. Liu, M.Y.; Xie, F.; Zhang, Y.; Wang, T.T.; Ma, S.N.; Zhao, P.X.; Zhang, X.; Lebaron, T.W.; Yan, X.L.; Ma, X.M. Molecular hydrogen suppresses glioblastoma growth via inducing the glioma stem-like cell differentiation. Stem Cell Res. Ther. 2019, 10, 145. [Google Scholar] [CrossRef] [PubMed]
  45. Chu, J.; Gao, J.; Wang, J.; Li, L.; Chen, G.; Dang, J.; Wang, Z.; Jin, Z.; Liu, X. Mechanism of hydrogen on cervical cancer suppression revealed by high-throughput RNA sequencing. Oncol. Rep. 2021, 46, 141. [Google Scholar] [CrossRef] [PubMed]
  46. Zhu, B.; Cui, H.; Xu, W. Hydrogen inhibits the proliferation and migration of gastric cancer cells by modulating lncRNA MALAT1/miR-124-3p/EZH2 axis. Cancer Cell Int. 2021, 21, 70. [Google Scholar] [CrossRef]
  47. Wong, Y.; Meehan, M.T.; Burrows, S.R.; Doolan, D.L.; Miles, J.J. Estimating the global burden of Epstein–Barr virus-related cancers. J. Cancer Res. Clin. Oncol. 2022, 148, 31–46. [Google Scholar] [CrossRef]
  48. Hsu, J.Y.; Chang, C.J.; Cheng, J.S. Survival, treatment regimens and medical costs of women newly diagnosed with metastatic triple-negative breast cancer. Sci. Rep. 2022, 12, 729. [Google Scholar] [CrossRef]
  49. McCloskey, C.; Ortega, M.T.; Nair, S.; Garcia, M.J.; Manevy, F. A systematic review of time and resource use costs of subcutaneous versus intravenous administration of oncology biologics in a hospital setting. PharmacoEcon. Open 2023, 7, 3–36. [Google Scholar] [CrossRef]
  50. Ryu, A.H.; Eckalbar, W.L.; Kreimer, A.; Yosef, N.; Ahituv, N. Use antibiotics in cell culture with caution: Genome-wide identification of antibiotic-induced changes in gene expression and regulation. Sci. Rep. 2017, 7, 7533. [Google Scholar] [CrossRef]
  51. Xu, X.; Wei, H.; Dong, Z.; Chen, Y.; Tian, Z. The differential effects of low dose and high dose concanavalin A on cytokine profile and their importance in liver injury. Inflamm. Res. 2006, 55, 144–152. [Google Scholar] [CrossRef]
  52. Wei, X.; Wang, S.; Zheng, W.; Wang, X.; Liu, X.; Jiang, S.; Pi, J.; Zheng, Y.; He, G.; Qu, W. Drinking water disinfection byproduct iodoacetic acid induces tumorigenic transformation of NIH3T3 cells. Environ. Sci. Technol. 2013, 47, 5913–5920. [Google Scholar] [CrossRef] [PubMed]
  53. Zhan, L.; Sakamoto, H.; Sakuraba, M.; Wu, D.S.; Zhang, L.S.; Suzuki, T.; Hayashi, M.; Honma, M. Genotoxicity of microcystin-LR in human lymphoblastoid TK6 cells. Mutat. Res./Genet. Toxicol. Environ. Mutagen. 2004, 557, 1–6. [Google Scholar] [CrossRef]
  54. Darzynkiewicz, Z.; Huang, X.; Zhao, H. Analysis of cellular DNA content by flow cytometry. Curr. Protoc. Immunol. 2017, 119, 5–7. [Google Scholar] [CrossRef] [PubMed]
  55. Manohar, S.M.; Shah, P.; Nair, A. Flow cytometry: Principles, applications and recent advances. Bioanalysis 2021, 13, 181–198. [Google Scholar] [CrossRef]
  56. Saitoh, Y.; Okayasu, H.; Xiao, L.; Harata, Y.; Miwa, N. Neutral pH hydrogen-enriched electrolyzed water achieves tumor-preferential clonal growth inhibition over normal cells and tumor invasion inhibition concurrently with intracellular oxidant repression. Oncol. Res. 2008, 17, 247–255. [Google Scholar] [CrossRef]
  57. Saitoh, Y.; Harata, Y.; Mizuhashi, F.; Nakajima, M.; Miwa, N. Biological safety of neutral-pH hydrogen-enriched electrolyzed water upon mutagenicity, genotoxicity and subchronic oral toxicity. Toxicol. Ind. Health 2010, 26, 203–216. [Google Scholar] [CrossRef]
  58. Wang, D.; Wang, L.; Zhang, Y.; Zhao, Y.; Chen, G. Hydrogen gas inhibits lung cancer progression through targeting SMC3. Biomed. Pharmacother. 2018, 104, 788–797. [Google Scholar] [CrossRef] [PubMed]
  59. Zan, R.; Wang, H.; Cai, W.; Ni, J.; Luthringer-Feyerabend, B.J.; Wang, W.; Peng, H.; Ji, W.; Yan, J.; Xia, J.; et al. Controlled release of hydrogen by implantation of magnesium induces P53-mediated tumor cells apoptosis. Bioact. Mater. 2022, 9, 385–396. [Google Scholar] [CrossRef] [PubMed]
  60. Hasegawa, T.; Ito, M.; Hasegawa, S.; Teranishi, M.; Takeda, K.; Negishi, S.; Nishiwaki, H.; Takeda, J.I.; LeBaron, T.W.; Ohno, K. Molecular Hydrogen Enhances Proliferation of Cancer Cells That Exhibit Potent Mitochondrial Unfolded Protein Response. Int. J. Mol. Sci. 2022, 23, 2888. [Google Scholar] [CrossRef]
  61. Noor, M.N.Z.M.; Alauddin, A.S.; Wong, Y.H.; Looi, C.Y.; Wong, E.H.; Madhavan, P.; Yeong, C.H. A Systematic Review of Molecular Hydrogen Therapy in Cancer Management. Asian Pac. J. Cancer Prev. 2023, 24, 37. [Google Scholar] [CrossRef] [PubMed]
  62. Sabri, S.M.; Annuar, N.; Rahman, N.L.A.; Musairah, S.K.; Mutalib, H.A.; Subagja, I.K. Major Trends in Ageing Population Research: A Bibliometric Analysis from 2001 to 2021. Proceedings 2022, 82, 19. [Google Scholar]
  63. NHS Backlog Data Analysis. Available online: https://www.bma.org.uk/advice-and-support/nhs-delivery-and-workforce/pressures/nhs-backlog-data-analysis (accessed on 31 August 2023).
Figure 1. Photographs of sterilization and infusion methods.
Hydrogen 04 00047 g001
Figure 2. The concentration and retention of H2 in RPMI media.
Hydrogen 04 00047 g002
Figure 3. The concentration and retention of O2 in RPMI media.
Hydrogen 04 00047 g003
Figure 4. (A,B). Assessment of cell population density.
Hydrogen 04 00047 g004
Figure 5. The effects of oxyhydrogen gas on mitogen-stimulated TK6 cells. The error bars denote ± SEM. * p ≤ 0.05.
Hydrogen 04 00047 g005
Figure 6. The percentage of TK6 cells in each phase of the cell cycle—Oxyhydrogen. * (p ≤ 0.05) ** (p ≤ 0.01) *** (p ≤ 0.001) n/s = no significance.
Hydrogen 04 00047 g006
Disclaimer/Publisher’s Note: The statements, opinions and data contained in all publications are solely those of the individual author(s) and contributor(s) and not of MDPI and/or the editor(s). MDPI and/or the editor(s) disclaim responsibility for any injury to people or property resulting from any ideas, methods, instructions or products referred to in the content.

