Article

Life Cycle Global Warming Impact of Long-Distance Liquid Hydrogen Transport from Africa to Germany

1
IEK-5 Photovoltaics, Forschungszentrum Jülich GmbH, 52425 Jülich, Germany
2
Department of Mechanical Engineering, Eindhoven University of Technology (TU/e), 5612 AZ Eindhoven, The Netherlands
*
Author to whom correspondence should be addressed.
Hydrogen 2023, 4(4), 760-775; https://doi.org/10.3390/hydrogen4040048
Submission received: 1 September 2023 / Revised: 4 October 2023 / Accepted: 6 October 2023 / Published: 8 October 2023

Abstract

:
The global interest in hydrogen as an energy carrier is steadily increasing. In this study, multiple scenarios of liquid hydrogen exports from Africa to Germany are analyzed by life cycle assessment (LCA) to quantify the global warming potential (GWP) of 1 kg hydrogen. The investigation is driven by the promise that hydrogen can be sustainably and economically produced by photovoltaic (PV)-powered electrolysis in Africa, benefiting from the geographical location near the equator and, consequently, higher solar irradiation levels. Given the absence of a pipeline network, shipping hydrogen emerges as the most efficient short-term transportation option to Germany. In this paper, supply locations—Morocco, Senegal, and Nigeria—are evaluated by means of an LCA and compared to hydrogen supply from Germany. Results show that emissions from hydrogen production and transportation by ship from Morocco range from 3.32 to 3.41 kgCO2-eq/kgH2. From Senegal, the range is 3.88 to 3.99 kgCO2eq/kgH2, and from Nigeria, it falls between 4.38 and 4.27 kgCO2-eq/kgH2. These emission levels are influenced by factors such as the GWP of PV electricity, the efficiency of the electrolyzer, and the transportation distance. Interestingly, the analysis reveals that PV-powered electrolysis of hydrogen in Germany, including 300 km distribution, causes, in most scenarios, a lower GWP in the range of 3.48 to 3.61 kgCO2-eq/kgH2 than hydrogen from the analyzed African regions. Opting for grid electricity instead of PV (with a value of 0.420 kgCO2-eq/kWh) for hydrogen production in Germany yields a GWP ranging from 24.35 to 25.42 kgCO2-eq/kgH2. Hence, we can conclude that in any event, PV-powered hydrogen electrolysis has a low environmental impact not only within Africa but also in Germany. However, it is crucial to carefully consider the balance of the GWP of production versus transportation given the distance between a hydrogen production site and the location of consumption.

1. Introduction

Apart from the existing consumption of hydrogen in the refining of oil and ammonia production, there will be a significant increase in demand for hydrogen as a transportation fuel for transport, electricity generation, storage, and heating in the coming decades [1]. The projected hydrogen demand in Germany for 2045 is estimated to be between 226 and 600 TWh [2]. A significant portion of this demand, ranging from 50% to 90%, is expected to be met through imports from regions with favorable production conditions—for instance, from countries closer to the equator, such as various African regions, which have higher solar irradiation levels. Photovoltaic (PV) electricity can be generated at low-cost locations in Africa, resulting in a 30% reduction in electrolysis costs compared to self-supply in Germany [3]. The emergence of renewable hydrogen production, particularly through PV electrolysis, also holds great promise for reducing its global warming potential (GWP).
Comparable to the liquefied natural gas transportation, hydrogen can be liquefied and shipped to Germany [4,5]. Liquid hydrogen presents an advantage over gaseous hydrogen due to its higher volumetric density achieved through liquefaction [6]. Furthermore, compared to pipeline infrastructure, shipping allows the direct transport of a specified quantity of hydrogen to Germany without using internationally shared infrastructure. This enables the secure transportation of the predetermined volume of hydrogen [1]. Shipping liquid hydrogen offers advantages over alternatives such as ammonia or liquid organic hydrogen carriers (LOHC) by eliminating energy-intensive reconversion processes.
Studies have shown that hydrogen produced by renewable energy sources has up to 70% less GWP than conventional hydrogen production by fossil fuels [7,8,9]. To obtain more relevant information about PV-based hydrogen, we conducted a comprehensive search across academic databases such as Google Scholar, Web of Science, Scopus, and reputable organization publications to gather data on various studies that have assessed the GWP of hydrogen transportation. Various keywords, including “liquid hydrogen”, “global warming potential”, and “LCA”, were employed during the research process.
Limited research has been conducted to quantify the GWP of liquid hydrogen transportation via overseas shipping, particularly through detailed LCAs. Existing studies provide estimates of the GWP of between 1.2 and 6.5 kg CO2-eq per kg of hydrogen, depending on the specific production and transport scenario (see Table 1). These scenarios encompass a range of parameters, including transportation modes, production methods, and geographical locations. The findings underscore the multifaceted nature of GWP calculations and the significance of considering various factors in evaluating the environmental impact of liquid hydrogen supply chains.
Despite the research interest in hydrogen, the GWP of liquid hydrogen transportation from Africa to Germany remains uncertain due to the diverse nature of the studies conducted. Variations in import routes, production locations, and electricity sources significantly contribute to the challenge of drawing definitive conclusions regarding the potential impact on Germany. The inclusion or exclusion of transportation emissions significantly influenced GWP, as demonstrated in scenarios such as PV LH2 excl. transportation [10] and LH2, incl. transportation from Algeria (PV) and Canada (hydro) to Germany [17], where GWP values differed substantially.
Although previous research has made significant strides in assessing the GWP of hydrogen, a critical gap persists in understanding the GWP of renewable hydrogen supply corridors from Africa to Germany. In response to the current enhanced hydrogen market growth, this study aims to address the existing literature gap and assess the GWP of hydrogen supply. The goal is to go beyond assessing the GWP of hydrogen supply corridors from Africa to Germany and additionally compare import routes of hydrogen to production in Germany. Our research not only contributes to the broader discourse on sustainable energy but also offers practical insights for policymakers, energy stakeholders, and industries seeking to harness the potential of green hydrogen. Figure 1 gives an overview of the research approach chosen for the study.
The paper follows a structured approach, consisting of several sections that aim to comprehensively address the research question. It is organized in five sections: Section 2 offers a detailed explanation of the LCA methodology adopted in the study. It encompasses the system framework, defines the geographic scope considered, and outlines the relevant parameters utilized to address the research question effectively. Section 3 focuses on providing a comprehensive account of the life cycle inventories associated with the investigated processes. Moreover, the operational parameters of the transportation aspect of the study are thoroughly examined and presented. Section 4 is dedicated to presenting the outcomes of the LCA study and the scenario analysis conducted. The results are analyzed and discussed in the context of the research question, offering insights into the GWP impacts of the study. The results are interpreted and their implications are explored, and a critical assessment of the study’s strengths and limitations is carried out. Section 5 is devoted to conclusions from the LCA study. In this final section, the paper concludes by summarizing the key findings and insights derived from the study.

2. Materials and Methods

This section describes the methods used and defines the system’s boundaries, referring to the geographical locations and technologies analyzed. Additionally, the data sources are elucidated.

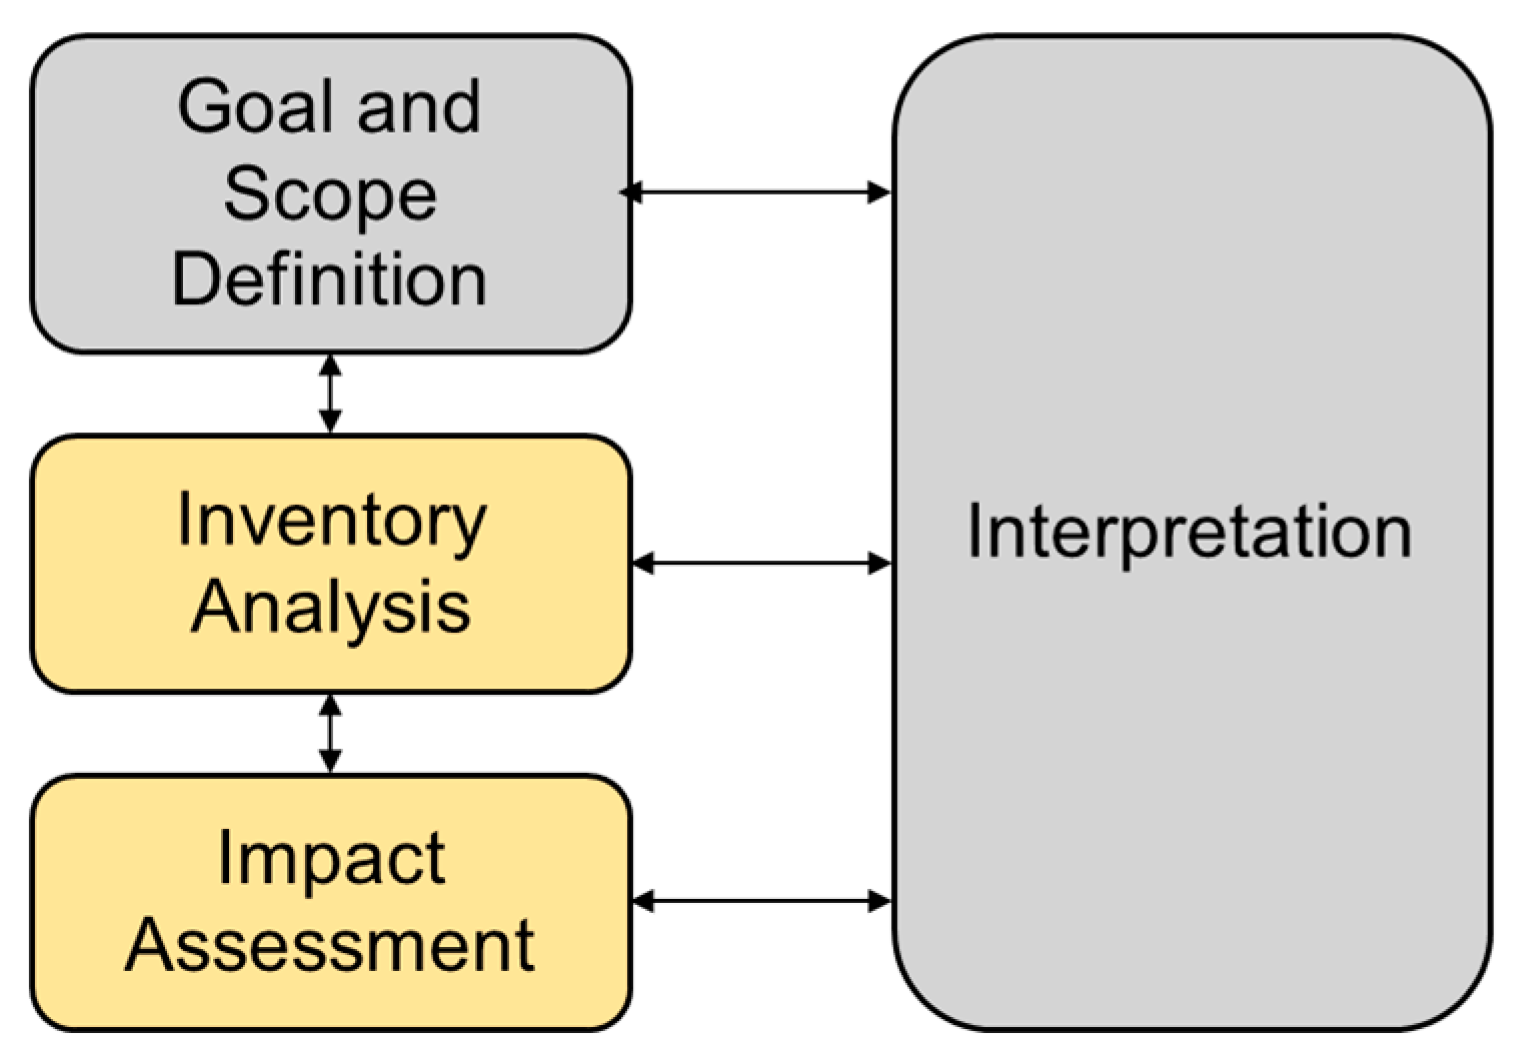
2.1. Life Cycle Assessment Method

LCA is a common tool for analyzing the environmental performance of a system or a product. It is usually defined as compiling and evaluating a system’s inputs, such as materials and energy; outputs, like emissions; and environmental impacts throughout its life cycle. LCA studies encompass four primary phases, as defined by ISO standards: goal and scope definition, inventory analysis, impact assessment, and interpretation (see Figure 2) [19,20]. The first phase is used to define the goal and scope of the LCA. A life cycle inventory (LCI) model is analyzed during the second step. The LCI quantifies elementary flows associated with specific processes, i.e., materials and resources, energy flows, land use, emissions, and products of the processes as outputs. The third step is the life cycle impact assessment (LCIA), which is used to understand the relevance of the LCI in an environmental framework. The last step is the interpretation, which is used to check and evaluate information resulting from the LCIA. For the calculations, a well-known LCA tool named GaBi was used [21].
Among the 17 impact categories of an LCA, the GWP holds dominant importance in today’s energy policy, making it a vital factor in any comparative assessment of energy technologies. Thus, an LCIA is conducted for this category to assess its contribution to climate change. GWP100 was used for this study to track the limit of 2 °C global warming in 2100, which requires a timeframe of 100 years, as proposed by the IPCC 2016. Further descriptions of the LCA methods are clarified in [22].

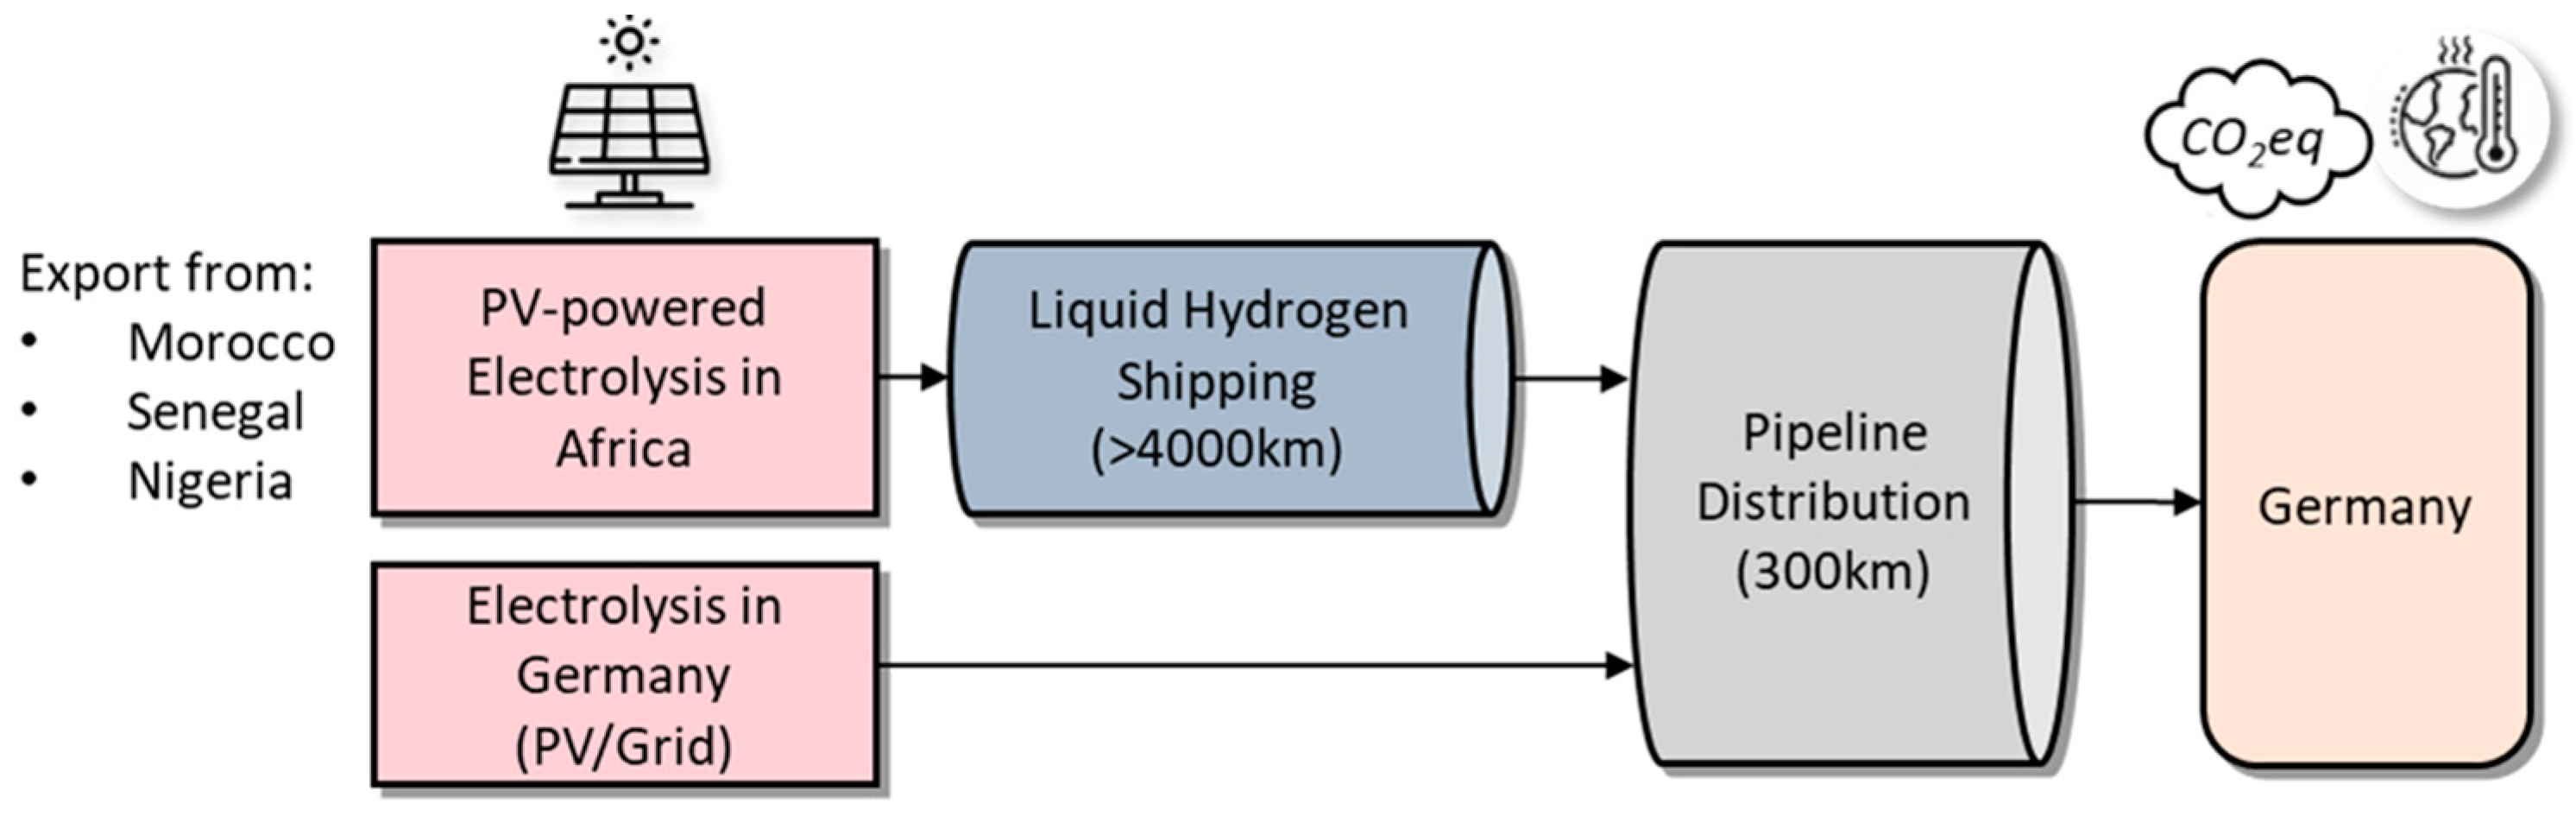
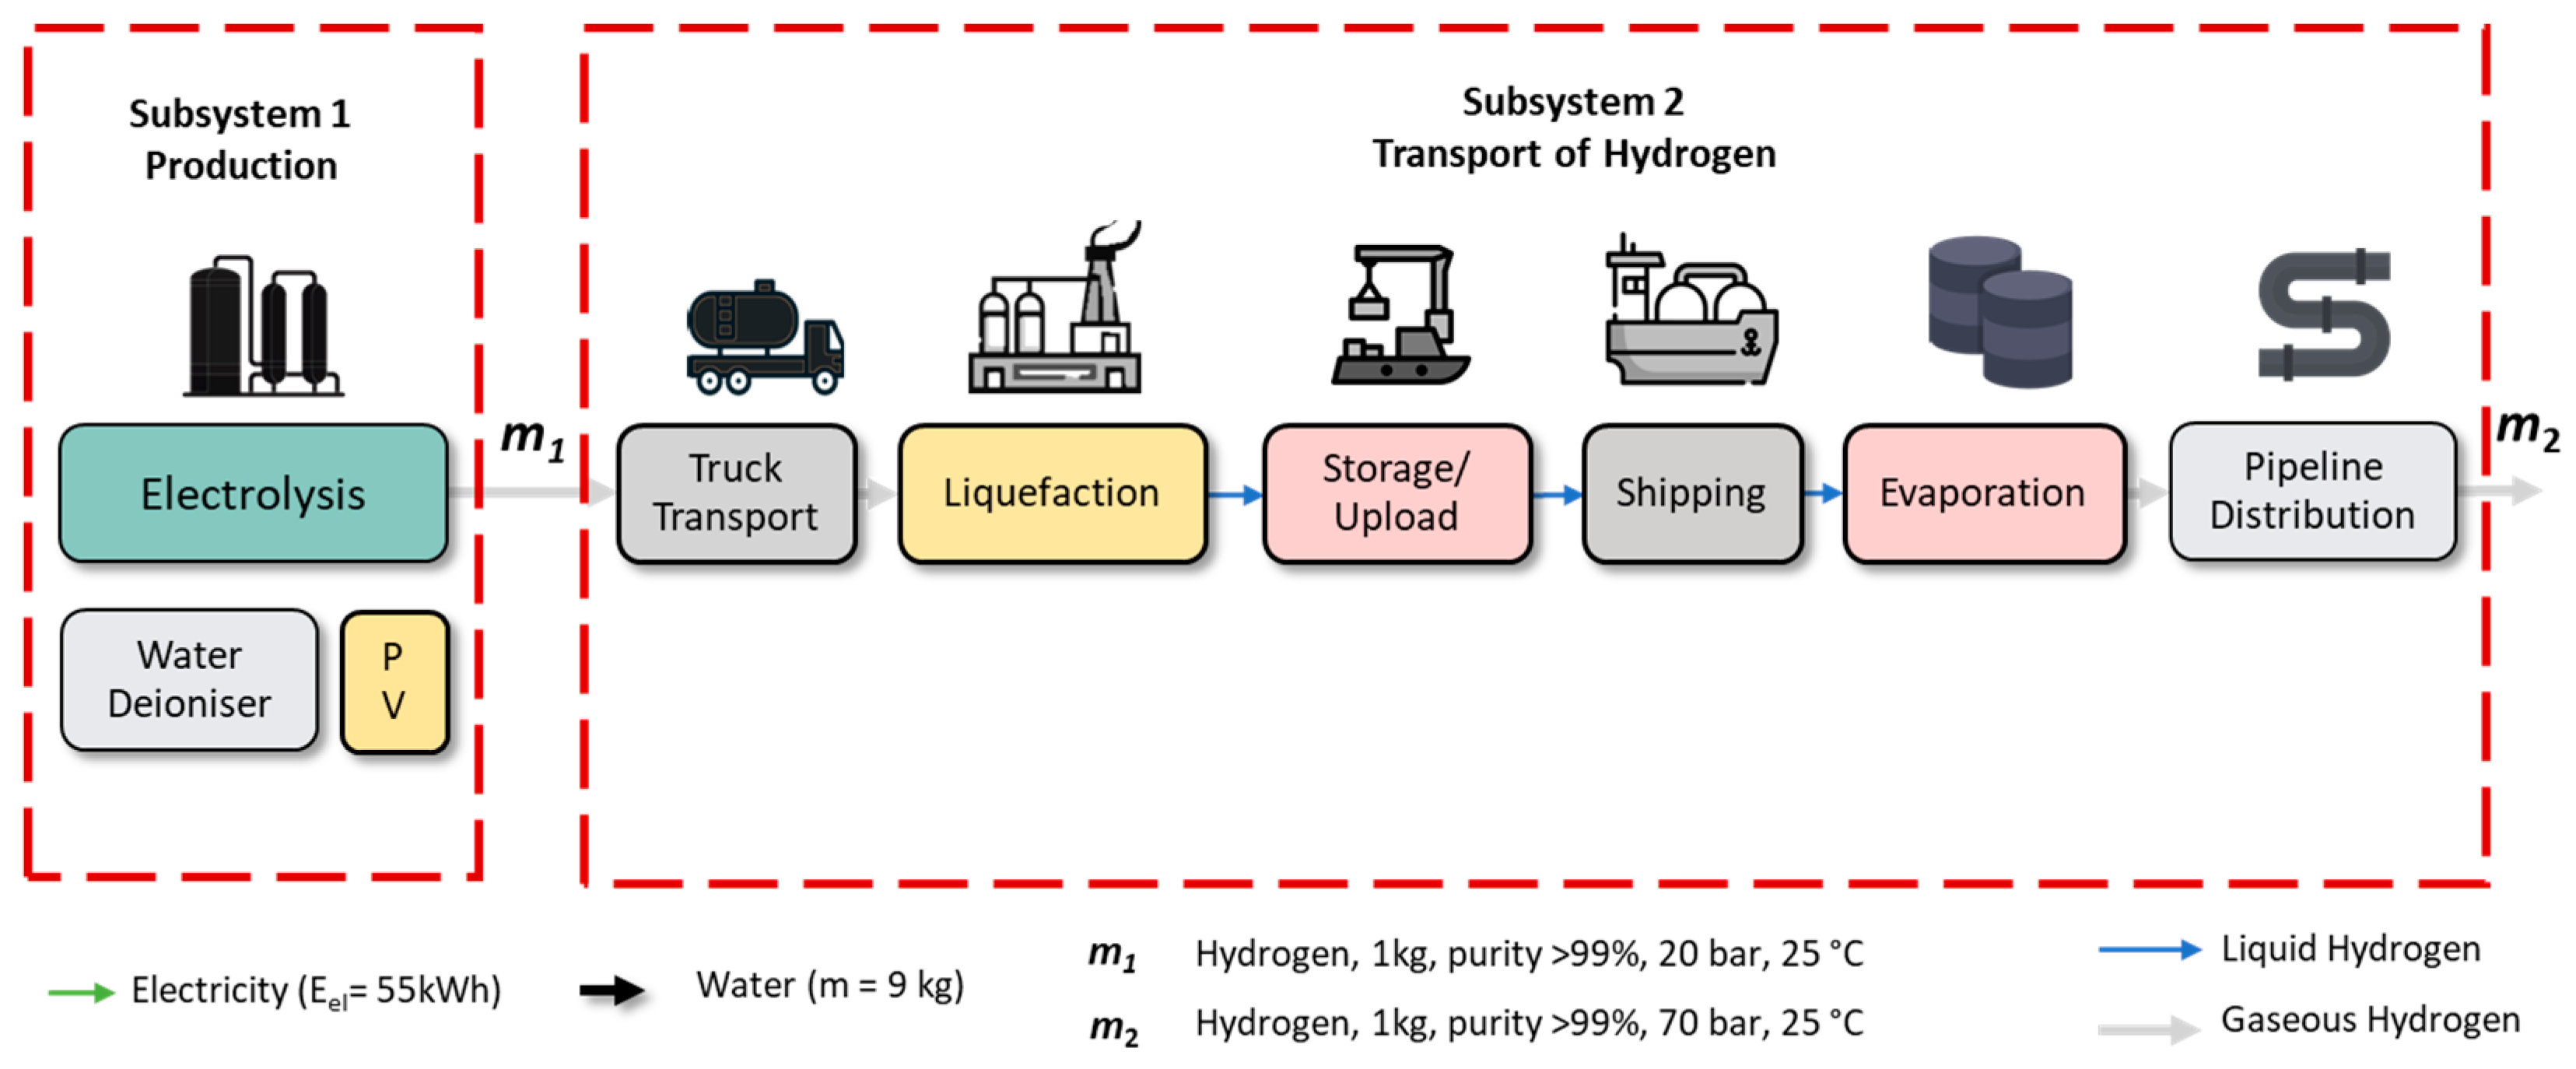
2.2. System Boundary

The system boundary definition impacts the materials, processes, and emissions analyzed by the LCA. The chosen organizational boundary for the inventory encompasses hydrogen production and transportation from Africa to Germany. PV-based hydrogen production based on water electrolysis was assumed for this study. Transportation of liquid hydrogen involves several steps. First is truck transport from the electrolyzer plant to the export port, where gaseous hydrogen is liquefied and stored. Afterwards, liquid hydrogen is loaded and shipped to Germany. The liquid hydrogen is vaporized at the destination port to be distributed by the pipeline. The system boundary encompasses both foreground and background processes, including essential upstream activities like raw material extraction. Figure 3 illustrates the system boundaries adopted for this study.
Defining the functional unit (FU) is a crucial component within LCA. An FU defines the product, service, or system whose impact is analyzed by means of LCA. The conditions of the FU are defined as the “provision of 1 kg of hydrogen” (purity > 99% vol. pressure 70 bar (p2), temperature 25 °C) injected into the hydrogen distribution pipeline in central Germany. This FU choice aligns with the FC-HyGuide document [23].
Production locations were chosen using location-based information concerning PV electricity costs, energy demands, and land and water suitability [3]. The model is built upon the coupled process simulation developed for our previous work [22]. Three African countries were analyzed in more detail: Morocco, Senegal and Nigeria. Average irradiance numbers were selected for these export locations. As a comparison, the average site in Germany was analyzed. Since production sites of very large PV parks are not likely to be directly located on the coast due to limited available space, 300 km were assumed to be the distance from the production site to the port [3].
Although our primary analysis maintained a system-level approach, we recognize the importance of background scenarios in understanding the interactions between a product and its surrounding environment. The landscape of methodologies has been evolving to accommodate new techniques that provide a more nuanced and comprehensive understanding of environmental impacts. These techniques enhance the traditional LCA methodology by offering deeper insights into specific stages, broader contexts, and circular economy principles. The classic LCA methodology used in this study offers a broad perspective suitable for initial assessments of emerging technologies. The availability of data and resources limited our ability to conduct a detailed analysis of multiple foreground, background, and recycling scenarios. The complexity of integrating these newer methods required additional expertise and resources that were beyond the scope of this study.

2.3. Data Input

The LCI is partly grounded in primary industry data and secondary literature sources. In order to provide comprehensive coverage of relevant process steps and ensure accuracy and consistency, the ecoinvent database (version 3.6) was applied for the GaBi model [24]. Most of the data was collected from LCA studies, manufacturers’ datasheets, and publicly accessible weather databases. The electricity sources were either specific electricity grid mixes of each country or exclusively from PV, sourced from historical weather data from PVGis. Crucial PV data were sourced from IEA-PVPS Task 12 reports [25].

3. Life Cycle Inventories

The LCI section describes the analyzed supply chains of hydrogen. The inventories were separated into “hydrogen production—subsystem 1” and “hydrogen transportation—subsystem 2” (see Figure 3).

3.1. Hydrogen Production

The electrolyzer employed in this LCA is a proton exchange membrane (PEM). One of the key advantages of PEM electrolyzers is their superior efficiency at lower current densities, as proton transport through the membrane is highly responsive to power fluctuations [26]. This attribute enables efficient operation with intermittent PV electricity. One MW PEM plant was modeled using the data from Bareiß et al. [27] (see Table A1 and Table A2). Unfortunately, the Nafion membrane material flow was absent, necessitating perfluoro sulfonyl fluoride data instead [28]. Further information on the LCI and configuration choices is described in more detail by Kanz et al. [22]. Twenty-five years were assumed for the lifetime of the system. The electrodes in the electrolyzer were assumed to be replaced during the lifetime. In the baseline scenario at an efficiency of 60% LHV, 55 kWh of electricity and 9 kg H2O are required to produce 1 kg H2 [27]. Oxygen production during electrolysis is not actively utilized.
It was assumed that the electrolyzer operates at a constant production profile powered by conventional silicon PV modules. PV performance values were supplemented by country-specific irradiance data obtained from PVGIS-SARAH2 [29]. A system loss of 14% was assumed. The azimuth angle of 0° and a degradation rate of 0.7% per year were analyzed [25]. A decline in PV electricity of 4.4% produced due to dust had to be considered for African production regions [30]. The electrolyzer’s operation profile and input parameter for domestic production in Germany were assumed to be the same as those of the other supply chains. Due to lower irradiance in Germany (of 1.100 kWh/m2 a), a higher GWP value of 56.6 gCO2-eq/kWh PV was applied [31]. Table 2 provides the essential input parameters for the PV plant in our study.

3.2. Hydrogen Transportation from Africa to Germany

This section describes the hydrogen transportation route from the production location in Africa to the end consumer in Germany. The transportation involves a multi-step process, outlined in the following sub-sections. This refers to all steps of Subsystem 2 from Figure 3.

3.2.1. Truck Transportation from the Production Site to the Terminal

The average distance between production locations and the liquefaction plant was assumed to be 300 km. For the emission calculation, both ways (600 km) were counted. The transportation of hydrogen was carried out by trucks fueled by diesel. The inventory was carried out based on ecoinvent data, and the emission intensity was calculated based on GaBi [24]. The truck’s average speed is 50 km/h, consumption is 35 l/100 km, and its lifetime is 15 years. The assumed load was 1000 kg net of compressed hydrogen per truck. In addition to the unloading/uploading process, losses of 0.5% were considered [32]. A full overview of the parameters of the trucks can be taken from Table 3.

3.2.2. Liquefaction Plant and Storage

The process of liquefying hydrogen is very electricity demanding, as the hydrogen becomes liquid at about −253 °C at normal pressure. The process requires several compression and cooling steps, with an overall demand of a minimum of 3.9 kWh/kg. Existing liquefaction plants typically need more electricity, depending on the size of the plant [33,34]. For instance, the specific electricity consumption at full load operation of a plant with a 50 tpd capacity is 6.4 kWh/kgH2. When considering some auxiliaries and additional losses, e.g., due to feed gas and flash gas compressors, the energy consumption increases to an average of 7 kWh/kgH2 (see Table 4) [35]. The liquefaction process requires low-temperature insulated storage tanks. Liquid hydrogen can be kept in cryogenic tanks at below 10 bar pressure. Considering the inability to entirely prevent heat transfer into the hydrogen tank, hydrogen boil-off was considered [36]. The LCI input data can be found in Table A3.

3.2.3. Ship Transportation

Similar to the transportation of natural gas, hydrogen ca be conveyed in its liquefied form via ships [37]. Because of the unavailability of the LCI of LH2 ships, the emissions had to be calculated based on the liquid natural gas (LNG) ships in GaBi. Heavy fuel oil was used as the fuel. Emissions from voyages from and to Germany were incorporated. The expected transported quantity of LH2 per ship was 100,000 m3 gross [38]. The cryogenic LH2 is transported in heat-insulated, cryogenic spherical tanks [39]. The boil-off was not estimated to be reliquefied [40] or used as a marine fuel [41]. The LH2 supply chain involved some infrastructural measures. The liquefaction, gasification, and storage facilities were assumed to be built at existing ports. These include terminals in the exporting and importing countries, which are connected to infrastructure for further distribution, e.g., CSBC—Morocco, SNDKR—Senegal, NGLOS—Nigeria, and NLRTM—the Netherlands [42,43]. Table 5 provides a comprehensive overview of all parameters related to ship transport.

3.2.4. Domestic Distribution per Pipeline

Hydrogen is transferred from the tanker to the pipeline infrastructure [45]. The pipeline design in Germany was selected following the proposal of the European Hydrogen Backbone. In this study, 60% of the infrastructure involved repurposed pipelines. To reuse the existing natural gas pipes for gaseous hydrogen transportation, extra corrosion protection coating had to be added [46,47]. Fifty years of operation can be anticipated for the new hydrogen pipelines. The repurposed pipelines can be in service for hydrogen transportation for 30 years [45].
Compressor stations with an electricity demand of 0.1 kWh/kgH2 were installed every 100 km to keep the operating pressure of 70 to 100 bar [48]. Based on the compressor stations’ efficiency, the maximum hydrogen mass flow was analyzed for different pipe diameters. The piston compressor NEA API 618 was estimated for the given hydrogen flow rates and pressure levels [49]. Compressor electricity input was assumed to covered by the current German electricity grid mix of 0.420 kgCO2-eq/kWh [50]. Following the Frazer-Nash study, 0.5% losses per 1000 km were assumed for the hydrogen transportation [51]. Descriptions of the pipeline parameter can be found in Table 6, Table A4 and Table A5 [45].

4. Results and Discussion

Emissions associated with the hydrogen supply can be divided into primary categories: those resulting from hydrogen production (Subsystem 1) and those associated with its transportation (Subsystem 2).
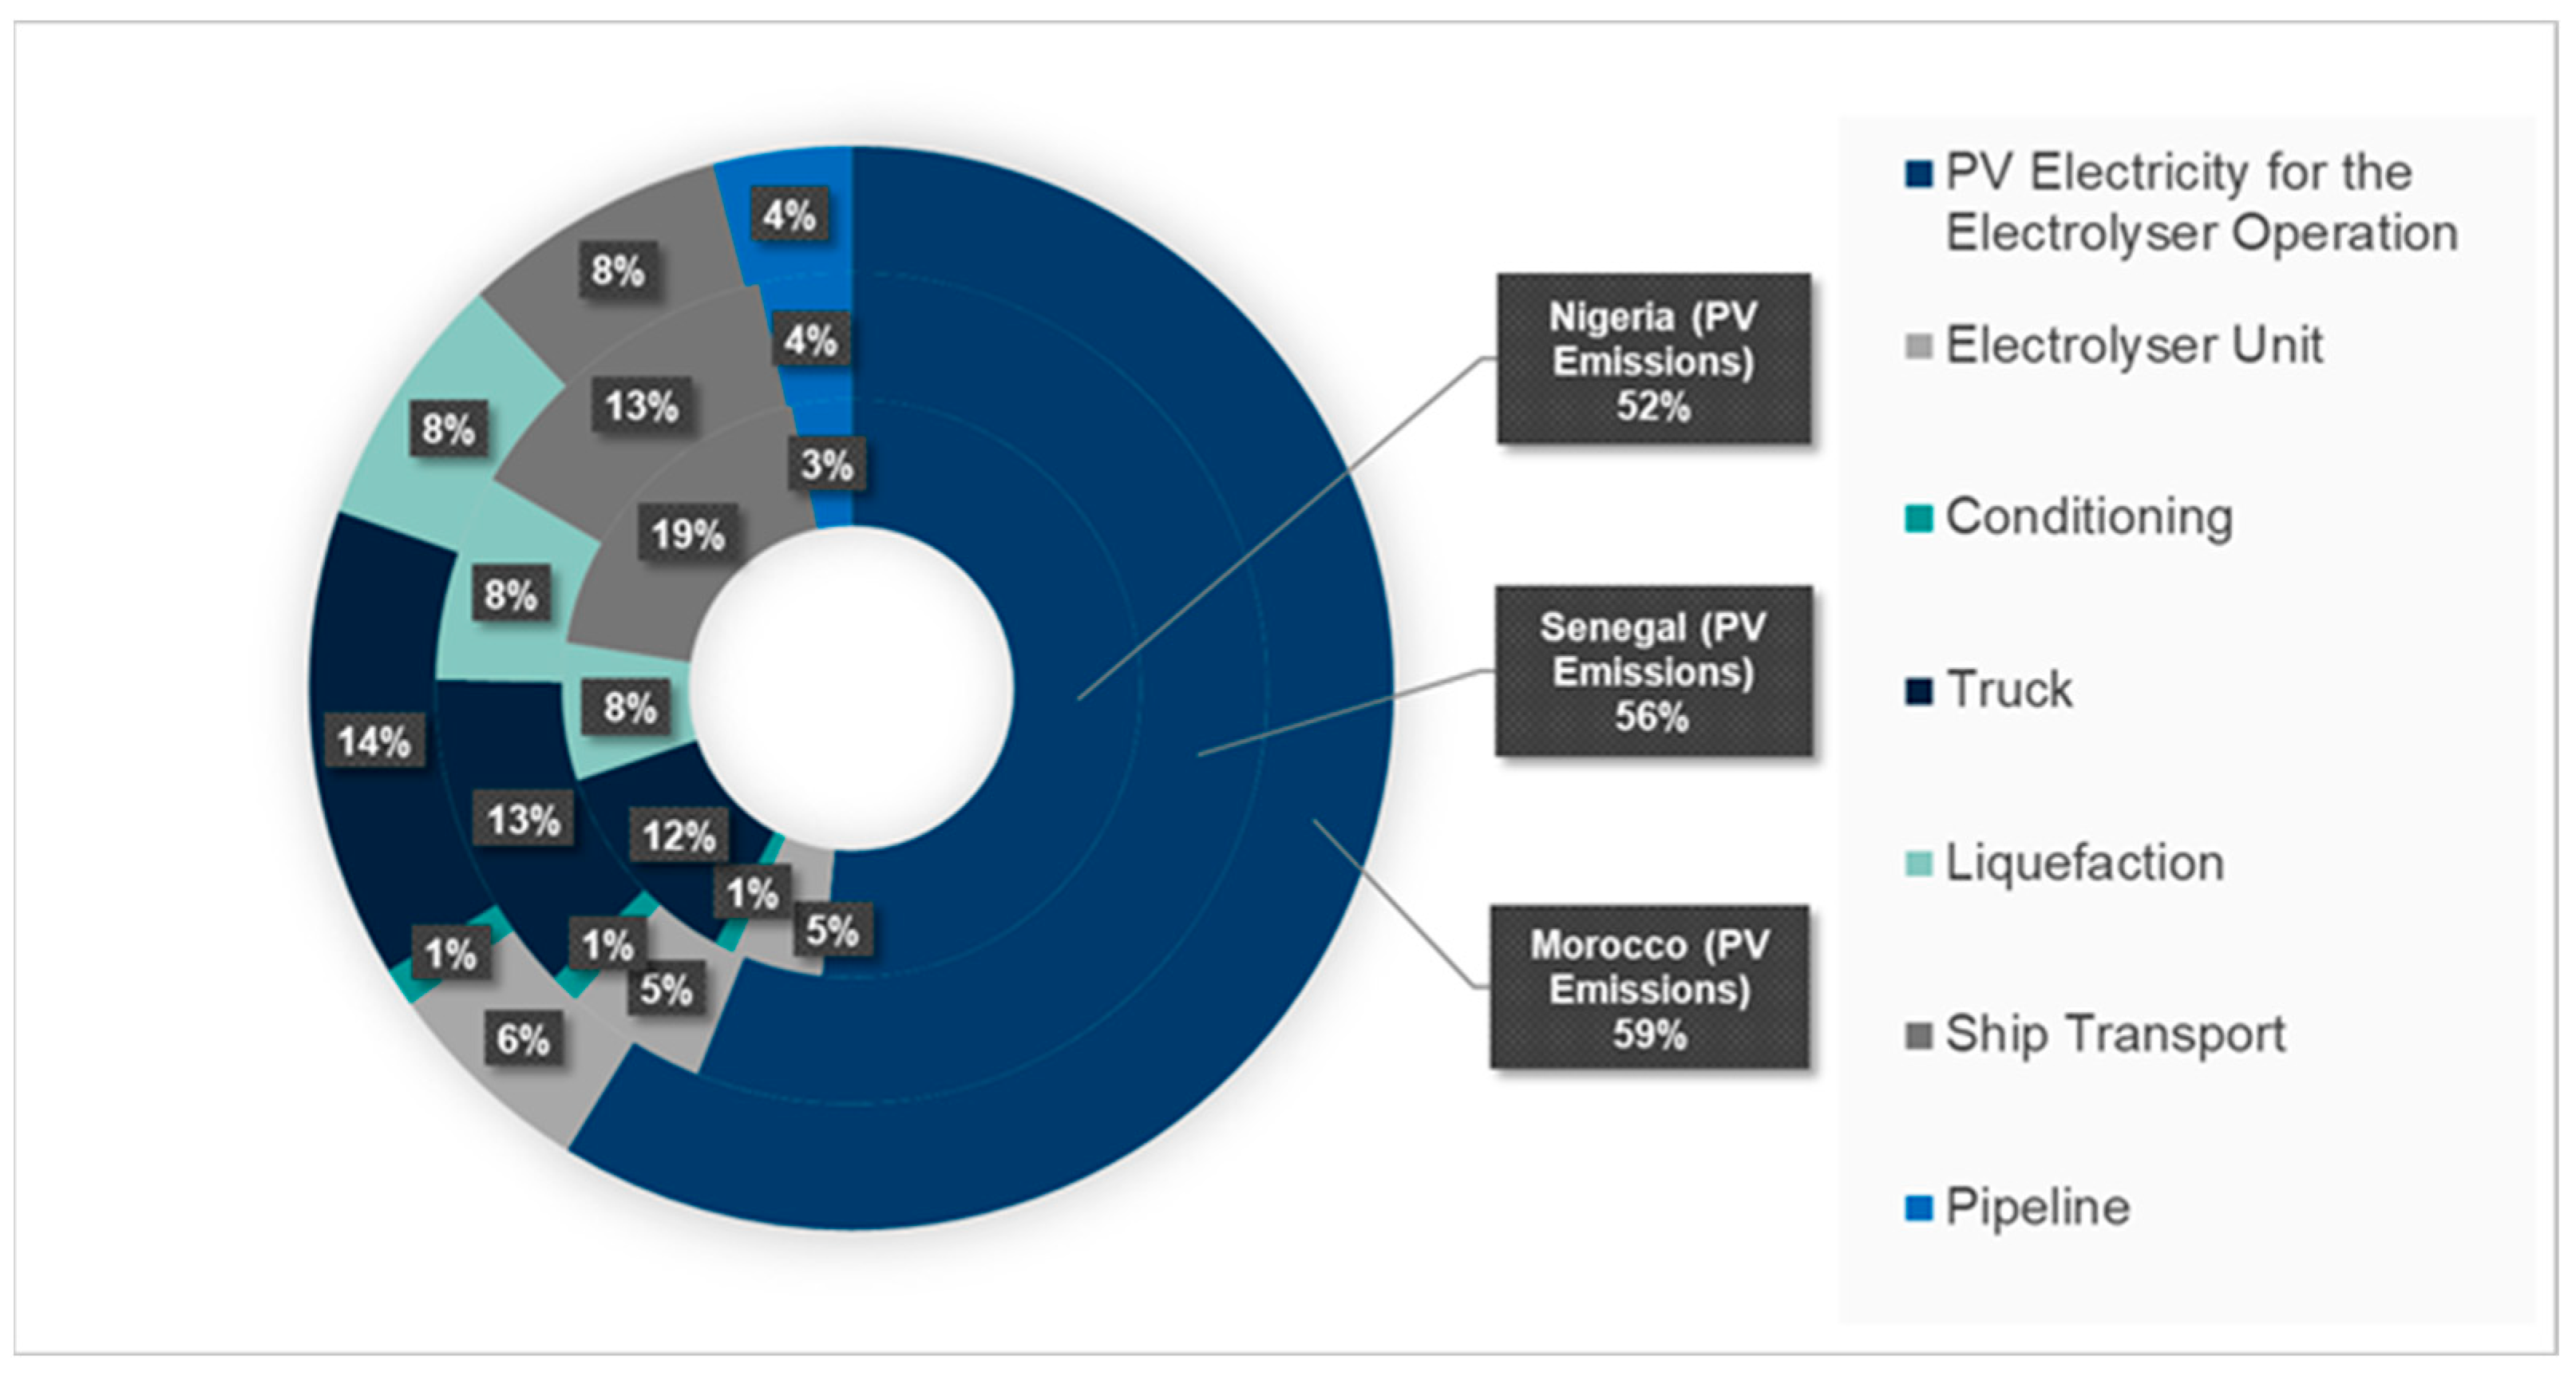
  • The first category encompasses emissions that occur indirectly, stemming from the manufacturing and operation of the electrolyzer. This includes emissions related to using PV electricity for electrolyzer operation and electrolyzer unit production.
  • The second category involves transportation-related emissions, which arise from activities such as conditioning for transport, truck delivery, liquefaction, shipping, and pipeline distribution. This includes emissions associated with the conditioning of hydrogen during transport, as well as the manufacturing of pipes for distribution, fuel consumption, and boil-off.
For both categories, multiple supply chains were analyzed, and the results are presented in this section.

4.1. GWP Results of Hydrogen Imports from Africa

To reduce the number of supply chains analyzed, we first considered pathways from Africa with centralized liquefaction plants at the port. In the following analysis, we added pathways to domestic production with pipeline distribution. Additional scenario analysis of the main pathways revealed the most sensitive assumptions of the model.
Hydrogen boil-off was a crucial parameter in this study, causing hydrogen losses at different supply chain stages. From an LCA standpoint, it is essential to note that up to 1.2 kg of hydrogen must be supplied to achieve a functional unit of 1 kg in Germany. The boil-off rates of liquid hydrogen transport from Africa to Germany are illustrated in Figure 4. The majority of the boil-off occurred during the shipping stage, which includes both the loading and unloading of the ships. The additional production of “lost” hydrogen was already accounted for in the study’s results at each step of the supply chain. However, in this study, the direct GWP associated with hydrogen leakage was excluded from the analysis, following the IPCC guidelines.

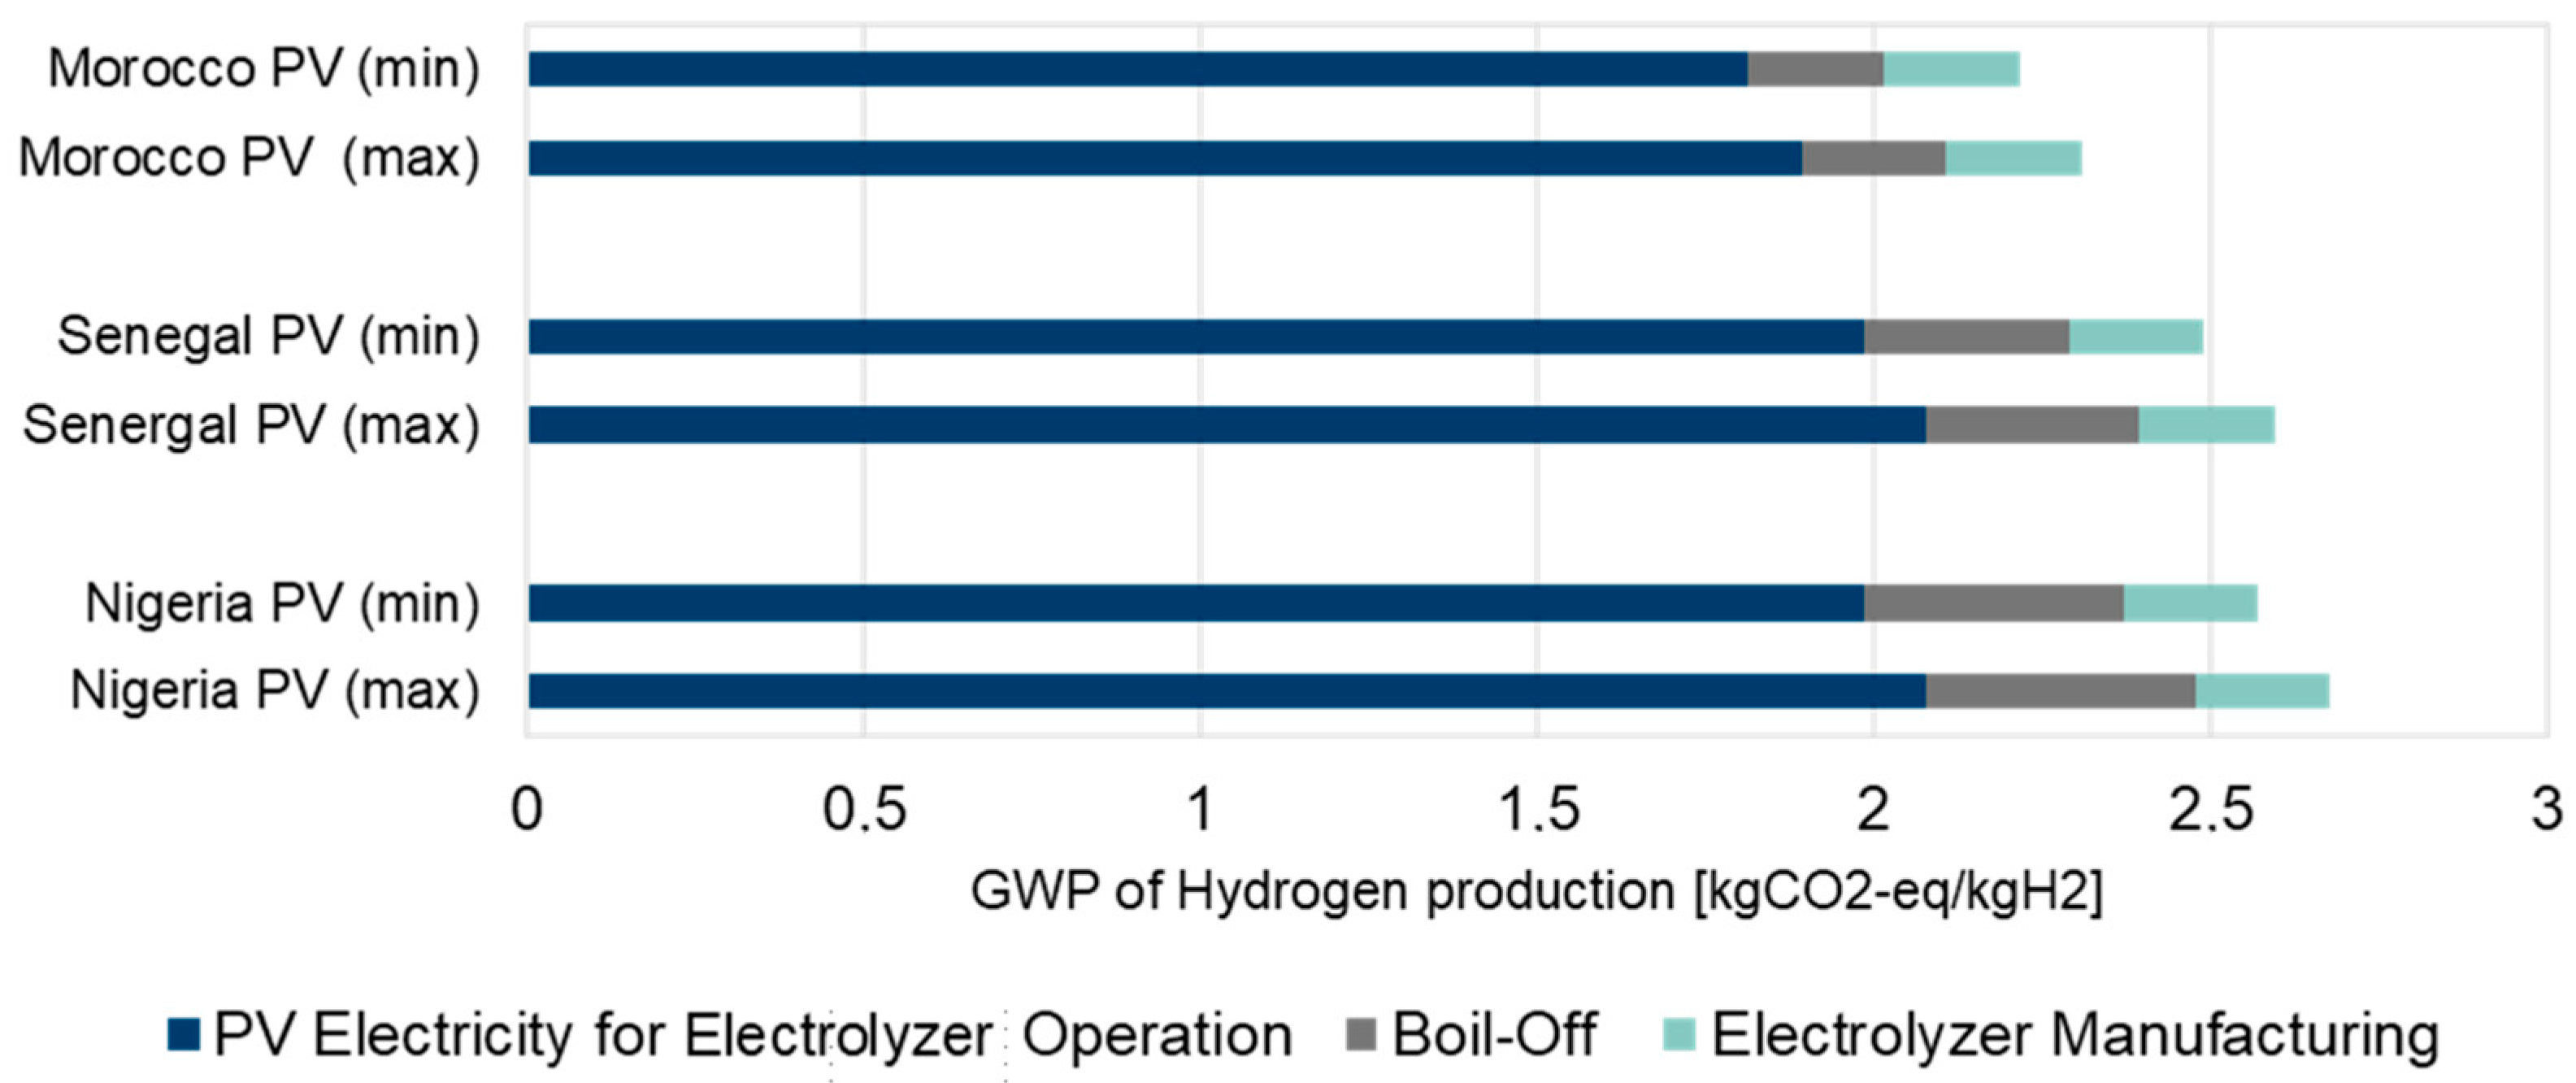
4.1.1. GWP Results of Hydrogen Production

The GWP results of PV-based hydrogen production exhibited a realistic range of 2.25 to 2.72 kgCO2-eq/kgH2, influenced by PV outputs, electrolyzer efficiencies, and irradiation values (refer to Figure 5). These values are consistent with the range of results reported in other literature for hydrogen production without considering transportation, as indicated in Table 1. As expected, the biggest contributor to the GWP of hydrogen production was the electricity used to operate the electrolyzer.

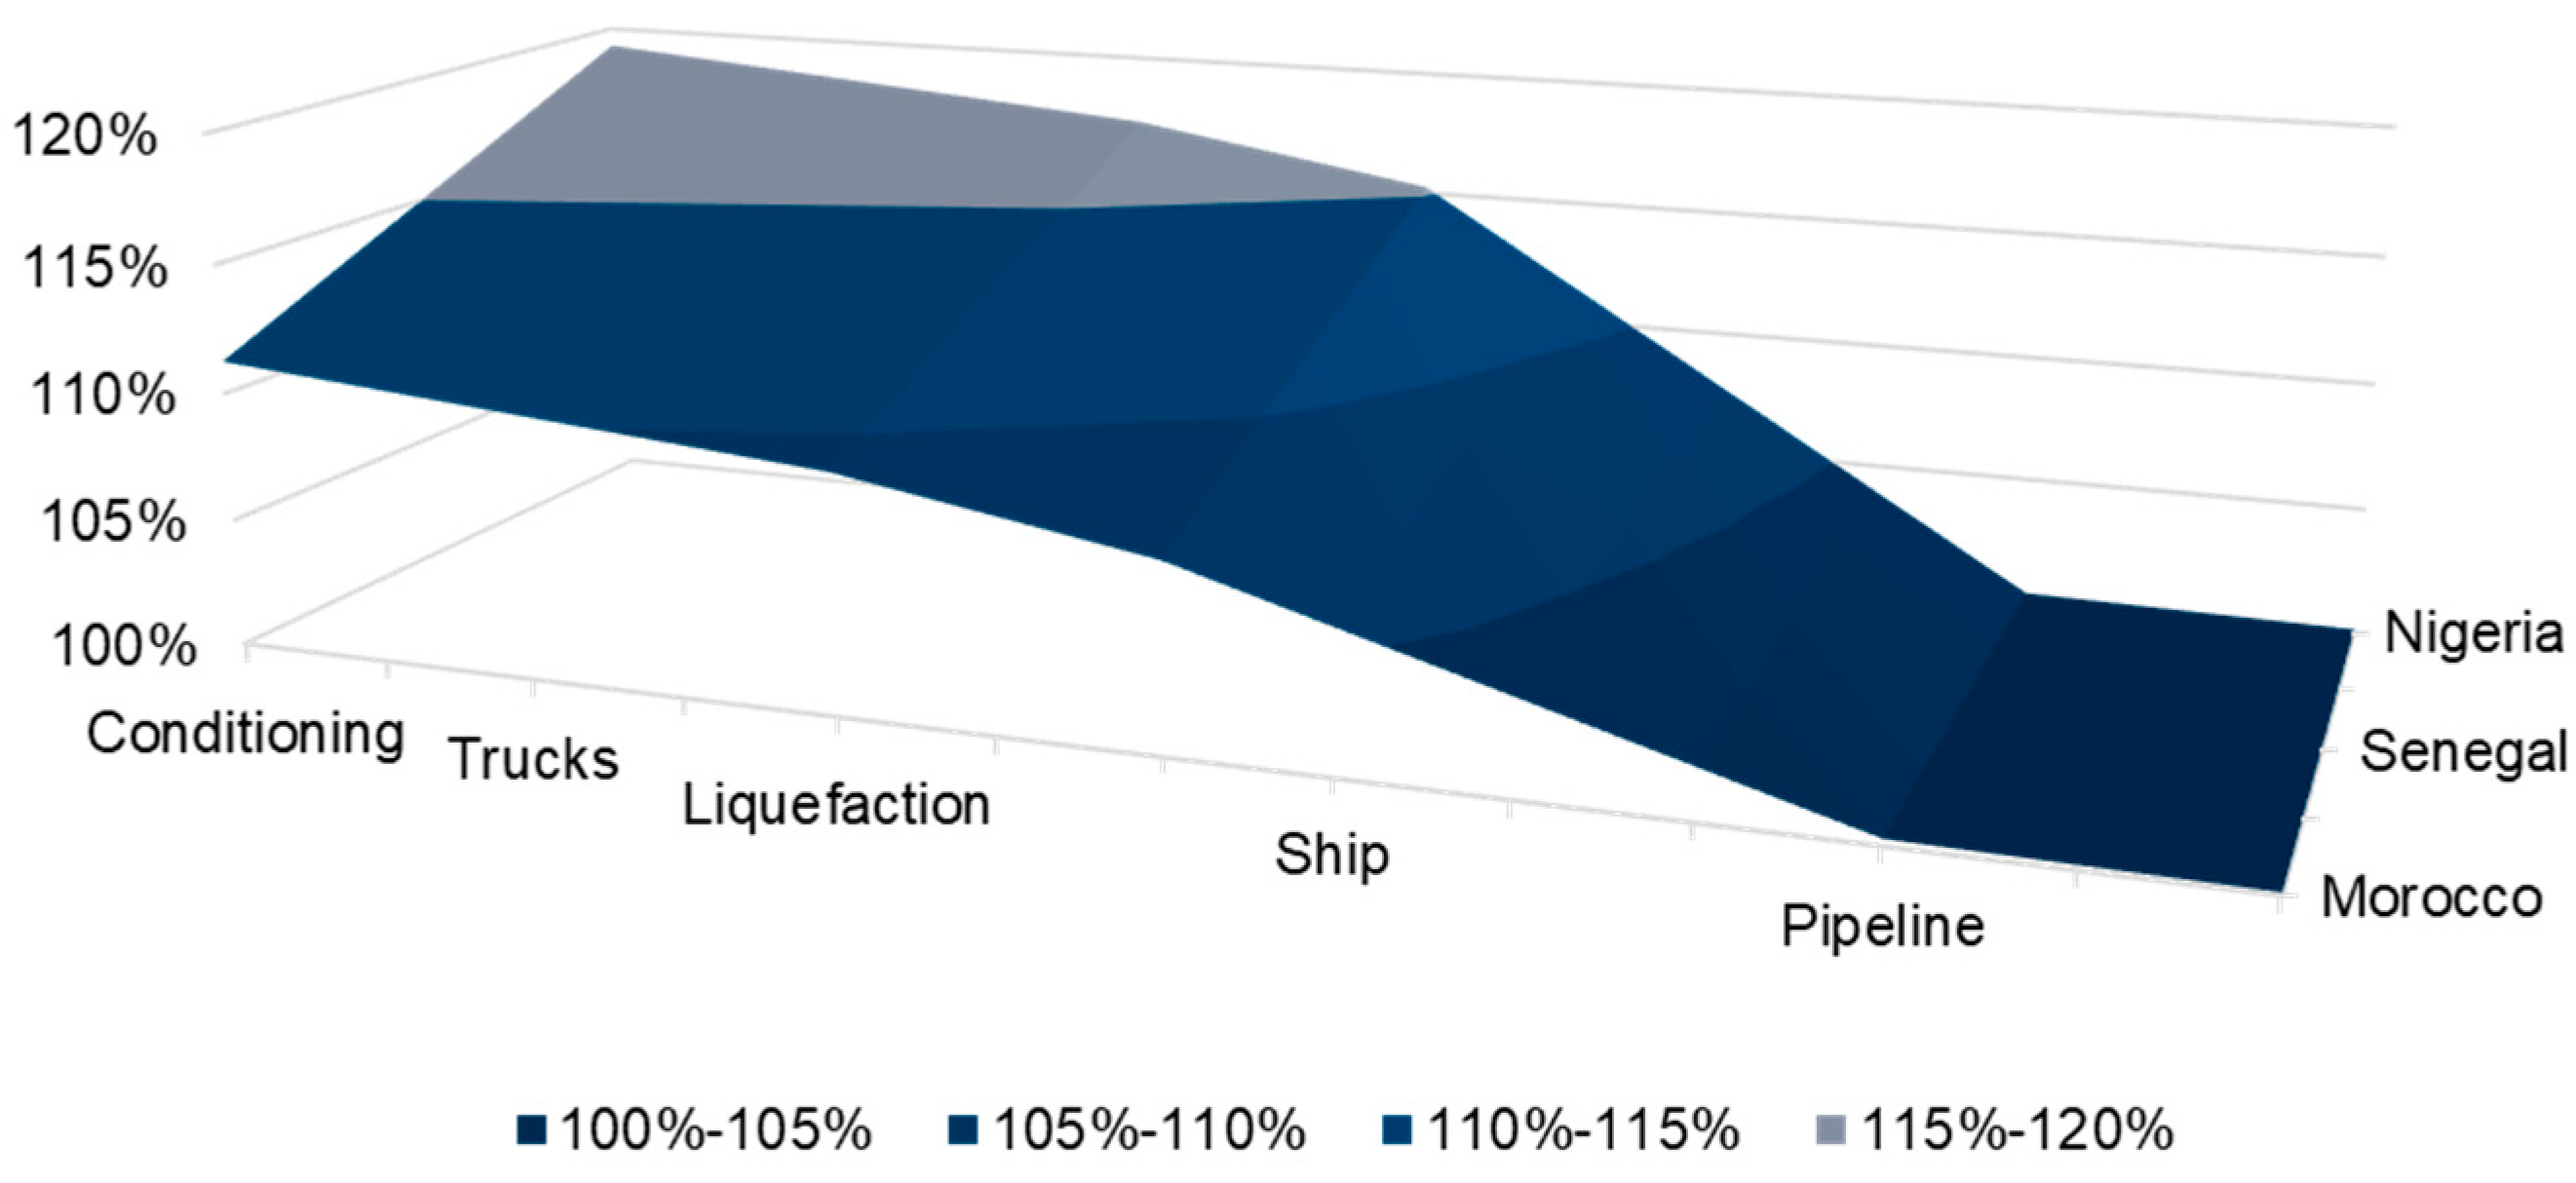
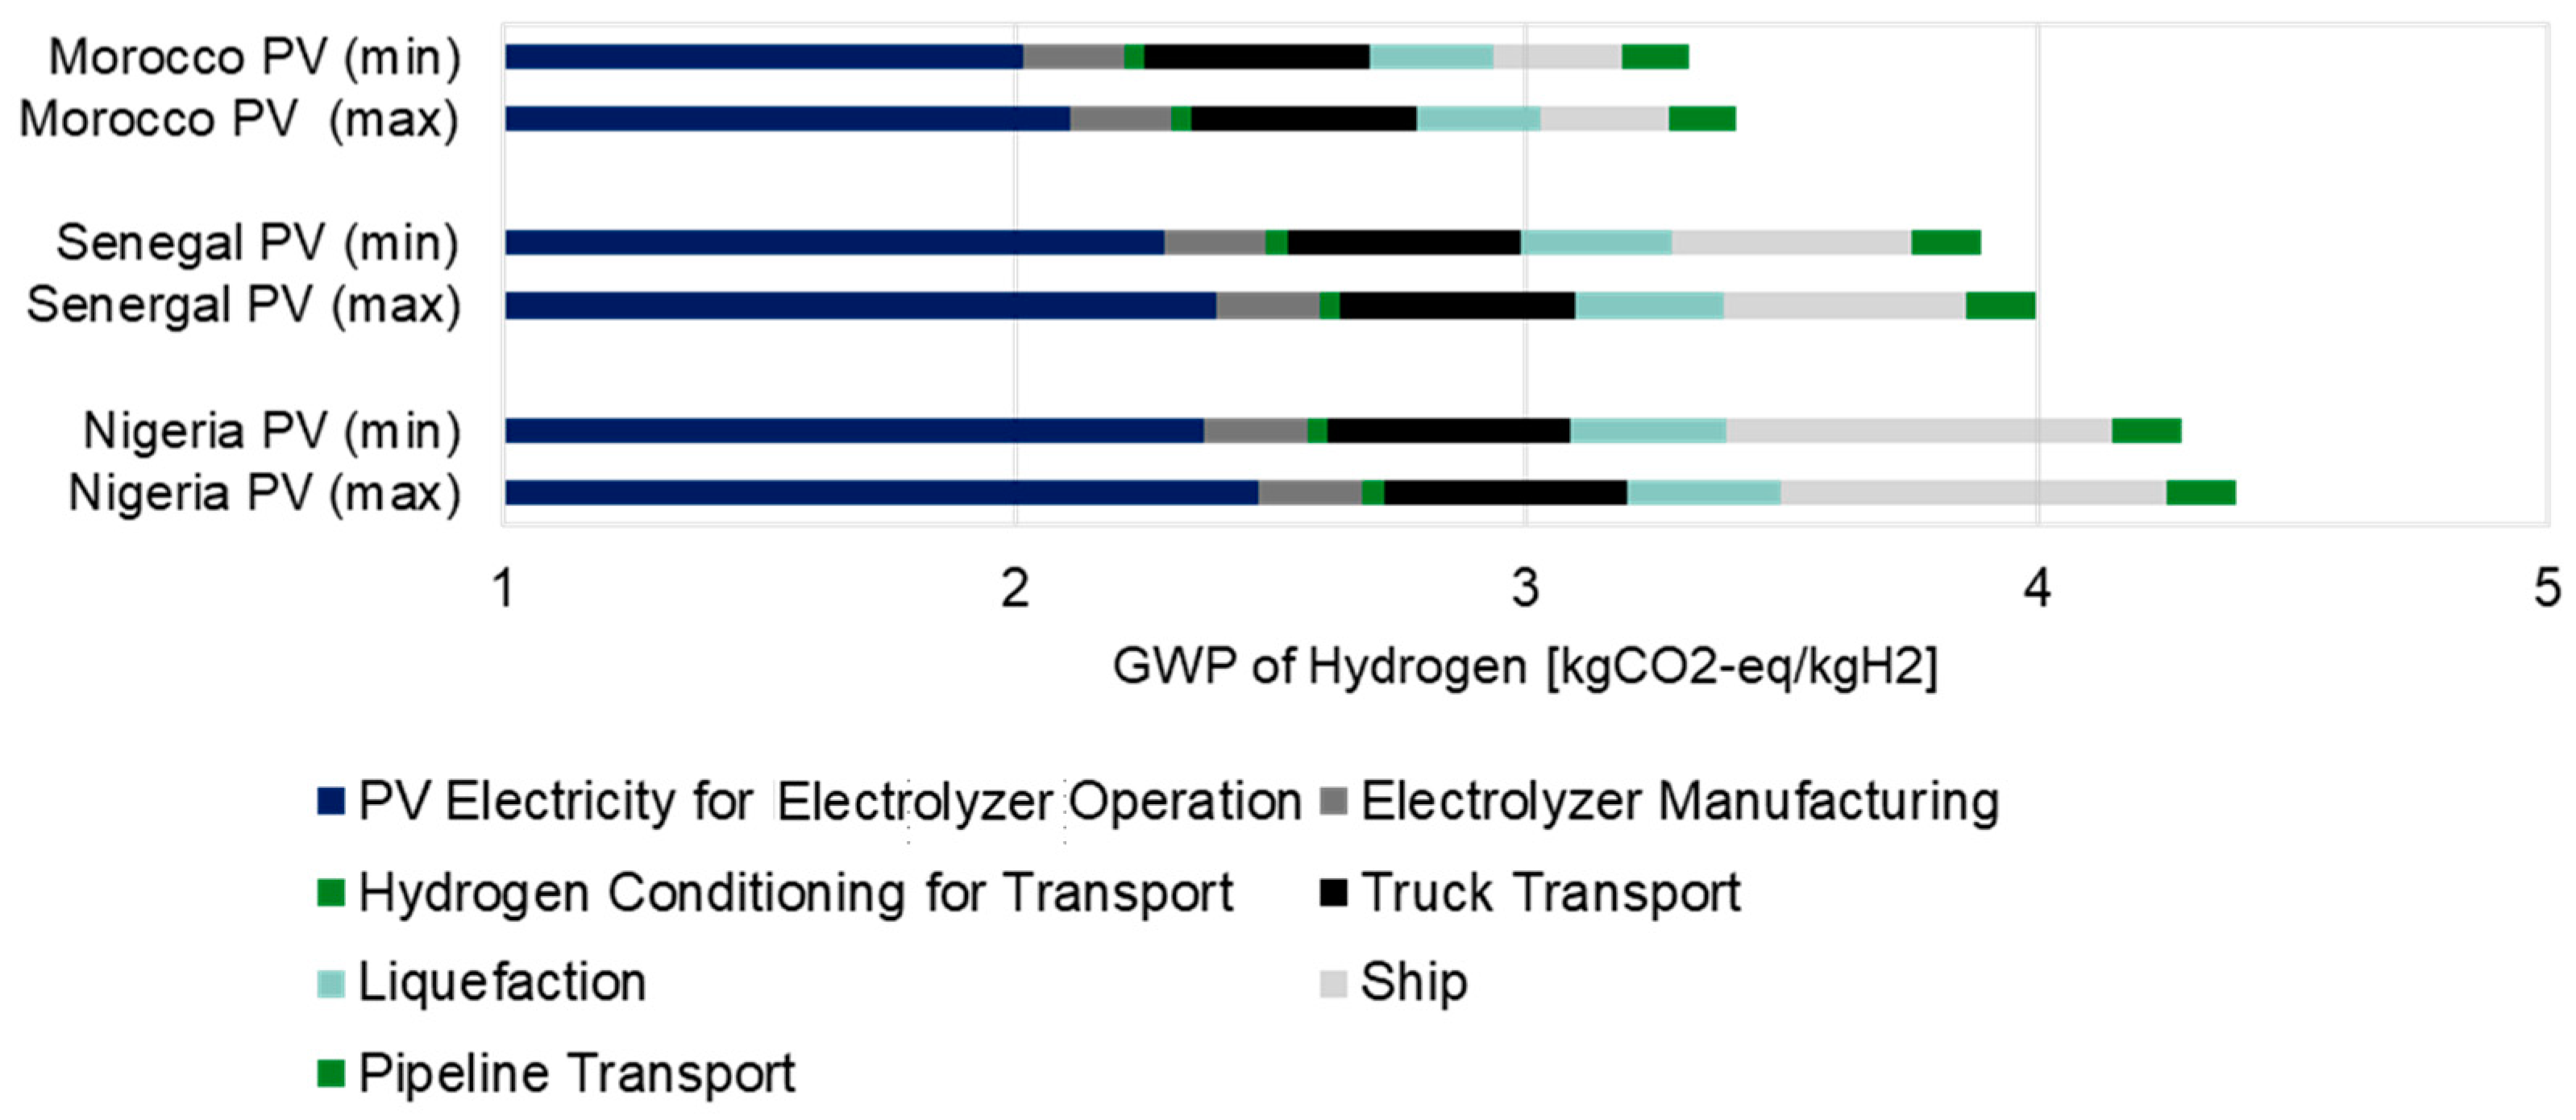
4.1.2. GWP of Hydrogen Transportation from Africa to Germany

Depending on the scenario, the transportation of produced hydrogen contributed to 35–43% of the overall GWP (see Figure 6 and Figure 7). Variations in transport GWP primarily stemmed from the distance covered by the shipping vessels and the boil-off occurrences.
As highlighted in the preceding section, nearly 20% of hydrogen was lost during transportation from Nigeria to Germany. Interestingly, in the case of Morocco, emissions from transportation by trucks (14%) exceeded those from shipping (8%).
Hydrogen imports from Morocco had a cumulative GWP ranging from 3.32 to 3.4 kgCO2-eq/kgH2. Likewise, the supply chains from Senegal and Nigeria resulted in emissions ranging from 3.88 to 3.99 kgCO2-eq/kgH2 and 4.27 to 4.38 kgCO2-eq/kgH2, respectively. Figure 7 illustrates the emissions related to the production and transportation of hydrogen from Africa to Germany. Different scenarios of electrolyzer efficiencies were considered for each location, with “min” representing higher-efficiency and “max” representing lower-efficiency electrolyzers. These values fall within the range of results reported in other literature, as demonstrated in Table 1.
Nevertheless, even in the low-efficiency scenario of the study, hydrogen was shown to have a lower GWP compared to alternative production methods reliant primarily on fossil fuels. For instance, as indicated by a review conducted by Bhandari [7], steam methane reforming (SMR) of natural gas yields 10.9 kgCO2-eq/kgH2, excluding the distribution phase. Other literature also presents higher values for SMR-based hydrogen production, with a GWP of 17.5 kgCO2-eq/kgH2 [52]. By incorporating carbon capture and storage technologies, the production of “blue” hydrogen results in a GWP of 6.87 kgCO2-eq/kgH2 [53]. However, it is worth noting that the emissions associated with the entire transportation chain were usually not further analyzed in those studies and thus remain unknown.

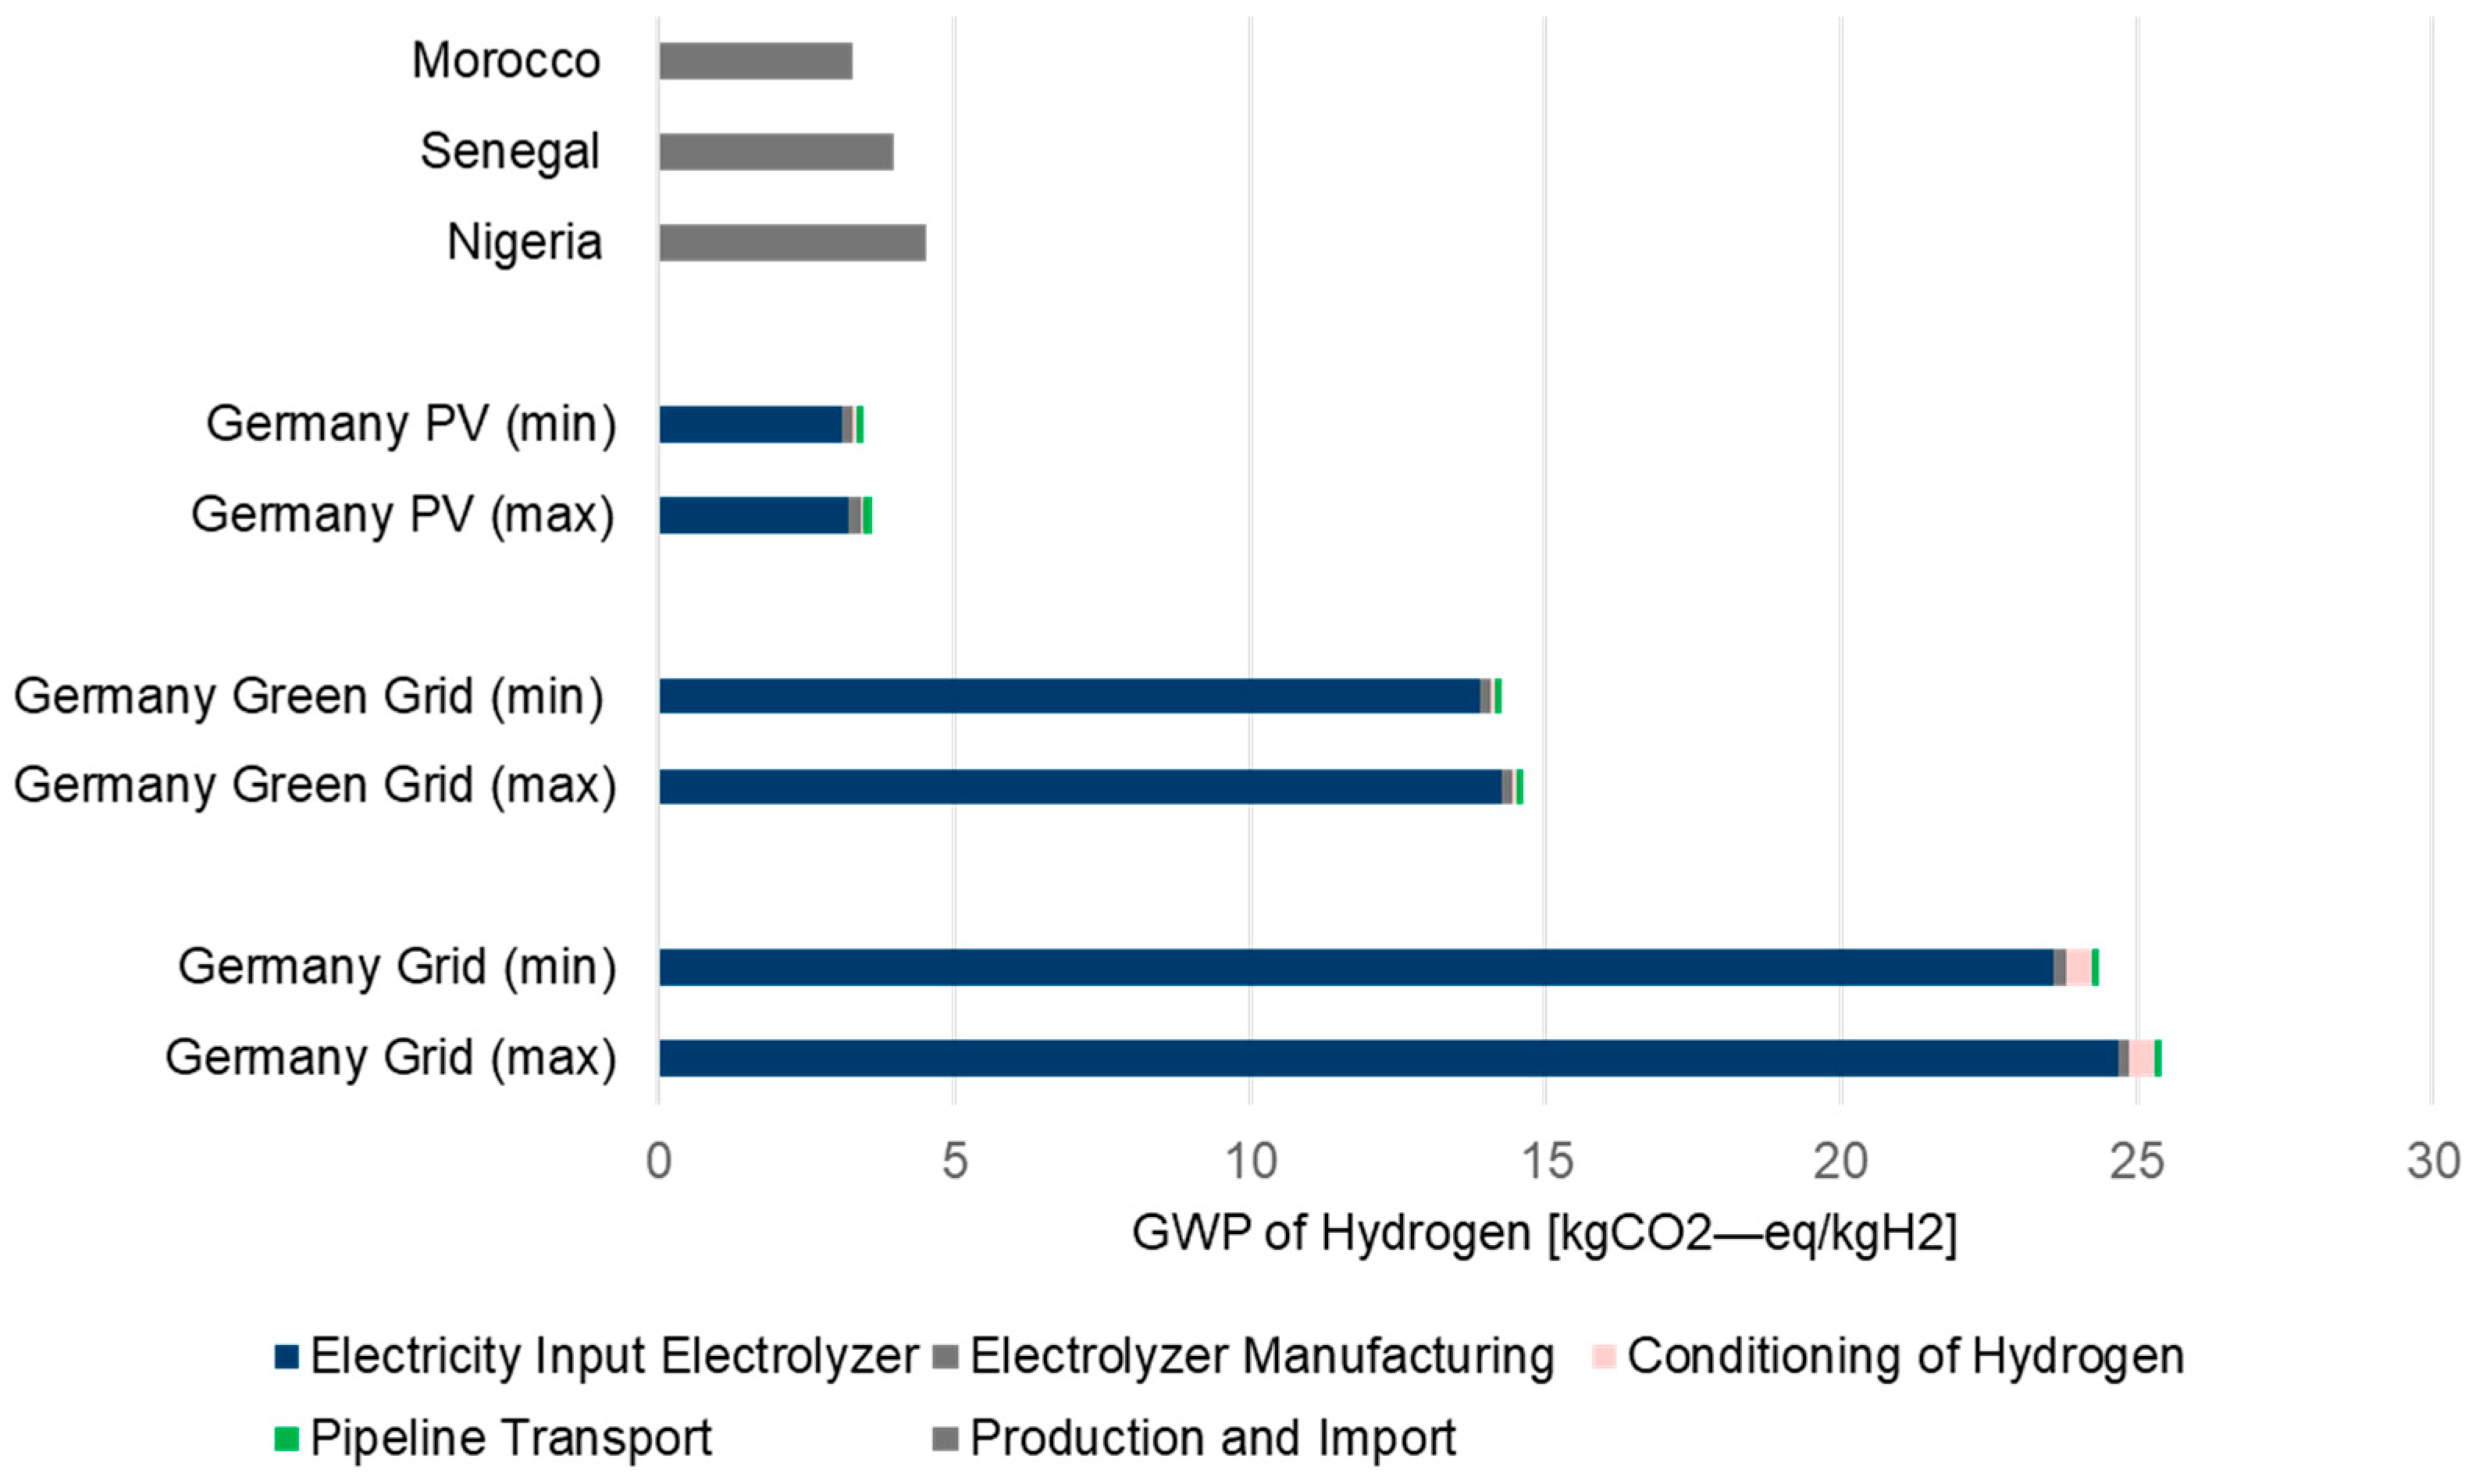
4.2. GWP Comparison to Domestic Hydrogen Supply Chain

Additionally, a scenario was examined involving a PV-powered PEM electrolyzer in Germany. Additionally, a scenario was examined involving a PV-powered PEM electrolyzer in Germany. The previously mentioned mass flows were assessed in two scenarios: one involving lower-efficiency electrolyzers requiring 57.5 kWh per kg H2 and another involving higher-efficiency electrolyzers with a demand of 55 kWh per kg H2. For Germany, an average value of 0.056 kgCO2-eq/kWh was taken for the GWP of PV electricity [54]. This value was calculated based on mono c-Si technology in central Germany (1100 kWh/m2a) and an expected lifetime of 30 years. The production region of the modules was assumed to be in China. In addition, an additional scenario was investigated in which the current German grid mix was assumed to power domestic hydrogen production (0.420 kgCO2-eq/kWh). The expected distribution distance of 300 km was assumed to be covered by the pipeline equally to other supply chains.
The results for domestic hydrogen production and distribution in Germany showed a GWP of 3.47–3.61 kgCO2-eq/kgH2 and 24.36–25.42 kgCO2-eq/kgH2 for PV-powered and grid-powered production, respectively. This underscores the significance of transitioning toward cleaner and more sustainable electricity sources. Lowering the carbon intensity of the grid can substantially mitigate the GWP of hydrogen production, making it a more climate-friendly option. The relatively low GWP of PV-based hydrogen supply is indicative of the benefits associated with PV, even for European countries. This value falls within the range of results observed in other literature, as indicated in Table 1. If we assume an average carbon intensity of the future grid of 0.25 kgCO2-eq/kWh, the GWP of hydrogen reduces to 14.63–15.00 kgCO2-eq/kgH2 (see Figure 8).
This indicates that in the baseline scenario, the import of PV-powered hydrogen from Africa would have a similar GWP level to domestic production unless grid electricity is used to power the electrolysis in Germany instead of PV.

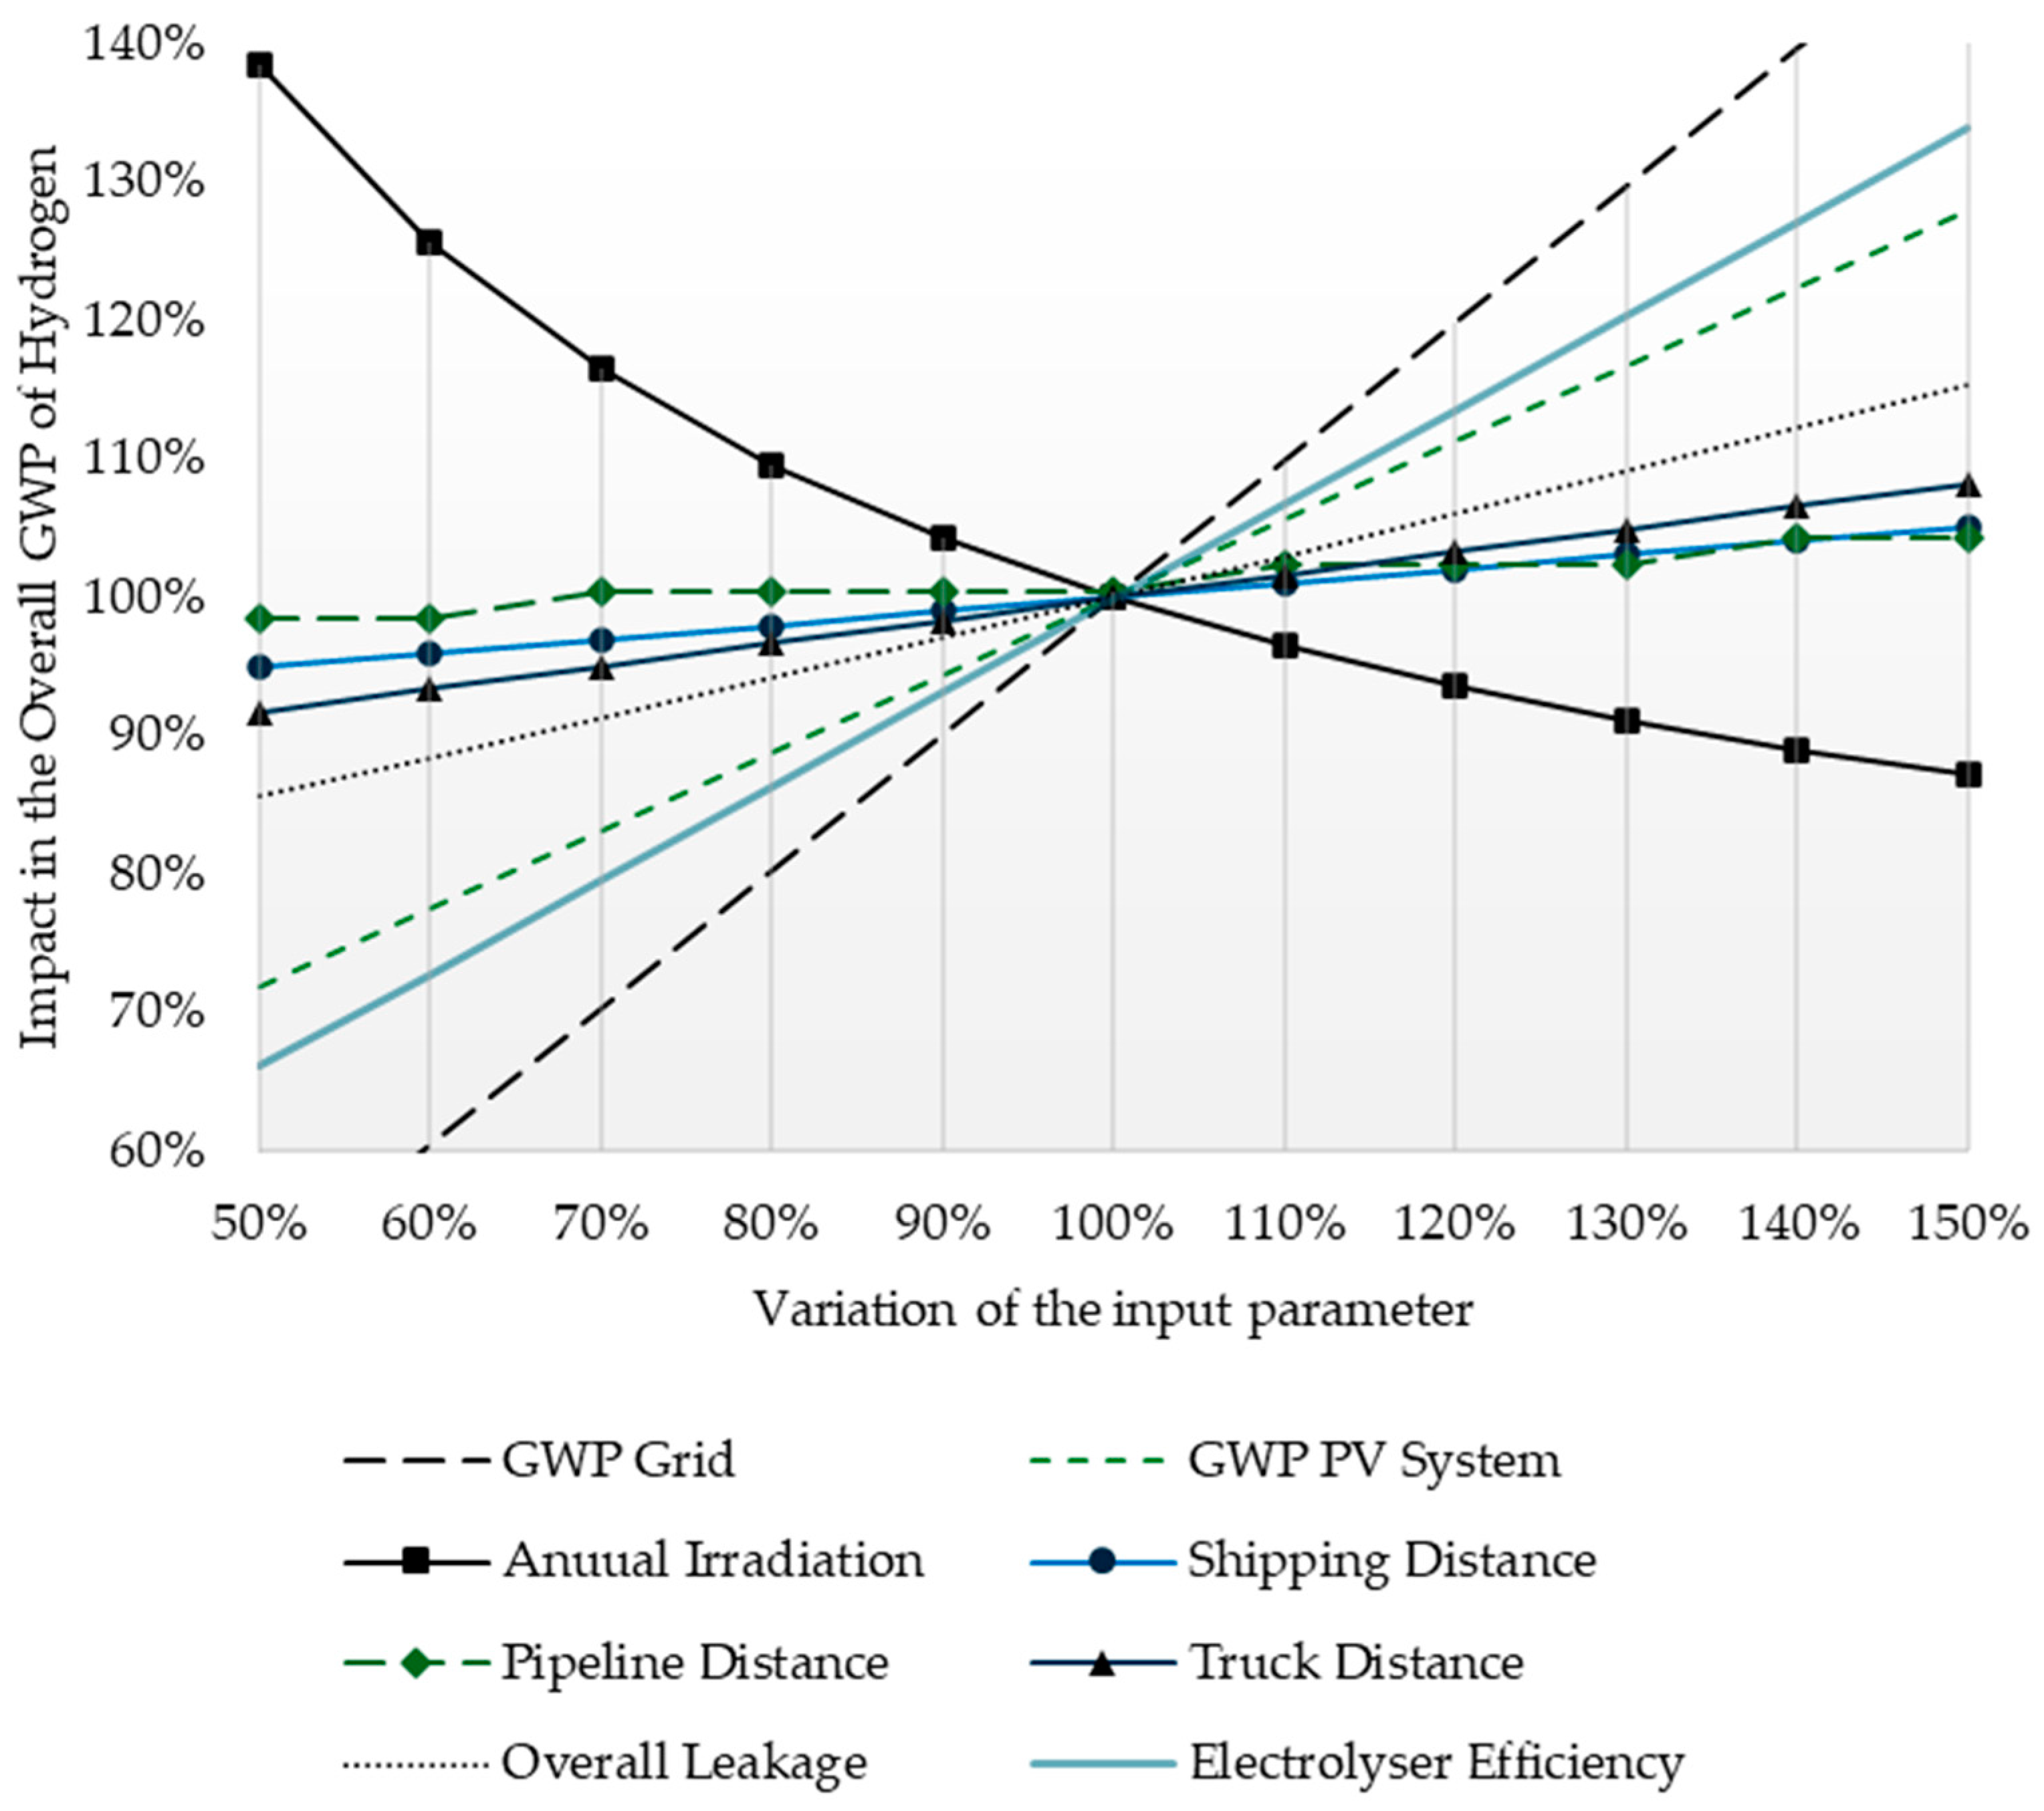
4.3. Sensitivity Analysis

Multiple assumptions of the LCA system boundaries had visible effects on the GWP of the hydrogen supply. Thus, a sensitivity analysis was used as a fundamental tool to assess the influence of these factors. Figure 9 shows the results in the form of [%] change of overall GWP given [%] change along mono-dimensional corridors of the input parameters.
The assumed energy yields of PV systems and the GWP of the PV panels played the most critical role in determining the energy efficiency of hydrogen supply. Additionally, lower GWP values for PV systems contributed to a more environmentally sustainable hydrogen supply chain. The factor of geographical separation between the PV system and the African harbors had a less notable impact on the emissions associated with hydrogen transportation. For the domestic hydrogen production scenario in Germany, the degree to which the electricity mix leans toward renewable energy sources and electrolyzer efficiency profoundly impacted the overall GWP of hydrogen production.

4.4. Limitations of the Study and Recommendations

Comparability between the LCA results of diverse energy systems can be challenging due to variations in system boundaries, functional units, timeframes, and geographical regions. Therefore, the outputs of an LCA should be interpreted within the context provided by the specific LCA study. For example, PV performance can differ based on factors such as irradiance, module technology, and cell efficiency. The choice of system boundaries can significantly impact the outcomes of an LCA study. In this study, for instance, we made the decision to exclude island systems with batteries due to uncertainties related to their sizing, such as the required level of operational reliability, system autonomy, and electrolyzer load profiles.
This LCA is based on significant data on future energy systems. The results are subject to uncertainties and variability caused by assumptions made regarding the future, which does not currently exist as of 2023. These uncertainties include assumptions about the technological efficiencies and operational profiles of the system’s components. It is worth noting that liquid hydrogen ships are still conceptual, making it impossible to accurately predict their fuel consumption and inventory. Additionally, we assumed the performance of liquefaction and compression stations under non-stationary operation, simulating perfect base load conditions. This simplified approach was assumed due to missing data on realistic operation profiles in scientific literature.
It is essential to acknowledge that this LCA primarily centers on GWP and may not encompass other facets of sustainability, including social and economic consequences. The GWP findings, in this regard, constitute just a portion of the numerous outcomes derived from the LCA. Nevertheless, forthcoming research should also analyze other impact categories within the LCA framework, such as acidification potential (AP), eutrophication potential (EP), and photochemical ozone creation potential (POCP) [23]. We also acknowledge the importance of considering payback time and conducting economic analyses in the context of hydrogen production and transportation; we must emphasize that these topics are outside the scope of this paper.
Exporting hydrogen from Africa has the potential to bring about positive impacts on various aspects, including the local energy supply, labor market, education, and healthcare. However, it is essential to acknowledge that alongside these advantages, the act of hydrogen export also carries certain risks that necessitate attention. One notable challenge is the provision of a reliable source of clean water in Africa, a factor of paramount importance for the electrolysis process involved in hydrogen production. The H2Atlas-Africa data reveal that many regions across Africa possess ample water resources suitable for the production of green hydrogen. Furthermore, the findings from the H2 Atlas indicate that the cost of desalination, if required, would not substantially inflate the price of hydrogen [3]. Another alternative is to produce hydrogen directly from seawater, yet this technology is still under development [55].
Promoting the advantages of international collaboration and kickstarting renewable energy production are imperative steps. The establishment of international standards becomes necessary to facilitate an equitable energy transition in both Africa and Europe. This transition aims to stimulate economic growth, create fresh business prospects, generate employment opportunities, and enhance overall living standards in the two regions.

5. Conclusions

Multiple scenarios of liquid hydrogen exports from Africa to Germany were analyzed to determine the GWP of the supply of 1 kg of hydrogen. Notably, the emissions from PV-powered hydrogen production shipped from Morocco spanned a range of GWP values of 3.32–3.41 kgCO2-eq/kgH2, from Senegal 3.88–3.99 kgCO2-eq/kgH2, and from Nigeria 4.38–4.27 kgCO2-eq/kgH2. These values highly depend on the GWP of the electricity used to power the electrolysis and the liquefaction, and the shipping distance. Despite transportation’s contribution, up to 65% of import supply chain emissions arose from PV electrolysis, rendering its effect dominant. Comparing domestic production scenarios highlighted PV-powered electrolysis in Germany as competitive, especially using renewable PV sources. Sensitivity analysis demonstrated that despite the lower irradiation, PV-powered hydrogen production in Germany, coupled with a 300 km distribution, boasts less GWP than most imported chains. German PV-powered supply chain emissions ranged from 3.48–3.61 kgCO2-eq/kgH2. However, shifting the electricity source from PV to grid electricity elevated GWP to 24.35–25.42 kgCO2-eq/kgH2, reinforcing the necessity of renewable energy for hydrogen production.
In conclusion, this work highlights the significance of the entire supply chain when evaluating the GWP of hydrogen. The utilization of low-carbon or zero-emission fuels, including hydrogen or biofuels, for shipping purposes holds promise for further reducing emissions associated with liquid hydrogen transportation. Future studies should delve into alternative transportation methods, such as liquid organic hydrogen carriers. However, more comprehensive and system-relevant data are needed to accurately estimate the emissions associated with these alternative cases. As hydrogen’s significance in addressing global warming grows, a holistic approach to supply chain assessment becomes increasingly vital, paving the way for a sustainable and environmentally responsible hydrogen economy.

Author Contributions

Conceptualization, A.R., U.R., K.D., and K.B.; methodology, O.K. and A.R.; software and validation, O.K.; writing—original draft preparation, O.K.; writing—review and editing, A.R., K.B., K.D., and U.R.; supervision, A.R. All authors have read and agreed to the published version of the manuscript.

Funding

This research was funded by the Federal Ministry for Education and Research in the framework of the project “YESPV-NIGBEN”, grant number: 03SF0576A.

Data Availability Statement

Data sharing is not applicable to this article.

Conflicts of Interest

The authors declare no conflict of interest.

Appendix A

Table A1. Main materials for a 1MW PEM stack [27].
MaterialsMass (kg)
Titanium
Aluminum
Stainless steel
Copper
Nafion
Activated carbon
Iridium
Platinum
528
27
100
4.5
16
9
0.75
0.075
Table A2. Main materials for the PEM Balance of Plant [27].
MaterialsMass (t)
Low alloyed steel
High alloyed steel
Aluminium
Copper
Plastic
Electronic material (power, control)
Process material (adsorbent, lubricant)
Concrete
4.8
1.9
<0.1
<0.1
0.3
1.1
0.2
5.6
Table A3. Main materials of the liquefaction plant [34].
MaterialsMass (t)
Mass carbon steel
Stainless steel
Copper
380
595
150
Aluminum
Concrete
140
46,620
Table A4. Main materials and parameters of the pipeline [45].
Materials—Onshore PipelineValueUnit
Water187m3
Diesel, burned in construction machinery and vehicles3.31TJ
Steel X52, seamless pipeline630t
Epoxy powder, at the plant1.36kg
Polyethylene, LDPE, granules, at the plant4.64t
Transport, helicopter26h
Transport, truck 32t219,000tkm
Transport, freight, rail77,500tkm
Service life (new construction)50years
Net power demand every 100 km0.1kWh/kgH2
Compressor power12MW
Overall efficiency50%
Inlet pressure70bar
Outlet pressure100bar
Table A5. Main materials compressor station [45].
Materials—Compressor StationValueUnit
Steel profiles12.100t
Concrete172.000t
Reinforcing steel8.500t
Transport, trucks 32t54.750 tkm
Diesel, trucks, and construction machinery827.500 MJ

References

  1. Nationaler Wasserstoffrat. Wasserstofftransport. 2021. Available online: https://www.wasserstoffrat.de/fileadmin/wasserstoffrat/media/Dokumente/NWR_Wasserstofftransport_WEB-Bf.pdf. (accessed on 2 October 2023).
  2. Dena. Dena-Leitstudie Aufbruch Klimaneutralität; Deutsche Energie-Agentur GmbH (Dena): Berlin, Germany, 2021. [Google Scholar]
  3. Forschungszentrum Jülich GmbH. “. h2atlas.de/,” 2022. Available online: https://www.h2atlas.de/ (accessed on 2 October 2023).
  4. Van Wijk, A.; Wouters, F. 50–50; 2050 Final Energy Demand Split in 50% Electricity and 50% Hydrogen. In Shaping an Inclusive Energy Transition; E-Book; Springer: Berlin/Heidelberg, Germany, 2021; pp. 109–110. [Google Scholar]
  5. National Renewable Energy Laboratory. Solar-to-Hydrogen Efficiency: What You Need to Know. 2021. Available online: https://www.nrel.gov/docs/fy21osti/79108.pdf (accessed on 2 October 2023).
  6. Zhang, Z.; Miao, C.; Sun, Z.; Gan, J. Liquid Hydrogen Production, Transportation and Economic Analysis. Front. Bus. Econ. Manag. 2022, 5, 161–164. [Google Scholar] [CrossRef]
  7. Bhandari, R.; Trudewind, C.; Zapp, P. Life cycle assessment of hydrogen production via electrolysis—A review. J. Clean. Prod. 2014, 85, 151–163. [Google Scholar] [CrossRef]
  8. Wulf, C.; Reuß, M.; Grube, T.; Zapp, P.; Hake, J.-F.; Stolten, D. Life cycle assessment of hydrogen transport and distribution options. J. Clean. Prod. 2018, 199, 431–443. [Google Scholar] [CrossRef]
  9. Ozawa, A.; Inoue, M.; Kitagawa, N.; Marumatsu, R.; Anzai, Y.; Genchi, Y.; Kudow, Y. Assessing Uncertainties of Well-To-Tank Greenhouse Gas Emissions from Hydrogen Supply Chains. Sustainability 2017, 9, 1101. [Google Scholar] [CrossRef]
  10. Weidner, T.; Tulus, V.; Guillén-Gosálbez, G. Environmental sustainability assessment of large-scale hydrogen production using prospective life cycle analysis. Int. J. Hydrogen Energy 2022, 48, 8310–8327. [Google Scholar] [CrossRef]
  11. Kolb, S.; Müller, J.; Luna-Jaspe, N.; Karl, J. Renewable hydrogen imports for the German energy transition—A comparative life cycle assessment. J. Clean. Prod. 2022, 373, 133289. [Google Scholar] [CrossRef]
  12. Ozawa, A.; Kudoh, Y.; Kitagawa, N.; Muramatsu, R. Life cycle CO2 emissions from power generation. Int. J. Hydrogen Energy 2019, 44, 11219–11232. [Google Scholar] [CrossRef]
  13. Al-Breiki, M.; Yusuf, B. Comparative life cycle assessment of sustainable energy carriers including production, storage, overseas transport and utilization. J. Clean. Prod. 2020, 279, 123481. [Google Scholar] [CrossRef]
  14. Reuß, M. Techno-Economic Analysis of Hydrogen Infrastructure Alternatives. Ph.D. Thesis, Forschungszentrum Jülich GmbH, Jülich, Germany, 2019. [Google Scholar]
  15. Wulf, C.; Kaltschmitt, M. Hydrogen Supply Chains for Mobility—Environmental and Economic Assessment. Sustainability 2018, 10, 1699. [Google Scholar] [CrossRef]
  16. Sadeghi, S.; Ghandehariun, S.; Rosen, M. Comparative economic and life cycle assessment of solar-based hydrogen production for oil and gas industries. Energy 2020, 208, 118347. [Google Scholar] [CrossRef]
  17. Umweltbundesbank, Prozessdetails: LH2-Import-DE-mix-2030. Available online: https://www.probas.umweltbundesamt.de/php/prozessdetails.php?id={8C58E6DF-4F39-46A7-AF03-F8172EBB9202 (accessed on 13 June 2023).
  18. Umweltbundesbank, ProBas—Prozessorientierte Basisdaten für Umweltmanagementsysteme. Available online: https://www.probas.umweltbundesamt.de/php/prozessdetails.php?id=%7BA9247119-CF8E-4B7B-81AE-5282220E2DBB%7D (accessed on 13 June 2023).
  19. DIN ISO 14040; Environmental Management-Life Cycle Assessment-Requirements and Guidelines. ISO: Geneva, Switzerland, 2006.
  20. DIN ISO 14044; Environmental Management-Life Cycle Assessment-Principles and Framework. ISO: Geneva, Switzerland, 2006.
  21. Sphera Solutions GmbH. “gabi.sphera.com”. 2022. Available online: https://gabi.sphera.com/deutsch/index/ (accessed on 2 October 2023).
  22. Kanz, O.; Bittkau, K.; Ding, K.; Rau, U.; Reinders, A. Review and Harmonization of the Life-Cycle Global Warming Impact of PV-Powered Hydrogen Production by Electrolysis. Front. Electron. 2021, 2, 711103. [Google Scholar] [CrossRef]
  23. Lozanovski, A.; Schuller, O.; Faltenbacher, M.; Fischer, M.; Sedlbauer, K. Guidance Document for Performing LCA on Hydrogen Production; Fraunhofer-Institut für Bauphysik: Stuttgart, Germany, 2013. [Google Scholar]
  24. Ecoinvent Association. Ecoinvent Database. 2023. Available online: https://ecoinvent.org/the-ecoinvent-database/ (accessed on 2 October 2023).
  25. Frischknecht, R.; Stolz, P.; Krebs, L.; Wild-Scholten, M.; Sinha, P. Life Cycle Inventories and Life Cycle Assessments of Photovoltaic Systems; PVPS Task 12, Report; The International Energy Agency (IEA): Paris, France, 2020. [Google Scholar]
  26. Liponi, A.; Baccioli, A.; Ferrari, L.; Desideri, U. Techno-economic analysis of hydrogen production from PV. In Proceedings of the EFC21—European Fuel Cells and Hydrogen Piero Lunghi Conference, Online, 15–17 December 2021. [Google Scholar]
  27. Bareiß, K.; de la Rua, C.; Möckl, M.; Hamacher, T. Life Cycle Assessment of Hydrogen from Proton Exchange Membrane Water Electrolysis in Future Energy Systems. Appl. Energy 2019, 237, 862–872. [Google Scholar] [CrossRef]
  28. XRivera, C.S.; Topriska, E.; Kolokotroni, M.; Azapagic, A. Environmental sustainability of renewable hydrogen in comparison with conventional cooking fuels. J. Clean. Prod. 2018, 196, 863–879. [Google Scholar] [CrossRef]
  29. European Community. Photovoltaic Geographical Information System, 3. 1. 2022. Available online: https://re.jrc.ec.europa.eu/pvg_tools/en/ (accessed on 2 October 2023).
  30. Zorrilla-Casanova, J.; Piliougine, M.; Rubio, J.C.; Bernaola-Galvan, P.; Carpena, P.; Mora-López, L.; Sidrach-de-Cardona, M. Analysis of Dust Losses in Photovoltaic Modules. In Covariates of Fuel Saving Technologies in Urban Ethiopia; LiU Electronic Press: Linköping, Sweden, 2011. [Google Scholar]
  31. Wirth, H. Aktuelle Fakten zur Photovoltaik in Deutschland; Fraunhofer ISE: Freiburg im Breisgau, Germany, 2023. [Google Scholar]
  32. Reuß, M.; Grube, T.; Robinius, M.; Preuster, P.; Wasserscheid, P.; Stolten, D. Seasonal storage and alternative carriers: A flexible hydrogen supply. Appl. Energy 2017, 200, 290–302. [Google Scholar] [CrossRef]
  33. WaStrak NRW. Einsatz der Wasserstofftechnologie in der Abwasserbeseitigung—Phase 1, Band 1: Kompendium Wasserstoff. 2012. Available online: https://www.lanuv.nrw.de/fileadmin/forschung/wasser/klaeranlage_abwasser/WaStraK_Kurzbericht.pdf (accessed on 28 October 2021).
  34. Stolzenburg, K.; Mubbala, R. Integrated Design for Demonstration of Efficient Liquefaction of Hydrogen (IDEALHY). 2013. Available online: https://www.idealhy.eu/uploads/documents/IDEALHY_D3-16_Liquefaction_Report_web.pdf: (accessed on 7 October 2023).
  35. Patyk, A. Stoffstrom- und Kostendaten zu LNG, H2 und Synthetischem Rohöl, Arbeitspapier i.A. des Öko-Instituts im Rahmen des BMU-Geförderten Verbundvorhabens “Renewbility”, Heidelberger. 2008. Available online: https://www.probas.umweltbundesamt.de/php/web2pdf.php?id=%7B7A359E87-B14B-4881-992E-40B17855E7F6%7D (accessed on 7 October 2023).
  36. Aziz, M. Liquid Hydrogen: A Review on Liquefaction, Storage, Transportation, and Safety. Energies 2021, 14, 5917. [Google Scholar] [CrossRef]
  37. Agora Verkehrswende, Agora Energiewende und Fronier Economics, Die Zukünftigen Kosten Strombasierter Synthetischer Brennstoffe. 2018. Available online: https://www.agora-verkehrswende.de/fileadmin/Projekte/2017/Die_Kosten_synthetischer_Brenn-_und_Kraftstoffe_bis_2050/Agora_SynCost-Studie_WEB.pdf (accessed on 2 October 2023).
  38. Mazloomi, K.; Gomes, C. Hydrogen as an energy carrier: Prospects and challenges. Renew. Sustain. Energy 2012, 16, 3024–3033. [Google Scholar]
  39. Kawasaki Heavy Industries, Ltd. Develops Cargo Containment System for Large Liquefied Hydrogen Carrier with World’s Highest Carrying Capacity. 5. 2021. Available online: https://global.kawasaki.com/en/corp/newsroom/news/detail/?f=20210506_9983 (accessed on 7 October 2023).
  40. Smith, J.R.; Gkantonas, S.; Mastorakos, E. Modelling of Boil-Off and Sloshing Relevant to Future Liquid. Energies 2022, 15, 2046. [Google Scholar] [CrossRef]
  41. Wang, A.; Jens, J.; Mavins, D.; Moultak, M.; Schimmel, M.; van der Leun, K.; Peters, D.; Buseman, M. European Hydrogen Backbone—Analyzing Future Demand, Supply, and Transport of Hydrogen. June 2021. Available online: https://oge.net/_Resources/Persistent/2/c/f/9/2cf95bef7e617595ed1bdec9531acb69ef6b4c73/EHB_study_2021_June.pdf (accessed on 2 October 2023).
  42. Öko-Institut e. V. Die Wasserstoffstrategie 2.0 für Deutschland—Untersuchung für die Stiftung Klimaneutralität. 13 May 2021. Available online: https://www.oeko.de/fileadmin/oekodoc/Die-Wasserstoffstrategie-2-0-fuer-DE.pdf (accessed on 2 October 2023).
  43. Nowega, OGE, STORAG ETZEL, Uniper. Wilhelmshaven Kann Drehkreuz für Deutsche und Europäische Wasserstoffwirtschaft Werden. 7 July 2021. Available online: https://oge.net/de/pressemitteilungen/2021/wilhelmshaven-kann-drehkreuz-fur-deutsche-und-europaische-wasserstoffwirtschaft-werden (accessed on 10 March 2022).
  44. Sphera Solutions. GaBi Software and Database. 2022. Available online: https://sphera.com/wp-content/uploads/2022/02/GaBi-Databases-2022-Edition-Upgrades-and-Improvements.pdf (accessed on 7 October 2023).
  45. Kanz, O.; Brüggemann, F.; Ding, K.; Bittkau, K.; Rau, U.; Reinders, A. Life-cycle global warming impact of hydrogen transport through pipelines from Africa to Germany. Sustain. Energy Fuels 2023, 7, 3014–3024. [Google Scholar] [CrossRef]
  46. Legghe, E.; Joliff, Y.; Belec, L.; Aragon, E. Computational analysis of a three-layer pipeline coating: Internal stresses generated during the manufacturing process. Comput. Mater. Sci. 2010, 50, 1533–1542. [Google Scholar] [CrossRef]
  47. ESU-Services Ltd. Life Cycle Inventory of Natural Gas Supply. 2012. Available online: http://esu-services.ch/fileadmin/download/publicLCI/Schori_2012_NaturalGas.pdf (accessed on 2 October 2023).
  48. Siemens Energy. Hydrogen Infrastructure—The Pillar of Energy Transition. 2021. Available online: https://assets.siemens-energy.com/siemens/assets/api/uuid:3d4339dc-434e-4692-81a0-a55adbcaa92e/200915-whitepaper-h2-infrastructure-en.pdf (accessed on 2 October 2023).
  49. Neuman & Esser Verwaltungs- und Beteiligungsgesellschaft mbH, Neuman & Esser. 27 October 2022. Available online: https://www.neuman-esser.de/en/compressors/hydrogen-compressors/ (accessed on 2 October 2023).
  50. Icha, P.; Lauf, T.; Kuhs, G. Entwicklung der Spezifischen Treibhausgas-Emissionen des Deutschen Strommix in den Jahren 1990-2021, Umweltbundesbank. 2022. Available online: https://www.umweltbundesamt.de/sites/default/files/medien/1410/publikationen/2022-04-13_cc_15-2022_strommix_2022_fin_bf.pdf (accessed on 7 October 2023).
  51. Frazer-Nash Consultancy. Fugitive Hydrogen Emissions in a Future Hydrogen Economy. Crown. 2022. Available online: https://assets.publishing.service.gov.uk/media/624ec79cd3bf7f600d4055d1/fugitive-hydrogen-emissions-future-hydrogen-economy.pdf (accessed on 7 October 2023).
  52. Bodineau, L. Analyse de Cycle de Vie Relative à L’hydrogène, Sphera, Gingko. 2020. Available online: https://inis.iaea.org/search/searchsinglerecord.aspx?recordsFor=SingleRecord&RN=52048754 (accessed on 7 October 2023).
  53. Bauer, C.; Treyer, K.; Antonini, C.; Bergerson, J.; Gazzani, M.; Gencer, E.; Gibbins, J.; Mazzotti, M.; McCoy, S.T.; McKenna, R. On the climate impacts of blue hydrogen production. Sustain. Energy Fuels 2022, 6, 66–75. [Google Scholar] [CrossRef]
  54. Umweltbundesamt. Ökobilanzrechner für Photovoltaikanlagen. 2021. Available online: https://public.tableau.com/app/profile/umweltbundesamt/viz/OekobilanzrechnerfuerPhotovoltaikanlagen/PVScreeningTool (accessed on 2 October 2023).
  55. Kuang, Y.; Kenney, M.J.; Meng, Y.; Hung, W.-H.; Liu, Y.; Huang, J.E.; Prasanna, R.; Li, P.; Li, Y.; Wang, L.; et al. Solar-driven, highly sustained splitting of seawater into hydrogen and oxygen fuels. Proc. Natl. Acad. Sci. USA 2019, 116, 6624–6629. [Google Scholar] [CrossRef] [PubMed]
Figure 1. Overview of the research approach of the study.
Hydrogen 04 00048 g001
Figure 2. The framework of a life cycle assessment.
Hydrogen 04 00048 g002
Figure 3. System boundary of the life cycle assessment. Icons copyright ©2023 Freepik Company S.L. [23].
Hydrogen 04 00048 g003
Figure 4. The boil-off rates during the transportation of liquid hydrogen from Africa to Germany. The boil-off rates are dependent on the distance and the supply chain step. The functional unit of 1 kg of hydrogen supplied to Germany is considered.
Hydrogen 04 00048 g004
Figure 5. Results of hydrogen production global warming potential excl. transportation of hydrogen. Min/max values depend on the electrolyzer efficiency and locations of production.
Hydrogen 04 00048 g005
Figure 6. Global warming potential contributions of the substages of different supply chains of hydrogen.
Hydrogen 04 00048 g006
Figure 7. Global warming potential of different supply chains of hydrogen. Liquid hydrogen export from Africa powered by photovoltaic electricity.
Hydrogen 04 00048 g007
Figure 8. Global warming potential of different supply chains of hydrogen. Liquid hydrogen export from Africa compared to German domestic production powered by photovoltaic electricity or grid.
Hydrogen 04 00048 g008
Figure 9. Impact of the input parameters on the overall global warming potential of hydrogen. Results shown in [%] difference to the reference scenario illuminated earlier.
Hydrogen 04 00048 g009
Table 1. Overview of different LCA results on renewable hydrogen production.
GWP ResultsKey ParameterReference
1.3–3.9 kgCO2-eq/kgH2H2 (PV, excl. transportation)[10]
3.8–4.0 kgCO2-eq/kgH2LH2 (PV, incl. transportation from Chili and Morocco to Germany)[11]
6.5 kgCO2-eq/kgH2LH2 (wind and PV, incl. transportation from Australia to Japan)[12]
2.2 kgCO2-eq/kgH2LH2 (PV, incl. 20,000 nmi shipping)[13]
2.3 kgCO2-eq/kgH2LH2 (wind and PV, excl. transportation)[14]
1.2 kgCO2-eq/kgH2H2 from Africa (concentrating solar power, excl. transport)[15]
3.1 kgCO2-eq/kgH2LH2 (PV, excl. transportation)[16]
5.6 kgCO2-eq/kgH2LH2 (incl. transportation from Algeria (PV) and Canada (hydro) to Germany)[17]
2.3 kgCO2-eq/kgH2LH2 from Morocco (PV, excl. transportation)[18]
Table 2. Overview of the PV input and output parameters [29].
MoroccoSenegalNigeriaGermany
Annual irradiation [kWh/m2]2575234422271399
Annual PV energy production [kWh]1954169816191113
Total loss (incl. angle, spectral effects, temperature and low irradiance [%]−25.4−26.67−27.29−20.45
Average GWP [kgCO2-eq/kWh]0.0320.0370.0390.057
Table 3. Input parameters of truck transportation [21,32].
VolumeValue
Transportation distance300km
Average truck velocity50km/h
Lifetime truck15a
Diesel demand35l/100 km
Compression electricity demand1.9kWh/kg
Pressure H2500bar
Capacity1000kg
Efficiency losses0.5% per day
Table 4. Input parameters of the liquefaction plant [35].
Liquefaction PlantVolumeValue
Capacity50t/d
Operation load factor100%
Full load hours7000h/a
Lifetime25a
Electricity demand7kWh/kg
Loss liquefaction0.5%
Loss storage0.1%/d
Table 5. Overview of different inputs of liquid hydrogen shipping [38,44].
Ship TransportVolumeValue
Annual distance80,000km/a
Lifetime16a
Fuel consumption (tkm)92.64l/1000 km
Hydrogen cargo (gross)100,000
Losses0.2%/d
Distance (one way)2576km (Morocco)
4785km (Senegal)
7693km (Nigeria)
Table 6. Input parameters of the pipeline distribution [45].
Pipeline TransportVolumeValue
Distance300km
Lifetime (repurposed—new)30–50a
Energy consumption (grid)0.1kWh/kgH2
Distance between compressors100km
Losses per 1000 km0.5%
Inlet pressure70bar
Outlet pressure100bar
Annual capacity69TWh/a (208d operation)
115TWh/a (350d operation)
Disclaimer/Publisher’s Note: The statements, opinions and data contained in all publications are solely those of the individual author(s) and contributor(s) and not of MDPI and/or the editor(s). MDPI and/or the editor(s) disclaim responsibility for any injury to people or property resulting from any ideas, methods, instructions or products referred to in the content.

