Article

Techno-Economic Analysis of Solar Thermal Hydrogen Production in the United Arab Emirates

Graduate School of Science and Technology, University of Tsukuba, Tsukuba 3058573, Japan
*
Author to whom correspondence should be addressed.
Hydrogen 2022, 3(4), 389-401; https://doi.org/10.3390/hydrogen3040024
Submission received: 31 August 2022 / Revised: 28 September 2022 / Accepted: 3 October 2022 / Published: 10 October 2022
(This article belongs to the Special Issue Feature Papers in Hydrogen)

Abstract

:
Solar thermal technology can provide the United Arab Emirates and the Middle East region with abundant clean electricity to mitigate the rising levels of carbon dioxide and satisfy future demand. Hydrogen can play a key role in the large-scale application of solar thermal technologies, such as concentrated solar plants, in the region by storing the surplus electricity and exporting it to needed countries for profit, placing the Middle East and the United Arab Emirates as major future green hydrogen suppliers. However, a hydrogen supply chain comparison between hydrogen from CSP and other renewable under the UAE’s technical and economic conditions for hydrogen export is yet to be fully considered. Therefore, in this study we provide a techno-economic analysis for well-to-ship solar hydrogen supply chain that compares CSP and PV technologies with a solid oxide water electrolyzer for hydrogen production, assuming four different hydrogen delivery pathways based on the location of electrolyzer and source of electricity, assuming the SOEC can be coupled to the CSP plant when placed at the same site or provided with electric heaters when placed at PV plant site or port sites. The results show that the PV plant achieves a lower levelized cost of electricity than that of the CSP plant with 5.08 ¢/kWh and 8.6 ¢/kWh, respectively. Hydrogen production results show that the scenario where SOEC is coupled to the CSP plant is the most competitive scenario as it achieves the payback period in the shortest period compared to the other scenarios, and also provides higher revenues and a cheaper LCOH of 7.85 $/kgH2.

Graphical Abstract

1. Introduction

The Middle East region and the United Arab Emirates (UAE) are increasing their efforts to find new and clean sources of energy to satisfy the new levels of demand and reduce their growing carbon footprint [1,2], making renewable energy technologies a real option to shape the future of the region’s energy market.
The climatic properties of the region, from excess sunlight to the wide empty areas of deserts [3], suggest that the region can be a perfect match for solar technologies [1,2,4,5,6,7,8], In the case of the UAE, currently a few projects such as concentrated solar power (CSP) and photovoltaics (PV), are already completed or still in the making, but fulfilling the full solar potential of the country seems like a far-away goal. The IRENA has reported in 2018 that renewable energies make only 2% of the UAE’s energy mix [7], as large-scale renewable energy projects are yet to prove themselves more profitable compared to the current fossil fuel projects.
By guaranteeing long term sustainability, hydrogen presents itself as a main factor in the future of renewables and the tireless efforts of global decarbonization [9,10,11,12], as it has the ability to store excess energy from renewable sources such as solar energy, and the energy conversion system can achieve zero emissions when solar energy is used as a source for electrolyzing the water [13]. Global hydrogen integration plans lead to the rise of demand levels, especially for the mobility sector [14]. Japan has already announced brave future hydrogen targets [15], but as domestic supply of hydrogen fails to meet its targets in CO2 emissions reduction, Japan has turned to importing zero-carbon produced H2 from overseas [16,17,18]. In its aim to realize a hydrogen-based society, a plan to establish an international hydrogen supply chain is already in the making [19], where a few deals have already been agreed upon with many countries, such as the United Arab Emirates for hydrogen imports as the Middle East region aims to play a major role in the low carbon hydrogen market in the near future [20]. Exporting green hydrogen produced from surplus solar energy can provide the economic incentive to sway the decision makers in the Middle East region to exploit the full solar potential of the region.
One of the leading solar hydrogen production technologies is concentrated solar plants [21]. Where most renewables’ output capacity heavily depends on weather conditions [22,23], one of the advantages of CSP is its capability to store energy in the form of heat through the use of thermal heat storages (TES), which means CSP can still provide stable electricity levels long after day hours preventing the intermittent functioning of water electrolyzers and stabilizing the hydrogen production process [21]. Furthermore, TES coupled CSP can provide more flexibility to H2 generation plants, making it easier to respond to fluctuating demand and diminishing the need for hydrogen storage, especially for the export of hydrogen.
Although a few studies have addressed solar hydrogen potential in the UAE, such as Kazim et al. and Orhan et al. [24,25], a gap is still present in the literature for a full technological and economical well-to-ship hydrogen production study that compares thermal solar hydrogen to other solar technologies, namely PV, while addressing the properties and climate conditions of the UAE. As our previous work investigates the technical potential of hydrogen from solar technologies and the infrastructure of the UAE [26], continuing with our study, in this paper we aim to provide a full techno-economic analysis for solar hydrogen in the case of the UAE, by comparing hydrogen production from solar thermal concentrates solar plants and from photovoltaics in two different sites for the purpose of hydrogen export, to highlight the technology that provides the most feasible hydrogen and accommodates the properties of the UAE.

2. Materials and Methods

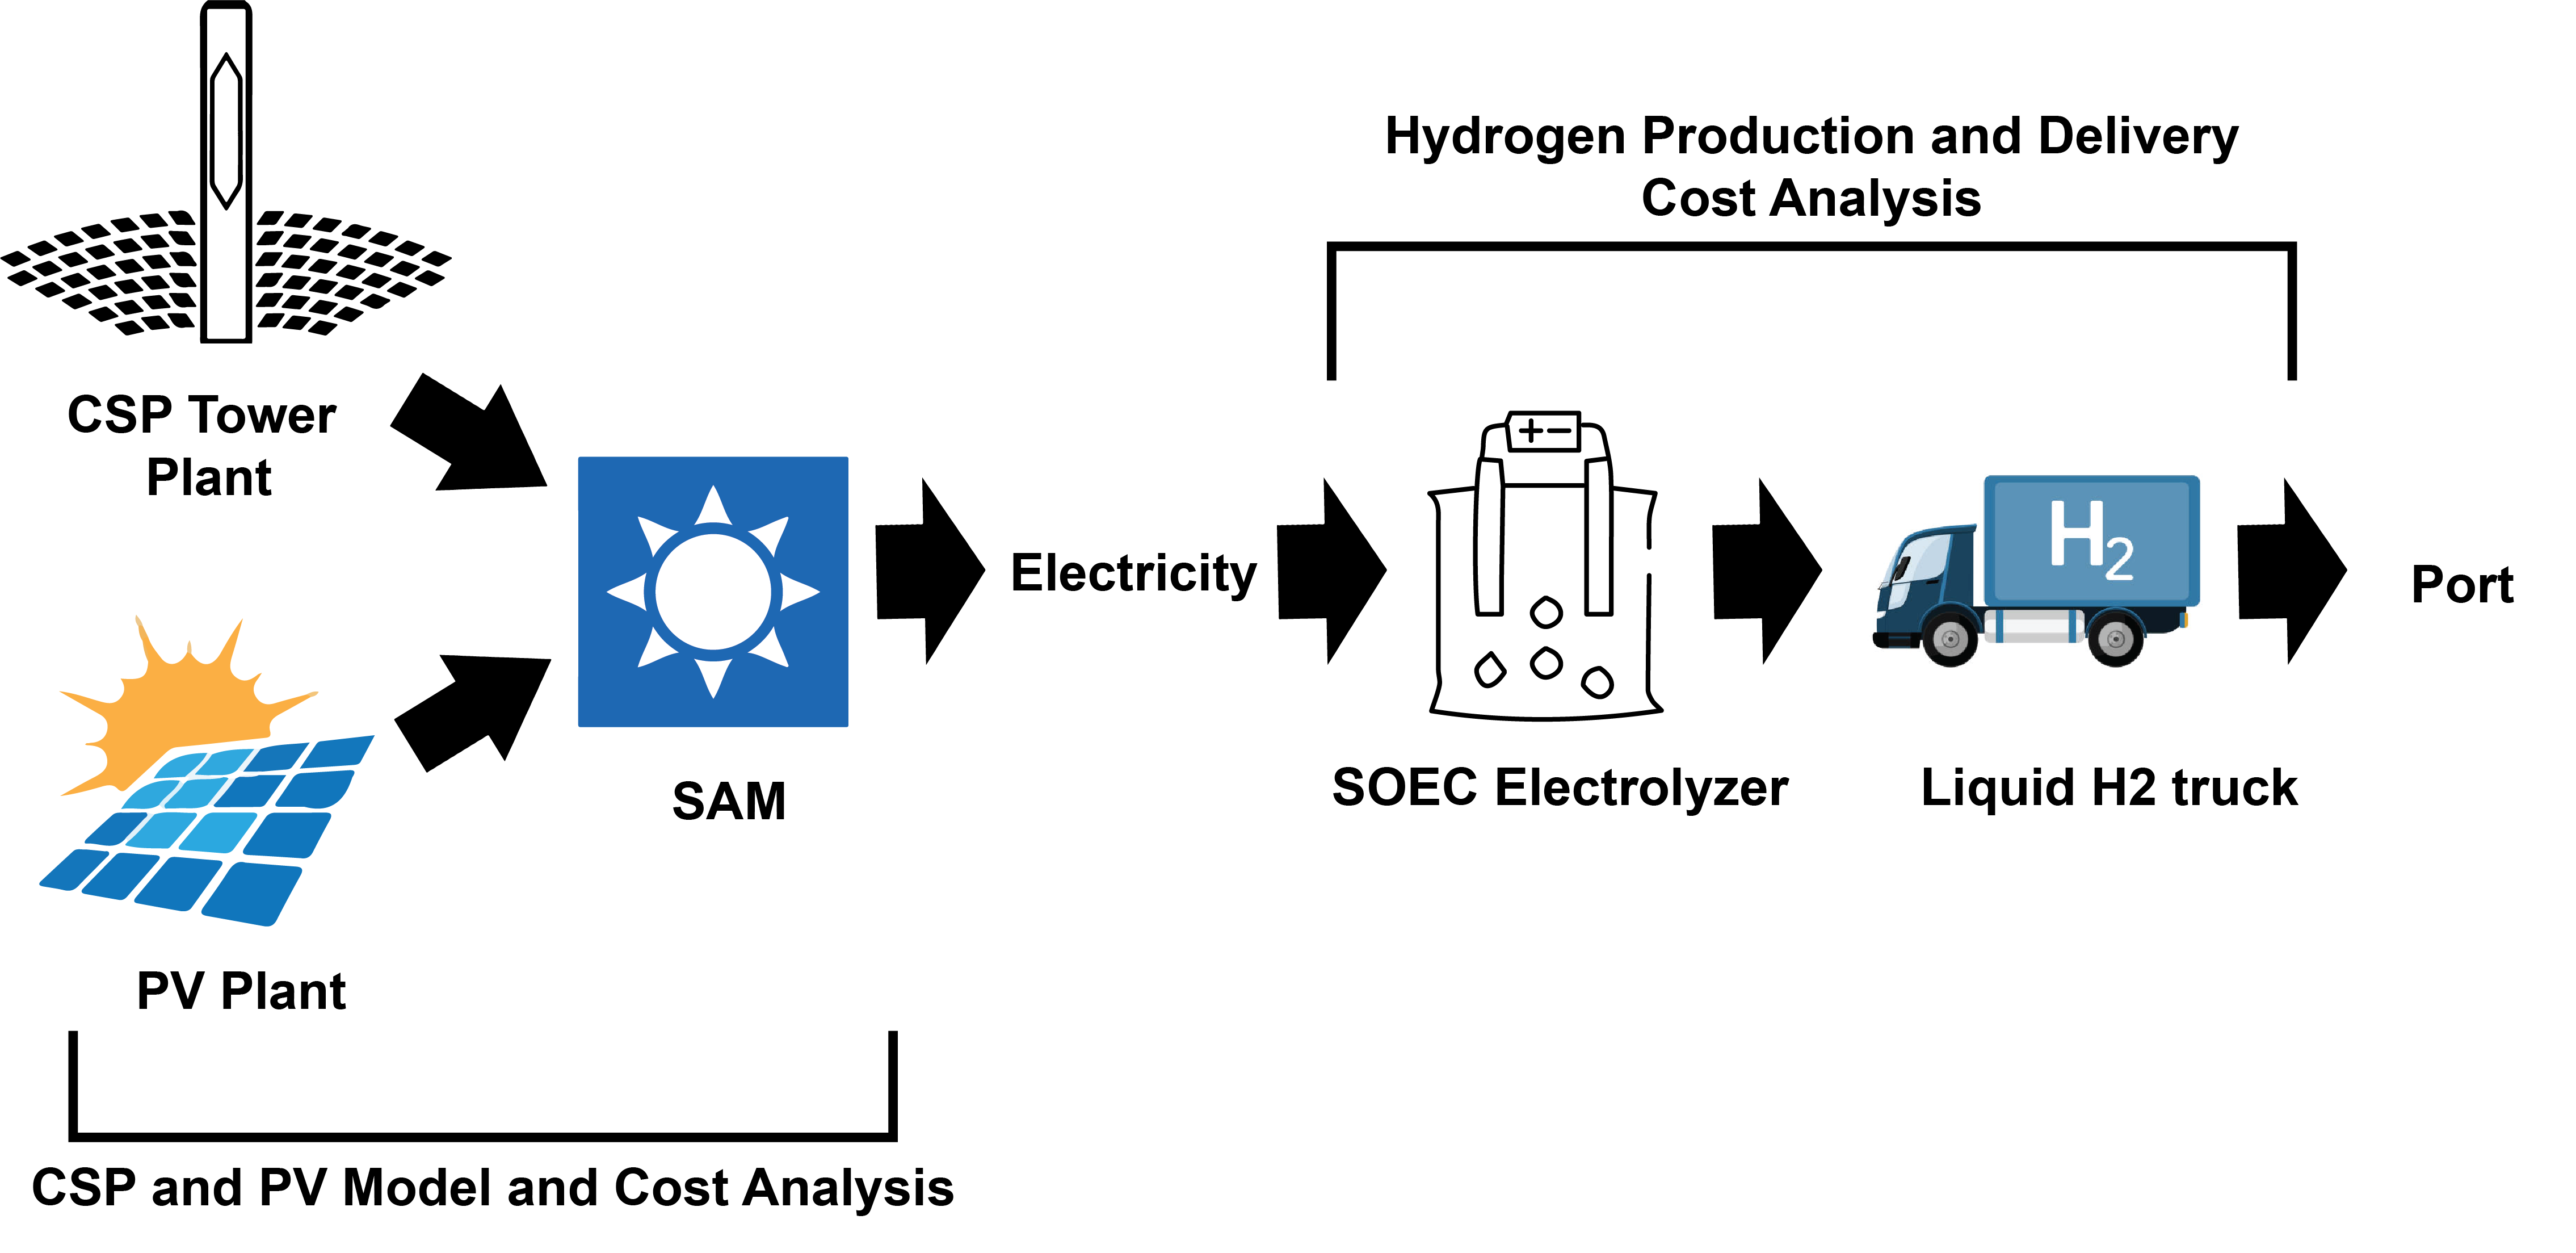
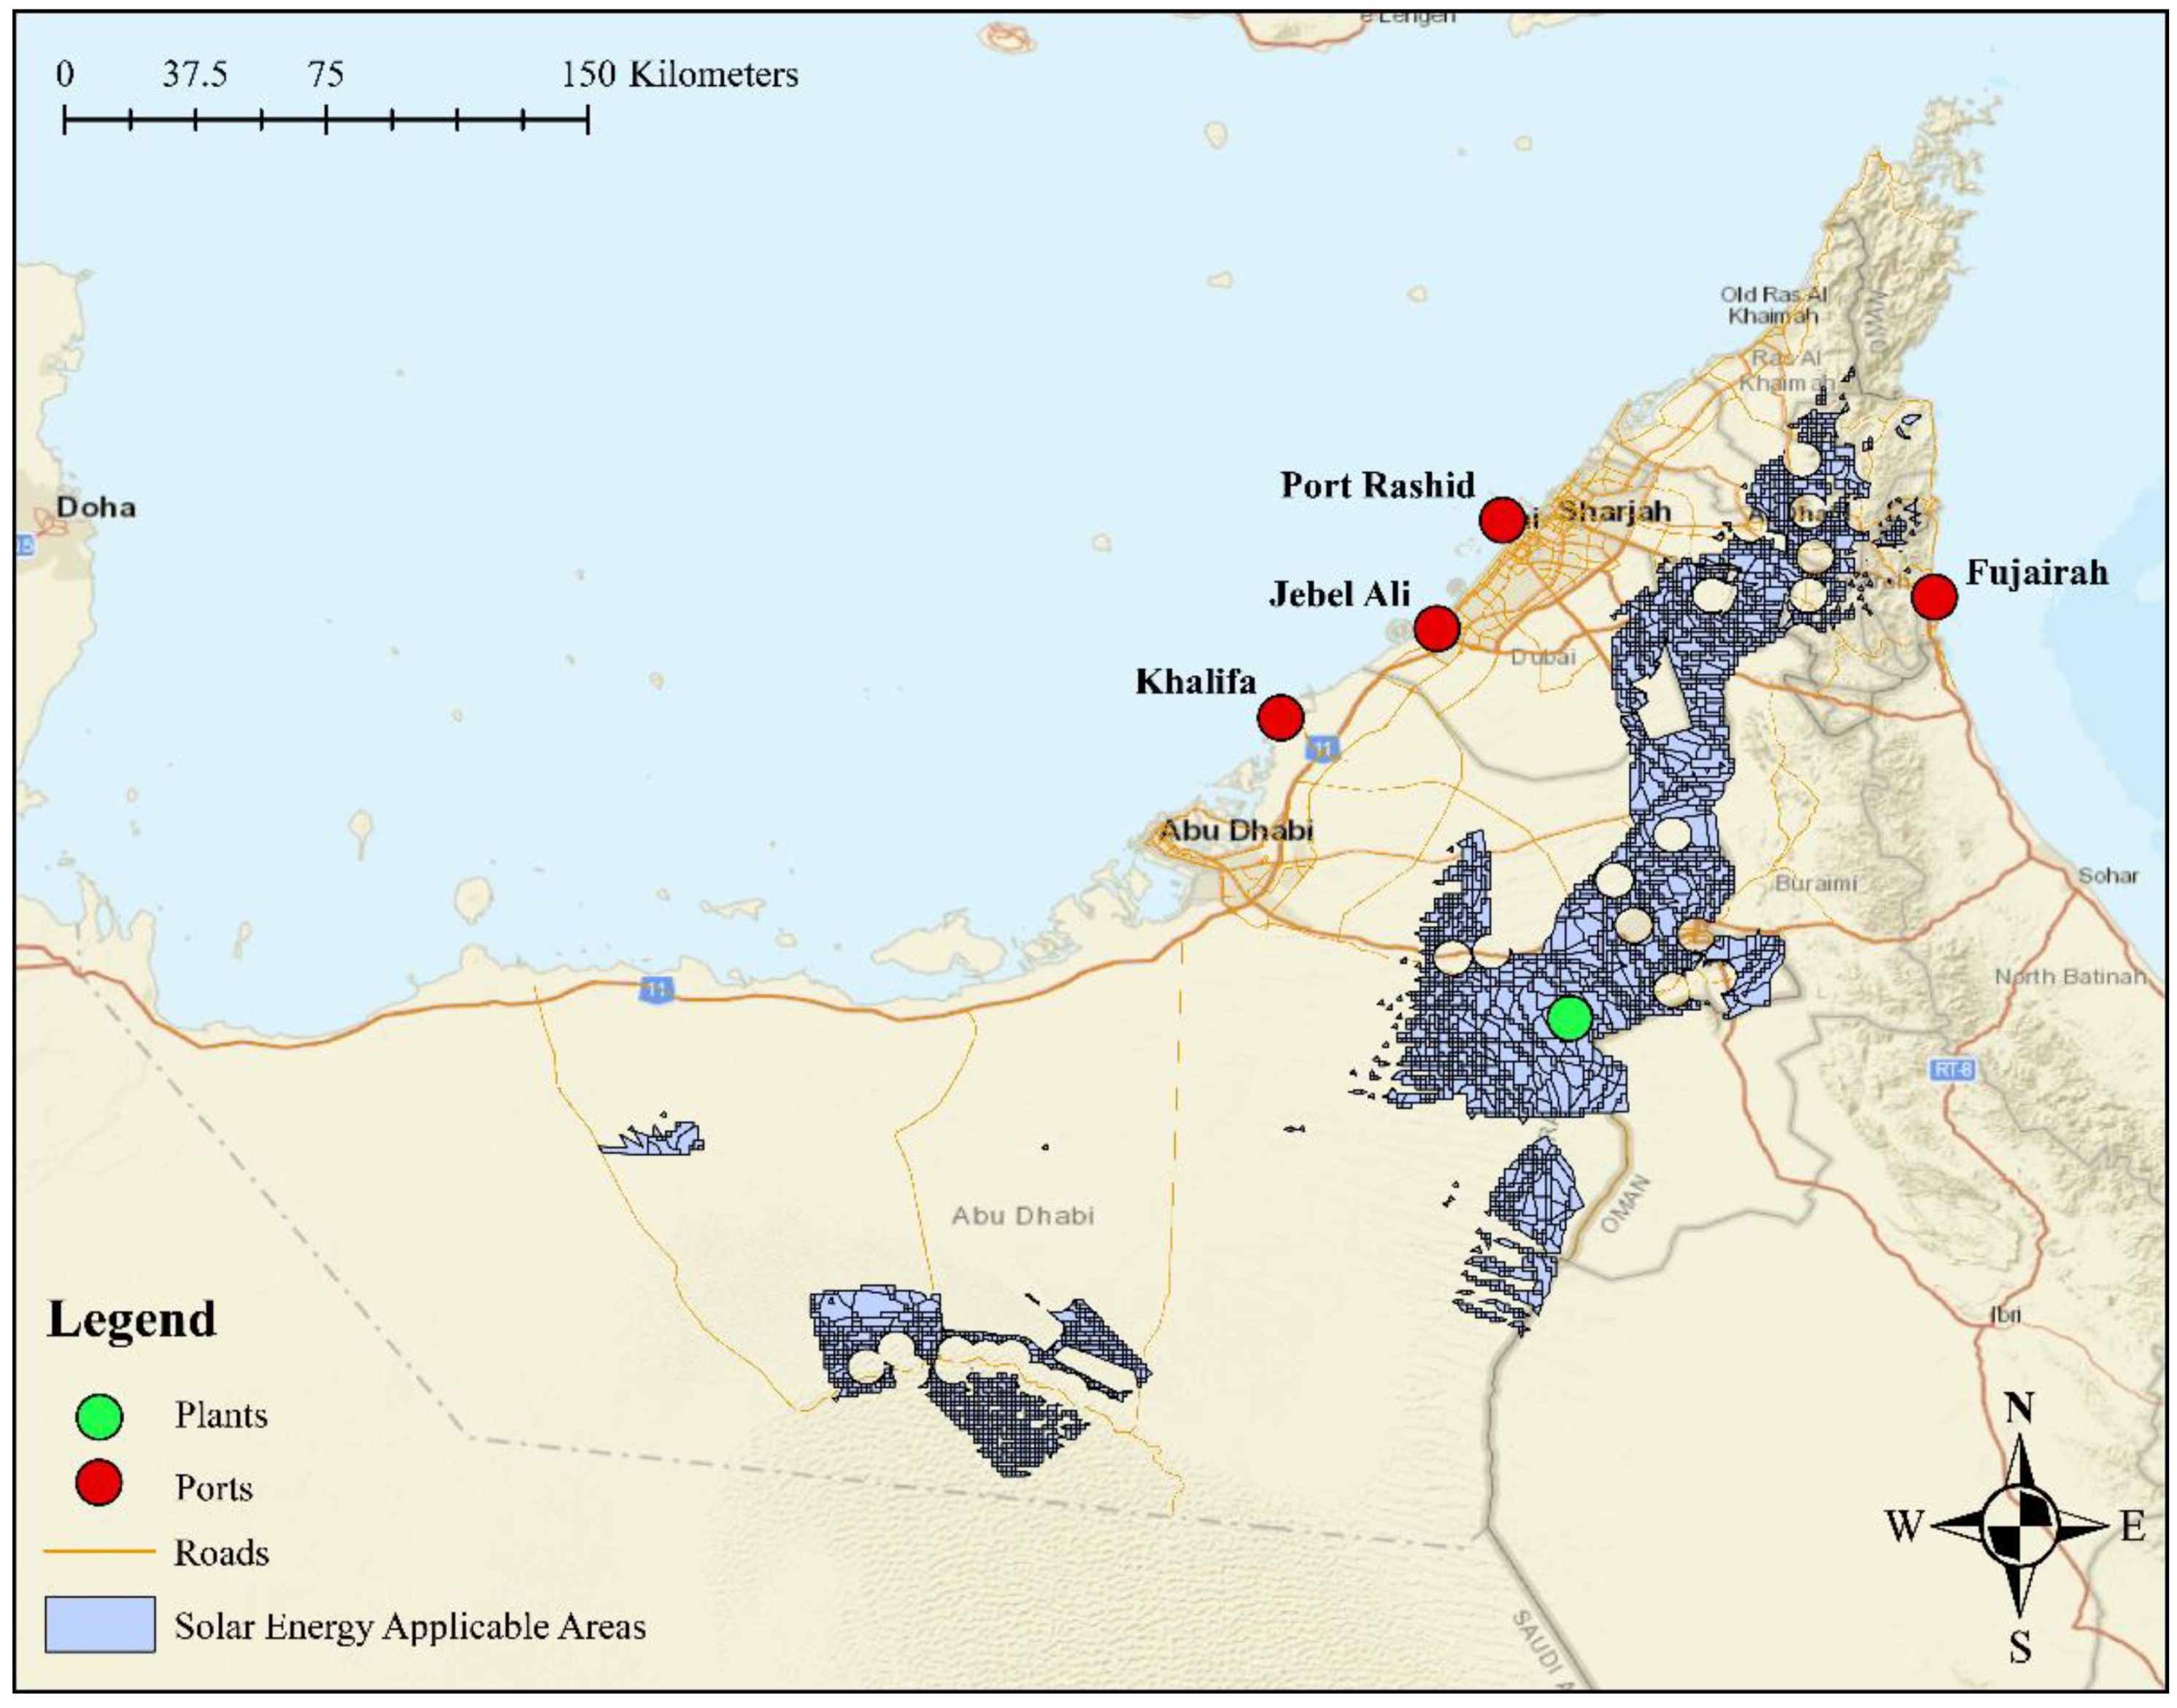
This study proposes a well-to-ship hydrogen from solar production model that aims to compare two different solar technologies from technical and financial aspects in the case of the United Arab Emirates in two different hydrogen delivery scenarios, to help provide an adequate discussion about which technology is more favorable in a zero-emission energy and hydrogen future of the Middle East region. PV and CSP solar plants are modeled at a chosen location in the UAE, following the results of our previous study shown in Figure 1 [26], where solar irradiance and slope conditions are satisfactory following NREL’s model [
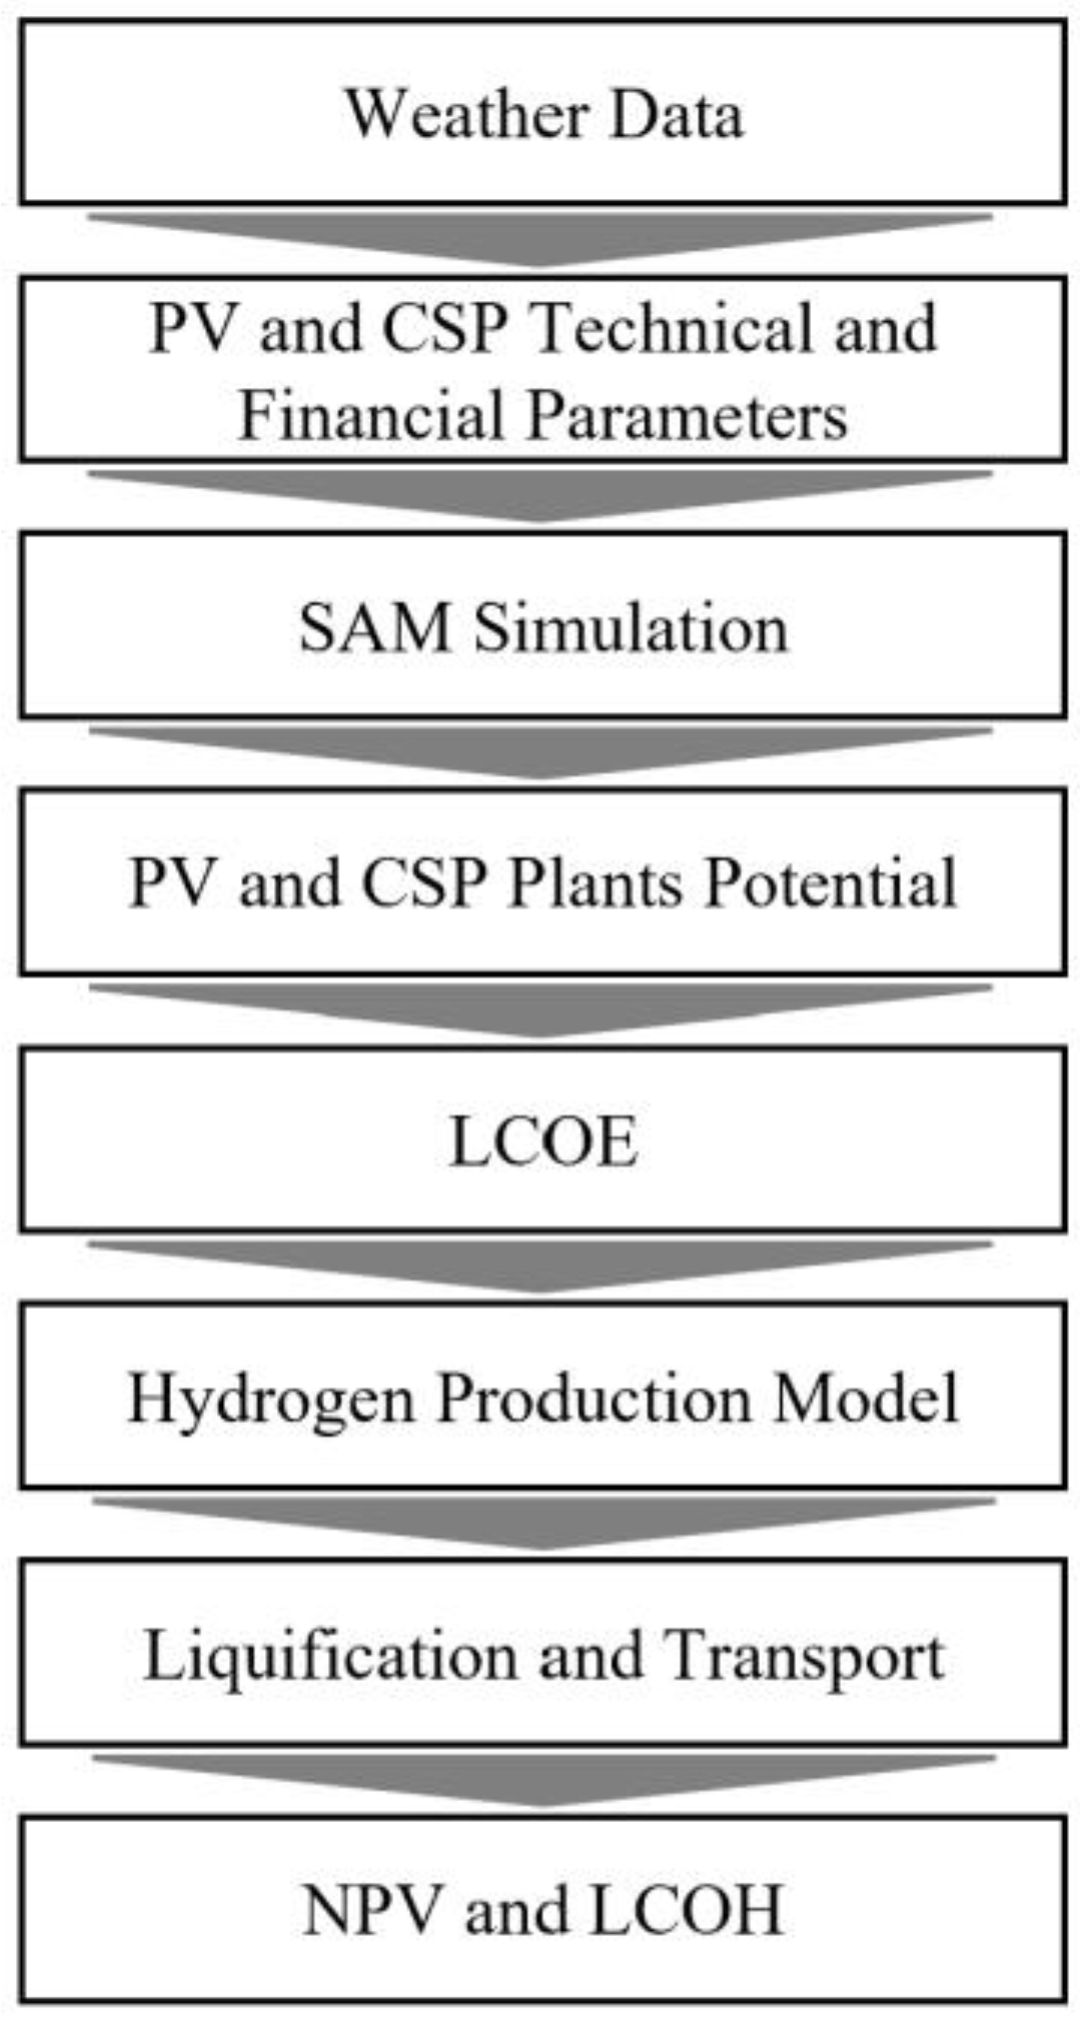
27], with a distance of 25 km from main roads and electrical transmission lines, and does not intersect with populated, or preserved areas. Taking into consideration the properties of the UAE, technical and financial parameters are set to simulate the technical and financial performances of the PV and CSP plants using NREL’s simulation advisor model (SAM) after adding the weather data of the specified plant location. The electricity produced by each plant is then used to power the SOEC water electrolyzer for hydrogen production. Technical and financial parameters for the hydrogen plant are incorporated to fit SOEC’s technology characteristics and the UAE’s financial index to provide the net present value for each project (NPV) and the levelized cost of hydrogen (LCOH). The steps of this study are shown with a flowchart in Figure 2.
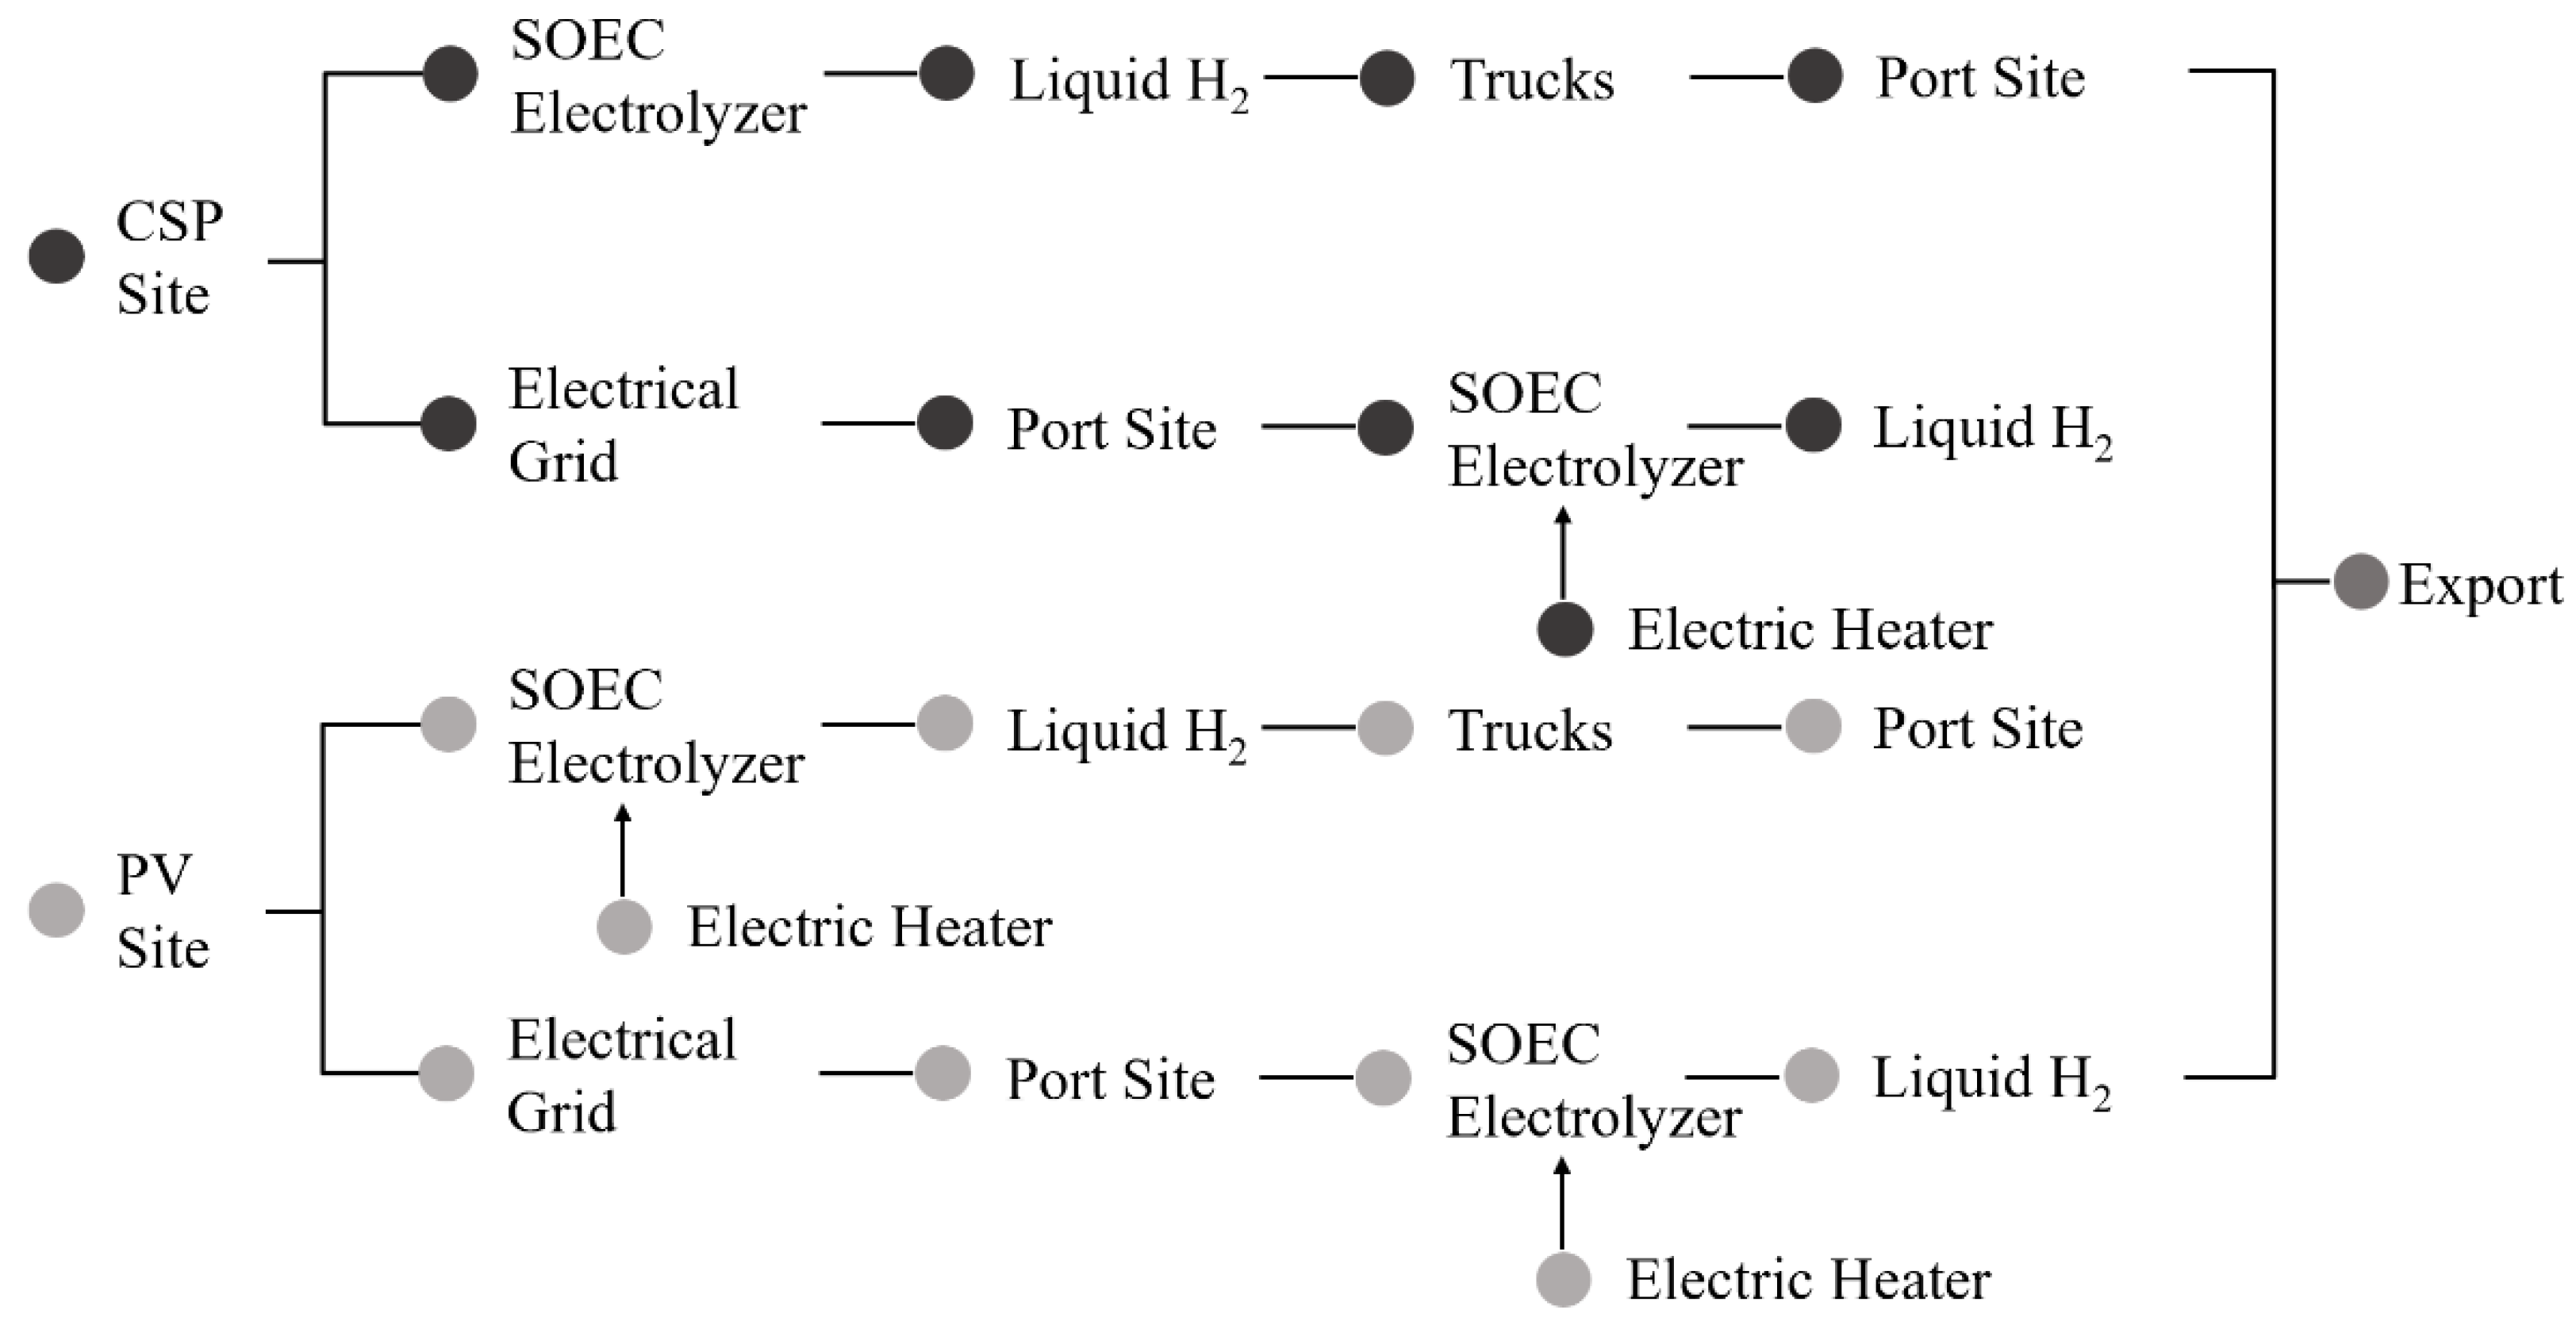
Two different hydrogen supply chains are assumed in this study; in the first one the electrolyzer is located at the same site as the solar plant with the CSP plant being coupled to it, and for the PV plant, extra electric water heaters are used to heat the water feeding the high heat temperature electrolyzer. The produced hydrogen in the first scenario is then liquified before it is transported by liquid hydrogen trailers to port sites for export. In the second scenario, the SOEC electrolyzers are located at port sites to reduce transportation fees, assuming the electricity from the PV and CSP plants are transmitted to the hydrogen plant’s location using UAE’s current electricity grid. In this scenario, electric water heaters are used in both solar plants’ cases. Hydrogen supply chain scenarios are thoroughly explained in Figure 3.

2.1. CSP and PV Plants Modelling

Version 2021.12.2 of the SAM optimization tool, developed by the U.S. Department of Energy’s National Renewable Energy Laboratory (NREL) [28], is used to carry the simulation for the performance and financial metrics of CSP and PV plants.
A solar tower system is chosen for our CSP plant with molten salt as heat fluid and solar multiple of 2.4 coupled with a 10 h thermal storage, following NREL’s model [29]. For the photovoltaic plant, NREL’s economic analysis case study with battery energy storage model is adapted [30], SunPower SPR-210-BLK-U modules with SMA America: STP24000TL-US-10 480V inverters were selected as per the mentioned case study. Financial modeling for both plants is done under Power Purchase Agreement (PPA) models with Single Ownership. Furthermore, a 6% real discount rate is chosen for this study, befitting the UAE’s financial model [31,32] with an income tax rate of 9% [33]. Detailed technical and financial parameters used for the simulation of CSP and PV plants using SAM software are mentioned in Table 1 and Table 2.
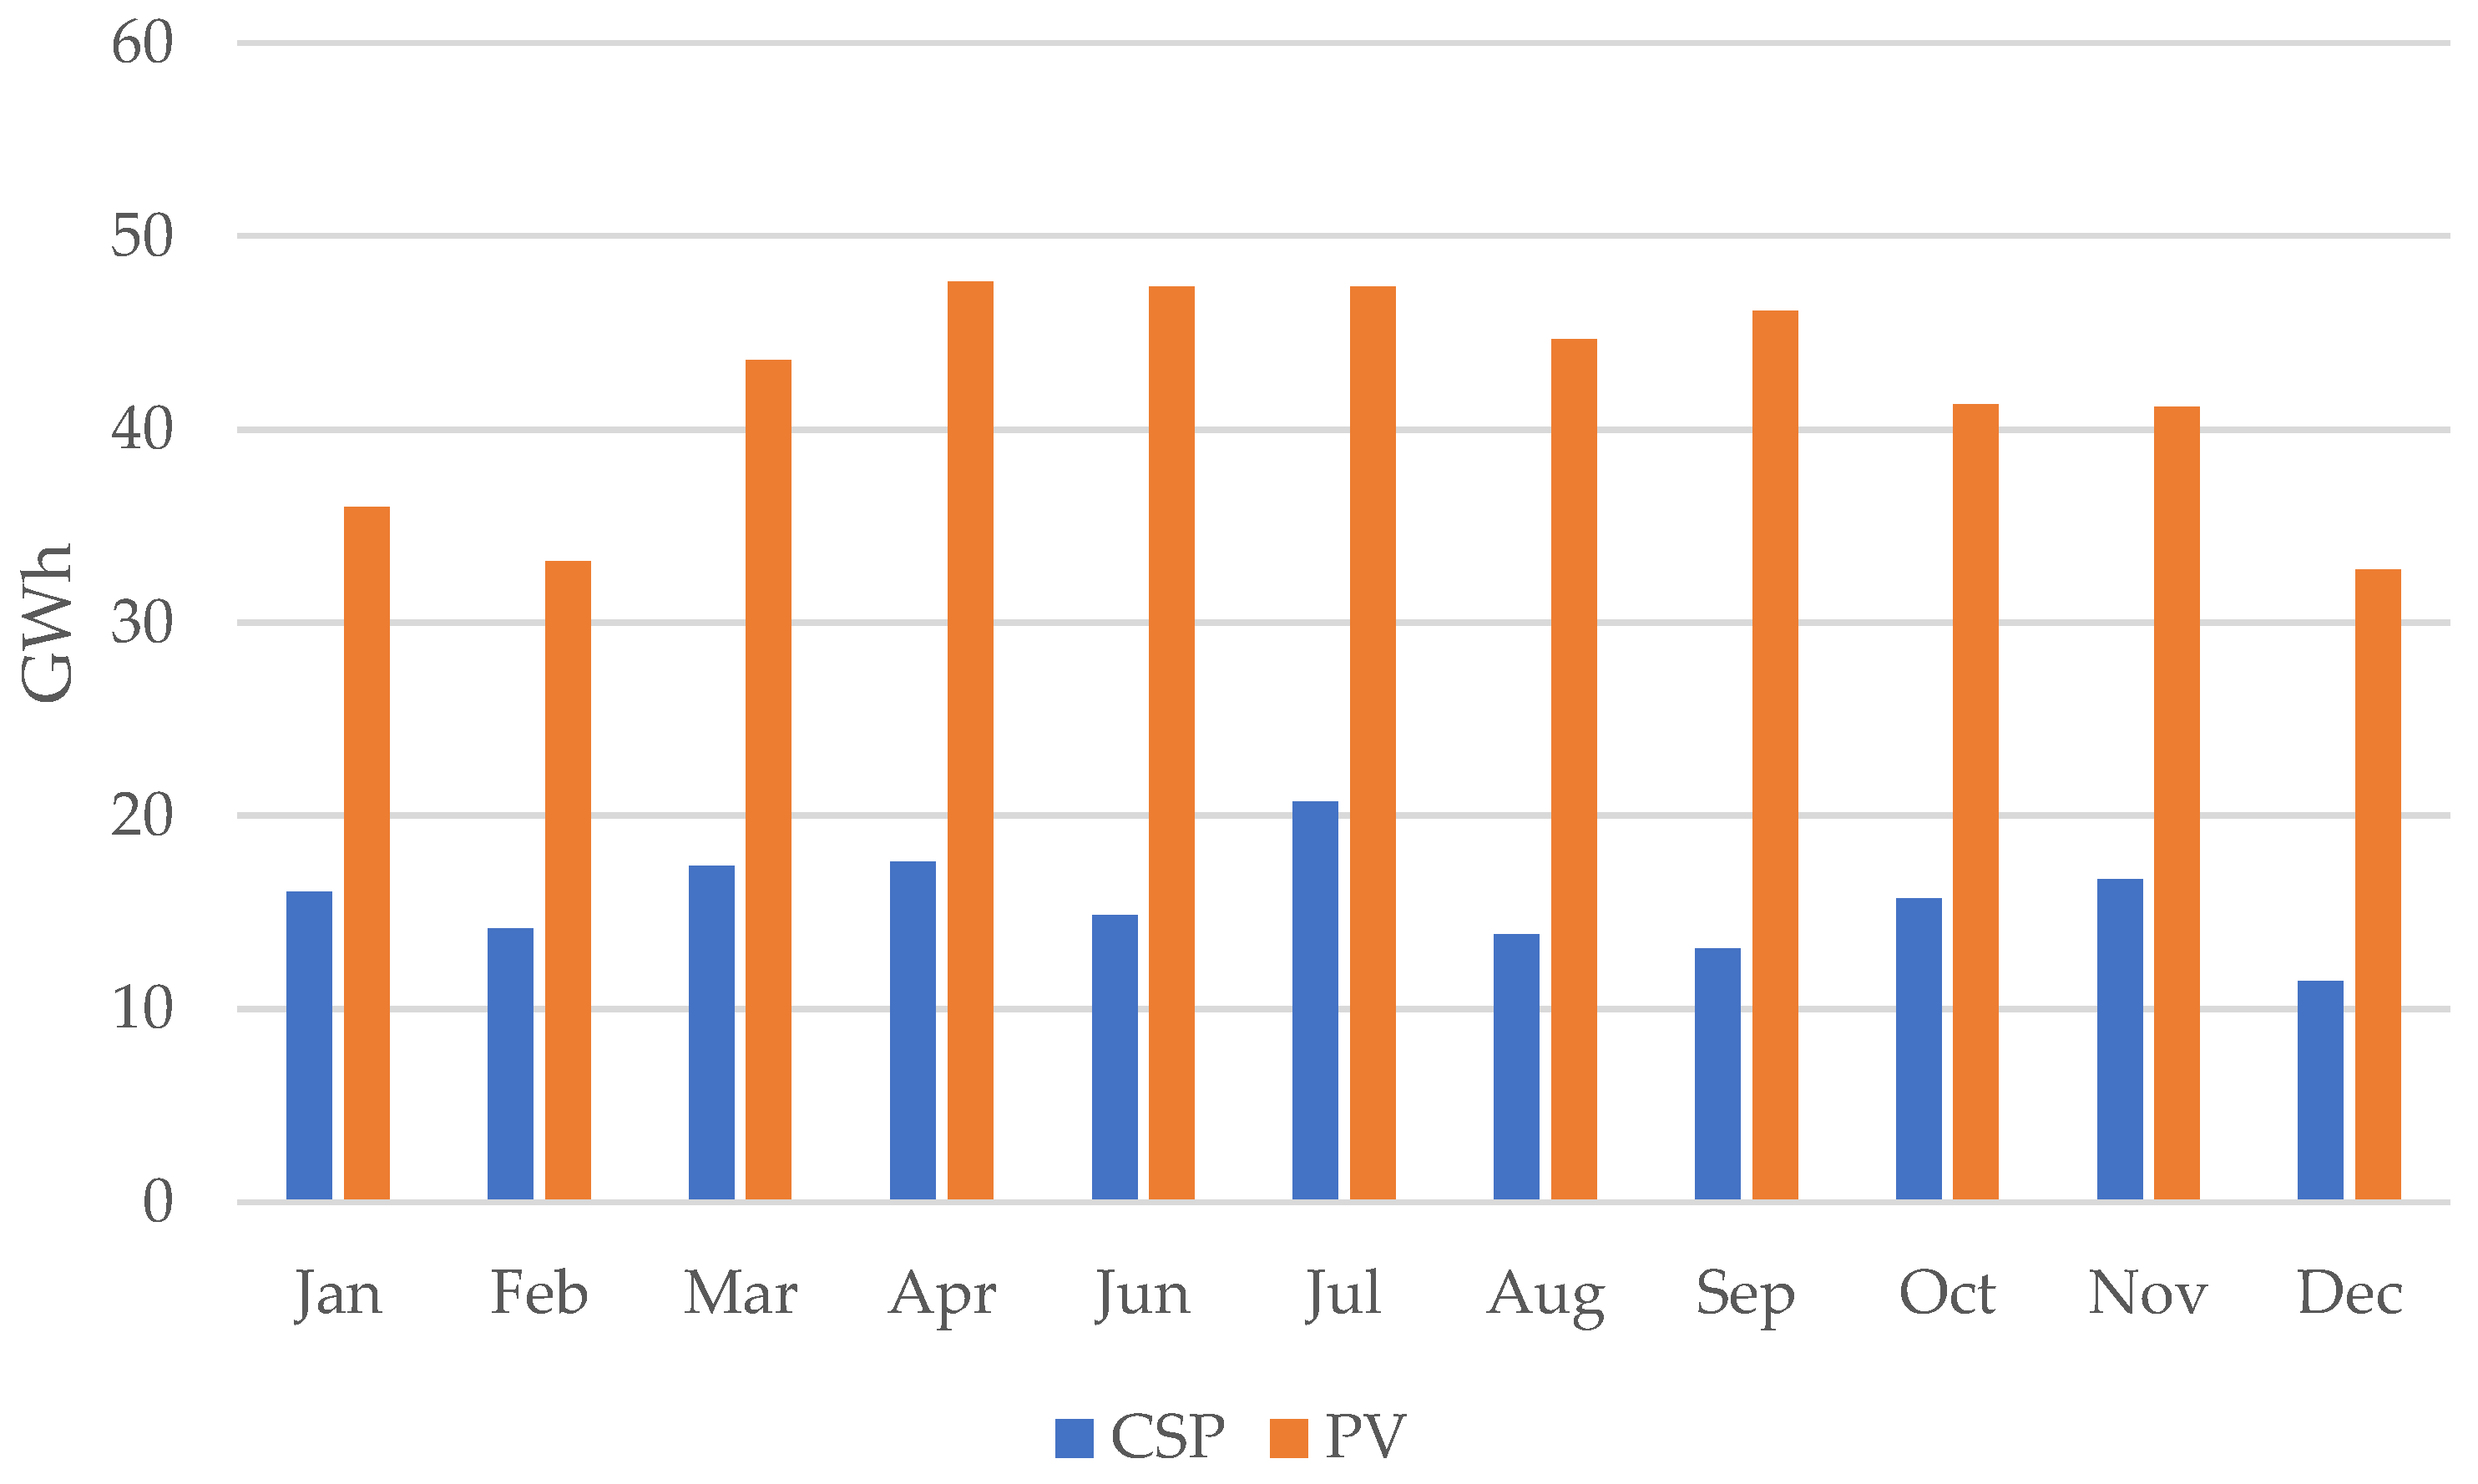
SAM uses Typical Metrological Year (TMY) data to access the hourly Direct Normal Irradiation (DNI) and Global Horizontal Irradiation (GHI) needed to estimate the technical performance of a specified site. TMY data adapted from the PV-GIS database [34] is used for the chosen location of the plants that is shown in Figure 1, and then added to SAM’s weather library to estimate the annual average DNI and GHI before incorporating the assumed technical and financial parameters and going through the simulation.

2.2. H2 Production and Cost Model

Four scenarios of hydrogen production are considered in this study, the first with CSP coupled to the SOEC electrolyzer at the same solar plant site (CSP Solar Plant Site), the second with electricity generated by the same CSP plant but with the SOEC electrolyzer with electric heaters placed at the port site (CSP Port Site), the third is with the H2 plant at the same place as the PV solar plant using electric heaters (PV Solar Plant Site), and finally placing the SOEC electrolyzer again at the port site and providing it with an electric heater and electricity from the PV plant (PV Port Site).
Hydrogen plants in all scenarios are assumed as a class of 1 MWel. Table 3 shows the SOEC electrolyzer efficiency and operation point derived from Jang et al. study [36] which is used to calculate the hydrogen production potential in each scenario.
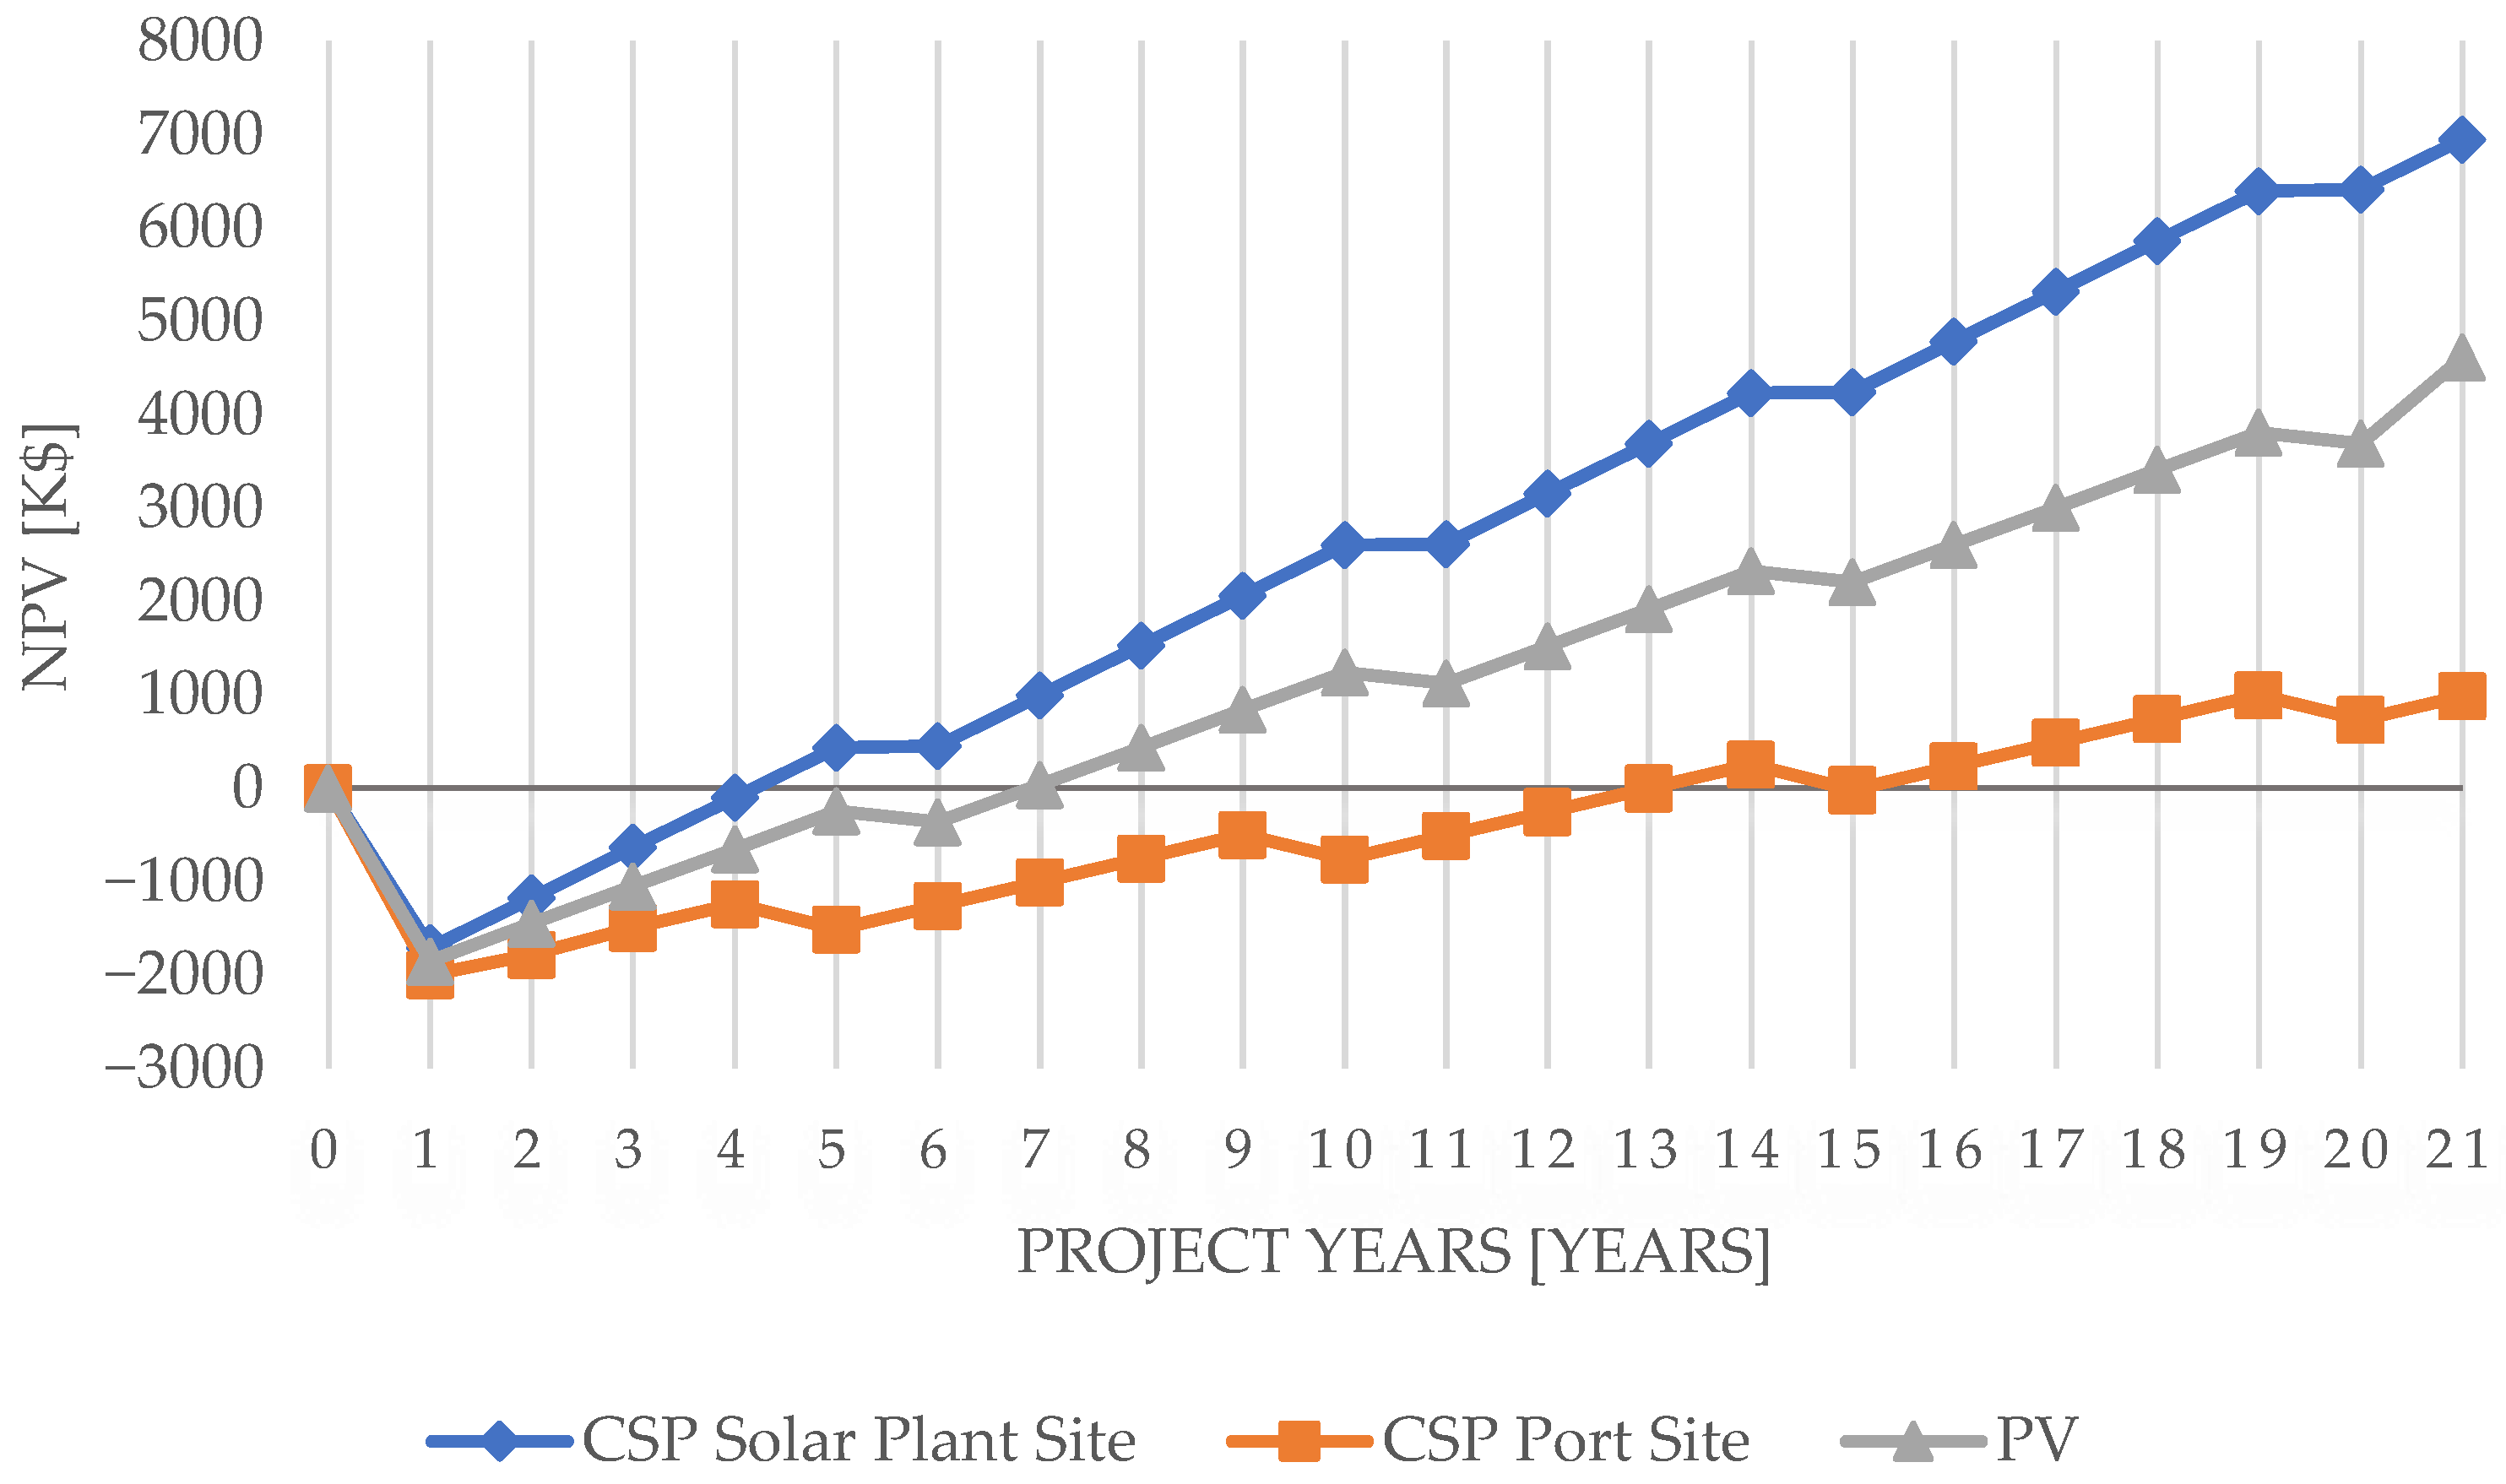
In this study we adopt the method and equations of Nicita et al. [37] and Jang et al. [36] to calculate the hydrogen production cost. This method uses cash flow of the project to calculate the net present value (NPV) and the levelized cost of hydrogen (LCOH). The NPV measures the feasibility of projects by estimating the project’s final value over plant life at the present point in time [36]. The NPV is calculated by dividing the expected future cash flows from the plant operating by the discount rate and then summing them all, and it is presented as follows [36]:
N P V = n = 0 N C F n ( 1 + r ) n = n = 1 N C F n ( 1 + r ) n I 0
N represents the term of the project in years, C F n is the net cash flow at year n , r is the discount rate which is needed to estimate the change in cash value, assumed at 6% for UAE’s case [31,32], and I 0 is the capital expenditure (CAPEX).
Equation (1) can be described as follows to help calculate the cash flow [36]:
N P V = C A P E X + ( 1 T R ) n = 1 N R E V n O P E X n ( 1 + r ) n
where project revenues are R E V n , O P E X n is the operating expenditure, from labor to maintenance and electricity fees, and T R is the income tax rate. Equation (2) can be further explained as follows [36]:
N P V = C A P E X n = 1 N O P E X n ( 1 + r ) n T R n = 1 N R E V n ( 1 + r ) n + n = 1 N R E V n ( 1 + r ) n + T R n = 1 N O P E X n ( 1 + r ) n
Again, the R E V n terms of Equation (4) can be further specified as follows [36]:
n = 1 N R E V n ( 1 + r ) n = n = 1 N R E V H n + k R E V O n ( 1 + r ) n = n = 1 N M H 2 ( 1 S R D ) n ( 1 + r ) n P H 2 + k n = 1 N 8 M H 2 ( 1 S R D ) n ( 1 + r ) n P O 2
where R E V H n is the revenue from the hydrogen sales, R E V O n is oxygen sales revenues, M H 2 is the annual mass hydrogen production, S R D is the system’s rate of degradation which represents the deterioration in efficiency for hydrogen production over time, P H 2 and P O 2 are the selling price of hydrogen and oxygen, respectively, and k is a factor of 0 or 1 that indicates whether oxygen is sold or not. As hydrogen and oxygen gas are generated at a mole ratio of 1:0.5 by water electrolysis, it can be calculated that oxygen is coproduced eight times the mass of hydrogen [36].
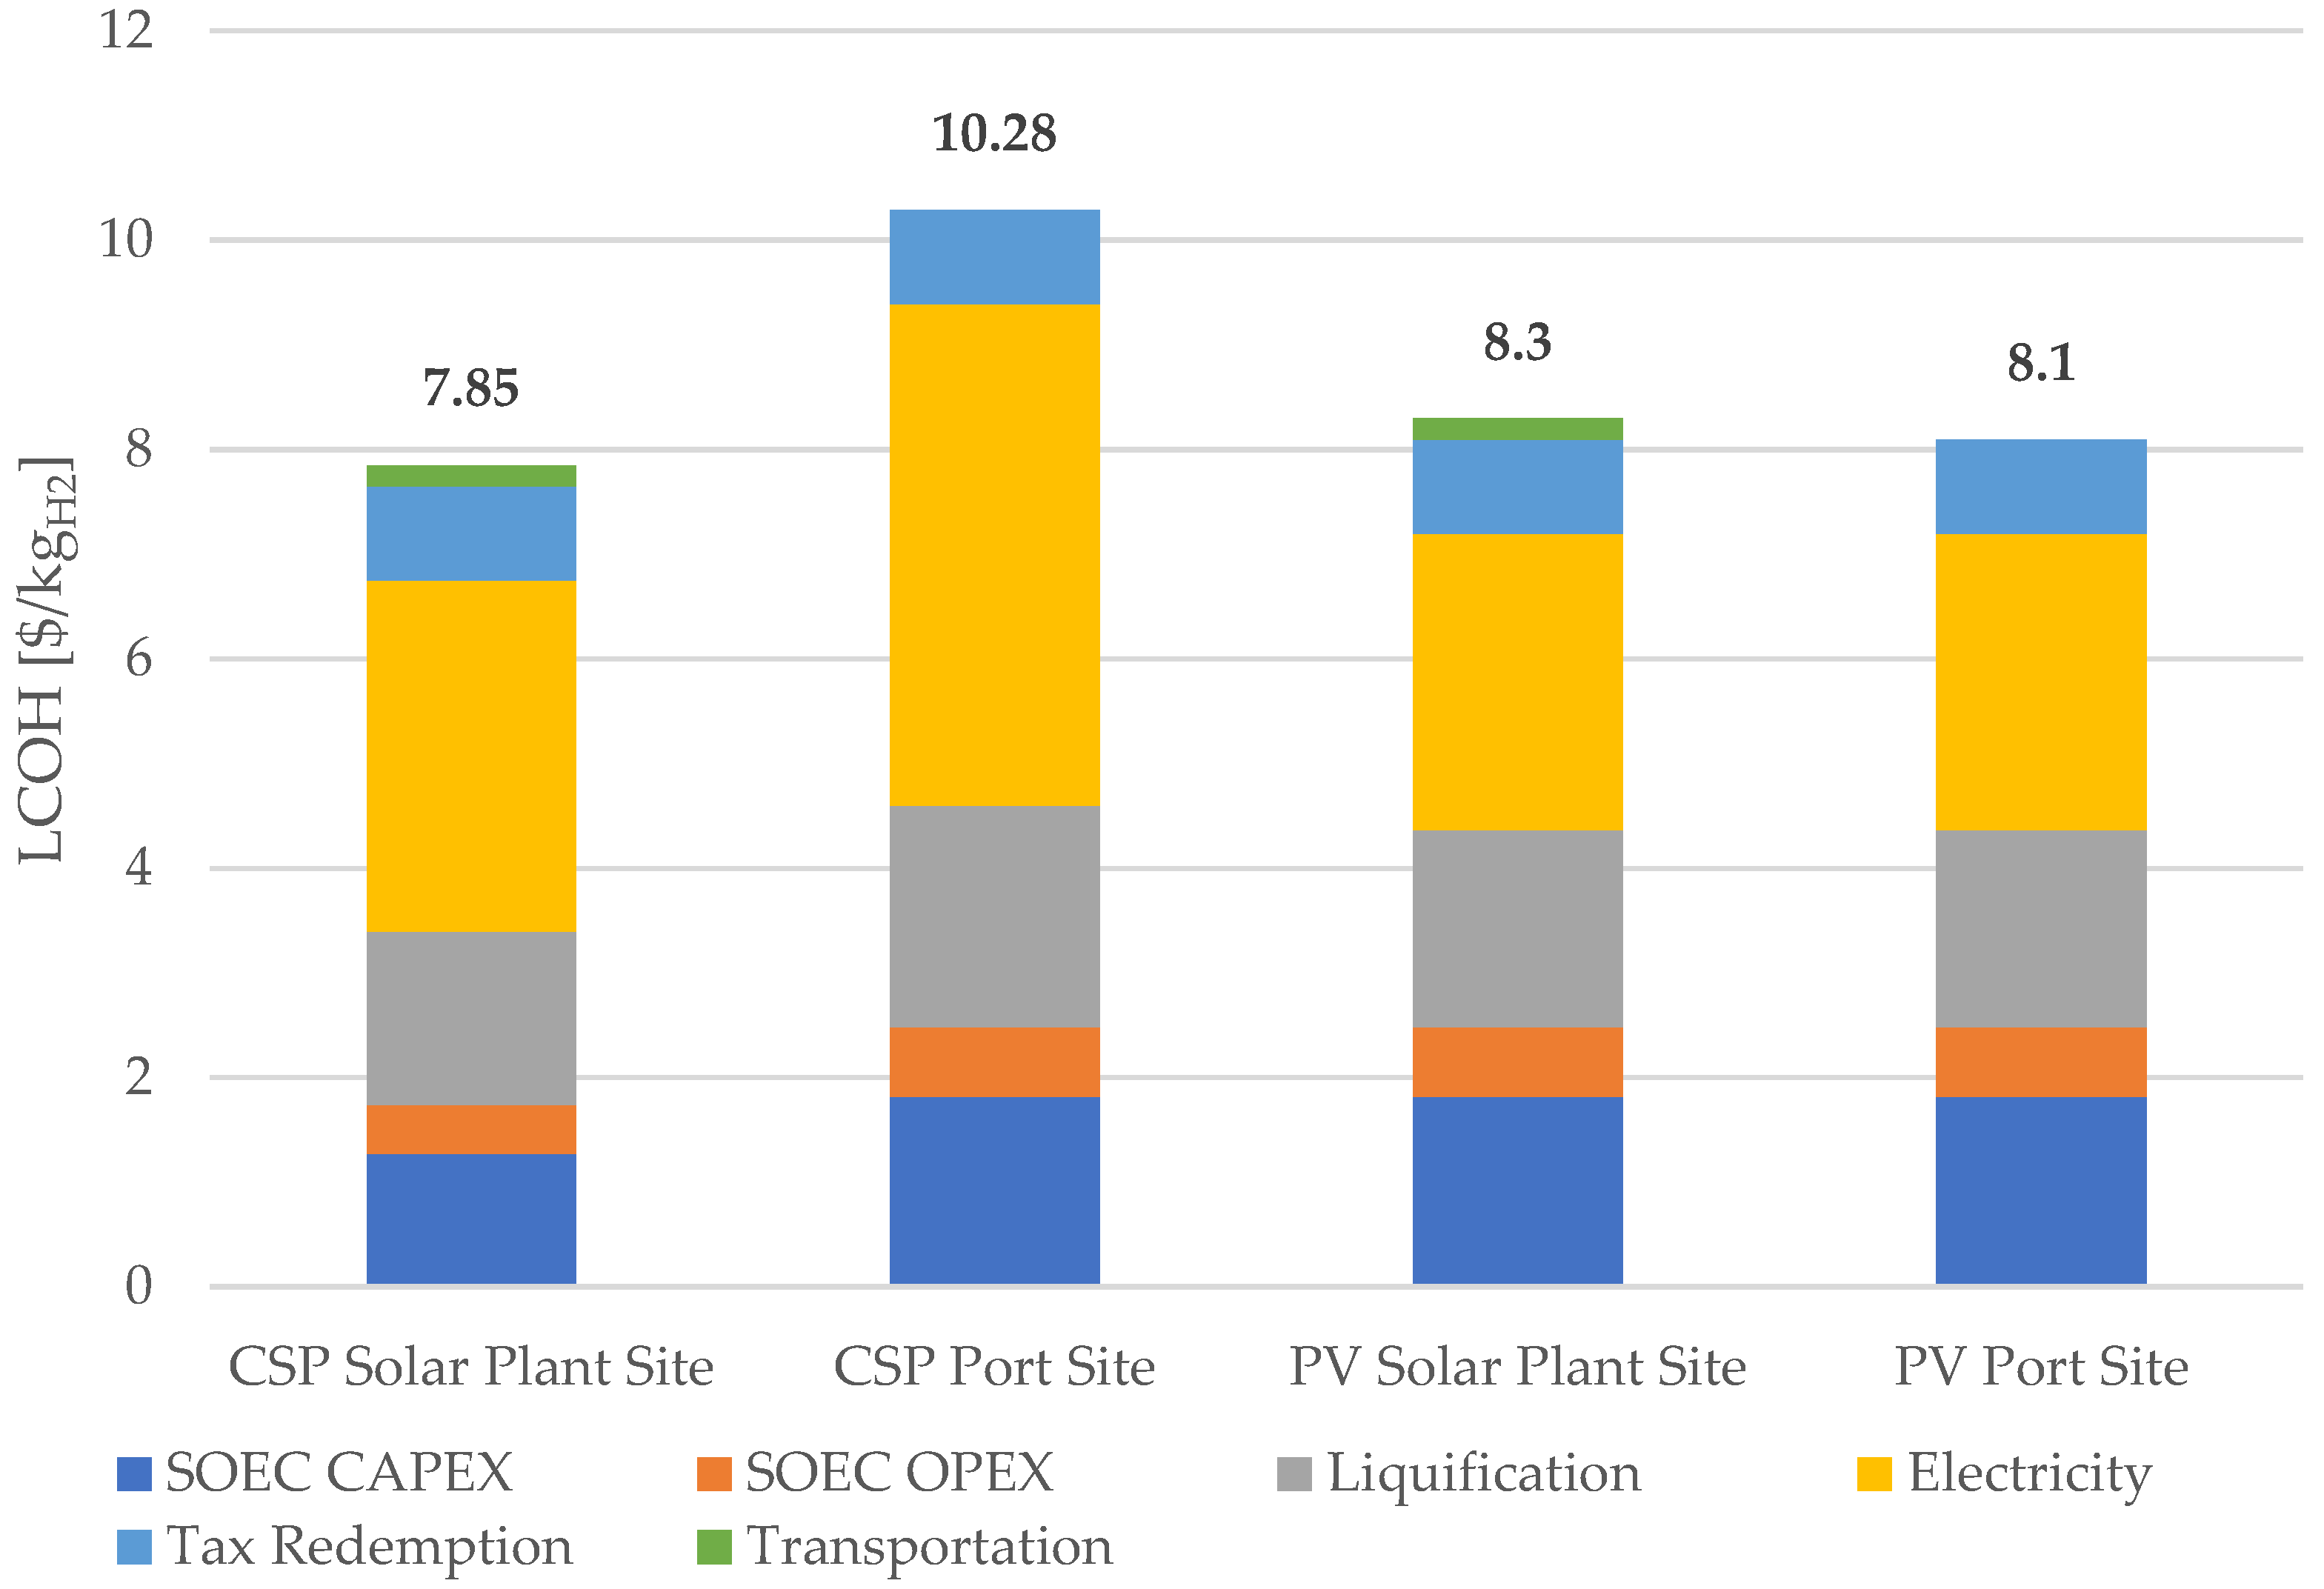
The price of hydrogen can illustrate a better comparison between all energy technologies and delivery scenarios, the LCOH can be estimated as follows [36]:
L C O H = T o t a l L i f e t i m e C o s t T o t a l L i f e t i m e H 2 P r o d u c t i o n = C A P E X + n = 1 N O P E X n ( 1 + r ) n + T R n = 1 N R E V H n ( 1 + r ) n n = 1 N M H 2 ( 1 S R D ) n ( 1 + r ) n
The capital cost of expenditure indexes along with the annual operational costs and factors needed to calculate the equations above are explained in Table 4 and Table 5. The lifetime of hydrogen plants is set to 20 years, the SOEC stack unit is presumed to be replaced after 20,000 working hours [36], which comes to once every 4.38 years in a 20-year plant lifetime, and the loss of efficiency is set to 10 %. The capacity of the hydrogen plants is set to 50% with 12 h a day, accumulating to 4380 h in each year [36]. SAM’s results for the CSP and PV’s plants LCOE accounts for the cost of electricity to operate the electrolyzers in each scenario. Additionally, 10 kg of water are assumed to provide 1 kg of hydrogen [36]. UAE’s wage rates are considered for one full-time employee to manage each hydrogen plant. Hydrogen sales price is set to 10 $/kgH2 [38,39], and 0.054 $/kgO2 for oxygen [40]. Loan payments and interest in debts were not considered for the hydrogen plants.

2.3. Liquification and Distribution

Liquification energy consumption assumptions are based on Gallardo et al. study with 6.4 kWh/kgH2 [39], and liquid hydrogen plant CAPEX of 50,000 $/(kgH2/h) [45], presuming operation and maintenance annual fees of 4% of the CAPEX according to Stolzenburg [46].
For the first delivery scenario from solar plant sites to ports, trucks are considered to carry the liquified H2. The IEA’s considerations of transportation cost as a function to distance with 0.12–0.13 $/kgH2 for each 100 km traveled LH2 are adapted in this study [47]. The average distance between solar plants and the closest ports in the cases of the UAE are estimated at 154.34 km, as per our previous study [26].

3. Results and Discussions

3.1. SAM Model Results

Two simulations are performed in this study by SAM to project the technical and financial performance of a CSP and PV plants in the case of the UAE at the same location. Table 6 and Table 7 present the findings of the simulations for both plants. The summarized results show that the PV plant has a higher energy rate throughout the first year of production and a lower levelized cost of energy of 5.08 ¢/kWh than that of the CSP plant’s 8.6 ¢/kWh, due to the PV’s higher efficiency and lower capital investment.
In Figure 4, monthly AC Energy in year one for both PV and CSP plants is presented to show the higher levels of energy the PV plant produces throughout the year compared to those of the CSP plant, and we can also see the changes in energy production rates for both plants from one month to another due to the weather changes that affect solar irradiance levels, which impacts the solar plants’ efficiencies.
When looking at the yearly scales of production, the CSP plant shows more steady rates throughout the lifetime of the plant compared to the PV one as the degradation rate for CSP plants are lower than these of PV. Annual electricity net generation during the 25-year lifetime of CSP and PV plants presented in Figure 5 shows the yearly decline in energy production for the PV plant, which is caused by the system’s degradation and battery deterioration rates. Thus, the aftermath of the full lifetime total net electricity generation of both plants presents the CSP as the technology that generates higher amounts of electricity between CSP and PV, as shown in Figure 5.

3.2. Hydrogen Production Results

Techno-economic analysis is carried for 1 MWel SOEC water electrolyzer in four different cases based on electricity source and hydrogen plant location. Table 8 lists the capital costs, operational costs, hydrogen production rates, liquification and transportation cost for each scenario. These numbers are then applied in Equations (1) to (4) to estimate the net present values of the projects and in Equation (5) to calculate the levelized cost of hydrogen in each assumed hydrogen production pathway.
Figure 6 presents the NPV variations for all hydrogen production plants in all scenarios in the 20 years assumed lifetime of the project, and the scenario where CSP plant is coupled to the SOEC electrolyzer and placed at the same site proves most profitable according to the results, achieving the shortest payback period between all projects in only 4 years, and making the highest revenues as this scenario provides the highest rates of hydrogen as explained in Table 3. The scenarios with an electricity source from the PV plants have identical NPVs, and they come as second to the SOEC at CSP as profitable projects, reaching payback period in around 7 years, followed by the scenario with the SOEC electrolyzer fed by CSP plant electricity and placed at the port site, as the price of electricity is the highest and an electric heater is still needed, which raises the expenses.
Applying assumptions and results in Table 8 to Equation (5), we estimate the levelized cost of hydrogen for each hydrogen plant in every scenario. The results show that the electrolyzer coupled to the CSP plant at the solar plant site scenario provides the cheapest hydrogen at 7.85 $/kgH2, followed by the PV port site scenario at 8.1 $/kgH2 and then 8.3 $/kgH2 for PV at the solar plant scenario, as the 0.2 $/kgH2 transportation fees raise the cost of LCOH for this scenario from PV at the port site, and finally CSP at the port site scenario estimates the LCOH at 10.28 $/kgH2. A comparison between all LCOH rates for all cases is presented in Figure 7, which also shows the ratio of cost items that contributes to each result. In all scenario electricity cost has the highest contribution to the final numbers of the LCOH.

4. Conclusions

In this paper, we present a techno-economic analysis for solar hydrogen generation from concentrated solar power and photovoltaic technologies, considering two different hydrogen supply chain pathways depending on the location of the chosen SOEC water electrolyzer. CSP and PV plants are optimized using NRLE’s system advisor model, SAM, at the same site in the UAE to estimate electricity generation levels in a 25-year lifetime and the levelized cost of electricity. Then, a 1 MWel SOEC electrolyzer is modeled to produce hydrogen when coupled to a thermal source of heat, which is either the CSP plant or provided by electric resistance heaters when working at the PV plant site or port site. The net present value NPV and levelized cost of hydrogen are evaluated to estimate the feasibility of each scenario and the final cost of hydrogen for export.
SAM model results show that PV can provide more electricity in the first year than CSP, and a lower levelized cost of electricity of 5.08 ¢/kWh, while the CSP plant maintains a steadier power generation through the years of the plant’s lifetime and a much bigger total net electric generation, with a LCOE of 8.6 ¢/kWh.
The NPV results taken from the hydrogen production model equations show that the scenario where hydrogen is produced by the SOEC electrolyzer coupled to CSP plants at the same site is the most profitable scenario and can reach the payback period in about only 4 years, compared to 7 years for PV and 13 years when the electrolyzer is placed at the port site and fed electricity from the CSP plant.
The LCOH results show that SOEC coupled to the CSP plant at the same site has more competitive results of 7.85 $/kgH2, followed by the PV solar site hydrogen production scenario with 8.1 $/kgH2, then 8.3 $/kgH2 for the PV port scenario and finally 10.28 $/kgH2 for the case where hydrogen is produced using electricity from the CSP plant at the port site.
This study highlights the significance of solar thermal technology for energy and hydrogen futures in the Middle East region. Although the levelized cost of energy for a CSP plant might be higher than that of a PV plant in the same conditions in the case of the UAE, CSP plants provide a steadier level of energy along the full lifetime of the solar plant and can also provide cheaper emission-free hydrogen when coupled to an SOEC electrolyzer than an PV-SOEC plant, which makes it a more favorable choice for green hydrogen production for export purposes.
Future studies should consider a life cycle assessment to compare CO2 emissions for each scenario, to provide a clearer view of the advantage of each technology.

Author Contributions

Conceptualization, A.J. and K.O.; methodology, A.J.; software, A.J.; validation, A.J., Y.A. and K.O.; formal analysis, A.J.; investigation, A.J.; resources, A.J.; data curation, A.J.; writing—original draft preparation, A.J.; writing—review and editing, A.J.; visualization, A.J.; supervision, Y.A. and K.O.; project administration, A.J. and K.O.; funding acquisition, K.O. All authors have read and agreed to the published version of the manuscript.

Funding

This research was funded by JSPS Grant-in-Aid for Scientific Research, grant number 20H02677.

Informed Consent Statement

Not applicable.

Data Availability Statement

Not applicable.

Acknowledgments

The first author acknowledges funding support from the Japanese government, Ministry of Education, Culture, Sports, Science and Technology, under their international program (MEXT) scholarship.

Conflicts of Interest

The authors declare no conflict of interest.

References

  1. El-Katiri, L.; Fattouh, B.; Oxford Institute for Energy Studies. A Roadmap for Renewable Energy in the Middle East and North Africa; Oxford Institute for Energy Studies: Oxford, UK, 2014; ISBN 9781907555909. [Google Scholar] [CrossRef]
  2. Alnaser, W.E.; Alnaser, N.W. The Status of Renewable Energy in the GCC Countries. Renew. Sustain. Energy Rev. 2011, 15, 3074–3098. [Google Scholar] [CrossRef]
  3. Bouhal, T.; Agrouaz, Y.; Kousksou, T.; Allouhi, A.; el Rhafiki, T.; Jamil, A.; Bakkas, M. Technical Feasibility of a Sustainable Concentrated Solar Power in Morocco through an Energy Analysis. Renew. Sustain. Energy Rev. 2018, 81, 1087–1095. [Google Scholar] [CrossRef]
  4. Griffiths, S. A Review and Assessment of Energy Policy in the Middle East and North Africa Region. Energy Policy 2017, 102, 249–269. [Google Scholar] [CrossRef]
  5. Bhutto, A.W.; Bazmi, A.A.; Zahedi, G.; Klemeš, J.J. A Review of Progress in Renewable Energy Implementation in the Gulf Cooperation Council Countries. J. Clean Prod. 2014, 71, 168–180. [Google Scholar] [CrossRef]
  6. IRENA. Renwable Energy Market Analysis: The GCC Rregion; International Renewable Energy Agency: Abu Dhabi, United Arab Emirates, 2016. [Google Scholar]
  7. IRENA. Renewable Energy Market Analysis: GCC 2019; International Renewable Energy Agency: Abu Dhabi, United Arab Emirates, 2019. [Google Scholar]
  8. Nematollahi, O.; Hoghooghi, H.; Rasti, M.; Sedaghat, A. Energy Demands and Renewable Energy Resources in the Middle East. Renew. Sustain. Energy Rev. 2016, 54, 1172–1181. [Google Scholar] [CrossRef]
  9. Reuß, M.; Grube, T.; Robinius, M.; Stolten, D. A Hydrogen Supply Chain with Spatial Resolution: Comparative Analysis of Infrastructure Technologies in Germany. Appl. Energy 2019, 247, 438–453. [Google Scholar] [CrossRef]
  10. Marchenko, O.V.; Solomin, S.V. The Future Energy: Hydrogen versus Electricity. Int. J. Hydrog. Energy 2015, 40, 3801–3805. [Google Scholar] [CrossRef]
  11. Loisel, R.; Baranger, L.; Chemouri, N.; Spinu, S.; Pardo, S. Economic Evaluation of Hybrid Off-Shore Wind Power and Hydrogen Storage System. Int. J. Hydrog. Energy 2015, 40, 6727–6739. [Google Scholar] [CrossRef]
  12. Franco, B.A.; Baptista, P.; Neto, R.C.; Ganilha, S. Assessment of Offloading Pathways for Wind-Powered Offshore Hydrogen Production: Energy and Economic Analysis. Appl. Energy 2021, 286, 116553. [Google Scholar] [CrossRef]
  13. Lan, X.; Li, G.; Jin, R.; Li, X.; Zheng, J. Carbon Coated Nickel Cobalt Phosphide with Sea Urchin-like Structure by Low Temperature Plasma Processing for Hydrogen Evolution and Urea Oxidation. Chem. Eng. J. 2022, 450, 138225. [Google Scholar] [CrossRef]
  14. IEA. World Energy Outlook 2020; International Energy Agency: Paris, France, 2020. Available online: https://www.iea.org/reports/world-energy-outlook-2020 (accessed on 16 May 2020).
  15. Behling, N.; Williams, M.C.; Managi, S. Fuel Cells and the Hydrogen Revolution: Analysis of a Strategic Plan in Japan. Econ. Anal. Policy 2015, 48, 204–221. [Google Scholar] [CrossRef]
  16. Kamiya, S.; Nishimura, M.; Harada, E. Study on Introduction of CO2 Free Energy to Japan with Liquid Hydrogen. Phys. Procedia 2015, 67, 11–19. [Google Scholar] [CrossRef] [Green Version]
  17. Nagashima, M.; Institut Franҫais des Relations Internationales. Japan’s Hydrogen Strategy and Its Economic and Geopolitical Implications; Études de l’Ifri, Ifri: Paris, France, 2018; ISBN 9782365679183. [Google Scholar]
  18. Kim, A.; Kim, H.; Lee, H.; Lee, B.; Lim, H. Comparative Economic Optimization for an Overseas Hydrogen Supply Chain Using Mixed-Integer Linear Programming. Sustain. Chem. Eng. 2021, 9, 14249–14262. [Google Scholar] [CrossRef]
  19. Basic Hydrogen Strategy Determined(METI). Available online: https://www.meti.go.jp/english/press/2017/1226_003.html (accessed on 28 April 2022).
  20. IEA. Global Hydrogen Review 2021; International Energy Agency: Paris, France, 2021; Available online: https://www.iea.org/reports/global-hydrogen-review-2021 (accessed on 15 November 2021).
  21. Rosenstiel, A.; Monnerie, N.; Dersch, J.; Roeb, M.; Pitz-Paal, R.; Sattler, C. Electrochemical Hydrogen Production Powered by PV/CSP Hybrid Power Plants: A Modelling Approach for Cost Optimal System Design. Energies 2021, 14, 3437. [Google Scholar] [CrossRef]
  22. View of improving the output of dc-dc converter by phase shift full bridge applied to renewable energy. Available online: https://journal.iem.pub.ro/rrst-ee/article/view/32/20 (accessed on 27 September 2022).
  23. van Tan, N.; Nam, N.B.; Hieu, N.H.; Hung, L.K.; Duong, M.Q.; Lam, L.H. A Proposal for an MPPT Algorithm Based on the Fluctuations of the PV Output Power, Output Voltage, and Control Duty Cycle for Improving the Performance of PV Systems in Microgrid. Energies 2020, 13, 4326. [Google Scholar] [CrossRef]
  24. Kazim, A. Strategy for a Sustainable Development in the UAE through Hydrogen Energy. Renew. Energy 2010, 35, 2257–2269. [Google Scholar] [CrossRef]
  25. Orhan, M.F.; Kahraman, H.; Babu, B.S. Approaches for Integrated Hydrogen Production Based on Nuclear and Renewable Energy Sources: Energy and Exergy Assessments of Nuclear and Solar Energy Sources in the United Arab Emirates. Int. J. Hydrog. Energy 2017, 42, 2601–2616. [Google Scholar] [CrossRef]
  26. Joubi, A.; Akimoto, Y.; Okajima, K. A Production and Delivery Model of Hydrogen from Solar Thermal Energy in the United Arab Emirates. Energy 2022, 15, 4000. [Google Scholar] [CrossRef]
  27. Lopez, A.; Roberts, B.; Heimiller, D.; Blair, N.; Porro, G.U.S. Renewable Energy Technical Potentials. A GIS-Based Analysis; National Renewable Energy Lab. (NREL): Golden, CO, USA, 2012. [CrossRef]
  28. Blair, N.; Diorio, N.; Freeman, J.; Gilman, P.; Janzou, S.; Neises, T.; Wagner, M. System Advisor Model (SAM) General Description (Version 2017.9.5); National Renewable Energy Lab. (NREL): Golden, CO, USA, 2018.
  29. Murphy, C.; Sun, Y.; Cole, W.; Maclaurin, G.; Turchi, C.; Mehos, M. The Potential Role of Concentrating Solar Power within the Context of DOE’s 2030 Solar Cost Targets; National Renewable Energy Lab. (NREL): Golden, CO, USA, 2019.
  30. Diorio, N.; Dobos, A.; Janzou, S. Economic Analysis Case Studies of Battery Energy Storage with SAM; National Renewable Energy Lab. (NREL): Golden, CO, USA, 2015.
  31. Poullikkas, A.; Gadalla, M. Assessment of Solar Electricity Production in the United Arab Emirates. Int. J. Sustain. Energy 2013, 32, 631–642. [Google Scholar] [CrossRef]
  32. Alhammami, H.; An, H. Techno-Economic Analysis and Policy Implications for Promoting Residential Rooftop Solar Photovoltaics in Abu Dhabi, UAE. Renew. Energy 2021, 167, 359–368. [Google Scholar] [CrossRef]
  33. Introduction of Corporate Tax in the UAE—Gibson Dunn. Available online: https://www.gibsondunn.com/introduction-of-corporate-tax-in-the-uae/ (accessed on 29 August 2022).
  34. JRC Photovoltaic Geographical Information System (PVGIS)—European Commission. Available online: https://re.jrc.ec.europa.eu/pvg_tools/en/ (accessed on 30 August 2022).
  35. United Arab Emirates Interest Rate—2022 Data—2007–2021 Historical—2023 Forecast. Available online: https://tradingeconomics.com/united-arab-emirates/interest-rate (accessed on 31 August 2022).
  36. Jang, D.; Kim, J.; Kim, D.; Han, W.B.; Kang, S. Techno-Economic Analysis and Monte Carlo Simulation of Green Hydrogen Production Technology through Various Water Electrolysis Technologies. Energy Convers. Manag. 2022, 258, 115499. [Google Scholar] [CrossRef]
  37. Nicita, A.; Maggio, G.; Andaloro, A.P.F.; Squadrito, G. Green Hydrogen as Feedstock: Financial Analysis of a Photovoltaic-Powered Electrolysis Plant. Int. J. Hydrog. Energy 2020, 45, 11395–11408. [Google Scholar] [CrossRef]
  38. Arias, J. Hydrogen and Fuel Cells in Japan; EU-Japan Centre for Industrial Cooperation: Tokyo, Japan, 2019. [Google Scholar]
  39. Gallardo, F.I.; Monforti Ferrario, A.; Lamagna, M.; Bocci, E.; Astiaso Garcia, D.; Baeza-Jeria, T.E. A Techno-Economic Analysis of Solar Hydrogen Production by Electrolysis in the North of Chile and the Case of Exportation from Atacama Desert to Japan. Int. J. Hydrog. Energy 2021, 46, 13709–13728. [Google Scholar] [CrossRef]
  40. Meunier, N.; Chauvy, R.; Mouhoubi, S.; Thomas, D.; de Weireld, G. Alternative Production of Methanol from Industrial CO2. Renew. Energy 2020, 146, 1192–1203. [Google Scholar] [CrossRef]
  41. Zauner, A.; Böhm, H.; Rosenfeld, D.C.; Tichler, R. Innovative Large-Scale Energy Storage Technologies and Power-to-Gas Concepts after Optimization Analysis on Future Technology Options and on Techno-Economic Optimization; DVGW Deutscher Verein des Gas- und Wasserfaches e.V.: Bonn, Germany, 2019. Available online: https://www.storeandgo.info/fileadmin/downloads/publications/STORE_GO_power_to_gas_roadmap.pdf (accessed on 1 August 2022).
  42. Tong, Q.; Al Awad, M. Wages in the United Arab Emirates. 2017. Available online: https://zuscholars.zu.ac.ae/works/1295 (accessed on 1 August 2022).
  43. Home—Business Rates And Tariffs 2018. Available online: https://www.addc.ae/en-US/business/Pages/RatesAndTariffs2018.aspx (accessed on 30 August 2022).
  44. Lee, B.; Chae, H.; Choi, N.H.; Moon, C.; Moon, S.; Lim, H. Economic Evaluation with Sensitivity and Profitability Analysis for Hydrogen Production from Water Electrolysis in Korea. Int. J. Hydrog. Energy 2017, 42, 6462–6471. [Google Scholar] [CrossRef]
  45. Reuß, M.; Grube, T.; Robinius, M.; Preuster, P.; Wasserscheid, P.; Stolten, D. Seasonal Storage and Alternative Carriers: A Flexible Hydrogen Supply Chain Model. Appl. Energy 2017, 200, 290–302. [Google Scholar] [CrossRef]
  46. Stolzenburg, K.; Mubbala, R. Integrated Design for Demonstration of Efficient Liquefaction of Hydrogen (IDEALHY) Fuel Cells and Hydrogen Joint Undertaking (FCH JU) Grant Agreement Number 278177 Title: Hydrogen Liquefaction Report. 2013. Available online: https://www.idealhy.eu/uploads/documents/IDEALHY_D3-16_Liquefaction_Report_web.pdf (accessed on 1 August 2022).
  47. IEA. G20 Hydrogen Report: Assumptions; International Energy Agency: Paris, France, 2020. Available online: https://iea.blob.core.windows.net/assets/a02a0c80-77b2-462e-a9d5-1099e0e572ce/IEA-The-Future-of-Hydrogen-Assumptions-Annex.pdf (accessed on 15 August 2022).
Figure 1. Solar energy applicable areas, suggested plant location and export ports in the UAE.
Hydrogen 03 00024 g001
Figure 2. Study flowchart.
Hydrogen 03 00024 g002
Figure 3. Scenarios’ layout.
Hydrogen 03 00024 g003
Figure 4. Monthly AC Energy in year 1 for both PV and CSP plants.
Hydrogen 03 00024 g004
Figure 5. (a) Annual electricity net generation of CSP and PV plants, (b) total electricity net generation comparison between the CSP and PV plants in 25 years of lifetime.
Hydrogen 03 00024 g005
Figure 6. NPV variations for all hydrogen production plants in all scenarios.
Hydrogen 03 00024 g006
Figure 7. LCOH for all hydrogen production plants in all scenarios.
Hydrogen 03 00024 g007
Table 1. CSP’s technical and financial parameters.
Technical ParametersValueRef.
Solar Multiple2.4[29]
Tower height (m)193.458[29]
Receiver height (m)21.60[29]
Receiver diameter (m)17.65[29]
Plant gross capacity (MW)100[29]
Cooling systemDry cooling[29]
Thermal storage (h)10[29]
Financial parameters
Site improvement cost ($/m2)16[29]
Heliostat field ($/m2)140[29]
Thermal energy storage ($/kWh)22[29]
O&M ($/kWh-year)56[29]
Analysis period (years)25[29]
Inflation rate (%)2.5[35]
Real discount rate (%)6[31,32]
Tax rate (%)9[33]
Table 2. PV’s technical and financial parameters.
Technical ParametersValueRef.
Tracking (axis)1[30]
Tilt (deg)0[30]
Module nominal efficiency (%)17.28[30]
DC to AC ratio1.2[30]
Battery capacity (kWh)80,000[30]
Battery replacement (% capacity)50[30]
Cooling systemDry cooling[30]
Annual degradation rate (%)0.5[30]
Financial parameters
Module cost ($/W)0.71[30]
Inverter ($/W)0.21[30]
PV O&M ($/kWh-year)20[30]
Battery O&M ($/kWh-year)10[30]
Analysis period (years)25[30]
Inflation rate (%)2.5[35]
Real discount rate (%)6[31,32]
Tax rate (%)9[33]
Table 3. Electrolyzers’ operational metrics [36].
ElectrolyzerSOEC Coupled to CSPSOEC with Electric Heaters
Current density [A/cm2]0.670.67
Cell voltage [V/cell]1.261.26
Supplied power [MWel]1.01.0
System efficiency [%]87.661.4
H2 production [Nm3/h]146.47102.66
Table 4. SOEC electrolyzer plant capital costs values in [$] [36].
ItemsSOEC Coupled to CSPSOEC with Electric Heaters
Stack520,000520,000
Power supply198,225198,225
Water circulation87,08287,082
Hydrogen processing83,88083,880
Cooling39,20328,678
Electric Heaters-15,000
Others60006000
Table 5. SOEC electrolyzer plant operational costs factors and values.
ItemsValueUnit
Discount rate [31,32]6%
Income tax rate [33]9%
Plant lifetime [36]20years
Stack lifetime [41]20,000Hours
Operational hours [36]12Hours/day
System’s rate of degradation [36] 5.9%/10,000 h
Labor [42]22,222$/year
Water [43]0.02136$/kgH2
Service and Maintenance [44]2% of CAPEX
Other operating costs [44]1% of CAPEX
Table 6. CSP plan SAM model summary metric values.
CSP Metric Value
Annual AC energy (year 1)470,323,744 kWh
Capacity factor (year 1)59.7%
Annual Water Usage92,754 m3
LCOE Levelized cost of energy real8.60 ¢/kWh
NPV Net present value$−39,282,172
IRR Internal rate of return3.17%
Net capital cost$668,567,680
Debt percent51.26%
Table 7. PV plan SAM model summary metric values.
PV Metric Value
Annual AC energy in Year 1492,705,152 kWh
DC capacity factor in Year 125.6%
Energy yield in Year 12247 kWh/kW
Performance ratio in Year 10.79
Battery roundtrip efficiency88.02%
LCOE Levelized cost of energy real5.08 ¢/kWh
NPV Net present value$5,854,680
IRR Internal rate of return6.93%
Net capital cost$384,917,792
Debt percent57.24%
Table 8. Hydrogen plants and production metrics along with liquification and transportation costs in each scenario.
Items CSP Solar Plant SiteCSP Port SitePV Solar Plant SitePV Port Site
H2 plant CAPEX [$]
Stack520,000520,000520,000520,000
Balance of Plant414,390418,865418,865418,865
H2 plant OPEX [$/year]Electricity376,680376,680222,504222,504
Labor22,22222,22222222222
Water2461.12172517251725
Others9344938993449389
Hydrogen production rate [kgH2/year] 115,22180,760115,22180,760
Liquification
Capital cost [$]1,315,308.221,315,308.221,315,308.221,315,308.22
Electricity [$/year]63,417.6444,450.326,256.726,256.7
O&M [$/year]52,612.3352,612.3352,612.3352,612.33
Transportation [$/kgH2] 0.2-0.2-
Publisher’s Note: MDPI stays neutral with regard to jurisdictional claims in published maps and institutional affiliations.

