
Green Hydrogen Blends with Natural Gas and Its Impact on the Gas Network

Abstract
:1. Introduction
- make use of excess renewable energy.
- Increase renewables share in an energy system to reduce air pollutants and GHG emissions.
2. Methodology
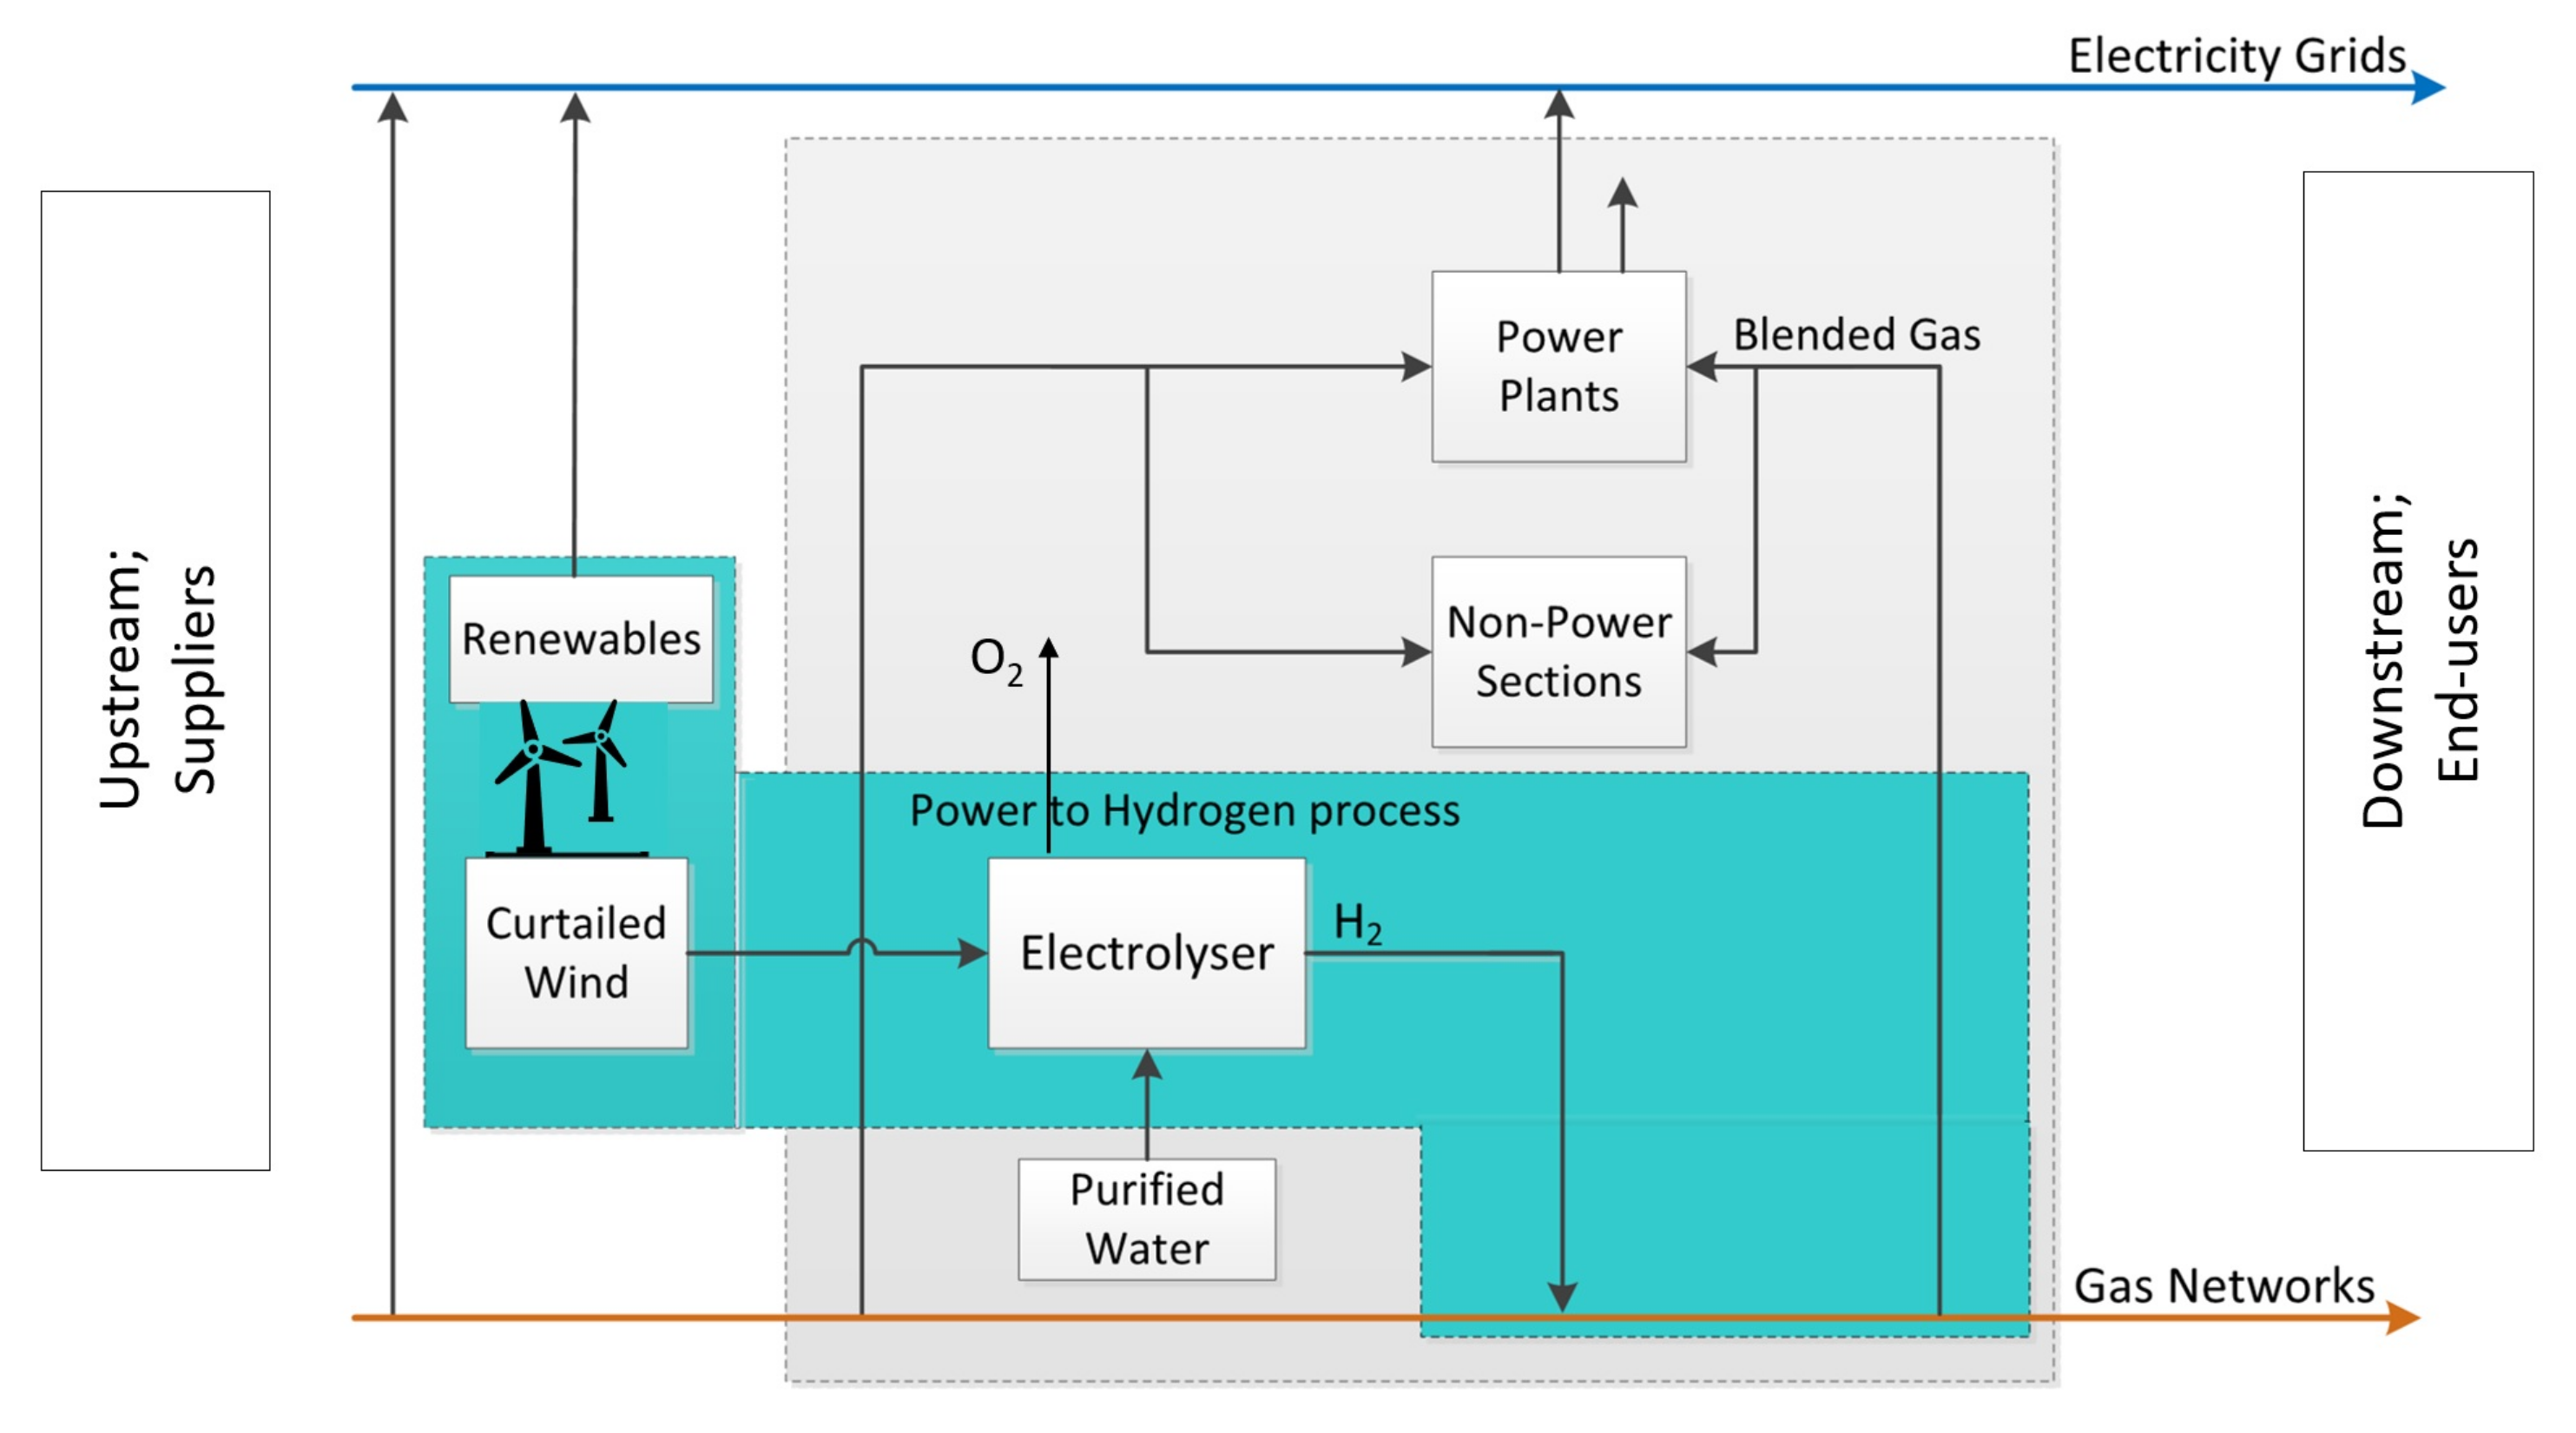
2.1. Gas Network and Renewables Model
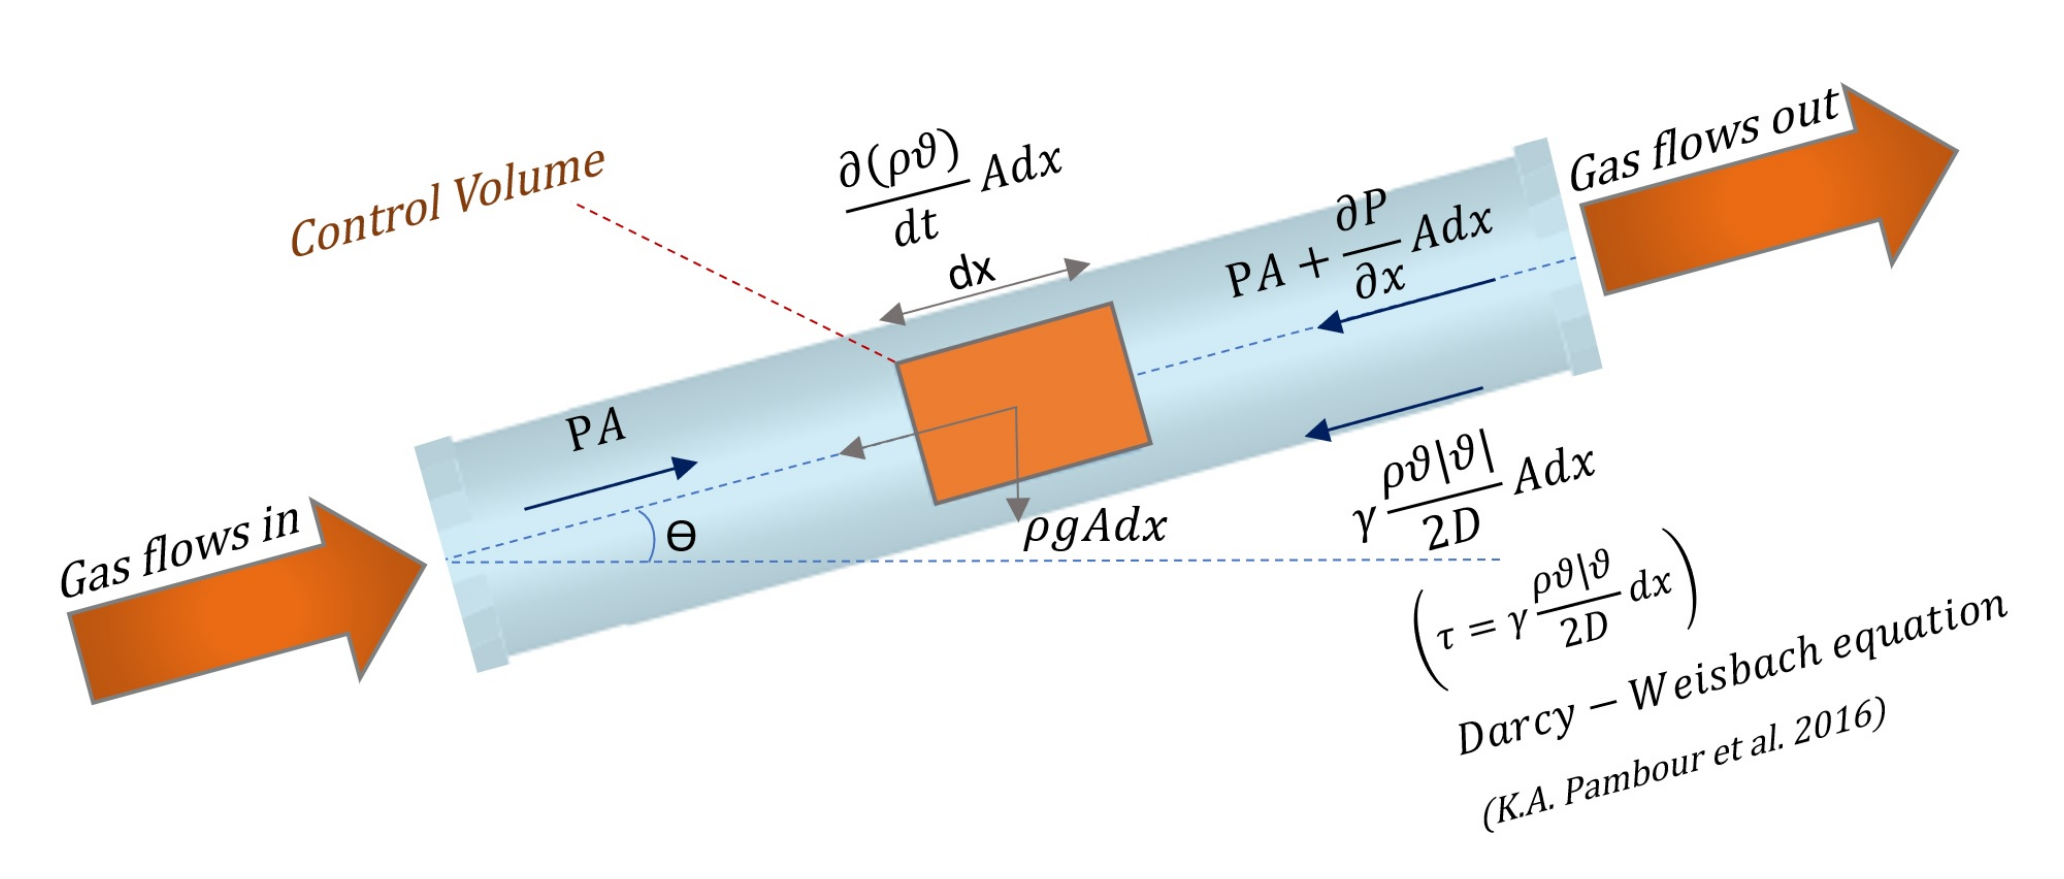
2.1.1. Gas Network Model
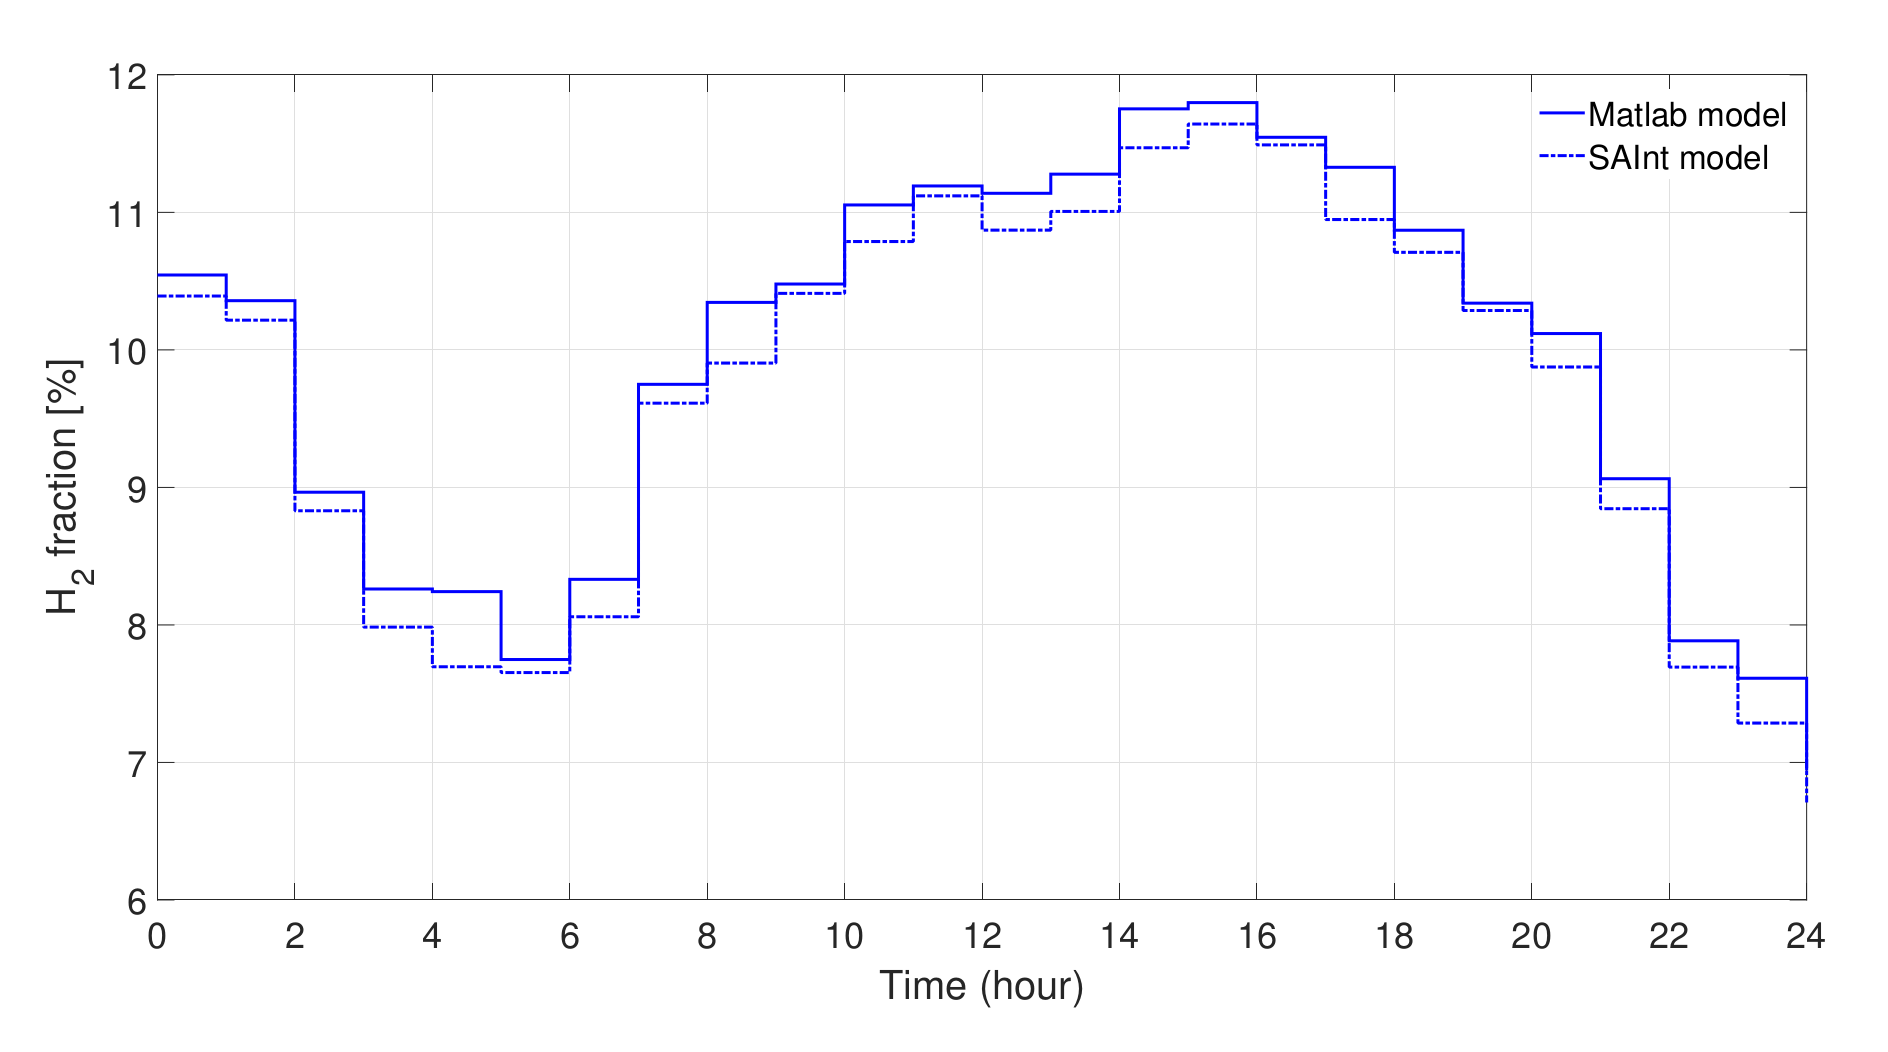
2.1.2. Variable Gas Quality
- Define an initial gas quality using components percentages.
- Calculate the nodal pressures and pipe flow rates.
- Calculate the gas quality through the pipeline, including gas density in and hydrogen concentration at each node of the network.
- Recalculate the pressures and flow rates.
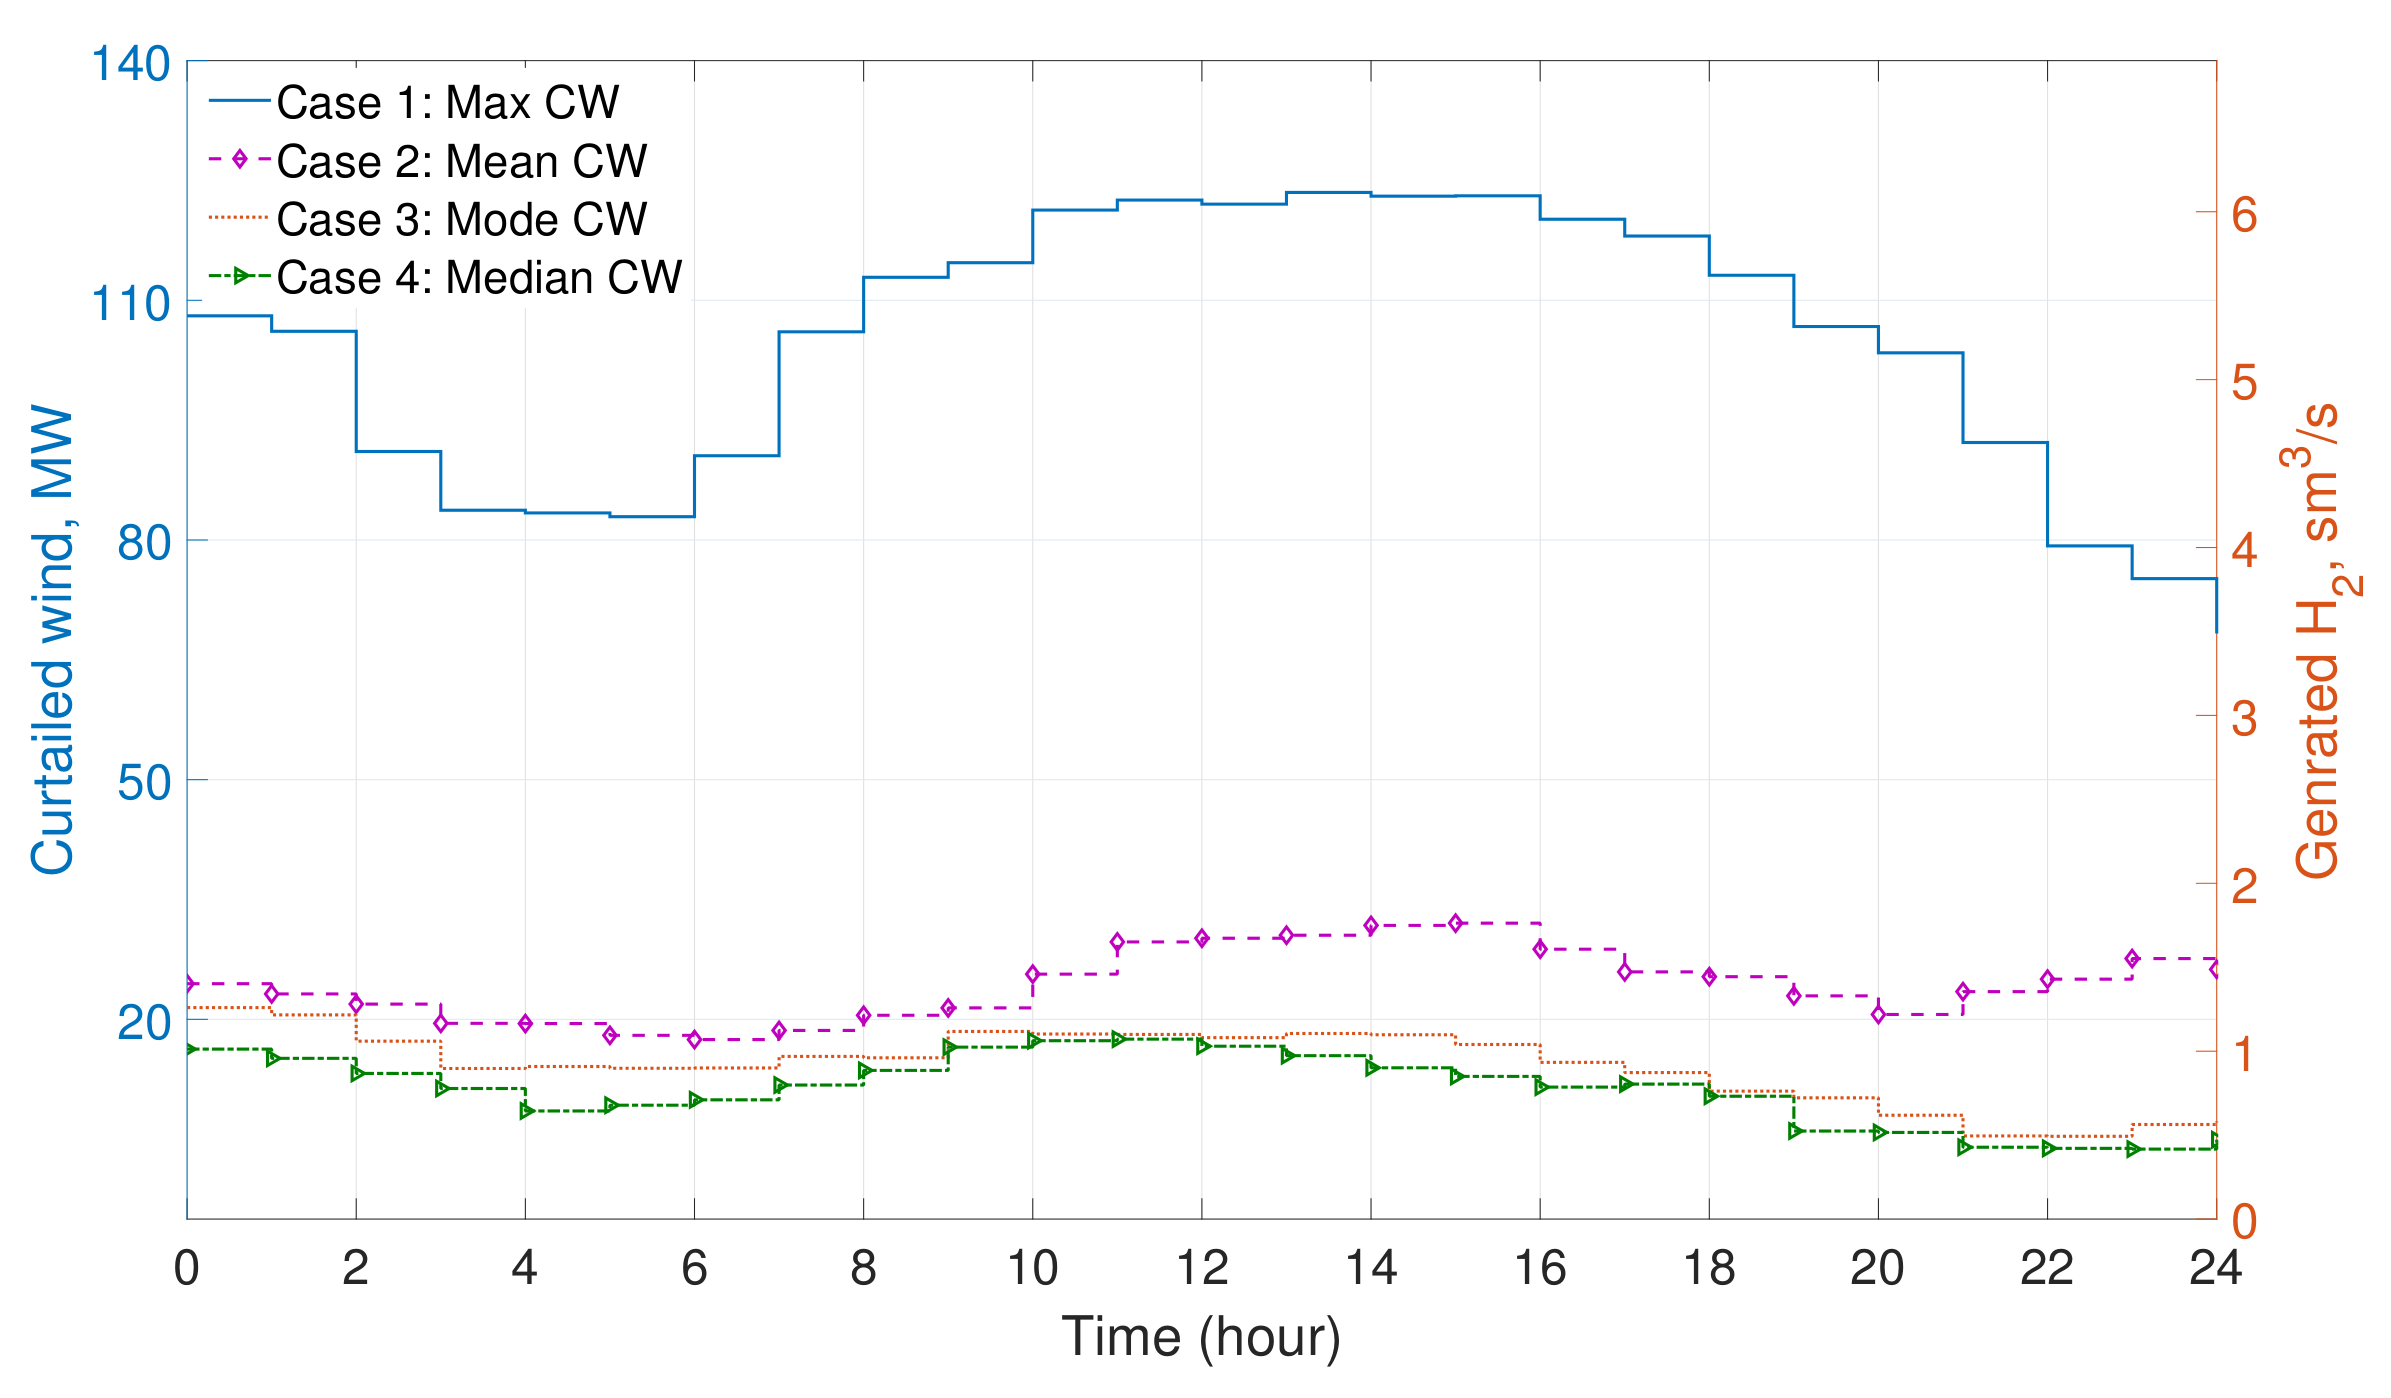
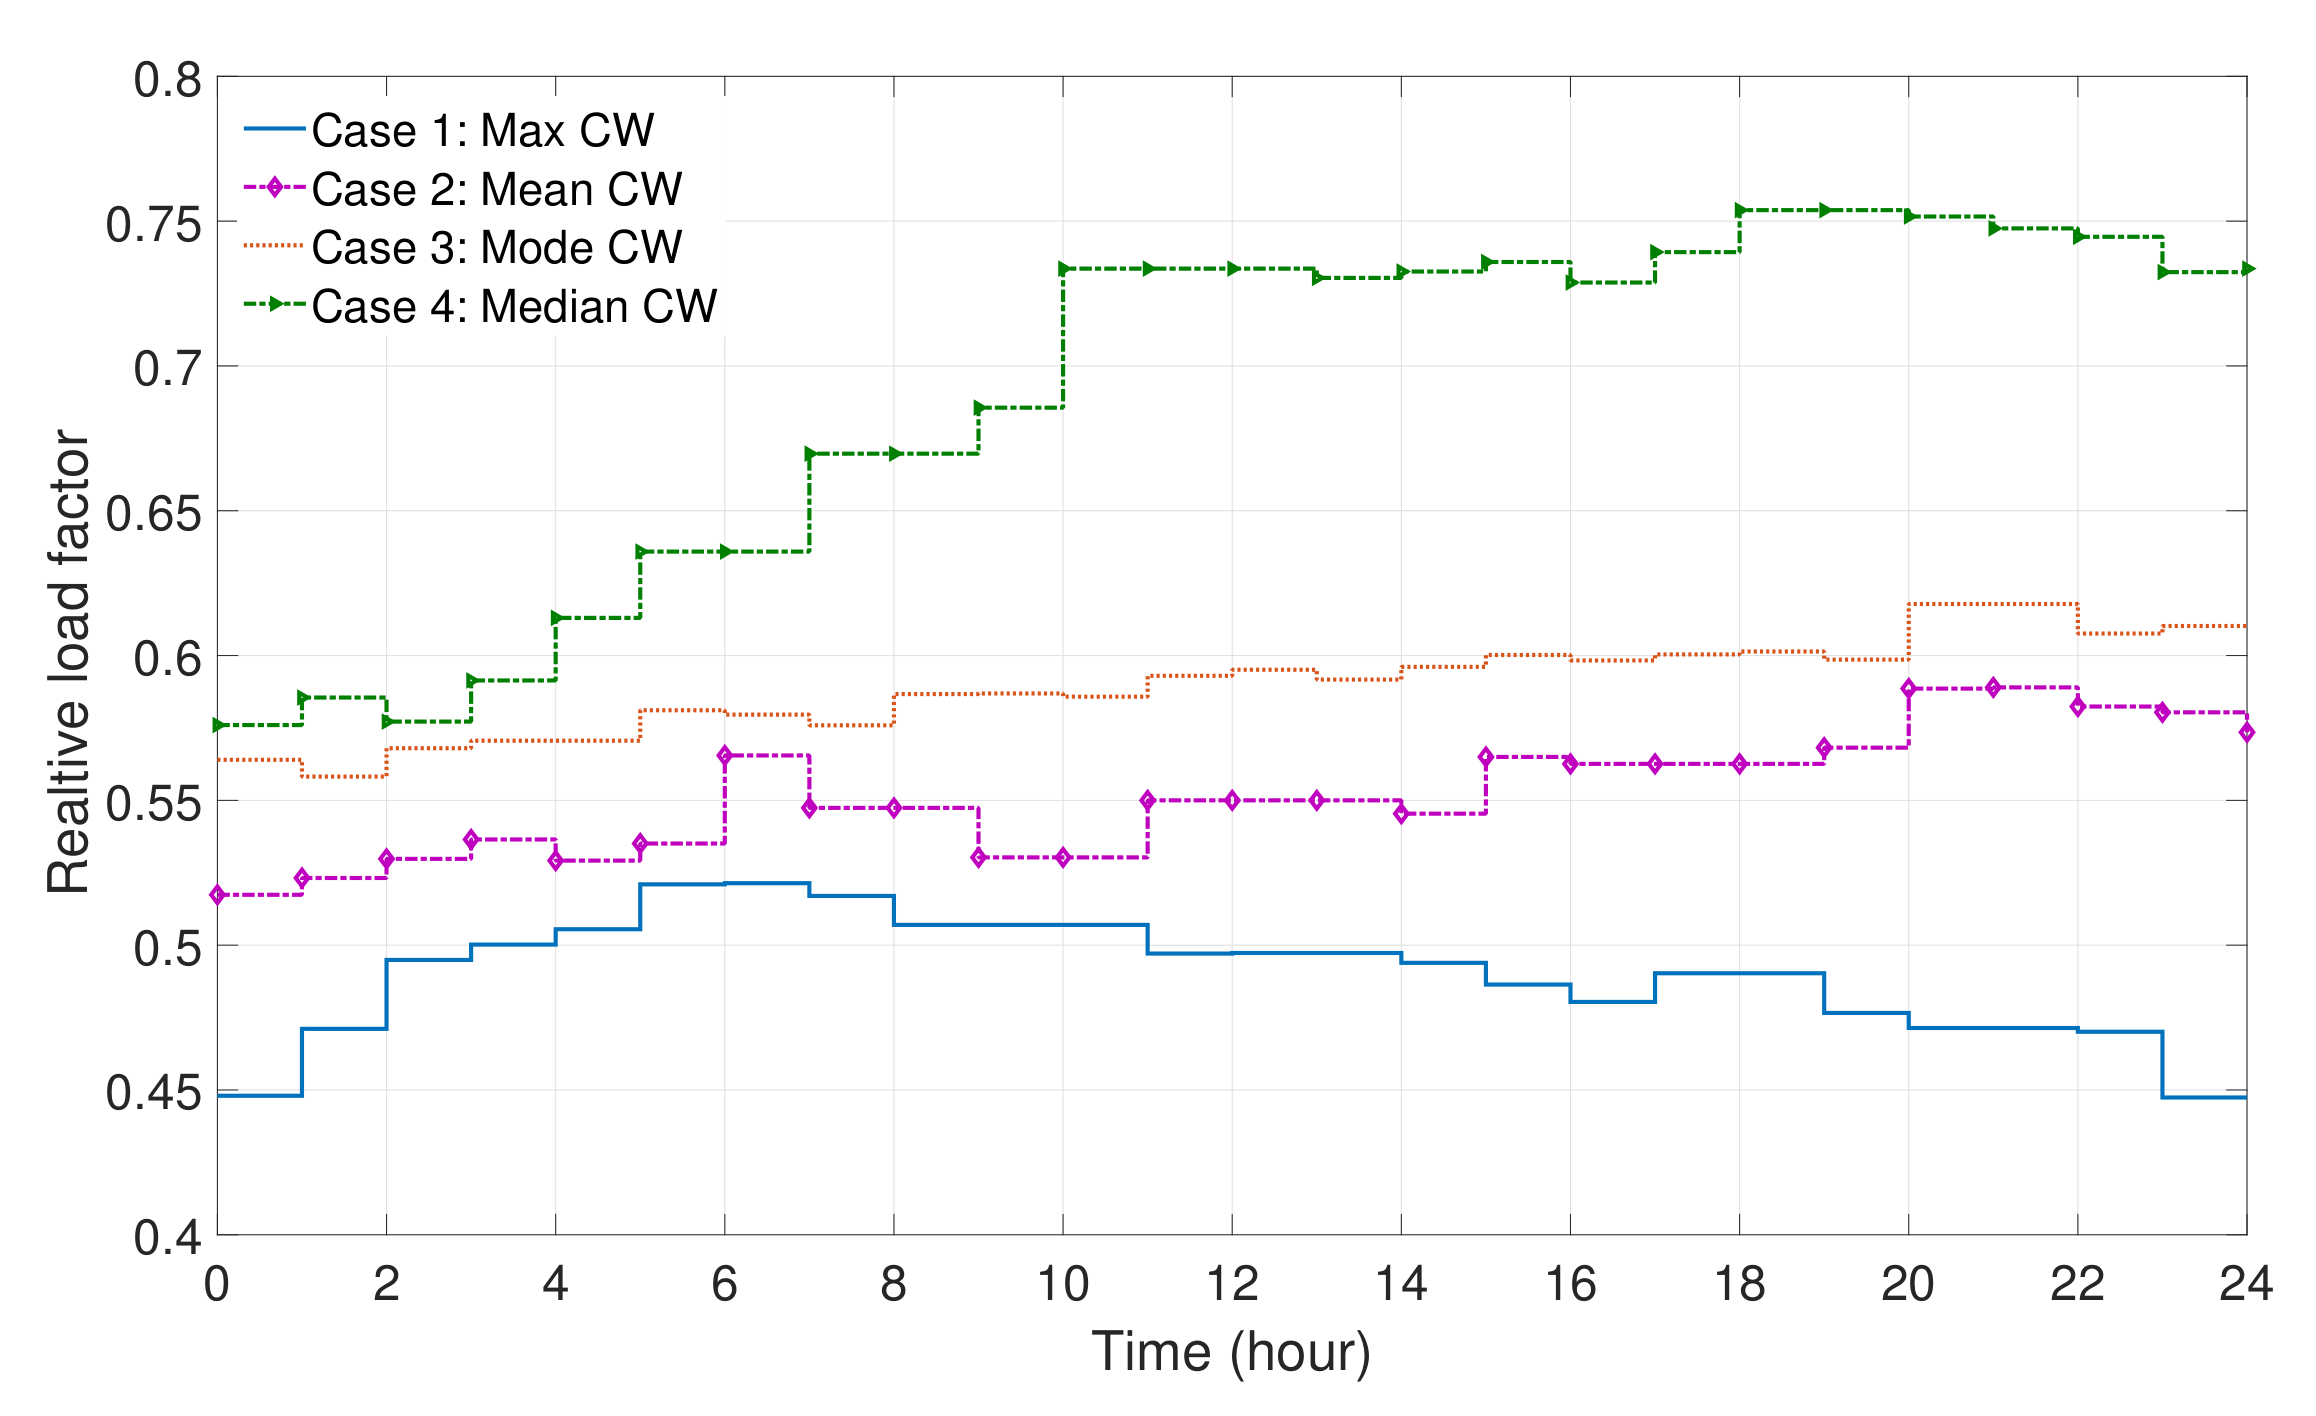
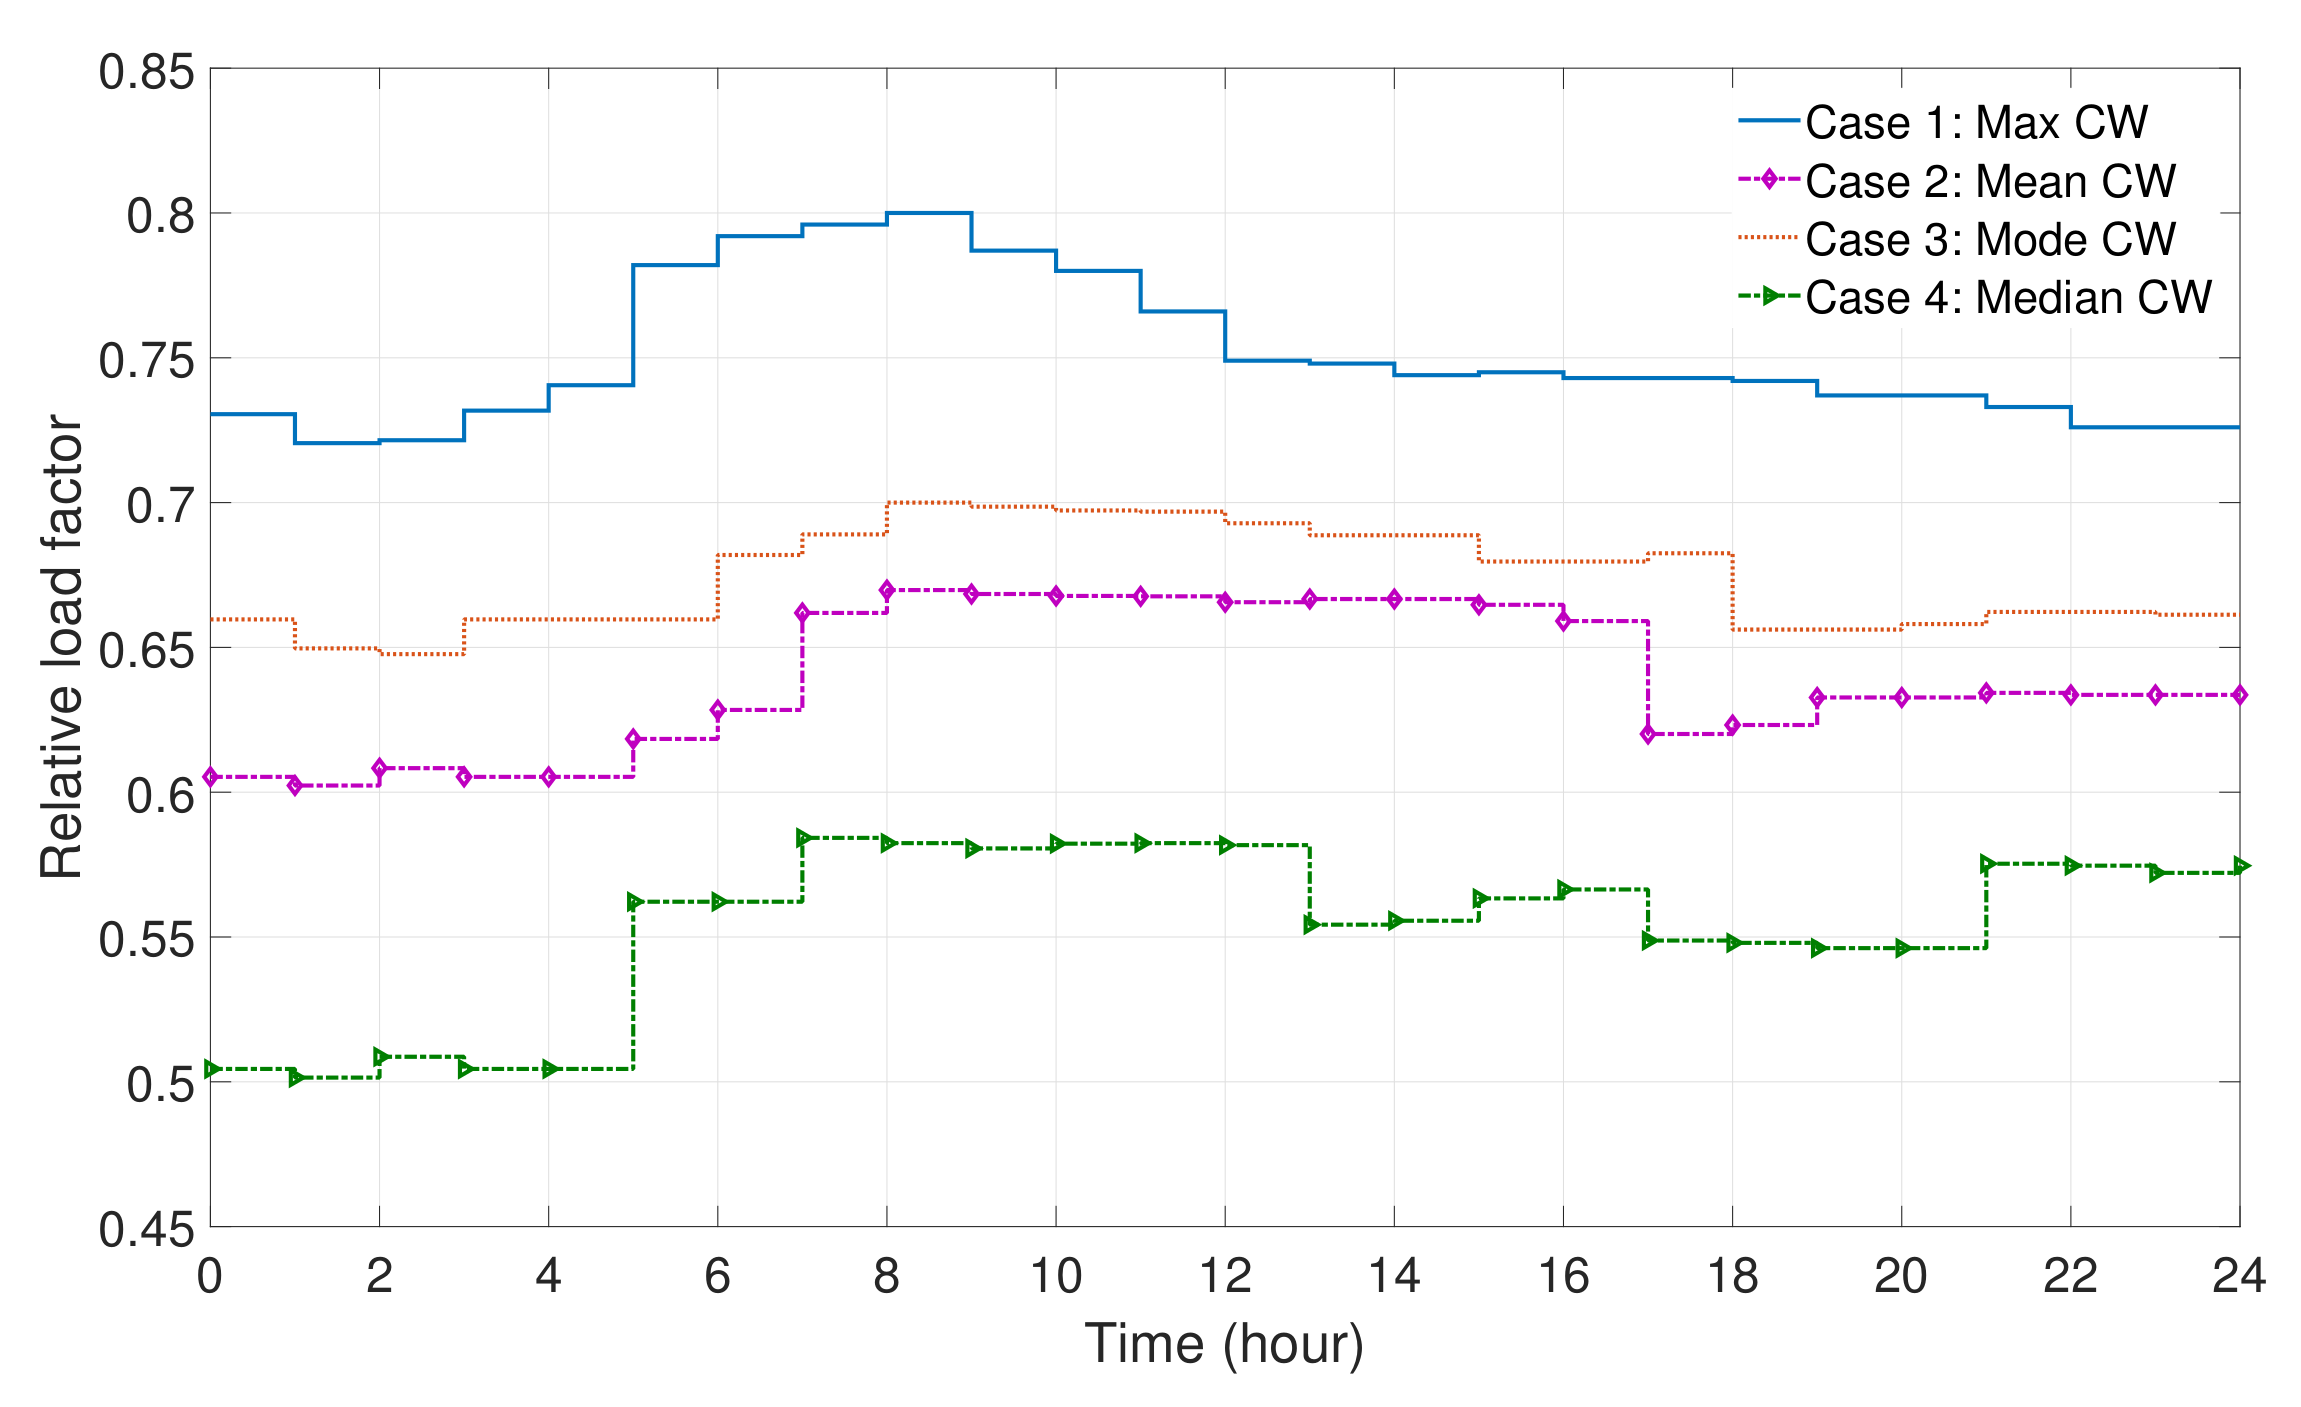
2.2. Scenarios
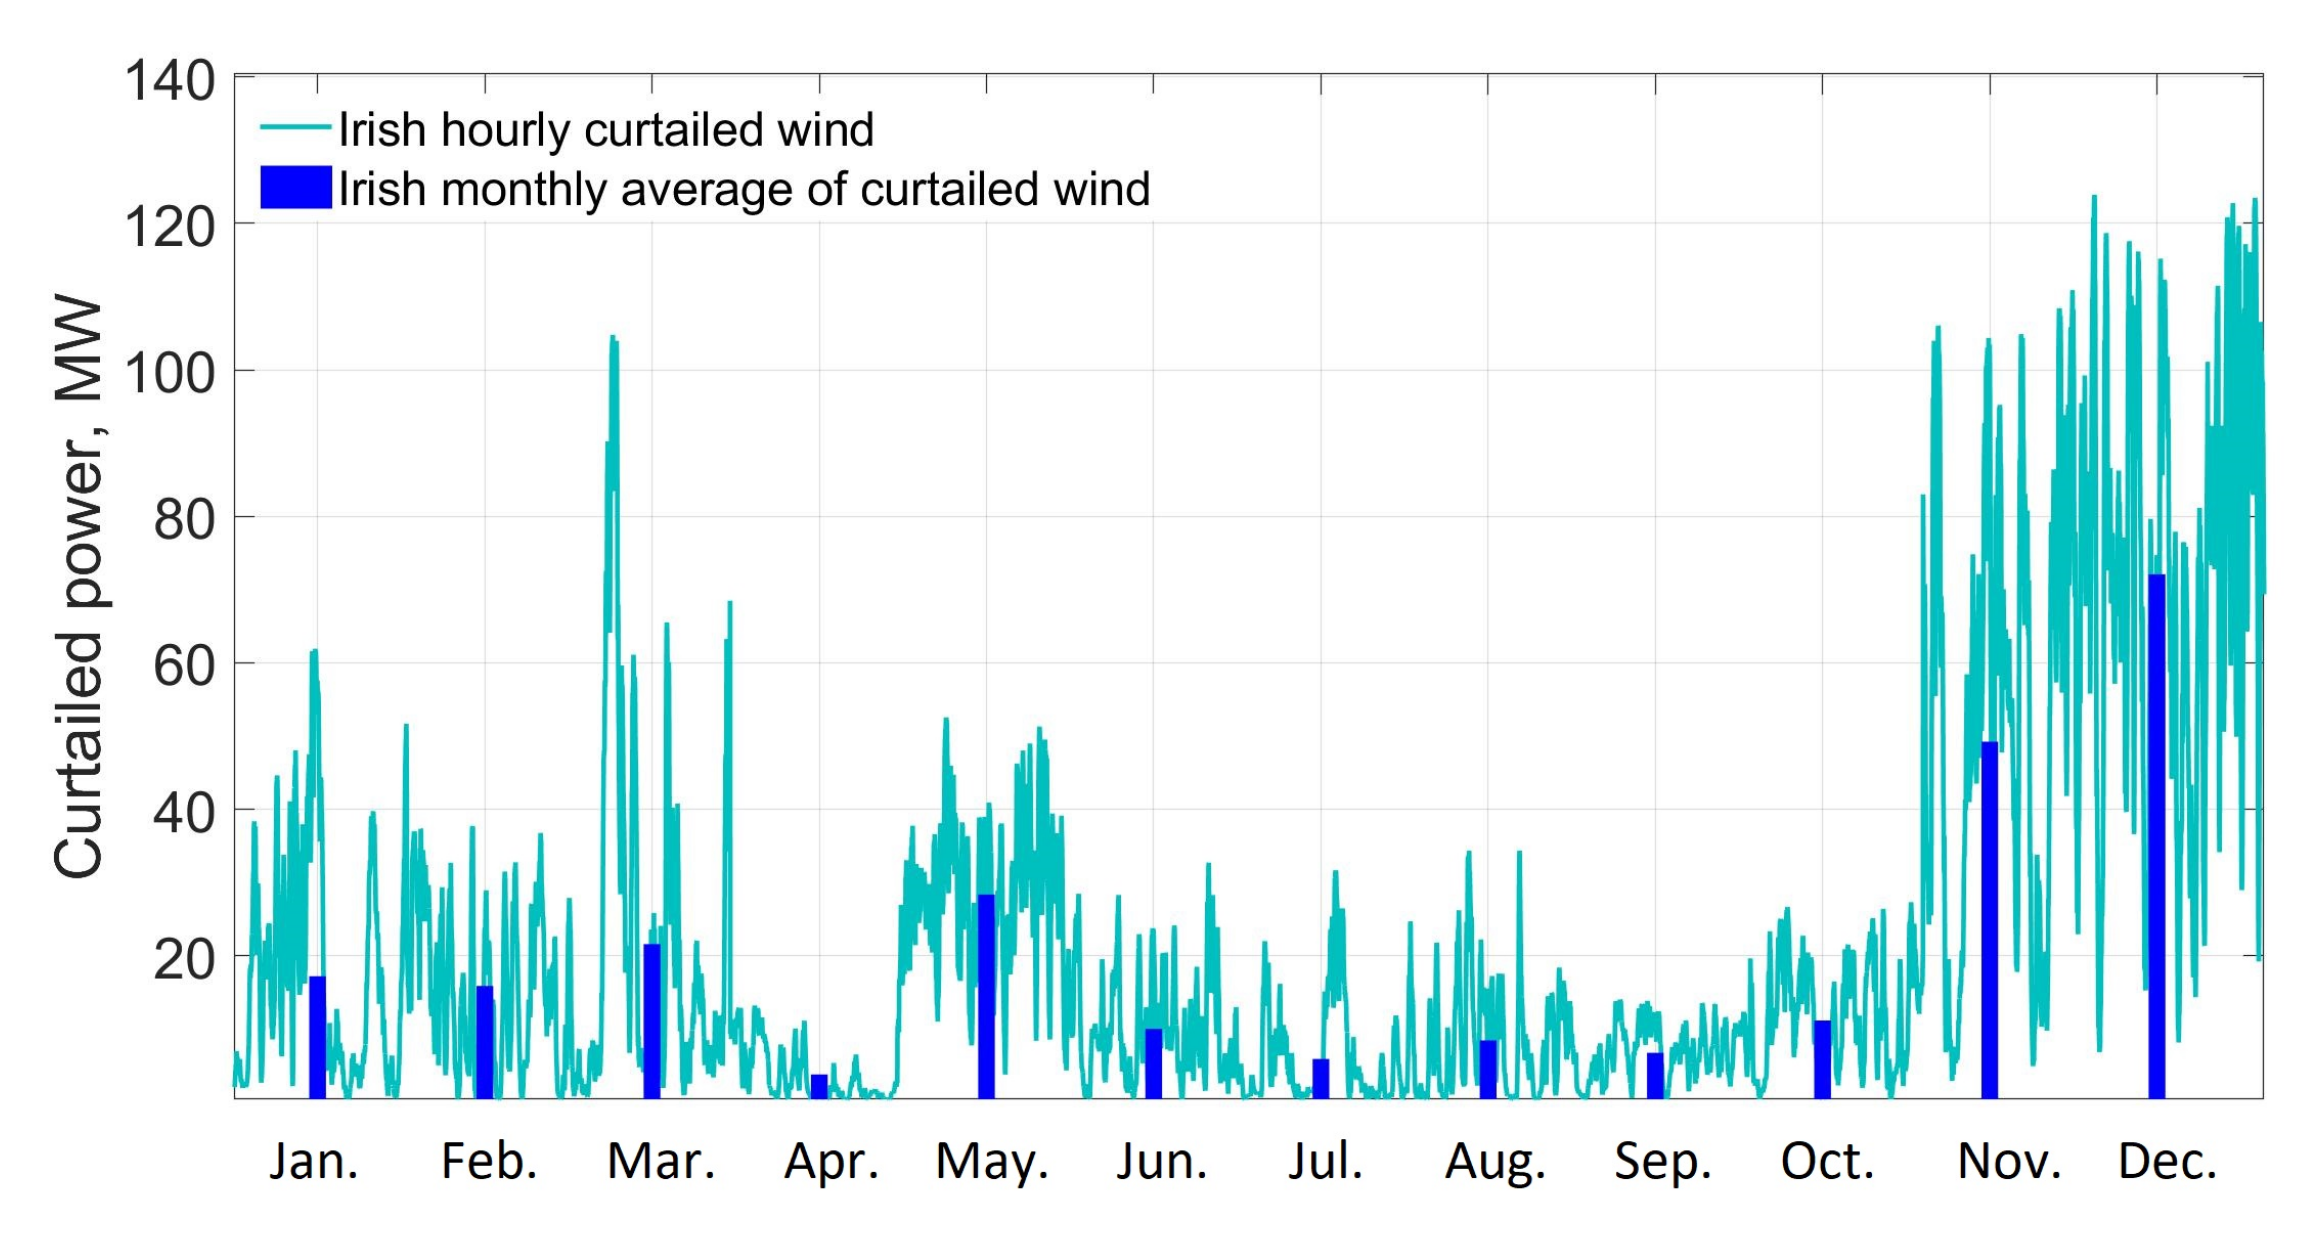
2.3. Gas Network and Wind Power Data
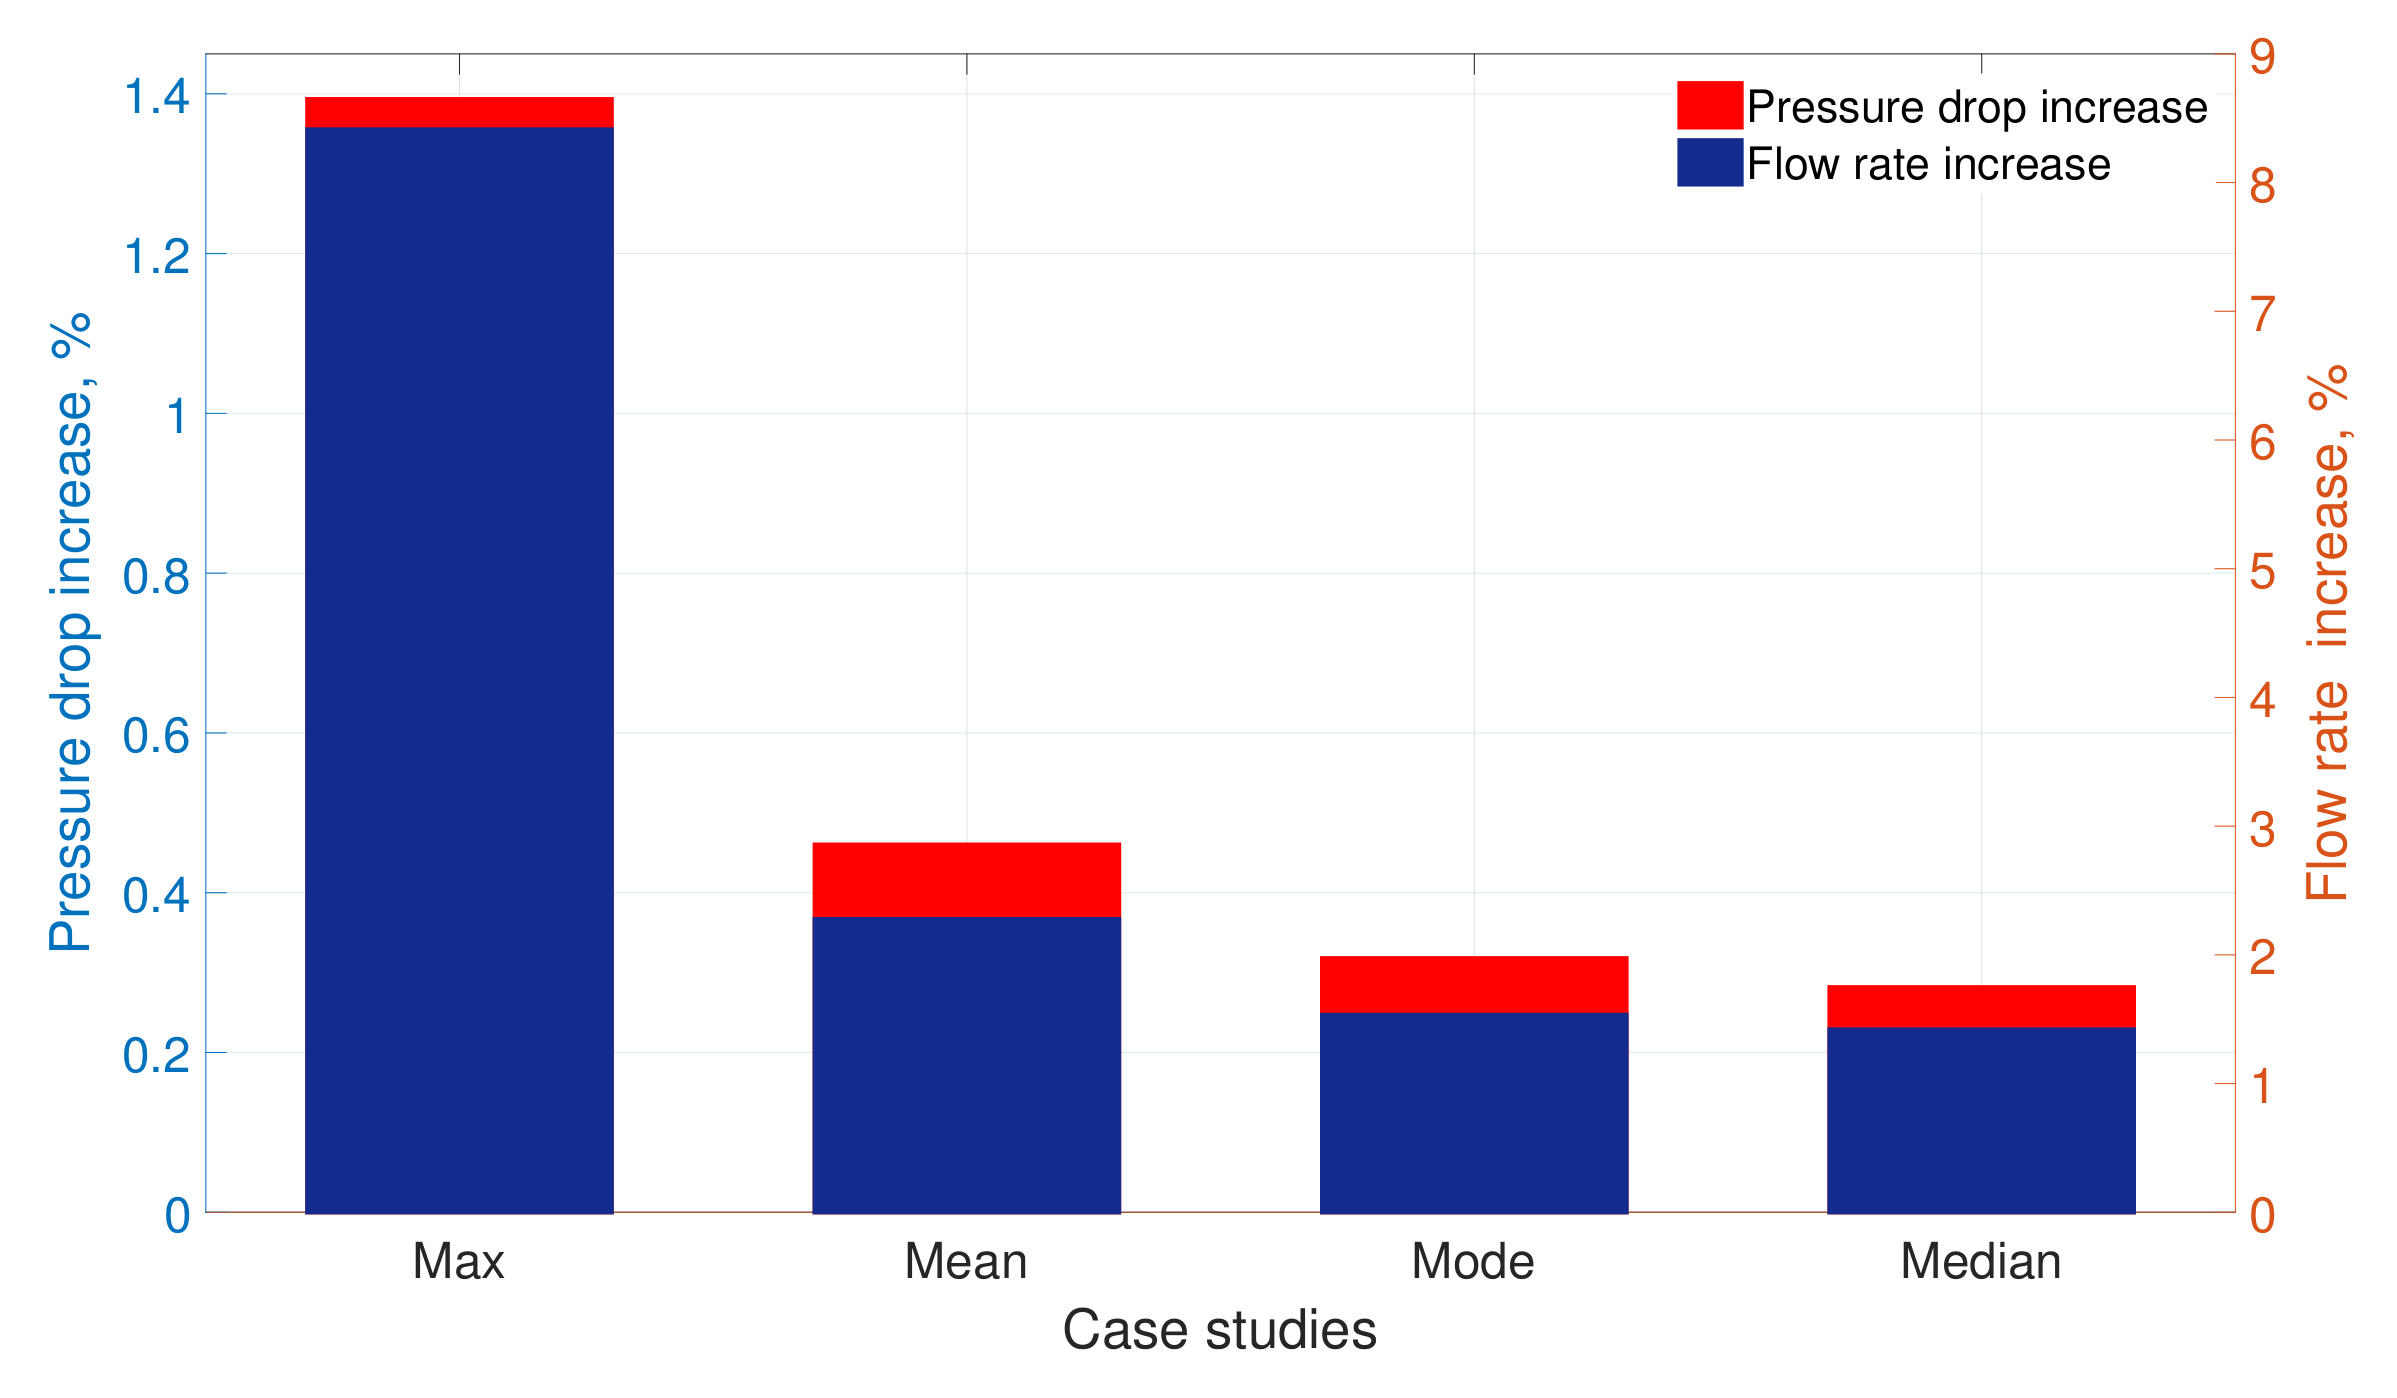
3. Simulation Results and Discussion
- Safety: since hydrogen is very flammable, the main concern is the potential for increased ignition and resulting damage compared to the risk posed by NG without blended hydrogen. In transmission networks, up to 20%, and in distribution pipelines, up to 50% has a minor risk
- Durability of pipes and facilities
- gas leakage from pipelines and connections
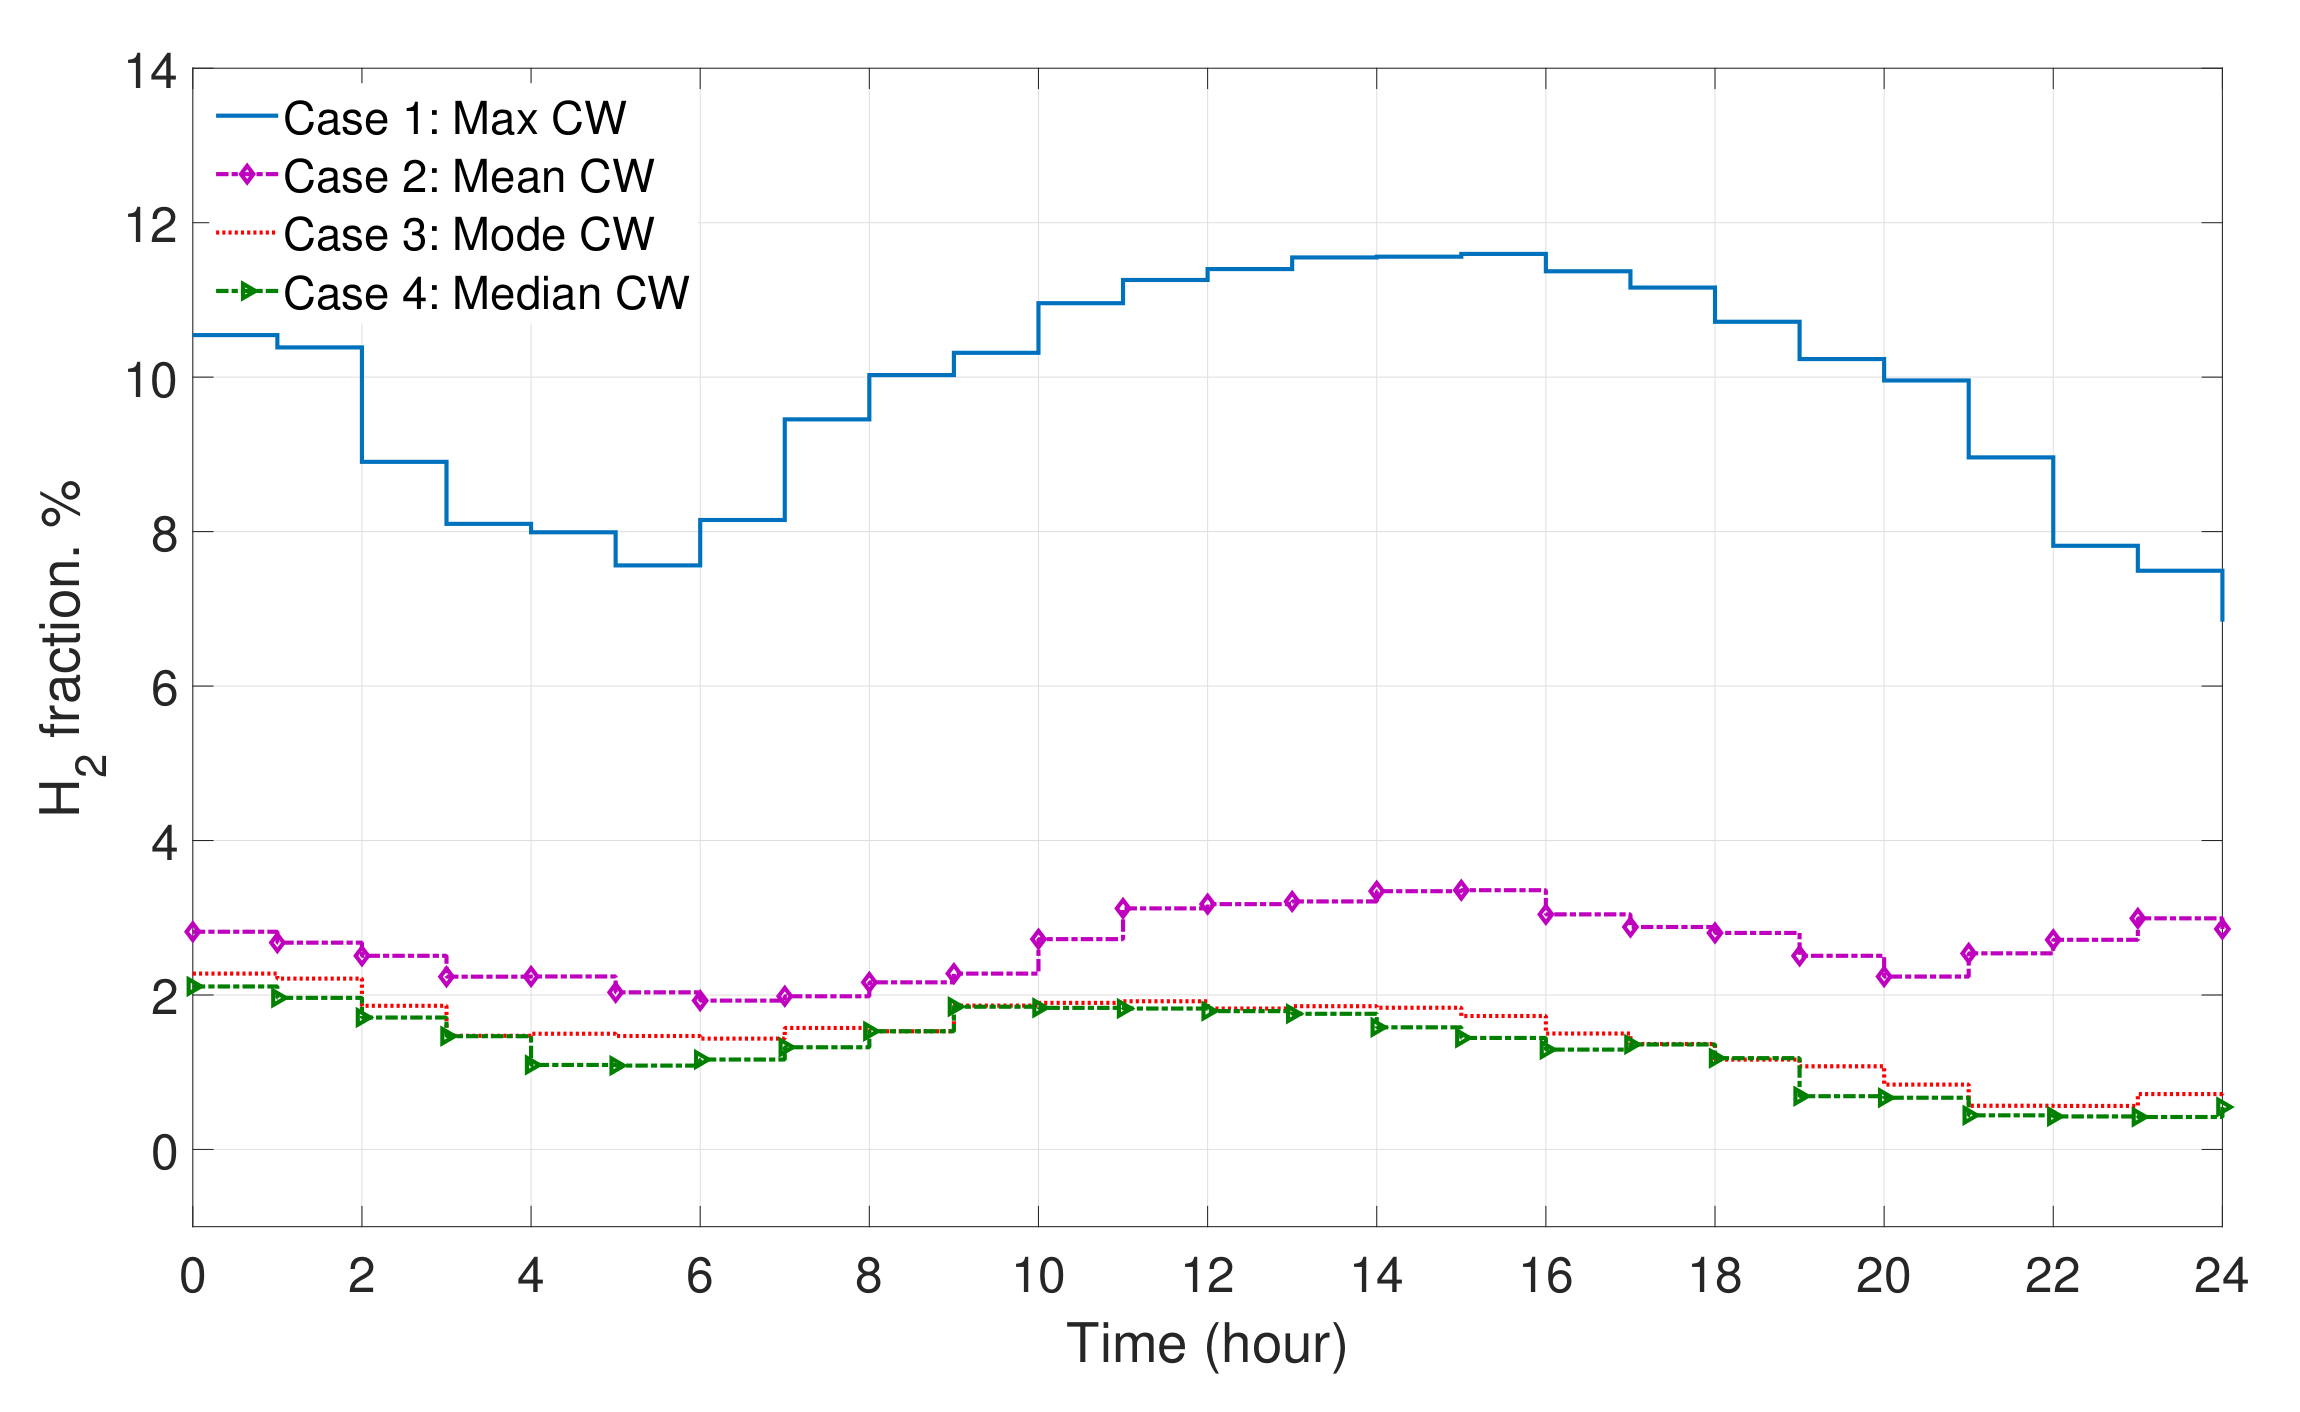
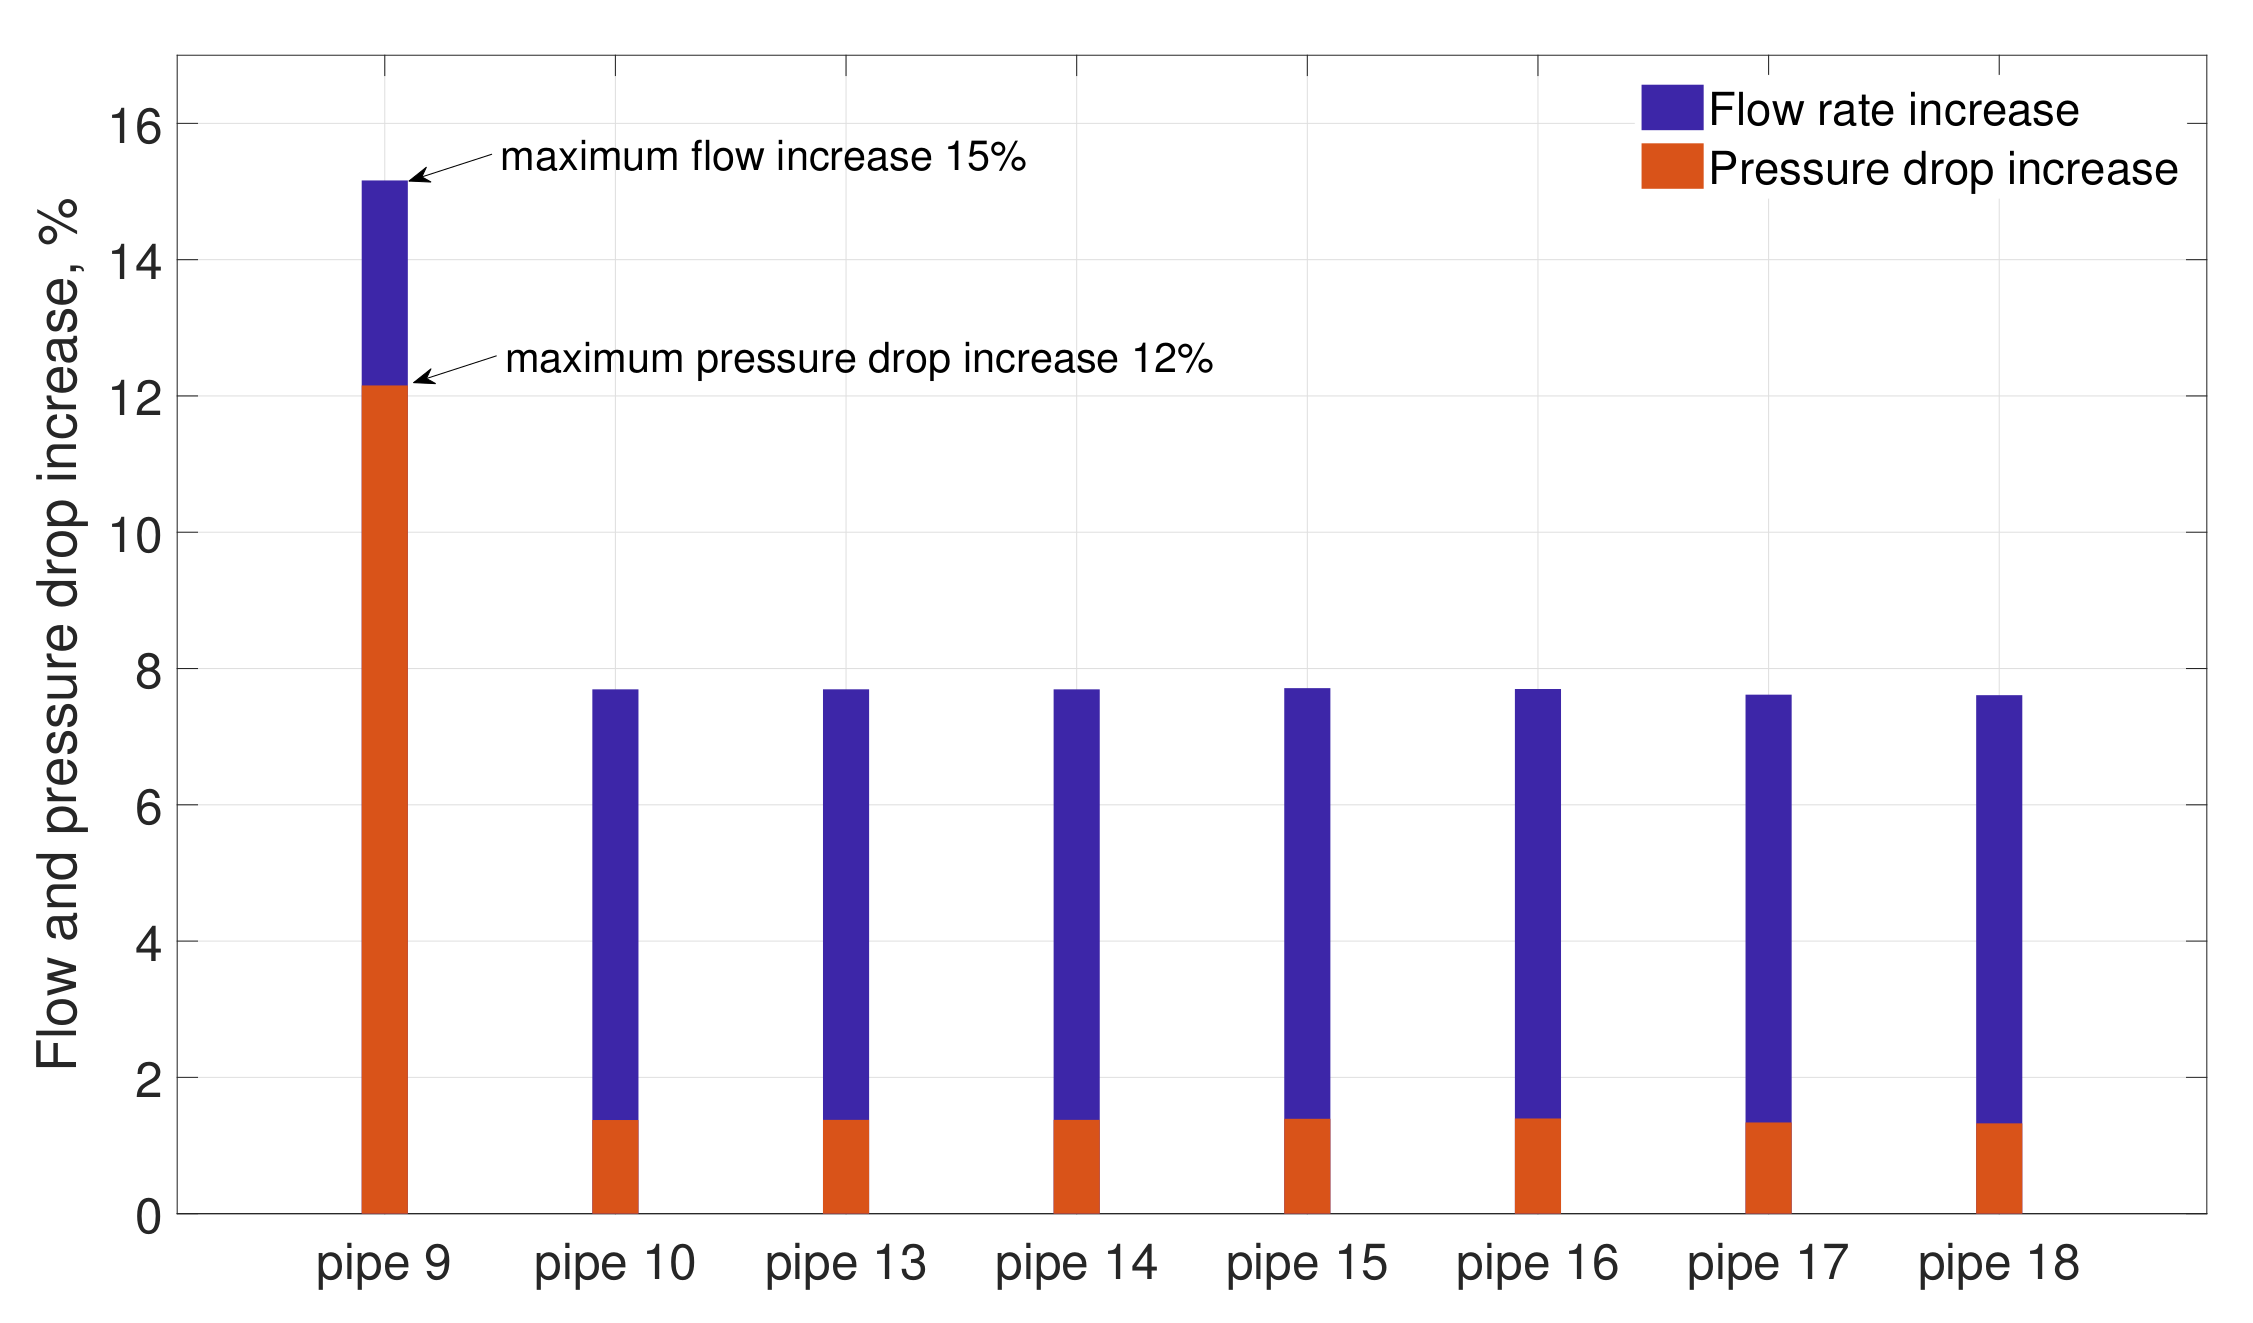
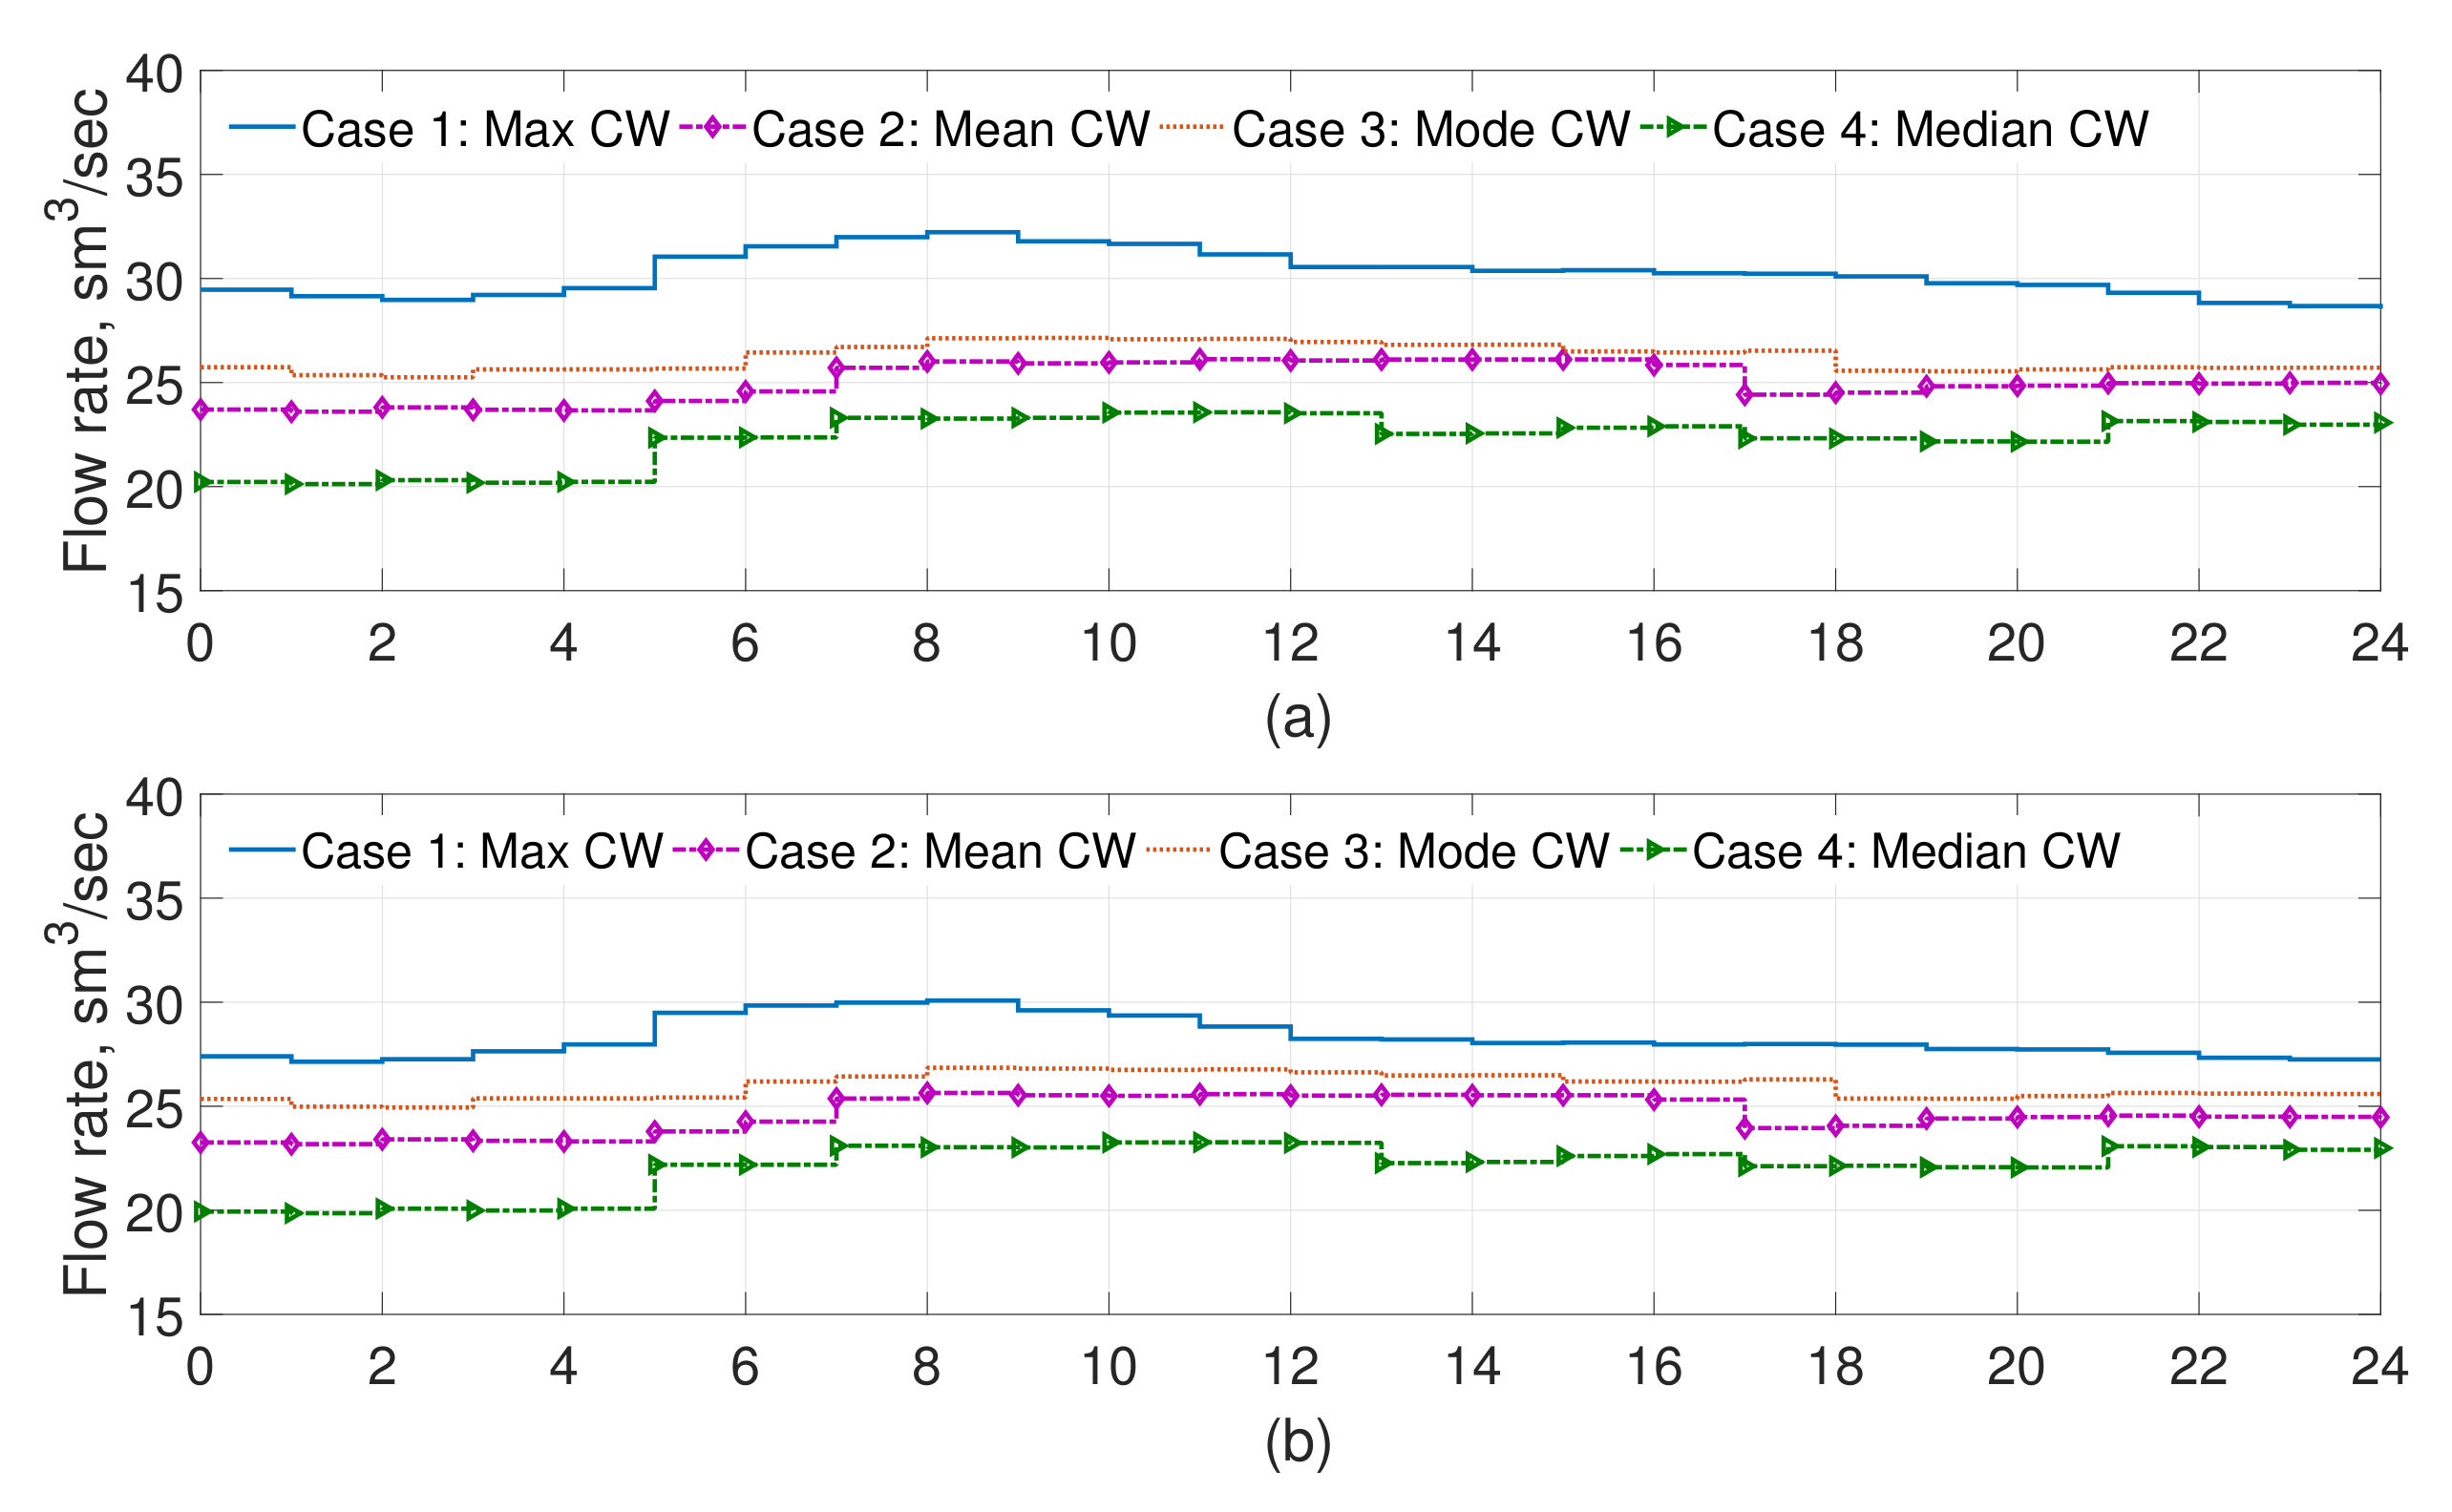
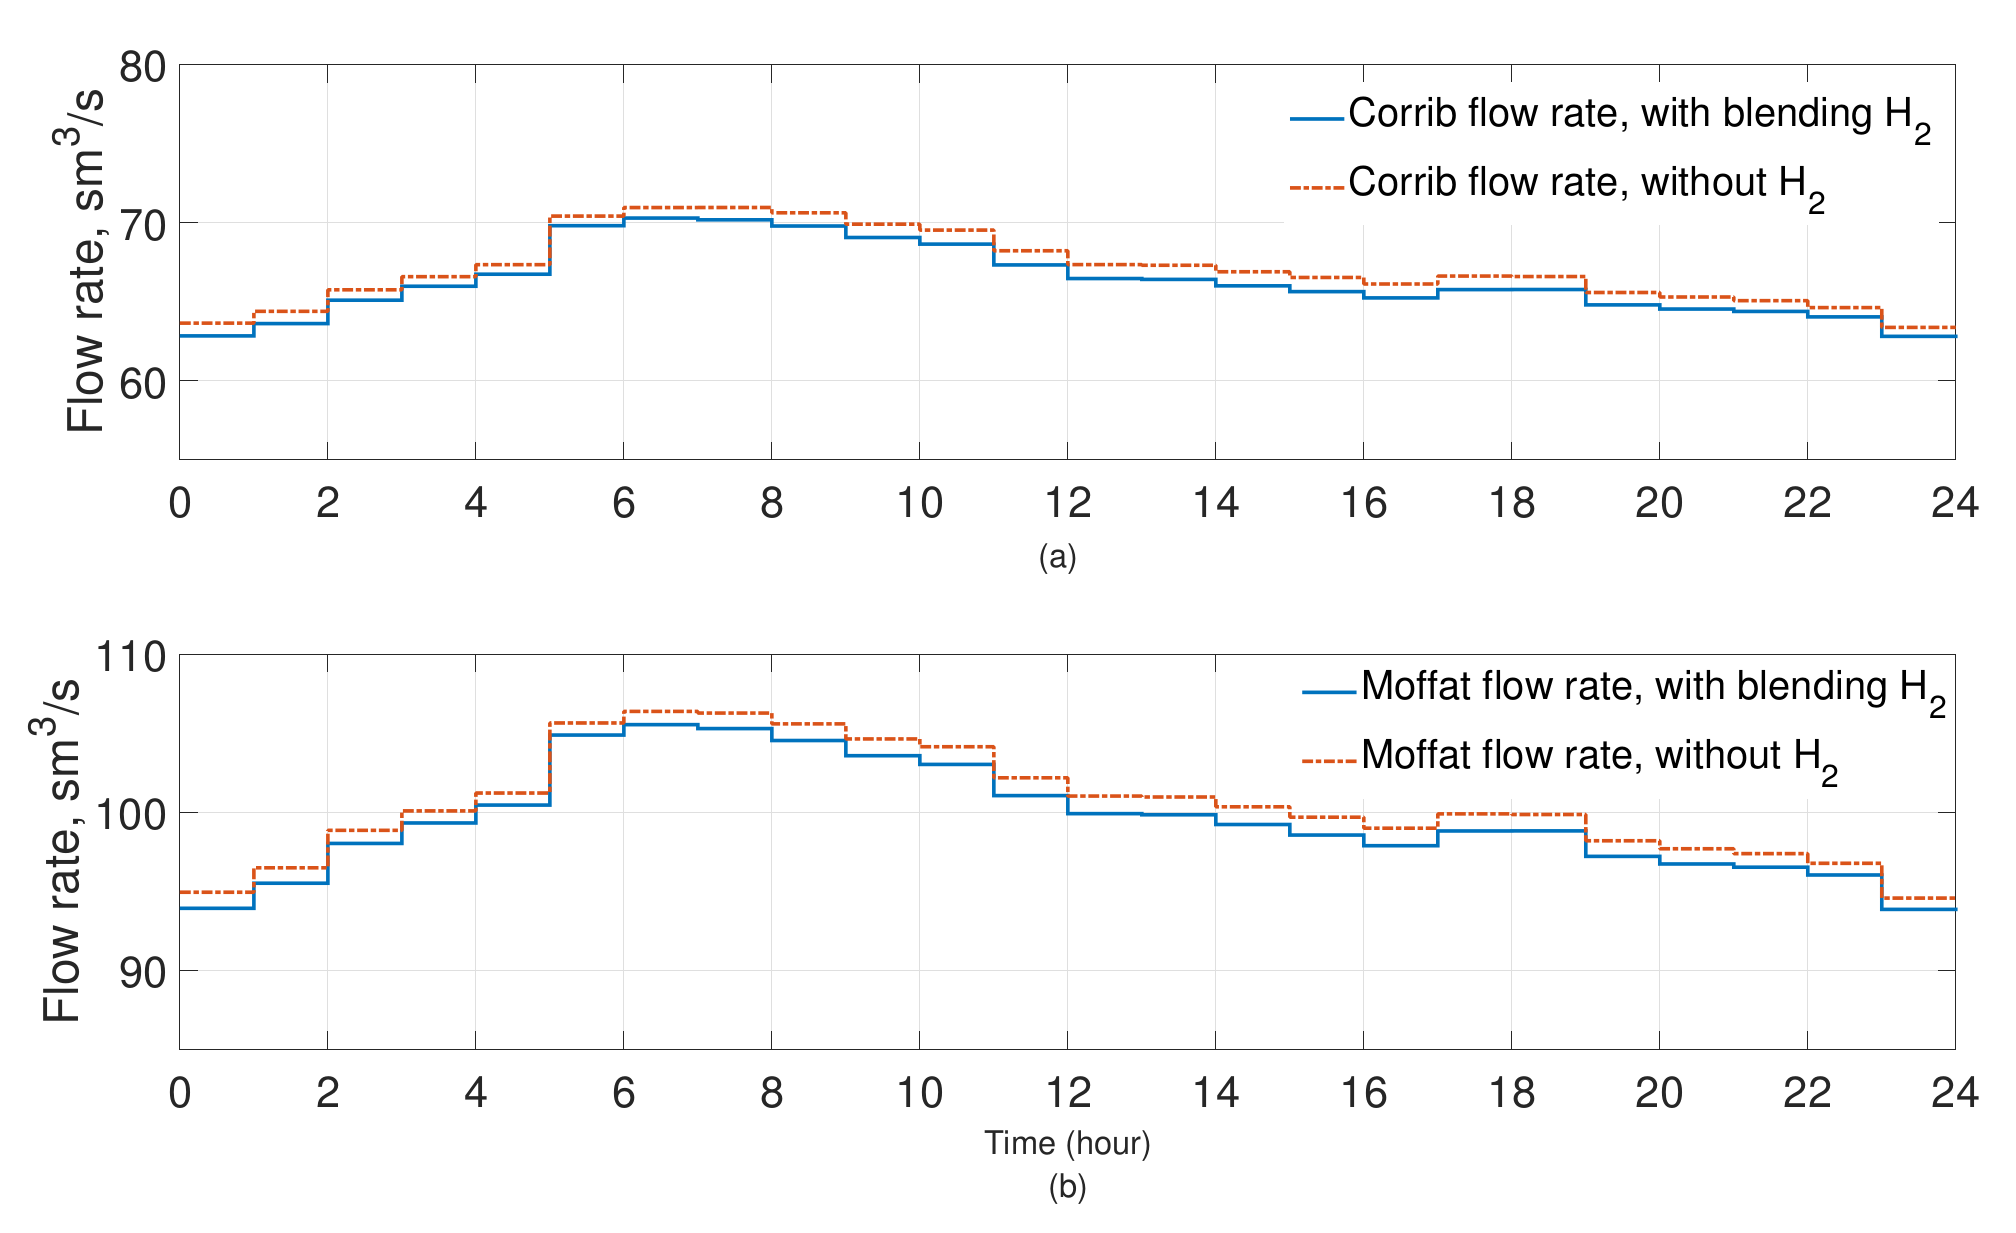
Operational Variable Changes
4. Conclusions
Author Contributions
Funding
Data Availability Statement
Conflicts of Interest
Abbreviations
| A | Cross Sectional area of pipe (m) |
| V | volume (m) |
| D | pipe inner diameter (m) |
| x | pipeline coordinate |
| E | Energy (J) |
| X | volumetric fraction of components |
| f | friction factor |
| f | theoretical friction factor |
| z | elevation (m) |
| g | gravitational acceleration (ms) |
| Z | compressibility factor |
| i | sender node |
| inclination (rad) | |
| j | receiver node |
| normal density (kg/m) | |
| set of nodal load (demand, ms) | |
| density (kg/m) | |
| set of pipe from the branch list | |
| shear stress (Pa) | |
| l | pipe length (m) |
| T | time span |
| set of natural gas compositions | |
| CW | Curtailed Wind |
| p | nodal pressure (Pa) |
| HHV | Higher Heating Value |
| p | critical pressure (Pa) |
| IC | Industrial/Commercial |
| p | pressure drop (Pa) |
| NG | Natural Gas |
| Q | flow rate (ms) |
| ODE | Ordinary Differential Equation |
| R | gas constant (kJ/kgoK) |
| P2G | Power-to-Gas |
| specific gravity (kg/m) | |
| P2H | Power-to-Hydrogen |
| T | Temperature (K) |
| PDE | Partial Differential Equation |
| T | Critical temperature (K) |
| PEM | Polymer electrolyte membrane |
Appendix A


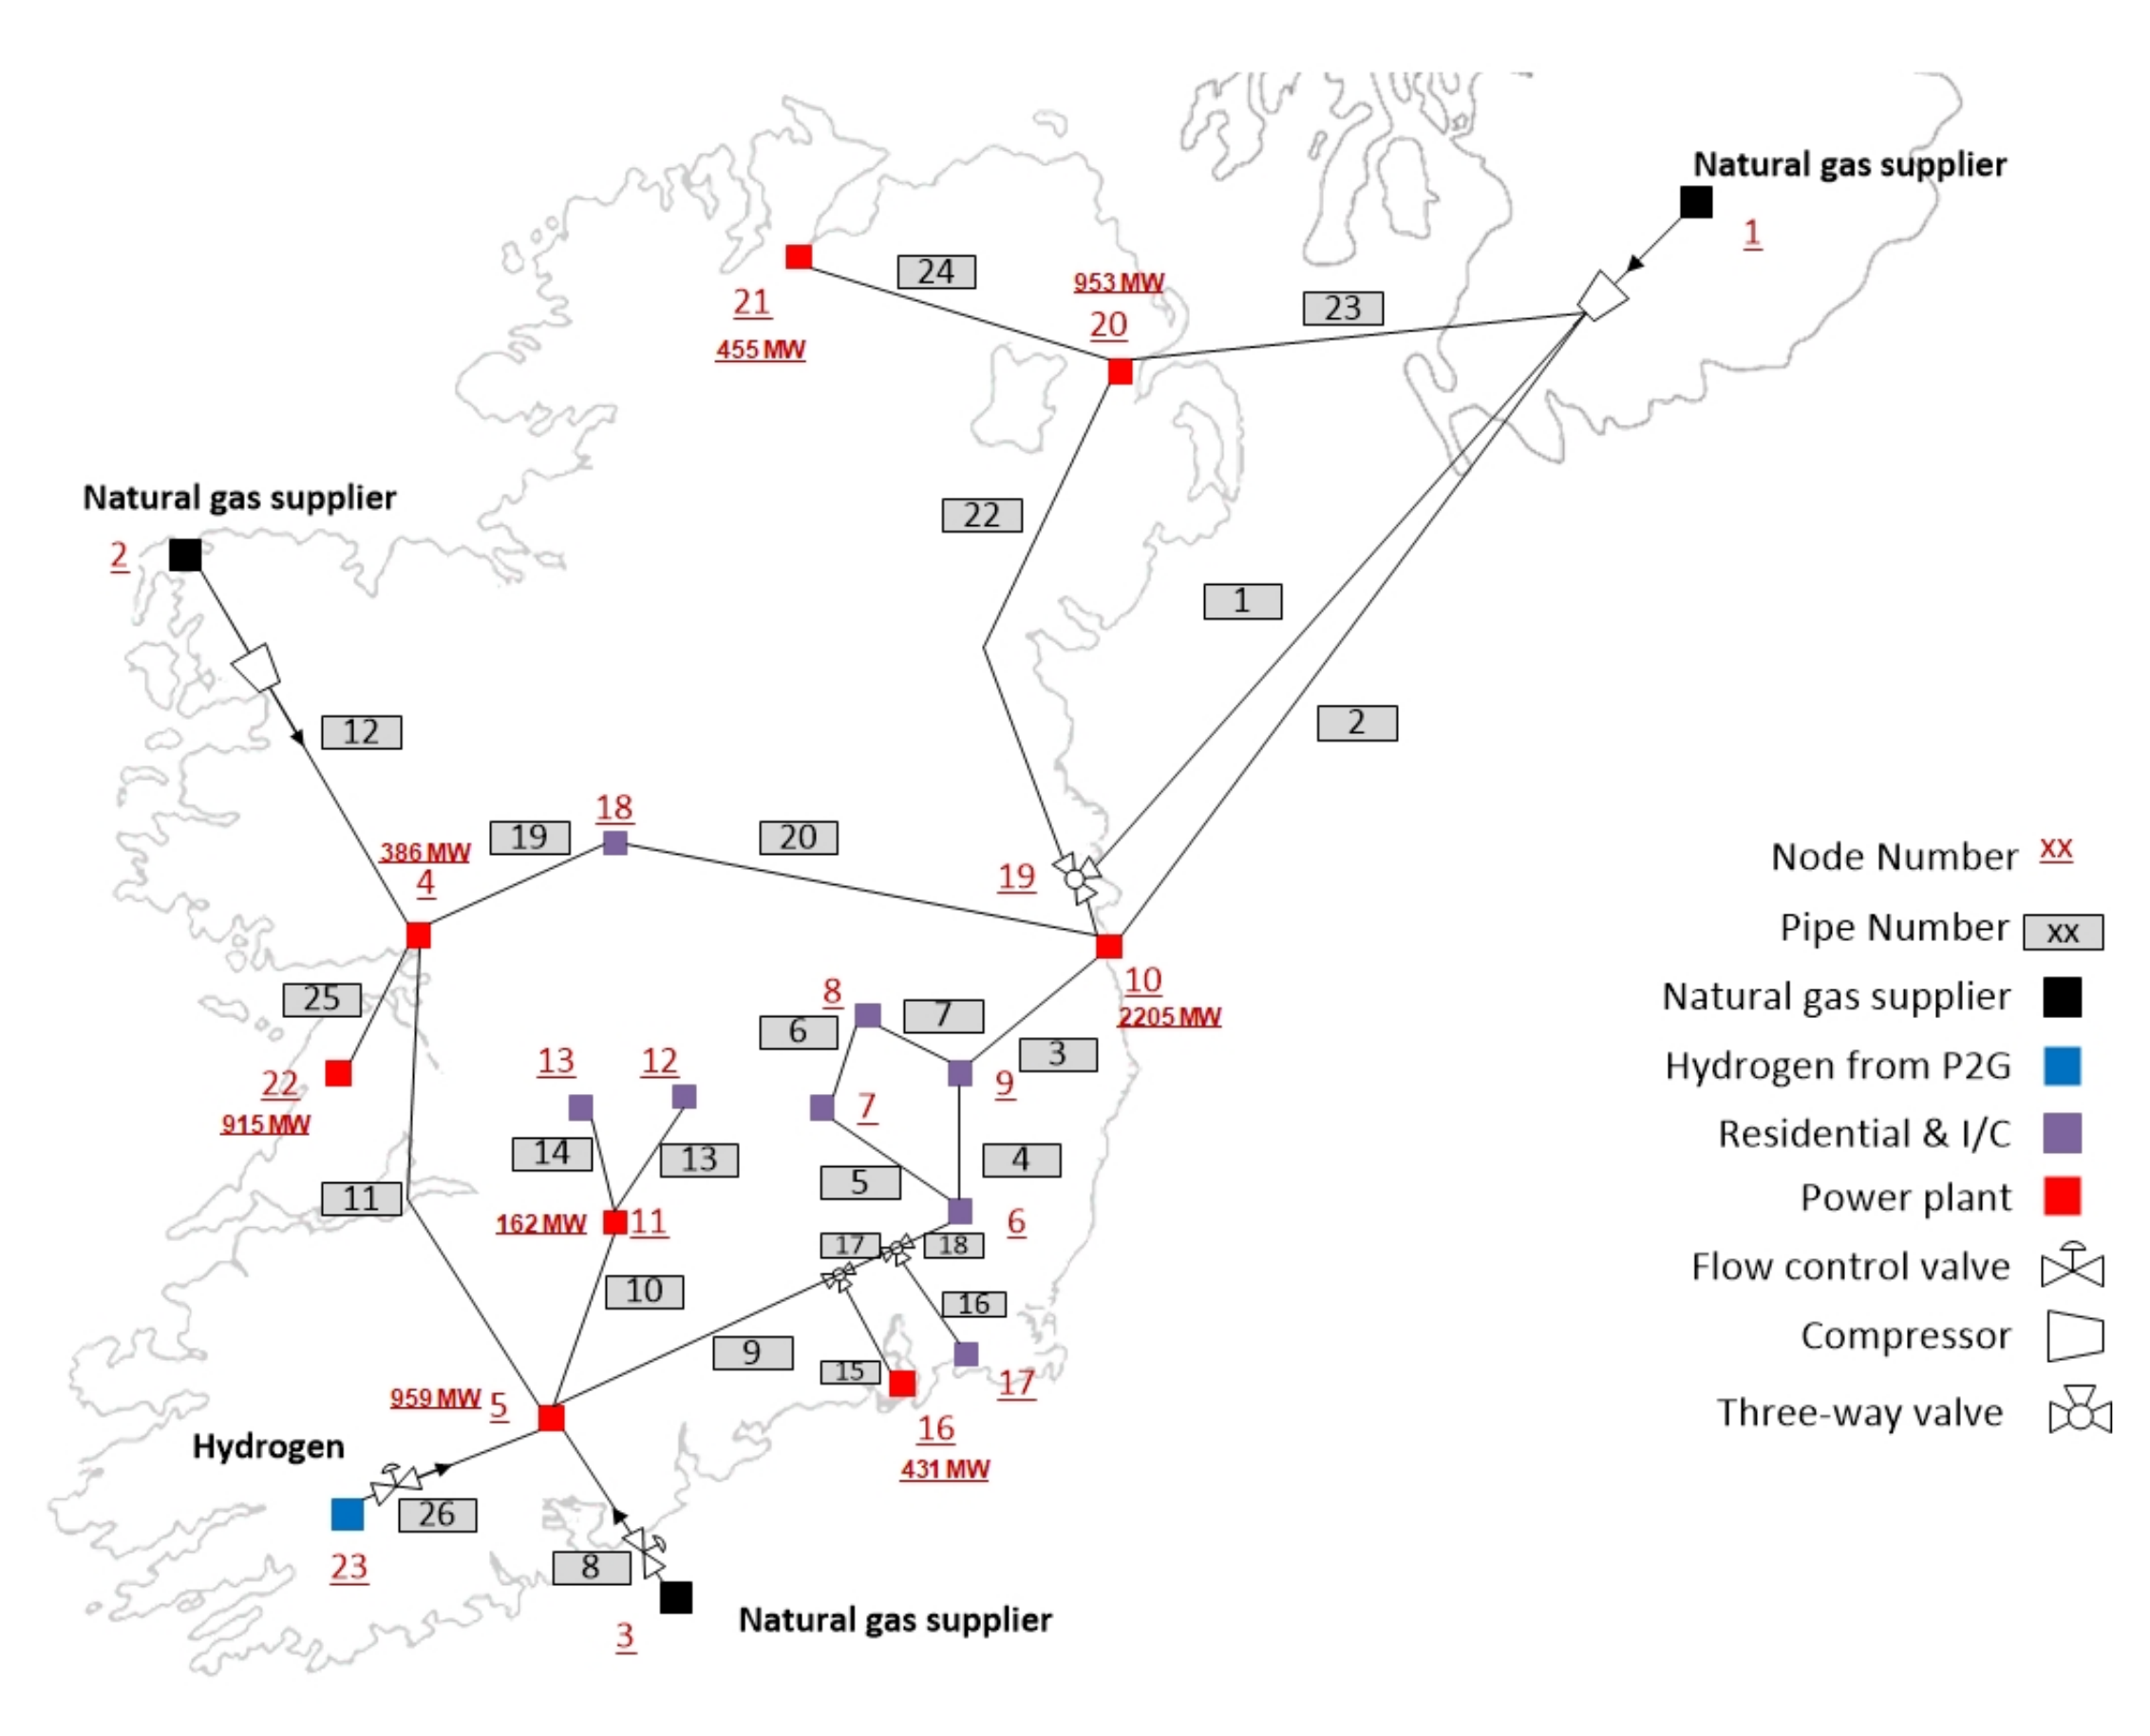
| Pipes | Nodes | |||||
|---|---|---|---|---|---|---|
| Pipe No. | Sender Node | Receiver Node | Diameter, m | Length, km | Node No. | Node Type |
| Pipe 1 | 1 | 19 | 0.76 | 280 | 1 | Supplier (NG) |
| Pipe 2 | 2 | 10 | 0.6 | 300 | 2 | Supplier (NG) |
| Pipe 3 | 3 | 9 | 0.6 | 70 | 3 | Supplier (NG) |
| Pipe 4 | 9 | 6 | 0.6 | 15 | 4 | Power plant |
| Pipe 5 | 7 | 6 | 0.6 | 15 | 5 | Power plant |
| Pipe 6 | 8 | 7 | 0.6 | 15 | 6 | Non-Power |
| Pipe 7 | 9 | 8 | 0.6 | 7 | 7 | Non-Power |
| Pipe 8 | 3 | 5 | 0.6 | 15 | 8 | Non-Power |
| Pipe 9 | 5 | 14 | 0.6 | 70 | 9 | Non-Power |
| Pipe 10 | 5 | 11 | 0.6 | 35 | 10 | Power plant |
| Pipe 11 | 4 | 5 | 0.6 | 130 | 11 | Power plant |
| Pipe 12 | 2 | 4 | 0.6 | 113 | 12 | Non-Power |
| Pipe 13 | 11 | 12 | 0.6 | 15 | 13 | Non-Power |
| Pipe 14 | 11 | 13 | 0.6 | 13 | 14 | Connector |
| Pipe 15 | 14 | 16 | 0.6 | 20 | 15 | Connector |
| Pipe 16 | 15 | 17 | 0.6 | 20 | 16 | Power plant |
| Pipe 17 | 14 | 15 | 0.6 | 30 | 17 | Non-Power |
| Pipe 18 | 15 | 6 | 0.6 | 30 | 18 | Non-Power |
| Pipe 19 | 4 | 18 | 0.6 | 100 | 19 | Connector |
| Pipe 20 | 18 | 10 | 0.6 | 65 | 20 | Power plant |
| Pipe 21 | 19 | 10 | 0.6 | 5 | 21 | Power plant |
| Pipe 22 | 20 | 19 | 0.6 | 160 | 22 | Power plant |
| Pipe 23 | 1 | 20 | 0.6 | 180 | 23 | P2H |
| Pipe 24 | 20 | 21 | 0.6 | 100 | ||
| Pipe 25 | 4 | 22 | 0.6 | 5 | ||
| Pipe 26 | 23 | 5 | 0.6 | 20 | ||
References
- Gautam, P.; Kumar, S.; Lokhandwala, S. Energy-Aware Intelligence in Megacities. In Current Developments in Biotechnology and Bioengineering; Elsevier: Amsterdam, The Netherlands, 2019; pp. 211–238. [Google Scholar]
- Smil, V. Energy in World History; Routledge: London, UK, 2019. [Google Scholar]
- MacKay, D. Sustainable Energy-Without the Hot Air; UIT Cambridge: Cambridge, UK, 2008. [Google Scholar]
- Hansen, A.B.; Nybroe, M.H. Future possibilities—The gas system as flexibility provider for wind power production. In Proceedings of the Power and Energy Society General Meeting, San Diego, CA, USA, 22–26 July 2012; pp. 1–8. [Google Scholar]
- Knezović, K.; Soroudi, A.; Keane, A.; Marinelli, M. Robust multi-objective PQ scheduling for electric vehicles in flexible unbalanced distribution grids. IET Gener. Transm. Distrib. 2017, 11, 4031–4040. [Google Scholar] [CrossRef] [Green Version]
- Ekhtiari, A.; Dassios, I.; Liu, M.; Syron, E. A Novel Approach to Model a Gas Network System. Appl. Sci. 2019, 9, 1047. [Google Scholar] [CrossRef] [Green Version]
- GasNetworksIreland. Delivering a Reliable and Secure Gas Supply. Gas Networks Ireland em. 2020. Available online: https://www.gasnetworks.ie/corporate/company/our-network/18048_GNI_GasNetwork_ReliabilityCapacity_Doc_Update.pdf.html (accessed on 23 August 2022).
- Pambour, K.A.; Cakir Erdener, B.; Bolado-Lavin, R.; Dijkema, G.P. Development of a simulation framework for analyzing security of supply in integrated gas and electric power systems. Appl. Sci. 2017, 7, 47. [Google Scholar] [CrossRef] [Green Version]
- Ekhtiari, A.; Syron, E. Moffat Constraints to supply Ireland’s Gas Network. Irel. Soc. Eng. 2018. Available online: https://www.engineersireland.ie/Brexit/irelands-future-natural-gas-supply-how-well-connected-is-the-island (accessed on 23 August 2022).
- Götz, M.; Lefebvre, J.; Mörs, F.; Koch, A.M.; Graf, F.; Bajohr, S.; Reimert, R.; Kolb, T. Renewable Power-to-Gas: A technological and economic review. Renew. Energy 2016, 85, 1371–1390. [Google Scholar] [CrossRef] [Green Version]
- Gahleitner, G. Hydrogen from renewable electricity: An international review of power-to-gas pilot plants for stationary applications. Int. J. Hydrogen Energy 2013, 38, 2039–2061. [Google Scholar] [CrossRef]
- Qadrdan, M.; Cheng, M.; Wu, J.; Jenkins, N. Benefits of demand-side response in combined gas and electricity networks. Appl. Energy 2017, 192, 360–369. [Google Scholar] [CrossRef] [Green Version]
- Portarapillo, M.; Di Benedetto, A. Risk Assessment of the Large-Scale Hydrogen Storage in Salt Caverns. Energies 2021, 14, 2856. [Google Scholar] [CrossRef]
- Gupta, R.B. Hydrogen Fuel: Production, Transport, and Storage; CRC Press: Boca Raton, FL, USA, 2008. [Google Scholar]
- Hafsi, Z.; Mishra, M.; Elaoud, S. Hydrogen embrittlement of steel pipelines during transients. Procedia Struct. Integr. 2018, 13, 210–217. [Google Scholar] [CrossRef]
- Ekhtiari, A. Academic Article: Ireland’s Decarbonisation Target, Green Hydrogen and End-Users’ Limits. Gas Networks Ireland em. 2022. Available online: https://www.gasnetworks.ie/corporate/news/active-news-articles/irelands-decarbonisation/ (accessed on 23 August 2022).
- Gondal, I.A. Hydrogen integration in power-to-gas networks. Int. J. Hydrogen Energy 2019, 44, 1803–1815. [Google Scholar] [CrossRef]
- Clegg, S.; Mancarella, P. Storing renewables in the gas network: Modelling of power-to-gas seasonal storage flexibility in low-carbon power systems. IET Gener. Transm. Distrib. 2016, 10, 566–575. [Google Scholar] [CrossRef]
- Qadrdan, M.; Abeysekera, M.; Chaudry, M.; Wu, J.; Jenkins, N. Role of power-to-gas in an integrated gas and electricity system in Great Britain. Int. J. Hydrogen Energy 2015, 40, 5763–5775. [Google Scholar] [CrossRef]
- Ameli, H.; Qadrdan, M.; Strbac, G. Techno-economic assessment of battery storage and Power-to-Gas: A whole-system approach. Energy Procedia 2017, 142, 841–848. [Google Scholar] [CrossRef]
- Afkousi-Paqaleh, M.; Rigoni, V.; Wilson, C.; Hewitt, N.; Flynn, D.; Keane, A. Network limits on residential heat pump capacity as an enabling technology towards renewables integration. In Proceedings of the The 9th Renewable Power Generation Conference (RPG Dublin Online 2021), Online, 1–2 March 2021; Volume 2021, pp. 265–270. [Google Scholar]
- Guandalini, G.; Robinius, M.; Grube, T.; Campanari, S.; Stolten, D. Long-term power-to-gas potential from wind and solar power: A country analysis for Italy. Int. J. Hydrogen Energy 2017, 42, 13389–13406. [Google Scholar] [CrossRef]
- Yang, L.; Zhao, X.; Li, X.; Feng, X.; Yan, W. An MILP-Based Optimal Power and Gas Flow in Electricity-gas Coupled Networks. Energy Procedia 2019, 158, 6399–6404. [Google Scholar] [CrossRef]
- Qadrdan, M.; Fazeli, R.; Jenkins, N.; Strbac, G.; Sansom, R. Gas and electricity supply implications of decarbonising heat sector in GB. Energy 2019, 169, 50–60. [Google Scholar] [CrossRef]
- Khalilpour, K.R. Interconnected Electricity and Natural Gas Supply Chains: The Roles of Power to Gas and Gas to Power. In Polygeneration with Polystorage for Chemical and Energy Hubs; Elsevier: Amsterdam, The Netherlands, 2019; pp. 133–155. [Google Scholar]
- Ordoudis, C.; Pinson, P.; Morales, J.M. An integrated market for electricity and natural gas systems with stochastic power producers. Eur. J. Oper. Res. 2019, 272, 642–654. [Google Scholar] [CrossRef] [Green Version]
- Nasrolahpour, E.; Kazempour, J.; Zareipour, H.; Rosehart, W.D. A bilevel model for participation of a storage system in energy and reserve markets. IEEE Trans. Sustain. Energy 2017, 9, 582–598. [Google Scholar] [CrossRef] [Green Version]
- Clegg, S.; Mancarella, P. Integrated modeling and assessment of the operational impact of power-to-gas (P2G) on electrical and gas transmission networks. IEEE Trans. Sustain. Energy 2015, 6, 1234–1244. [Google Scholar] [CrossRef]
- Ozturk, M.; Dincer, I. System development and assessment for green hydrogen generation and blending with natural gas. Energy 2022, 261, 125233. [Google Scholar] [CrossRef]
- Smith, C.; Mouli-Castillo, J.; Van Der Horst, D.; Haszeldine, S.; Lane, M. Towards a 100% hydrogen domestic gas network: Regulatory and commercial barriers to the first demonstrator project in the United Kingdom. Int. J. Hydrogen Energy 2022, 47, 23071–23083. [Google Scholar] [CrossRef]
- Eirgrid. Annual Renewable Energy Constraint and Curtailment. 2020. Available online: https://www.eirgridgroup.com/site-files/library/EirGrid/Annual-Renewable-Constraint-and-Curtailment-Report-2020.pdf (accessed on 23 August 2022).
- Ekhtiari, A.; Flynn, D.; Syron, E. Gas Network, Storing Energy and Renewable Power Penetration. In Proceedings of the 22nd Conference on Process Integration. Modelling, and Optimisation for Energy Saving and Pollution Reduction, PRES’19, Crete, Greece, 20–23 October 2019; pp. 1–6. [Google Scholar]
- Osiadacz, A. Simulation and Analysis of Gas Networks; Gulf Publishing Company: Houston, TX, USA, 1987. [Google Scholar]
- Ekhtiari, A.; Flynn, D.; Syron, E. Investigation of the Multi-Point Injection of Green Hydrogen from Curtailed Renewable Power into a Gas Network. Energies 2020, 13, 6047. [Google Scholar] [CrossRef]
- Pambour, K.A.; Bolado-Lavin, R.; Dijkema, G.P. An integrated transient model for simulating the operation of natural gas transport systems. J. Nat. Gas Sci. Eng. 2016, 28, 672–690. [Google Scholar] [CrossRef]
- Heidaryan, E.; Salarabadi, A.; Moghadasi, J. A novel correlation approach for prediction of natural gas compressibility factor. J. Nat. Gas Chem. 2010, 19, 189–192. [Google Scholar] [CrossRef]
- Parra, D.; Zhang, X.; Bauer, C.; Patel, M.K. An integrated techno-economic and life cycle environmental assessment of power-to-gas systems. Appl. Energy 2017, 193, 440–454. [Google Scholar] [CrossRef]
- Abdon, A.; Zhang, X.; Parra, D.; Patel, M.K.; Bauer, C.; Worlitschek, J. Techno-economic and environmental assessment of stationary electricity storage technologies for different time scales. Energy 2017, 139, 1173–1187. [Google Scholar] [CrossRef]
- Hafsi, Z.; Ekhtiari, A.; Ayed, L.; Elaoud, S. The linearization method for transient gas flows in pipeline systems revisited: Capabilities and limitations of the modelling approach. J. Nat. Gas Sci. Eng. 2022, 101, 104494. [Google Scholar] [CrossRef]


| Composition | Concentration (by Volume), % | Density, kg/m | HHV, MJ/kg |
|---|---|---|---|
| C_1 | 93.94 | 0.67 | 55.50 |
| C_2 | 4.2 | 1.038 | 51.90 |
| C_3 | 0.3 | 1.522 | 50.40 |
| i-C_4 | 0.03 | 2.50 | 49.10 |
| n-C_4 | 0.03 | 2.50 | 49.10 |
| N_2 | 1 | 0.966 | - |
| CO_2 | 0.5 | 1.977 | - |
Publisher’s Note: MDPI stays neutral with regard to jurisdictional claims in published maps and institutional affiliations. |
© 2022 by the authors. Licensee MDPI, Basel, Switzerland. This article is an open access article distributed under the terms and conditions of the Creative Commons Attribution (CC BY) license (https://creativecommons.org/licenses/by/4.0/).
Share and Cite
Ekhtiari, A.; Flynn, D.; Syron, E. Green Hydrogen Blends with Natural Gas and Its Impact on the Gas Network. Hydrogen 2022, 3, 402-417. https://doi.org/10.3390/hydrogen3040025
Ekhtiari A, Flynn D, Syron E. Green Hydrogen Blends with Natural Gas and Its Impact on the Gas Network. Hydrogen. 2022; 3(4):402-417. https://doi.org/10.3390/hydrogen3040025
Chicago/Turabian StyleEkhtiari, Ali, Damian Flynn, and Eoin Syron. 2022. "Green Hydrogen Blends with Natural Gas and Its Impact on the Gas Network" Hydrogen 3, no. 4: 402-417. https://doi.org/10.3390/hydrogen3040025