Article

First Hydrogenation of TiFe with Addition of 20 wt.% Ti

by
Elena Ulate-Kolitsky
1,2,*,
Bernard Tougas
1 and
Jacques Huot
2,*
1
Centre de Métallurgie du Québec, Trois-Rivières, QC G9A 5E1, Canada
2
Hydrogen Research Institute, Université du Québec à Trois-Rivières, Trois-Rivières, QC G8Z 4M3, Canada
*
Authors to whom correspondence should be addressed.
Hydrogen 2022, 3(4), 379-388; https://doi.org/10.3390/hydrogen3040023
Submission received: 25 July 2022 / Revised: 26 August 2022 / Accepted: 16 September 2022 / Published: 21 September 2022
(This article belongs to the Special Issue Hydrogen Energy Technologies)

Abstract

:
In this paper, we report the first hydrogenation (activation) of a 1.2Ti-0.8Fe alloy synthesized by induction melting (9 kg ingot). The alloy presented a three-phase structure composed of a main TiFe phase, a secondary Ti2Fe phase and a Ti-rich BCC phase. The alloy required cold rolling to achieve activation at room temperature. However, it did so with good kinetics, reaching saturation (2.6 wt.% H) in about 6 h. After activation, the phases identified were TiFe, Ti2FeHx and an FCC phase. The Ti2FeHx and FCC are the stable hydrides formed by the secondary Ti2Fe and BCC phases, respectively. The stoichiometry of the Ti2FeHx was calculated to be between x = 3.2–4.75. As the microstructure obtained by an industrial-scale synthesis method (induction melting) may be different than the one obtained by laboratory-scale method (arc melting), a small 3 g sample of Ti1.2Fe0.8 was synthesized by arc melting. The lab-scale sample activated (2 wt.% H in ~12 h) without the need for cold rolling. The phases identified for the lab-scale sample matched those found for the induction-melted sample. The phase fractions differed between the samples; the lab-scale sample presented a lower abundance and a finer distribution of the secondary phases. This explains the difference in the kinetics and H capacity. Based on these results it can be concluded that the alloy of composition, 1.2Ti-0.8Fe, can absorb hydrogen without the need for a heat treatment, and that finer microstructures have a strong influence on the activation kinetics regardless of the secondary phases’ phase fractions.

1. Introduction

TiFe is a hydride-forming alloy with great potential for hydrogen storage applications due to its low-cost and mild operation conditions (low pressure and ambient temperature) [1,2]. However, TiFe is highly sensitive to air and forms a passivation layer that inhibits its activation. Generally, pure TiFe requires an activation heat treatment to improve its first hydrogenation kinetics. This activation heat treatment requires cycling between a high temperature and room temperature under high hydrogen pressure [3]. The focus of TiFe research is the improvement of the first hydrogenation kinetics by different approaches that will ultimately eliminate the need for an activation heat treatment. For example, the use of mechanical processing techniques (ball milling, cold rolling, high-pressure torsion) [4,5,6,7,8,9,10,11,12] and/or the addition of alloying elements [13,14,15,16,17,18,19,20] have both shown to improve the kinetics.
Several studies have reported the improvement of activation kinetics by alloying TiFe with Zr [21,22,23,24] and Zr-Mn [8,25,26,27]. These studies report the formation of TiFe, Ti-rich (BCC/β), TiFe2 and a Ti2Fe-like phase. However only TiFe, Ti-rich (BCC/β) and TiFe2 are equilibrium phases. The β-Ti phase is a high temperature phase which can be present at room temperature due to the presence of Fe and/or Zr, which are β stabilizers [28,29,30]. Regarding the Ti2Fe phase, little is known because of its difficulty being synthesized. According to the Ti-Fe phase diagram, when ≥50 wt.% of Ti is added, there should be Ti precipitates. Ti2Fe was first described by Dong et al. [31] as having the structure type of Ti2Ni. However, it is currently not mentioned in the ASM Phase Diagram Handbook [32]. Reilly et al. [3] were the first to try to obtain Ti2Fe to study its hydrogen absorption capabilities. However, after synthesizing the stoichiometric Ti2Fe (63Ti-37Fe) and annealing it at 1000 K, their attempt failed, and they were only able to obtain the equilibrium TiFe and Ti phases.
More recently, Park et al. synthesized a Ti1.2Fe alloy (60% Ti–40% Fe) by arc-melting [33] and annealed it at 1470 K, reporting three phases: TiFe (92%), Ti4Fe BCC (Body Centered Cubic) (5%) and Ti2Fe (3%). The Ti1.2Fe alloy activated at low pressure and room temperature reached 2.1 wt.% H in 6 h. One conclusion of their work was that the kinetics improvement was due to the formation of the Ti2Fe and Ti4Fe(BCC) phases. Other studies have reported how the TiFe alloy activates as the Ti concentration in the oxide layer increases during the thermal activation process [34]. The Ti-rich oxide has higher reactivity with hydrogen, enhancing the decomposition of hydrogen molecules on the surface oxide of the alloy and, therefore, the hydrogen adsorption kinetics [18,35]. Park et al. studied the composition of each phase present in the Ti1.2Fe0 alloy (TiFe, Ti4FeBCC, Ti2Fe). Each phase’s composition was synthesized separately to study each of their oxide layers. However, they only succeeded in synthesizing single-phased TiFe and Ti4Fe(BCC). They claimed that a higher Ti concentration of surface oxide on the Ti4Fe(BCC) alloy than on the TiFe alloy was able to trigger and improve the hydrogen absorption kinetics [33].
The effects of substitution and impurities have been studied by DFT calculation. Ćirić et al. [36] studied the substitution of iron by nickel and found that the replacement of iron by nickel increased the hydride cohesive energy. The effect of substitutional impurities on hydrogen diffusion was evaluated by Bakulin et al. [37]. They found that easier diffusion came through octahedral sites formed by four Ti atoms and two Fe atoms. Substitution of Fe by Al, Be, Co, Cr, Cu, Mn and Ni was calculated using DFT by Fadonougbo et al. [38]. Their calculation shows that the logarithm of plateau pressure is linearly correlated to the monohydride formation energy as predicted by the van’t Hoff plot.
In industrial synthesis, it may be difficult to achieve a ‘pure’ TiFe alloy by induction casting. Therefore, understanding how getting out of the stoichiometry will impact the hydrogenation behavior of the alloy is the purpose of this article, specifically relating to the over-stoichiometry of titanium to avoid the formation of TiFe2, which is well known to not absorb hydrogen. In order to be as close as possible to an industrial environment, the alloy was synthesized in a 9 kg ingot. Additionally, the possibility of using Ti as the alloying element instead of other, more expensive transition metals or rare earth elements to improve the activation kinetics is of great interest because this would decrease the alloy cost. In this paper, we report the activation of an induction-melted TiFe + 20 wt.% Ti (1.2Ti-0.8Fe) alloy and the phases present before and after hydrogenation. The same composition was also synthesized by arc melting (3 g pellet) to compare the microstructures of each sample.

2. Materials and Methods

Industrial-grade Fe (1005), and Ti (CP Grade 1) were used to synthesize all samples. The composition 1.2Ti-0.8Fe was synthesized by induction melting (9 kg ingot) and by arc melting (3 g pellet) under an argon atmosphere. After synthesis, the samples were transferred to a glovebox for further manipulation under argon. The pellets and ingot samples were crushed in a hardened steel mortar and pestle.
The induction-melted samples were mechanically processed in the air using a modified Durston DRM 130 model (High Wycombe, Buckinghamshire, UK) (5 passes). The crushed sample was rolled between stainless steel sheets to avoid contamination of the powder by the rollers.
The hydrogen storage properties were measured using a home-made Sieverts-type apparatus. The initial hydrogen pressures for kinetic measurements were 20 bars for absorption and 0.1 bars for desorption. All measurements were taken at room temperature.
The crystallographic analysis was performed via X-ray diffraction—XRD (powder)—on a Bruker D8 Focus diffractometer (Billerica, MA, USA), and the radiation source was CuKα. The XRD patterns present a raised background due to the fluorescence generated by the Fe. The Rietveld refinement method was used to determine the lattice parameters using the TOPAS software (V6.0) [39]. Microstructural and chemical analysis were performed using a scanning electron microscope—SEM (Hitachi SU3500, Tokyo, Japan)—equipped with an energy-dispersive X-ray spectrometer—EDS (Oxford Maxn50, Abingdon, UK).

3. Results and Discussion

Figure 1a shows the microstructure of the induction-melted 1.2Ti-0.8Fe 9 kg ingot. Three regions are observed in the micrograph: a bright main region (1–2) and two grey regions. One grey region (3) consists of rounded areas that are in contact with the bright region and the dispersed dark-grey region (4). The phase fractions were measured by image processing. The main bright region accounts for 58% of the micrograph’s area, and the secondary grey and dark-grey regions for 12 and 30%, respectively. Figure 1b shows a higher magnification image of the regions analyzed by EDX. The chemical composition of the overall alloy and each specific region was measured, and the results are presented in Table 1.
The overall composition measurement shows how the measured composition of the alloy is 1.26Ti-0.74Fe instead of the nominal composition 1.2Ti-0.8Fe. This difference is not uncommon when working with industrial synthesis methods. Since the difference is small, we will use the nominal composition in our discussion. The main phase (Spectra 1 and 2) matches the composition for the intermetallic TiFe. The grey phase (Spectrum 3) presents a composition close to Ti2Fe, and the dark-grey phase (Spectrum 4) is Ti-rich.
Figure 2 shows the XRD patterns of the 1.2Ti-0.8Fe alloy in the as-cast condition. The phases identified are TiFe, Ti2Fe and BCC. By correlating the phases identified by EDX, it can be assumed that the main region, grey region and dark-grey region respectively correspond to the TiFe, Ti2Fe and BCC phases. Table 2 presents the results from the Rietveld refinement performed on the as-cast condition. The abundances of each phase from image analysis are included for comparison. The phase abundance for the refinement results is higher than that measured by image analysis. However, it is important to keep in mind that Rietveld refinement reports the wt.%. If the phase fraction measured by image analysis is multiplied by the density of each phase (TiFeρ = 6.6 g/cm3, Ti2Feρ = 5.7 g/cm3, BCCρ (Ti80%Fe20%) = 5.2 g/cm3), and each result is divided by the sum, the phase fraction obtained is 63 wt.% TiFe, 11 wt.% Ti2Fe and 26 wt.% BCC. This is an almost exact match to the Rietveld refinement.
Figure 3 shows the activation curves of the 1.2Ti-0.8Fe alloy. The as-cast sample did not activate after over 20 h under 20 bars of hydrogen pressure. The sample that was cold rolled five times in air (CR5) presented fast activation kinetics reaching ~2.6 wt.% H, with an incubation period of ~40 min and saturation in ~6 h.
Figure 4 shows the XRD patterns of the CR5 1.2Ti-0.8Fe alloy before and after activation. The phases identified after cold rolling match those identified in the as-cast condition (TiFe, Ti2Fe and BCC), with the difference being that the peaks are slightly broader, which is typical for samples that have undergone mechanical deformation. The phases identified after activation are TiFe, Ti2FeHx and FCC (Face Centered Cubic). The hydride phases Ti2FeHx and FCC are both stable hydrides formed during activation. It is well known that the BCC phase hydrides into a dihydride with an FCC structure. Therefore, the source of the FCC phase can be directly related to the BCC phase in the as-cast alloy. Seeing that Ti2Ni is the structure type of Ti2Fe, it will be supposed that the Ti2FeHx phase has the same structure type as the hydride of Ti2Ni (Fd-3m, Pearson’s symbol cF96, Ti2NiH2.5) [40]. The stable hydrides identified match those previously reported on TiFe-based alloys with Ti overstoichiometry [26,33].
Table 3 shows the crystal structure parameters of the refined Ti2Fe and Ti2FeHx, respectively, for the CR5 before and after activation. The volume expansion of the Ti2Fe phase in the CR5’s post-activation condition was determined to be 21%. This expansion is close to the ones previously reported by Faisal et al. [21]. They reported the hydrogen storage behavior of a minor (Ti, Zr)2-Fe phase present in two alloys by measuring a volume expansion of 16.4% and 24.4%. The stoichiometry of the Ti2FeHx was determined by the unit cell volume increase. The volume increase is 305 Å3, and since there are 32 formula units per unit cell, this results in a volume per formula unit of 9.5 Å3. Assuming a sole hydrogen atom typically occupies a volume between 2 and 3 Å3, the range of the stoichiometry would be between Ti2FeH4.75 (3.09 wt.% H) and Ti2FeH3.2 (2.08 wt.% H).
Now, considering the phase fractions obtained by Rietveld refinement in Table 2, the theoretical composition for TiFe (1.86 wt.% H), FCC (3.7 wt.% H) and the stoichiometry calculated by the unit cell volume increase for Ti2FeHx, the hydrogen intake contribution during the activation of each phase can be calculated as follows: 64% of TiFe would contribute 1.19 wt.% H; the 10% of Ti2FeHx, between 0.2–0.3 wt.% H; and the 26% of BCC, 0.96 wt.% H, for a total of 2.35–2.45 wt.% H. These results are not far off from the 2.6 wt.% H measured during activation. The effect of the absorption of each phase is not seen in the activation curve, meaning that in Figure 3, the activation curve is smooth and does not present any kinks. This points to the system acting as a single phase.
To see the effect of the microstructure, a small 3 g sample of 1.2Ti-0.8Fe was prepared by arc melting. Figure 5 shows a side-by-side comparison of the microstructure obtained by induction melting (a) and arc melting (b). It is clear from the image analysis of Figure 5 that the arc-melted sample presents a much finer microstructure with a higher area abundance for the bright main phase, 77 %, compared to the 58% measured for the induction-melted sample.
Figure 6 shows the activation curve of the arc-melted sample. It activated without the need for any heat treatment or mechanical processing, reaching a capacity of 2 wt.% H in ~12 h. The ability to activate it without the need for cold rolling is attributed to the fine microstructure generated by arc-melting. Nevertheless, the presence of the secondary phases is essential for activation without heat treatment.
Figure 7 shows the XRD patterns of the arc-melted 1.2Ti-0.8Fe alloy. The phases identified are TiFe, Ti2Fe and BCC, match those in the induction-melted condition. The phase fractions obtained by Rietveld refinement are 80 wt.% TiFe, 4 wt.% Ti2Fe and 16 wt.% BCC. This shows how lower percentages of the secondary phases can be enough to achieve activation under mild conditions if the microstructure presents a finer scale. Regarding the difference in H capacity between the induction-melted sample (2.6 wt.% H) and the arc-melted sample (2 wt.% H), this is due to the difference in the phase fraction of secondary phases. However most important is the phase fraction of TiFe, which is the phase that ultimately provides reversible hydrogenation behavior. Therefore, the reversible capacity of the induction-melted sample is thought to be 1.19 wt.% H (64% TiFe) and 1.49 wt.% for the arc-melted sample (80% TiFe).
The comparison between the induction-melted ingot and the arc-melted sample clearly show how a TiFe-based alloy will achieve activation under mild conditions (room temperature, low pressure) if the Ti2Fe secondary phases and BCC phases are present. The finer distribution of the secondary phases is ultimately more effective in the improvement of the activation kinetics since no mechanical processing is necessary regardless of the abundance of secondary phases. Previous studies have shown how the BCC phase presents an oxide layer with a higher Ti concentration than TiFe; this oxide layer promotes hydrogen dissociation, improving hydrogen absorption [18,33,35]. Therefore, it can be theorized that a finer distribution of secondary phases represents a higher surface interphase contact between secondary phases and the matrix. This interface may be where dissociation takes place.

4. Conclusions

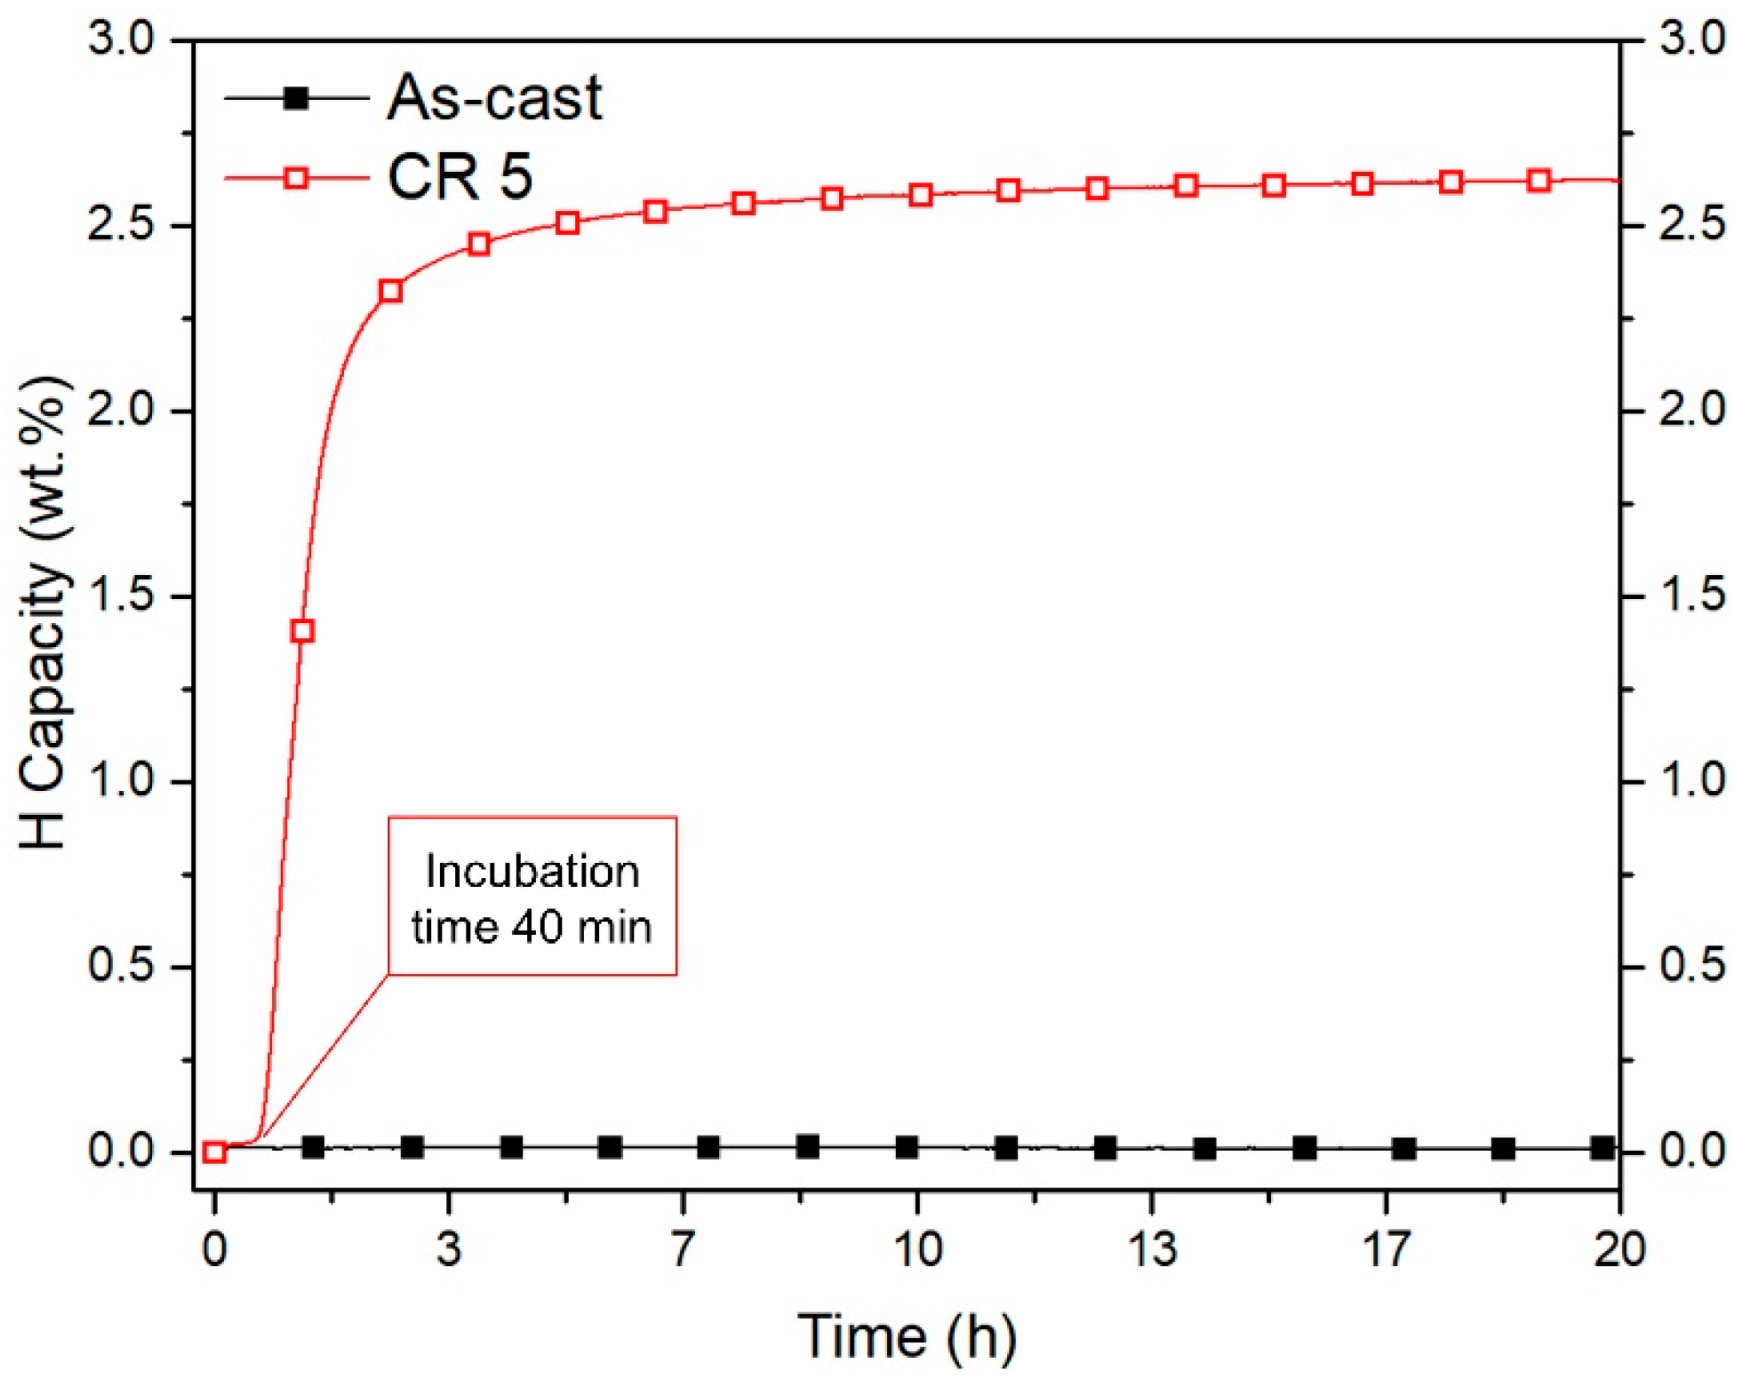
  • The synthesis of a 9 kg 1.2Ti-0.8Fe ingot produced by induction casting results in an alloy that can activate after cold rolling in air without the need for an activation heat treatment.
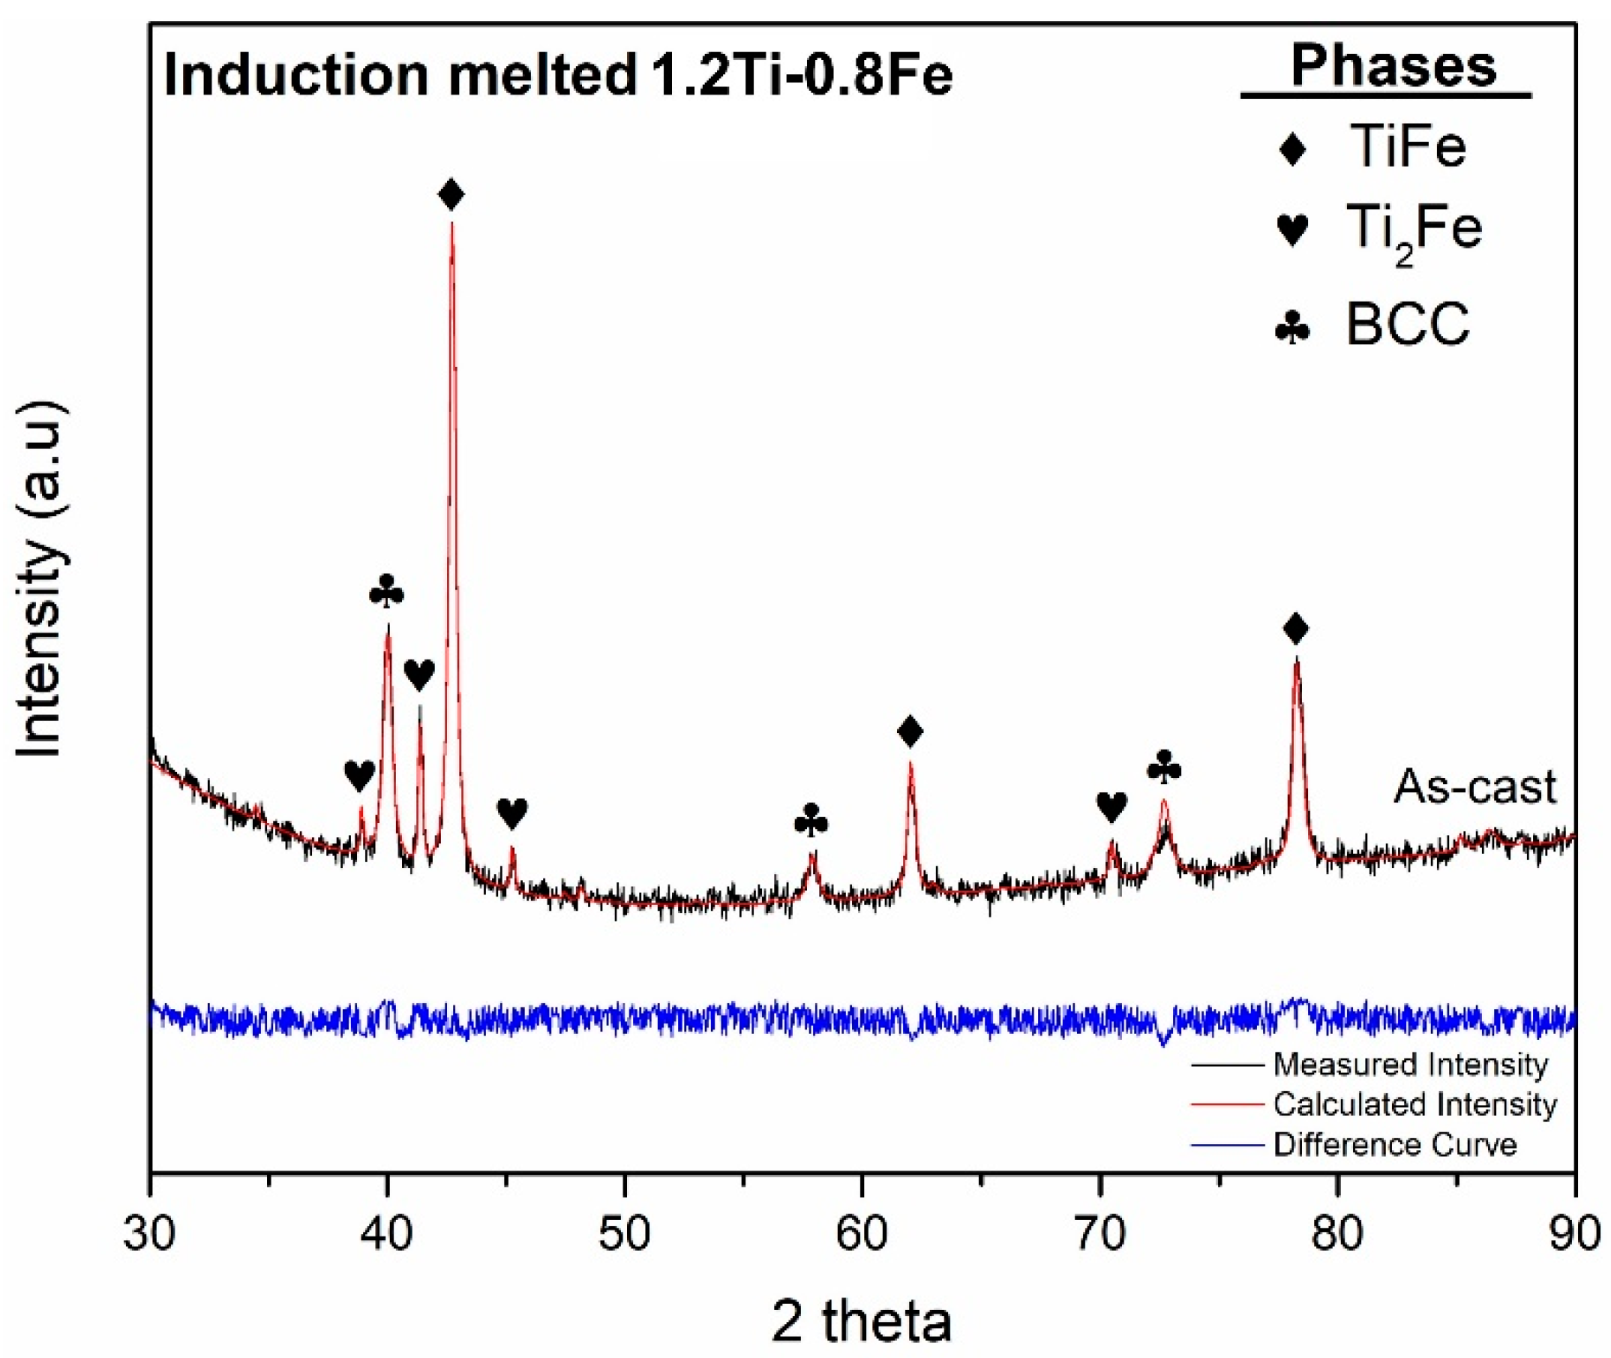
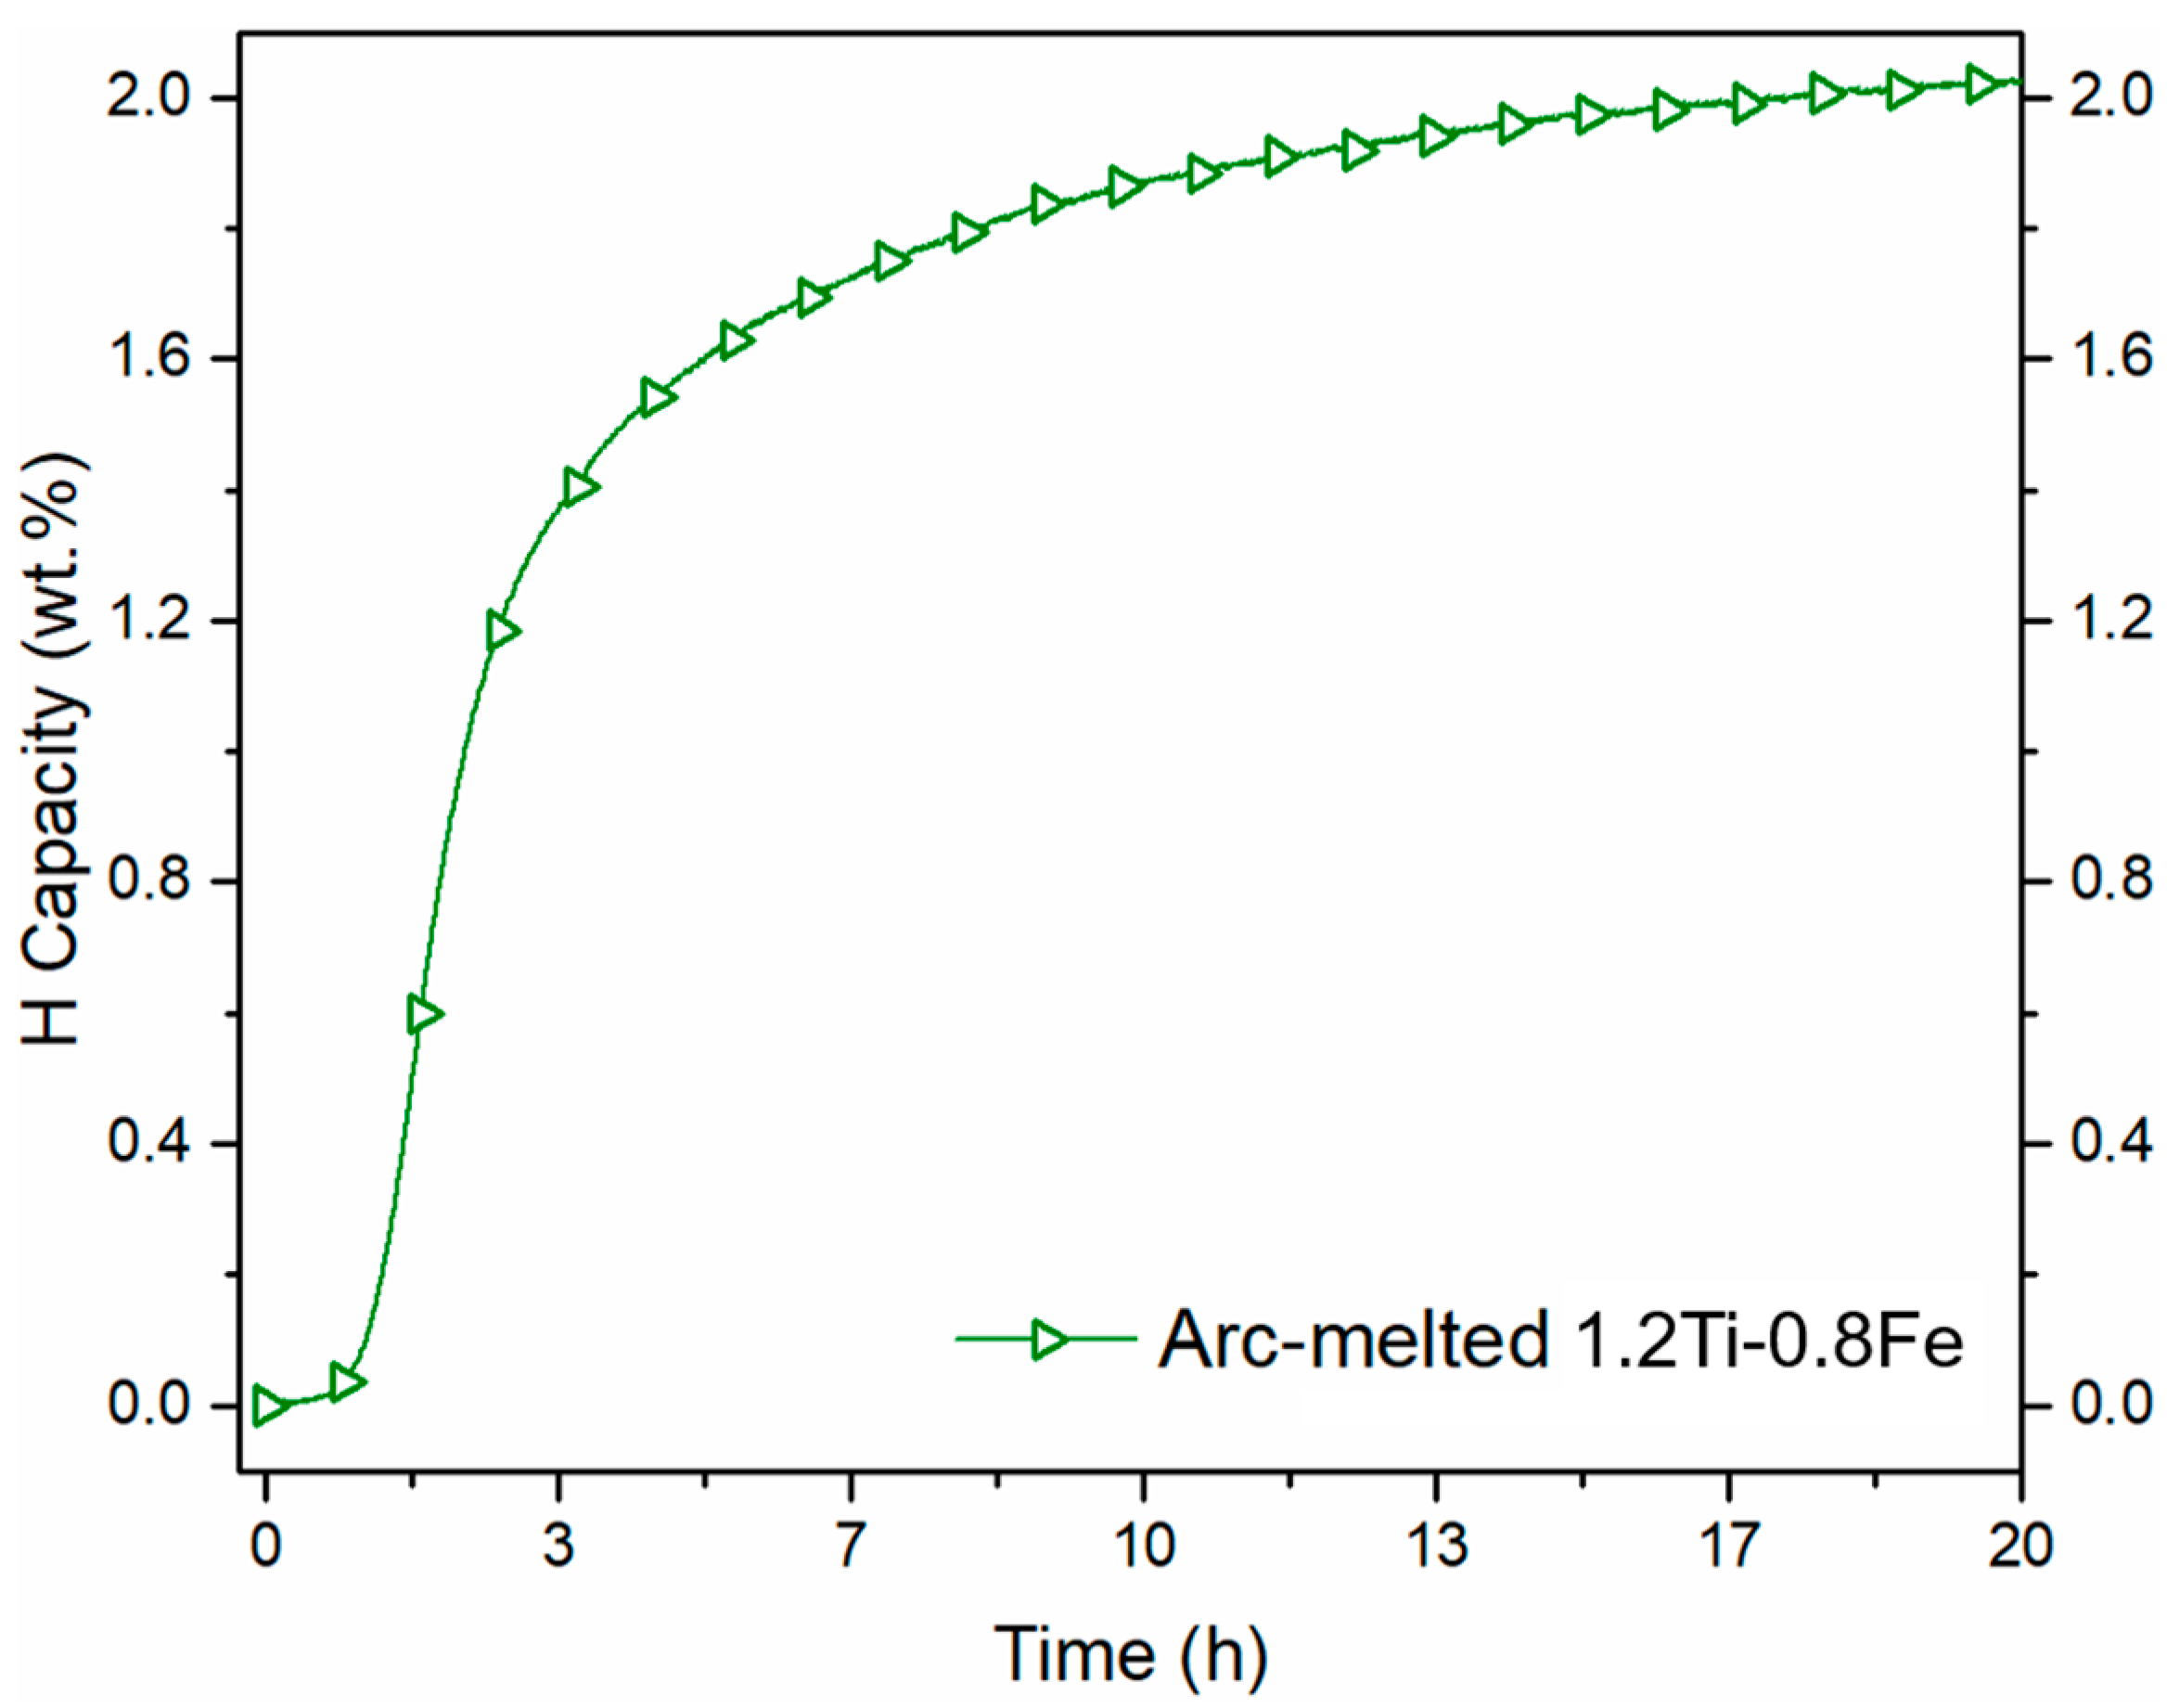
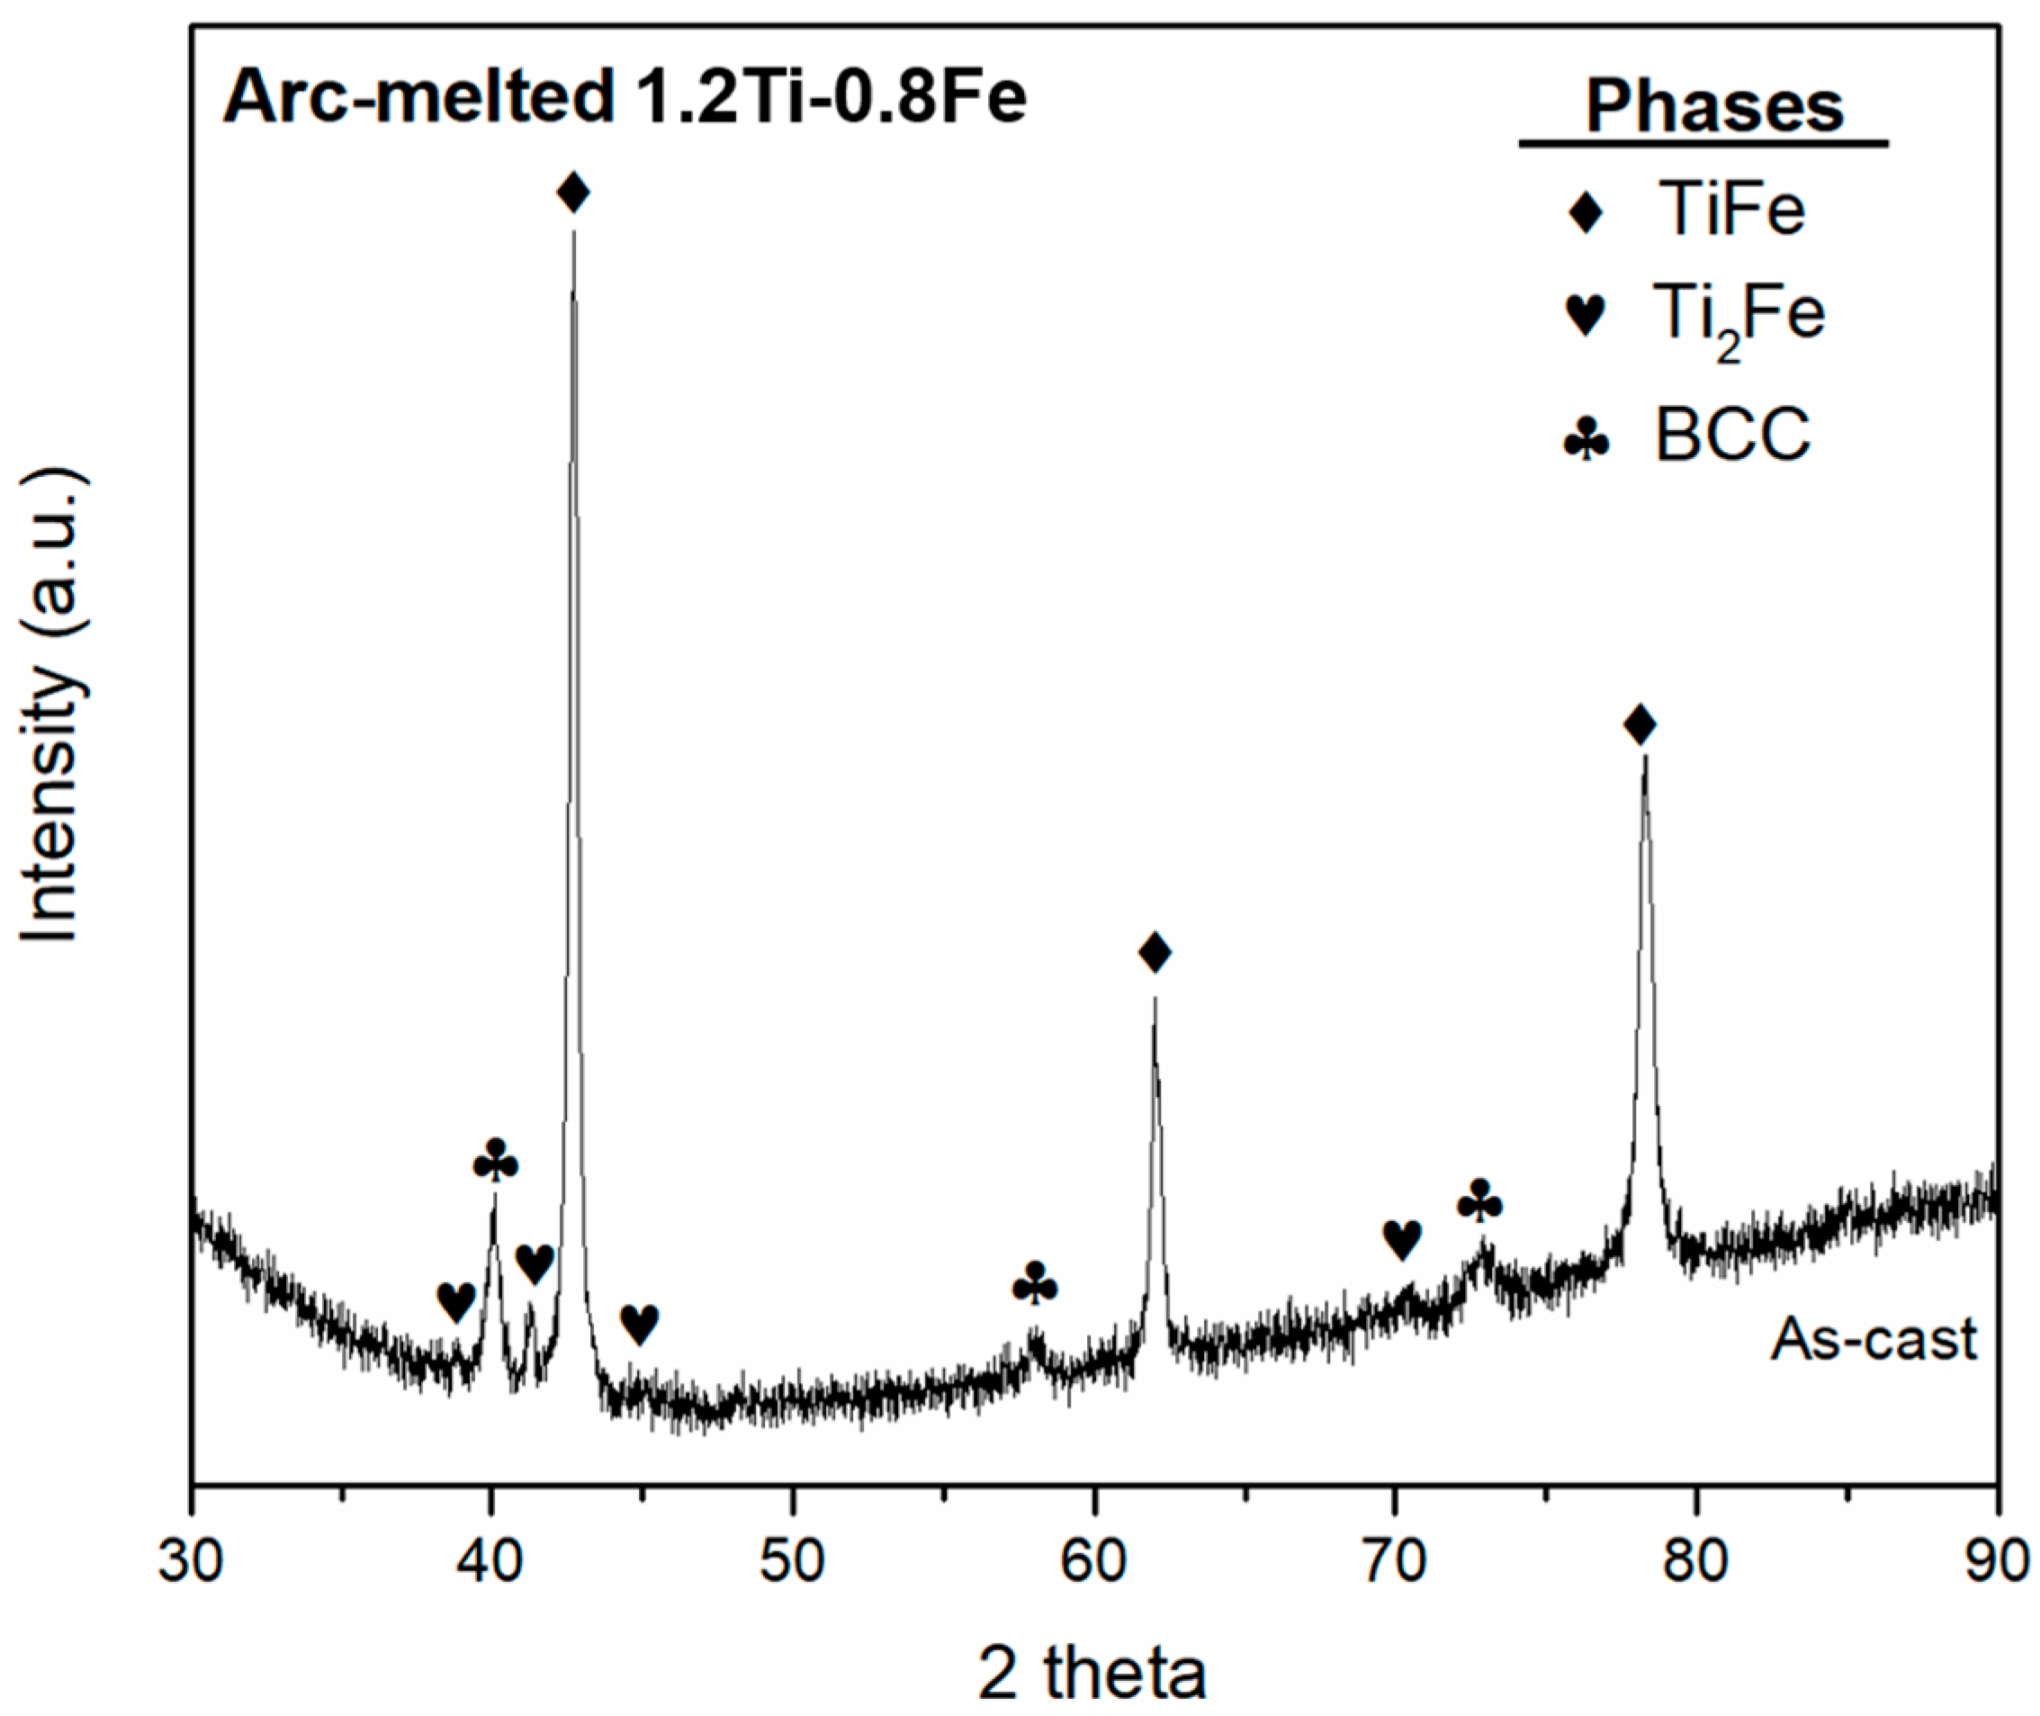
  • The phases formed by synthesizing 1.2Ti-0.8Fe match the crystal structures (TiFe, Ti2Fe and BCC) of the phases previously reported when alloying TiFe with Zr and Mn. Similar to the addition of these more expensive alloying elements, the addition of Ti to TiFe resulted in the improvement of first hydrogenation kinetics.
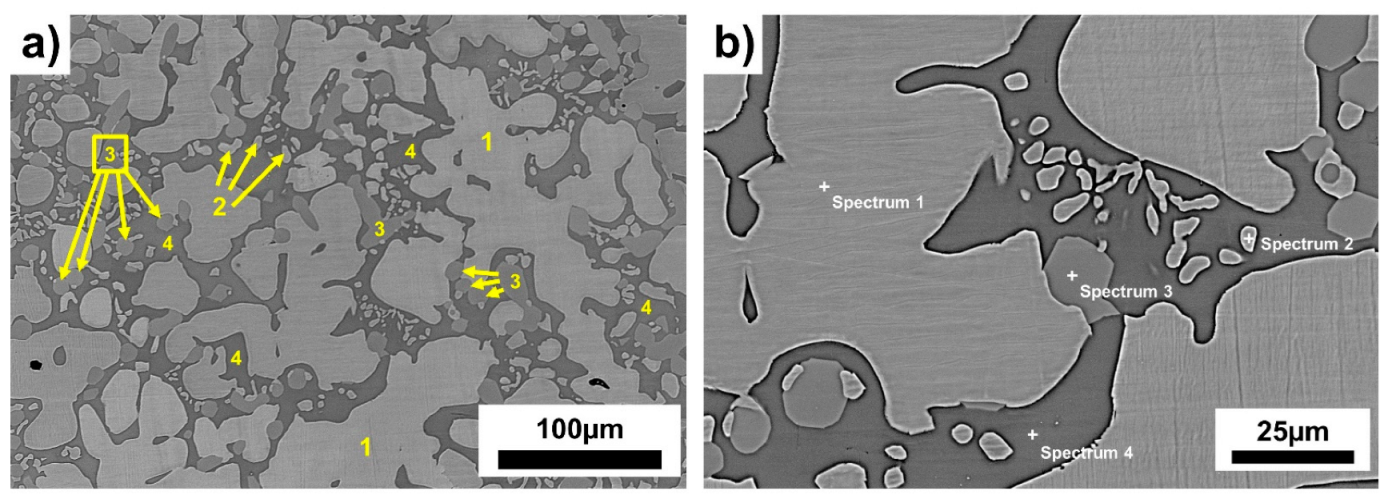
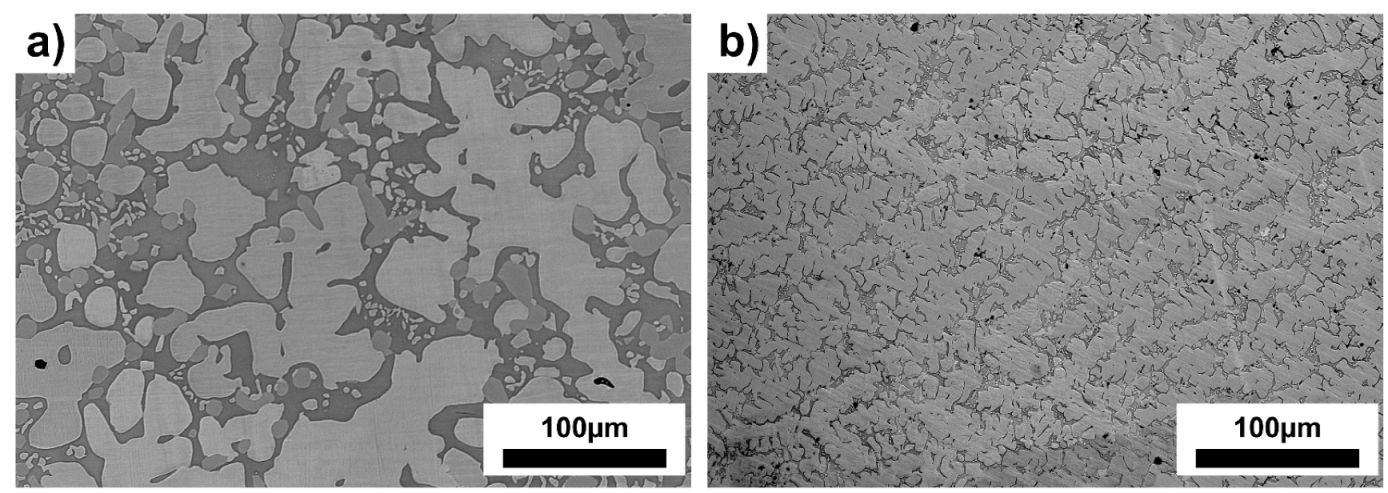
  • The finer distribution of secondary phases (Ti2Fe and BCC) in a TiFe-based alloy present a superior activation ability than that of the same composition with a coarse microstructure. This is thought to be due to the larger surface interphase between the matrix and the secondary phases.
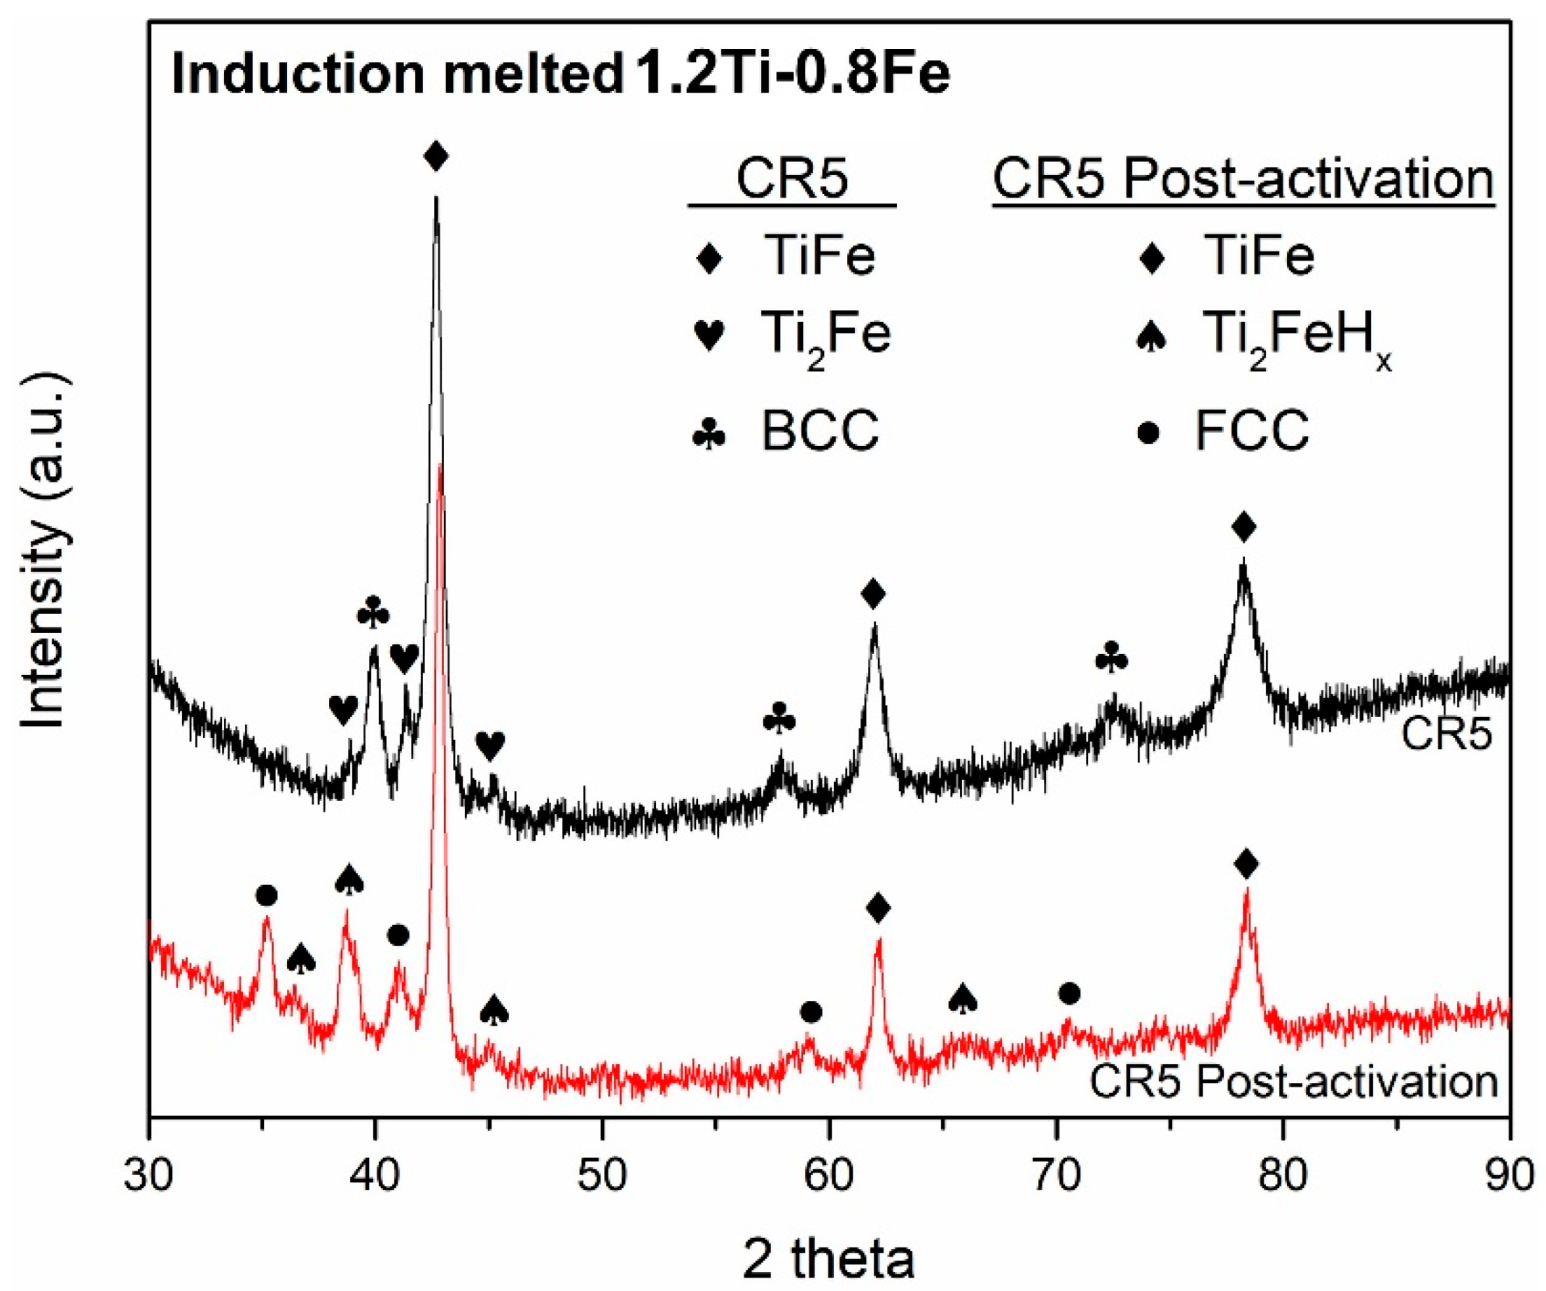
  • The three-phase system (TiFe, Ti2Fe and BCC) activates as a single-phase system regardless of the formation of two stable hydrides (Ti2FeHx and FCC).

Author Contributions

Conceptualization, E.U.-K. and J.H.; methodology, E.U.-K.; investigation, E.U.-K.; writing—original draft preparation E.U.-K.; writing—review and editing, E.U.-K., B.T. and J.H.; visualization, E.U.-K.; supervision, J.H. All authors have read and agreed to the published version of the manuscript.

Funding

E. Ulate-Kolitsky would like to acknowledge the student grant provided by the Réseau Québécois sur l’Énergie Intelligente (RQEI).

Conflicts of Interest

The authors declare no conflict of interest.

References

  1. von Colbe, J.B.; Ares, J.-R.; Barale, J.; Baricco, M.; Buckley, C.; Capurso, G.; Gallandat, N.; Grant, D.M.; Guzik, M.N.; Jacob, I.; et al. Application of hydrides in hydrogen storage and compression: Achievements, outlook and perspectives. Int. J. Hydrogen Energy 2019, 44, 7780–7808. [Google Scholar] [CrossRef]
  2. Sujan, G.K.; Pan, Z.; Li, H.; Liang, D.; Alam, N. An overview on TiFe intermetallic for solid-state hydrogen storage: Microstructure, hydrogenation and fabrication processes. Crit. Rev. Solid State Mater. Sci. 2020, 45, 410–427. [Google Scholar] [CrossRef]
  3. Reilly, J.J.; Wiswall, R.H. Formation and properties of iron titanium hydride. Inorg. Chem. 1974, 13, 218–222. [Google Scholar] [CrossRef]
  4. Lv, P.; Guzik, M.N.; Sartori, S.; Huot, J. Effect of ball milling and cryomilling on the microstructure and first hydrogenation properties of TiFe+4 wt.% Zr alloy. J. Mater. Res. Technol. 2019, 8, 1828–1834. [Google Scholar] [CrossRef]
  5. Silva, R.; Lean Neto, R.L.; Leiva, D.R.; Ishikawa, T.T.; Kiminami, C.S.; Jorge, A.M., Jr.; Botta, W.J. Room temperature hydrogen absorption by Mg and Mg TiFe nanocomposites processed by high-energy ball milling. Int. J. Hydrogen Energy 2018, 43, 12251–12259. [Google Scholar] [CrossRef]
  6. Falcão, R.B.; Dammann, E.D.; Rocha, C.J.; Durazzo, M.; Ichikawa, R.U.; Martinez, L.G.; Botta, W.J.; Neto, R.M.L. An alternative route to produce easily activated nanocrystalline TiFe powder. Int. J. Hydrogen Energy 2018, 43, 16107–16116. [Google Scholar] [CrossRef]
  7. Guo, F.; Namba, K.; Miyaoka, H.; Jain, A.; Ichikawa, T. Hydrogen storage behavior of TiFe alloy activated by different methods. Mater. Lett. X 2021, 9, 100061. [Google Scholar] [CrossRef]
  8. Ulate-Kolitsky, E.; Tougas, B.; Neumann, B.; Schade, C.; Huot, J. First hydrogenation of mechanically processed TiFe-based alloy synthesized by gas atomization. Int. J. Hydrogen Energy 2021, 46, 7381–7389. [Google Scholar] [CrossRef]
  9. Vega, L.E.R.; Leiva, D.R.; Neto, R.M.L.; Silva, W.B.; Silva, R.A.; Ishikawa, T.T.; Kiminami, C.S.; Botta, W.J. Mechanical activation of TiFe for hydrogen storage by cold rolling under inert atmosphere. Int. J. Hydrogen Energy 2018, 43, 2913–2918. [Google Scholar] [CrossRef]
  10. Edalati, K.; Matsuda, J.; Yanagida, A.; Akiba, E.; Horita, Z. Activation of TiFe for hydrogen storage by plastic deformation using groove rolling and high-pressure torsion: Similarities and differences. Int. J. Hydrogen Energy 2014, 39, 15589–15594. [Google Scholar] [CrossRef]
  11. Edalati, K.; Matsuda, J.; Arita, M.; Daio, T.; Akiba, E.; Horita, Z. Mechanism of activation of TiFe intermetallics for hydrogen storage by severe plastic deformation using high-pressure torsion. Appl. Phys. Lett. 2013, 103, 143902. [Google Scholar] [CrossRef]
  12. Oliveira, V.B.; Beatrice, C.A.G.; Neto, R.M.L.; Silva, W.B.; Pessan, L.A.; Botta, W.J.; Leiva, D.R. Hydrogen Absorption/Desorption Behavior of a Cold-Rolled TiFe Intermetallic Compound. Mater. Res. 2021, 24, e20210204. [Google Scholar] [CrossRef]
  13. Gosselin, C.; Huot, J. Hydrogenation Properties of TiFe Doped with Zirconium. Materials 2015, 8, 7864–7872. [Google Scholar] [CrossRef] [PubMed]
  14. Gosselin, C.; Huot, J. First Hydrogenation Enhancement in TiFe Alloys for Hydrogen Storage Doped with Yttrium. Metals 2019, 9, 242. [Google Scholar] [CrossRef]
  15. Lv, P.; Liu, Z.; Dixit, V. Improved hydrogen storage properties of TiFe alloy by doping (Zr+2V) additive and using mechanical deformation. Int. J. Hydrogen Energy 2019, 44, 27843–27852. [Google Scholar] [CrossRef]
  16. Ali, W.; Li, M.; Gao, P.; Wu, C.; Li, Q.; Lu, X.; Li, C. Hydrogenation properties of Ti-Fe-Mn alloy with Cu and Y as additives. Int. J. Hydrogen Energy 2017, 42, 2229–2238. [Google Scholar] [CrossRef]
  17. Leng, H.; Yu, Z.; Luo, Q.; Yin, J.; Miao, N.; Li, Q.; Chou, K.-C. Effect of cobalt on the microstructure and hydrogen sorption performances of TiFe0.8Mn0.2 alloy. Int. J. Hydrogen Energy 2020, 45, 19553–19560. [Google Scholar] [CrossRef]
  18. Leng, H.; Yu, Z.; Yin, J.; Li, Q.; Wu, Z.; Chou, K.-C. Effects of Ce on the hydrogen storage properties of TiFe 0.9 Mn 0.1 alloy. Int. J. Hydrogen Energy 2017, 42, 23731–23736. [Google Scholar] [CrossRef]
  19. Yang, T.; Wang, P.; Xia, C.; Liu, N.; Liang, C.; Yin, F.; Li, Q. Effect of chromium, manganese and yttrium on microstructure and hydrogen storage properties of TiFe-based alloy. Int. J. Hydrogen Energy 2020, 45, 12071–12081. [Google Scholar] [CrossRef]
  20. Park, K.B.; Ko, W.-S.; Fadonougbo, J.O.; Na, T.-W.; Im, H.-T.; Park, J.-Y.; Kang, J.-W.; Kang, H.-S.; Park, C.-S.; Park, H.-K. Effect of Fe substitution by Mn and Cr on first hydrogenation kinetics of air-exposed TiFe-based hydrogen storage alloy. Mater. Charact. 2021, 178, 111246. [Google Scholar] [CrossRef]
  21. Faisal, M.; Suh, J.-Y.; Lee, Y.-S. Understanding first cycle hydrogenation properties of Ti–Fe–Zr ternary alloys. Int. J. Hydrogen Energy 2021, 46, 4241–4251. [Google Scholar] [CrossRef]
  22. Zeng, L.; Xu, G.; Liu, L.; Bai, W.; Zhang, L. Experimental investigation of phase equilibria in the Ti-Fe-Zr system. Calphad 2018, 61, 20–32. [Google Scholar] [CrossRef]
  23. Tamara, V.; Kostyantyn, K. Iron-Titanium-Zirconium. In Iron Systems, Part 5, (Landolt-Börnstein - Group IV Physical Chemistry; Springer: Berlin/Heidelberg, Germany, 2009; Chapter 34; pp. 702–720. [Google Scholar]
  24. Zhou, G.; Zeng, D.; Liu, Z. Phase equilibria in the Fe–Ti–Zr system at 1023K. J. Alloys Compd. 2010, 490, 463–467. [Google Scholar] [CrossRef]
  25. Patel, A.K.; Duguay, A.; Tougas, B.; Schade, C.; Sharma, P.; Huot, J. Microstructure and first hydrogenation properties of TiFe alloy with Zr and Mn as additives. Int. J. Hydrogen Energy 2020, 45, 787–797. [Google Scholar] [CrossRef]
  26. Ulate-Kolitsky, E.; Tougas, B.; Huot, J. Hydrogenation of TixFe2-x-based alloys with overstoichiometric Ti ratio (x = 1.1, 1.15 and 1.2). Int. J. Hydrogen Energy 2021, 46, 38363–38369. [Google Scholar] [CrossRef]
  27. Manna, J.; Tougas, B.; Huot, J. First hydrogenation kinetics of Zr and Mn doped TiFe alloy after air exposure and reactivation by mechanical treatment. Int. J. Hydrogen Energy 2020, 45, 11625–11631. [Google Scholar] [CrossRef]
  28. Christ, H.J.; Schmidt, P. Influence of Beta Stability on Hydrogen Diffusion in Various Beta Titanium Alloys. Defect Diffus. Forum 2009, 289–292, 87–94. [Google Scholar] [CrossRef]
  29. Marczewski, M.; Miklaszewski, A.; Jurczyk, M. Structure evolution analysis in ultrafine-grained Zr and Nb-based beta titanium alloys. J. Alloys Compd. 2018, 765, 459–469. [Google Scholar] [CrossRef]
  30. Mehjabeen, A.; Xu, W.; Qiu, D.; Qian, M. Redefining the β-Phase Stability in Ti-Nb-Zr Alloys for Alloy Design and Microstructural Prediction. JOM 2018, 70, 2254–2259. [Google Scholar] [CrossRef]
  31. Dong, C.; Hei, Z.K.; Wang, L.B.; Song, Q.H.; Wu, Y.K.; Kuo, K.H. A new icosahedral quasicrystal in rapidly solidified FeTi2. Scr. Metall. 1986, 20, 1155–1158. [Google Scholar] [CrossRef]
  32. Okamoto, H.; Schlesinger, M.E.; Mueller, E.M. Binary Alloy Phase Diagrams. In Asm Handbook; ASM International Materials Park: Materials Parks, OH, USA, 2016. [Google Scholar]
  33. Park, K.B.; Na, T.-W.; Kim, Y.D.; Park, J.-Y.; Kang, J.-W.; Kang, H.-S.; Park, K.; Park, H.-K. Characterization of microstructure and surface oxide of Ti1.2Fe hydrogen storage alloy. Int. J. Hydrogen Energy 2021, 46, 13082–13087. [Google Scholar] [CrossRef]
  34. Schlapbach, L.; Riesterer, T. The activation of FeTi for hydrogen absorption. Appl. Phys. A 1983, 32, 169–182. [Google Scholar] [CrossRef]
  35. Balcerzak, M.; Wagstaffe, M.; Robles, R.; Pruneda, M.; Noei, H. Effect of Cr on the hydrogen storage and electronic properties of BCC alloys: Experimental and first-principles study. Int. J. Hydrogen Energy 2020, 45, 28996–29008. [Google Scholar] [CrossRef]
  36. Ćirić, K.D.; Kocjan, A.; Gradišek, A.; Koteski, V.J.; Kalijadis, A.; Ivanovski, V.; Laušević, Z.V.; Stojić, D.L. A study on crystal structure, bonding and hydriding properties of Ti–Fe–Ni intermetallics—Behind substitution of iron by nickel. Int. J. Hydrogen Energy 2012, 37, 8408–8417. [Google Scholar] [CrossRef]
  37. Bakulin, A.V.; Kulkov, S.S.; Kulkova, S.E.; Hocker, S.; Schmauder, S. Influence of substitutional impurities on hydrogen diffusion in B2-TiFe alloy. Int. J. Hydrogen Energy 2014, 39, 12213–12220. [Google Scholar] [CrossRef]
  38. Fadonougbo, J.O.; Park, K.B.; Na, T.-W.; Park, C.-S.; Park, H.-K.; Ko, W.-S. An integrated computational and experimental method for predicting hydrogen plateau pressures of TiFe1-xMx-based room temperature hydrides. Int. J. Hydrogen Energy 2022, 47, 17673–17682. [Google Scholar] [CrossRef]
  39. TOPAS. Bruker, Alan A. Coelho, V6. 2021. Available online: http://www.topas-academic.net/ (accessed on 20 September 2022).
  40. Buchner, H.; Gutjahr, M.A.; Beccu, K.D.; Saeufferer, H. Hydrogen in intermetallic phases: The system titanium--nickel--hydrogen. Wasserstoff in intermetallischen phasen am beispiel des systems titan-nickel-wasserftoff. Int. J. Mater. Res. 1972, 63, 497–500. [Google Scholar] [CrossRef]
Figure 1. Backscattered electron micrograph of the induction-melted 1.2Ti-0.8Fe alloy (a) low magnification: regions 1, 2, 3 and 4 match the EDX spectrums, and (b) higher magnifications: EDX point spectrums.
Hydrogen 03 00023 g001
Figure 2. X-ray diffraction patterns of the induction-melted 1.2Ti-0.8Fe.
Hydrogen 03 00023 g002
Figure 3. Activation curve of 1.2Ti-0.8Fe with and without cold rolling.
Hydrogen 03 00023 g003
Figure 4. X-ray diffraction patterns of the cold-rolled-five-times (CR5) induction-melted 1.2Ti-0.8Fe alloys before and after activation.
Hydrogen 03 00023 g004
Figure 5. Backscattered electron images of induction-melted (a) and arc-melted (b) 1.2Ti-0.8Fe.
Hydrogen 03 00023 g005
Figure 6. Activation curve of the arc-melted 1.2Ti-0.8Fe.
Hydrogen 03 00023 g006
Figure 7. X-ray diffraction patterns of the arc-melted 1.2Ti-0.8Fe.
Hydrogen 03 00023 g007
Table 1. EDX analysis of the induction-melted 1.2Ti-0.8Fe alloy (uncertainty is ±1 for all values).
RegionTi
wt.%
Fe
wt.%
Nominal compositionN/A5644
Overall compositionN/A5941
Spectra 1 and 2Bright4951
Spectrum 3Grey6337
Spectrum 4Dark-grey7921
Table 2. Rietveld refinement of the as-cast induction-melted 1.2Ti-0.8Fe (the uncertainty on the last significant digit is given by the number in parentheses).
PhasePhase Fraction Image Analysis (area%) Phase Fraction Rietveld Refinement (wt.%) Lattice Parameters “a”
(Å)
TiFe58642.9904 (2)
Ti2Fe121011.328 (1)
BCC30263.1850 (3)
Table 3. Crystal structure parameters of the Ti2Fe and Ti2FeHx phases identified in Figure 4 (the uncertainty on the last significant digit is given by the number in parentheses).
CR5CR5 Post-Activation
PhaseLattice
parameters (Å)
Unit cell
volume (Å3)
Micro strainPhaseLattice
parameters (Å)
Unit cell
Volume (Å3)
Micro strain
Ti2Fe11.320 (3)1451 (1)0.13 (8)%Ti2FeHx12.064 (5)1756 (2)0.44 (1)%
Publisher’s Note: MDPI stays neutral with regard to jurisdictional claims in published maps and institutional affiliations.

