1. Introduction
Metal hydrides MH are formed by the reversible reaction of hydrogen with metals or their alloys. For some metals, the absorption reaction occurs at room temperature and at relatively low hydrogen pressures [
1,
2]. For most metallic hydrides, high density of hydrogen accumulation has been achieved. Thanks to their ability to absorb large amounts of hydrogen in a small volume, metal hydrides can be considered as potential materials for hydrogen storage—especially in applications where the weight of containers is not critical.
The metal hydrides dedicated for hydrogen storage applications are expected to exhibit a high storage capacity, reversibility and long-term stability. Among others, the intermetallic compounds derived from LaNi
5 (general formula AB
5) have been extensively investigated for many years as possible hydrogen storage materials [
1,
2,
3]. One of the methods to improve the hydrogen absorption properties of LaNi
5 is to replace La, Ni or both by other elements: La by Ce, Pr, Nd or by a mischmetal and Ni by Pb, Zn, Cr, Fe, Co, Cu or even by Al or Sn. Replacing Ni by other elements can improve the long-term stability and resistance of a hydride to hydrogen impurity.
Experimental
(pressure–composition–temperature) measurements can deliver information about the macroscopic state of a tested hydride, e.g., the maximum storage capacity, reversibility of a process or long-term stability. Earlier works [
1,
2] have shown that there is a correlation between the crystallographic and thermodynamic properties of hydrides and the hydrogen concentration in them. This provides a useful starting point for further theoretical studies.
Theoretical investigations based on statistical physics models can be treated as complementary to experimental research as they can provide characteristics of the microscopic state of a hydride. It is then possible to unveil the mechanism of hydrogen distribution in hydrides and to determine the evolution of thermodynamic functions, e.g., internal energy , Gibbs free energy and entropy , basing on theoretical models.
There are many models which employ the statistical physics methods to describe the behavior of real metal hydride systems. Such models were proposed, developed and successfully used by several authors [
4,
5,
6,
7,
8,
9] to characterize metal hydrides. A common feature of all those models is methodology which includes numerically fitting the analytical expressions to the previously known experimental
isotherms and looking for correlations between them.
The aim of this paper is to apply a theoretical model to the hydrogen absorption isotherms and then to derive and analyze the thermodynamic characteristics of hydrides created of the well known LaNi
5 alloy [
1,
2] as well as of a poorly described in literature hydride of Pb-doped alloy LaNi
4.75Pb
0.25 [
3]. The hydride of this Pb-doped alloy has been—probably for the first time—introduced in paper [
3]. Finally, according to the proposed model, to study the influence of Pb doping of a base alloy at a molecular level.
2. Materials and Methods
The LaNi5 and LaNi4.75Pb0.25 alloys were obtained by arc melting of high purity elements La (99.5%), Ni (99.9%) and Pb (99.99%) in the required mass ratios under 0.8 bar Ar atmosphere. The previous experience in the preparation of the AB5 alloys showed an intensive evaporation of components—mainly Ni—during the melting process. In order to compensate for the mass loss, and to maintain the stoichiometry of the alloy it was decided to use 5% mass excess of Ni.
After melting, the specimens were slowly cooled down to the room temperature and then annealed at 573 K for 8 h under dynamic vacuum. The homogeneity of the obtained samples were checked by the powder X-ray diffraction at room temperature using X’Pert PRO diffractometer with CuK radiation.
The samples with high purity, i.e., with low or zero content of foreign phases, were selected for the activation procedure and finally for hydrogenation. The activation procedure included storing the samples at 398 K under hydrogen atmosphere at the continuously maintained pressure of 10 bar. After 96 h, the samples were slowly cooled to room temperature and subjected to multiple hydriding/dehydriding cycles. The hydriding/dehydriding cycling was repeated until the equilibrium pressure of hydrogen absorption reached the minimum value and hydrogen absorption capacity did not vary by more than 5% between successive cycles. Hence, it could be concluded that the samples had been fully activated and stable so that reproducible absorption isotherms could be obtained. For LaNi5 and LaNi4.75Pb0.25 alloys, the four and six complete hydriding/dehydriding cycles were required, respectively.
The evolution of the hydrogen absorption and desorption properties of these alloys was measured by the Sievert’s volumetric method at T = 303 K, 313 K and 323 K, using commercial gas absorption analyzer Hiden Isochema IMI. For the measurements, samples with mass below 500 mg were used. In addition, it was ensured that the whole volume of the measurement sample holder was completely filled by the sample—without any voids, thereby maintaining close-packing of the powder sample grains. In this way, a thermal conductivity at the grains boundary and hydrogen diffusion rate could be improved. In addition no filler or thermal balance, such as high purity graphite powder, was used during the measurements. In the experiments, high purity grade (6.0) hydrogen gas was used.
The uncertainty of pressure measurement was equal to 0.05% of FSR (100 bar) and uncertainty of the absorbed hydrogen mass (including uncertainties of the sample mass, geometric dimensions of the reactor, hydrogen uptake, temperature stability) was estimated at 2.5 wt.%.
The
isotherms were taken at the above mentioned temperatures, as representing the most likely operating environment conditions for typical portable hydrogen tanks. The obtained results of the equilibrium pressure and absorption capacity for the LaNi
5 base and Pb-doped alloy do did not differ significantly from the data reported in other studies, e.g., for LaNi
5 [
1,
2] and LaNi
4.75Pb
0.25 [
3] respectively.
Based on experimental hydrogen absorption data, the properties of hydrides, including their thermodynamic characteristics, have been determined and analyzed within the framework of three models derived from statistical physics. This work is limited to modelling the hydrogen absorption phenomenon, but the presented models can be successfully used also to the desorption process, which is the reverse of absorption.
3. Results
3.1. Theoretical Background and Model Details
The general reversible reaction of a hydrogen molecule with a metal alloy M, leading to the formation of metal hydride (MH
), is expressed by Equation (
1) [
4,
5,
6]:
where n is a stoichiometric coefficient representing the number of H-atoms absorbed during reaction. The study of the hydrogen absorption processes in metal hydrides using the statistical physics method is expected to give the distribution of
hydrogen atoms absorbed onto
interstitial sites located in the unit mass of a hydride. The theoretical model requires assumptions listed below [
4,
5,
6,
7,
8,
9]:
The hydrogen absorption materials are single phase alloys—supposed to be ideal, without any structural defects;
The energy resulting during the formation of the hydride phase due to mechanical stresses of crystal structure is not taken into account at model approach;
The investigated hydrides are considered as thermodynamic open systems, which can exchange both energy and matter with their surroundings. During the hydrogen absorption process by metal hydrides, hydrogen molecules pass from a gaseous state to the absorbed one. The reverse reaction occurs during the desorption process. Each direction of the hydrogen atoms/molecules flow is related to the absorption or release of heat. In the statistical approach, any process occurring in thermodynamic open systems can be described by the grand canonical ensemble (Equation (
2)) [
4,
5,
6,
7,
8,
9].
The next model assumption is related to hydrogen molecules, which are considered to constitute an ideal gas—a concept in the classical approximation with Maxwell–Boltzmann distribution. Based on this simplification, the interaction between hydrogen molecules in the gaseous state can be neglected. Internal gas energy can be determined by most important degrees of freedom [
4,
5,
6,
7,
10]. From here, the energy of hydrogen molecules is fully characterized by their internal degrees of freedom, e.g., translation
, rotation
, vibration
, electronic
and nuclear
, whose energies are related as follows
[
11].
As long as the molecular gas temperature
T (consequently energy, which is proportional to
T), is lower than
, the rotational and vibrational degrees of freedom are not excited during collisions and the gas behaves as a simple monoatomic gas [
11]. At higher temperatures,
, the rotational degrees of freedom become excited during gas molecules collisions, but oscillations remain frozen [
11]. Finally, the electronic and nuclear degrees of freedom cannot be thermally activated at a reasonable temperature. They begin to play a role at high temperatures, e.g.,
K for electronic degrees of freedom and for
K in case of nuclear [
11]. Similarly, a vibration degree of freedom can be neglected compared to other ones [
5,
6,
7,
8].
Finally, to simplify the statistical model, only the most important degrees of freedom which contribute to molecules energy at ambient temperatures are considered. For hydrogen, they are translational and rotational degrees of freedom.
The starting point of theoretical considerations is the grand canonical partition function (
), Equation (
2) [
5,
7,
8], which defines the microscopic state of the system, depending on the physical situation the system is placed in.
where
and
are the absorption energy per site and chemical potential of a site, respectively. The parameter
describes the occupation of a site and it can take two values: zero when a site is empty or unity if a site is filled by H-atoms. The
parameter is defined as
, where
is the Boltzmann constant and
T is the absolute temperature.
Assuming that all of the receptor sites
per unit absorbent mass are indistinguishable, which means that hydrogen atoms may be stored on each site with equal probability, the total grand canonical partition function
can be expressed as Equation (
3) [
7,
8]:
The average occupation
of the receptor sites by H-atoms is calculated using Equation (
4) [
4,
5,
6,
7,
8,
9,
10]:
3.2. Model with Two Absorption Energy Levels
Based on Equation (
3), the model with two energy levels and variable numbers
and
of hydrogen atoms absorbed in two independent kinds of interstitial sites can be developed to calculate the amount of absorbed hydrogen versus pressure. For the purpose of this model (named Model 2), it was assumed that the number density of hydrogen absorption sites of the first type is
and that of the second type is
. The sites are characterized by the absorption energy values
and
, respectively. Consequently, the filling by hydrogen atoms of each type sites leads to the formations of two individual phases called
and
. The testing model can be treated as a simple topological issue. The total grand canonical partition function
for this model is given by Equation (
5) [
4,
5,
6,
7,
8,
9,
10]:
where the grand canonical partition functions
and
are related to the first and second site types, respectively, are expressed by Equations (
6) and (
7):
The chemical potential
is given by the equation
, where
is the chemical potential of the site and
n is the number of atoms per site. The chemical potential
of a hydrogen molecule in the gaseous state is expressed by Equation (
8) [
4,
5,
6,
7,
8,
10].
The partition function
Equation (
9) of a free hydrogen gas molecule can be expressed by partition functions of a translational Equation (
10) rotational Equation (
11) and vibrational degrees of freedom [
7,
8,
10,
11], where:
where
m is the mass of the absorbed atom (1.00784 u),
h is the Planck’s constant and
V is the volume of the studied system. The translation partition function per volume unit
, for an ideal gas, can be formulated versus the saturated vapor pressure
and the vaporization energy
as Equation (
12) [
5,
6,
7,
8]:
Using the canonical partition function given by Equation (
5) and the expression from Equation (
4), the average numbers
and
of occupied sites for
and
type are given by Equation (
13) [
7,
8,
10]:
where
and
are the numbers of hydrogen atoms per site,
and
are the pressures at half saturation respectively, for the
and
sites. According to Equation (
4) and using the average site occupation
derived by Equation (
13) the average number of absorbed H-atoms
can be describe by Equation (
14) [
7,
8]:
Finally, combining Equations (
13) and (
14) the formula to express the amount of the absorbed hydrogen
as a function of pressure can be expressed by Equation (
15) [
7,
8].
3.3. Model Adjustment and Validity
Three analytical models, most frequently used in literature to describe such systems are listed in
Table 1 [
7,
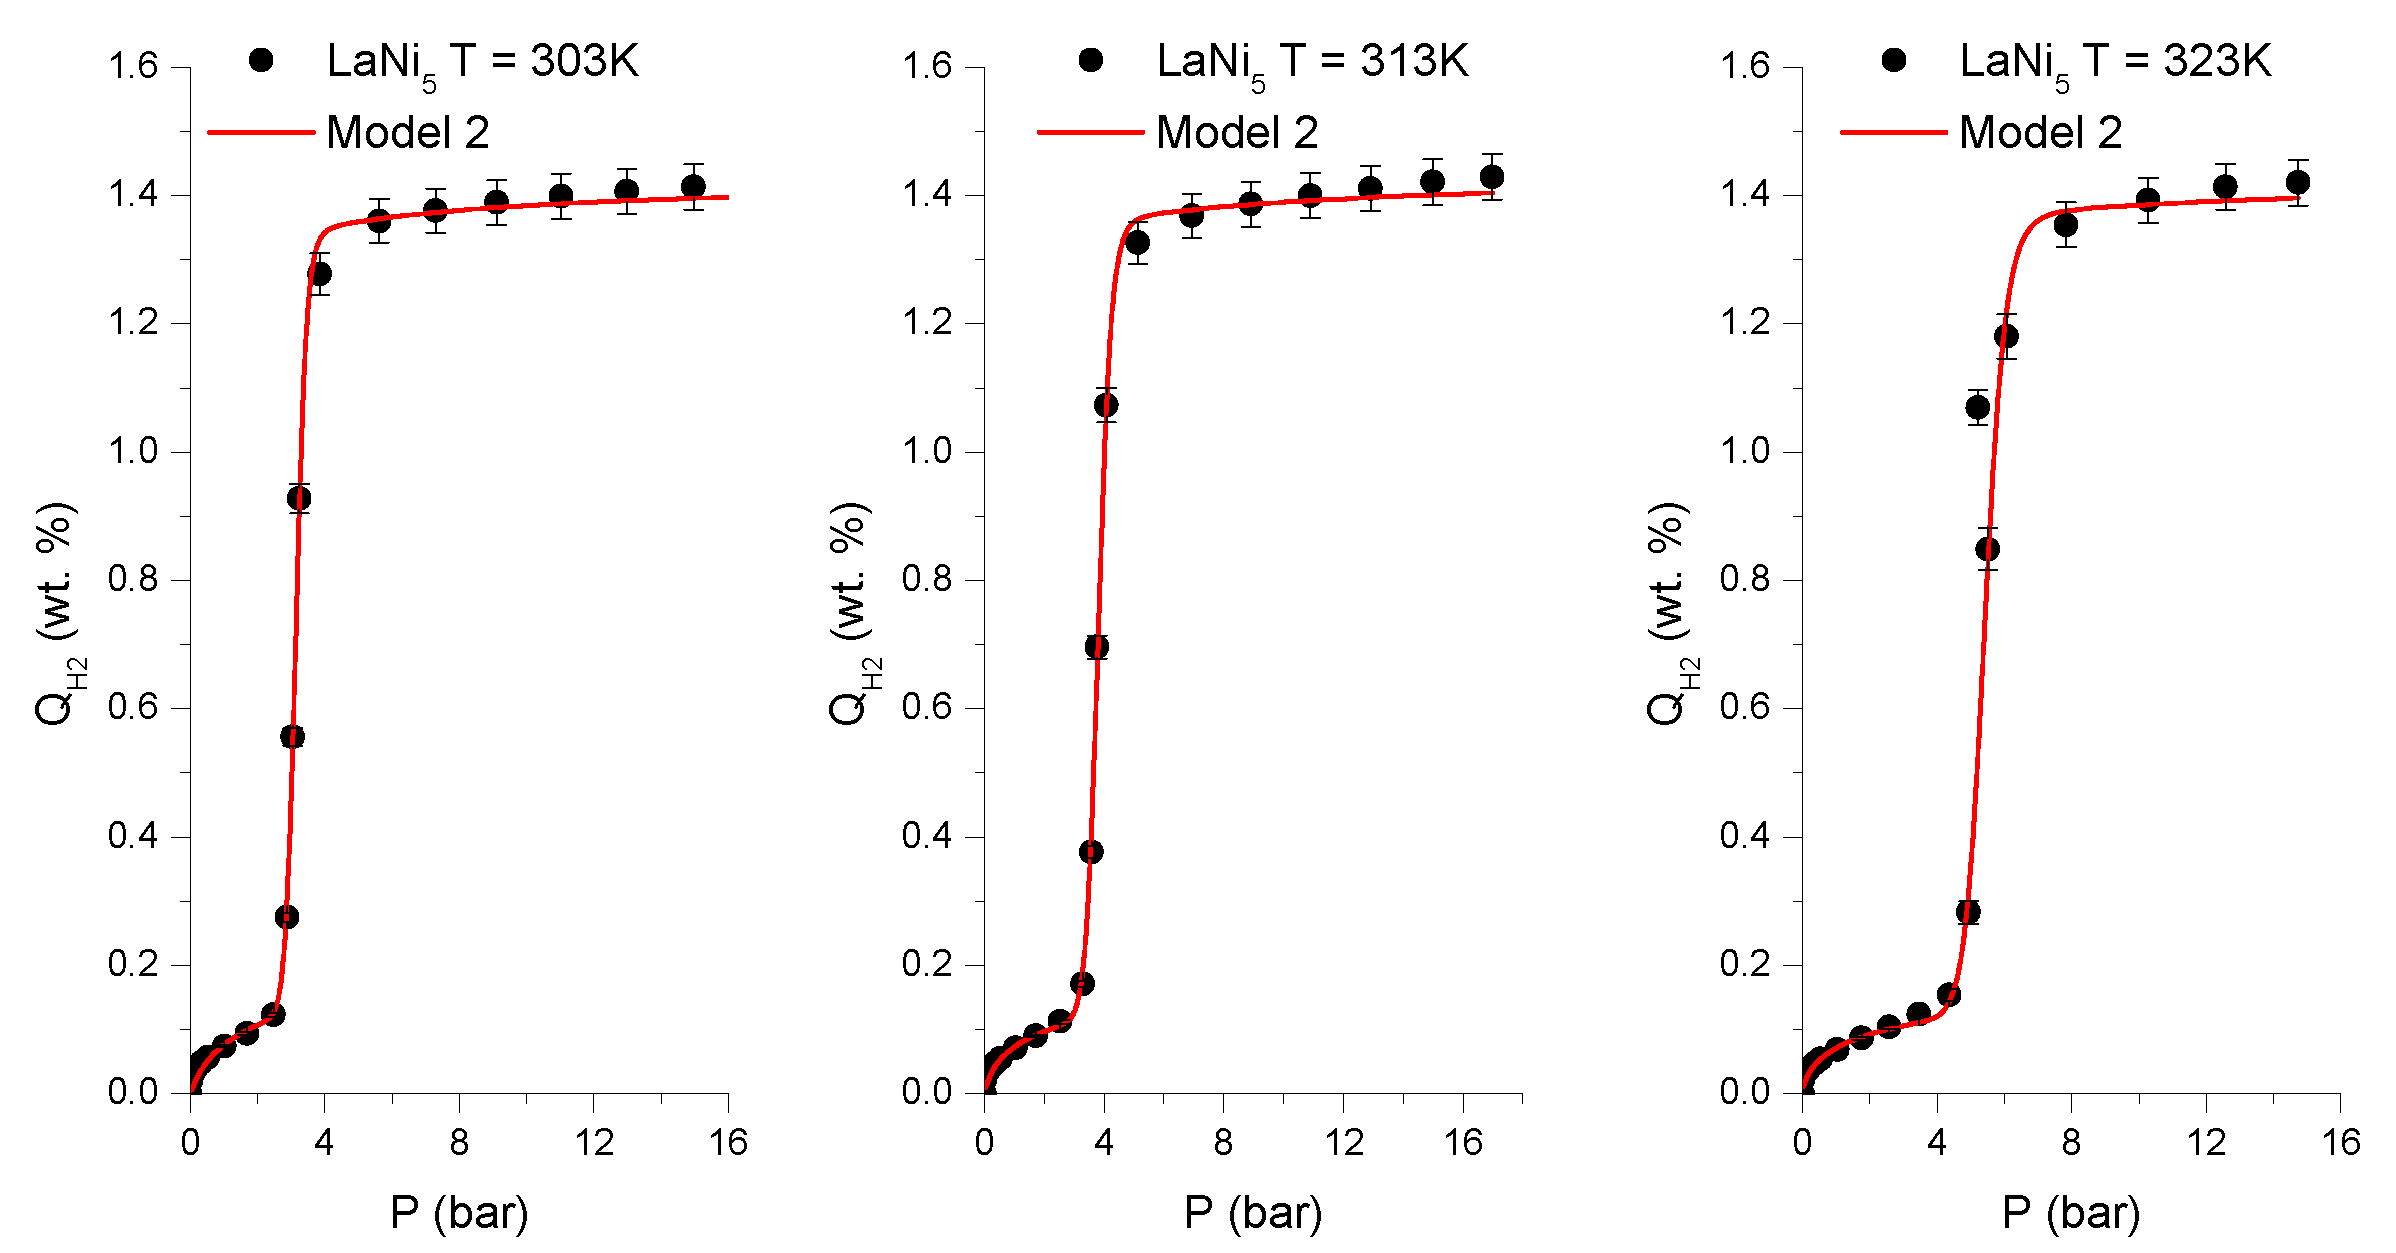
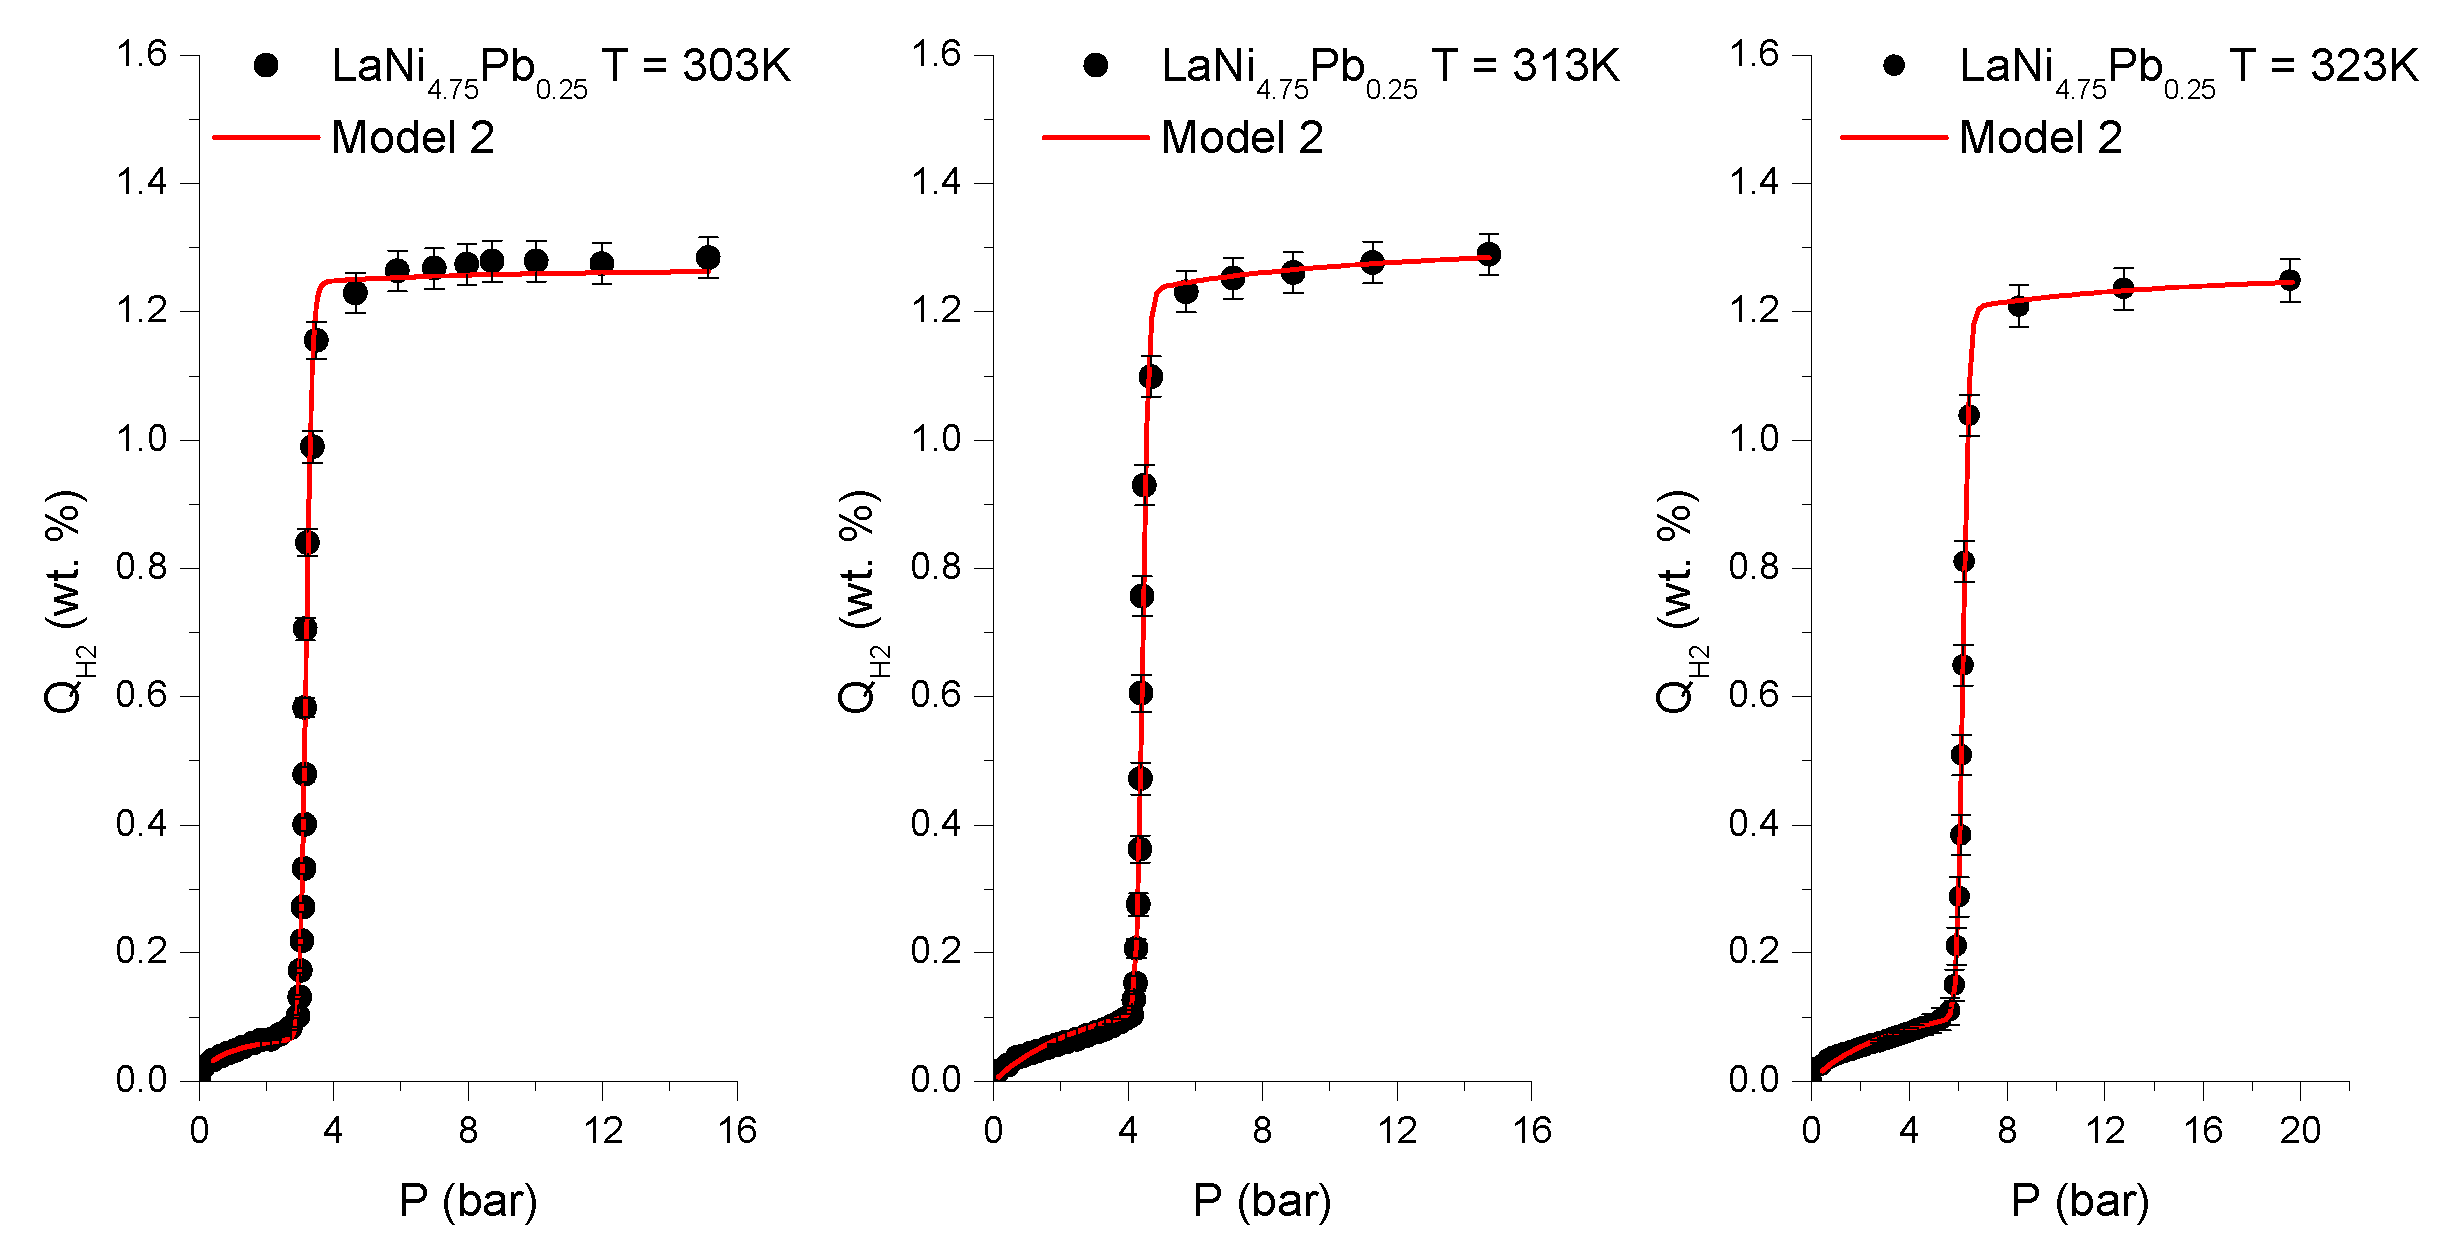
8]. The selection of the appropriate model to fit the experimental data is made on a mathematical and physical level. The three applicable models have been tested by fitting them to the experimental hydrogen absorption isotherms of the LaNi
5 and LaNi
4.75Pb
0.25 alloys. The quality of a fit was checked based on the regression correlation coefficient
and residual root mean square error RMSE—also known as the estimated standard error of the regression [
4]. The fitted model is considered to show a good agreement with absorption isotherms if the regression coefficient
is close to unity and the value of RMSE is close to zero.
The acceptable values of the correlation coefficients
and RMSE (
Table 2) were obtained for Model 2, assuming two energy levels
and
. From the physical point of view, the validation of models should be done in accordance with the real system properties, e.g., its crystallographic structure.
Many intermetallic AB
5 alloys including LaNi
5 and LaNi
4.75Pb
0.25, crystallize in the hexagonal CaCu
5 type structure with
space group [
1,
3]. The unit cell contains one La atom in the Wyckoff
position and five Ni atoms located in two crystallographic positions. Two nickel atoms labeled Ni
1 are located in position
and three Ni atoms labeled Ni
2 in position
.
In this structure there are capacious tetrahedral (Th) type interstitial site formed by La and Ni atoms e.g., Ni4 , LaNi2Ni2, LaNi3gNi22c, LaNi23gNi2c, and the octahedral (Oh) type site La2Ni22cNi23g. The difference in interatomic distances and types of atoms creating the interstitial sites (Th) and (Oh) lead to their different hydrogen absorption energies and chemical potentials . For this reason, during absorption process the hydrogen atoms fill the above mentioned sites at two different absorption levels at different pressure values and . In consequence, two phases denoted as and appear during the overall process. The phase is a solid solution of hydrogen in an alloy with low hydrogen concentrations (∼0.1 wt.%) and the second phase is a full metal hydride with the maximum hydrogen concentration (∼1.2 wt.%).
These assumptions make Model 2 the most appropriate to describe intermetallic hydrides of the AB
5 type. The results obtained for this model are collected in
Table 2 and
Table 3 and
Figure 1 and
Figure 2. A slight misfit of the tested model in the low hydrogen concentration range (<0.1 wt.%) may be due to the effects of samples grains powdering [
7].
The tested model (Model 2) with two types of interstitial sites contains six adjustable parameters divided into two groups. The first group are steric parameters including the numbers of hydrogen atoms per site , and number densities of receptor sites , in phases , . Parameters from the second group define the interaction between a hydrogen atom and an absorption site including the energy parameters, which can be expressed by the pressure of half saturation and for phases and , respectively.
3.4. Result Interpretations—Microscopic Investigation of Absorption Phenomena
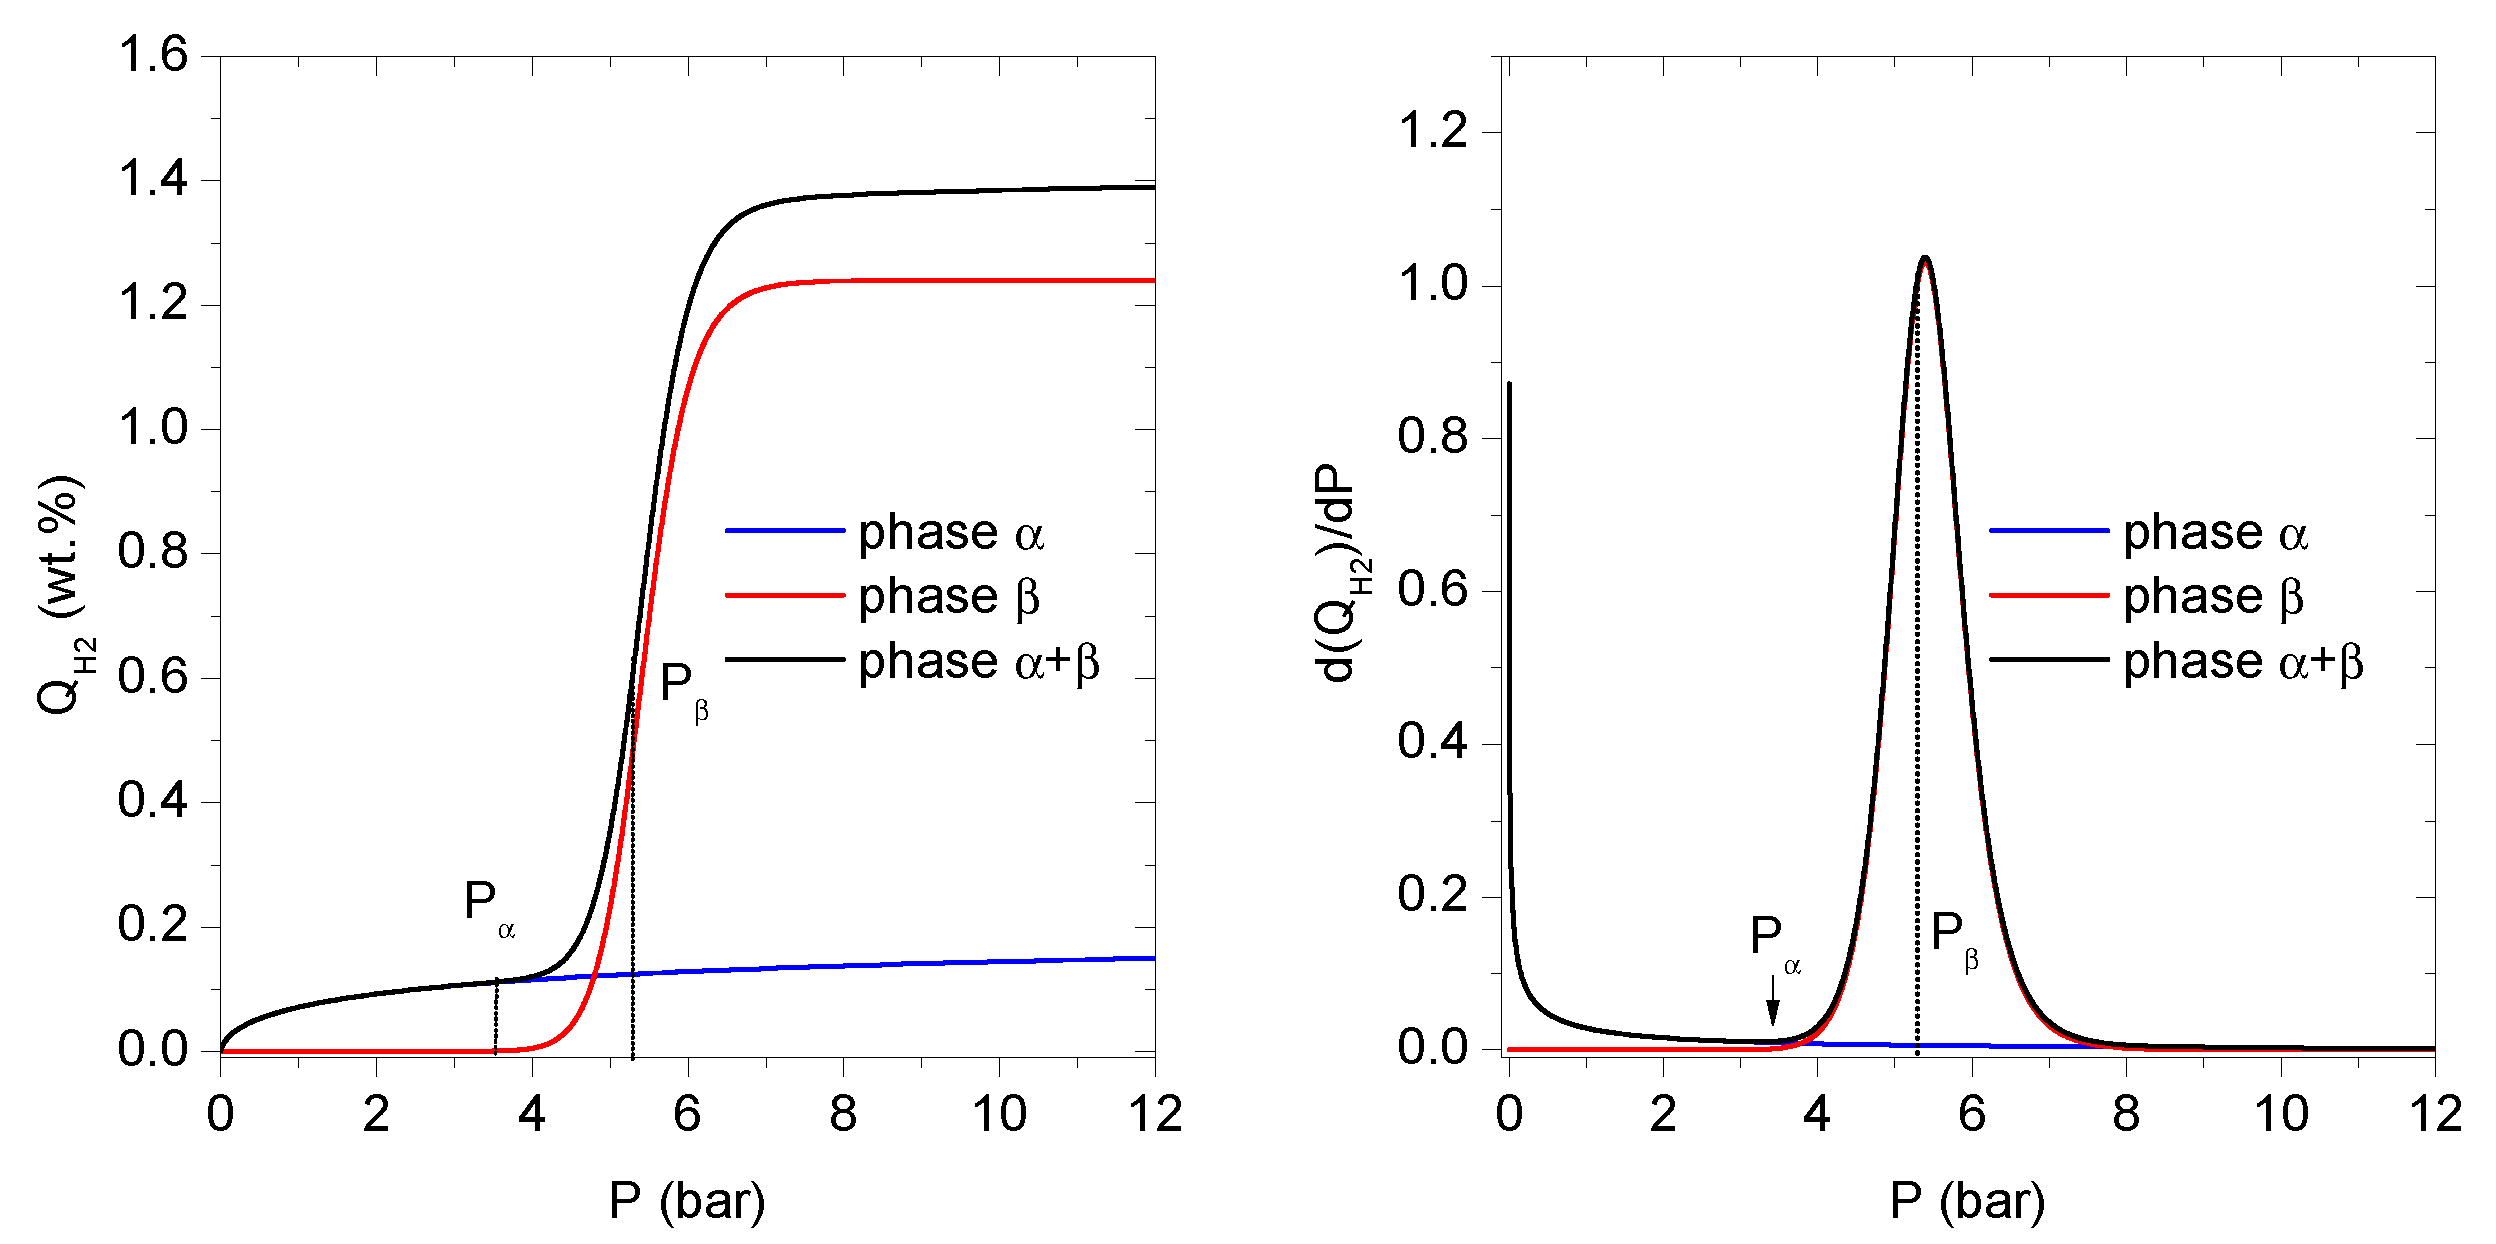
The effect of the increasing pressure of gaseous hydrogen on the
and
phases is presented in
Figure 3.
3.4.1. Pressure Domain I:
The derivative
(H
2 wt.%/bar), which represents the differential amount of absorbed hydrogen per pressure unit is shown in
Figure 3. The existence of maxima in
indicates the phase formation. For both LaNi
5 and LaNi
4.75Pb
0.25 alloys, maxima can be observed. The first maximum, centered below 1 bar, corresponds to the
phase formation, and the second maximum, at much higher pressure, is related to the
phase formation.
Starting from zero pressure up to
, the site occupancy by hydrogen atoms and
phase abundance grow as a result of the increasing hydrogen pressure surrounding the alloy. The abundance of the
phase rises intensively at low H pressures (below 0.9 bar); then the growth slows down until the saturation state is reached at
(
Figure 3).
This behaviour is similar for both compounds, and it can be explained by the fact that the majority of the
phase sites are empty at the beginning of the process. Because of that, the absorption energy of the first absorption site is enough to dissociate a hydrogen molecule in contact with the alloy interface, and then to physisorb H-atoms onto the alloy surface. After physisorption, H-atoms can diffuse into the bulk of the alloy [
12], and easily occupy the most energetically preferred interstitial sites of the
phase, even at a very low pressure.
The increasing hydrogen occupancy of the interstitial sites causes reduction in the number of available empty sites and slowing down of the whole absorption process. It is clearly visible as a characteristic “phase plateau” over the pressure
. Finally, the limit of the hydrogen capacity of the
phase is reached at pressure of
. At pressure interval below
the second term of
phase is almost null (
Figure 3).
3.4.2. Pressure Domain II:
The growing hydrogen pressure causes saturation of the
phase sites. Hydrogen atoms can then aggregate on the second type of sites, leading to the formation of the second hydride phase, the
phase. The peak indicating the formation of the
phase is spread out between
and
and centered around 5.4 bar for the base LaNi
5 alloy. The new phase is much richer in hydrogen and has a larger storage capacity with respect to the
phase (
Figure 3).
The development of the
phase is characterized by a relatively high number
of the absorbed hydrogen atoms at the beginning of the process. The hydride
phase is also characterized by a lower density of the sites
as compared to
for the
phase. Increasing the pressure up to
enables further growth of the hydrogen concentration
c in the
phase, while the saturation of the
phase is maintained. An experimental manifestation of this fact in the measurement data is a characteristic two—phase region (
+
) called “plateau” on the
curve (
Figure 1 and
Figure 2), fulfilling the Gibbs phase rule. The elevated hydrogen concentration in the alloy implies a significant H–H and M–H interaction in the
sites, leading to the lattice expansion.
3.4.3. Pressure Domain III:
Above the saturation plateau at
, the hydride consists of the
and
phases (
Figure 3). At pressures higher than
, the metal (alloy) hydride cannot absorb more hydrogen. In this pressure range the coexistence of two phases is observed with the abundance of 10% to 90% for
and
, respectively. Moreover, the
derivative does not show any peak at
, which can be explained as the absence of any phases other than
or
.
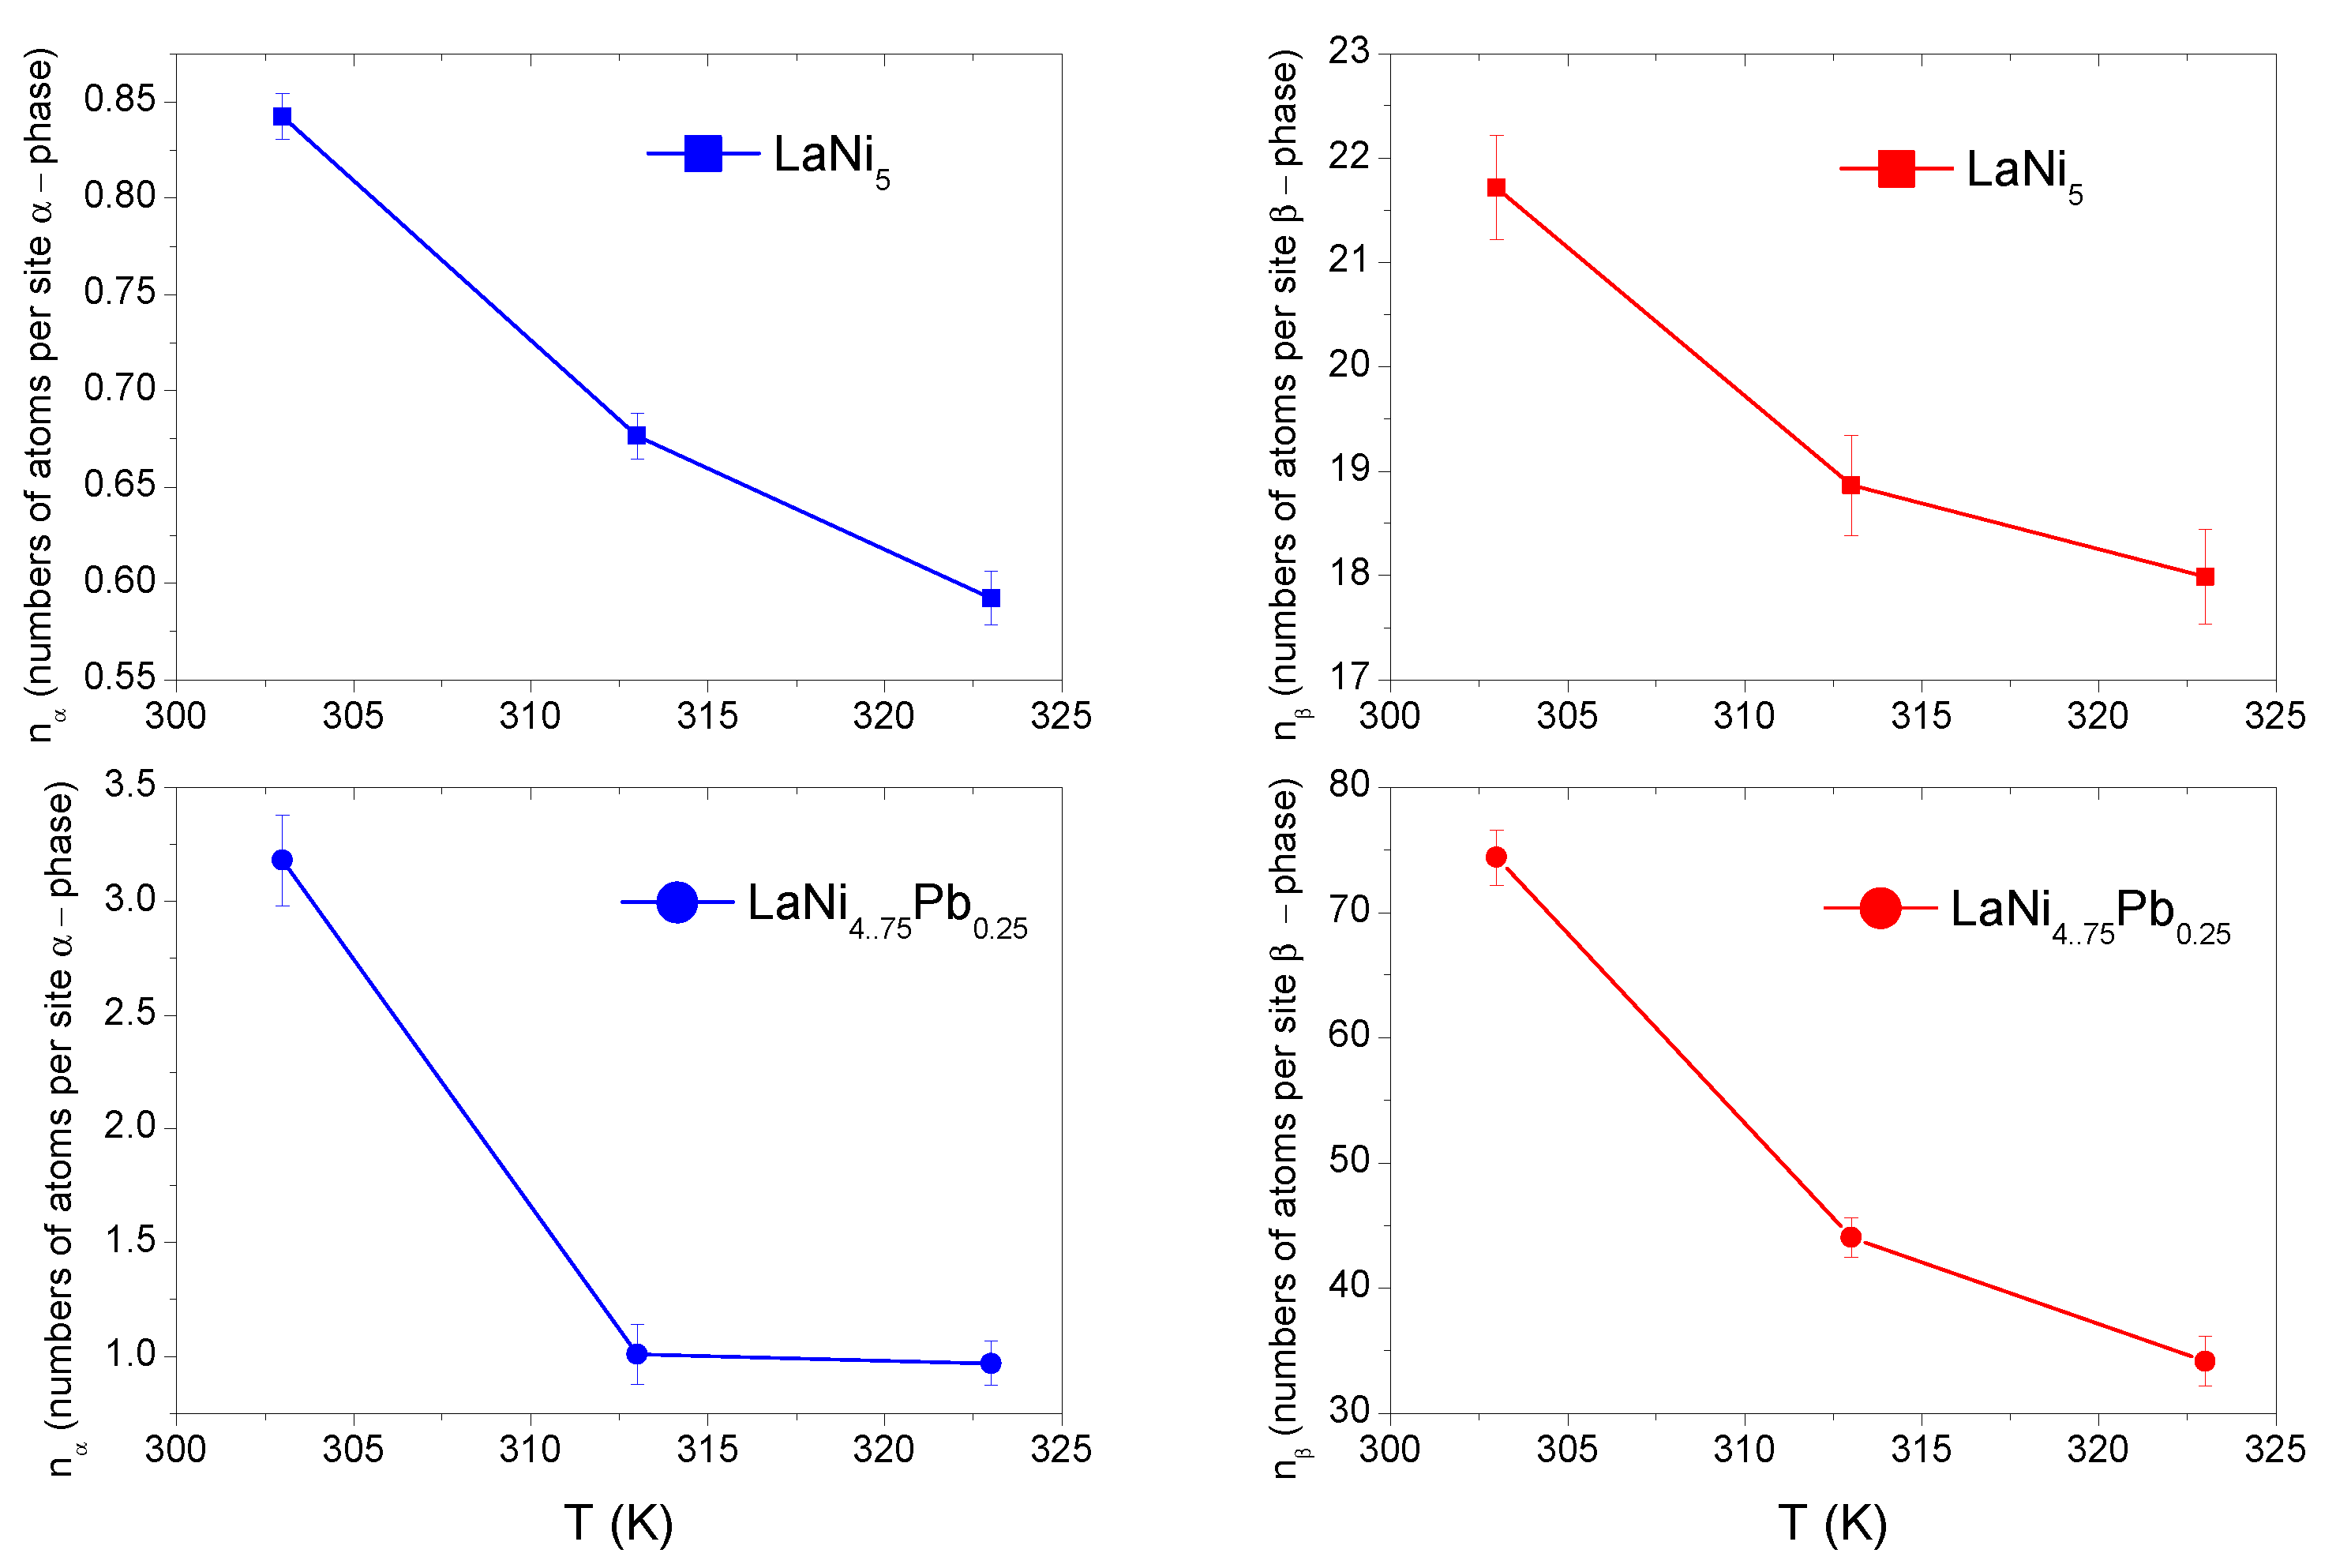
3.4.4. Study of the Model Parameters: and
Figure 4 shows the evolution of the number of H-atoms per site (
,
) with temperature.
The study of
and
parameter values allows one to deduce about two potential ways the absorbed atom can be anchoraged. The first manner, where both
and
take values lower than unity, is based on multianchorage. In this type of storage, the hydrogen atom can be anchored at many neighborhood sites or some numbers of available sites are occupied by exactly one hydrogen atom—leaving the rest of sites empty. The second manner is based on a multiatom anchorage when the number of atoms per site
or
is greater than one (
,
> 1). This kind of anchoring occurs in situations where a particular interstitial site can contain more than one hydrogen atom [
7]. The temperature variations of the number
and
of H-atoms per site for LaNi
5, and LaNi
4.75Pb
0.25 are collected in
Figure 4. For the base alloy at 323 K,
and
take the values 0.59 and 17.99, respectively. It can be therefore concluded that H-atoms in LaNi
5 are stored by multianchorage in the
phase and multiatom anchorage in the
phase. The different situation is observed in LaNi
4.75Pb
0.25, where
,
have values greater than unity. Hence it can be concluded that rather the multiatom anchorage occurs in both phases. The above difference in H-atoms anchorage is a result of the larger unit cell for LaNi
4.75Pb
0.25 than LaNi
5.
The larger unit cell results in a larger volume of the absorption sites and allows the aggregation of H-atoms, while fulfilling the Westlake [
13] and Switendick [
14] criteria at the same time. The first criterion assumes that minimum radius of a site has to be over 0.4 Å, but the second one takes into account the minimum distance between two hydrogen atoms that should be greater than 2.1 Å.
The parameter attains values from 21.71 to 17.98 for LaNi5, and 74.40 to 34.17 for LaNi4.75Pb0.25 at temperatures of 303 K and 323 K. A larger value of in both compounds indicates that the phase sites are more capacious than the phase sites at the same temperature. For the LaNi5 alloy, the value is almost constant for the studied temperatures, in contrast to LaNi4.75Pb0.25, where is more temperature-sensitive. For both alloys LaNi5 and LaNi4.75Pb0.25, a decreasing trend in the number of H-atoms per site is observed, and this phenomenon is much stronger for the Pb-doped alloy.
The decreasing trend in the number of atoms per site is probably a consequence of two effects. The first one is the collisions between thermally activated disanchored hydrogen atoms with previous aggregates, the second effect includes the lattice expansion as a result of the rising interatomic distances during the formation the phase.
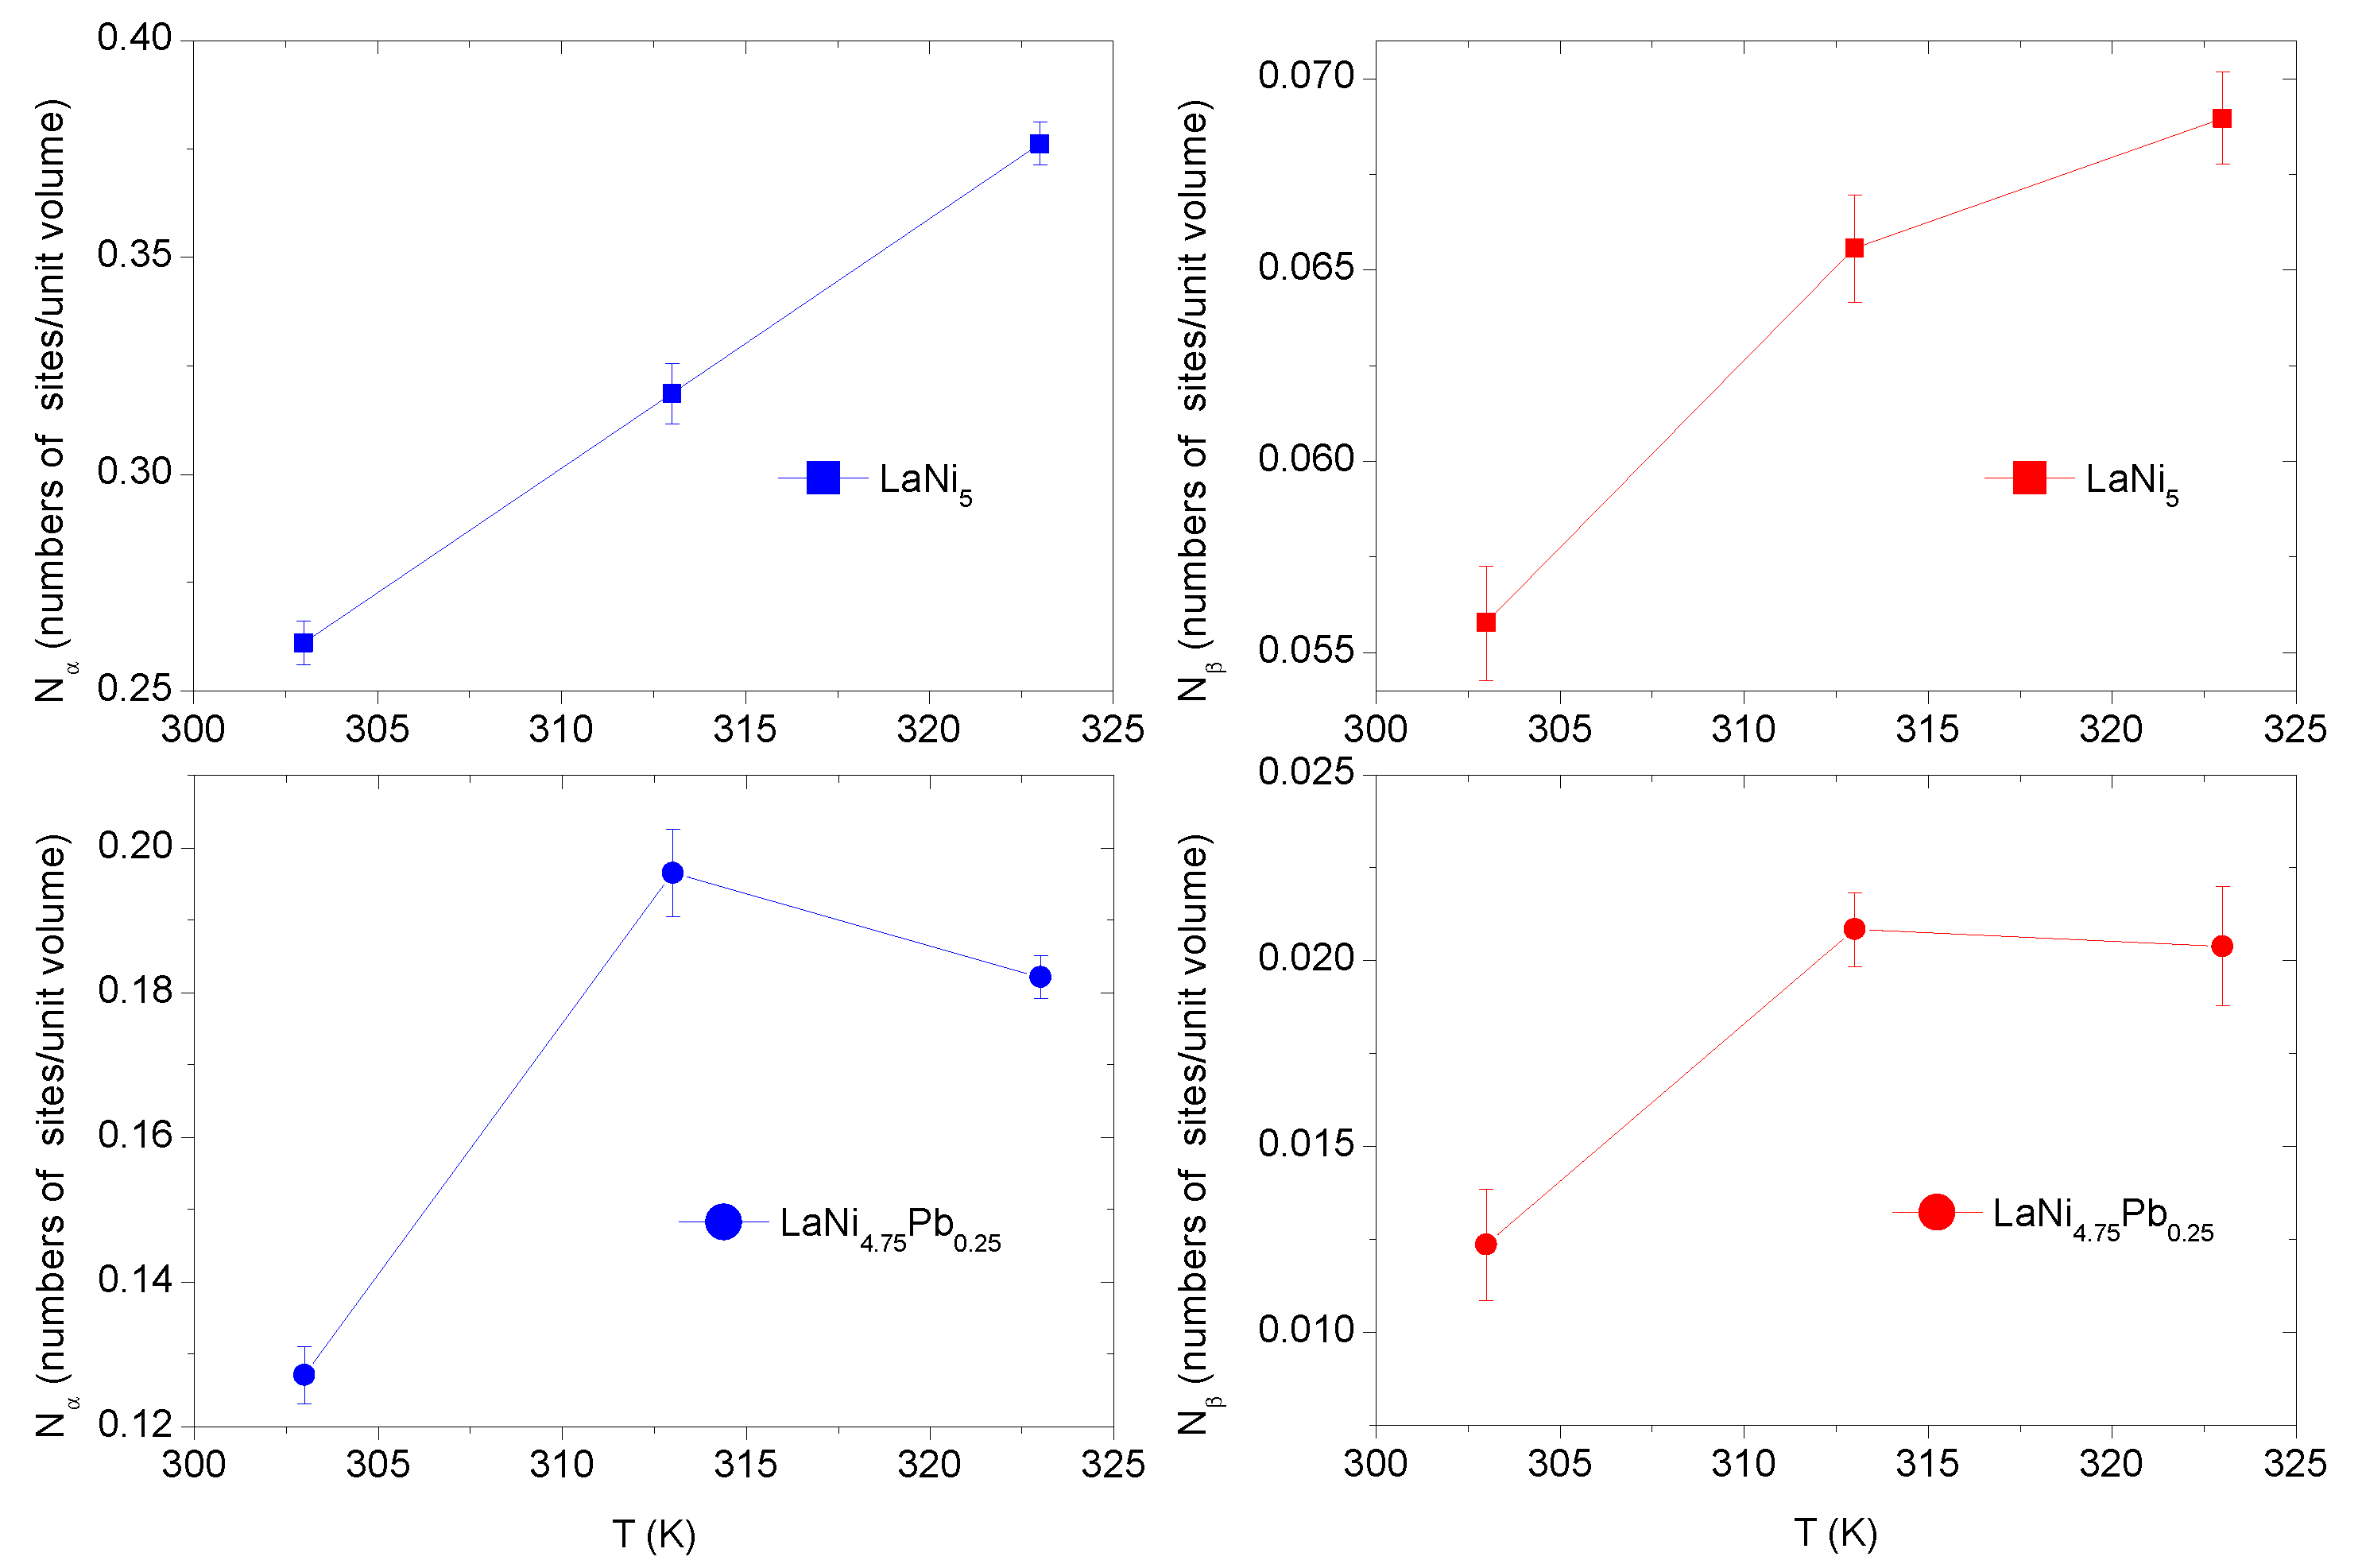
3.4.5. Study of the Model Parameters: and
The parameters
and
refer to the number densities of available receptor sites per alloy unit volume. The temperature evolution of the density of the still available interstitial sites (
and
) is shown in
Figure 5. The
phase receptor site density
is higher than
in the
phase for both alloys. The occupied number of receptor sites
and
increases with the increasing temperature, but with different dynamics—significantly for
and slightly for
. This is probably caused by the grain decrepitation phenomenon, through the expansion of lattice of the
phase and in consequences opening of the new available H-atoms receptor sites [
12].
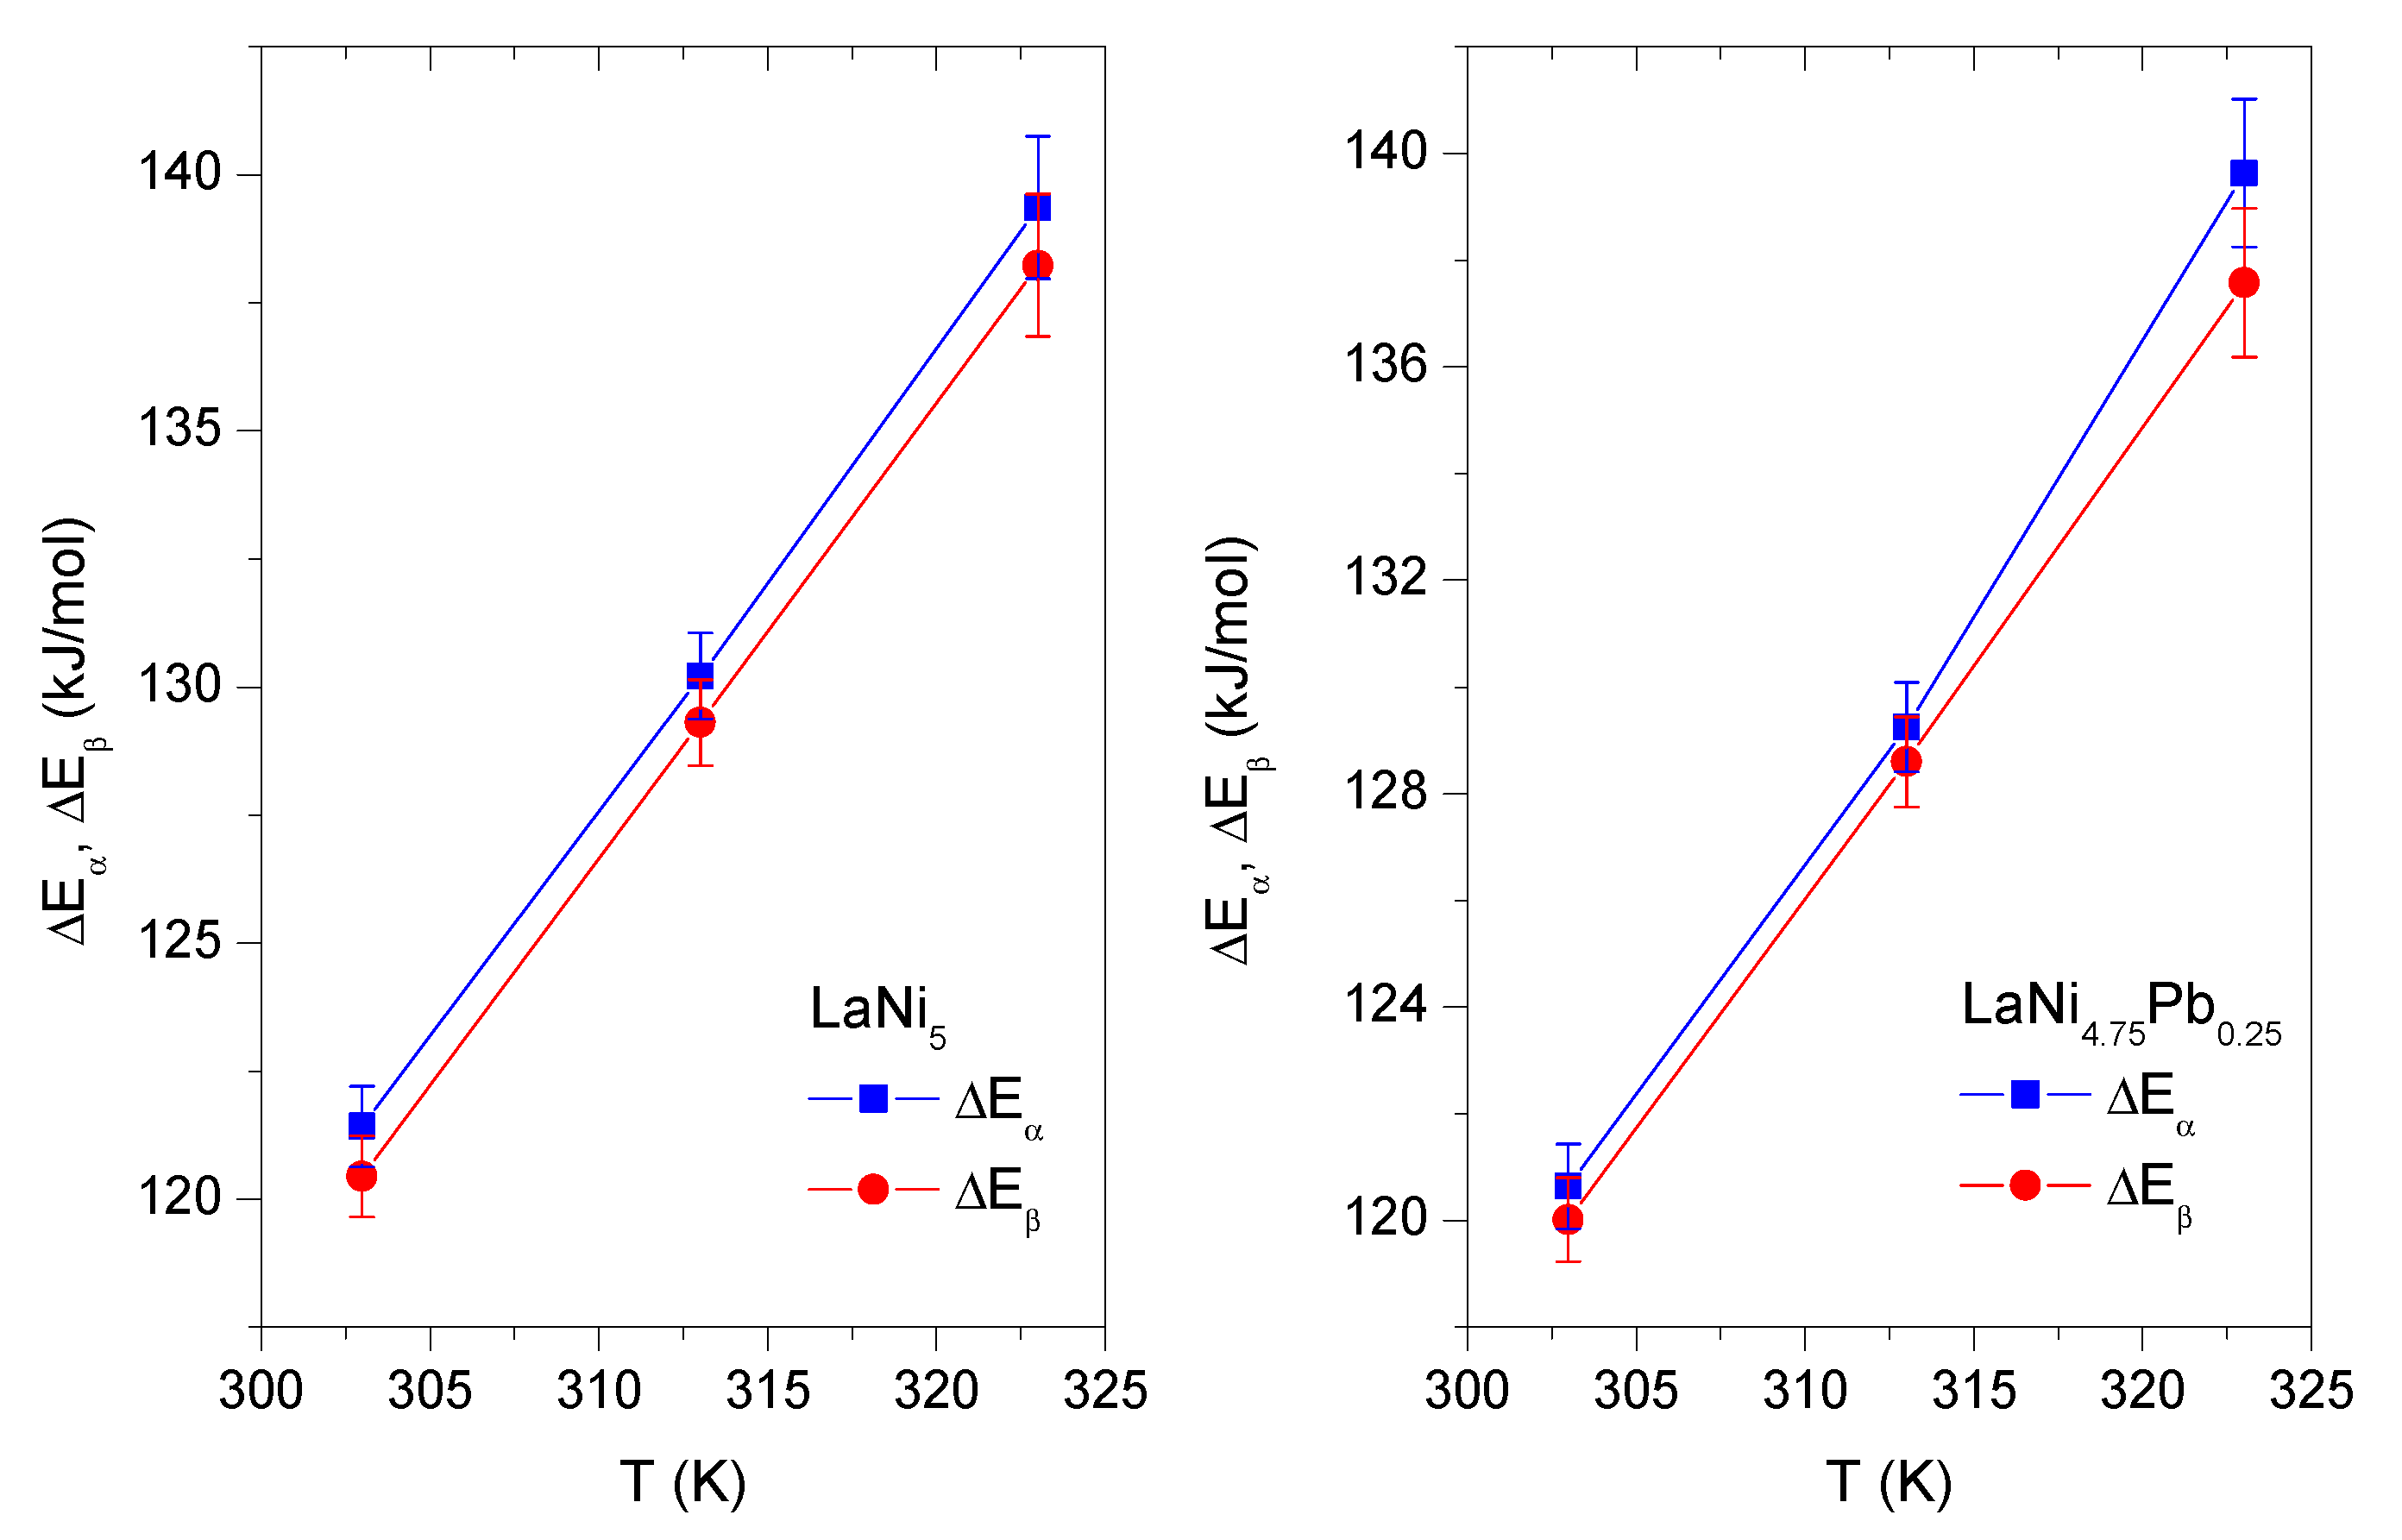
3.4.6. Study the Energy Parameters: Absorption Energies
The absorption energies
and
are calculated using values of the energy parameters
,
—fitted parameters from Model 2 and saturated vapor pressure
of the gaseous hydrogen. The
and
values are given by Equations (
16) and (
17) [
4,
5,
6,
7,
8]:
where
R is the ideal gas constant,
R = 8.314472 J/mol K and
is given by Equation (
18) [
4,
5,
6,
7,
8]:
The absorption energies
and
characterize the types of binding between hydrogen atoms and a host alloy sites in the phases
and
, respectively. The temperature evolution of the absorption energies
and
for LaNi
5 and LaNi
4.75Pb
0.25 are presented in
Figure 6 and in
Table 4. The absorption energy values obtained for LaNi
4.75Pb
0.25 are close to those obtained for the nondoped alloy LaNi
5, and they take values of over 100 kJ/mol in both cases. Hence it can be assumed that, for all investigated alloys, H-atoms are chemisorbed on the host alloys sites by creating metallic bonding, which are chemical in their nature. Moreover, in case of both compounds the relation
is preserved. The values obtained for the hydrides of alloys LaNi
5 and LaNi
4.75Pb
0.25 are comparable and consistent with values reported by other researchers for different hydrides of LaNi
5-xM
x type alloys. For example, in hydride LaNi
4.6Al
0.4, whose results are reported in [
6], at temperatures 303 K and 313 K, absorption energies
at
phase are 124.75 kJ/mol and 121.95 kJ/mol respectively. Similarly, for
phase,
takes the values 133.64 kJ/mol and 131.08 kJ/mol at the above temperatures.
For hydrides of LaNi
5 and LaNi
4.75Pb
0.25, the increasing values of energies
,
with the increasing temperature are observed. This behavior can be explained by the effect of thermal agitation. Thus, the sites have higher energies at growing temperature, which makes it more difficult to penetrate those volumes by hydrogen atoms. As a consequence, a greater pressure (energy) is required to deposit the H-atom at the same site. Thus, the absorption energy increases with increasing temperature (
Figure 6).
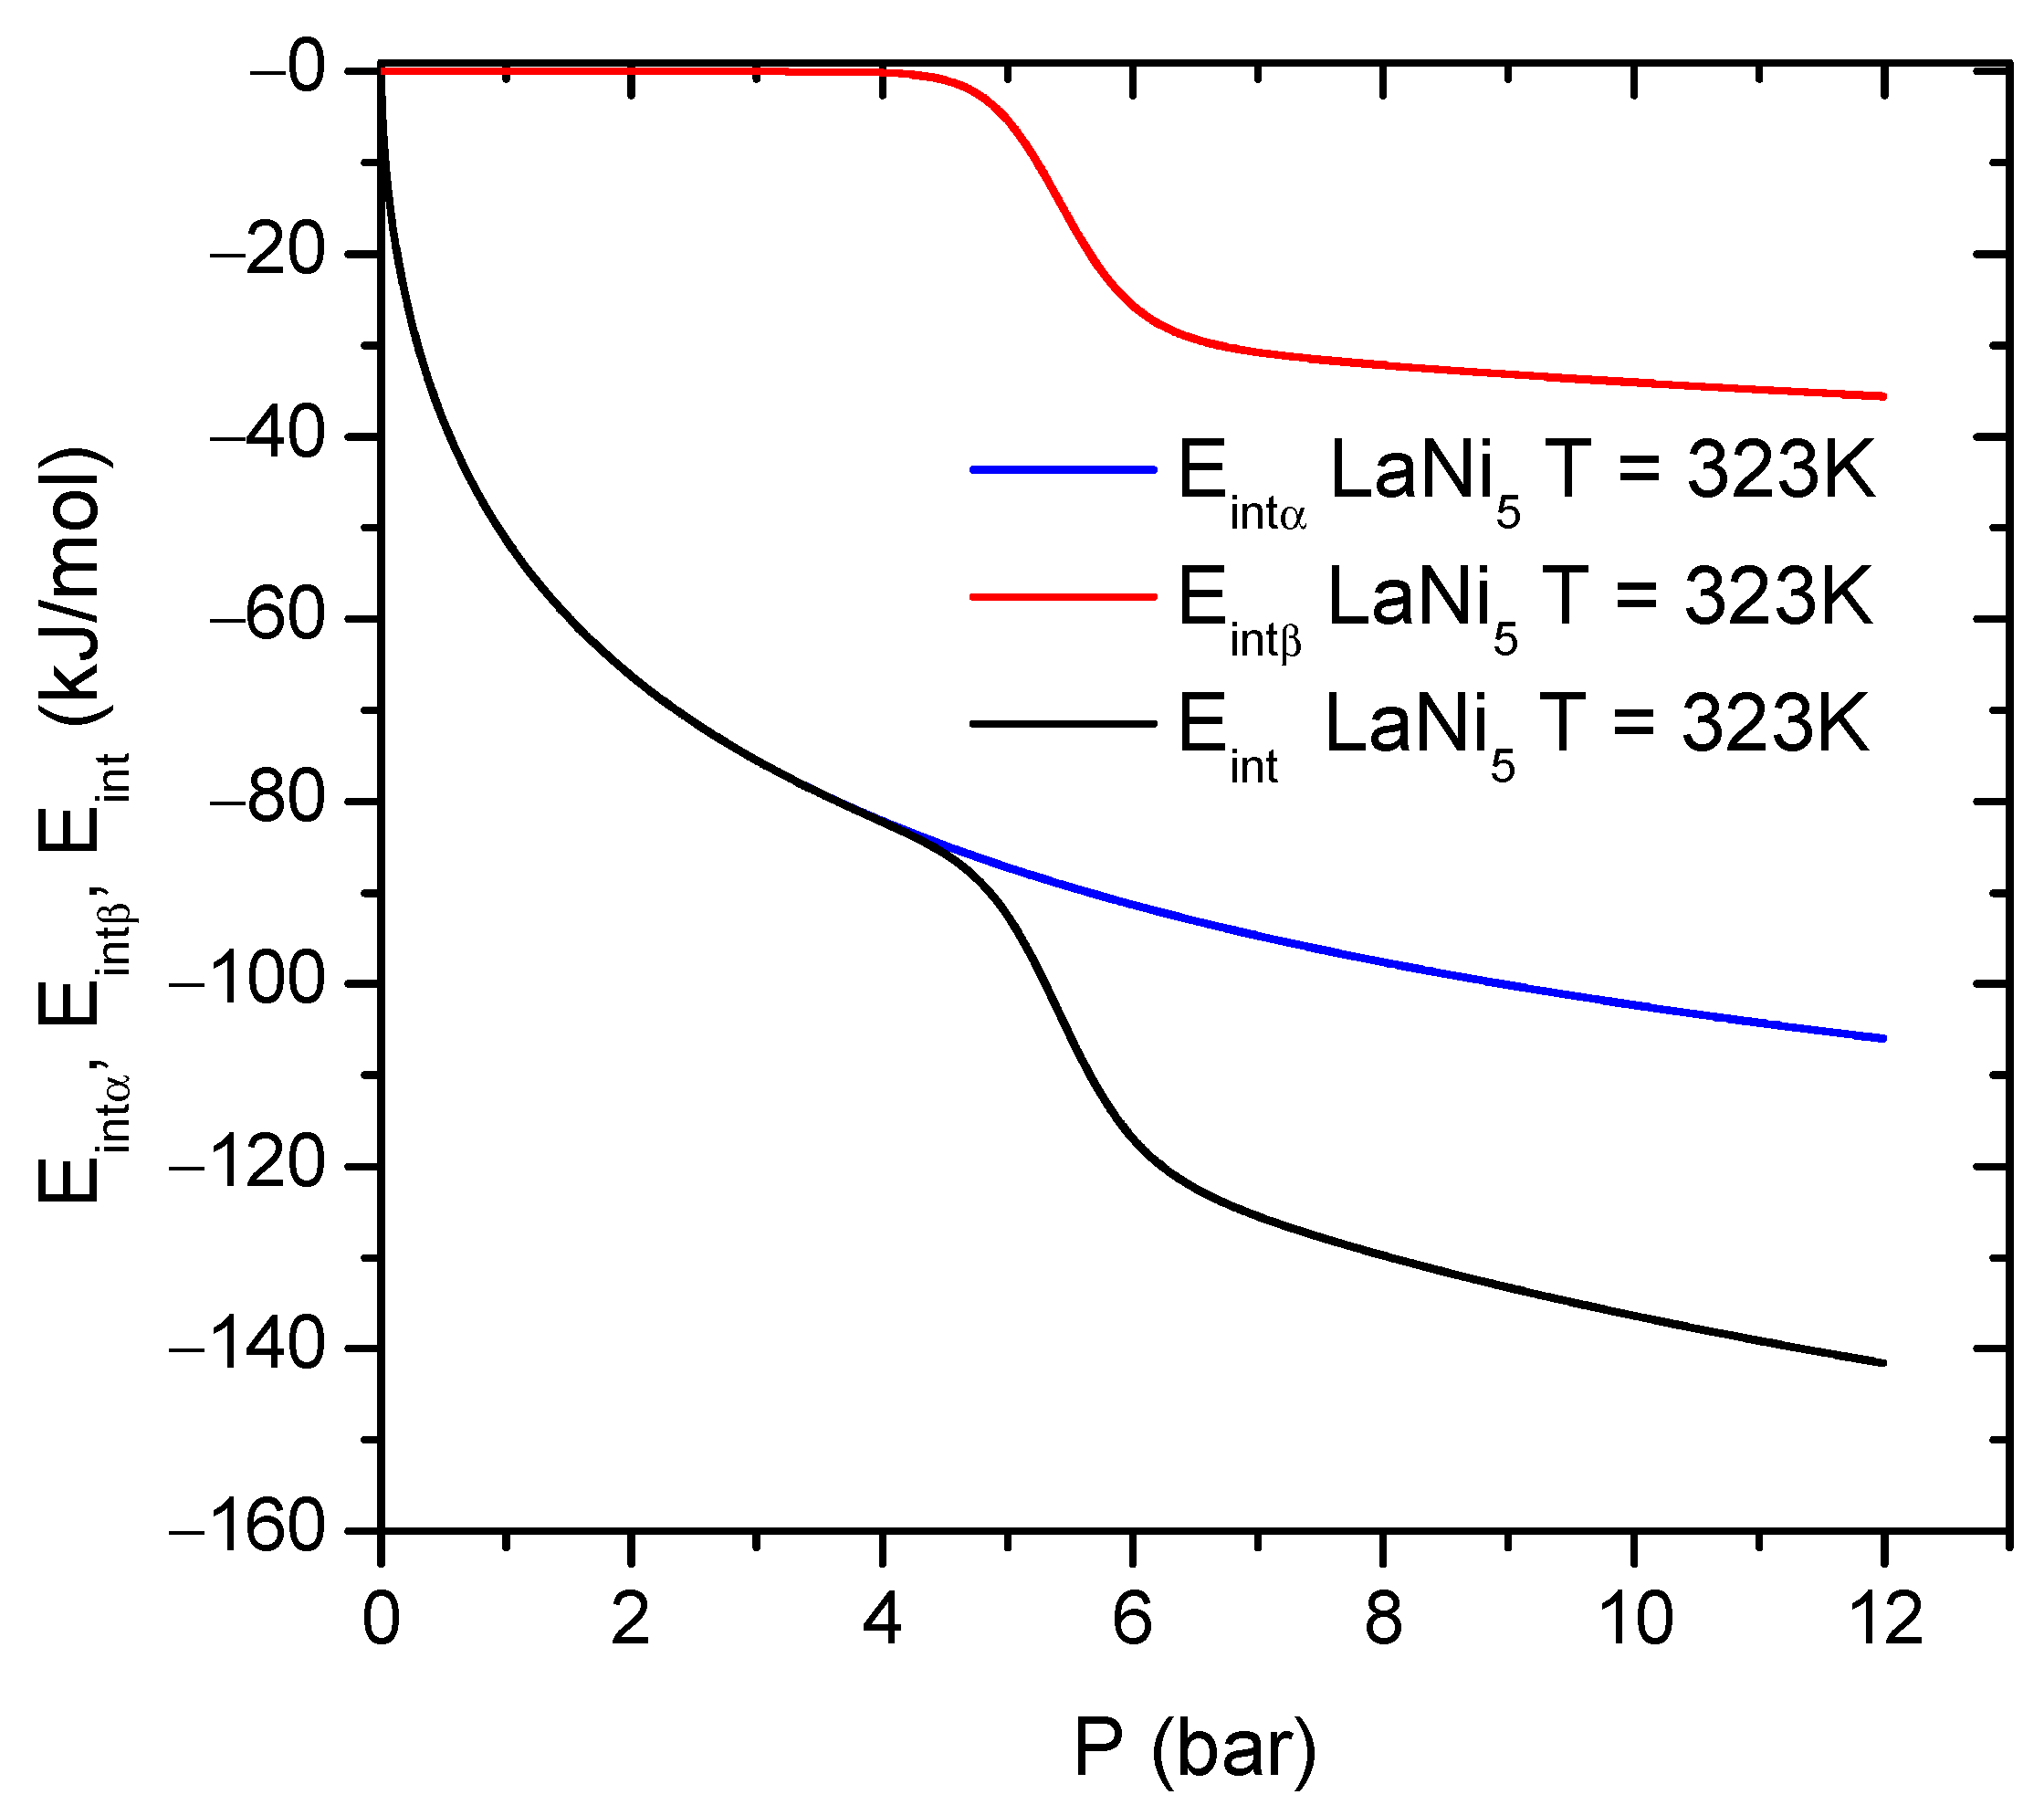
3.4.7. Investigation of Internal Energy
Internal energy
exists as a sum of all forms of energy stored in the system, including actual interactions between the gas–gas particles and gas–alloy receptor site. The internal energy
is given by Equation (
19) [
4,
5,
6,
7,
8]:
Equation (
19) for internal energy
can be further written as the following expression:
Thus, Equation (
20) can be divided into two additive contributions, given by Equations (
21) and (
22), originating from the first and second type sites from the
and
phases, which represent different absorption levels.
The results of the internal energy
computation are presented in
Figure 7.
At the beginning of the process (0 bar pressure), the internal energy is null. Increasing pressure leads to nonzero values of the internal energy and it then further algebraically decreases. During the whole hydrogen absorption process, the internal energy remains negative, with a step centered at the pressure of the
phase formation. The negative internal energy values are a manifestation of the exothermic nature of the absorption process and the release of energy to the environment. At a pressure below that of the
phase site saturation, the energy contribution
related to the second type site is rather constant and takes values close to zero. Increasing the pressure above
causes a step change in
(
Figure 7). Moreover, the contribution to
from the
phase shows a higher energy dissipation during absorption compared to the
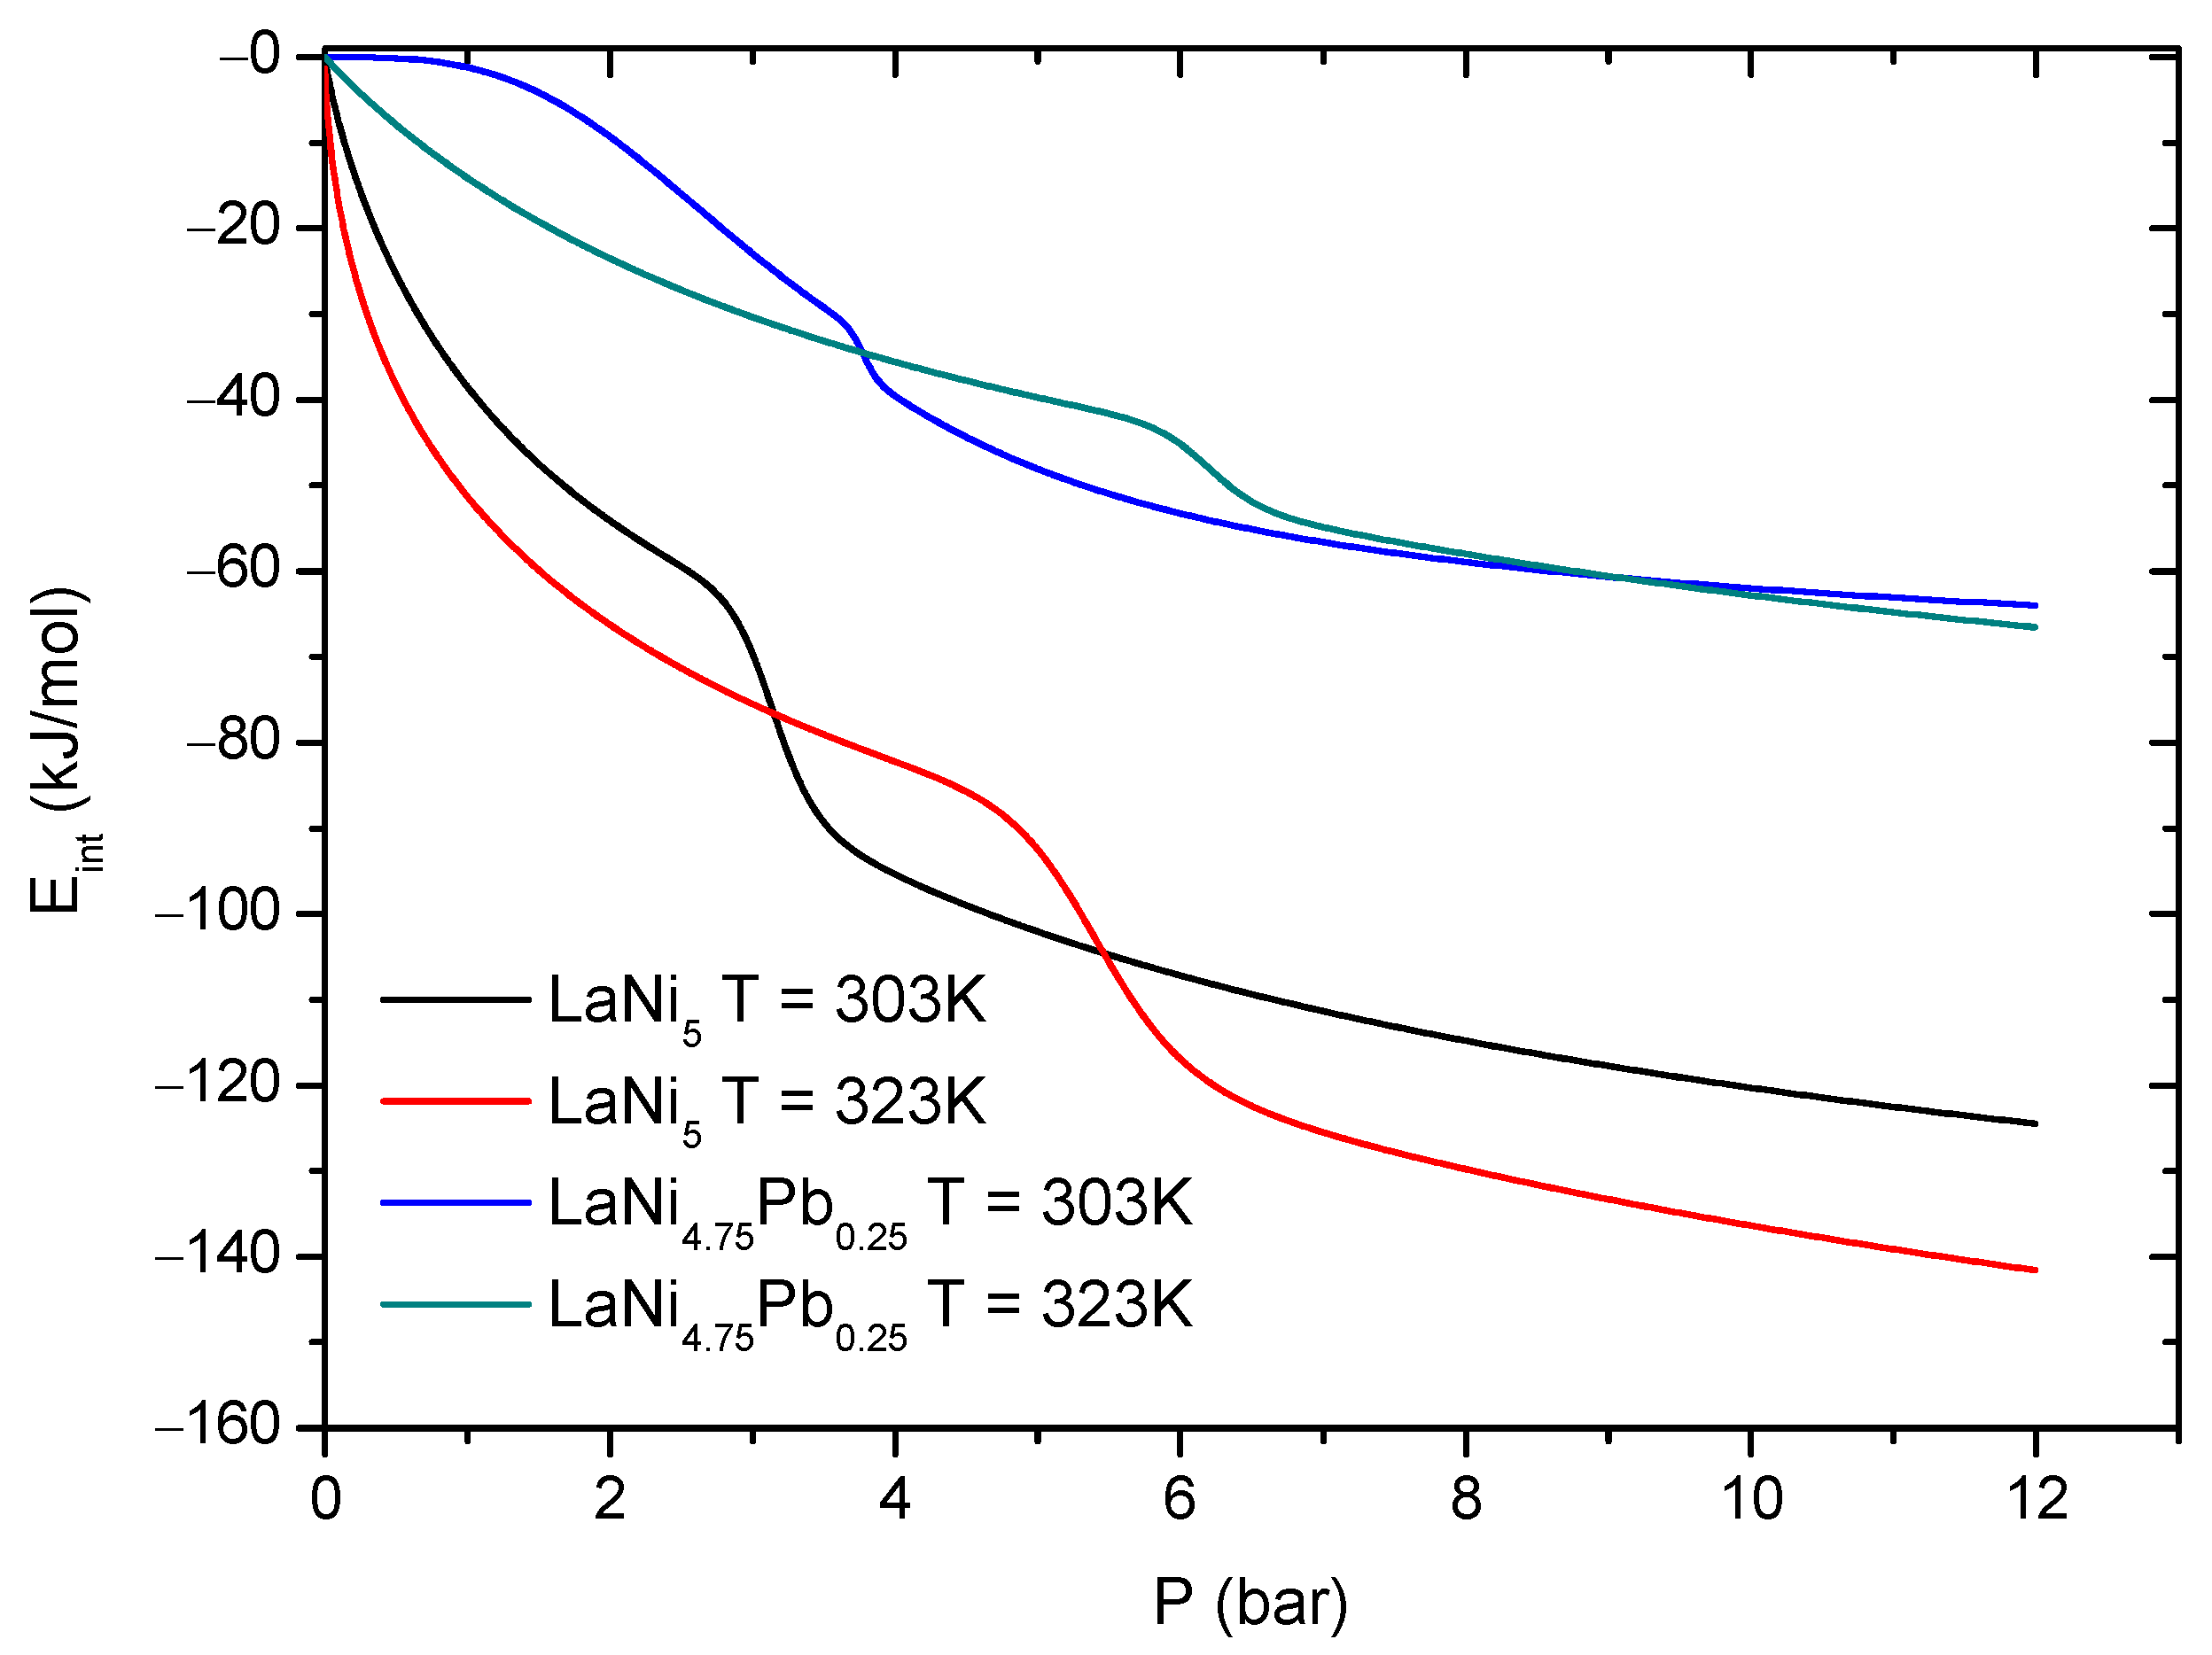
phase. The temperature evolution of the internal energy
versus pressure at the two absorption temperatures T = 303 K and 323 K for LaNi
5 and LaNi
4.75Pb
0.25 is presented in
Figure 8. At a fixed pressure, the total absolute
values are greater for LaNi
5 than for LaNi
4.75Pb
0.25. The absorption process for LaNi
5 is more energetic that for the nondoped alloy, as it requires or releases more energy (heat) during absorption/desorption process than for LaNi
4.75Pb
0.25 (
Figure 8).
3.4.8. Investigation of the Gibbs Free Energy
The Gibbs free energy
is one of the thermodynamic functions, which gives information about the spontaneity of the system and its interaction with external environment. The definition of
is given by Equation (
23) [
4,
5,
6,
15]:
where
is the absorbed quantity of hydrogen and
is the chemical potential from Equation (
8). Finally
can be written as Equation (
24):
Similarly as for the internal energy
, there are two contributions to the overall Gibbs free energy
, related to the absorption sites of two types from the
and
phases. Each contribution can be expressed by Equations (
25) and (
26).
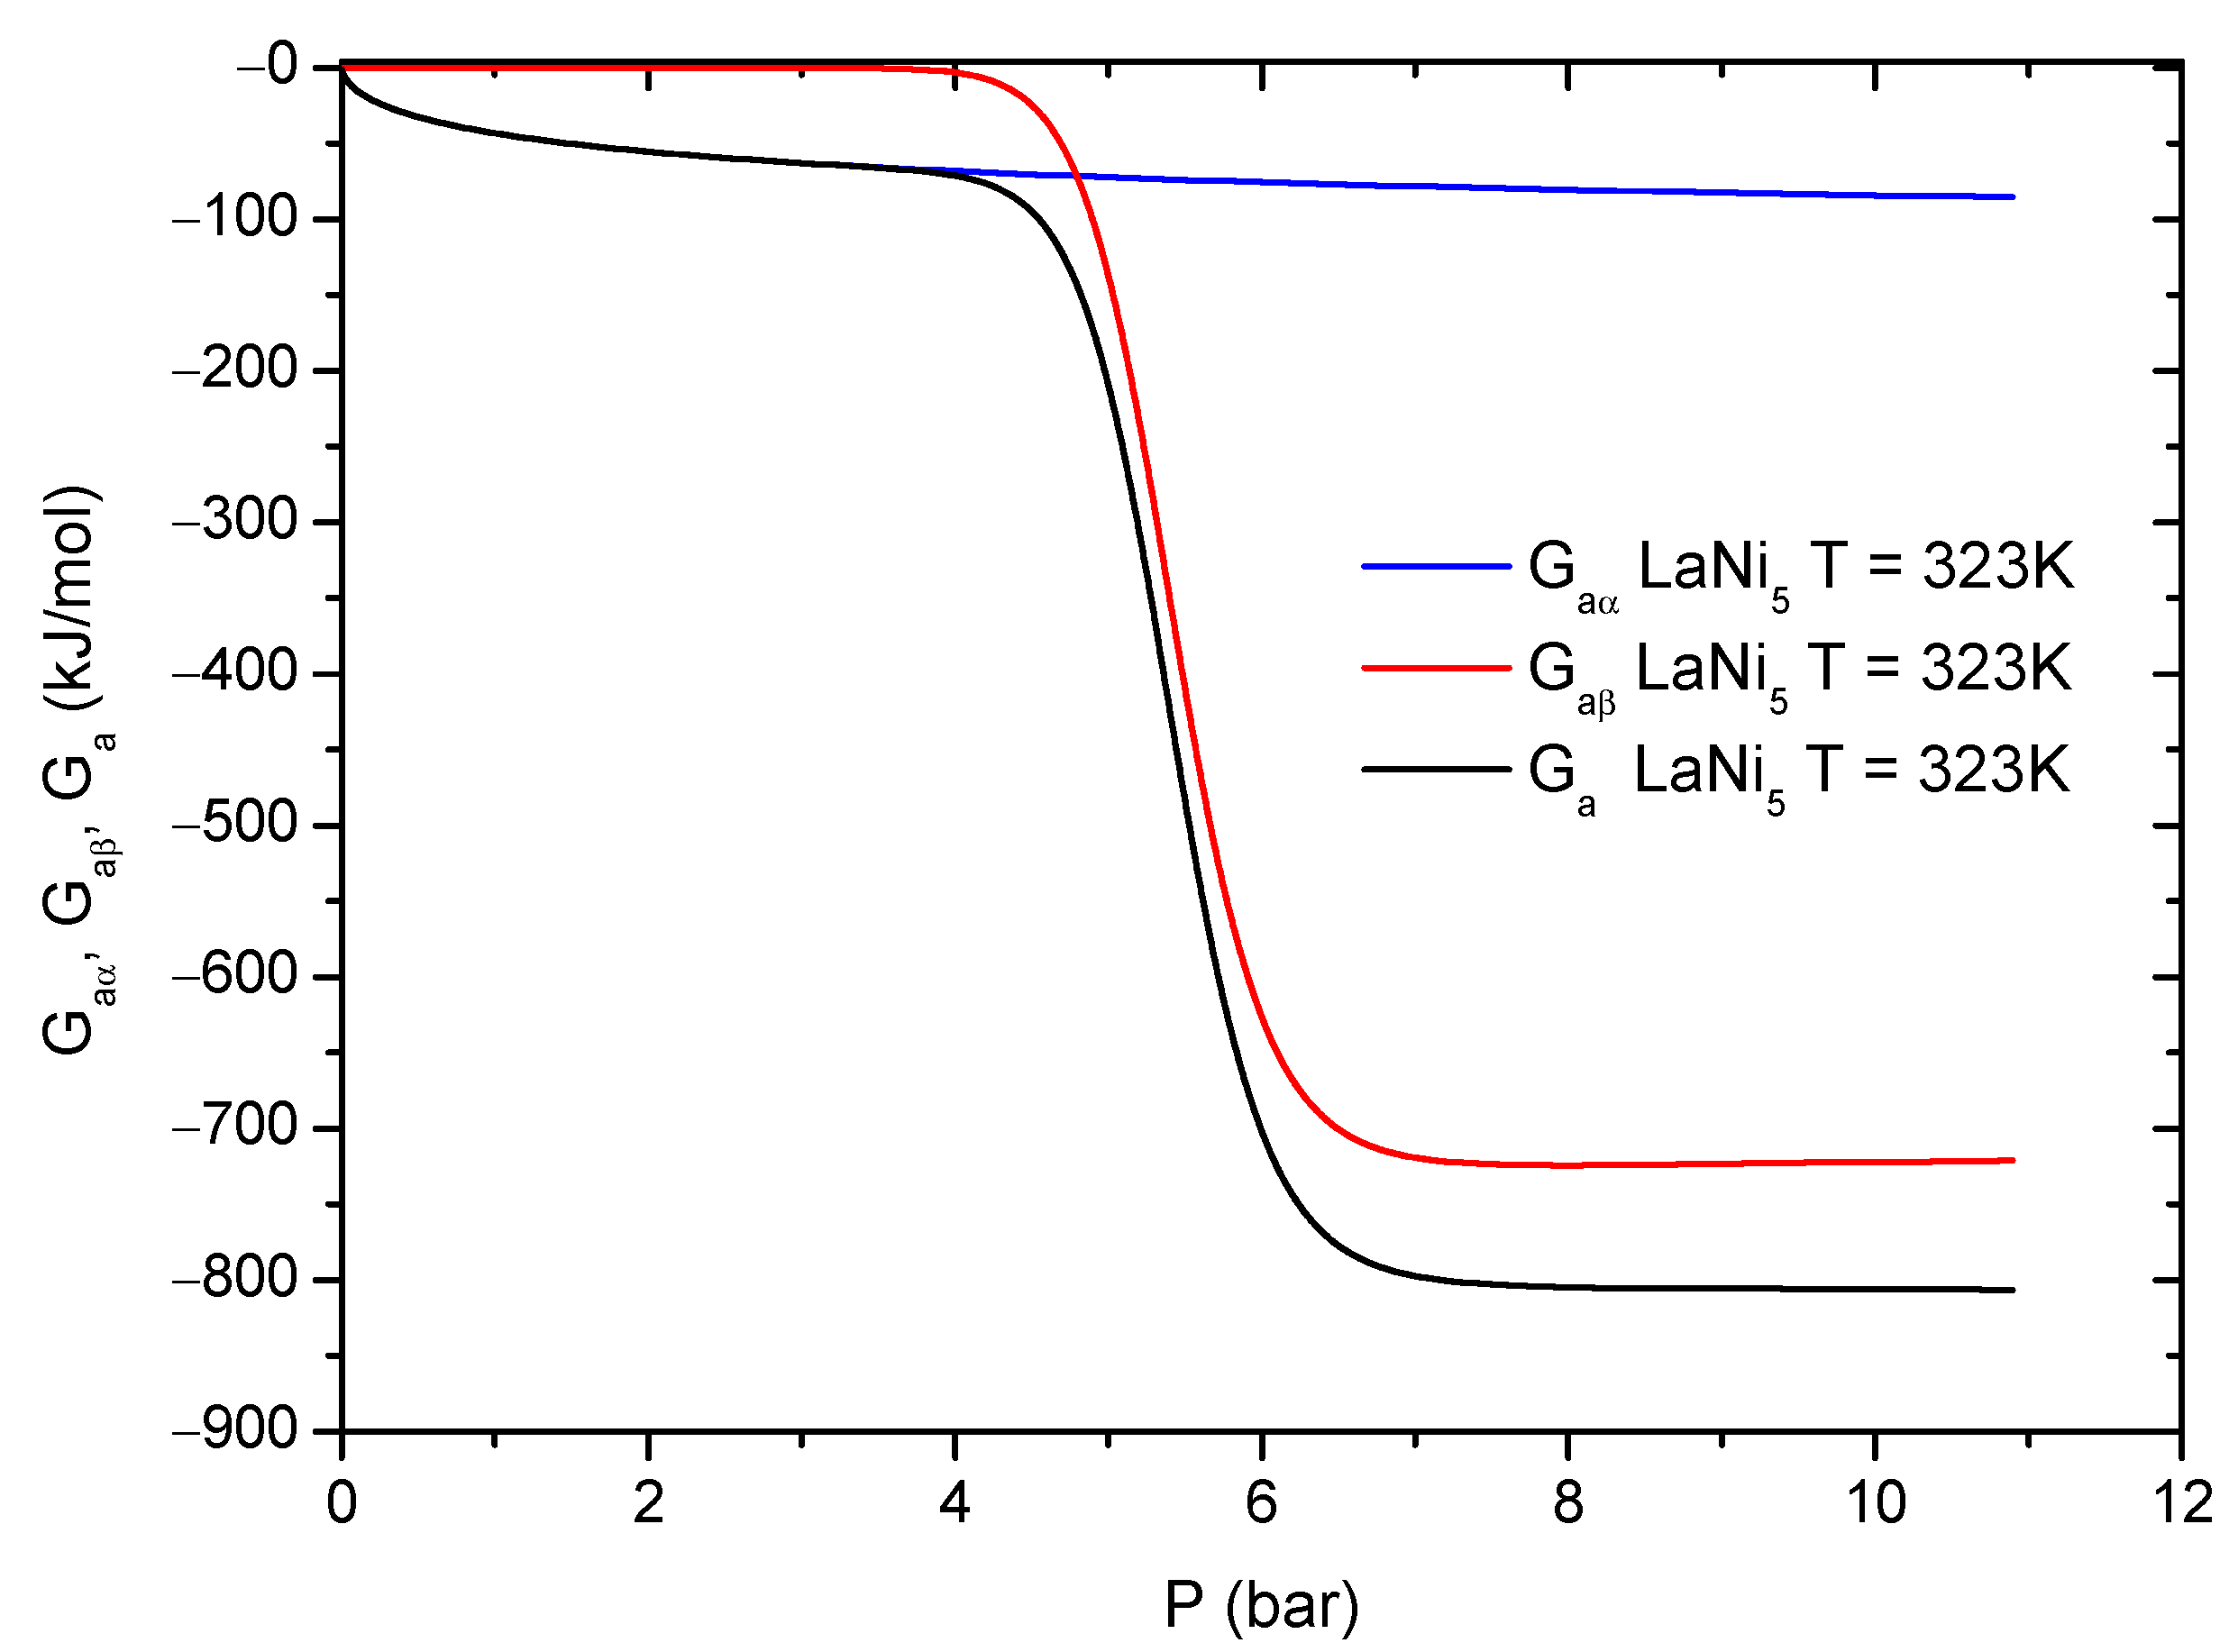
Figure 9 illustrates the evolution of the Gibbs free energy during the hydrogen absorption process for LaNi
5. The general discussion will be done on the example of LaNi
5. From
Figure 9, it can be noticed that the Gibbs free energy takes nonzero values first for the
phase. At pressure above
(saturation of the
sites),
is almost constant and the absorption process at the
phase sites loses its previous spontaneity. At the same pressure range, the
free energy contribution becomes significant. However, the Gibbs free energy
related to the second phase site takes lower values, therefore it can be concluded that the H-atoms absorption process is much more spontaneous for the
phase than for the
phase. The
phase sites are much more energetic than the
phase sites, which reflects in higher absorption energies (
Figure 6 and
Table 4).
The Gibbs free energy values in the high pressure range are negative. Hence, absorption phenomena are spontaneous in their nature. At a fixed pressure and increasing temperature, the values of total
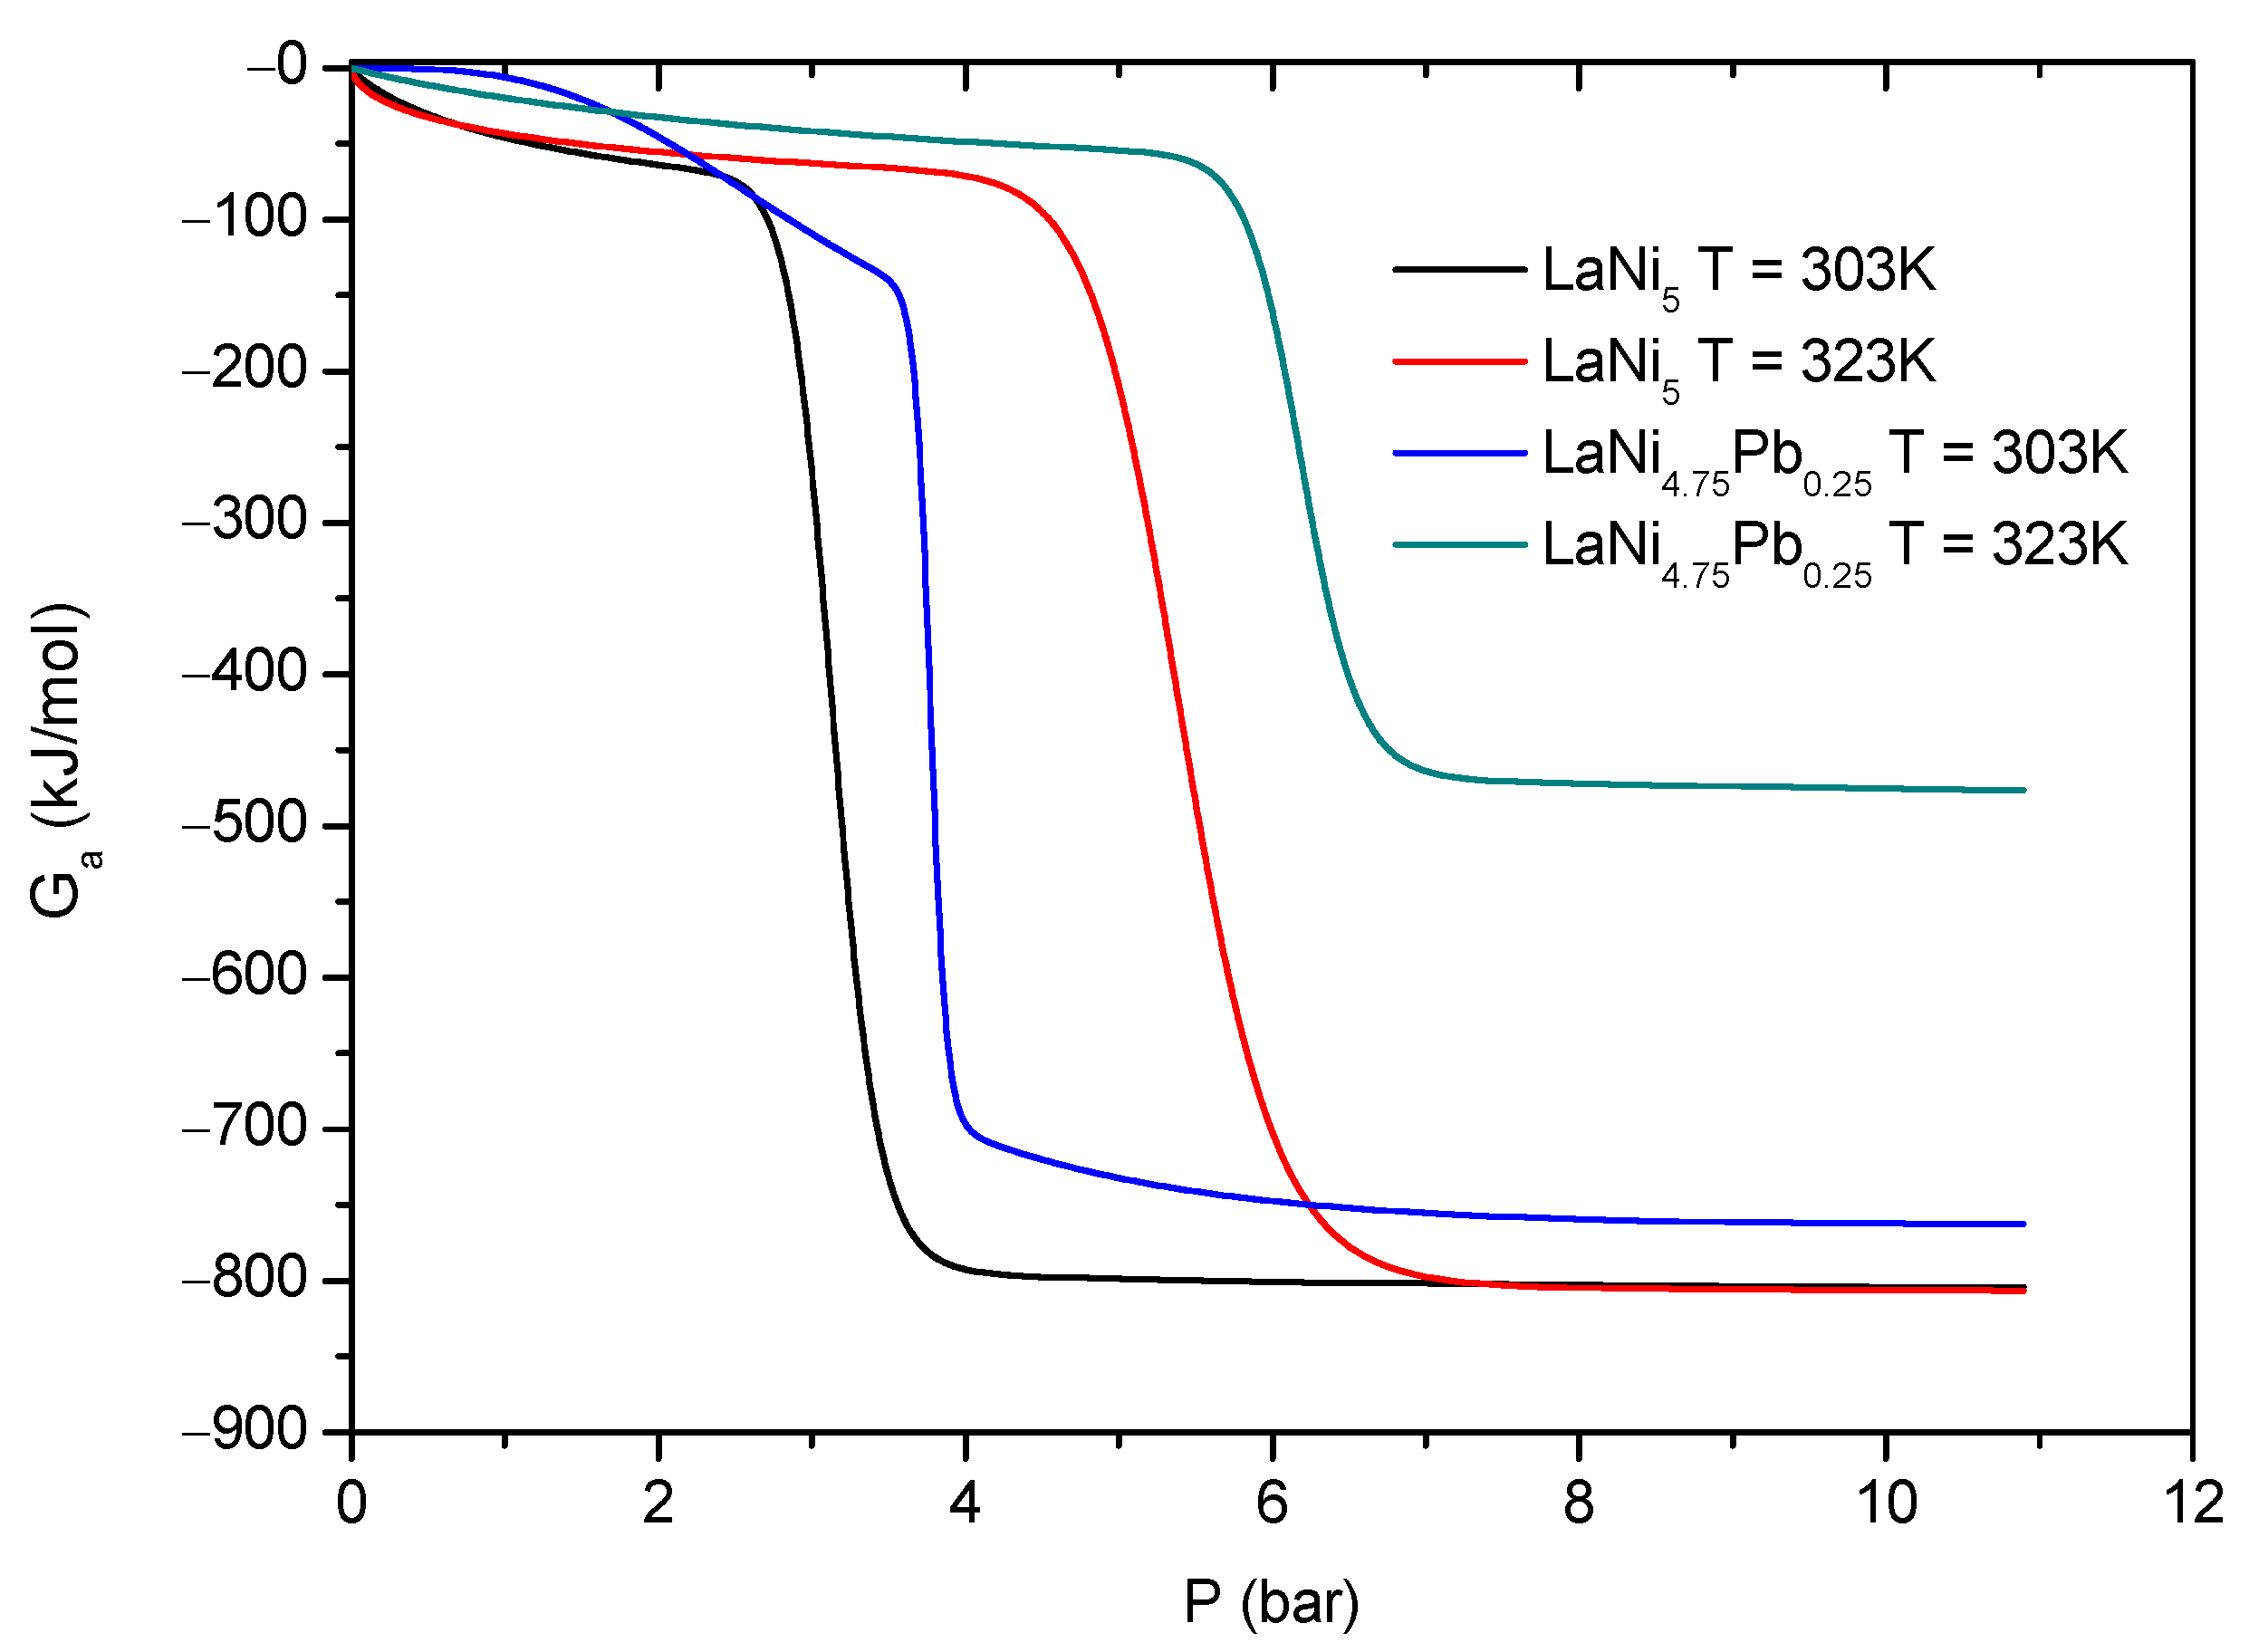
increase algebraically and decrease in absolute value. This suggests that the whole absorption process becomes less spontaneous at elevated temperatures. Consequently, it leads to the decrease in the amount of the absorbed hydrogen with increasing temperature. From
Figure 10 it can be seen that, for the base alloy LaNi
5 at a fixed pressure, the absolute values of the Gibbs energy are greater than for LaNi
4.75Pb
0.25, which indicates that for the nondoped alloy, the H absorption process is much more spontaneous.
3.4.9. Investigation of the Entropy
The entropy evolution during the hydrogen absorption process provides information about the homogeneity level of the system and its degree of disorder. Hence, the entropy can be also identified as an indicator of the process spontaneity. The entropy is determined through the grand potential
J and the grand canonical partition function
of the system by Equation (
27) [
4,
5,
7,
8]:
Since the grand potential
J is defined as
[
4,
5,
7]:
using Equations (
27) and (
28), the entropy can be expressed in a simple form:
Finally, by substituting and performing algebraic operations with Equation (
30), it is possible to obtain Equation (
31) for entropy
:
Similarly as for the internal energy
, Equation (
20) or free enthalpy
, Equation (
24), the entropy consists of two contributions
related to the first and second site types in the
and
phases. These entropy contributions
are described by Equations (
32) and (
33).
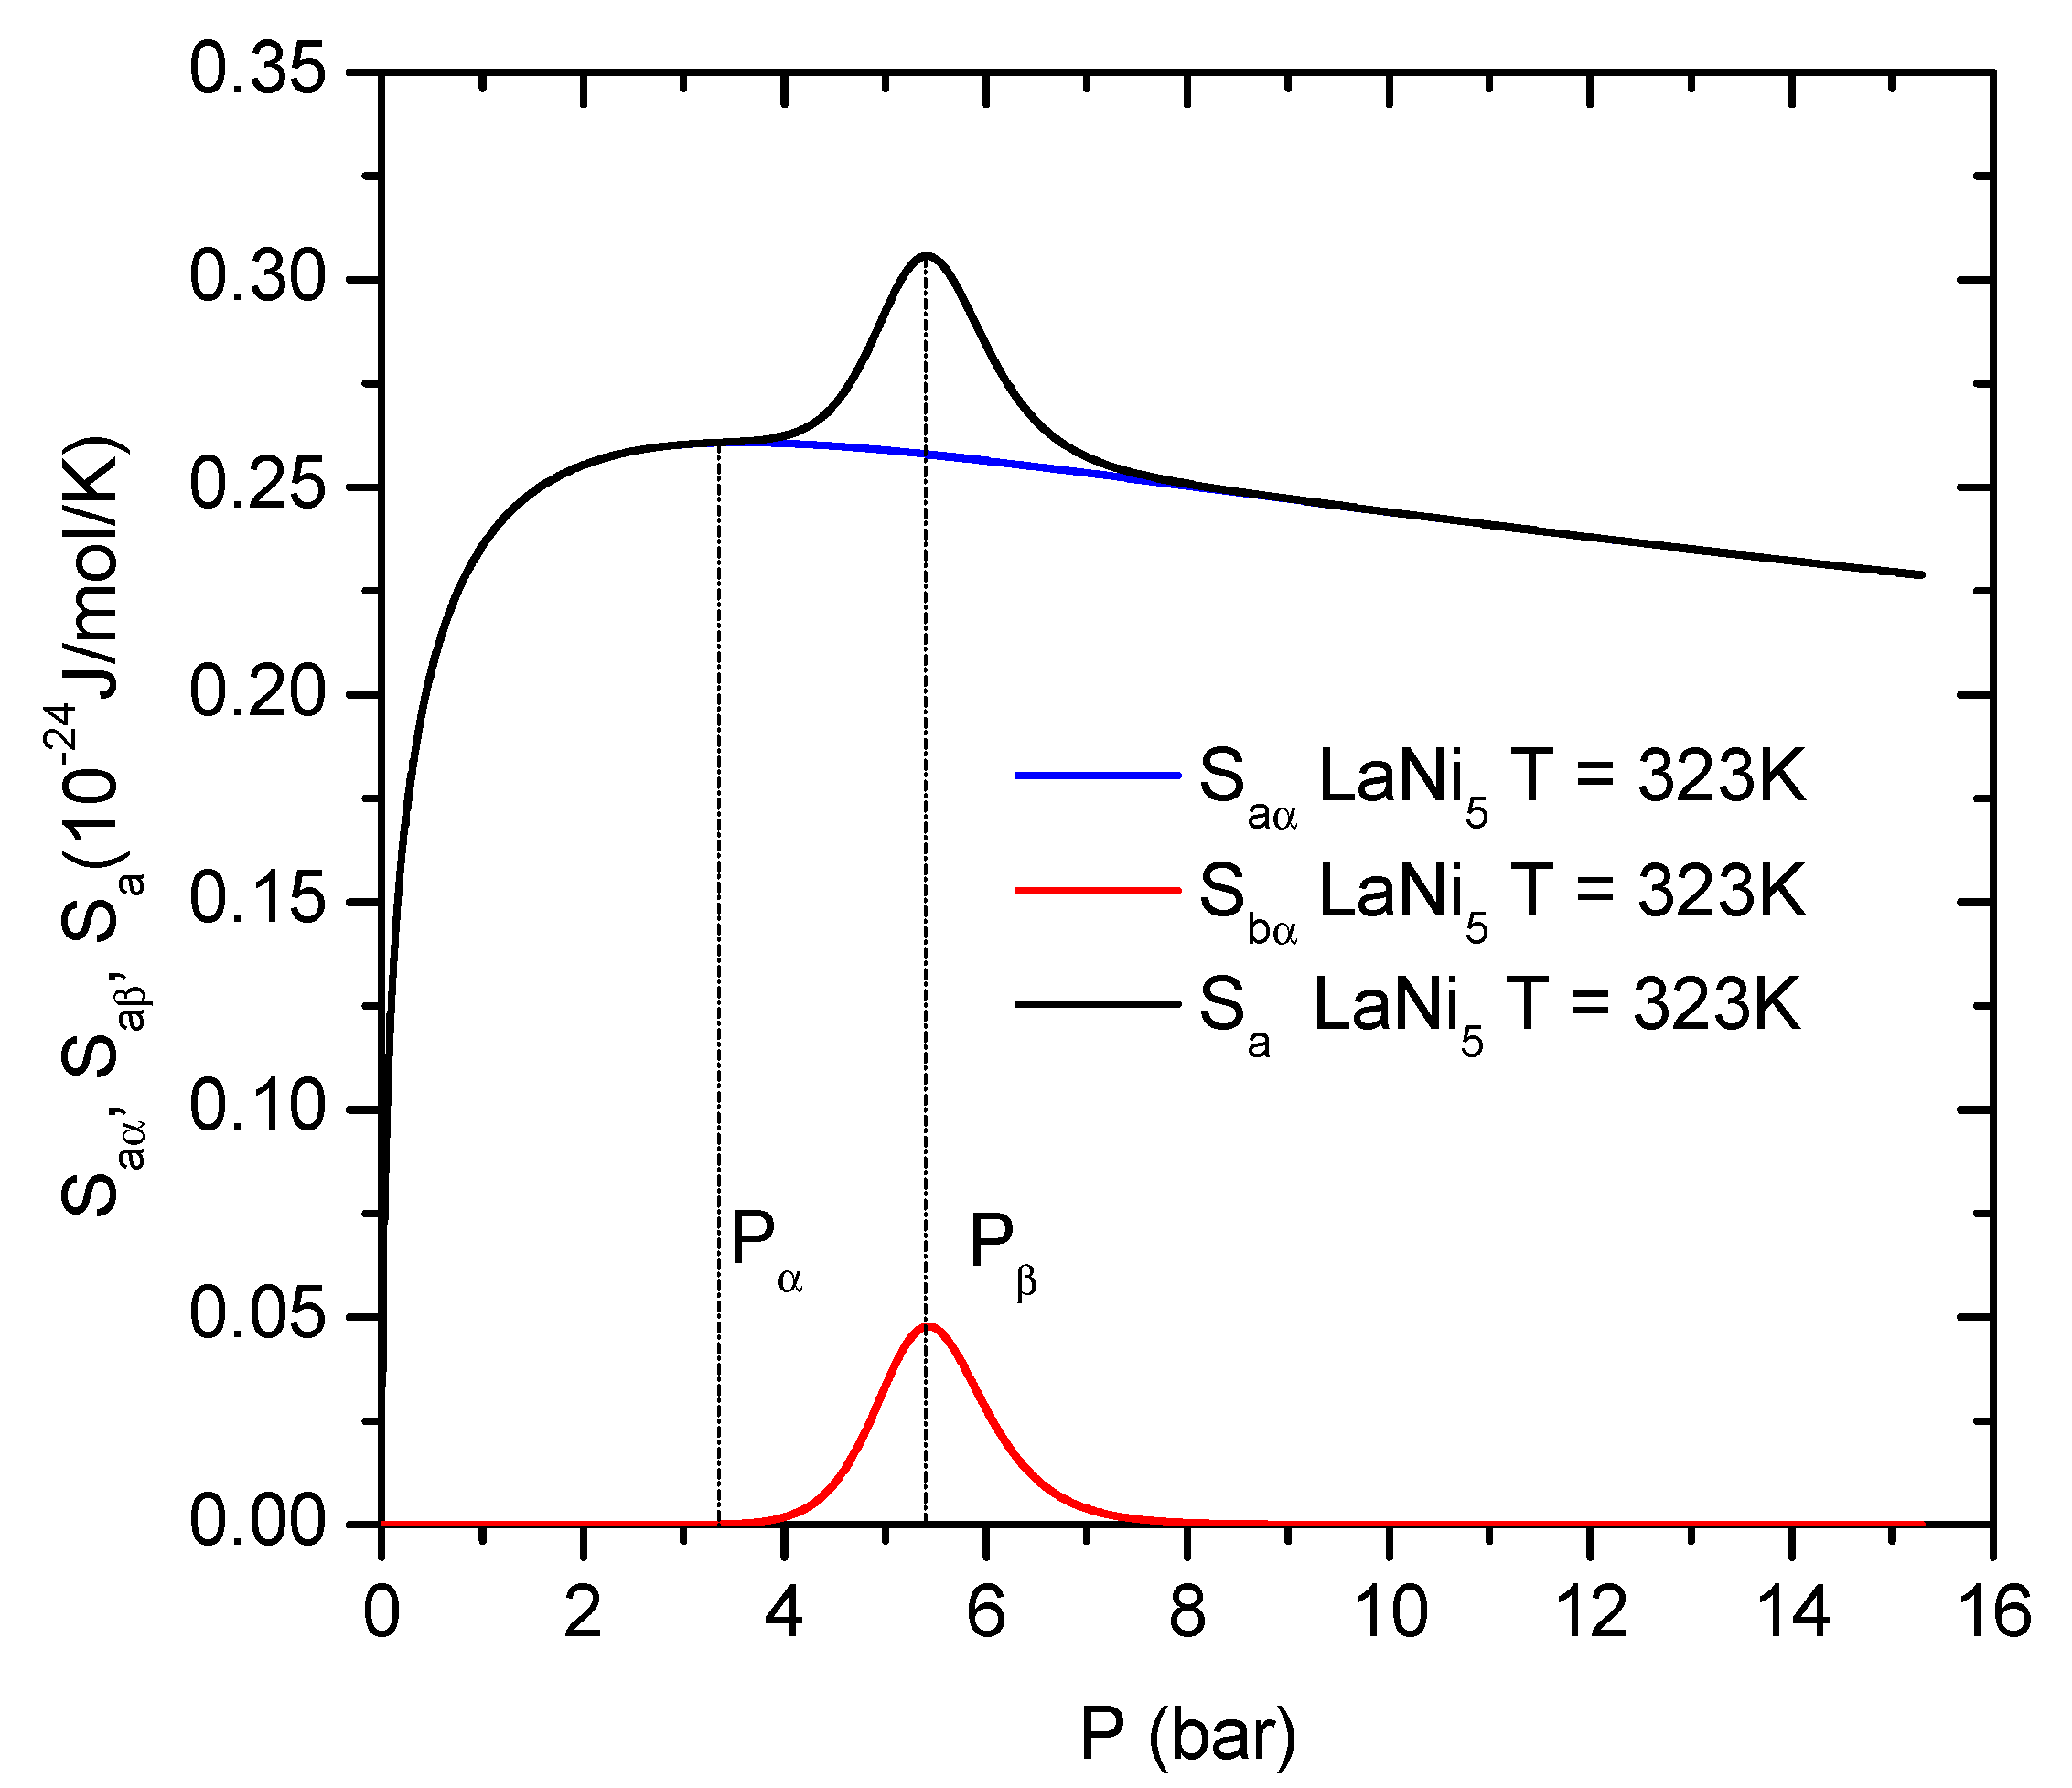
The evolution of the entropy versus pressure of the LaNi
5 hydride is presented in
Figure 11. It can be clearly seen that the entropy has two maxima corresponding to the pressure of the
and
phase formation, as contributions to the overall entropy. Similar situation is observed for the Pb-doped alloy, so the general discussion is done only for the base alloy.
The entropy
shows different behavior below and above the half saturation pressures
and
. Starting from the low pressure, the entropy
related to the
phase reaches a local maximum at the pressure of half saturation (at
). It is an effect of a step change in the system disorder caused by the intensive movements of hydrogen atoms around pressure
, which corresponds to the greatest reactivity. Further increasing of pressure,
, causes an increase of the hydrogen concentration and reduction of the number of the empty
sites, until the full
sites saturation is reached. As a result of the increasing saturation of the
sites, the configuration disorder disappears. This phenomenon is visible in the
values approaching zero above the half saturation pressure
. The second maximum
is reached at the pressure
, corresponding to half saturation of the
phase. Beyond the second half saturation
, H-atoms have a lower probability to select free receptor sites, so the entropy expressed by
decreases. When the saturation is attained for both phases
and
, their disorder decreases to zero (
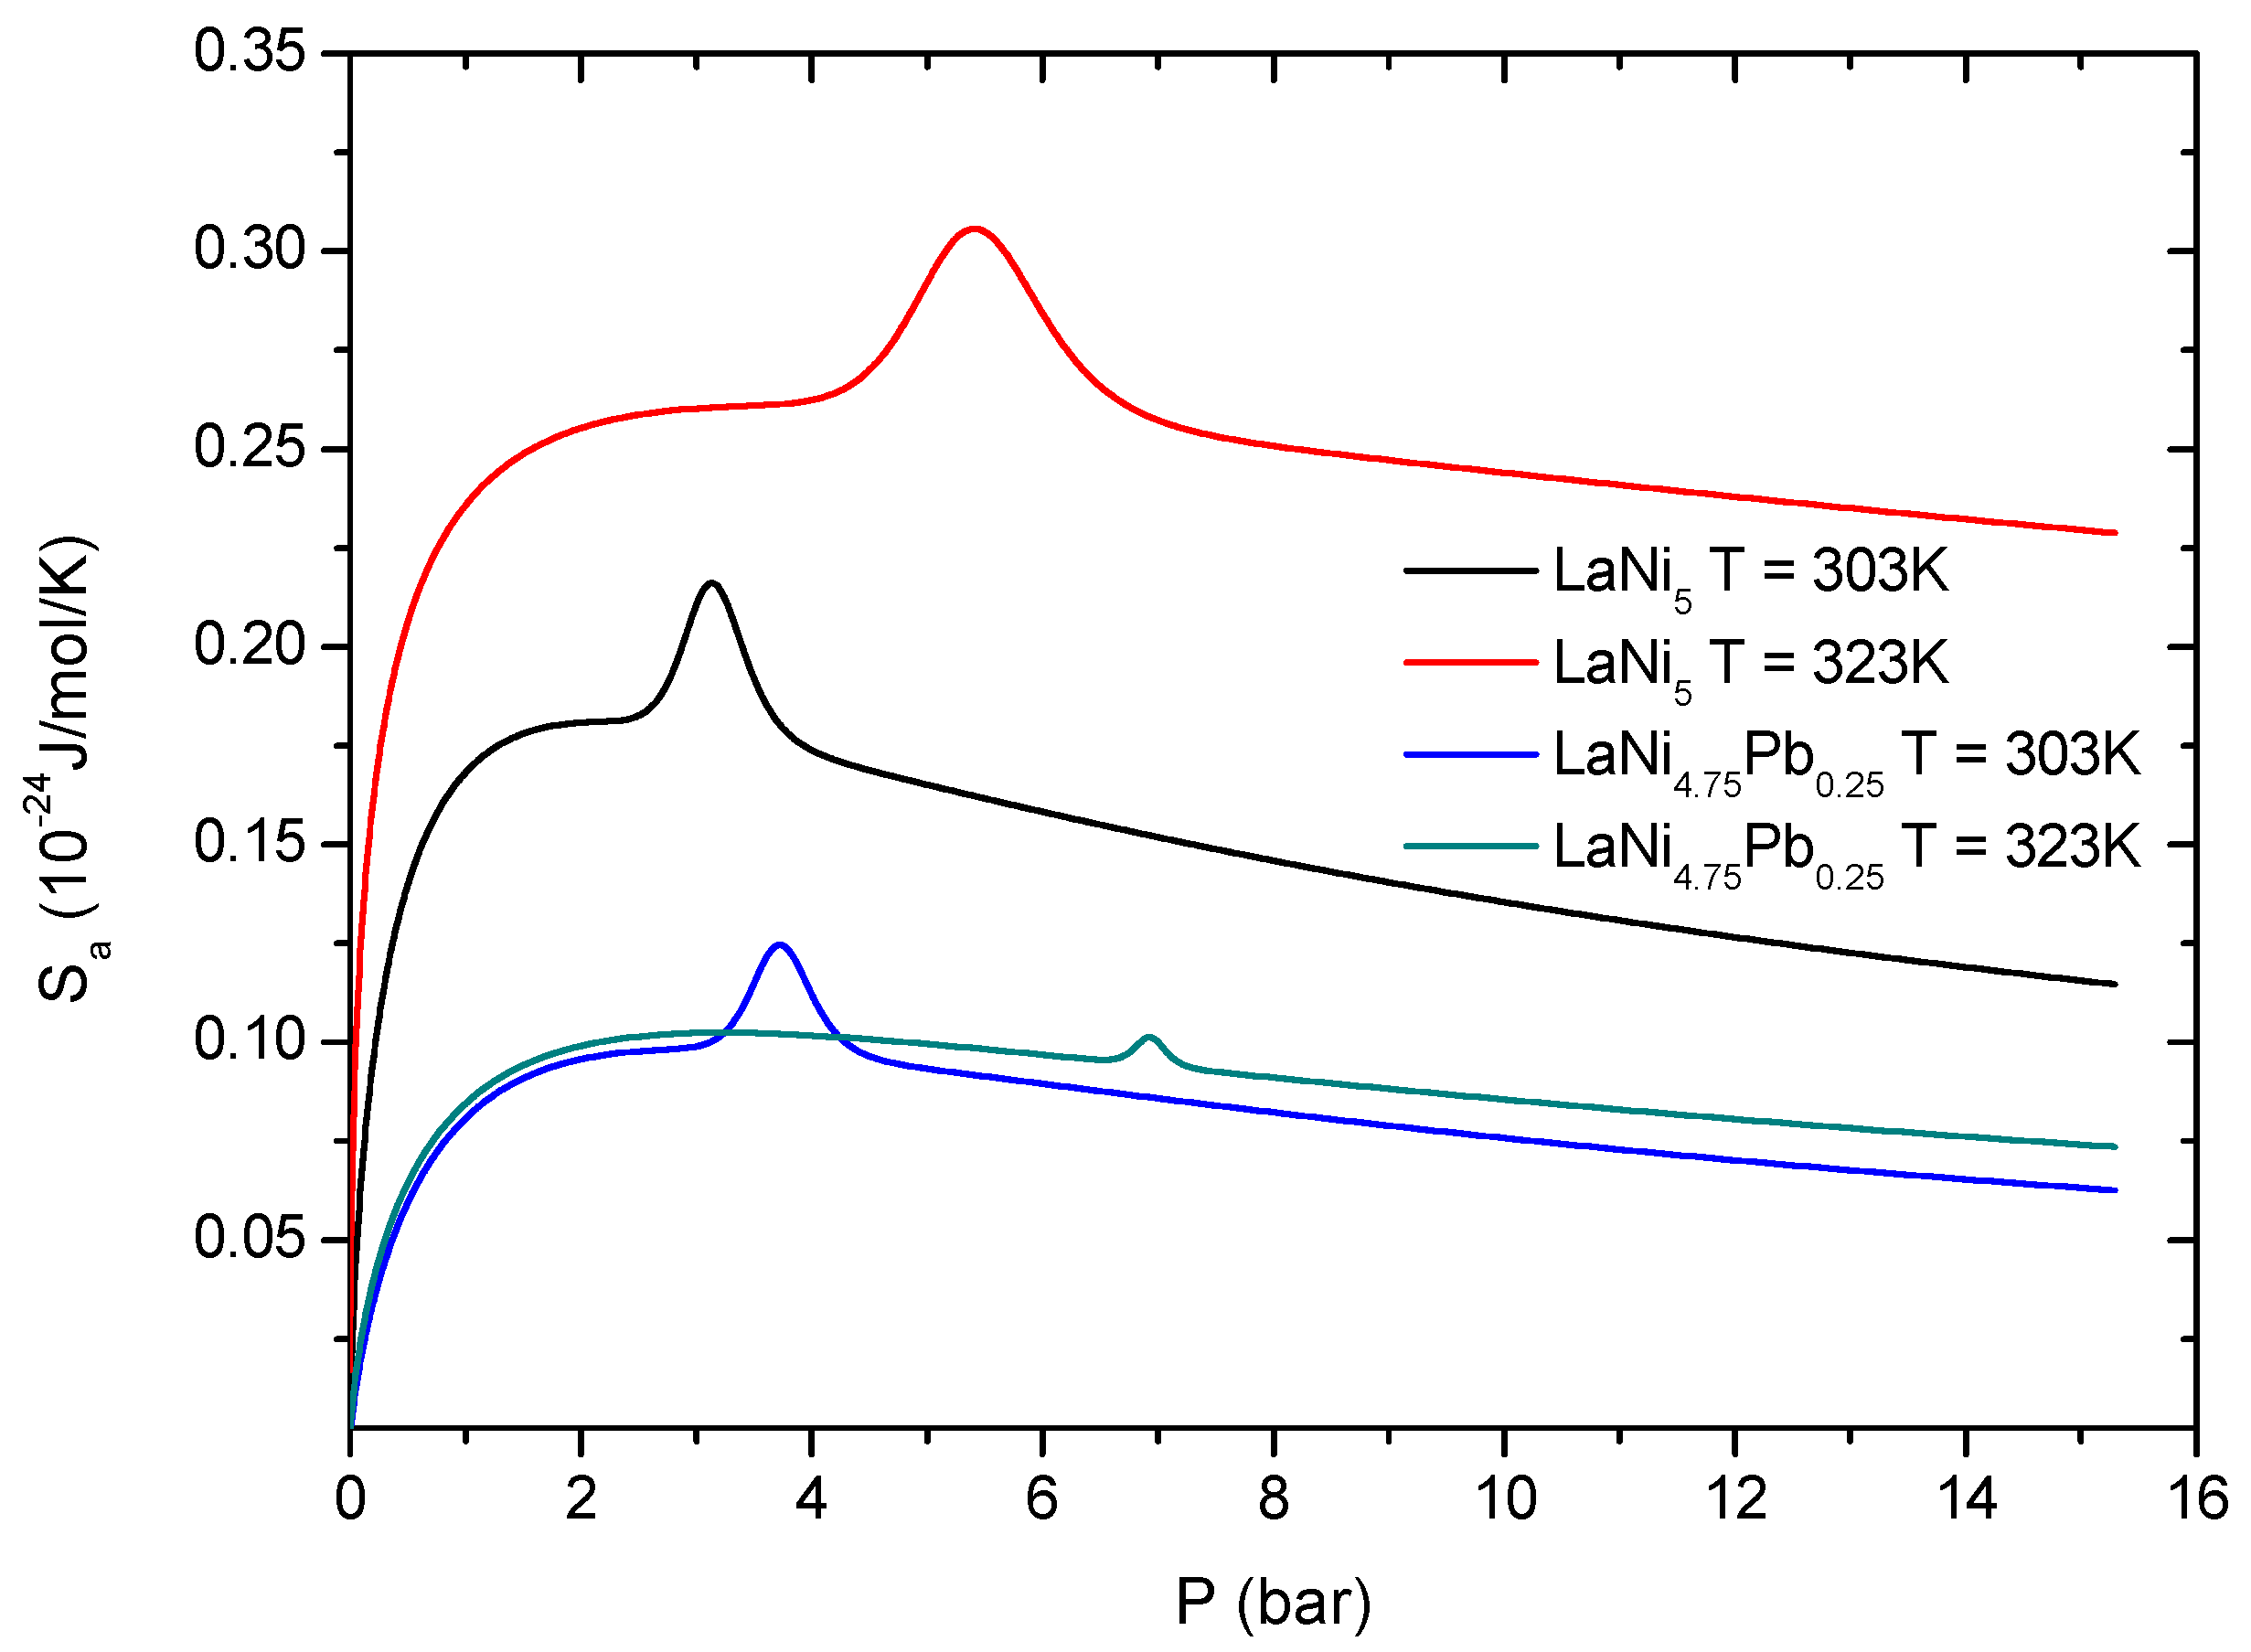
Figure 12).
4. Conclusions
The statistical physics formalism based on the grand canonical ensemble with some simplifying hypotheses was applied to describe the hydrogen absorption processes in alloys LaNi5 and LaNi4.75Pb0.25 at a microscopic level. The tested model is thermodynamically coherent and the physicochemical parameters showed by the absorption process are taken into consideration in the theoretical method. The hydrogen absorption in the LaNi5 and LaNi4.75Pb0.25 alloys is a chemisorption with two energy levels, which are supposed to correspond to the and phases. The parameters and corresponding to the and phases are dissimilar in values. The first one is close to 1 for the hydride of LaNi5 and about 3 for the hydride of LaNi4.75Pb0.25. The second parameters is much higher than the first one. The difference between alloys explained by the differences between the unit cell volumes, which is bigger in doped alloy than in the base alloy. The parameters and increase with growing temperature. The influence of thermal agitation becomes evidenced in this way. Thermal agitation hampers hydrogen atoms anchoring and disanchors the absorbed atoms. An energetic study has been carried out by means of the parameters and deduced from the model curve fits to the experimental data. The values of absorption energies and (>100 kJ/mol) indicated that, for both hydrides of tested alloys, hydrogen was chemically absorbed. These energies increased with temperature. Moreover, it was shown that the Pb-doping of the base LaNi5 alloy caused changes in the microscopic state of the alloy. As a consequence, the reduction of absorption spontaneity was evidenced from the course of the Gibbs enthalpy. The internal energy and entropy change during the hydrogen absorption process. It can be finally concluded that the applied statistical physics model proved correct and capable of plausibly interpreting the experimental isotherms, as well as deriving consistent and meaningful physical parameters.
Author Contributions
Conceptualization, M.Ż. and W.Z.; methodology, M.Ż. and W.Z.; investigation, M.Ż.; data curation, M.Ż.; writing—original draft preparation, M.Ż.; writing—review and editing, W.Z.; supervision, W.Z. All authors have read and agreed to the published version of the manuscript.
Funding
EU Project POWR.03.02.00-00-I004/16.
Data Availability Statement
Data are contained within the article.
Conflicts of Interest
The authors declare no conflict of interest.
Abbreviations
| T | temperature (K) |
| n | stoichiometric coefficient representing the number of H-atoms absorbed during reaction |
| number of hydrogen atoms absorbed |
| number of interstitial sites located in the unit mass of a hydride |
| grand canonical partition function |
| absorption energy per site in (kJ/mol) |
| Boltzmann constant equal 1.38064 J/K |
| chemical potential of a hydrogen absorption site |
| numbers of hydrogen atoms absorbed in two independent kinds of interstitial sites |
| names of existing phases connecting to different hydrogen occupations levels |
| numbers of hydrogen atoms absorbed in two independent kinds of interstitial sites |
| number densities of interstitial sites (number of such sites per unit volume of the alloy) |
| the pressure according to half of hydrogen capacity saturation in and phases |
| the pressure according of full phases hydrogen capacity saturation in and phases |
| hydrogen saturated vapor pressure (Pa) |
| hydrogen absorption energies in and phases (kJ/mol) |
| internal energy and two additive contributions become from and phases (J/mol) |
| free enthalpy and two additive contributions become from and phases (kJ/mol) |
| entropy and two additive contributions become from and phases (J/mol/K) |
References
- Senoh, H.; Kiyobayashi, T. Hydrogenation and Dehydrogenation Properties of RHNi5 (RH = Heavy Rare Earth) Binary Intermetallic Compounds. Mater. Trans. 2004, 45, 292–295. [Google Scholar] [CrossRef]
- Senoh, H.; Kiyobayashi1, T. Hydrogenation Properties of RNi5 (R: Rare Earth) Intermetallic Compounds with Multi Pressure Plateaux. Mater. Trans. 2003, 44, 1663–1666. [Google Scholar] [CrossRef]
- Łodziana, Z. Ternary LaNi4.75M0.25 hydrogen storage alloys: Surface segregation, hydrogen sorption and thermodynamic stability. Int. J. Hydrogen Energy 2018, 44, 1760–1773. [Google Scholar] [CrossRef]
- Bouaziz, N. Physicochemical and thermodynamic investigation of hydrogen absorption and desorption in LaNi3.8Al1.0Mn0.2 using the statistical physics modeling. Results Phys. 2018, 9, 1323–1334. [Google Scholar] [CrossRef]
- Bouaziz, N. Theoretical study of hydrogen absorption-desorption on LaNi3.8Al1.2−xMnx using statistical physics treatment. Phys. B 2017, 525, 46–59. [Google Scholar] [CrossRef]
- Bouaziz, N. Statistical physics modeling of hydrogen absorption onto LaNi4.6Al0.4: Stereographic and energetic interpretations. Sep. Sci. Technol. 2019, 414, 170–181. [Google Scholar] [CrossRef]
- Wjihi, S. P-C isotherms of LaNi4.75Fe0.25 alloy at different temperatures statistical physics modeling of hydrogen sorption onto LaNi4.75Fe0.25. Microscopic interpretation and thermodynamic potential investigation. Fluid Phase Equilibria 2016, 414, 170–181. [Google Scholar] [CrossRef]
- Khalfaoui, M. Modeling and interpretations by the statistical physics formalism of hydrogen adsorption isotherm on LaNi4.75Fe0.25. Int. J. Hydrogen Energy 2013, 38, 11536–11542. [Google Scholar]
- Sellaoui, L.; Depci, T. A new statistical physics model to interpret the binary adsorption isotherms of lead and zinc on activated carbon. J. Mol. Liq. 2015; in press. [Google Scholar]
- Mechi, N. A macroscopic investigation to interpret the absorption and desorption of hydrogen in LaNi4.85Al0.15 alloy using the grand canonical ensemble. Fluid Phase Equilibria, 2016; in press. [Google Scholar]
- Yu, B.; Rumer, M.; Ryvkin, S. Thermodynamics, Statistical Physics, and Kinetics; Mir Publishers Moscow, USSR: Moscow, Russia, 1980; ISBN 082851853X. [Google Scholar]
- Leblond, J.B. A general mathematical description of hydrogen diffusion in steels. Derivation of diffusion equations from Boltzmann-type transport equations. Acta Met. 1983, 31, 1459–1469. [Google Scholar] [CrossRef]
- Westlake, D.G. Site occupancies and stoichiometries in hydrides of intermetallic compounds: Geometric considerations. J. Less Common Met. 1983, 90, 251–273. [Google Scholar] [CrossRef]
- Switendick, A.C. Band structure calculations for metal hydrogen systems. Z. fur Phys. Chem. 1979, 117, 89–112. [Google Scholar] [CrossRef] [Green Version]
- Knani, S. Modeling of the psychophysical response curves using the grand canonical ensemble in statistical physics. Food Biophys. 2007, 2, 183–192. [Google Scholar] [CrossRef]
| Publisher’s Note: MDPI stays neutral with regard to jurisdictional claims in published maps and institutional affiliations. |
© 2022 by the authors. Licensee MDPI, Basel, Switzerland. This article is an open access article distributed under the terms and conditions of the Creative Commons Attribution (CC BY) license (https://creativecommons.org/licenses/by/4.0/).


