
Screening and Analysis of Potential Inhibitors of SHMT2

Abstract
:1. Introduction
2. Results and Discussion
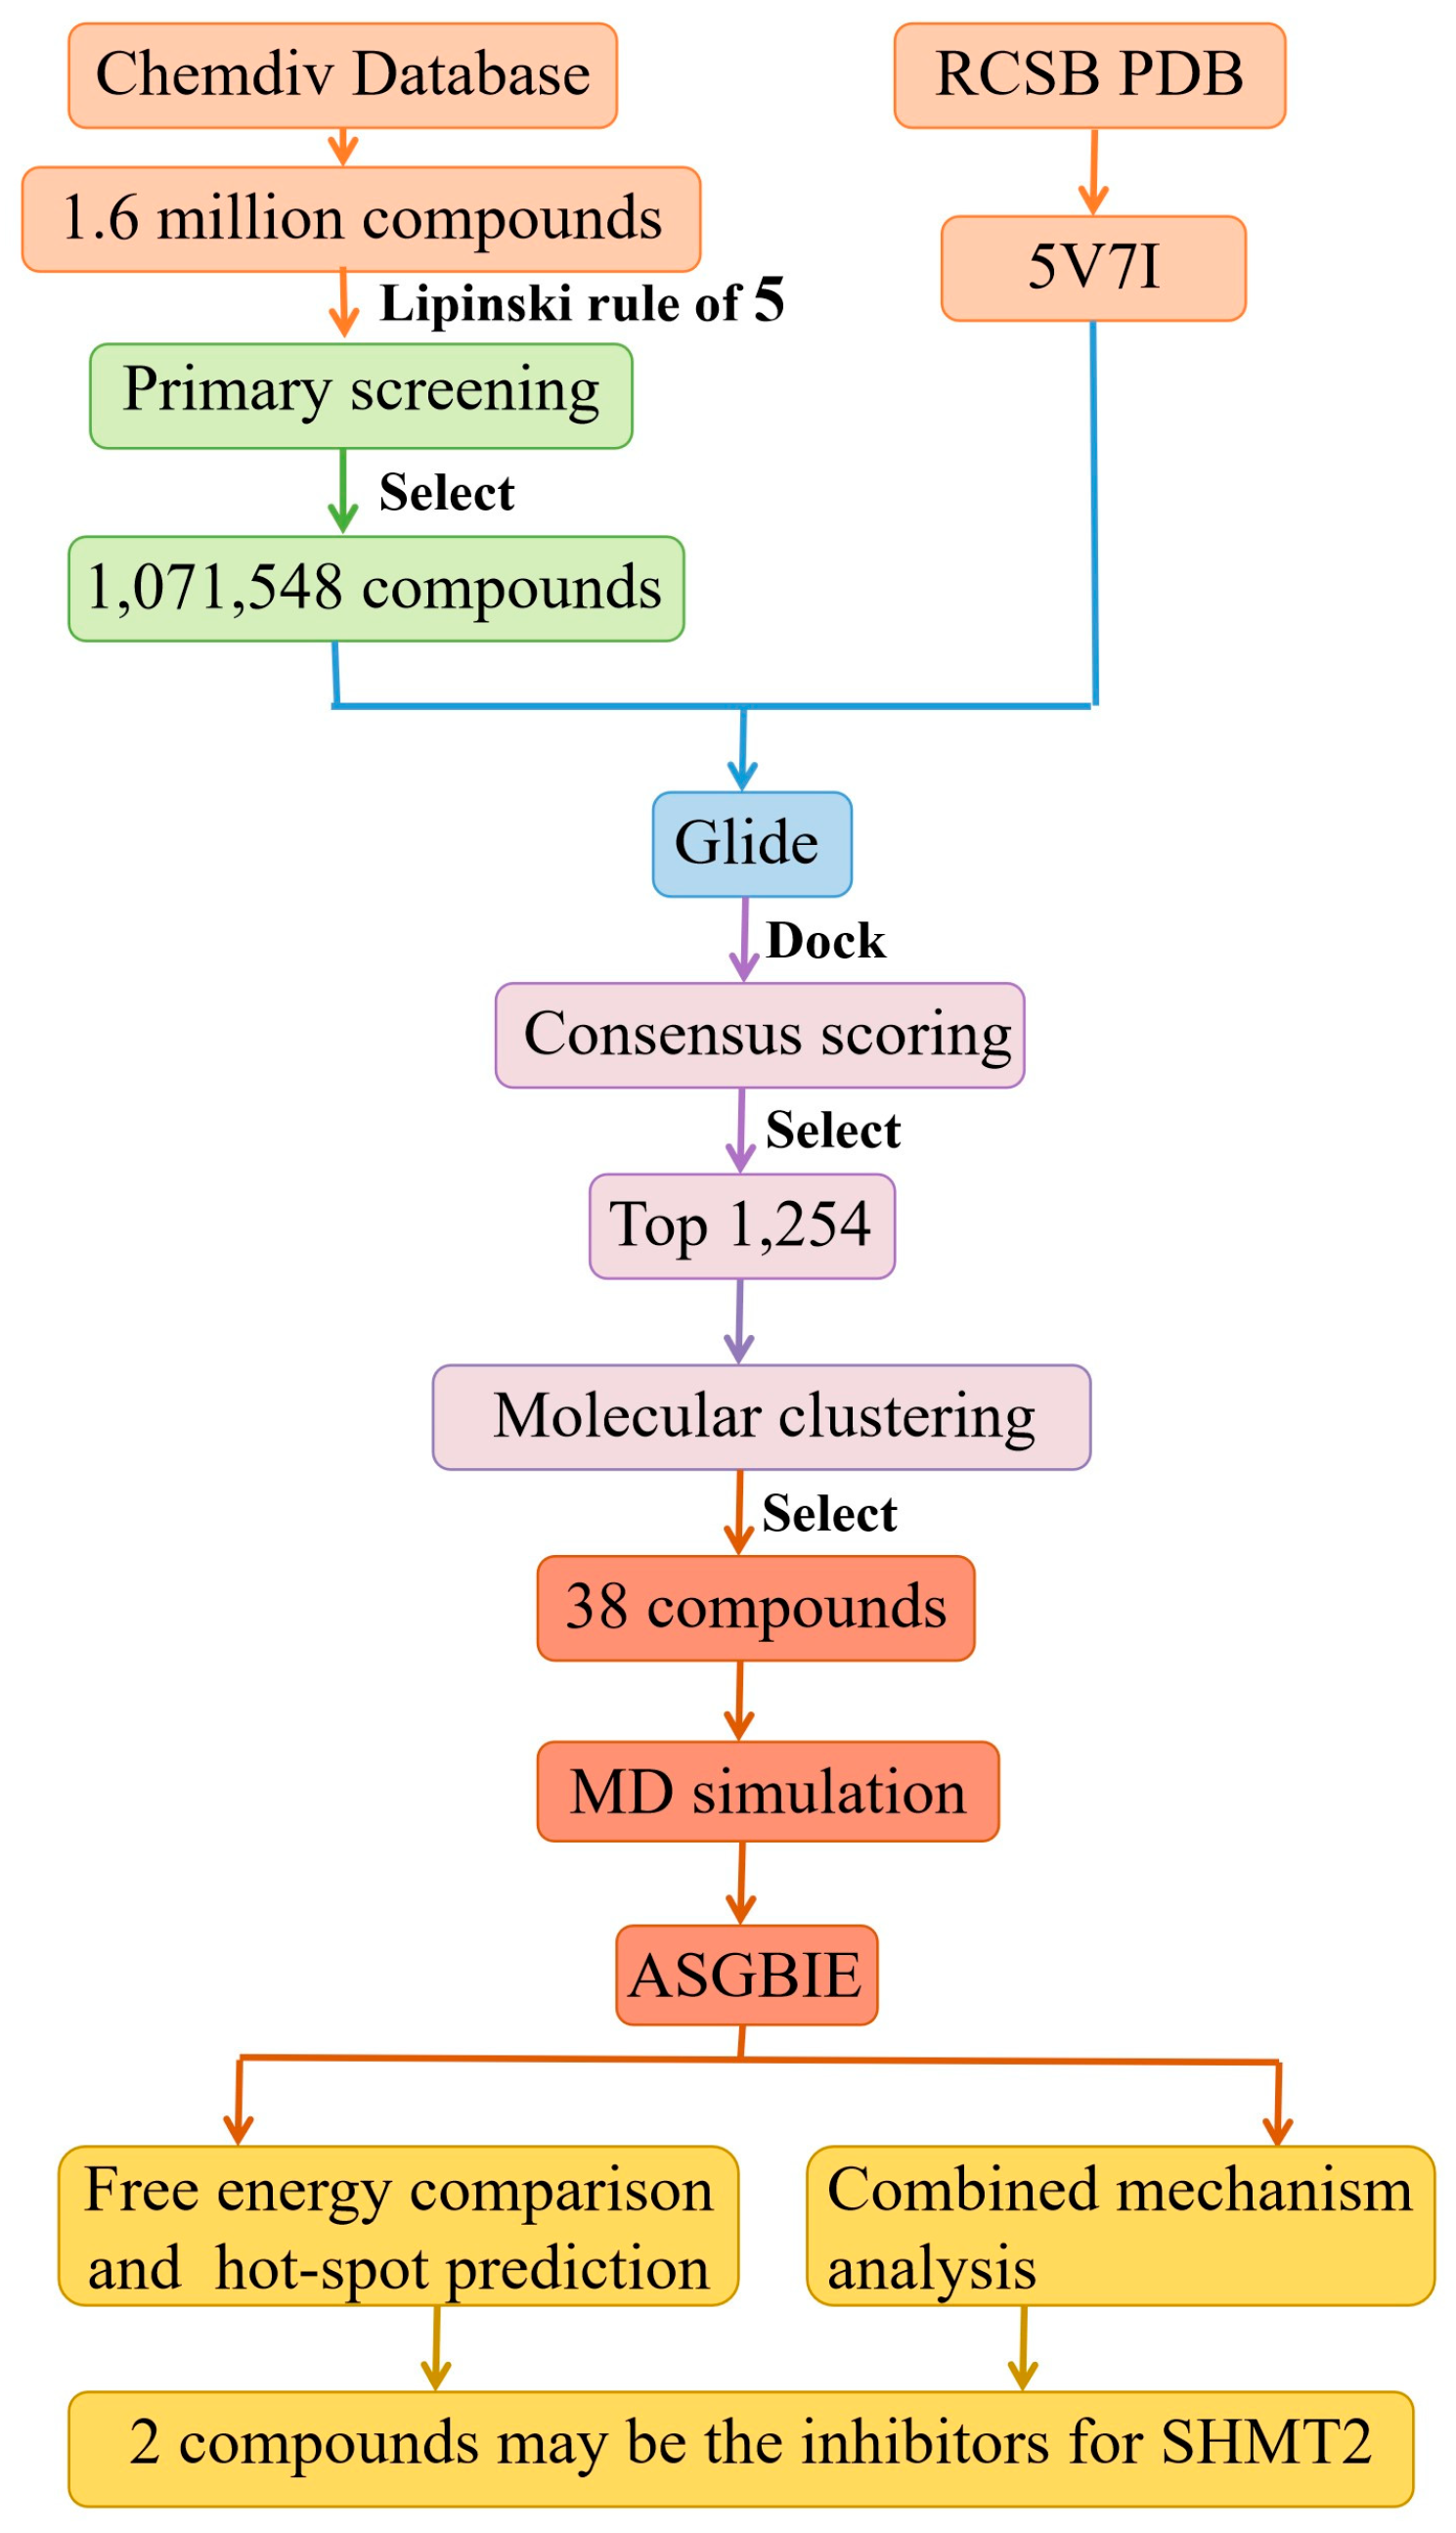
2.1. Virtual Screening Results
2.2. Result from Molecular Dynamics Simulation
2.3. Binding Free Energies
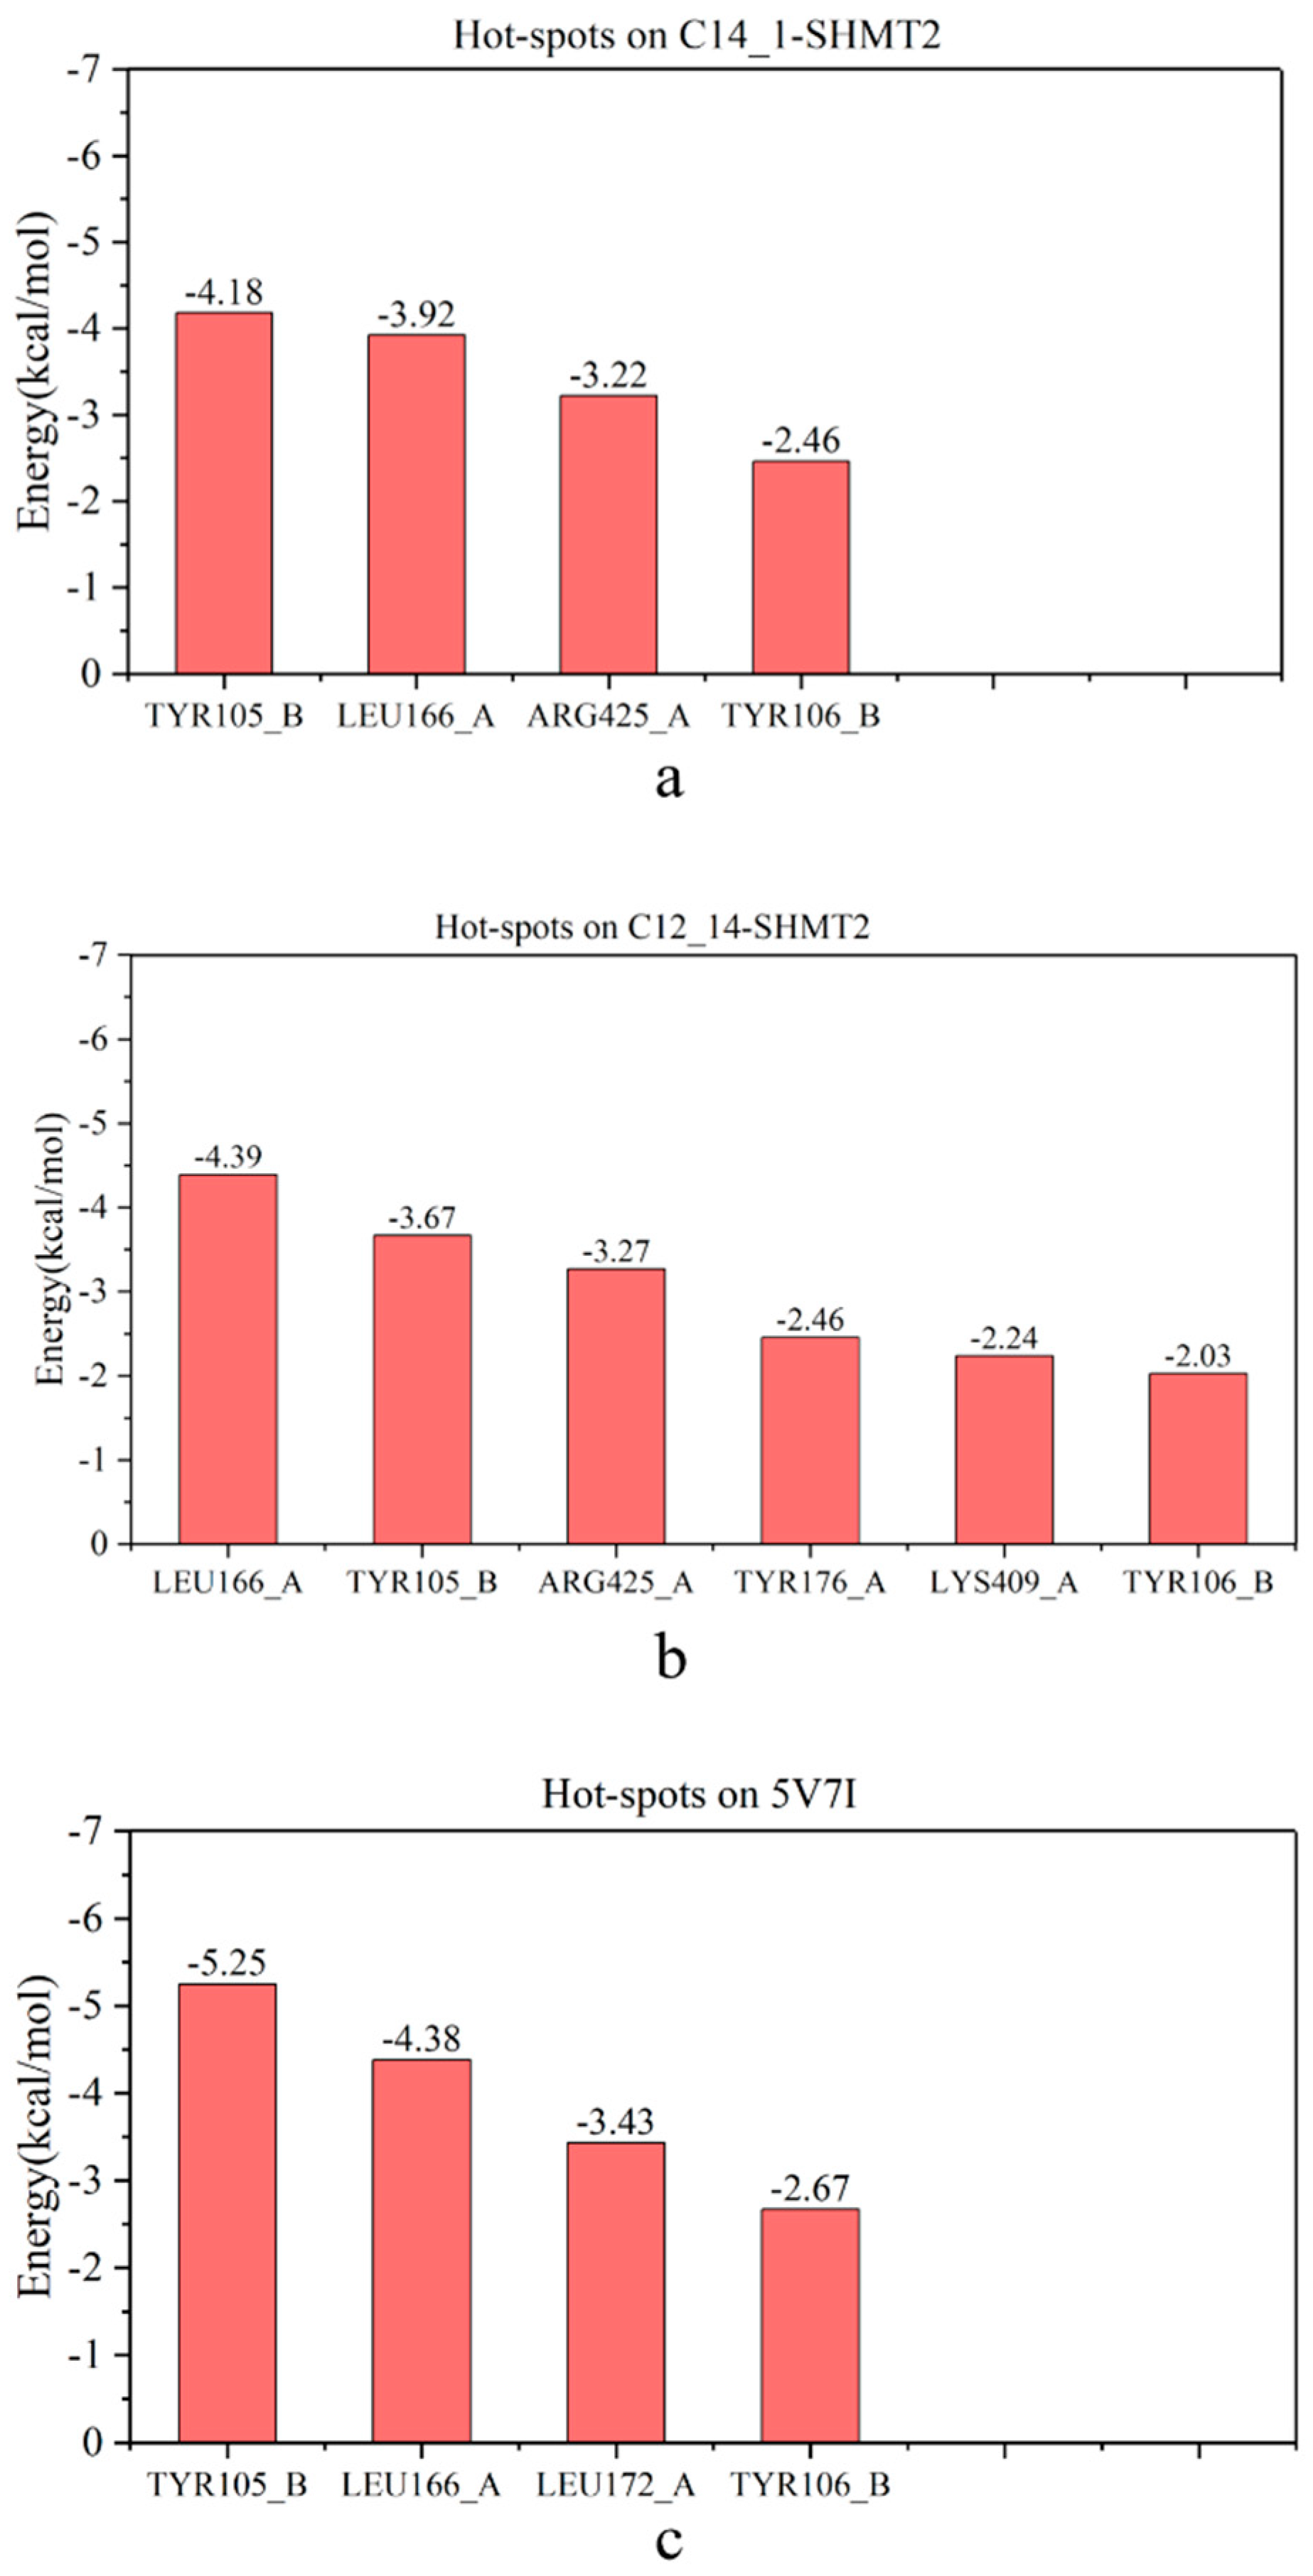
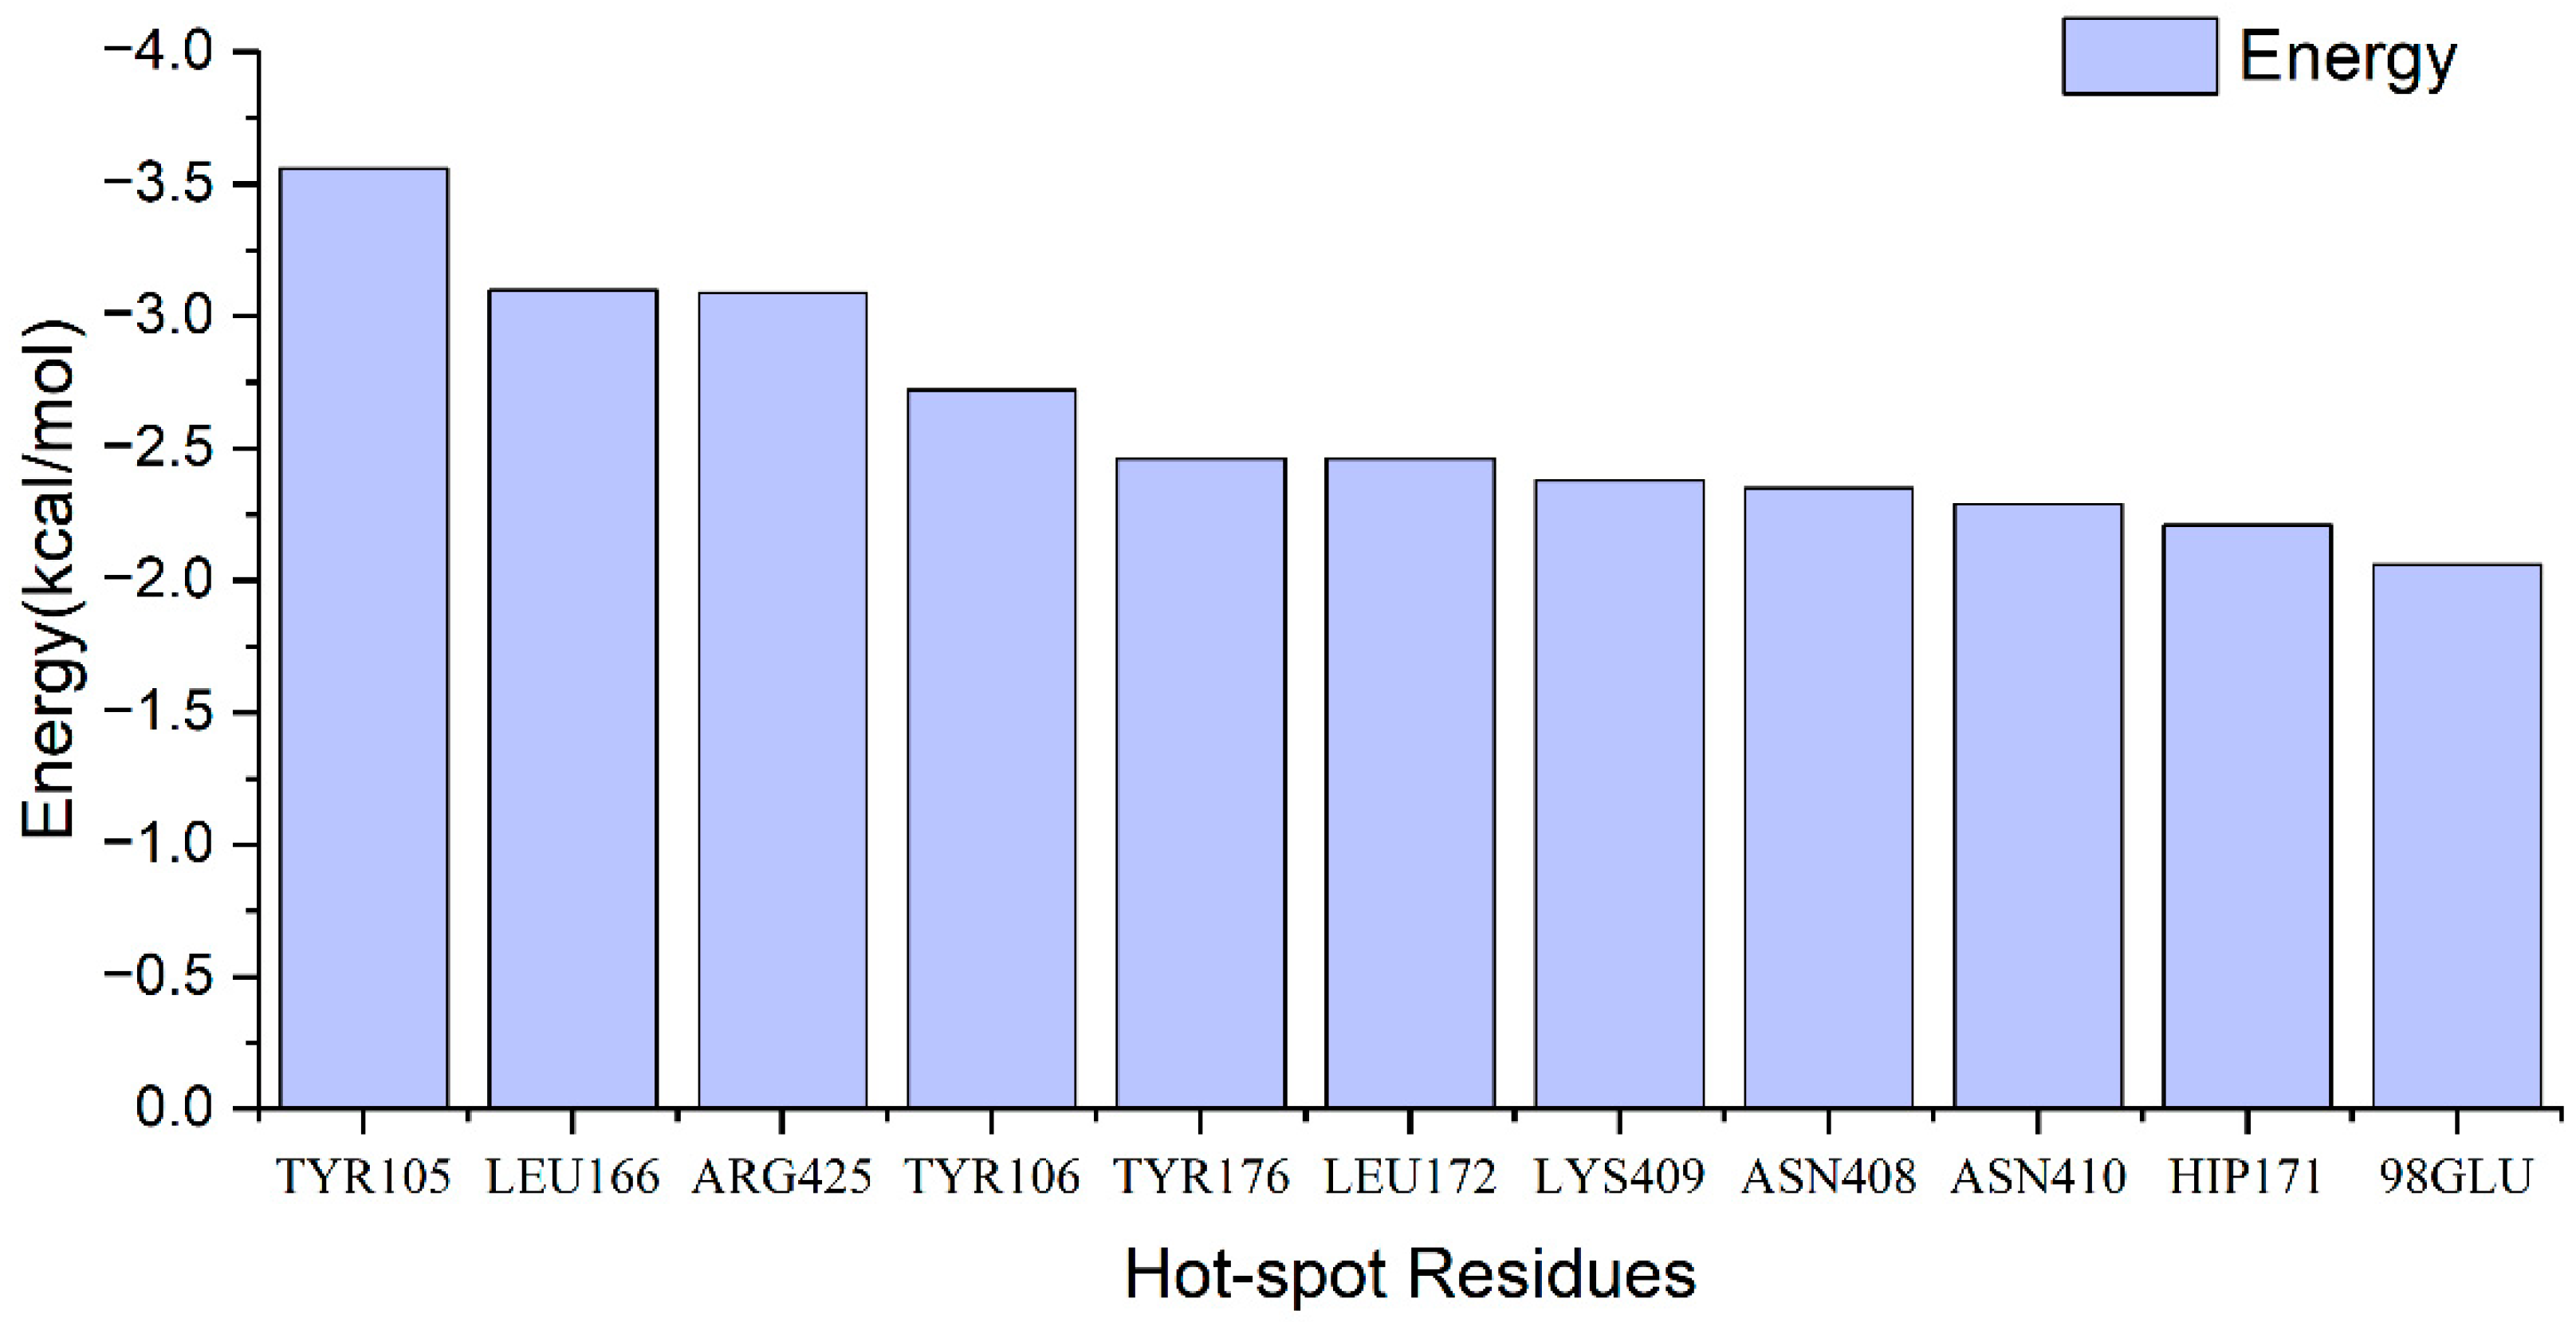
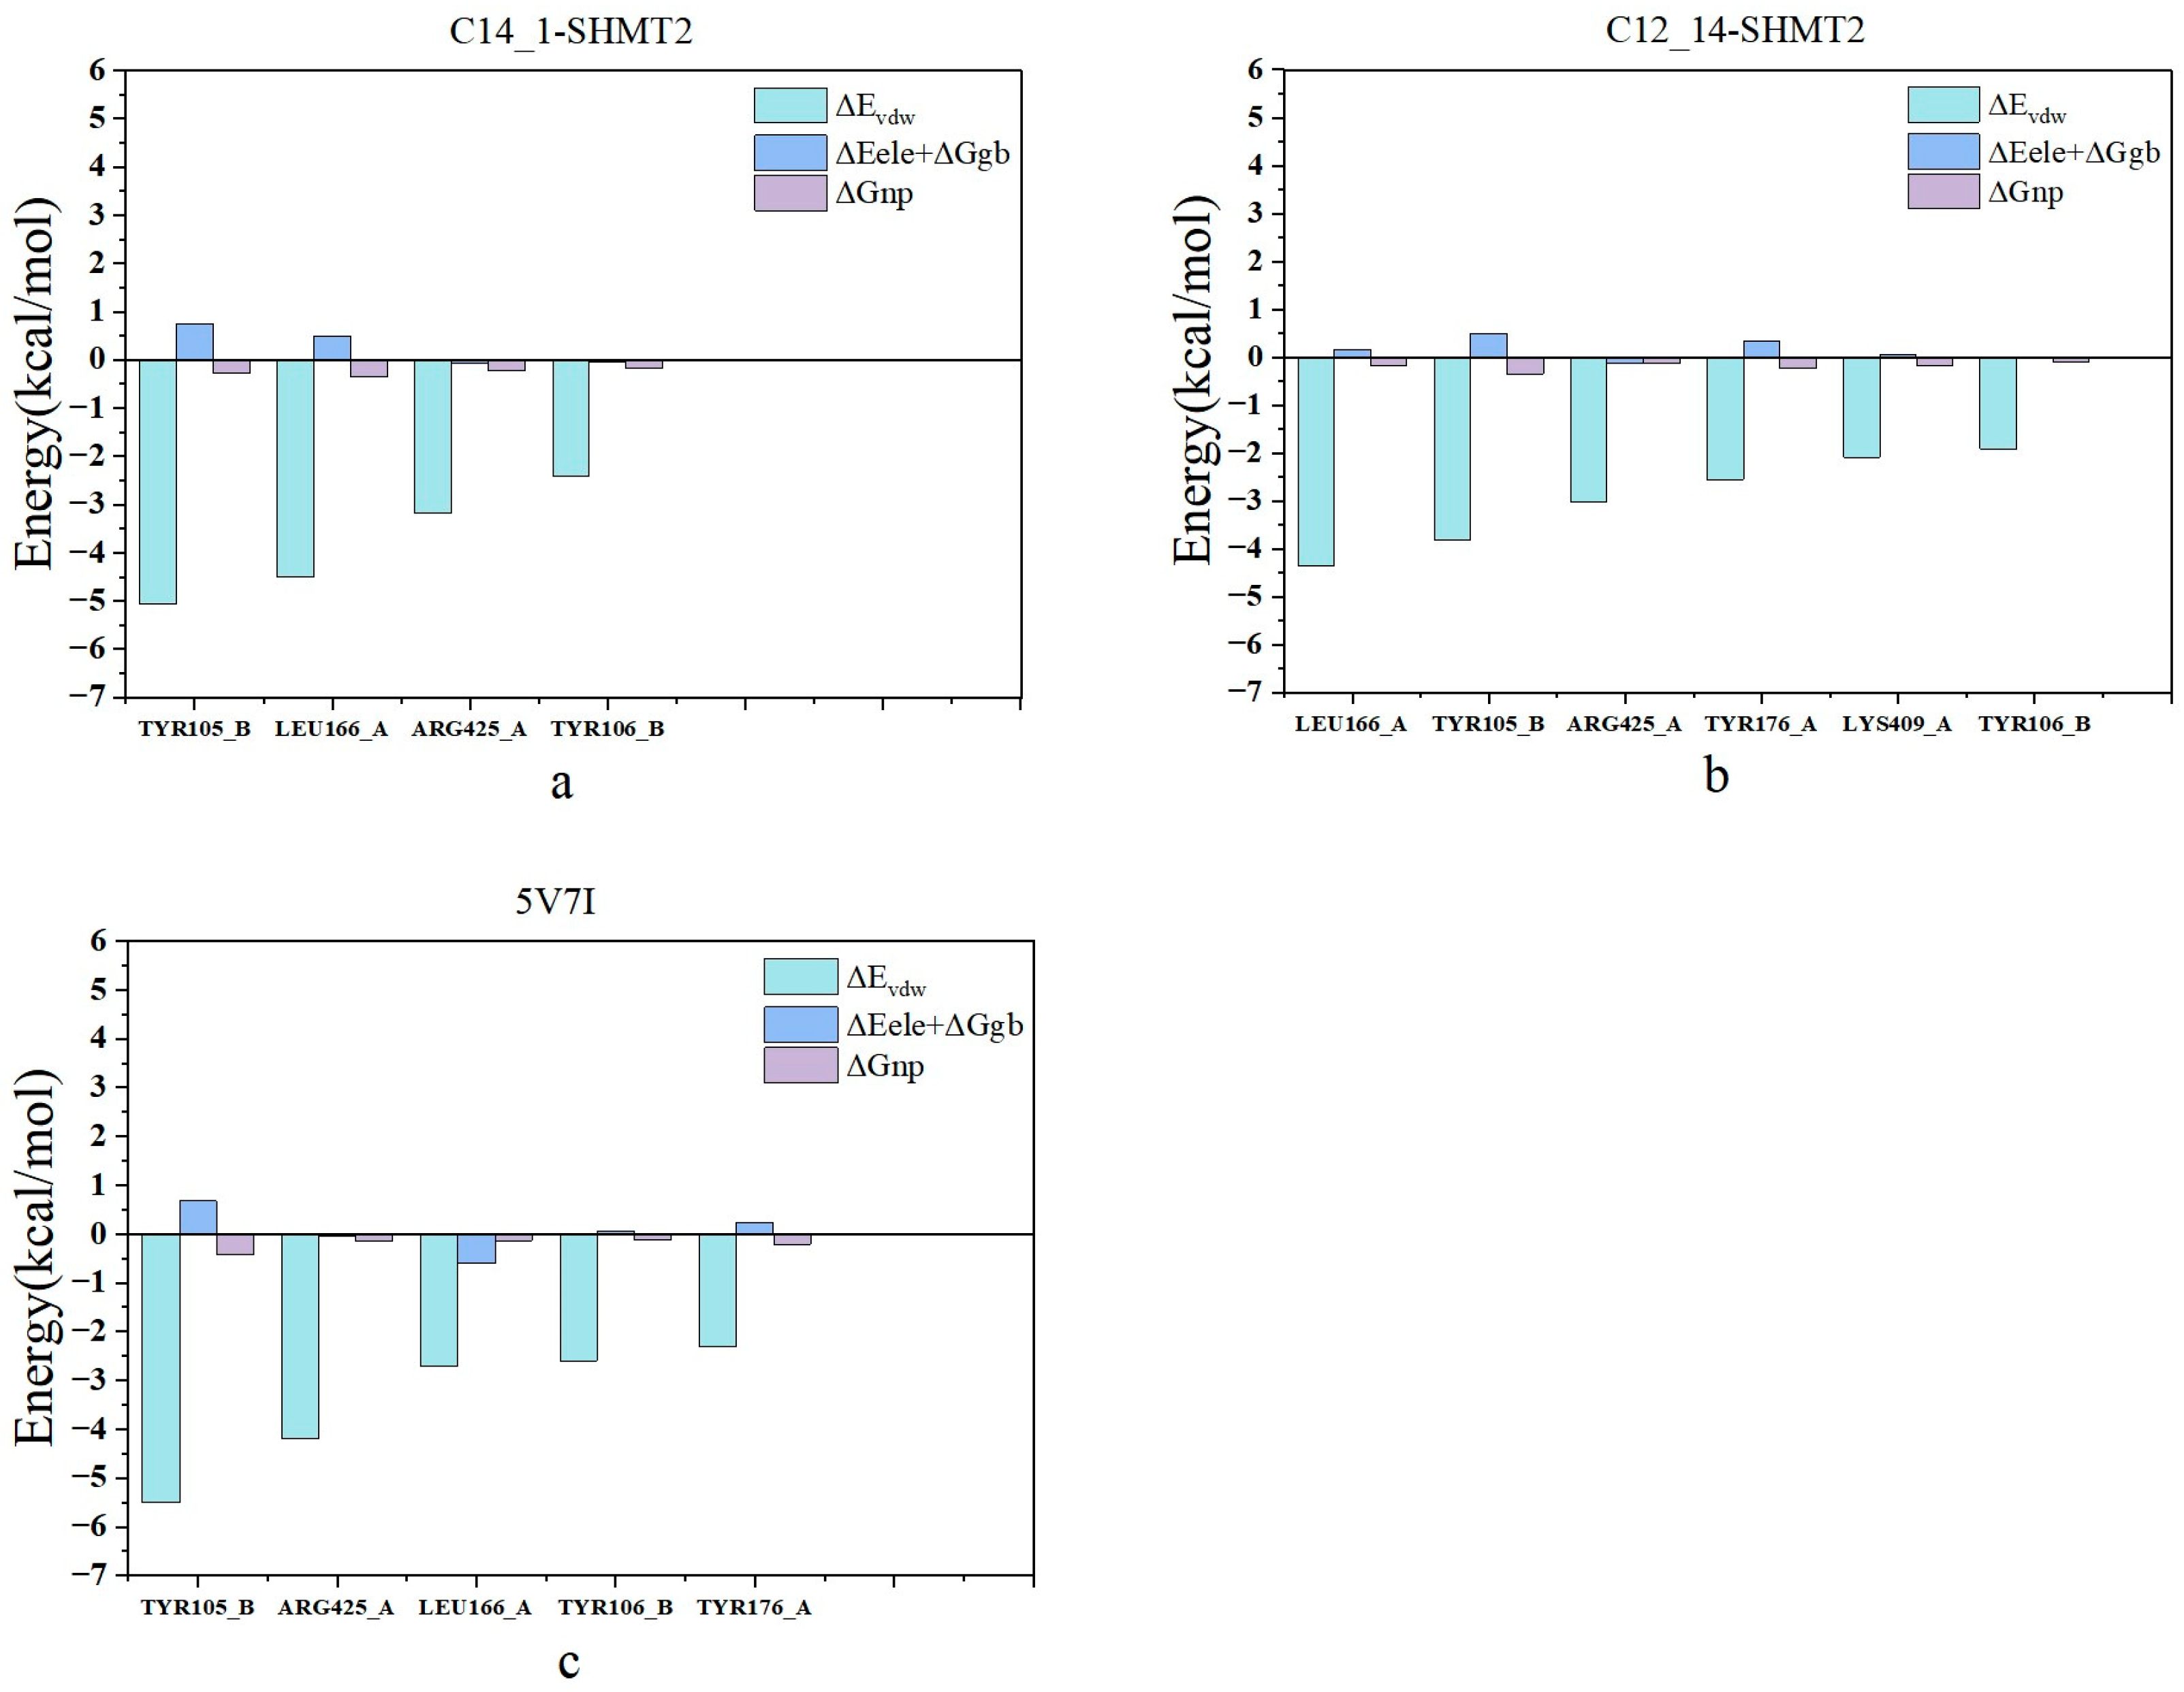
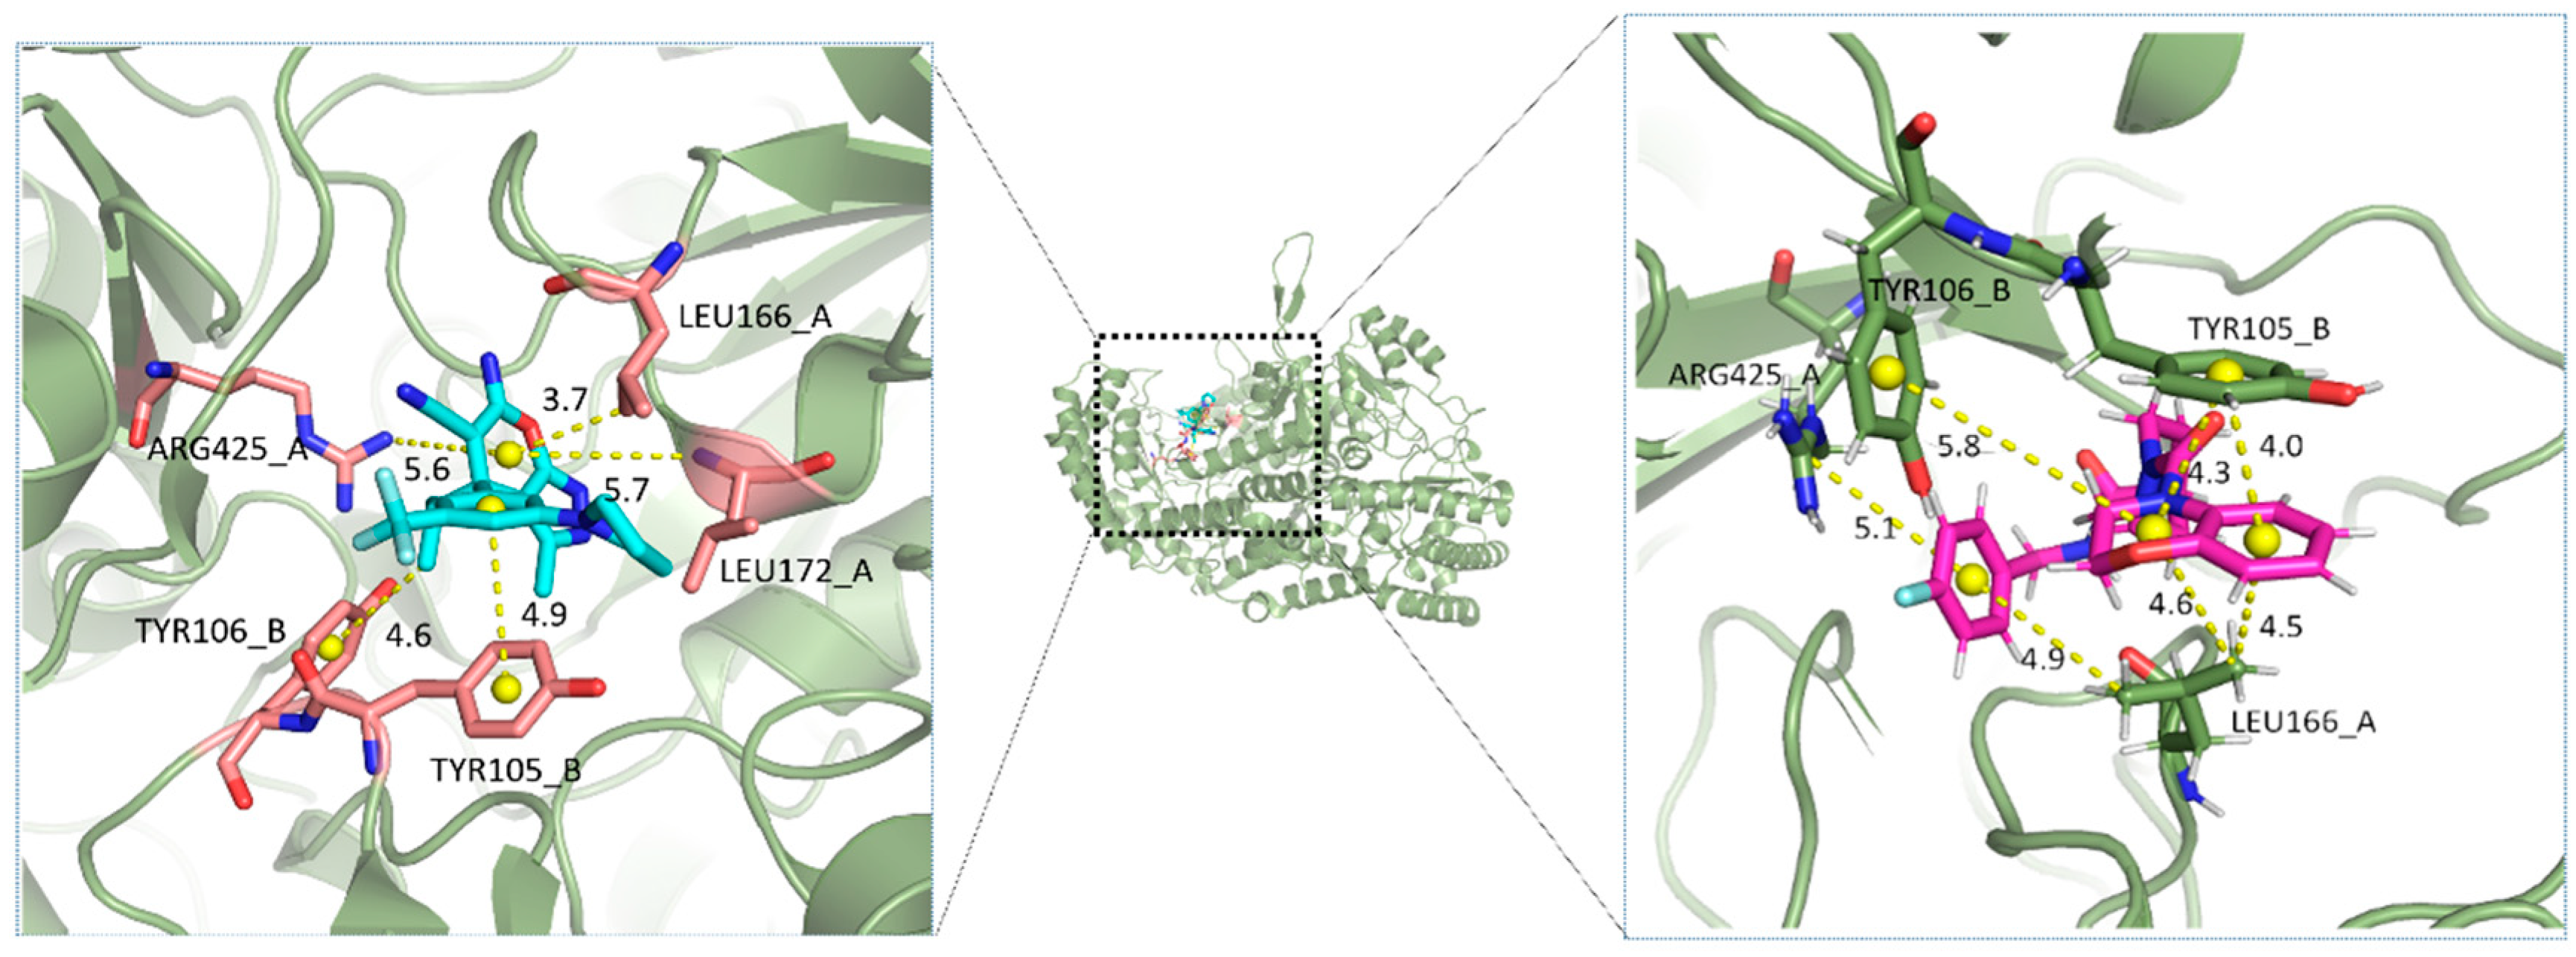
2.4. Identification of Hot Spots
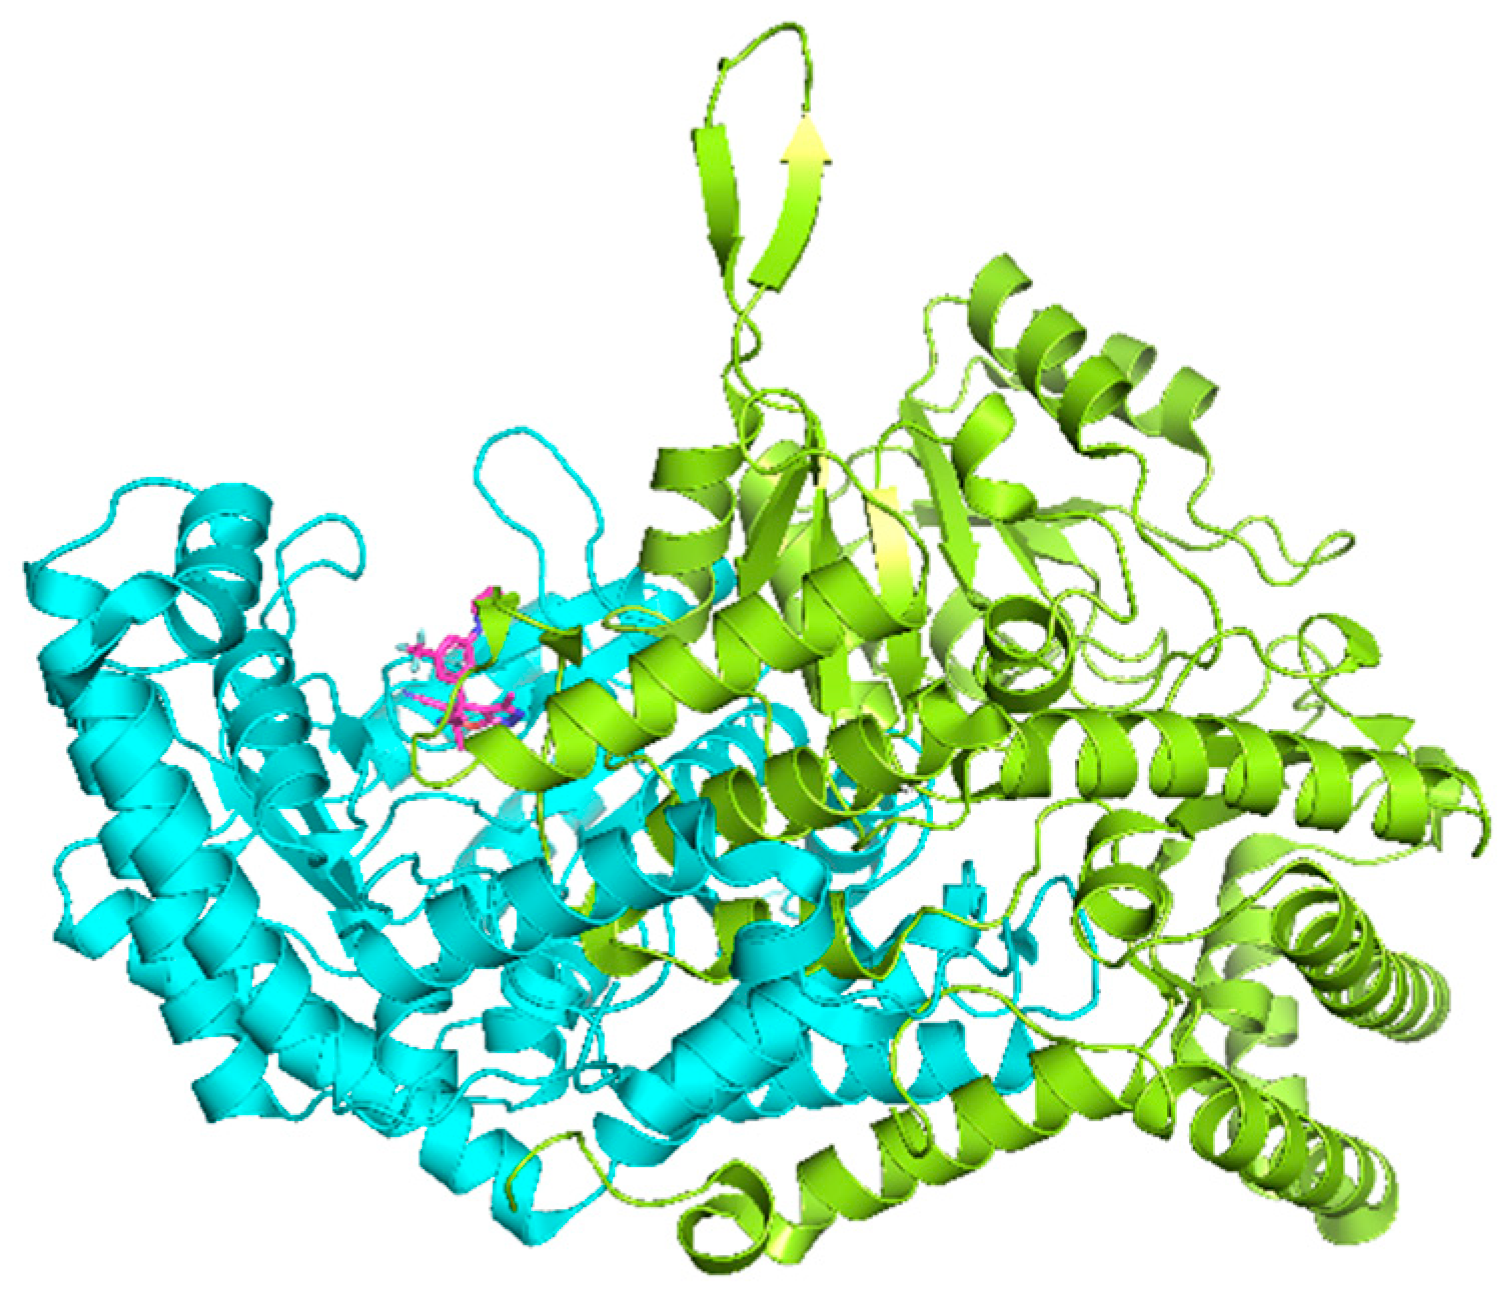
2.5. Analysis of Binding Mechanism
3. Method
3.1. Molecular Docking
3.2. Consensus Scoring
3.3. Molecular Clustering
3.4. Molecular Dynamics Simulation
3.5. Binding Free Energy Calculation
4. Conclusions and Discussion
Supplementary Materials
Author Contributions
Funding
Data Availability Statement
Acknowledgments
Conflicts of Interest
References
- Guertin, D.A.; Wellen, K.E. Acetyl-CoA metabolism in cancer. Nat. Rev. Cancer 2023, 23, 156–172. [Google Scholar] [CrossRef] [PubMed]
- Locasale, J.W. Serine, glycine and one-carbon units: Cancer metabolism in full circle. Nat. Rev. Cancer 2013, 13, 572–583. [Google Scholar] [CrossRef] [PubMed]
- Peng, H.; Wang, Y.; Luo, W. Multifaceted role of branched-chain amino acid metabolism in cancer. Oncogene 2020, 39, 6747–6756. [Google Scholar] [CrossRef] [PubMed]
- Asai, A.; Konno, M.; Koseki, J.; Taniguchi, M.; Vecchione, A.; Ishii, H. One-carbon metabolism for cancer diagnostic and therapeutic approaches. Cancer Lett. 2020, 470, 141–148. [Google Scholar] [CrossRef] [PubMed]
- Clare, C.E.; Brassington, A.H.; Kwong, W.Y.; Sinclair, K.D. One-Carbon Metabolism: Linking Nutritional Biochemistry to Epigenetic Programming of Long-Term Development. Annu. Rev. Anim. Biosci. 2019, 7, 263–287. [Google Scholar] [CrossRef]
- Cuthbertson, C.R.; Arabzada, Z.; Bankhead, A., 3rd; Kyani, A.; Neamati, N. A Review of Small-Molecule Inhibitors of One-Carbon Enzymes: SHMT2 and MTHFD2 in the Spotlight. ACS Pharmacol. Transl. Sci. 2021, 4, 624–646. [Google Scholar] [CrossRef] [PubMed]
- Ducker, G.S.; Rabinowitz, J.D. One-Carbon Metabolism in Health and Disease. Cell Metab. 2017, 25, 27–42. [Google Scholar] [CrossRef]
- Kato, Y.; Maeda, T.; Suzuki, A.; Baba, Y. Cancer metabolism: New insights into classic characteristics. Jpn. Dent. Sci. Rev. 2018, 54, 8–21. [Google Scholar] [CrossRef]
- Newman, A.C.; Maddocks, O.D.K. One-carbon metabolism in cancer. Br. J. Cancer 2017, 116, 1499–1504. [Google Scholar] [CrossRef]
- Tong, J.; Krieger, J.R.; Taylor, P.; Bagshaw, R.; Kang, J.; Jeedigunta, S.; Wybenga-Groot, L.E.; Zhang, W.; Badr, H.; Mirhadi, S.; et al. Cancer proteome and metabolite changes linked to SHMT2. PLoS ONE 2020, 15, e0237981. [Google Scholar] [CrossRef]
- Ji, L.; Tang, Y.; Pang, X.; Zhang, Y. Increased Expression of Serine Hydroxymethyltransferase 2 (SHMT2) is a Negative Prognostic Marker in Patients with Hepatocellular Carcinoma and is Associated with Proliferation of HepG2 Cells. Med. Sci. Monit. 2019, 25, 5823–5832. [Google Scholar] [CrossRef] [PubMed]
- Wilke, A.C.; Doebele, C.; Zindel, A.; Lee, K.S.; Rieke, S.A.; Ceribelli, M.; Comoglio, F.; Phelan, J.D.; Wang, J.Q.; Pikman, Y.; et al. SHMT2 inhibition disrupts the TCF3 transcriptional survival program in Burkitt lymphoma. Blood 2022, 139, 538–553. [Google Scholar] [CrossRef] [PubMed]
- Zhang, P.; Yang, Q. Overexpression of SHMT2 Predicts a Poor Prognosis and Promotes Tumor Cell Growth in Bladder Cancer. Front. Genet. 2021, 12, 682856. [Google Scholar] [CrossRef] [PubMed]
- Ducker, G.S.; Ghergurovich, J.M.; Mainolfi, N.; Suri, V.; Jeong, S.K.; Hsin-Jung Li, S.; Friedman, A.; Manfredi, M.G.; Gitai, Z.; Kim, H.; et al. Human SHMT inhibitors reveal defective glycine import as a targetable metabolic vulnerability of diffuse large B-cell lymphoma. Proc. Natl. Acad. Sci. USA 2017, 114, 11404–11409. [Google Scholar] [CrossRef]
- Wang, B.; Wang, W.; Zhu, Z.; Zhang, X.; Tang, F.; Wang, D.; Liu, X.; Yan, X.; Zhuang, H. Mitochondrial serine hydroxymethyltransferase 2 is a potential diagnostic and prognostic biomarker for human glioma. Clin. Neurol. Neurosurg. 2017, 154, 28–33. [Google Scholar] [CrossRef] [PubMed]
- Woo, C.C.; Chen, W.C.; Teo, X.Q.; Radda, G.K.; Lee, P.T. Downregulating serine hydroxymethyltransferase 2 (SHMT2) suppresses tumorigenesis in human hepatocellular carcinoma. Oncotarget 2016, 7, 53005–53017. [Google Scholar] [CrossRef] [PubMed]
- Tennenhouse, A.; Khmelnitsky, L.; Khalaila, R.; Yeshaya, N.; Noronha, A.; Lindzen, M.; Makowski, E.; Zaretsky, I.; Sirkis, Y.F.; Galon-Wolfenson, Y. Reliable energy-based antibody humanization and stabilization. bioRxiv 2022. [Google Scholar] [CrossRef]
- Witschel, M.; Stelzer, F.; Hutzler, J.; Qu, T.; Mietzner, T.; Kreuz, K.; Grossmann, K.; Aponte, R.; Hoeffken, H.W.; Calo, F. Pyrazolopyrans Having Herbicidal and Pharmaceutical Properties. U.S. Patent US9480259B2, 1 November 2016. [Google Scholar]
- Marani, M.; Paone, A.; Fiascarelli, A.; Macone, A.; Gargano, M.; Rinaldo, S.; Giardina, G.; Pontecorvi, V.; Koes, D.; McDermott, L. A pyrazolopyran derivative preferentially inhibits the activity of human cytosolic serine hydroxymethyltransferase and induces cell death in lung cancer cells. Oncotarget 2016, 7, 4570. [Google Scholar] [CrossRef]
- Zhao, R.; Goldman, I.D. Resistance to antifolates. Oncogene 2003, 22, 7431–7457. [Google Scholar] [CrossRef]
- Stover, P.; Schirch, V. 5-Formyltetrahydrofolate polyglutamates are slow tight binding inhibitors of serine hydroxymethyltransferase. J. Biol. Chem. 1991, 266, 1543–1550. [Google Scholar] [CrossRef]
- Marshall, G.R. Computer-aided drug design. Annu. Rev. Pharmacol. Toxicol. 1987, 27, 193–213. [Google Scholar] [CrossRef] [PubMed]
- Lyne, P.D. Structure-based virtual screening: An overview. Drug Discov. Today 2002, 7, 1047–1055. [Google Scholar] [CrossRef] [PubMed]
- Walters, W.P.; Stahl, M.T.; Murcko, M.A. Virtual screening—An overview. Drug Discov. Today 1998, 3, 160–178. [Google Scholar] [CrossRef]
- Wang, E.; Sun, H.; Wang, J.; Wang, Z.; Liu, H.; Zhang, J.Z.; Hou, T. End-point binding free energy calculation with MM/PBSA and MM/GBSA: Strategies and applications in drug design. Chem. Rev. 2019, 119, 9478–9508. [Google Scholar] [CrossRef] [PubMed]
- Liu, X.; Peng, L.; Zhou, Y.; Zhang, Y.; Zhang, J.Z. Computational alanine scanning with interaction entropy for protein–ligand binding free energies. J. Chem. Theory Comput. 2018, 14, 1772–1780. [Google Scholar] [CrossRef] [PubMed]
- Liu, X.; Peng, L.; Zhang, J.Z. Accurate and efficient calculation of protein–protein binding free energy-interaction entropy with residue type-specific dielectric constants. J. Chem. Inf. Model. 2018, 59, 272–281. [Google Scholar] [CrossRef] [PubMed]
- He, L.; Bao, J.; Yang, Y.; Dong, S.; Zhang, L.; Qi, Y.; Zhang, J.Z. Study of SHMT2 inhibitors and their binding mechanism by computational alanine scanning. J. Chem. Inf. Model. 2019, 59, 3871–3878. [Google Scholar] [CrossRef]
- Moreira, I.S.; Fernandes, P.A.; Ramos, M.J. Computational alanine scanning mutagenesis—An improved methodological approach. J. Comput. Chem. 2007, 28, 644–654. [Google Scholar] [CrossRef]
- Duan, L.; Liu, X.; Zhang, J.Z. Interaction entropy: A new paradigm for highly efficient and reliable computation of protein–ligand binding free energy. J. Am. Chem. Soc. 2016, 138, 5722–5728. [Google Scholar] [CrossRef]
- Han, Y.; He, L.; Qi, Y.; Zhao, Y.; Pan, Y.; Fang, B.; Li, S.; Zhang, J.Z.; Zhang, L. Identification of three new compounds that directly target human serine hydroxymethyltransferase 2. Chem. Biol. Drug Des. 2021, 97, 221–230. [Google Scholar] [CrossRef]
- Chaput, L.; Mouawad, L. Efficient conformational sampling and weak scoring in docking programs? Strategy of the wisdom of crowds. J. Cheminform. 2017, 9, 37. [Google Scholar] [CrossRef] [PubMed]
- Rao, S.; Sanschagrin, P.C.; Greenwood, J.R.; Repasky, M.P.; Sherman, W.; Farid, R. Improving database enrichment through ensemble docking. J. Comput. Aided Mol. Des. 2008, 22, 621–627. [Google Scholar] [CrossRef]
- Vass, M.; Tarcsay, A.; Keseru, G.M. Multiple ligand docking by Glide: Implications for virtual second-site screening. J. Comput. Aided Mol. Des. 2012, 26, 821–834. [Google Scholar] [CrossRef] [PubMed]
- Xu, D.; Meroueh, S.O. Effect of Binding Pose and Modeled Structures on SVMGen and GlideScore Enrichment of Chemical Libraries. J. Chem. Inf. Model. 2016, 56, 1139–1151. [Google Scholar] [CrossRef] [PubMed]
- Repasky, M.P.; Shelley, M.; Friesner, R.A. Flexible ligand docking with Glide. Curr. Protoc. Bioinform. 2007, 8, 8–12. [Google Scholar] [CrossRef]
- Corbeil, C.R.; Englebienne, P.; Moitessier, N. Docking ligands into flexible and solvated macromolecules. 1. Development and validation of FITTED 1.0. J. Chem. Inf. Model. 2007, 47, 435–449. [Google Scholar] [CrossRef]
- Koes, D.R.; Baumgartner, M.P.; Camacho, C.J. Lessons learned in empirical scoring with smina from the CSAR 2011 benchmarking exercise. J. Chem. Inf. Model. 2013, 53, 1893–1904. [Google Scholar] [CrossRef]
- Lu, J.; Hou, X.; Wang, C.; Zhang, Y. Incorporating Explicit Water Molecules and Ligand Conformation Stability in Machine-Learning Scoring Functions. J. Chem. Inf. Model. 2019, 59, 4540–4549. [Google Scholar] [CrossRef]
- Wang, C.; Zhang, Y. Improving scoring-docking-screening powers of protein-ligand scoring functions using random forest. J. Comput. Chem. 2017, 38, 169–177. [Google Scholar] [CrossRef]
- Pan, X.; Wang, H.; Zhang, Y.; Wang, X.; Li, C.; Ji, C.; Zhang, J.Z.H. AA-Score: A New Scoring Function Based on Amino Acid-Specific Interaction for Molecular Docking. J. Chem. Inf. Model. 2022, 62, 2499–2509. [Google Scholar] [CrossRef]
- Plimpton, S. Fast parallel algorithms for short-range molecular dynamics. J. Comput. Phys. 1995, 117, 1–19. [Google Scholar] [CrossRef]
- Kresse, G.; Furthmüller, J. Efficient iterative schemes for ab initio total-energy calculations using a plane-wave basis set. Phys. Rev. B 1996, 54, 11169. [Google Scholar] [CrossRef] [PubMed]
- Friesner, R.A.; Banks, J.L.; Murphy, R.B.; Halgren, T.A.; Klicic, J.J.; Mainz, D.T.; Repasky, M.P.; Knoll, E.H.; Shelley, M.; Perry, J.K. Glide: A new approach for rapid, accurate docking and scoring. 1. Method and assessment of docking accuracy. J. Med. Chem. 2004, 47, 1739–1749. [Google Scholar] [CrossRef]
- Huey, R.; Morris, G.M.; Olson, A.J.; Goodsell, D.S. A semiempirical free energy force field with charge-based desolvation. J. Comput. Chem. 2007, 28, 1145–1152. [Google Scholar] [CrossRef] [PubMed]
- Trott, O.; Olson, A.J. AutoDock Vina: Improving the speed and accuracy of docking with a new scoring function, efficient optimization, and multithreading. J. Comput. Chem. 2010, 31, 455–461. [Google Scholar] [CrossRef]
- Quiroga, R.; Villarreal, M.A. Vinardo: A scoring function based on autodock vina improves scoring, docking, and virtual screening. PLoS ONE 2016, 11, e0155183. [Google Scholar] [CrossRef] [PubMed]
- Butina, D. Unsupervised data base clustering based on daylight’s fingerprint and Tanimoto similarity: A fast and automated way to cluster small and large data sets. J. Chem. Inf. Comput. Sci. 1999, 39, 747–750. [Google Scholar] [CrossRef]
- Wang, J.; Wolf, R.M.; Caldwell, J.W.; Kollman, P.A.; Case, D.A. Development and testing of a general amber force field. J. Comput. Chem. 2004, 25, 1157–1174. [Google Scholar] [CrossRef]
- Dupradeau, F.Y.; Pigache, A.; Zaffran, T.; Savineau, C.; Lelong, R.; Grivel, N.; Lelong, D.; Rosanski, W.; Cieplak, P. The R.E.D. tools: Advances in RESP and ESP charge derivation and force field library building. Phys. Chem. Chem. Phys. 2010, 12, 7821–7839. [Google Scholar] [CrossRef]
- Janecek, M.; Kuhrova, P.; Mlynsky, V.; Otyepka, M.; Sponer, J.; Banas, P. W-RESP: Well-Restrained Electrostatic Potential-Derived Charges. Revisiting the Charge Derivation Model. J. Chem. Theory Comput. 2021, 17, 3495–3509. [Google Scholar] [CrossRef]
- Okiyama, Y.; Watanabe, H.; Fukuzawa, K.; Nakano, T.; Mochizuki, Y.; Ishikawa, T.; Ebina, K.; Tanaka, S. Application of the fragment molecular orbital method for determination of atomic charges on polypeptides. II. Towards an improvement of force fields used for classical molecular dynamics simulations. Chem. Phys. Lett. 2009, 467, 417–423. [Google Scholar] [CrossRef]
- Shul’ga, D.A.; Oliferenko, A.A.; Pisarev, S.A.; Palyulin, V.A.; Zefirov, N.S. Modeling of atomic RESP charges with the use of topological calculation schemes. Dokl. Chem. 2006, 408, 76–79. [Google Scholar] [CrossRef]
- Cornell, W.D.; Cieplak, P.; Bayly, C.I.; Kollman, P.A. Application of RESP charges to calculate conformational energies, hydrogen bond energies, and free energies of solvation. J. Am. Chem. Soc. 2002, 115, 9620–9631. [Google Scholar] [CrossRef]
- Maier, J.A.; Martinez, C.; Kasavajhala, K.; Wickstrom, L.; Hauser, K.E.; Simmerling, C. ff14SB: Improving the Accuracy of Protein Side Chain and Backbone Parameters from ff99SB. J. Chem. Theory Comput. 2015, 11, 3696–3713. [Google Scholar] [CrossRef] [PubMed]
- Pearlman, D.A.; Case, D.A.; Caldwell, J.W.; Ross, W.S.; Cheatham, T.E.; DeBolt, S.; Ferguson, D.; Seibel, G.; Kollman, P. AMBER, a package of computer programs for applying molecular mechanics, normal mode analysis, molecular dynamics and free energy calculations to simulate the structural and energetic properties of molecules. Comput. Phys. Commun. 1995, 91, 1–41. [Google Scholar] [CrossRef]
- Case, D.A.; Cheatham, T.E., III; Darden, T.; Gohlke, H.; Luo, R.; Merz, K.M., Jr.; Onufriev, A.; Simmerling, C.; Wang, B.; Woods, R.J. The Amber biomolecular simulation programs. J. Comput. Chem. 2005, 26, 1668–1688. [Google Scholar] [CrossRef] [PubMed]
- Andersen, H.C. Rattle: A “velocity” version of the shake algorithm for molecular dynamics calculations. J. Comput. Phys. 1983, 52, 24–34. [Google Scholar] [CrossRef]
- Qiu, L.; Yan, Y.; Sun, Z.; Song, J.; Zhang, J.Z. Interaction entropy for computational alanine scanning in protein–protein binding. Wiley Interdiscip. Rev. Comput. Mol. Sci. 2018, 8, e1342. [Google Scholar] [CrossRef]
- Yan, Y.; Yang, M.; Ji, C.G.; Zhang, J.Z. Interaction entropy for computational alanine scanning. J. Chem. Inf. Model. 2017, 57, 1112–1122. [Google Scholar] [CrossRef]
- Song, J.; Qiu, L.; Zhang, J.Z. An efficient method for computing excess free energy of liquid. Sci. China Chem. 2018, 61, 135–140. [Google Scholar] [CrossRef]
- Ben-Shalom, I.Y.; Pfeiffer-Marek, S.; Baringhaus, K.-H.; Gohlke, H. Efficient approximation of ligand rotational and translational entropy changes upon binding for use in MM-PBSA calculations. J. Chem. Inf. Model. 2017, 57, 170–189. [Google Scholar] [CrossRef]
- Genheden, S.; Ryde, U. The MM/PBSA and MM/GBSA methods to estimate ligand-binding affinities. Expert Opin. Drug Discov. 2015, 10, 449–461. [Google Scholar] [CrossRef]
- Massova, I.; Kollman, P.A. Combined molecular mechanical and continuum solvent approach (MM-PBSA/GBSA) to predict ligand binding. Perspect. Drug Discov. Des. 2000, 18, 113–135. [Google Scholar] [CrossRef]
- Onufriev, A.; Bashford, D.; Case, D.A. Exploring protein native states and large-scale conformational changes with a modified generalized born model. Proteins Struct. Funct. Bioinform. 2004, 55, 383–394. [Google Scholar] [CrossRef]
- Hou, T.; Wang, J.; Li, Y.; Wang, W. Assessing the performance of the MM/PBSA and MM/GBSA methods. 1. The accuracy of binding free energy calculations based on molecular dynamics simulations. J. Chem. Inf. Model. 2011, 51, 69–82. [Google Scholar] [CrossRef] [PubMed]
- Zhou, Y.; Liu, X.; Zhang, Y.; Peng, L.; Zhang, J.Z. Residue-specific free energy analysis in ligand bindings to JAK2. Mol. Phys. 2018, 116, 2633–2641. [Google Scholar] [CrossRef]
- Miller, B.R., III; McGee, T.D., Jr.; Swails, J.M.; Homeyer, N.; Gohlke, H.; Roitberg, A.E. MMPBSA. py: An efficient program for end-state free energy calculations. J. Chem. Theory Comput. 2012, 8, 3314–3321. [Google Scholar] [CrossRef] [PubMed]


| Residue | IE | ||||||
|---|---|---|---|---|---|---|---|
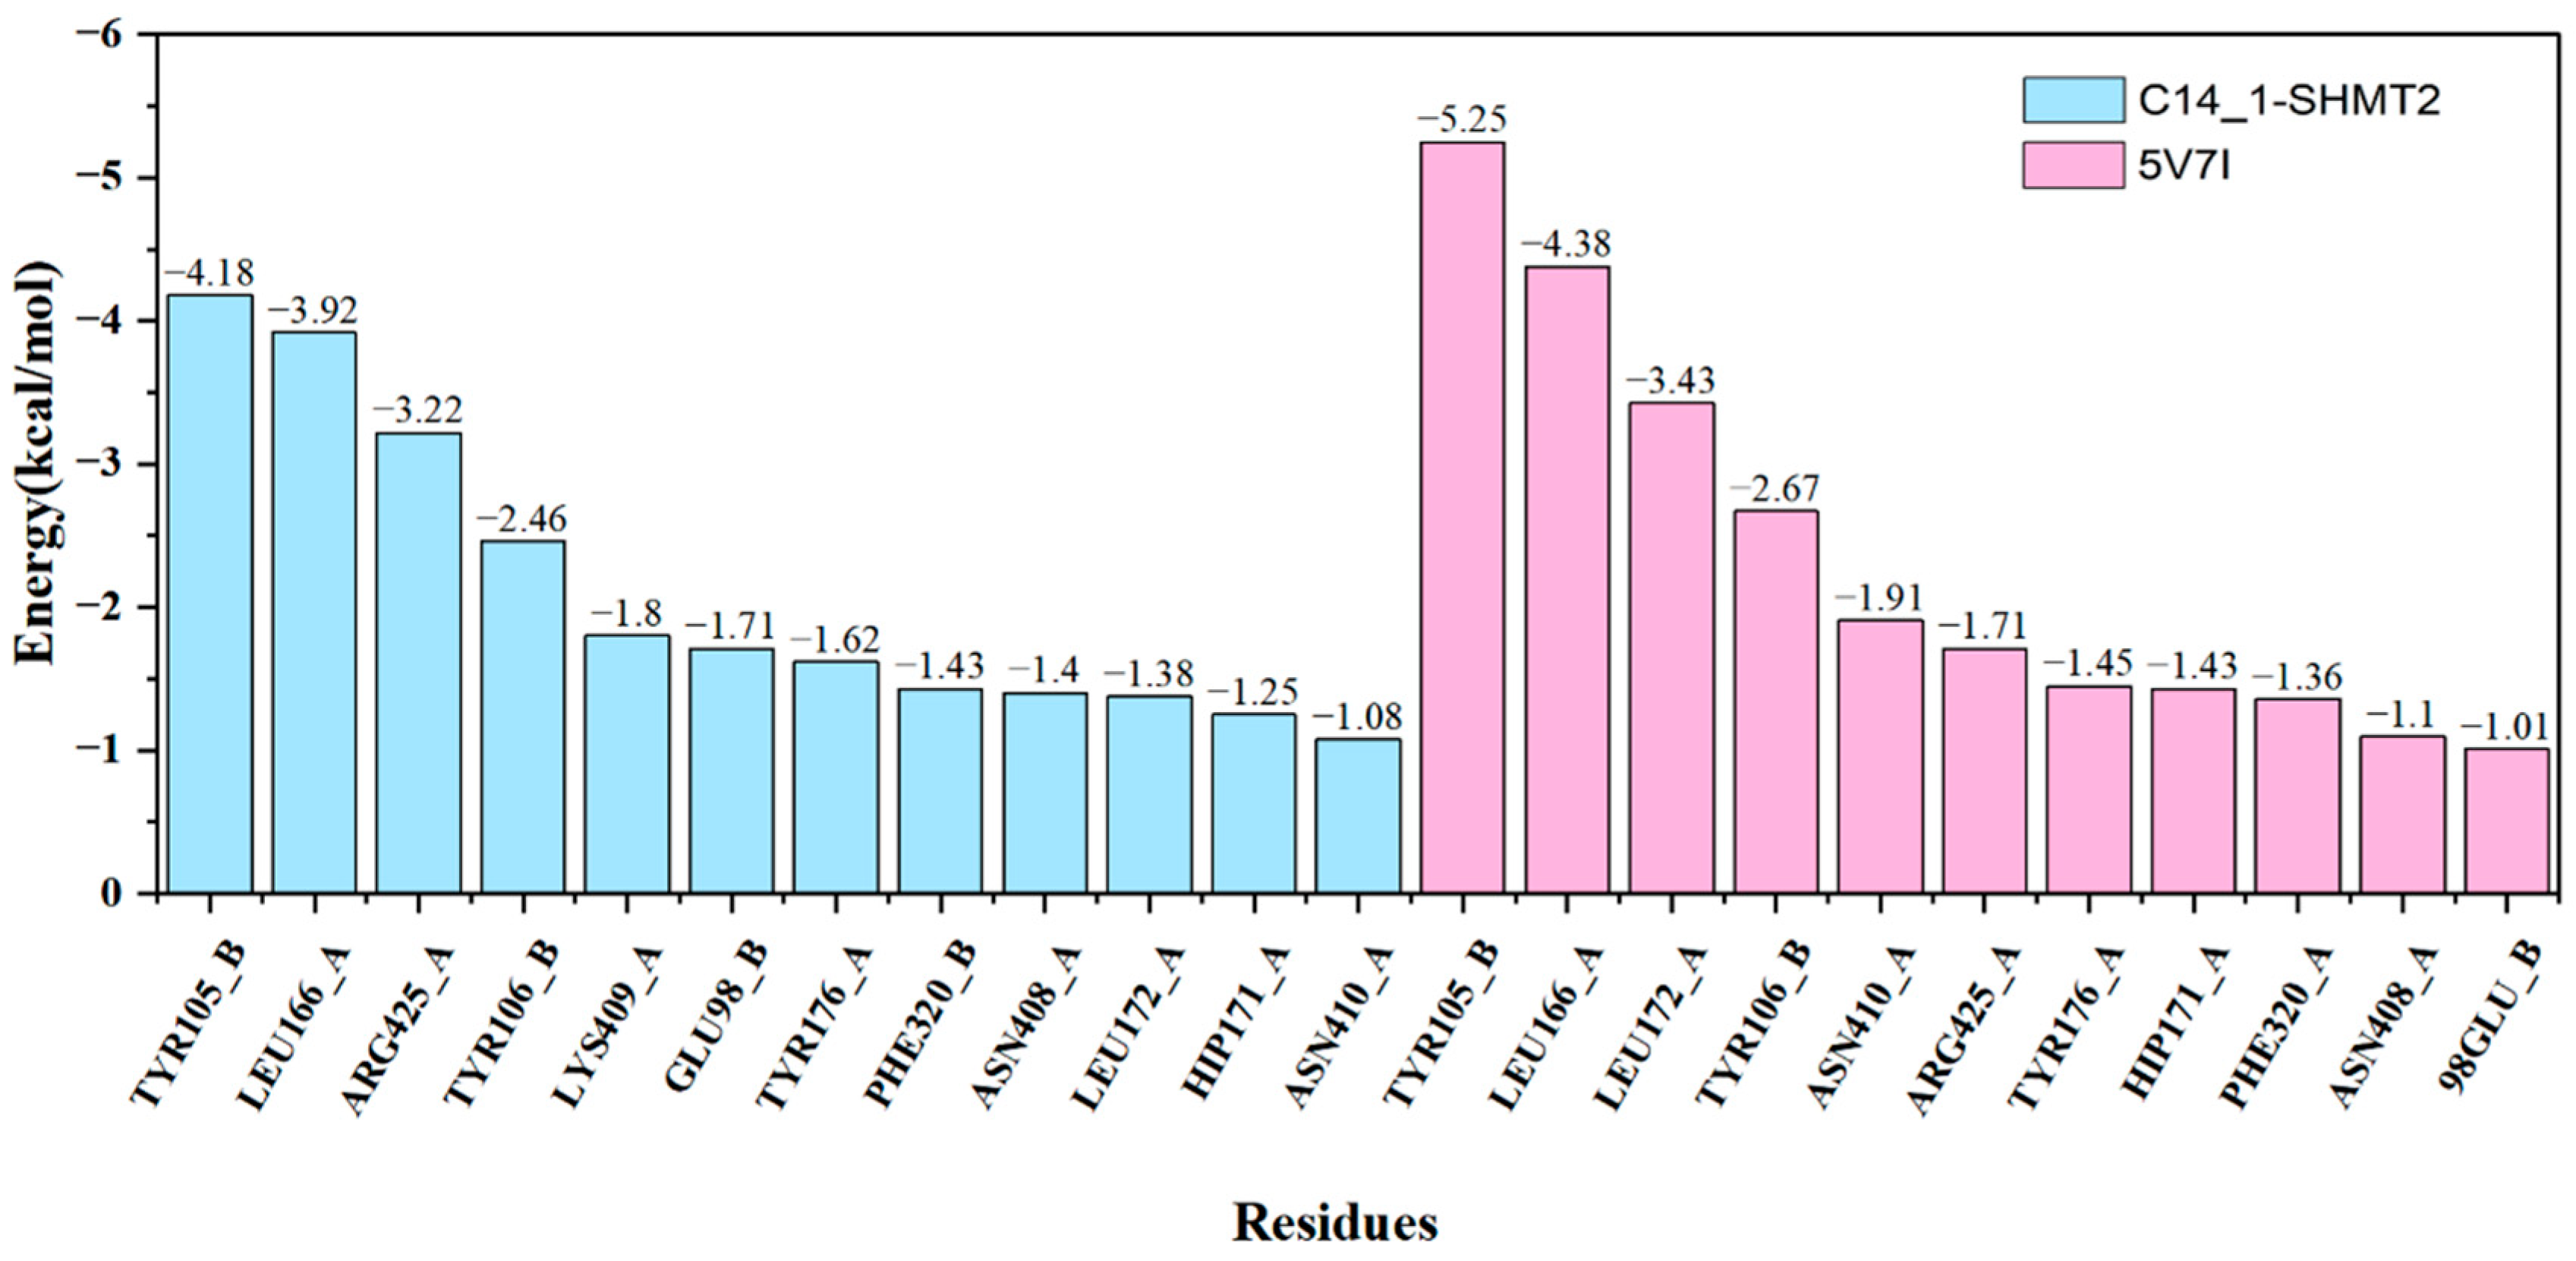
| TYR105_B | −5.05 | 0.05 | 0.71 | −0.28 | −4.57 | 0.39 | −4.18 |
| LEU166_A | −4.50 | −0.07 | 0.55 | −0.35 | −4.36 | 0.44 | −3.92 |
| ARG425_A | −3.18 | −0.08 | 0.02 | −0.22 | −3.46 | 0.24 | −3.22 |
| TYR106_B | −2.40 | 0.13 | −0.17 | −0.17 | −2.61 | 0.15 | −2.46 |
| LYS409_A | −1.82 | −0.01 | 0.06 | −0.17 | −1.94 | 0.14 | −1.80 |
| GLU98_B | −1.75 | −0.22 | 0.23 | −0.14 | −1.88 | 0.17 | −1.71 |
| TYR176_A | −1.93 | 0.00 | 0.34 | −0.19 | −1.78 | 0.16 | −1.62 |
| PHE320_B | −2.11 | −0.55 | 1.14 | −0.12 | −1.64 | 0.21 | −1.43 |
| ASN408_A | −1.37 | −0.31 | 0.15 | −0.11 | −1.63 | 0.23 | −1.40 |
| LEU172_A | −1.74 | −0.30 | 0.59 | −0.13 | −1.59 | 0.21 | −1.38 |
| HIP171_A | −1.21 | −0.17 | −0.01 | −0.09 | −1.48 | 0.23 | −1.25 |
| ASN410_A | −1.38 | −0.38 | 0.52 | −0.10 | −1.33 | 0.25 | −1.08 |
Disclaimer/Publisher’s Note: The statements, opinions and data contained in all publications are solely those of the individual author(s) and contributor(s) and not of MDPI and/or the editor(s). MDPI and/or the editor(s) disclaim responsibility for any injury to people or property resulting from any ideas, methods, instructions or products referred to in the content. |
© 2023 by the authors. Licensee MDPI, Basel, Switzerland. This article is an open access article distributed under the terms and conditions of the Creative Commons Attribution (CC BY) license (https://creativecommons.org/licenses/by/4.0/).
Share and Cite
Chen, B.; Zhang, J.Z.H. Screening and Analysis of Potential Inhibitors of SHMT2. Biophysica 2023, 3, 651-667. https://doi.org/10.3390/biophysica3040044
Chen B, Zhang JZH. Screening and Analysis of Potential Inhibitors of SHMT2. Biophysica. 2023; 3(4):651-667. https://doi.org/10.3390/biophysica3040044
Chicago/Turabian StyleChen, Bojin, and John Z. H. Zhang. 2023. "Screening and Analysis of Potential Inhibitors of SHMT2" Biophysica 3, no. 4: 651-667. https://doi.org/10.3390/biophysica3040044