1. Introduction
In most publications on DNA damage and not least radiation-induced damage, the severity of double-strand breaks (DSBs) is pointed out as critical. However, there are many types of real breaks in the DNA fibers of the chromosomes and most of them are quite effectively repaired by the cellular DNA repair system [
1,
2,
3,
4,
5,
6,
7,
8,
9] as they are produced by the electron slowing down spectrum of the primary particles (
Figure 1). Simple DNA breaks (
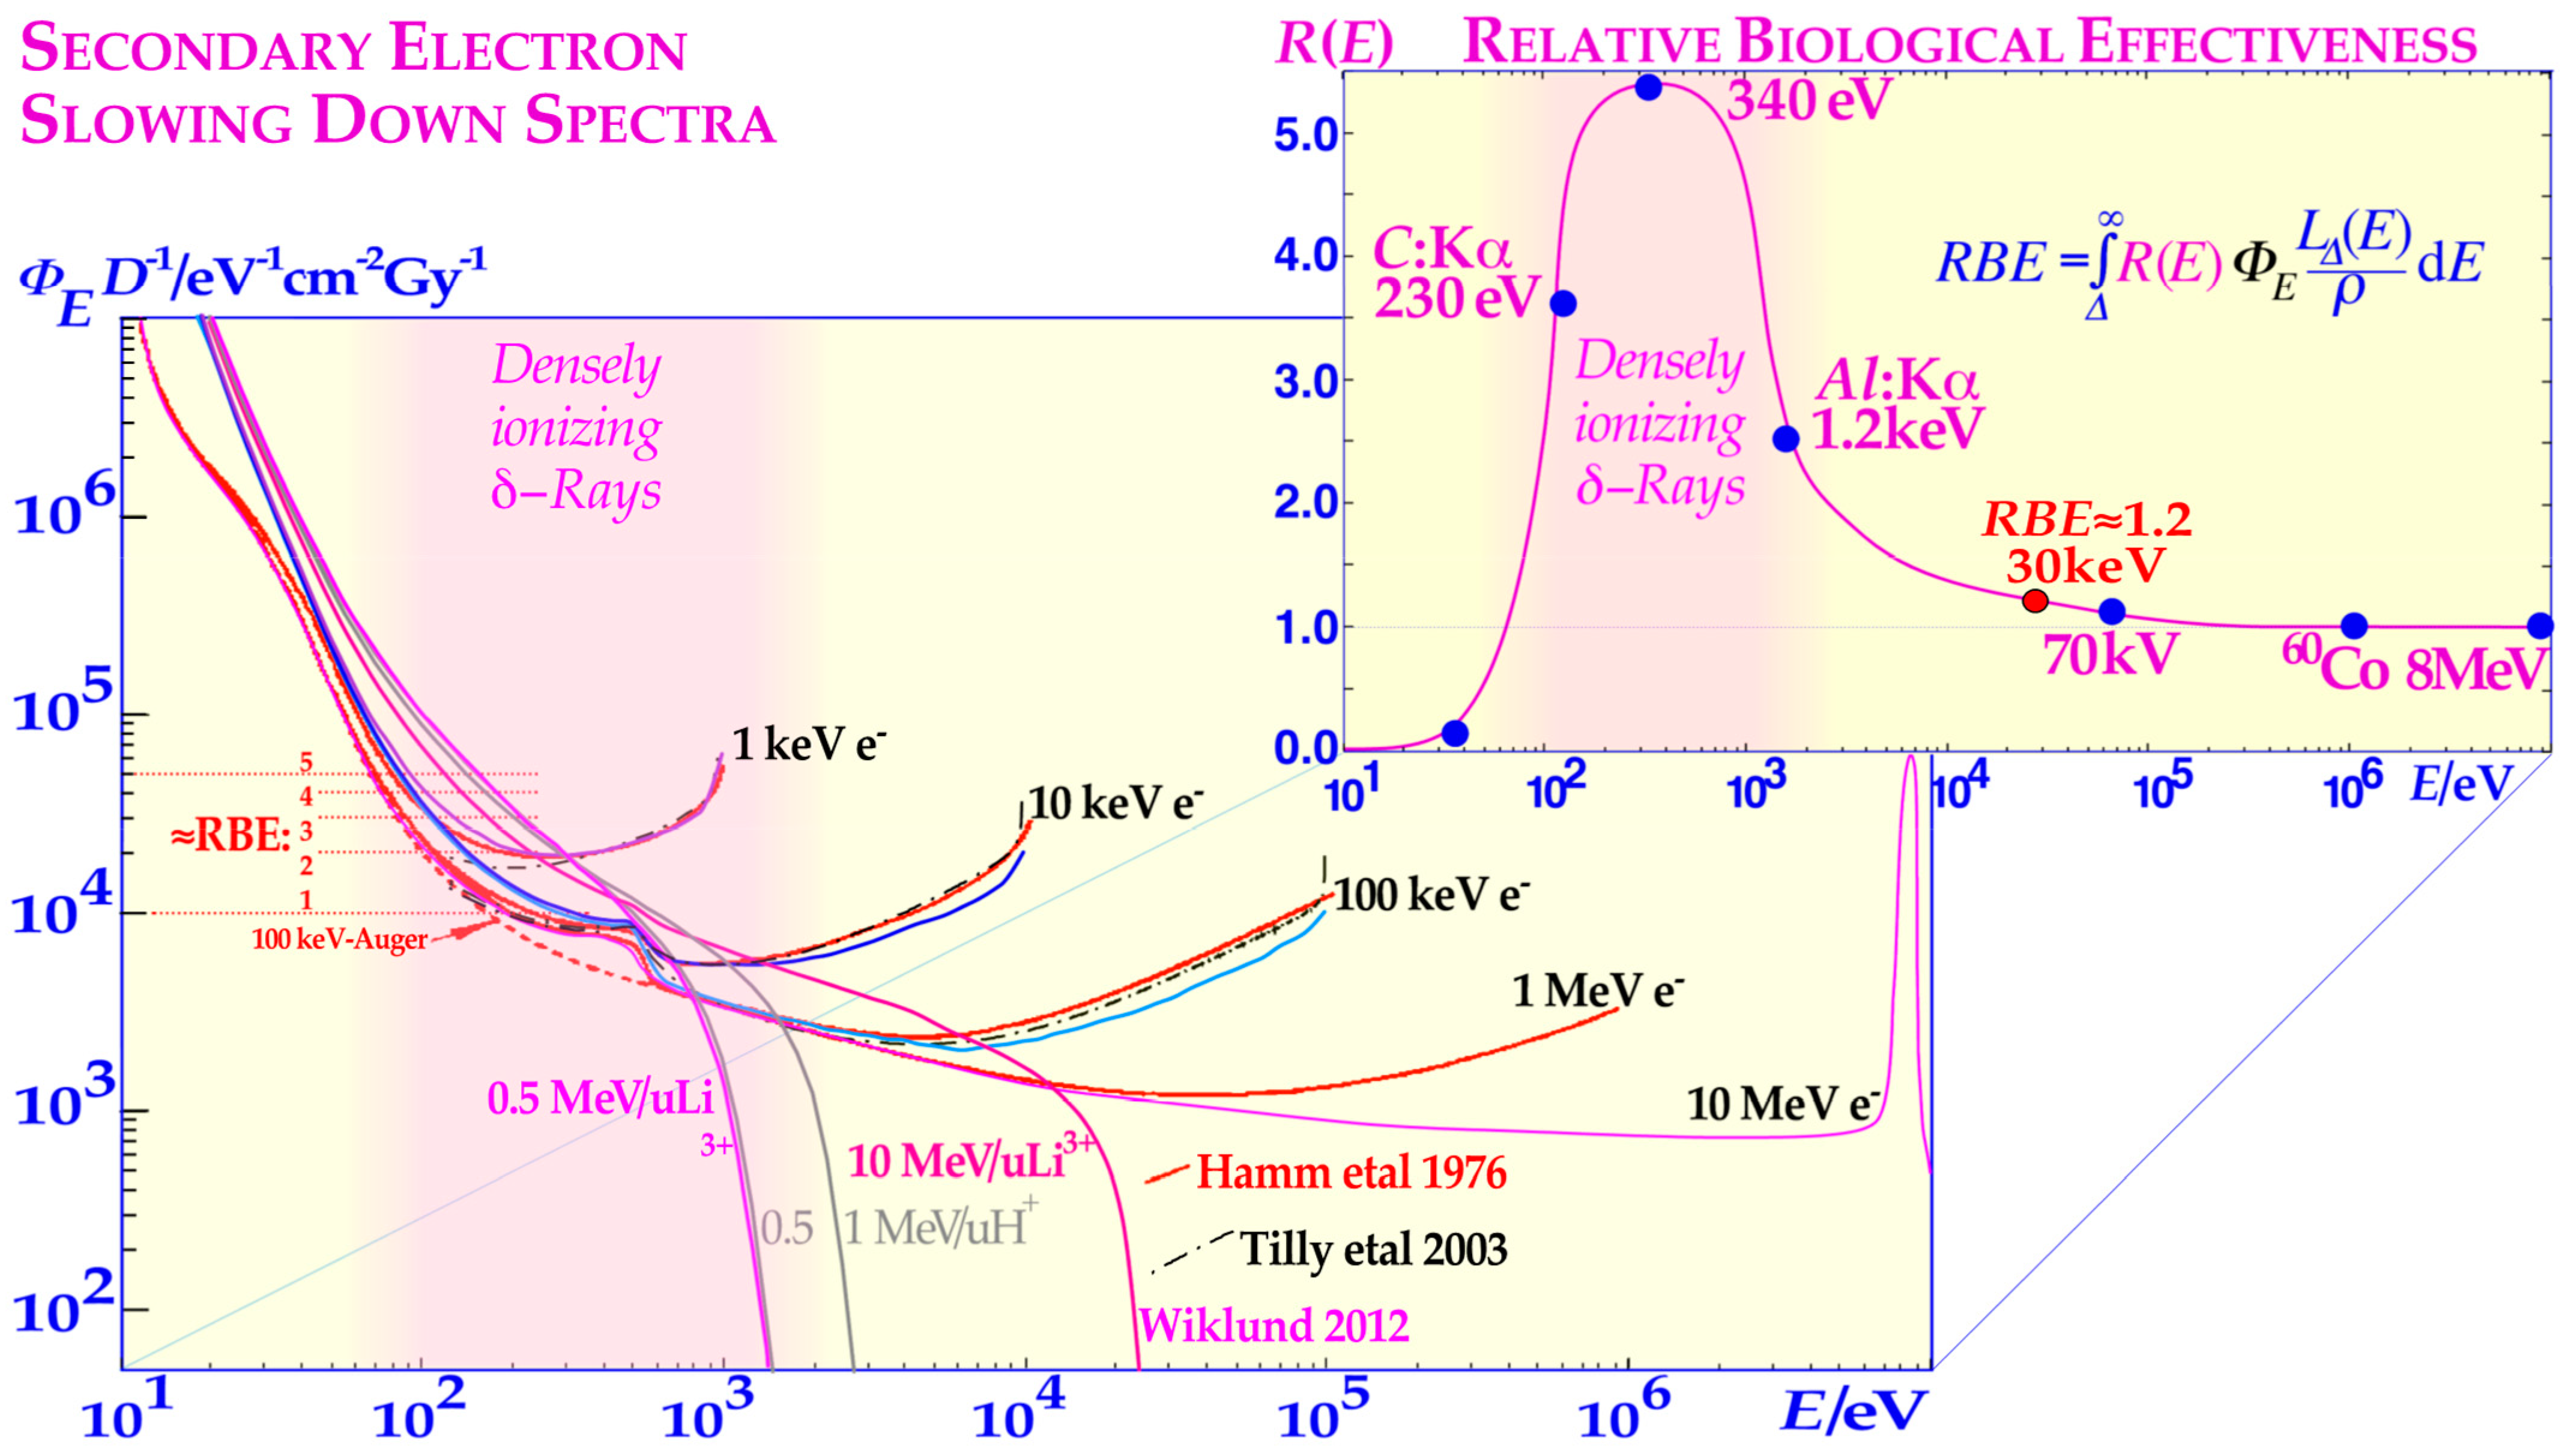
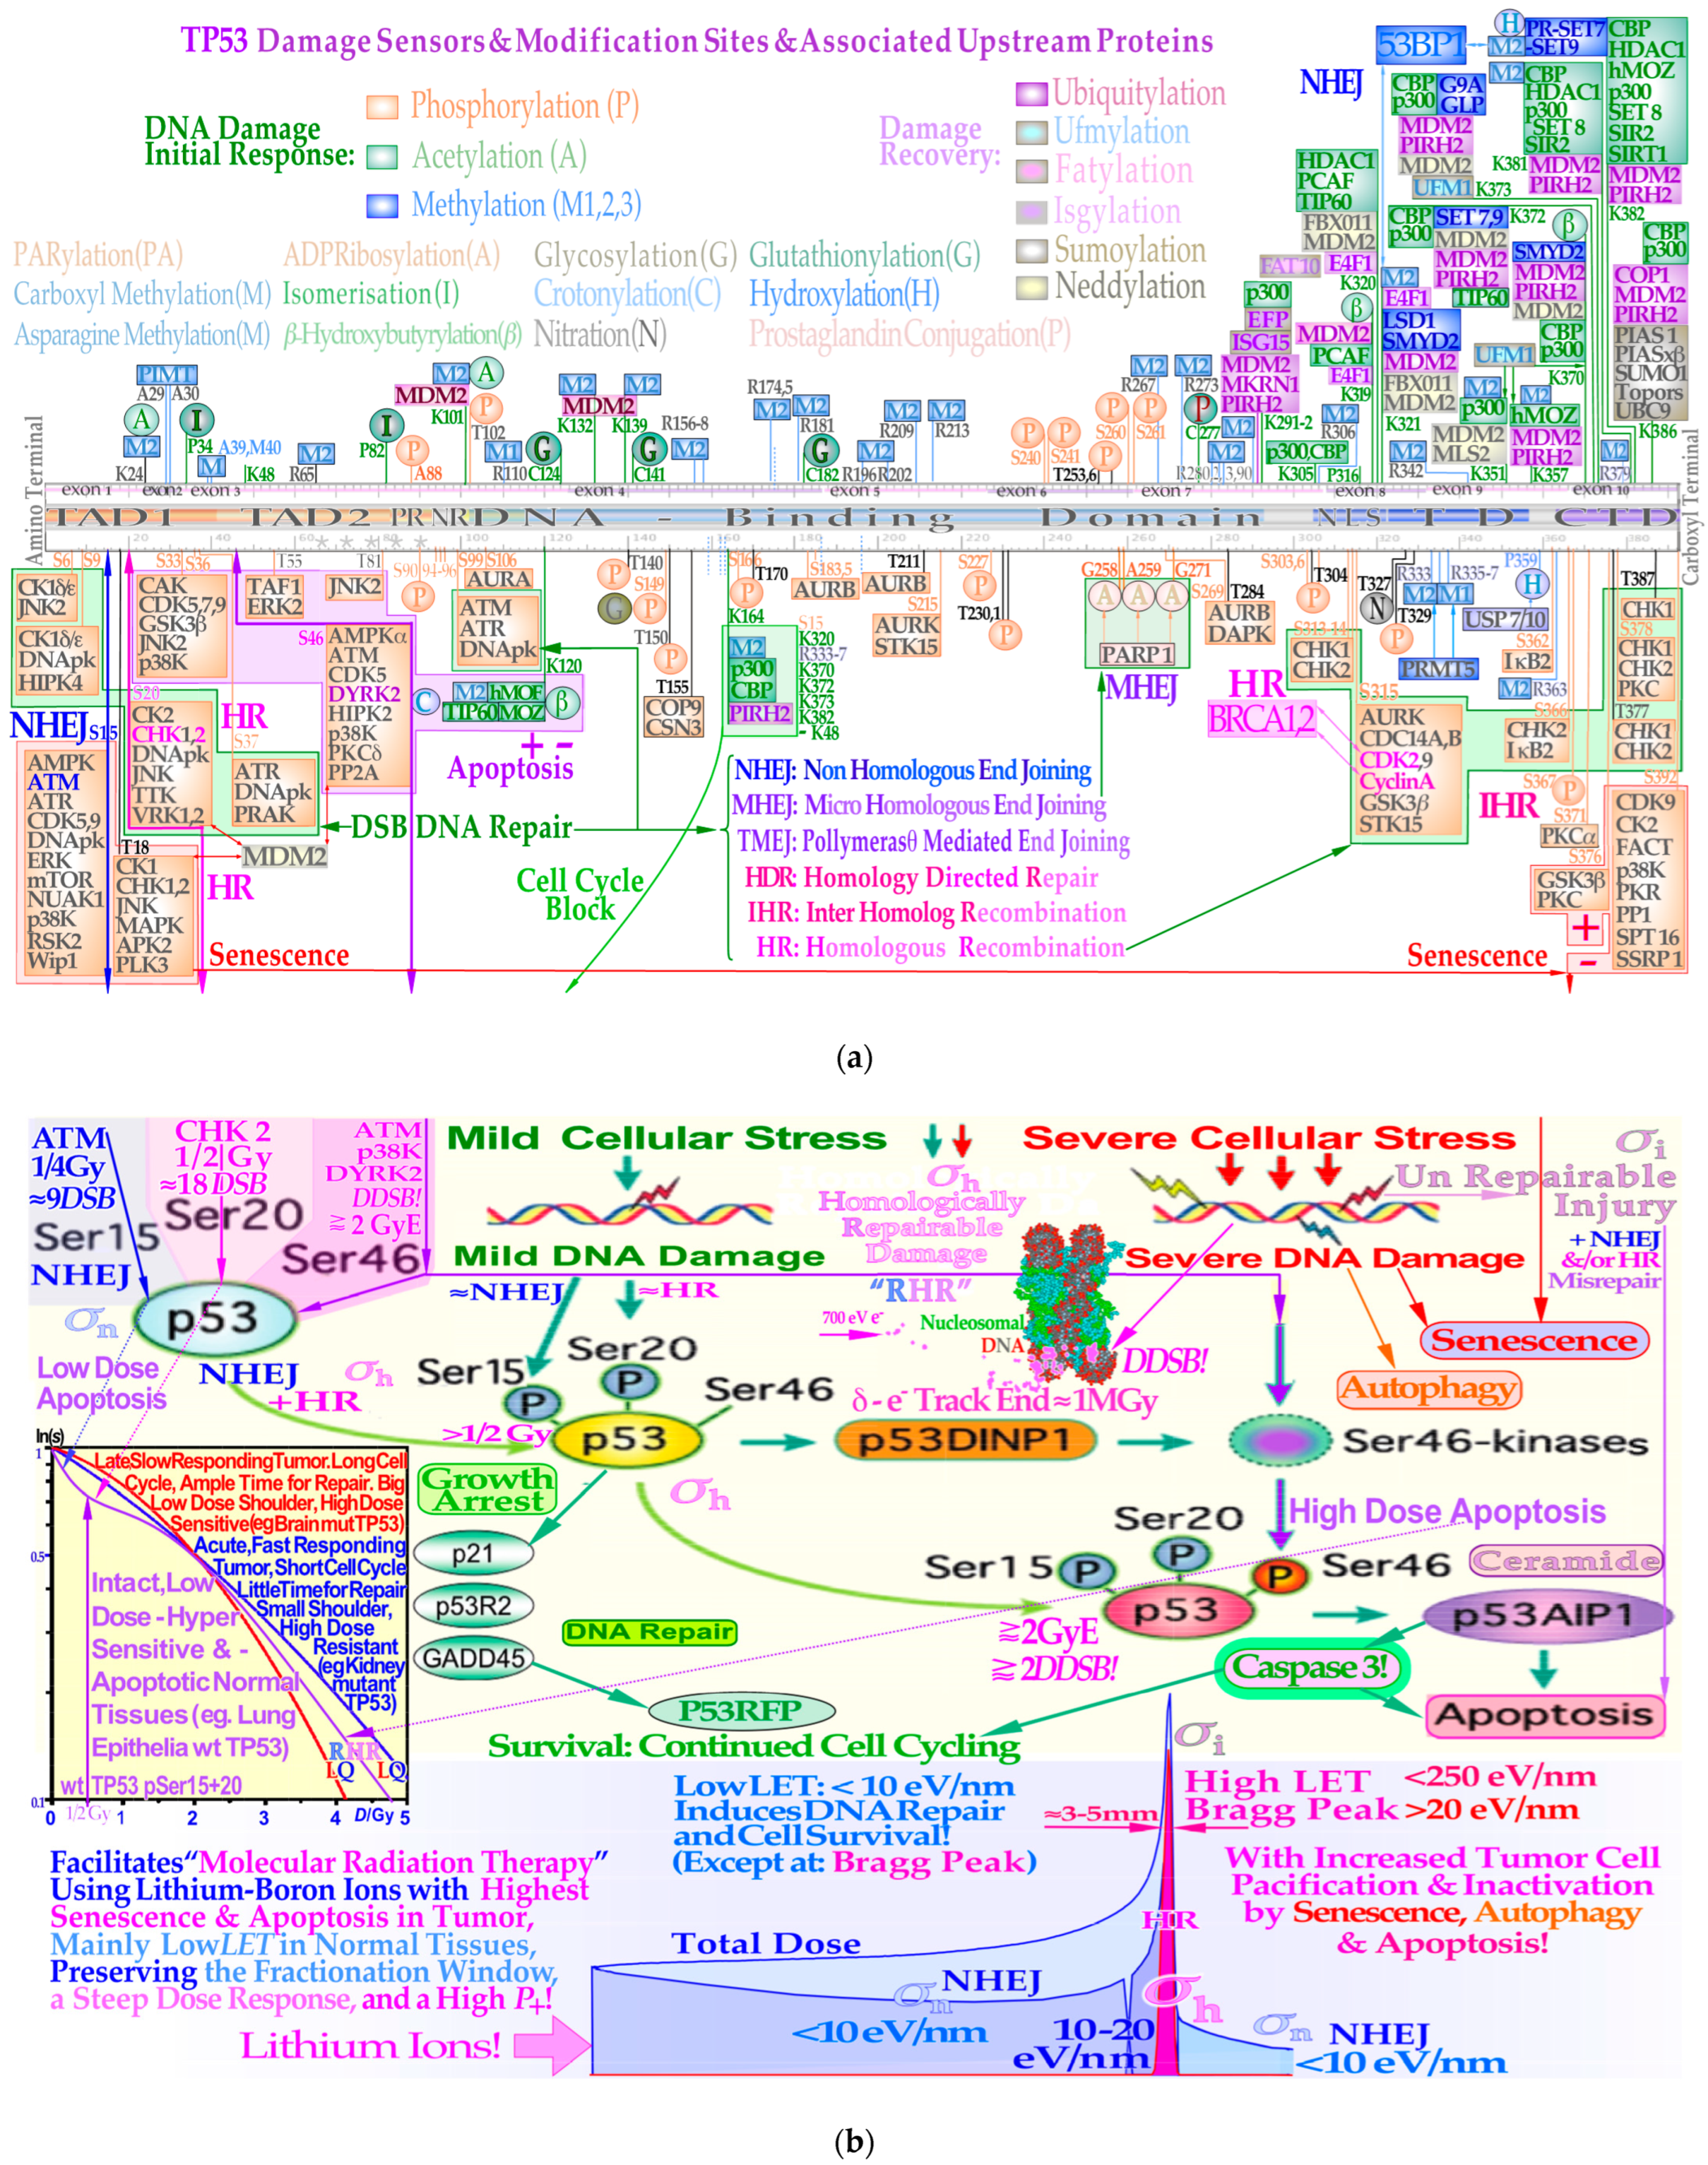
Figure 2a upper half) generally produced by low-ionization-density photons and electrons are effectively repaired by NHEJ at low therapeutic doses, whereas higher doses and ionization-densities increasingly require HR (
Figure 2a lower half and
Figure 2b). Interestingly, the pathway selection is largely determined by TP53 sensory layer indicated in
Figure 2a as shown in more detail in
Figure 3a,b and result in tumor and normal tissue cell survival curves as seen in in the lower right inset in
Figure 3b and
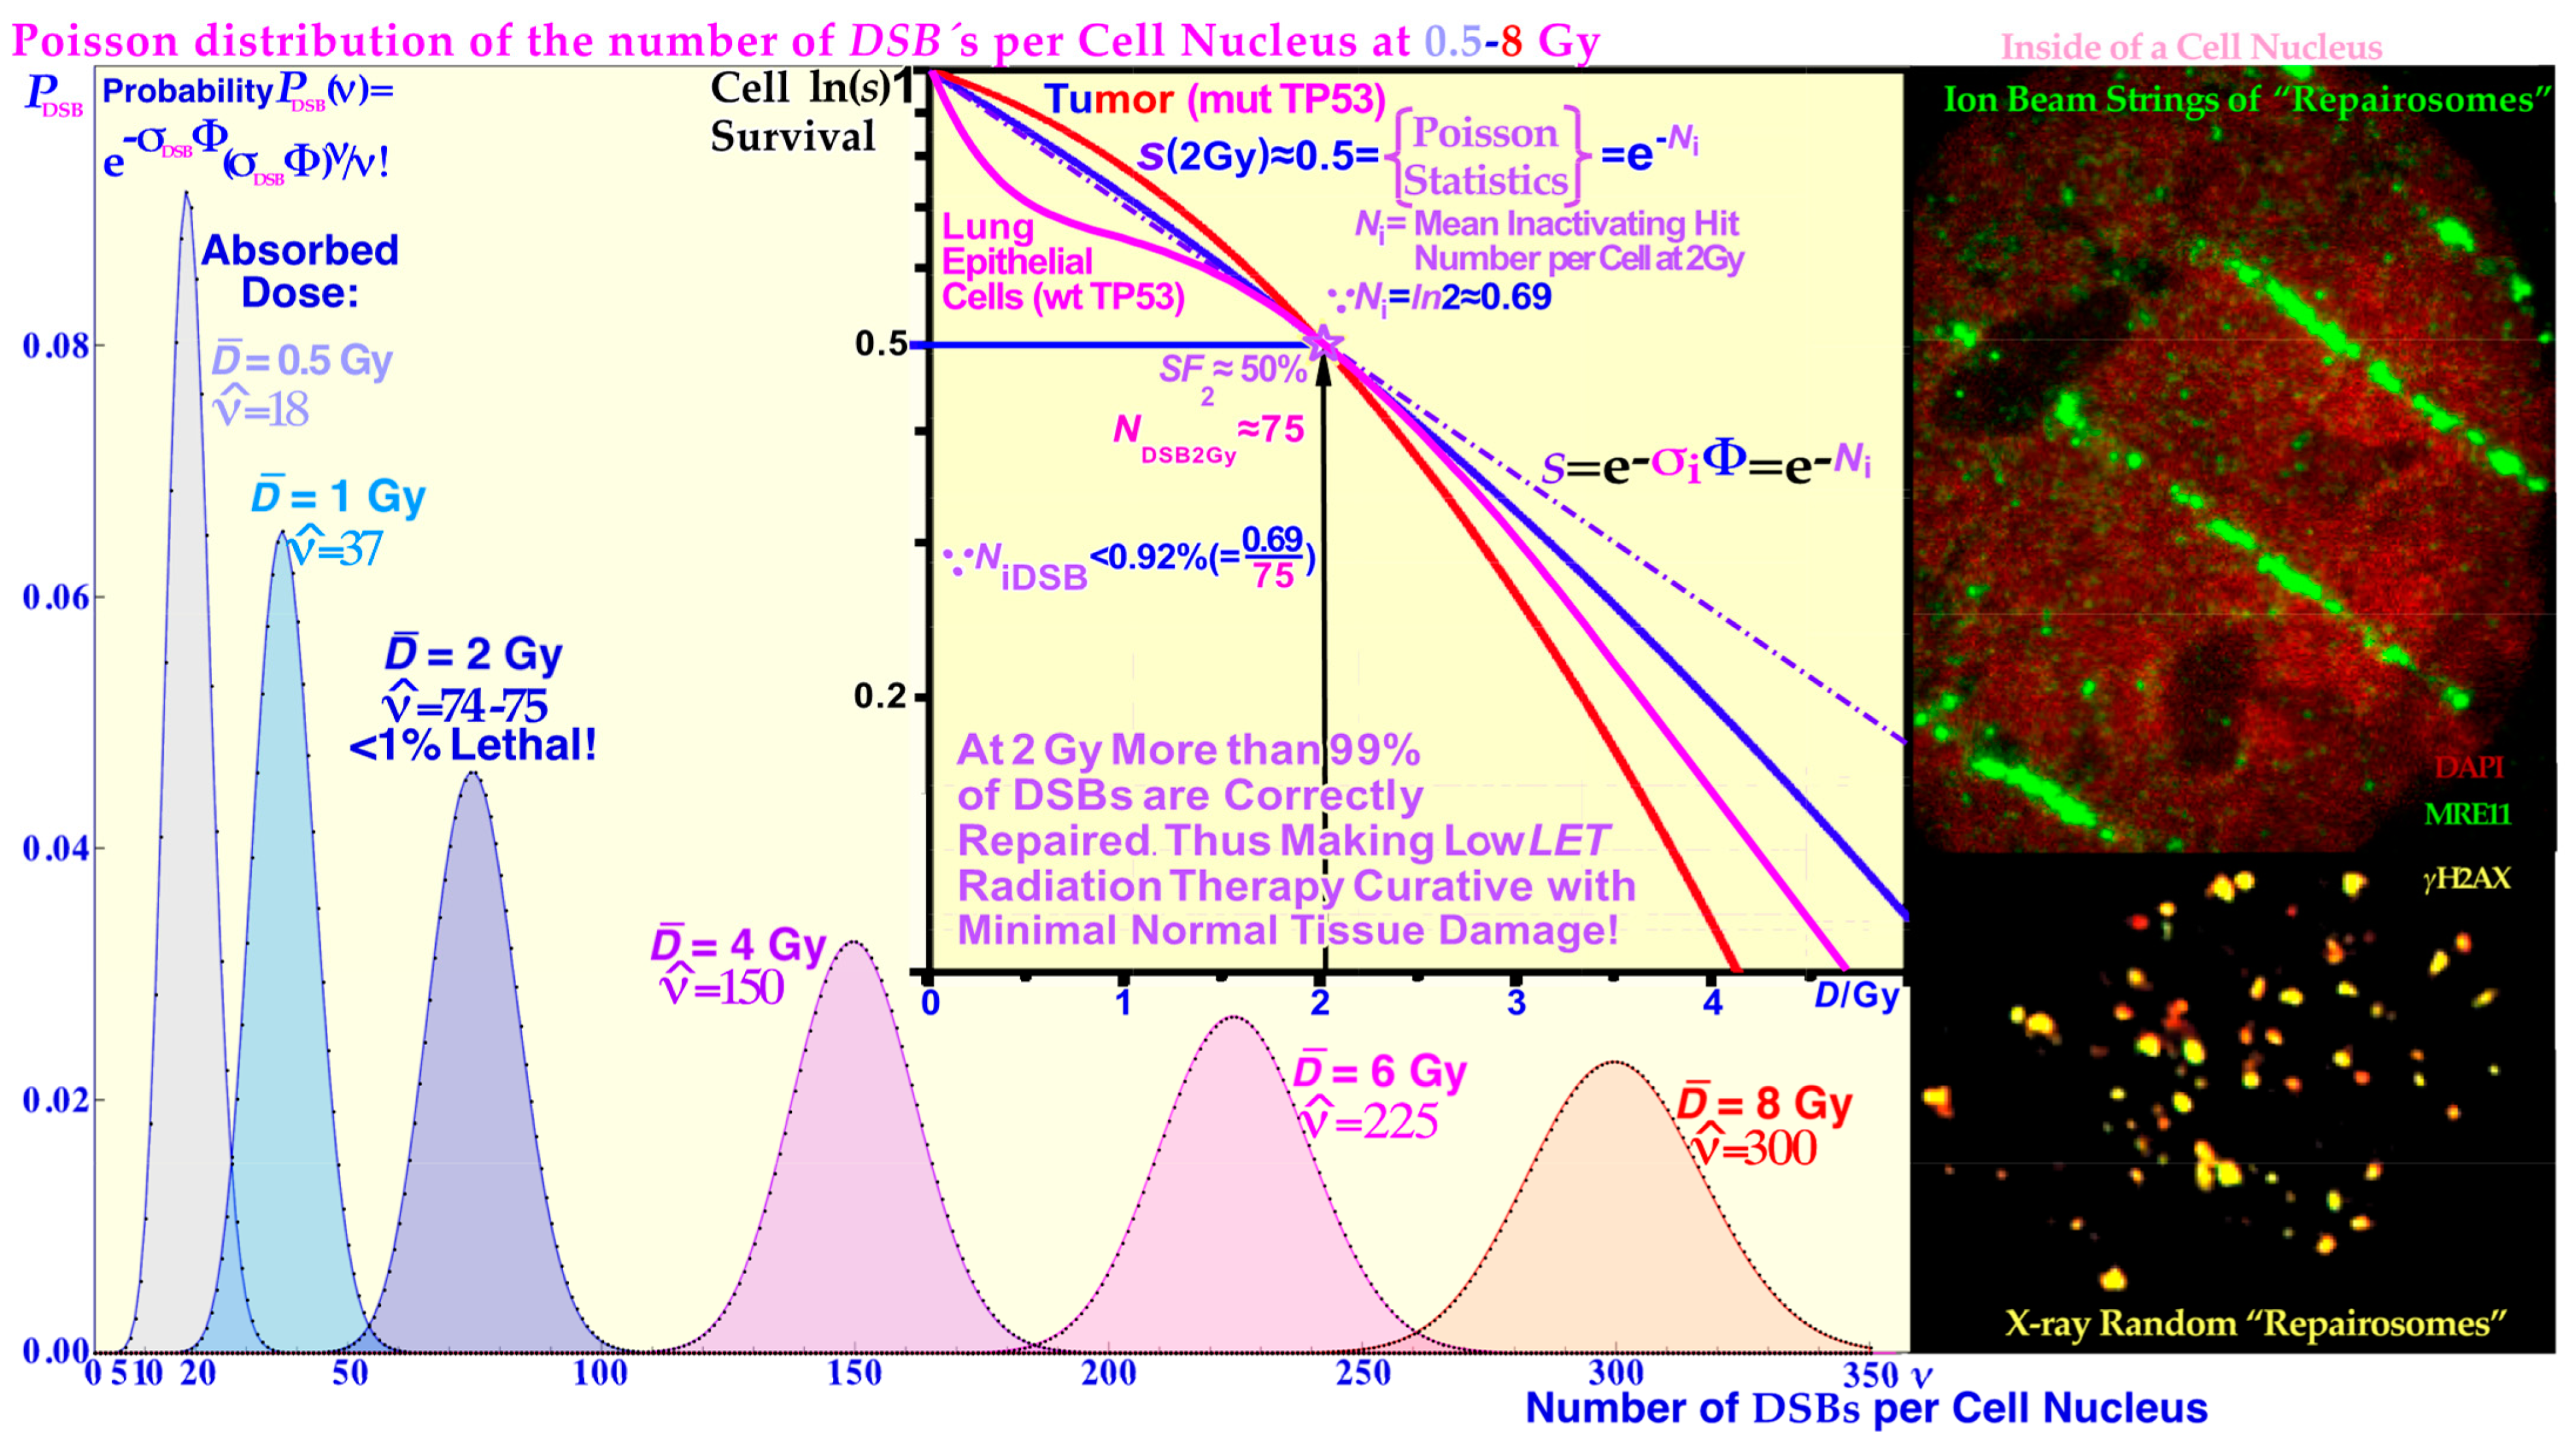
Figure 4, respectively. In fact, more than 99% of the DSBs are repaired correctly at 2 Gy and below (cf
Figure 5 and [
1,
9]). Thus, less than 1% of the real DNA breaks or, more exactly, “double-strand breaks” (DSBs) are lethal at approximately 2 Gy and below with sparsely ionizing radiation (low
LET). These radiation types make ≈75 DSBs in each cell nucleus at 2 Gy, as shown in more detail in
Figure 5 [
1]. Fortunately, this is the basis for curative radiation therapy, since it means that irradiated healthy normal tissue can recover after an optimal radiation treatment, when generally much higher therapeutic doses have to be delivered to the tumor volume. One may thus ask how cells are dying by radiation therapy if most and probably all simple DSBs are effectively being repaired by the cellular repair systems shown in some detail in the lower half of
Figure 2a and
Figure 3a,b. This has been known for quite some time to be mainly due to so-called multiply damaged sites (MDSs, [
10]) often caused by low-energy electrons (cf e.g., [
11,
12,
13,
14]) that have 10–30 nm ranges and by necessity are linked to all radiation beams as secondary so-called
δ-rays or
δ-electrons produced by the energy loss processes of the primary particle beam (cf
Figure 1 inset and [
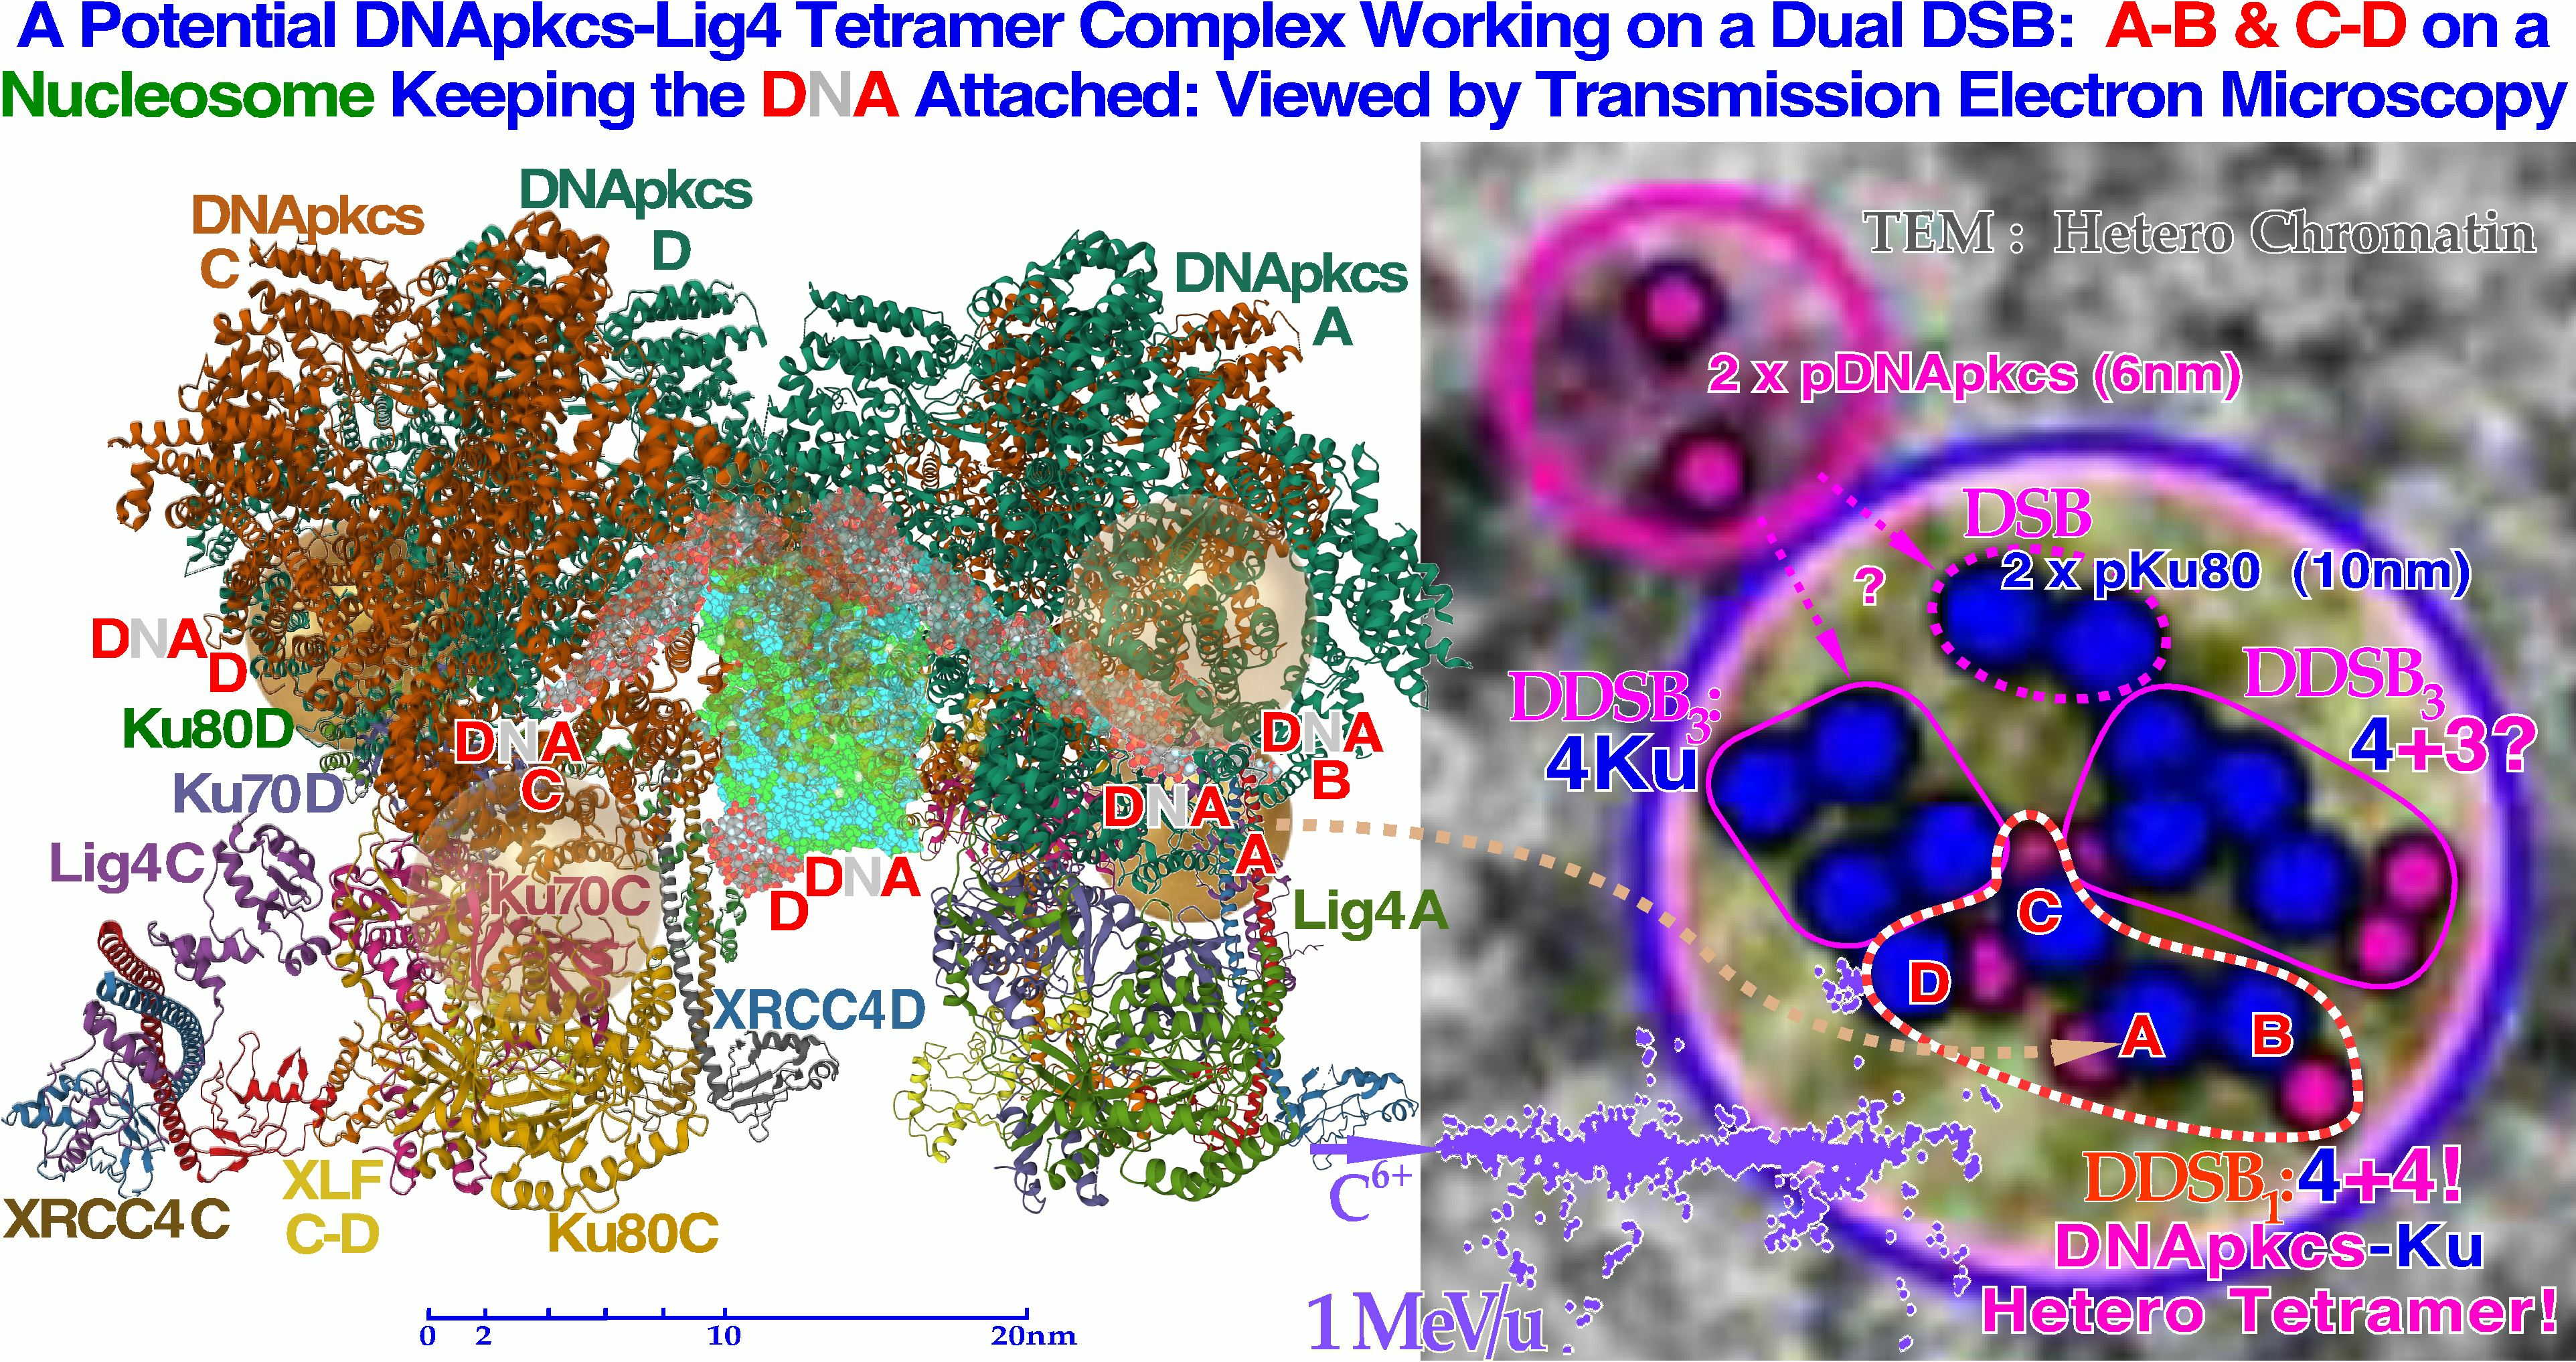
1]: Figure 3). In fact, very low-energy electron and photon beams (1.5–0.2 keV) are linked to very high relative biological effectiveness (RBE > 3, cf
Figure 1 [
15,
16]: Figure 8.7a), and the
δ-electron fluence per unit dose in this energy range of the secondary electron slowing down spectrum largely determines the RBE as seen in
Figure 1 [
17,
18,
19,
20,
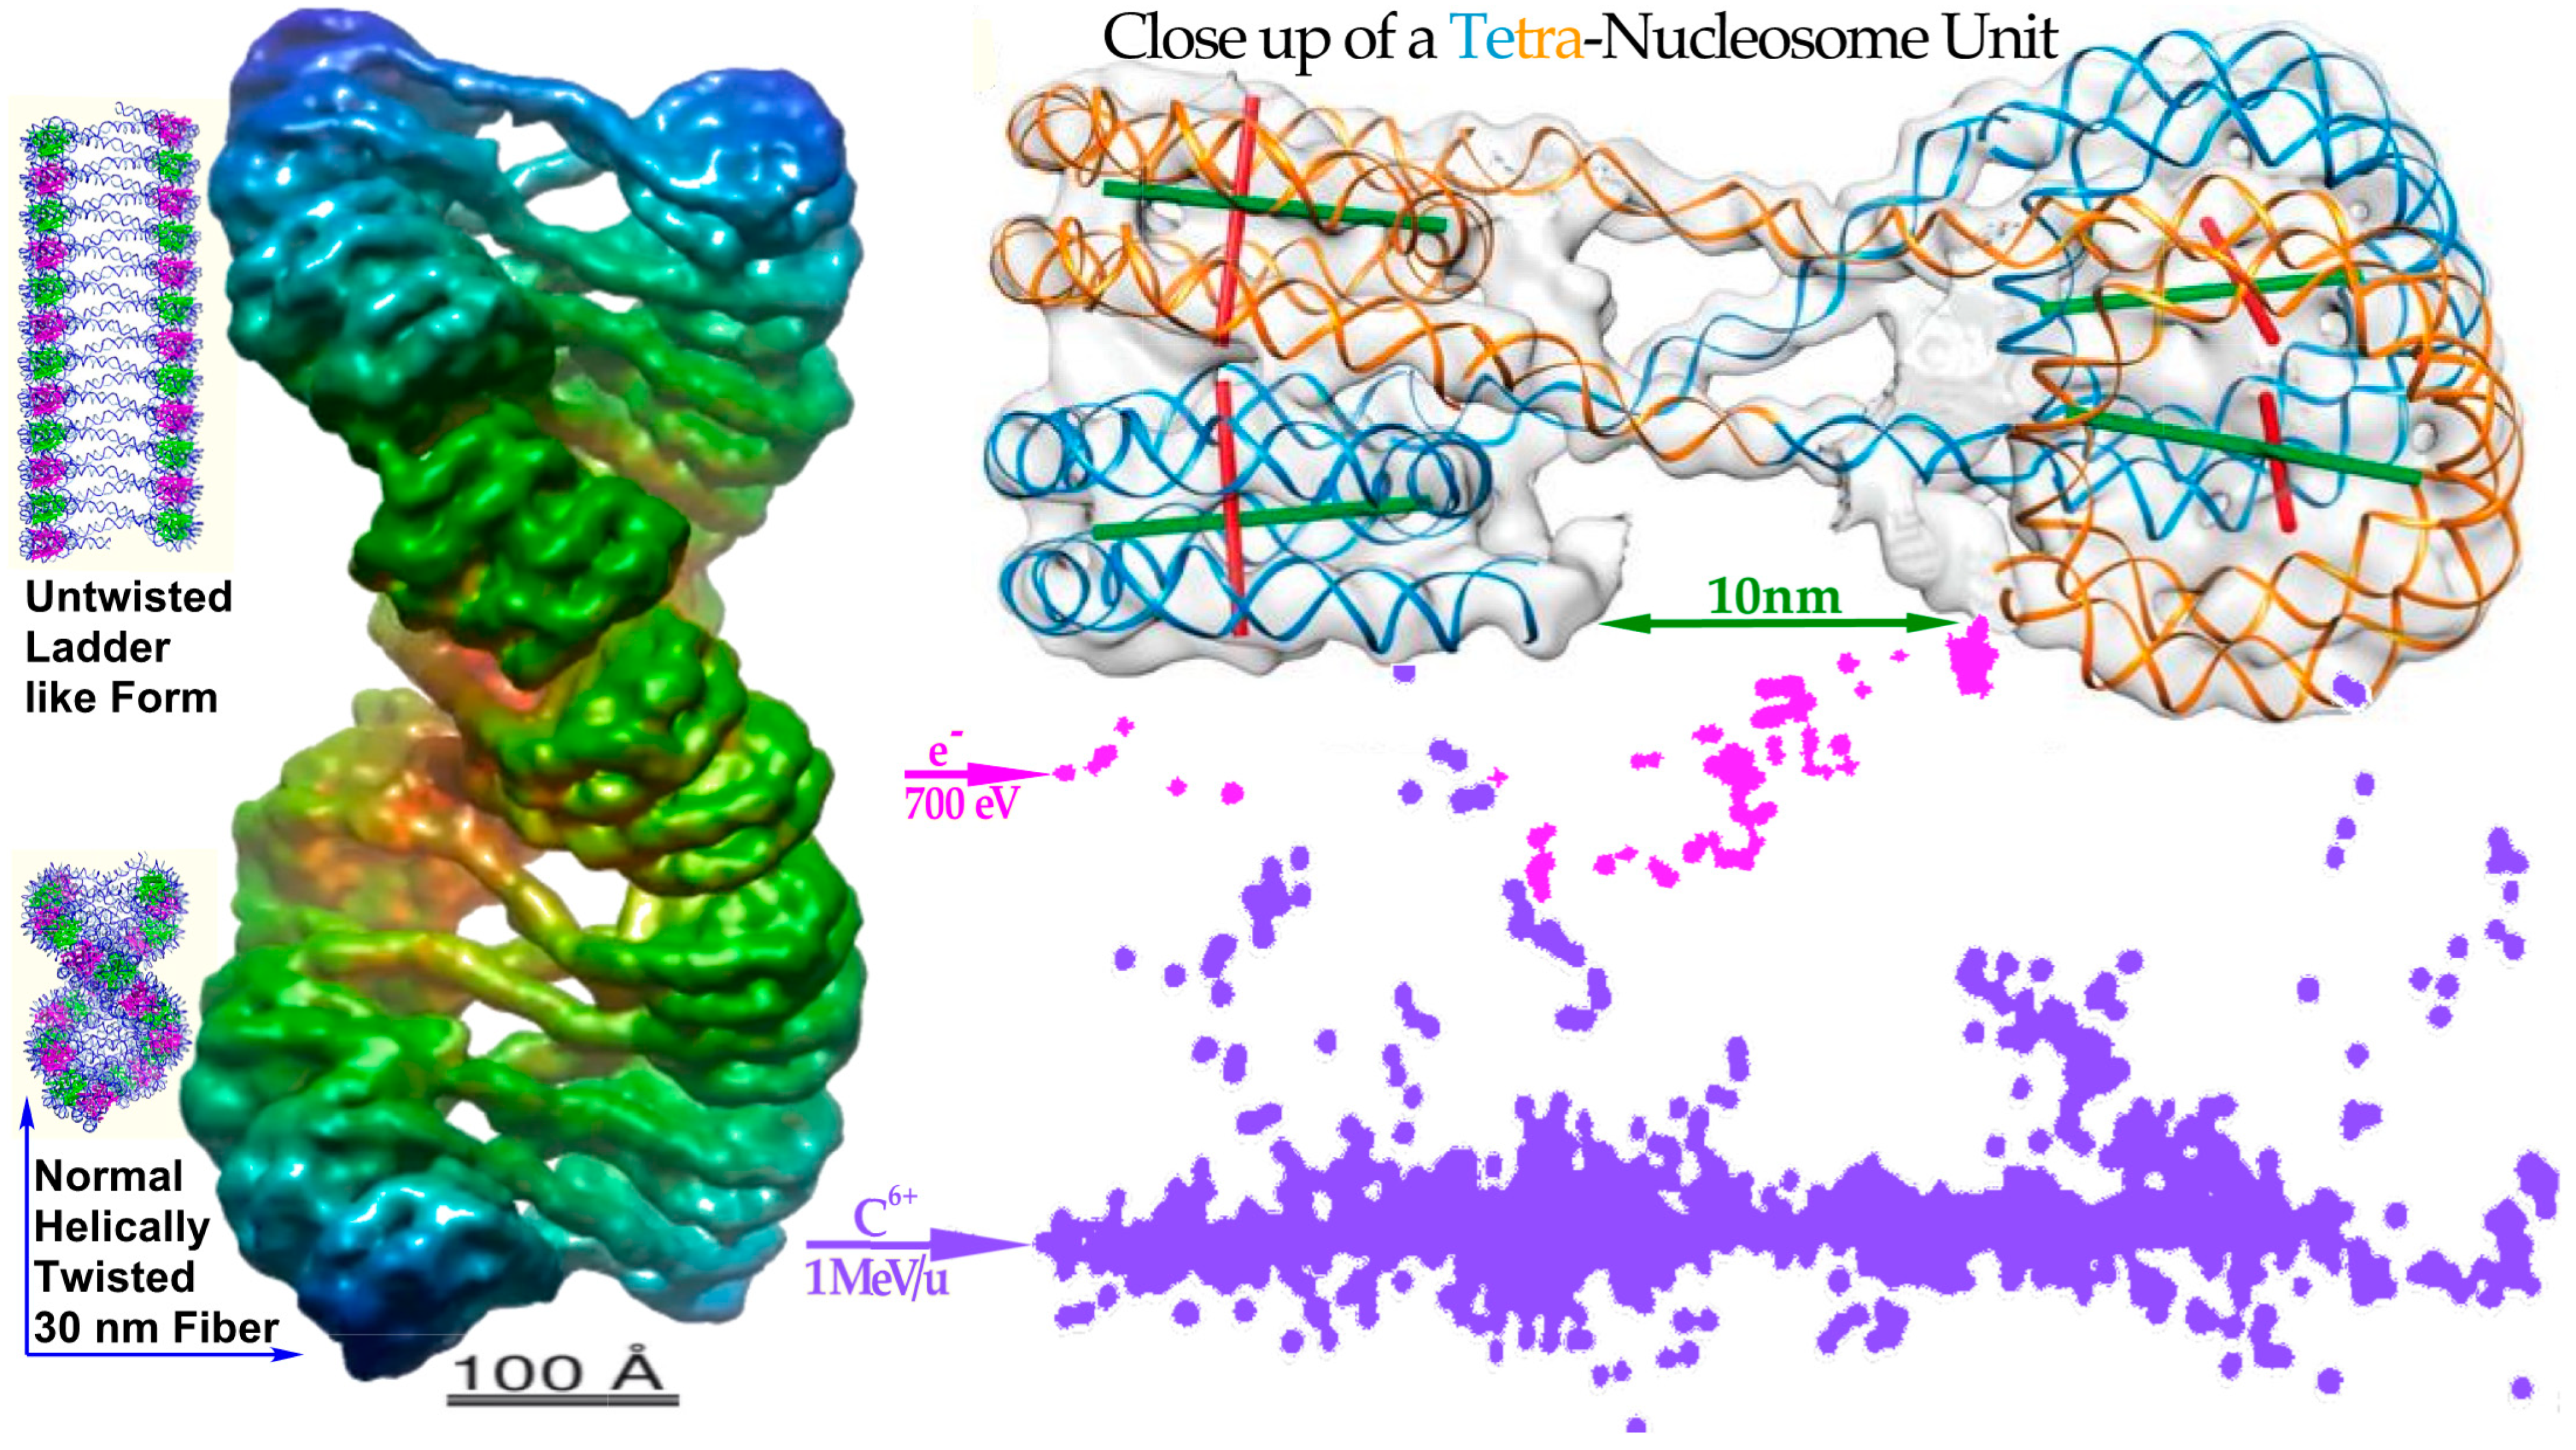
21]. In the mid-1990s, we realized that the most likely way to generate this high biological effect at a “multiply damaged site” would be by a
δ-electron hitting anywhere on the periphery of a nucleosome (cf Figure 7 [
22]). Heterochromatic DNA is wound almost two turns around it to save space and obtain safe storage of the hereditary material, but unfortunately such peripheral hits would generate two DSBs only a few nm apart, i.e., a dual DSB (DDSB, cf lower right of
Figure 3b,
Figure 6,
Figure 7,
Figure 8 and
Figure 9). As expected, DNA fragment length analyses showed that DNA segments of 78–80 base pairs were more than twice as common as all other segment lengths as they were practically independent of the hit location (
Figure 8). This predominantly produced fragment length is equal to a full turn of DNA around a nucleosome, as a single turn of DNA is produced almost independent of where the
δ-electron hits the peripheral nucleosomal DNA (cf
Figure 7 and
Figure 9). Unfortunately, this type of severe dual DSB produced in a single event has not been seriously considered in the literature except possibly in [
23,
24,
25].
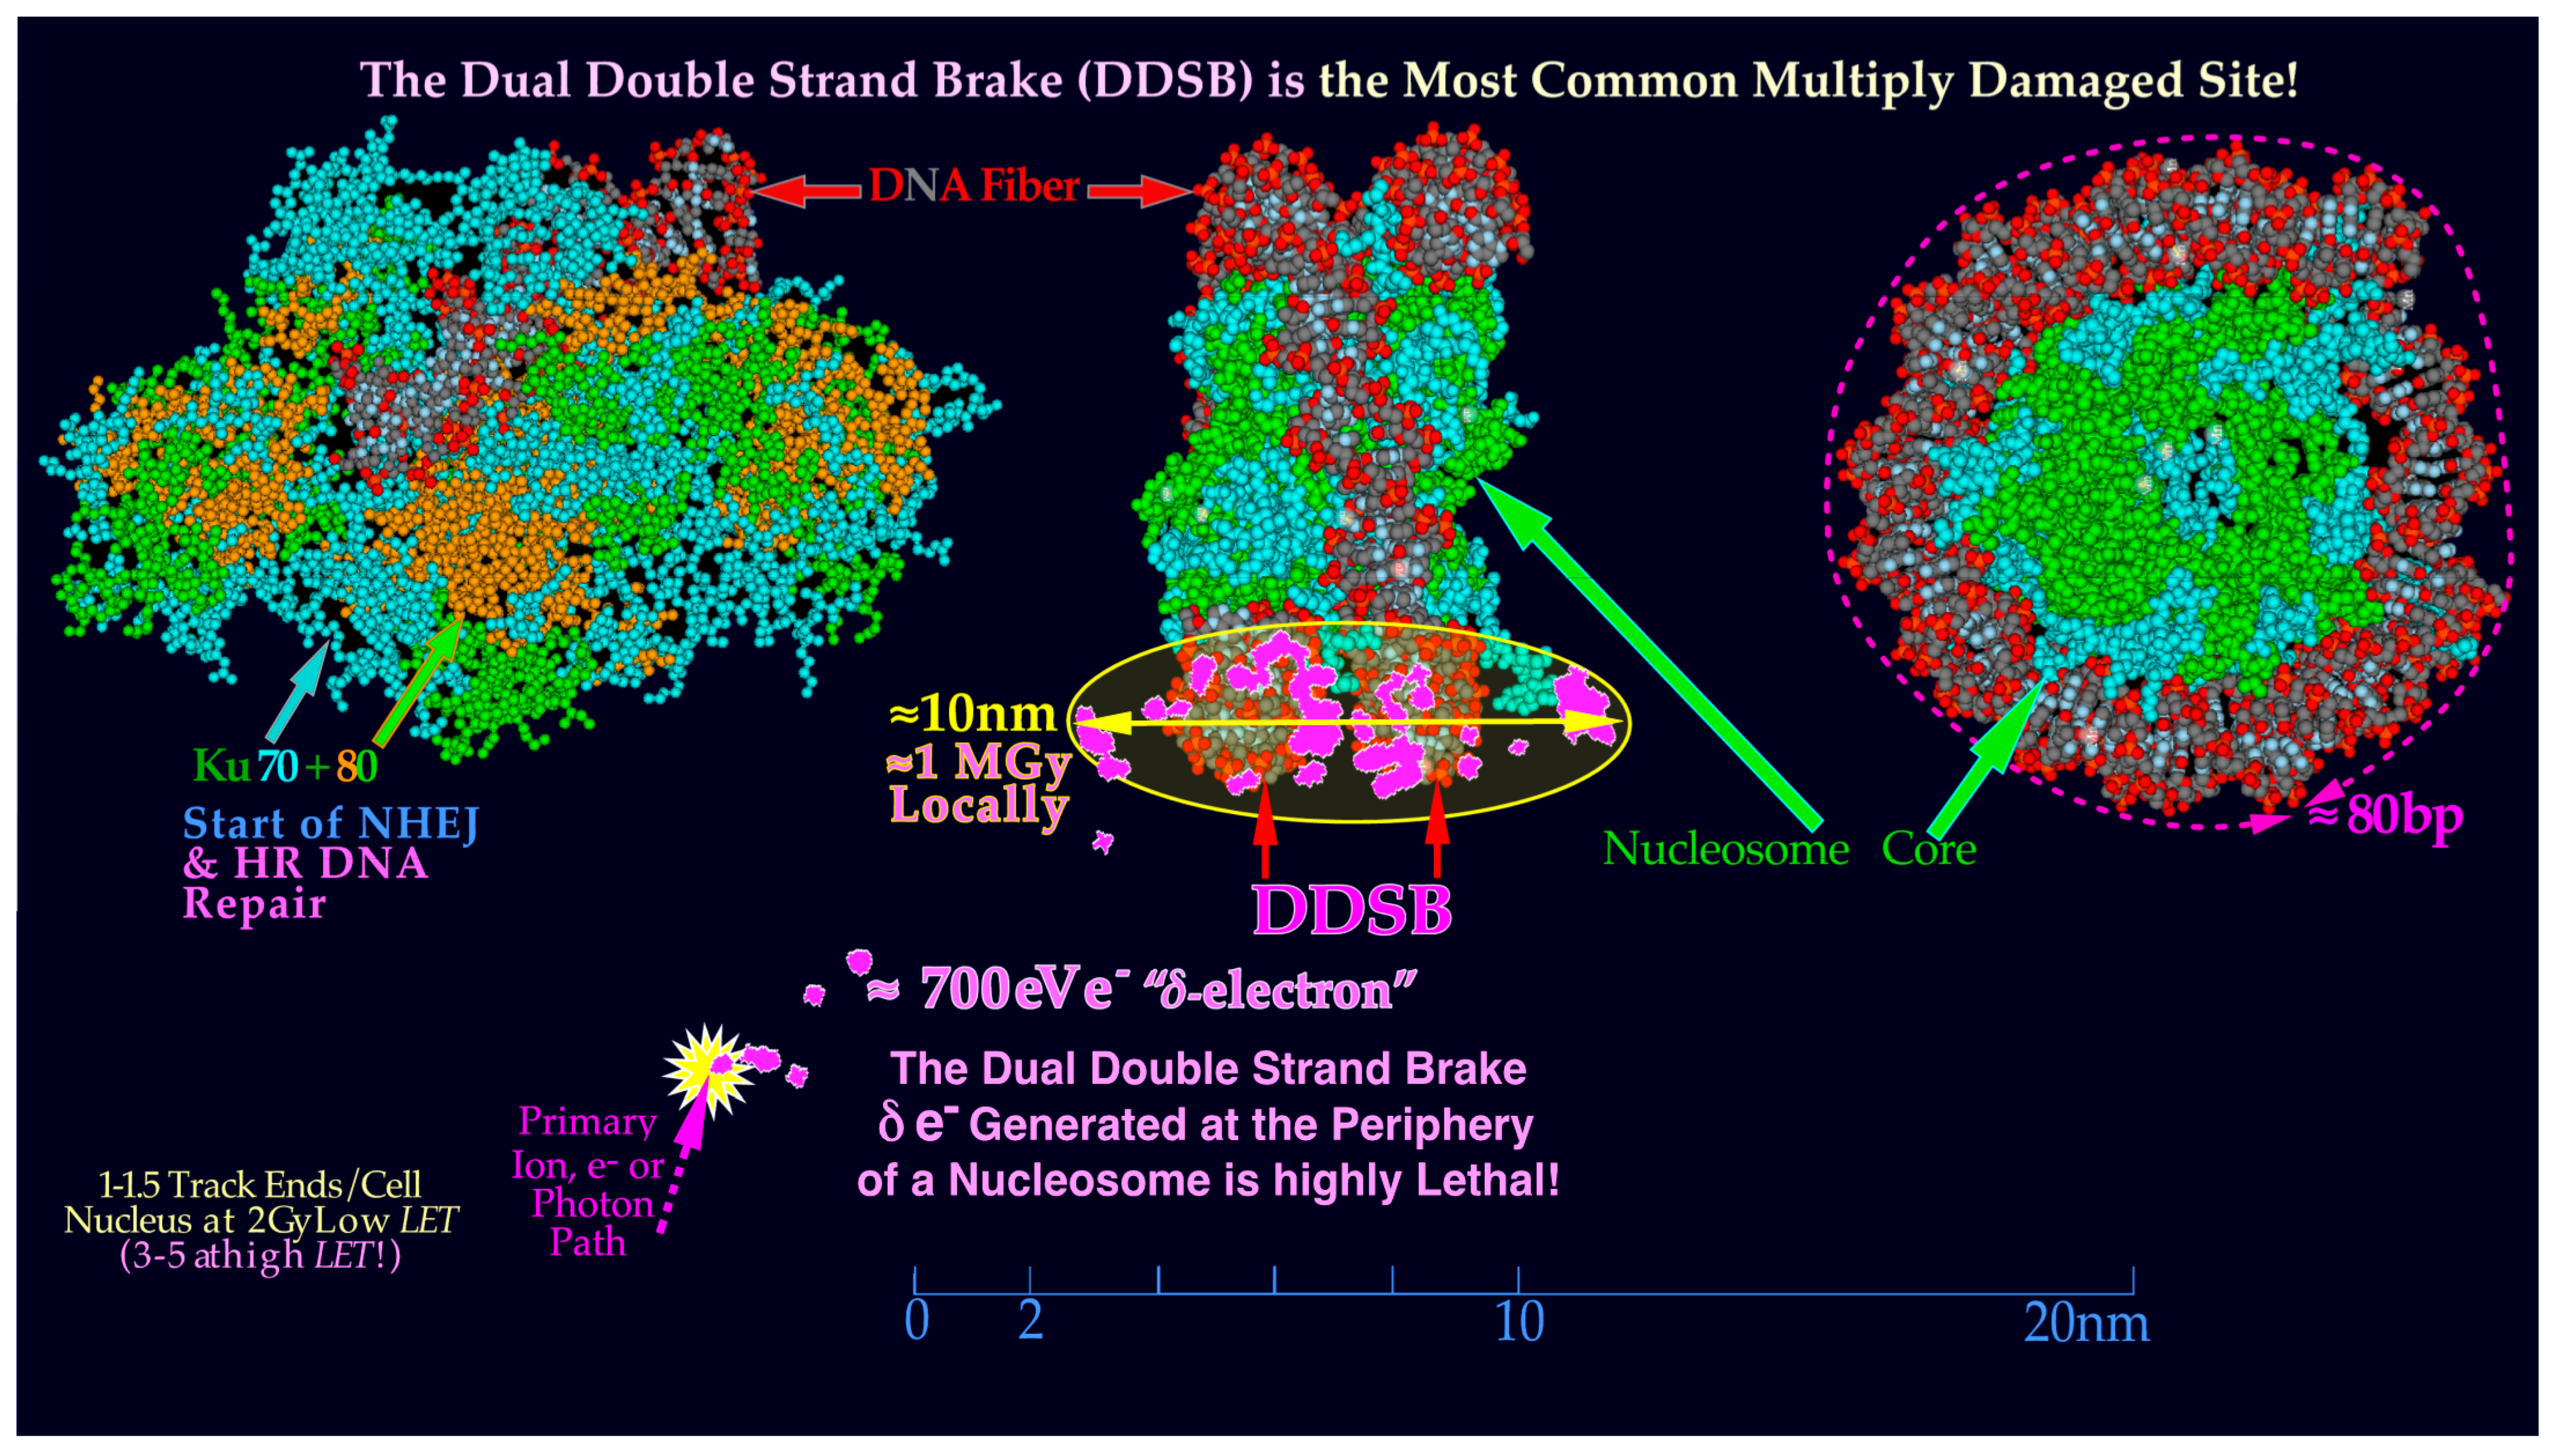
Most normal simple DSBs are effectively repaired by NHEJ, and the more complex DDSBs are already present in sufficient numbers at 2 Gy to cause a lethal event in ≈0.9% of cells at that dose level. Since we know that there are approximately 1–2 track ends in the cell nucleus at 2 Gy, if just half of them cause DDSBs, we can understand that this most likely caused the cell death, and thus their important therapeutic role follow even if they are few [
1]. For example, the otherwise very advanced theoretical study of dual radiation action [
26] did not consider the common single lethal event where a single
δ-electron could damage both the DNA strings on a nucleosome. They instead separated events that made a DSB in a single or a dual event leading to linear and quadratic dose terms, respectively, even if the dual events are very rare, except possibly at extremely high doses. The revised model also considered the interaction between sublesions at different distances from each other [
26]. In the present paper, we will briefly discuss DNA damage and repair processes and study the effects of DDSBs on the DNA repair machinery to find the optimal use of different radiation modalities to cure cancers with minimal side effects on normal tissues. A simplistic introduction to the new repairable homologous repairable (RHR) DNA damage and cell survival formulation [
1,
9] is also presented to stimulate its accessibility and usefulness for a wider range of scientists, e.g., allowing estimation of apoptosis from cell survival data (cf. [
27]: Figure 4). We will not discuss the large number of indirect events where chemical and oxygen radical reactions may damage DNA when induced in high numbers by high doses of low-ionization-density radiation and even high-intensity microwaves [
28]. However, it should be pointed out that the classical indirect effects of radiation, such as radiation-induced radicals with or without oxygen and bystander effects [
29,
30,
31], will still have a modifying effect on the irradiation and are truly taken into account by the RHR formulation. Generally, they are largely reduced as the ionization density and
LET are increased, such as when the oxygen enhancement ratio that tends to very low values at high
LETs. Interestingly, these effects are still well described by the RHR formulation as recently discussed in some detail [
1,
9,
17,
27]. For example, the very interesting compound APR246 at 5 μM was shown to reactivate TP53 mutant tumor cell lines by increasing LDA and HDA by 7 and 15%, respectively. Furthermore, this compound inhibits the enzymes thioredoxin reductase 1 and thioredoxin and decreases cellular glutathione levels and increases the apoptotic and senescence responses with a significant 27% increase in tumor cell death at 4 Gy at only approximately 4% general toxicity ([
27] cf also [
32]). However, the present focus is largely on the therapeutic effect of high-energy photons, electrons, and light ions in curative radiation therapy, even if the milder damage types play a role and for completeness are included in
Figure 2a,b. These reactions and, for example, bystander effects are also well accounted for by the new more general DNA-damage-based RHR formulation (cf Sections 5 and 6 and [
1,
9,
17,
27]).
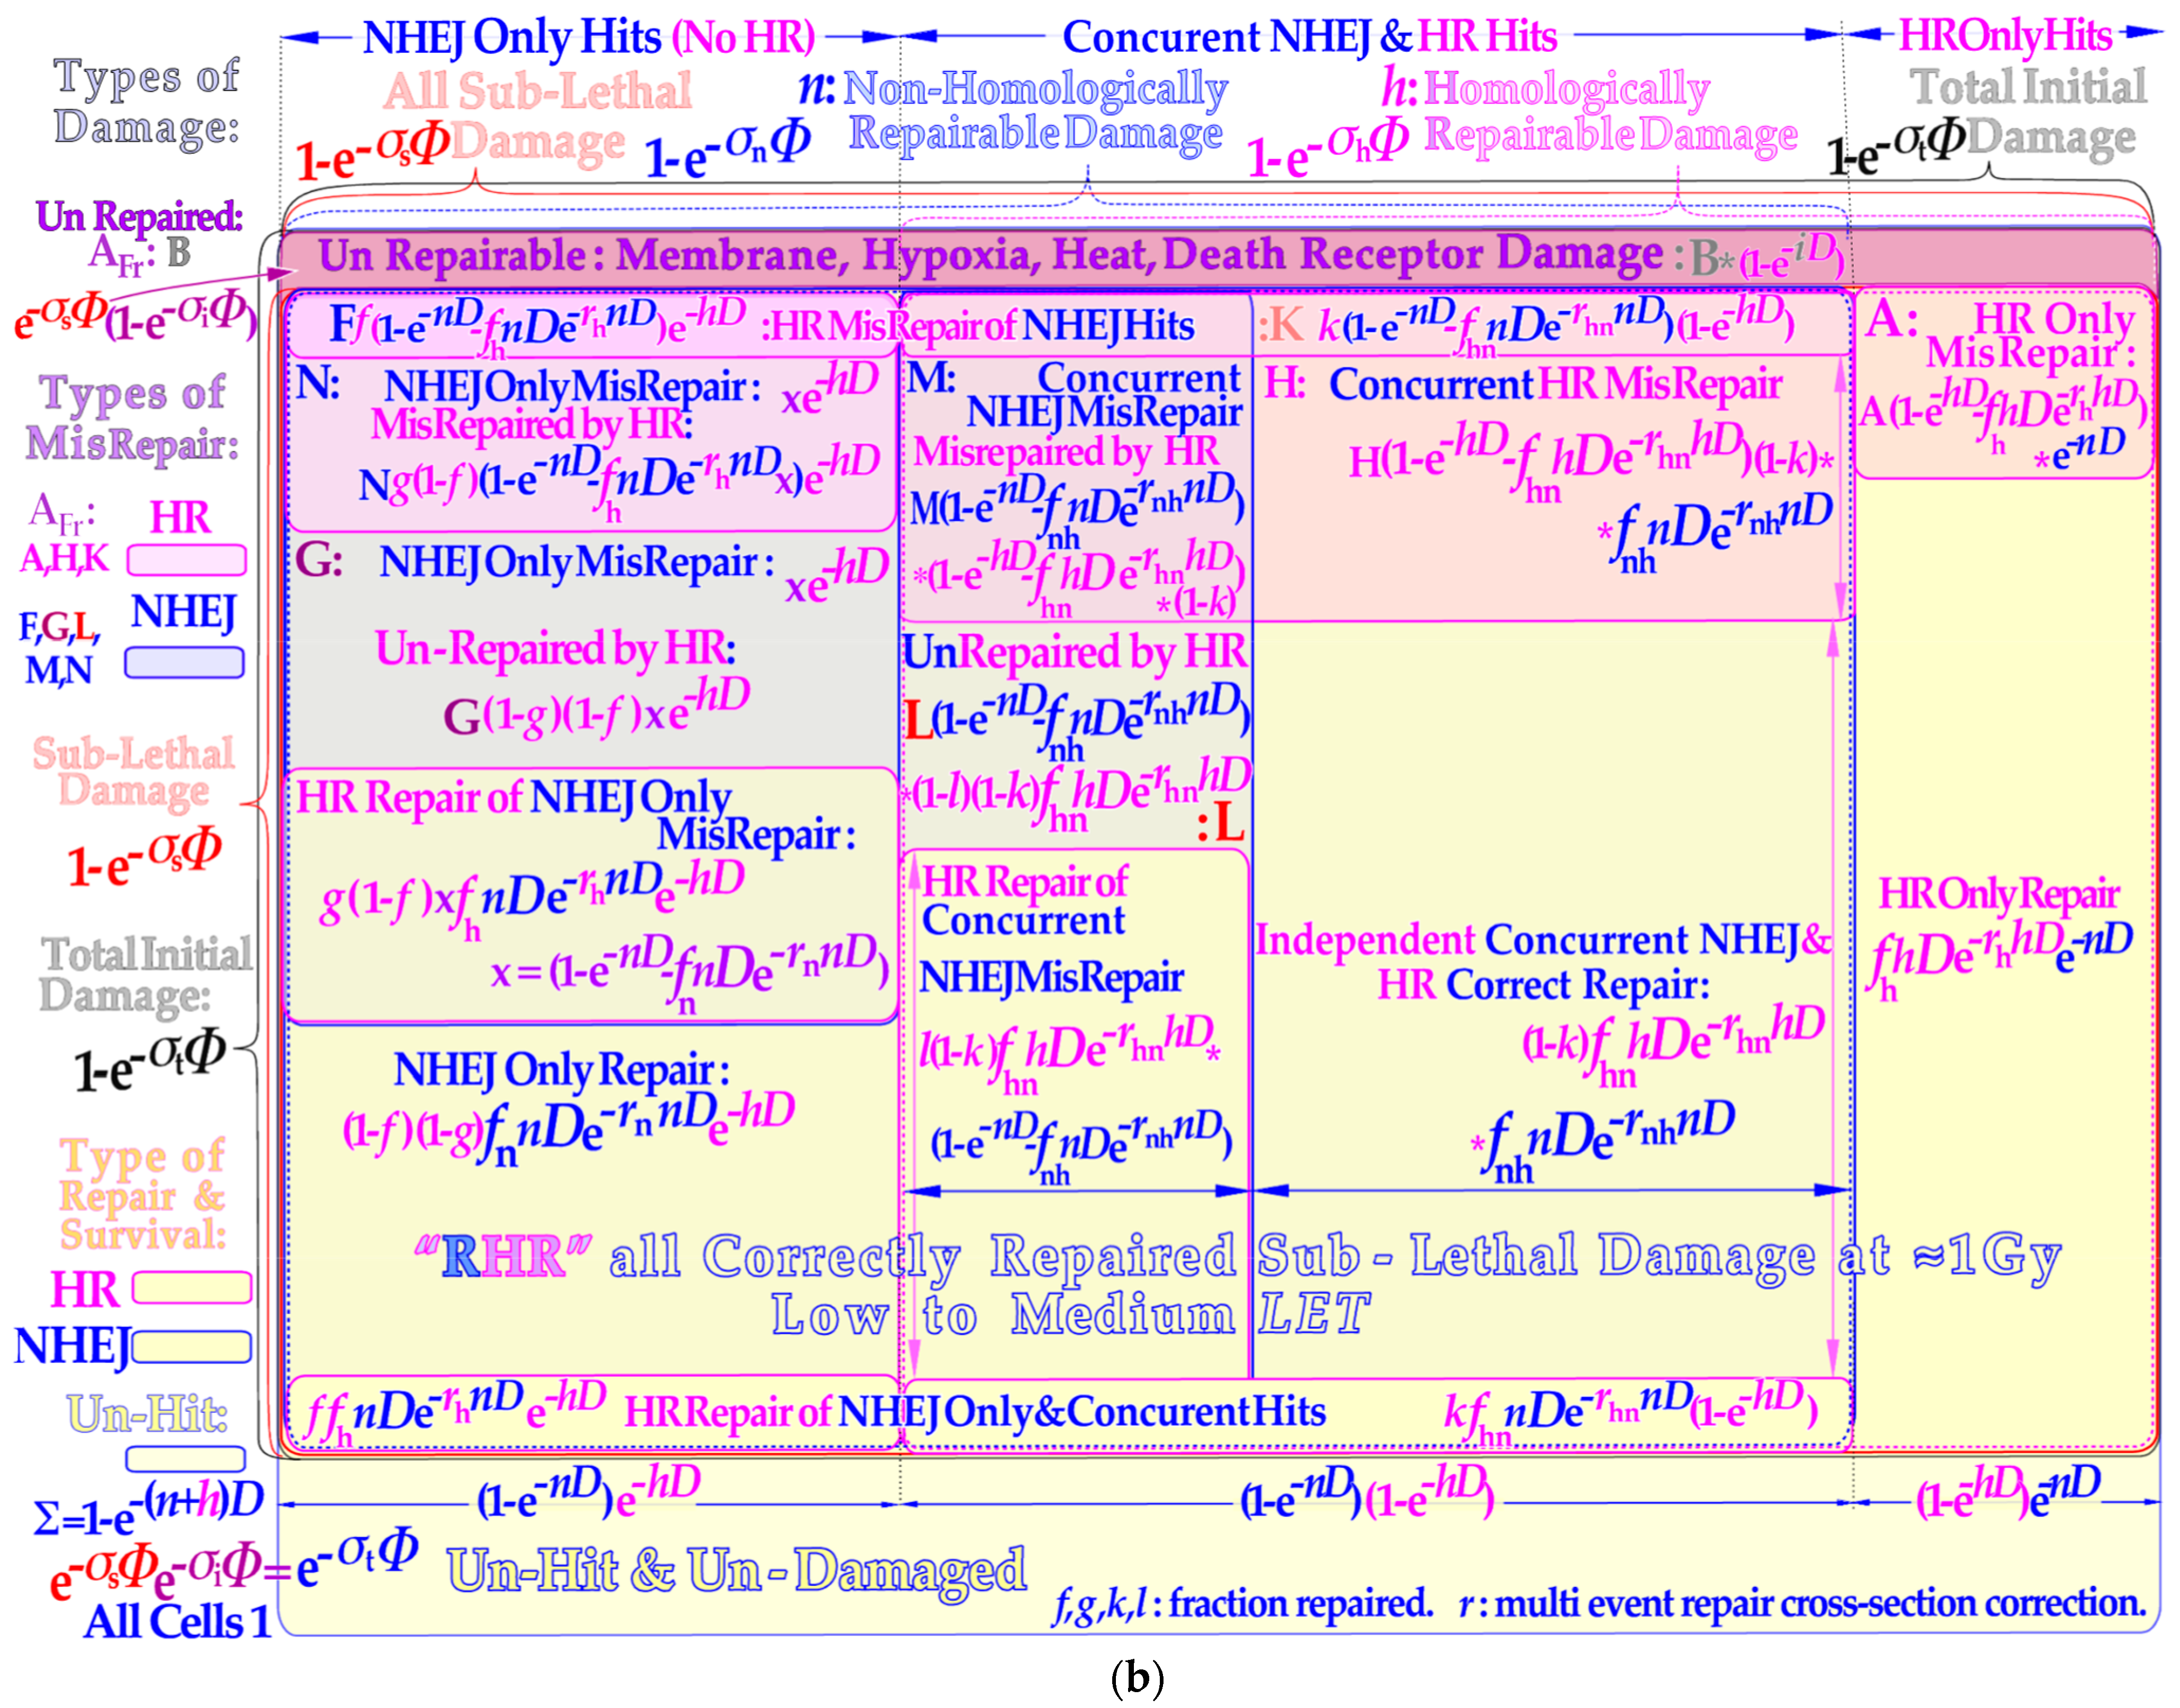
6. Repair of Sublethal Damage and Cell Survival
The repaired fraction with an increasing number ν of sublethal hits may be calculated using the Poisson statistics for all sublethal hit numbers
fν according to:
where the assumed repaired fraction of cells with ν sublethal hits is deoted
fν. Interestingly, we can break out the common single collision part to obtain:
where the power series can be approximated in many different ways [
1], probably most simply by a single exponential according to:
Here, the first two terms of the Equation (5) series are exactly reproduced, and only the third and higher orders are approximated (where
rs =
f2/2
f1). This is carried out by summarizing all the repair terms splitting
σs into its
n and
h components as the last step in Equation (6) and seen by the lower yellow regions of
Figure 2b and functionally described in the lower left inset of
Figure 3b and
Figure 4. The total survival is most accurately described by adding all eight yellow surviving cell areas in
Figure 2b to obtain the repairable homologous repairable (RHR) survival formulation (for more details, see [
9]: Equation (11)):
The repair of all NHEJ misrepairs and the dual HR and NHEJ repair terms can generally be used in a more simplified form to achieve a close to perfect survival curve shape agreement with the full Equation (7):
where the original
b and
c sublethal repair terms of the earlier RCR model as indicated in the lower left inset of
Figure 3b and
Figure 4 [
1,
9,
44,
45] and explained in more detail in the lower right corner of
Figure 4 appear in four new versions. They are used to more accurately describe non-homologous and homologous repair as well as homologous repair of non-homologous only and concurrent misrepair and independent non-homologous and homologous correct repair, as graphically illustrated in the lower yellow areas of
Figure 2b and lower right corner of
Figure 4.
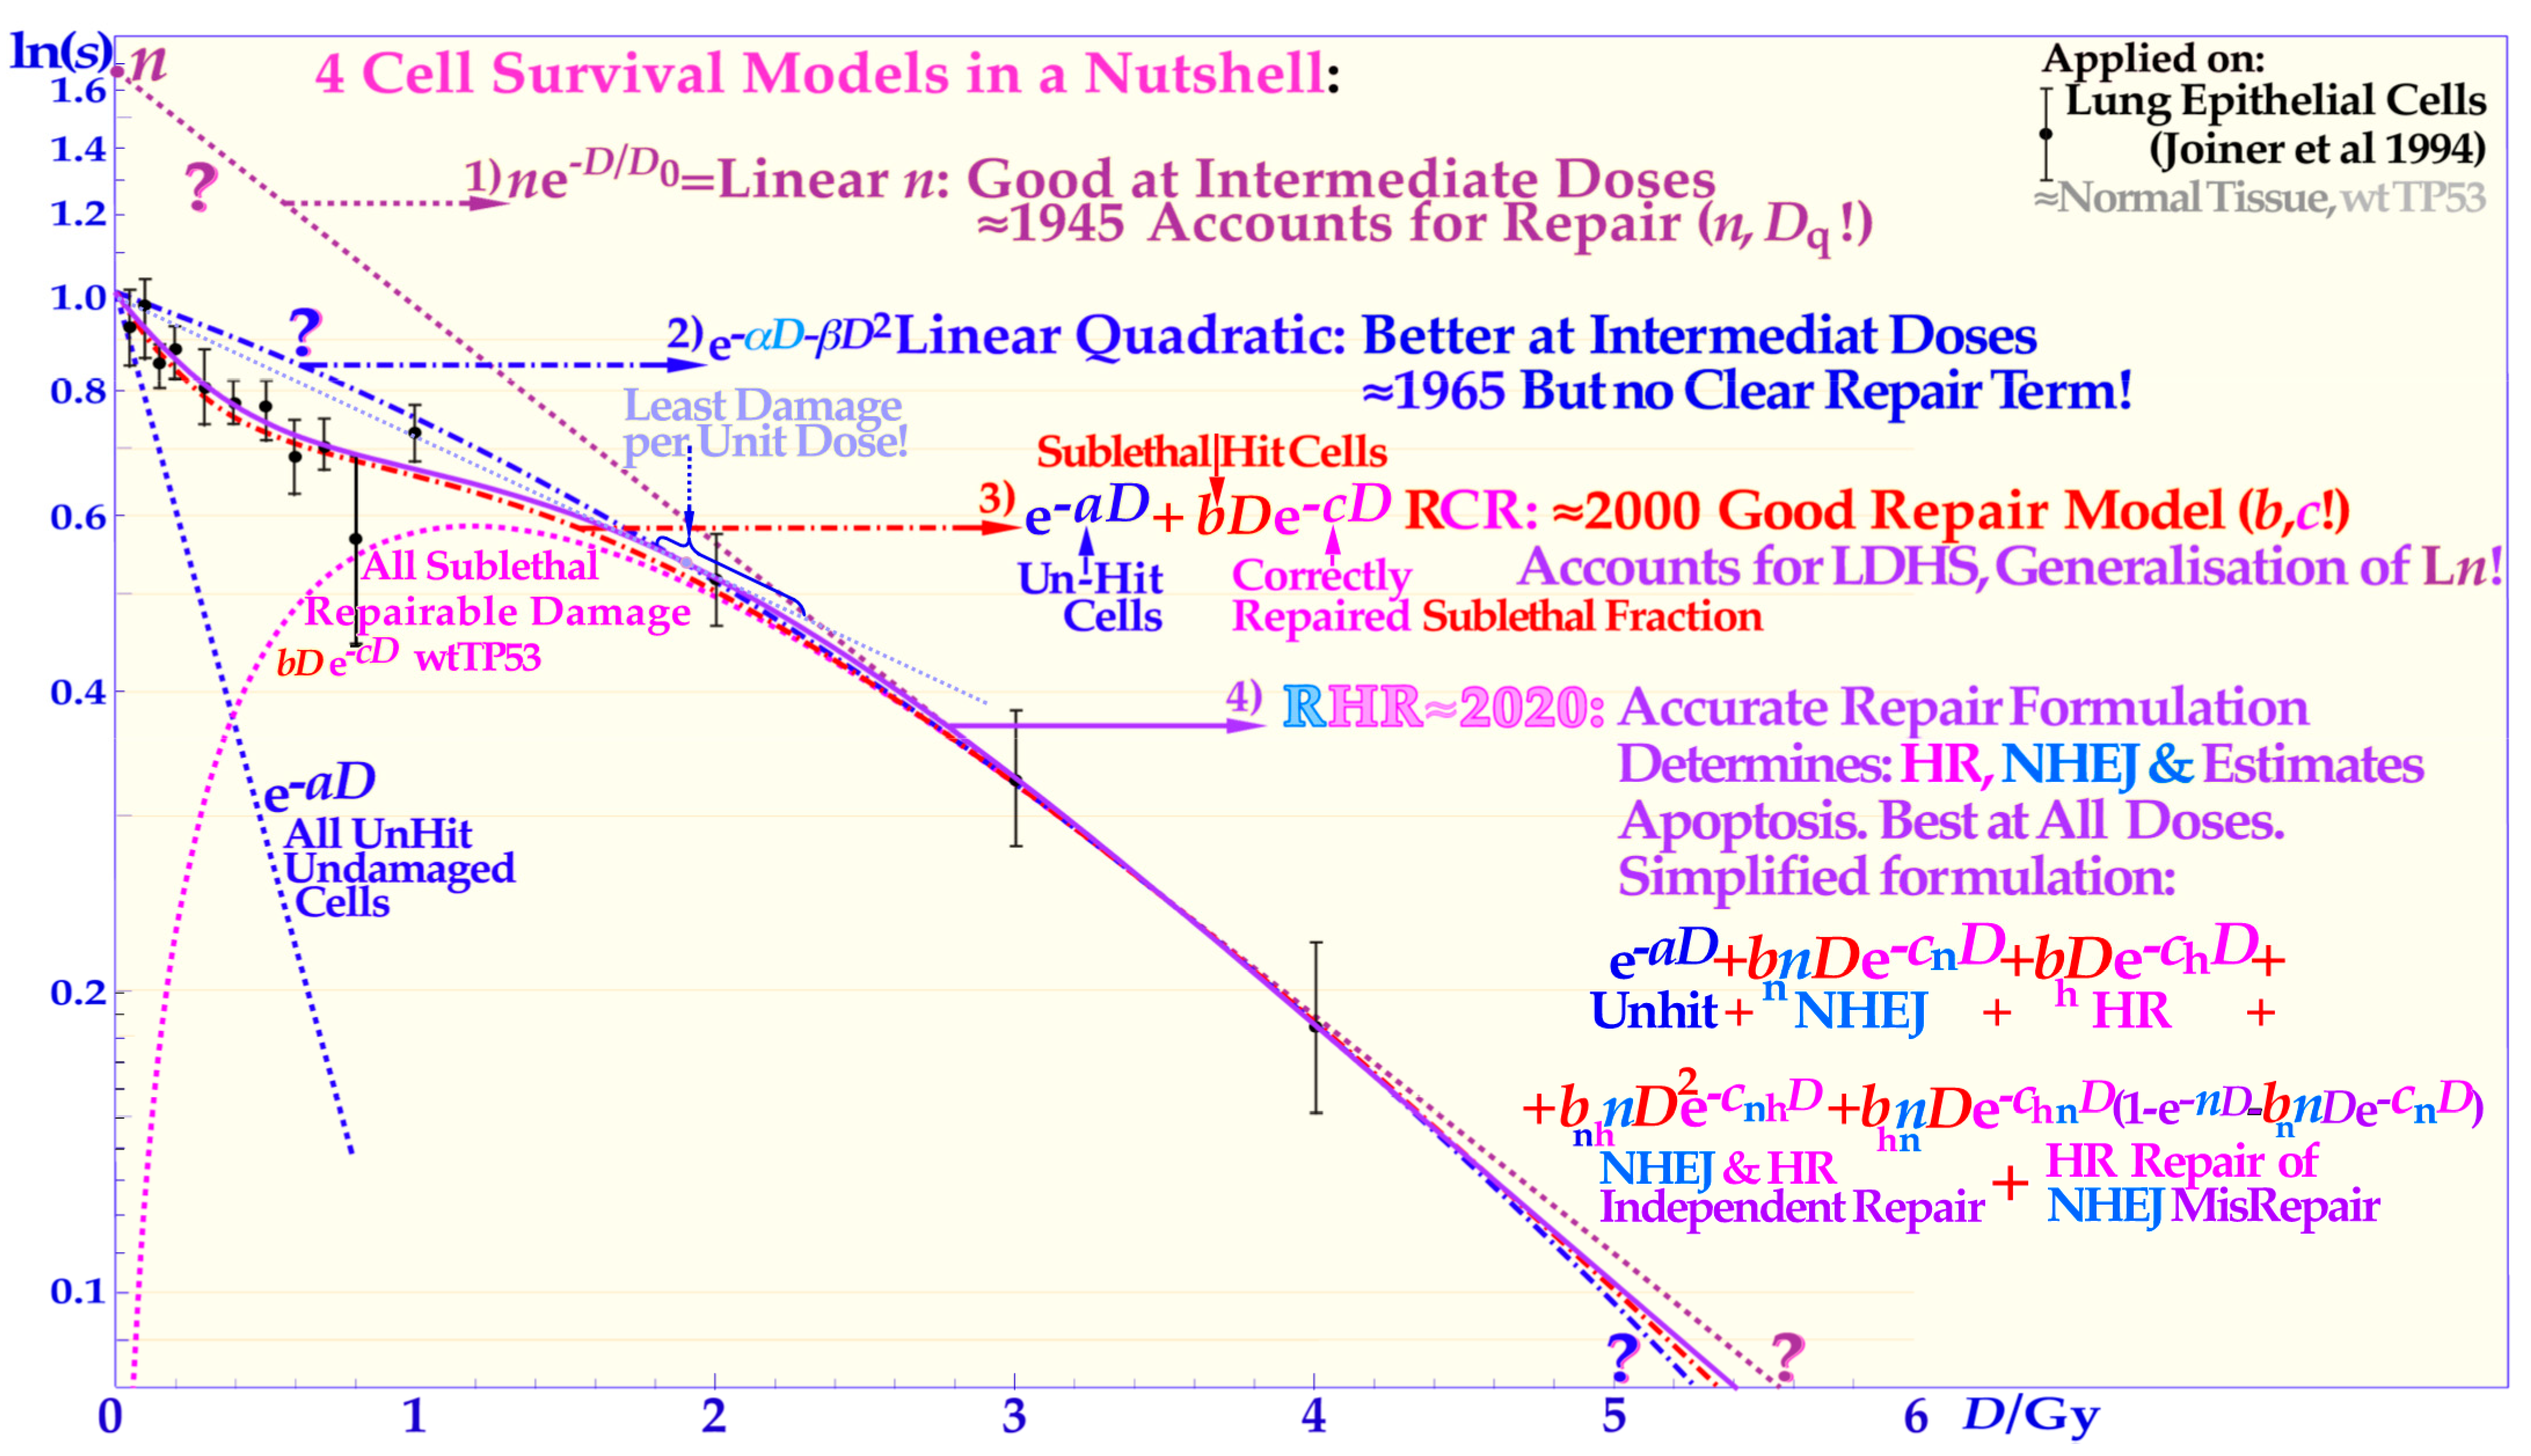
Figure 4.
The development of the description of the shape of the cell survival curve during the last ≈ hundred years from the linear exponential model with a back extrapolated effective initial cell number (
n, L
n) and today’s dominating linear quadratic formula (LQ) that does not even account separately for cellular repair as L
n does. The more recent repairable conditionally repairable model handles the cellular repair much better (cf
Supplementary Figure S3 for further details) and separates it from unhit survival, whereas the most recent repairable homologous repairable (RHR) formulation further accounts separately for non-homologous and homologous recombination repair, as shown in the lower right corner, and can estimate the apoptotic fraction and the individual repair processes, see
Supplementary Figures S1–S3 for further details and [
1,
9,
17,
27].
The classical linear quadratic model (which is often inconsistent with normal tissue survival curve shapes, see proof in [
1]) sometimes happens to give a rather good fit to commonly uncertain experimental tumor data, which generally lack LDHS due to p53 mutations or loss of ATM (cf [
9]: Figures 6, 7, 13 and 22, and [
27]). Equation (7) or (8) or, for simplicity, even just the RCR expression:
as seen in the lower left inset of
Figure 3b and
Supplementary Figure S3 should therefore be used to better describe most normal tissue cell survival curves that generally express LDHS (cf [
9,
44,
45]). It is very valuable to have an accurate survival expression (Equation (7)) that can also be used to estimate apoptosis, describe survival well with knocked-out repair genes or tumors with mutated genes [
1,
9], and may be used to estimate the potential therapeutic benefit, e.g., by repair inhibitors for HR, NHEJ, and PARP, just to mention a few.
8. Repair Problems with Dual Nucleosomal DSBs
Independent of the exact location of the
δ-electron hit at the periphery of the nucleosome, it will generate a full turn DNA fragment when released, as seen in
Figure 7 and
Figure 8 [
22]. The DNA fiber is wound with almost two turns around its histone octamer core, so it may thus break twice, as illustrated in
Figure 3,
Figure 7,
Figure 8,
Figure 9 and
Figure 10, producing four free DNA ends locally. Such damage is difficult to repair, as it may require the dismantling of all the histones in the nucleosome core to allow the Ku70 and Ku80 molecules to bind to each of the four free often-blunt DNA ends.
Figure 7.
A likely DDSB event by a
δ-electron is shown delivering approximately 0.5–1 MGy in a several hundred nm
3 local volume at the periphery of a nucleosome. To start NHEJ repair, four each of the Ku70 and Ku80 molecules have to bind to the four free DNA ends to allow the DNApk-Lig4 dimer complex to ligate. Compare also with the
δ-ray slowing down spectral density as seen in
Figure 1 for protons and lithium ions (cf
Figure 9 and
Figure 10 [
16,
22]).
This might be so because the Kus together are almost as large as the nucleosome core as seen in
Figure 7. The result may be a free nucleosomal DNA turn of ≈35 nm as seen in the lower right corner of
Figure 3b,
Figure 7 and
Figure 9, ending up as micronuclei or erroneously inserted in the genome. Fortunately, the Ku-binding process is very fast, as the subsequent interconnection of the Ku-capped DNA ends by the DNApkcs dimer and the recruitment of p53 are only a matter of a few seconds [
5,
41,
42,
43]. This high speed is truly needed to ensure that the correct DNA ends are well connected, especially at high local doses and
LETs as seen in the right half of
Figure 9. However, in the dual DSB case this may not help much as the breaks are only a few nm apart and are produced nearly simultaneously (probably within nano- or even picoseconds). It is therefore essential that the DNA strands initially stay as well connected to the nucleosome core as possible so breaks at B and C or B and D are not erroneously connected as seen in
Figure 9 and
Figure 10. As seen to the right in
Figure 9, each half of the nucleosome with its DSB can bind to its own DNApk-Ku heterodimer complex to later form a whole DNApk-Lig4 nucleosomal tetramer complex as shown to the left in
Figure 10 (cf also true nm resolution DNA damage images in
Figure 10,
Figure 11 and
Figure 12 and not least
Figure 13).
The question is now: would it be possible to dismantle the nucleosomes altogether and still keep the right order of the DNA strands in the repair process? This would most likely be necessary to complete the repair, since it would be impossible to bring A and B together on the nucleosome core at least with the Kus in place. Furthermore, it would probably not be easy to get the nucleosome core out of its tetramer cage as seen in
Figure 10, as the A–D DNA strand will be stretched and keep the two DNApk-Lig4 dimers rather tightly together especially with a diagonal nucleosome hit (
Figure 8), which may therefore be most lethal.
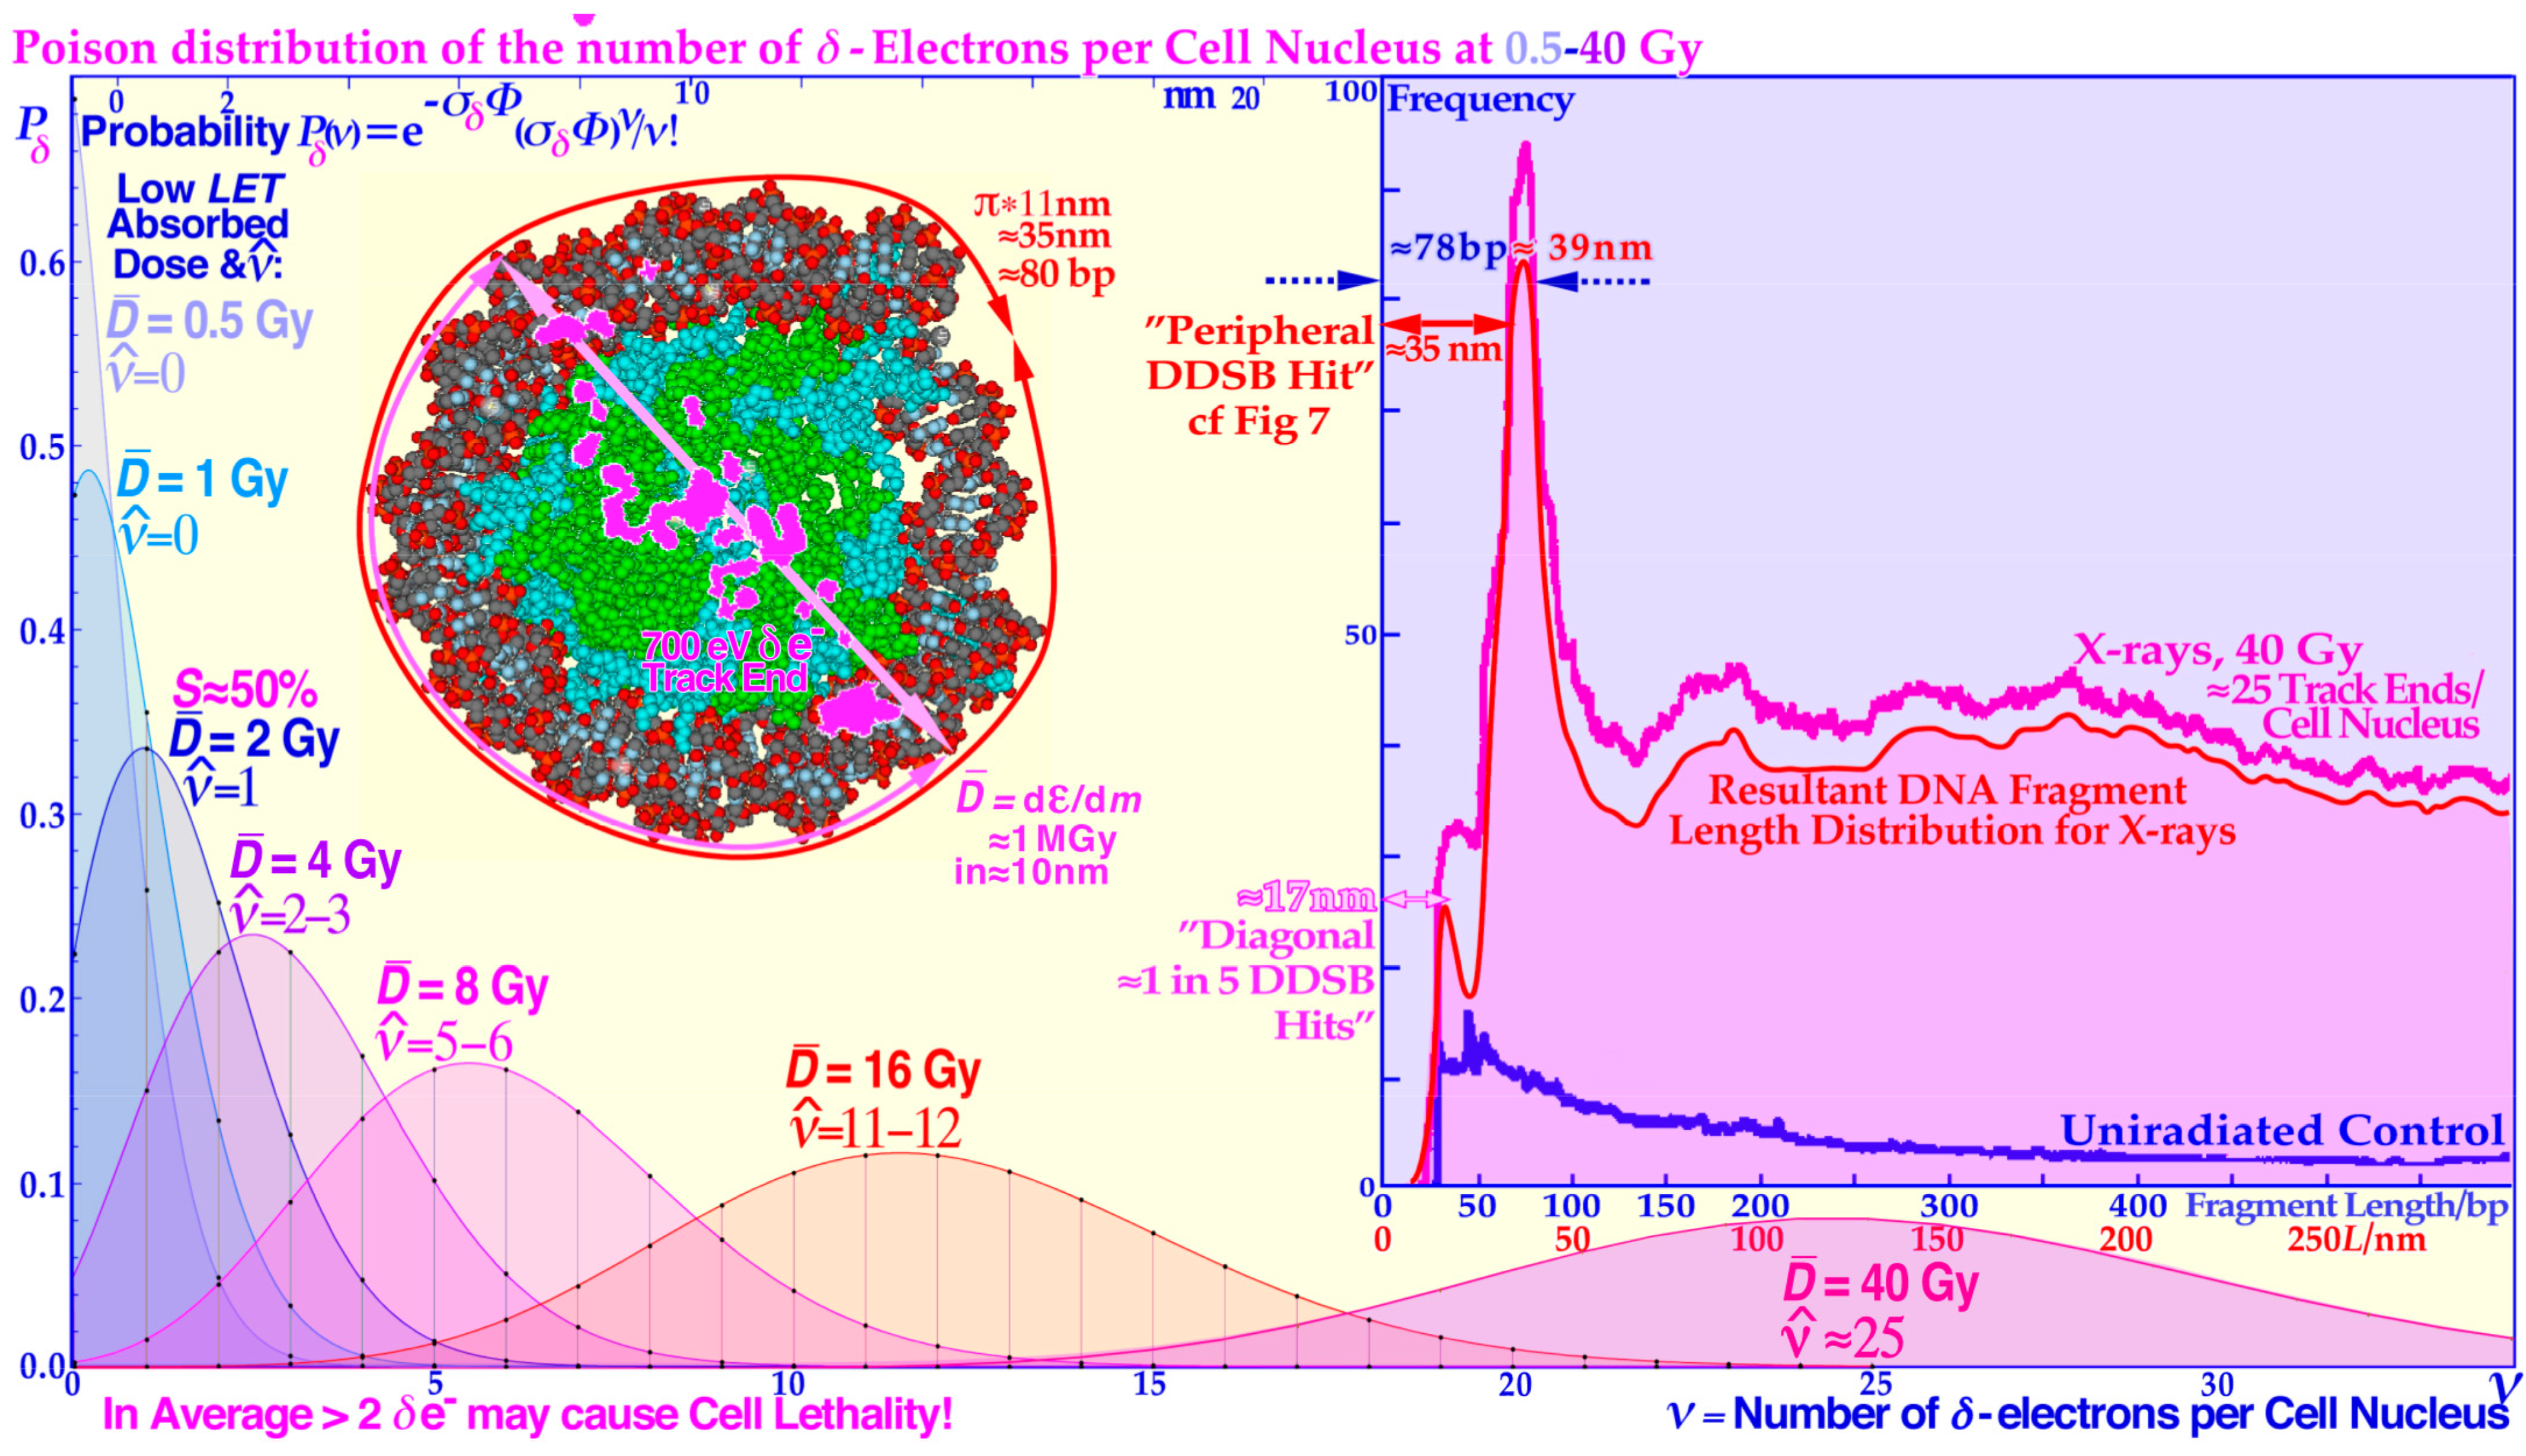
Figure 8.
The Poisson distribution of the number of
δ-electrons per cell nucleus at doses of 0.5–40 Gy of low
LET. A likely DDSB event by a
δ-electron is also shown to deliver approximately 1 MGy in a local volume of a few hundred nm
3 at the periphery (cf.
Figure 7) or as here diagonally at the side of a nucleosome resulting in the two shortest fragmentation peaks in the inset fragment spectrum. The ≈180, ≈300, and ≈400 base pair bumps are mainly due to the more complex nucleosomal tetramer structure in
Figure 6 in the crossing region between dinucleosomes and the middle region between the two nucleosomes of a dinucleosome causing less sharp peaks since the fragment length depends more on the exact location of the
δ-electron hit site. Modified from [
22].
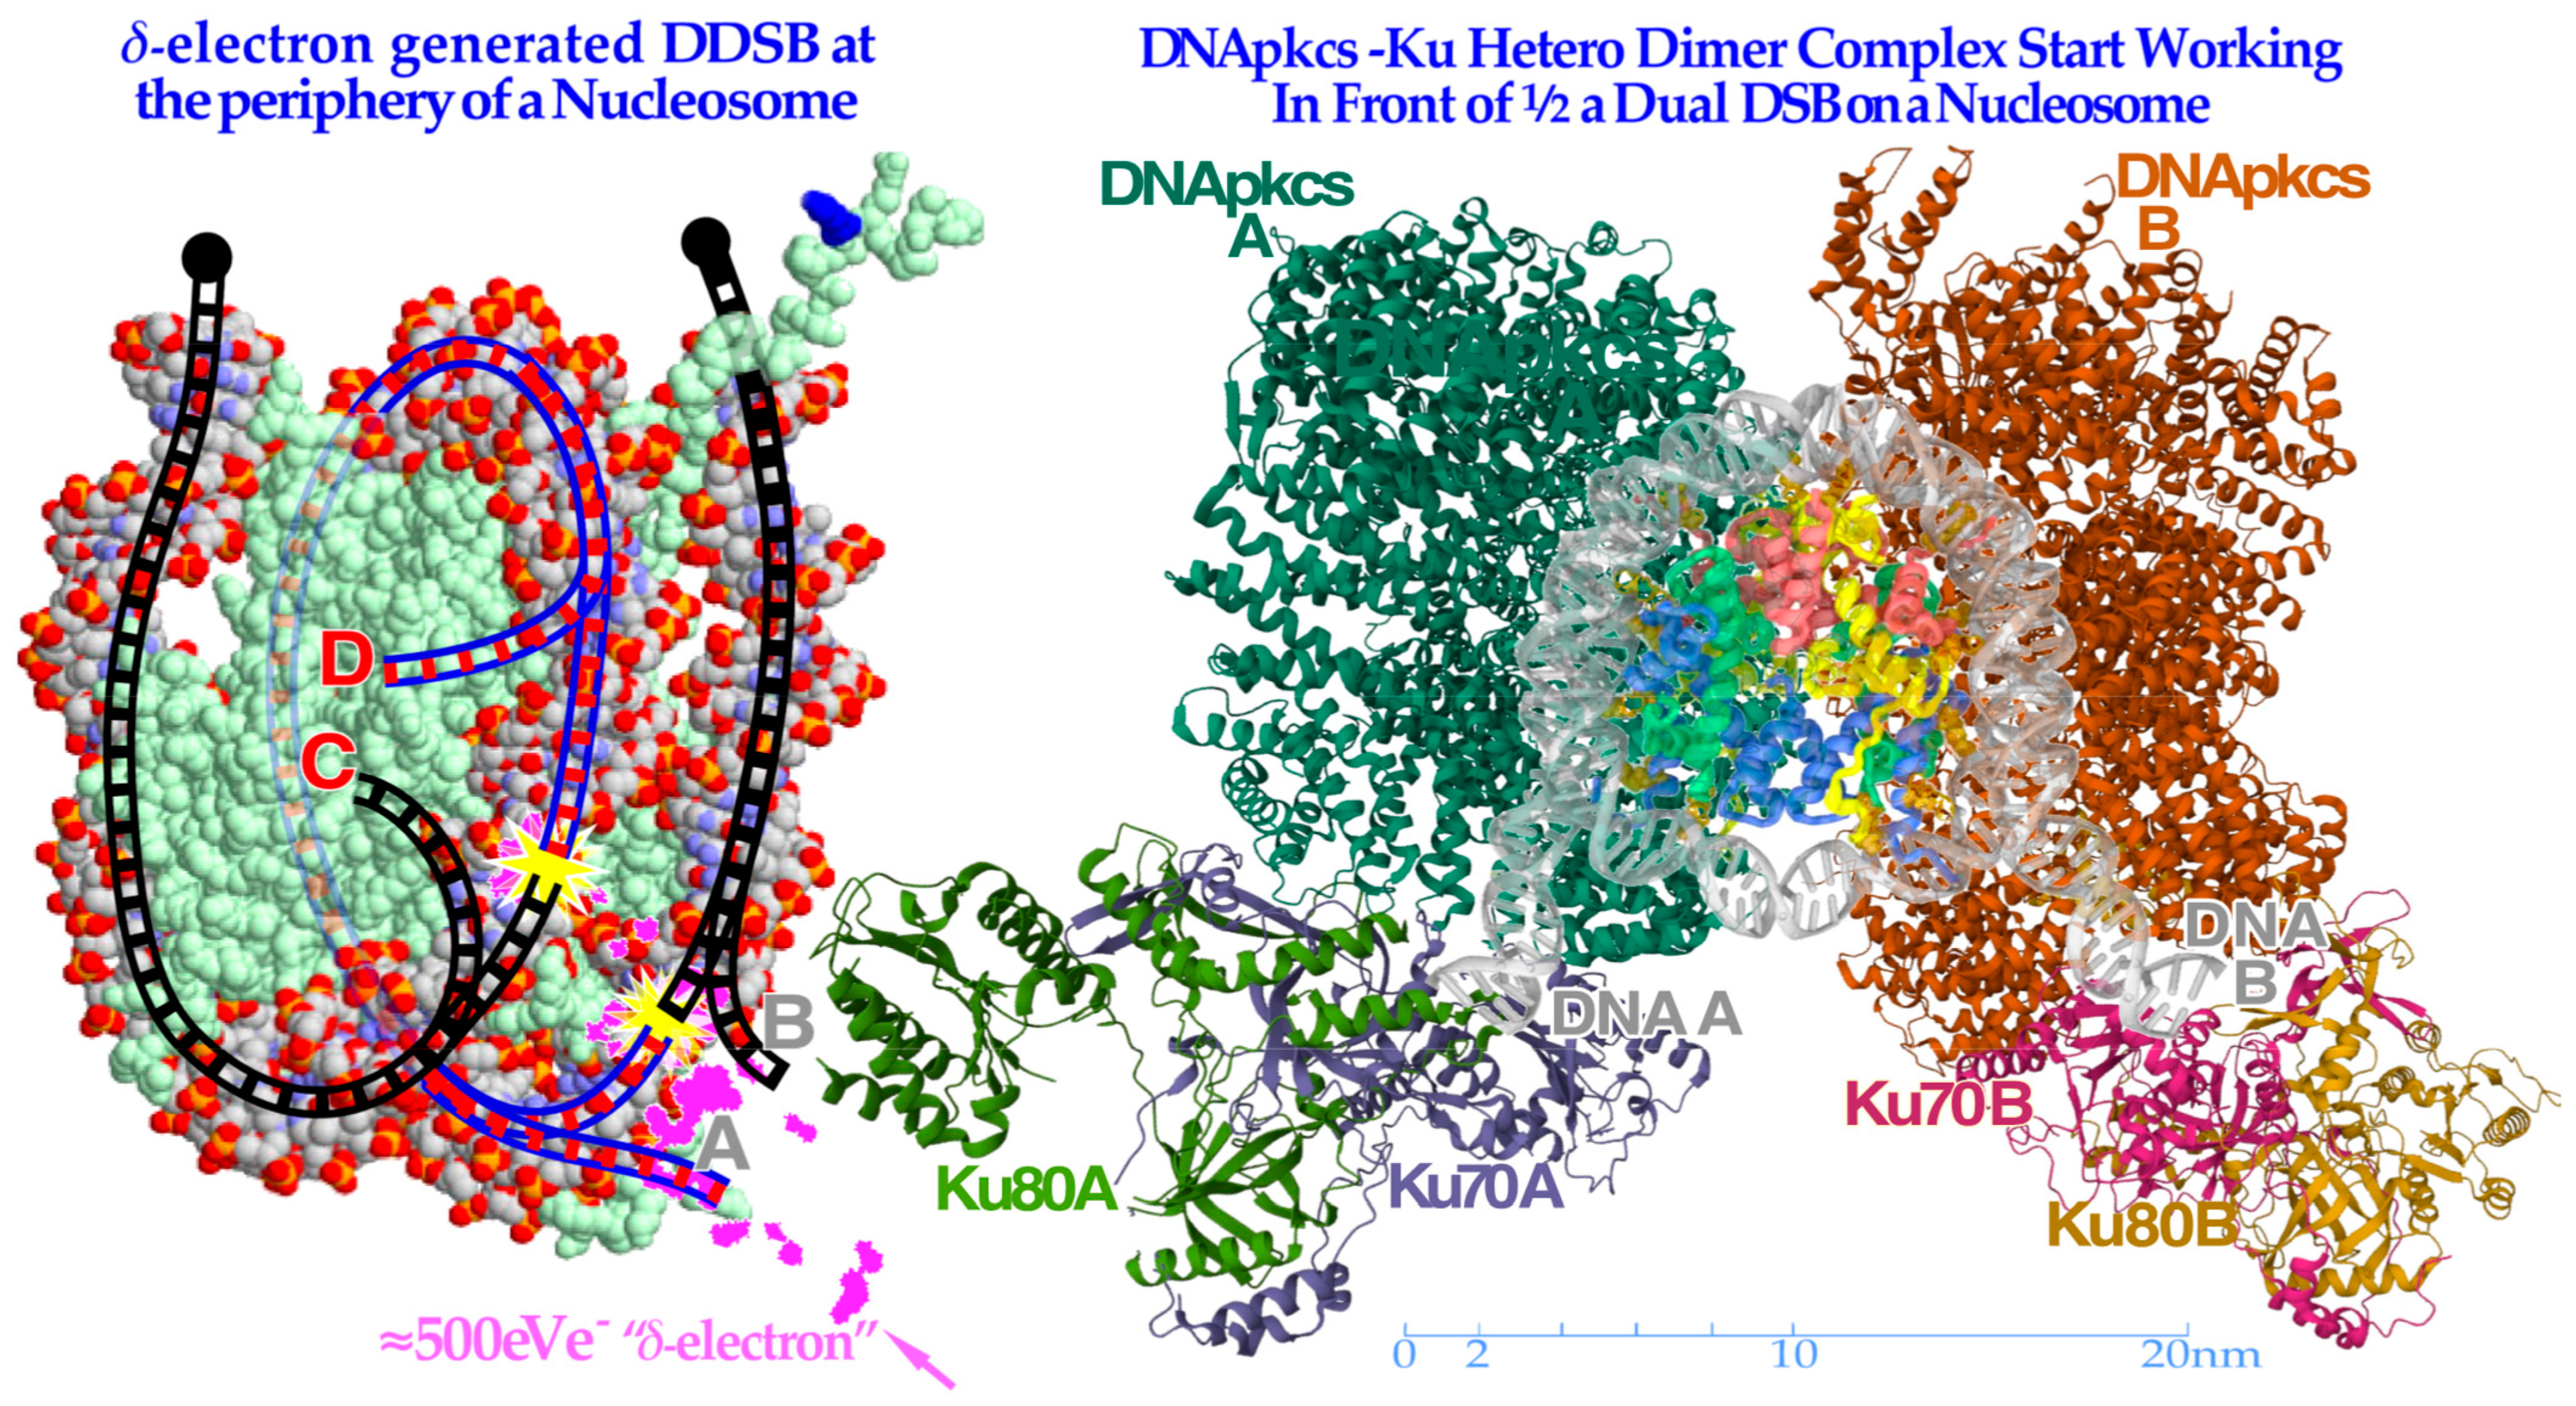
Figure 9.
To the left, a
δ-electron track end (pink) is producing a dual DSB on the periphery of a nucleosome. Interestingly, the A and D breaks are connected by a ≈35 nm or ≈78 base pair DNA strand (blue, cf
Figure 8) whereas the B and C breaks continue to the surrounding DNA fiber (black dots). To the right, the
partially translucent DNApk-Ku dimer complex is in place after a few seconds (modified from [
49] 7NFC) working in front of one DSB of the DDSB at the periphery of a partially opened and visible nucleosome and associated damaged DNA ends A and B, trying to repair them back together by later recruiting the remaining parts of the DNApk-Lig4 dimer–tetramer complex as shown in
Figure 10.
In addition, it is not uncommon that the nucleosome core itself is damaged in the initial damage process. However, a piecewise dismantling of the histone octamer core particle could take place. This may also be a case where the MRN dimer complex takes over after eliminating at least one of the DNApk-Ku heterodimers. This may introduce more flexibility in the motion of the DNA ends due to the Rad50 coiled coils of the homologous recombination MRN dimer complex (HR [
4,
9,
50]). HR promotes high-fidelity repair, particularly if the cell is in the S or G2 phase of the cell cycle. This will make use of the ≈100 nm coiled coil of the Rad50 of the MRN dimer complex to more flexibly move the DNA ends during the repair process and find suitable sister chromatids [
1,
4,
9,
41,
42]. Particularly in ion beam therapy it will be more common that the Ku heterodimers are eventually replaced by the more flexible MRN dimer complexes that can move more freely along the DNA strands [
4]. It was recently shown that HR is the dominant repair pathway for high-
LET ions ([
9]: Figure 8, [
50,
51]). Interestingly, the new DNA damage cross-section and DNA-repair- based cell survival formulation, briefly described above, is actually capable of describing the DDSB repair process since the relevant interactions between NHEJ and HR repair are taken into account, as shown in the lower part of
Figure 2b.
DDSB damage is a local high-dose and -
LET phenomenon and as such is mainly located in the middle of the lower cell survival and misrepair portion of
Figure 2b, and often both NHEJ and HR may be involved as just described [
1,
9]. Both the independent NHEJ and HR direct repair will contribute to survival as will HR repair of NHEJ only and concurrent misrepair and basically NHEJ damage when HR repair is already active nearby (lowest repair layer in
Figure 2b). This means that the two lowest rows above the unhit survival layer may contain DDSB survival components! In addition, a fraction of HR only repair should also be included. The misrepair of these DDSBs is given in the associated shaded areas above the yellow survival areas. Unfortunately, DDSBs do not have their own exact mathematical expressions in Equation (7) but their specific fractions of the repair and misrepair terms can be determined from experimental data either for survival or misrepair or both. Interestingly, this can be achieved by exactly the same method as used for determining the apoptotic fraction that was quite accurately quantified in paper ([
9]: Figures 5, 7 and 9–12) both for low and high
LET radiations!
9. DSB and Dual Nucleosomal DSB Imaging
Some of the main structures of a carbon ion track through eu- and heterochromatic DNA by transmission electron microscopy (TEM) using 6 and 10 nm nanoparticles are shown in
Figure 11 (for details on irradiation and labeling, see [
52,
53]). Interestingly, the new high-resolution electron microscopy visualization of the DNA ends using 6 and 10 nm gold nanoparticles bound to pKu70 and 53BP1 [
54] indicates that the whole nucleosome may not need to be totally dismantled and that the DNA seams are unwound just enough to allow sufficient Ku binding. This is seen in
Figure 11,
Figure 12 and
Figure 13 where four key types of nanoparticle geometrical DDSB structures have been identified in carbon-ion-irradiated cellular DNA, termed DDSB0–3, in addition to the normal plain DSBs. The pKu70-80 gold nanoparticles are quite large (≈10 nm), as translucently indicated at the B and C Ku80 DNA strand ends on the left side of
Figure 10. They may even often disturb the direct recruitment of normal DNApkcs dimers to bind the Ku heterodimers together, except possibly in
Figure 13 below where DNApkcs are also separately labeled.
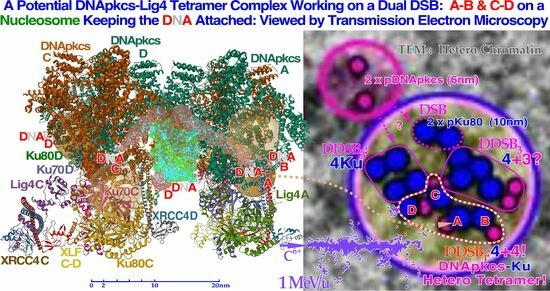
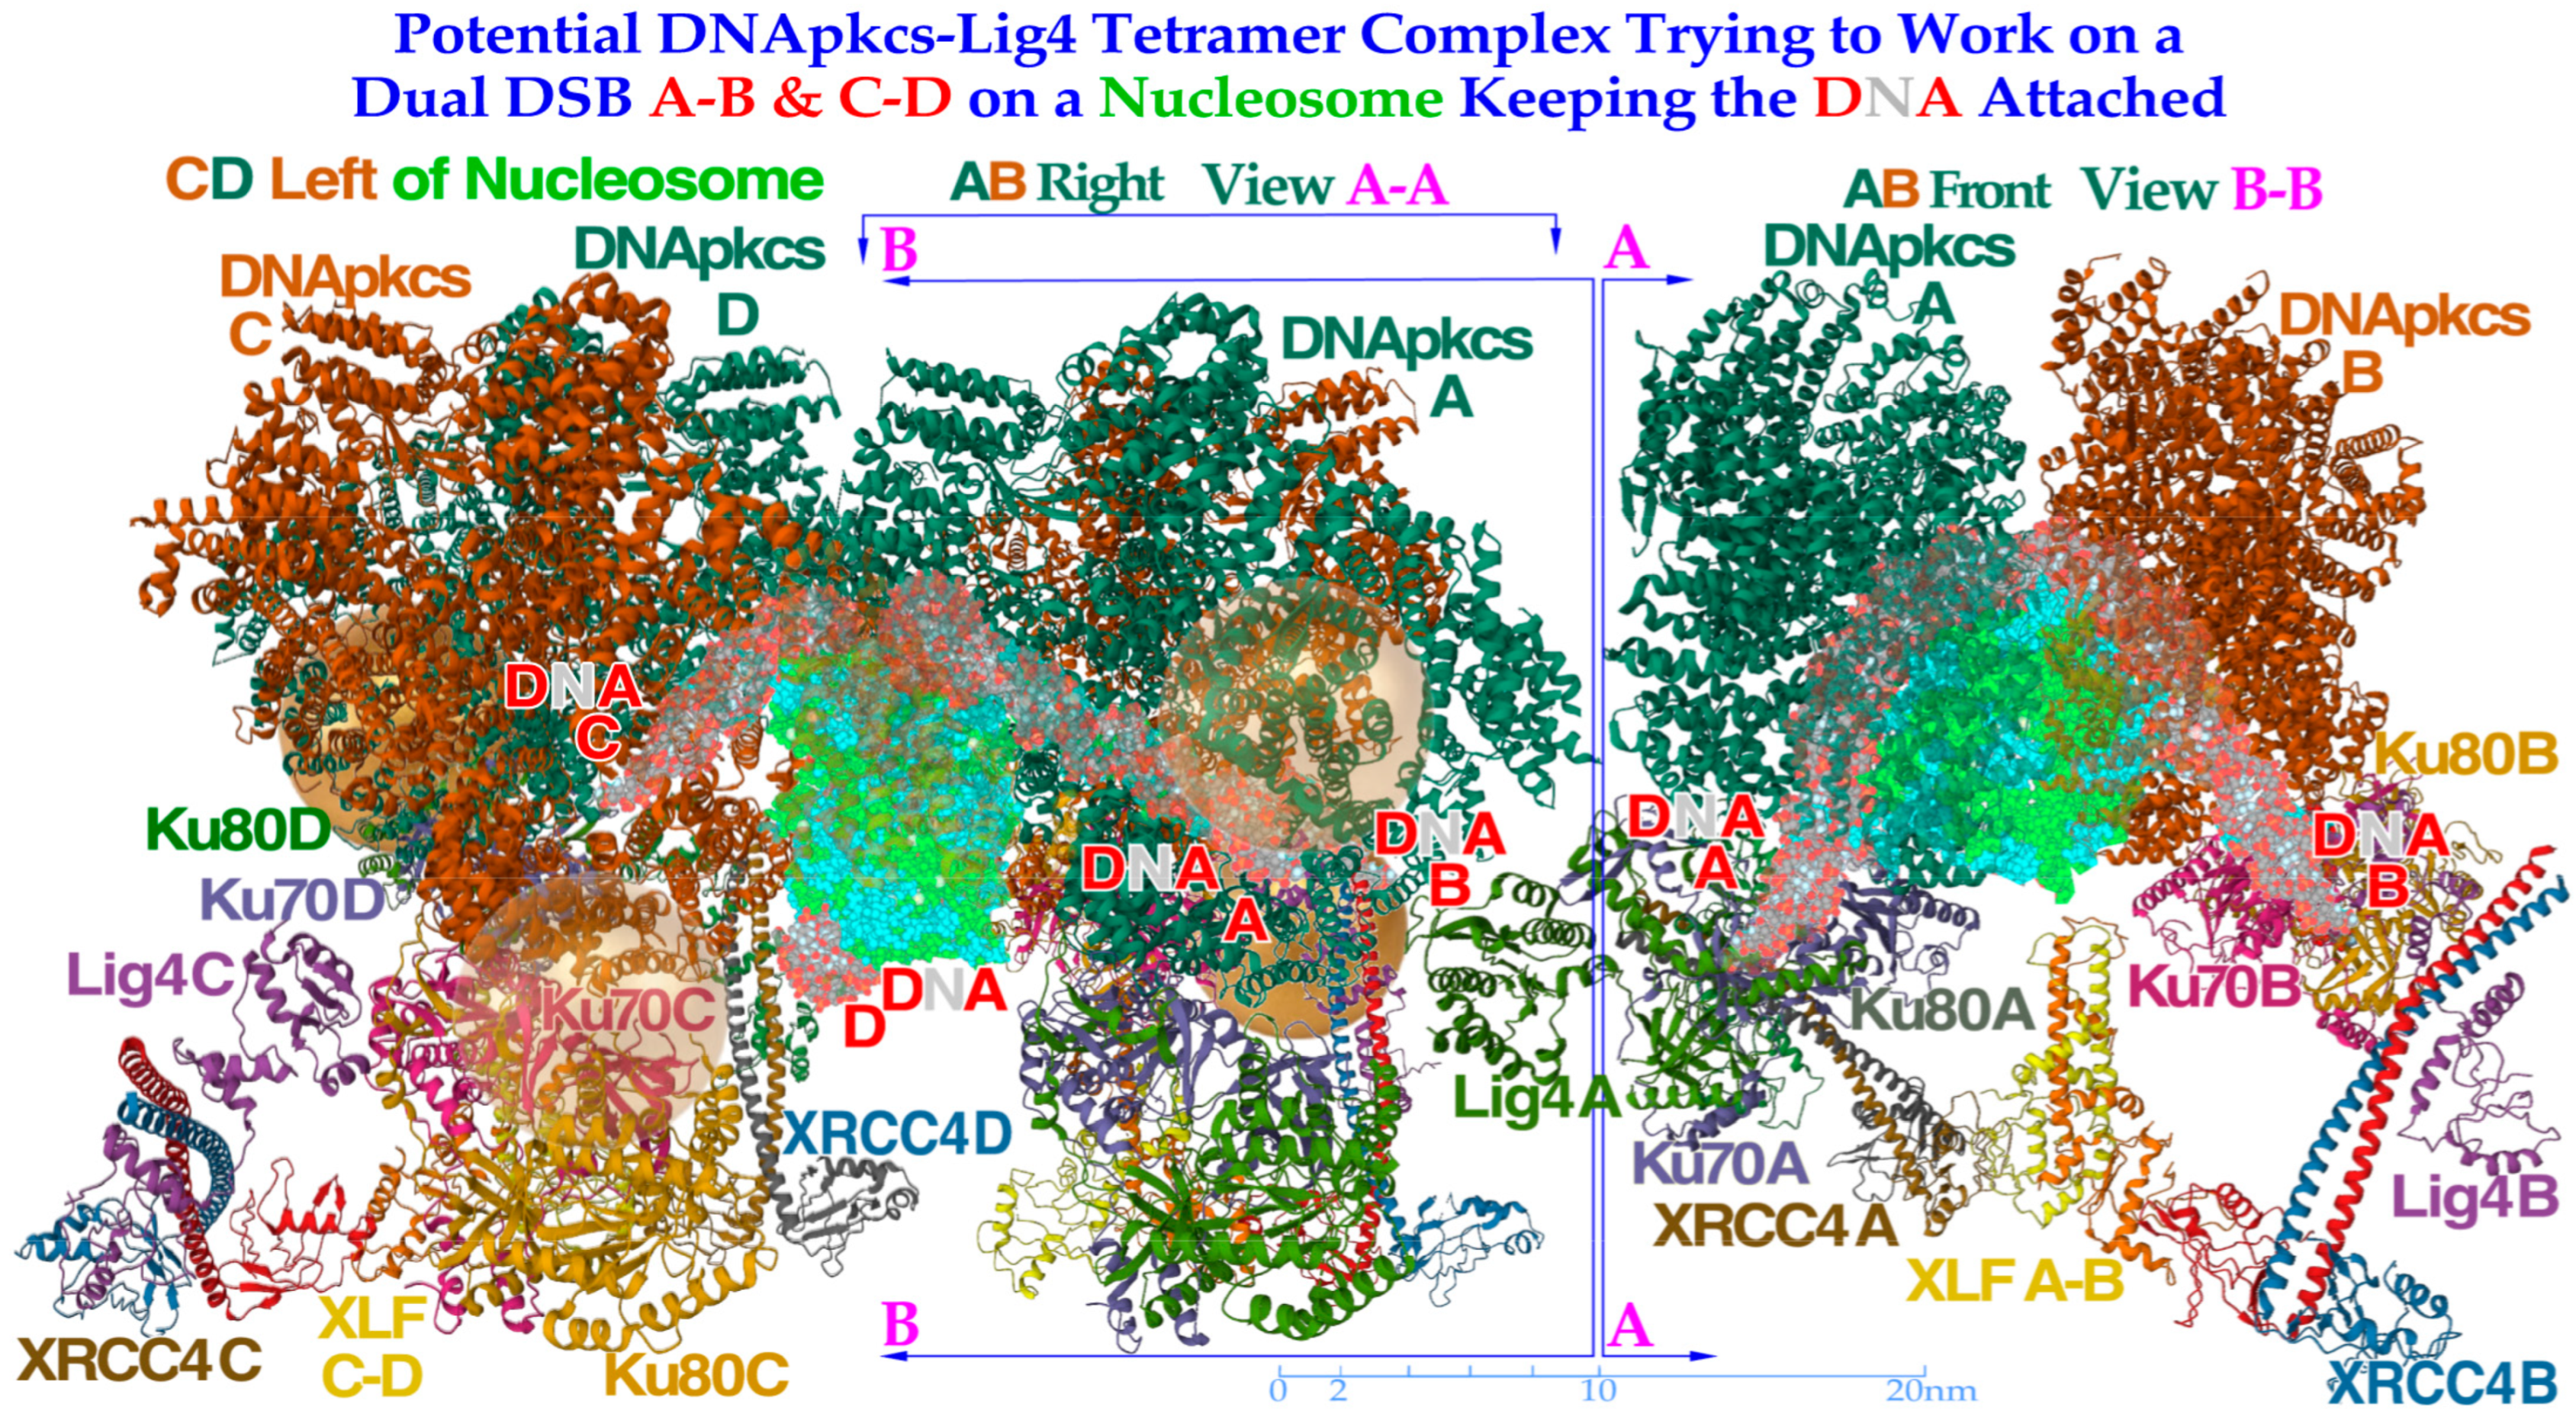
Figure 10.
To the left, a DNApk-Lig4 tetramer complex tries to work on dual DSBs A–B and C–D at the periphery of a nucleosome, keeping the DNA attached to the nucleosome. The partially translucent DNApk-Lig4 dimer complex (modified from [
49] 7NFC), partially showing the nucleosome and at its periphery one of the DSBs with associated damaged DNA ends A and B in view B-B to the right working in front of the nucleosome to repair them back together. For successful repair with a DDSB (cf
Figure 7,
Figure 8 and
Figure 9), both DNA strings on the nucleosome periphery are damaged at almost the same site, just a few nm apart, so a second mirror-imaged DNApk-Lig4 dimer complex should be working left of view A-A to also repair and rejoin DNA ends C and D mirror-imaged behind view B-B (cf
Figure 9). Potentially bound Ku80 gold nanoparticles are shown (anterior translucent, posteriors partly hidden with DNA D not yet at its final position behind C) to indicate their likely associated assembled configuration (cf
Figure 13).
![Biophysica 03 00045 g010]()
This should not generally be a repair problem here as long as the broken DNA strands still stick to their original nucleosome core, as indicated in the lower lane of
Figure 12. The only case where a DDSB gold nanoparticle structure such as that in
Figure 10 is potentially seen in the process in
Figure 12 is the second and perhaps the sixth DDSB termed DDSB0 or DDSB1 along the ion path, both harboring 53BP1 indicating NHEJ activity and possibly an early recruitment of the DNApk dimer before a possible Ku70 nanoparticle blockade of continued repair. Most of the shorter DDSB structures in
Figure 7 and
Figure 8 are therefore too compact to harbor a DNApkcs tetramer, as in
Figure 10 and
Figure 13, which would produce an ≈30 nm distance between the two DSBs. The four key DDSB types in
Figure 11 and
Figure 12 are thus most likely without dual DNApk dimers partly also because it may take many seconds to release enough DNA segments from the histone octamer core to allow Ku heterodimer binding, as shown in the lower left corner of
Figure 12. However, with a real-life DDSB (without gold nanoparticles) it would probably be impossible for the DNA to unwind enough to make room for the whole DNApk dimer and the attached dual Ku70–Ku80 complexes with their associated DNA ends to bind them together without losing the main contact with their original histone octamer core. In electron microscopy imaging, this process may be hard to capture, as the gold nanoparticles with their Ku-binding complexes could interfere with the DNApk dimer Ku-binding sites and may not show up as desired.
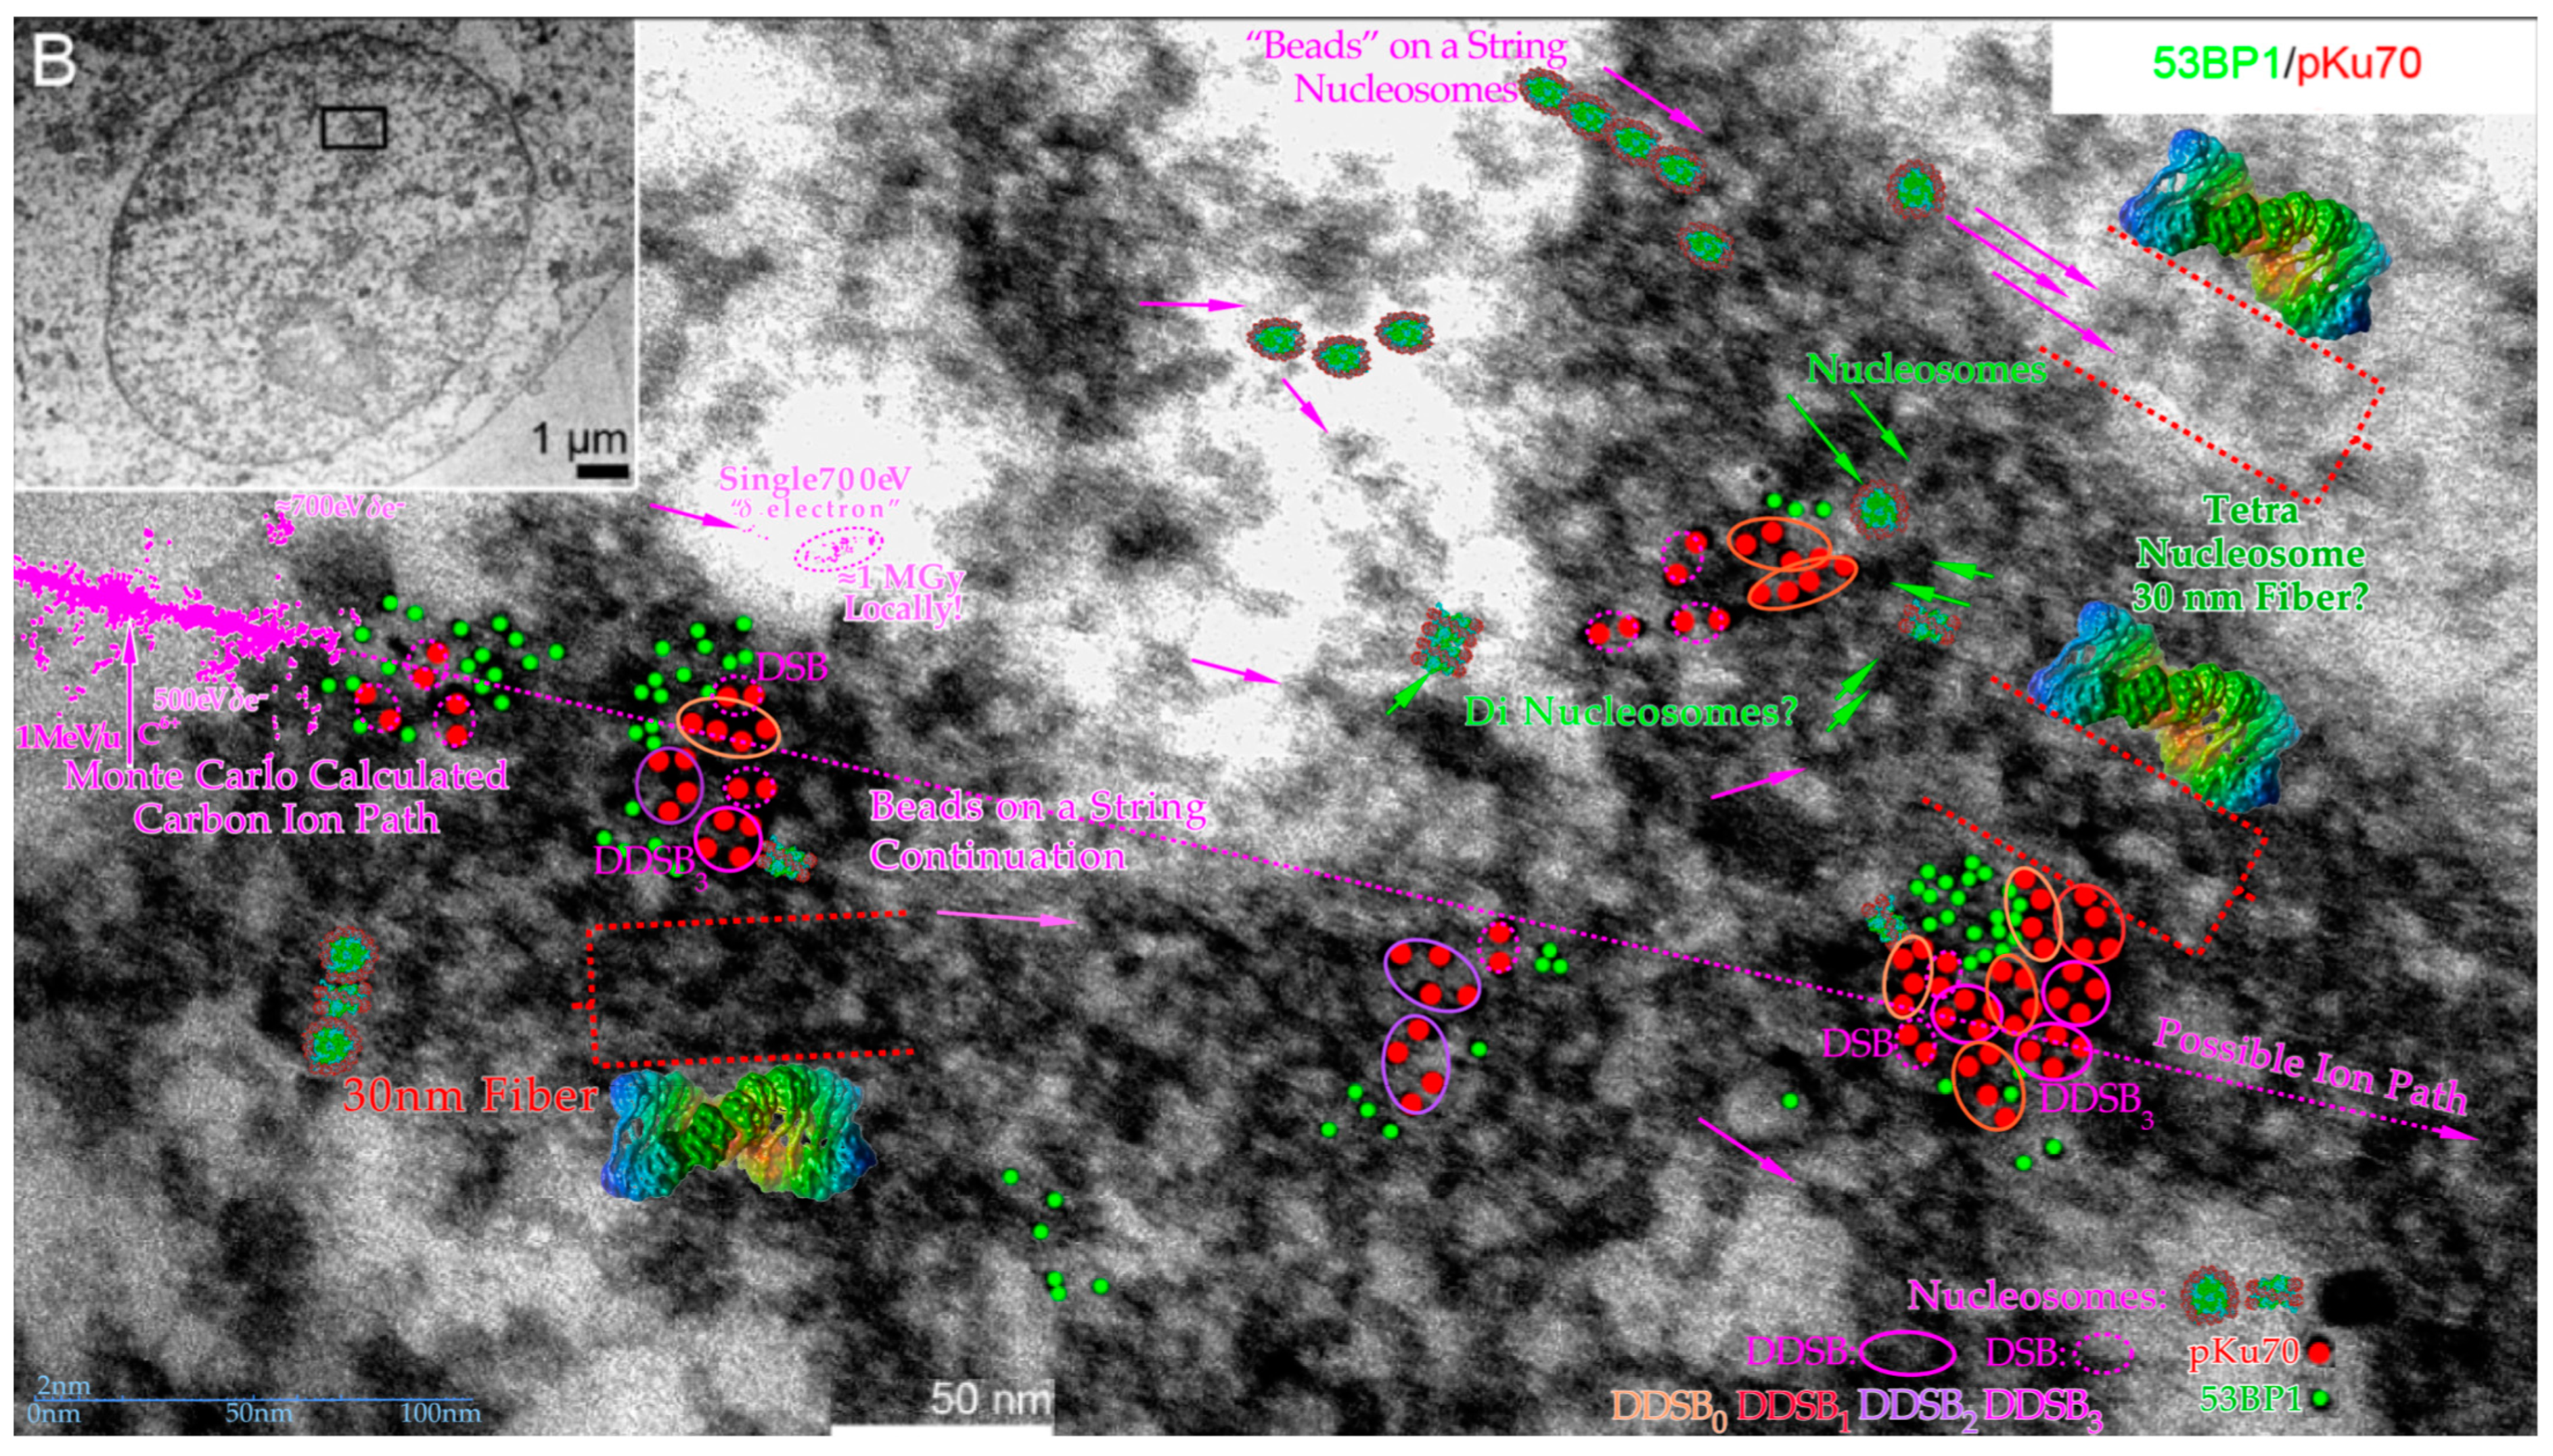
Figure 11.
Overview of some of the main structures of carbon ion tracks through heterochromatic DNA by TEM using 6 and 10 nm gold nanoparticles bound to 53BP1 and pKu70 to visualize DNA repair. Within a few seconds, the Kus are bound to the broken DNA ends, so DNApkcs dimers can rapidly reconnect them and start the repair process. This happens in connection with p53’s rapid double methylation at K321 and K382 to recruit 53BP1 to initiate NHEJ (cf
Figure 2a upper right corner). It is remarkable how large clusters of DNA breaks are generated partly in agreement with
δ-electron track end clusters of the Monte Carlo calculated track segment (cf
Figure 6 and
Figure 13 [
48]). Many nucleosomal particles (cf
Figure 7) and the tetra-nucleosomal 30 nm fiber (see
Figure 6 and
Figure 7) are indicated in the eu- and heterochromatic regions. The DDSB structures are further interpreted in
Figure 12 and
Figure 13. Modified from [
55]. B: Overview of cell with close up region indicated.
With a real DDSB, there would therefore probably still be a substantial risk that the nucleosomal core contact will at least partially be lost in trying to connect the DNApk dimers to the Ku70+80-caped DNApk dimer before a likely Ku70 nanoparticle blockade of continued repair. In fact, as shown in
Figure 5,
Figure 6,
Figure 7 and
Figure 8 the four damaged DNA ends, two on each half of the nucleosome histone octamer core, need to recruit one DNApk-Lig4 dimer complex per break pair to repair each side’s DSB. It is probably unlikely that this process is always successful and at least some of the DNA strands need to disconnect from the nucleosome histone core to allow faithful repair. The DNA ends A and B finally have to be brought back together, possibly by a switch from the DNApk dimer to the MRN dimer complex to use the higher flexibility and fidelity of HR repair [
4,
9,
41,
42,
43,
50]! In particular, if the cell is already in S phase and the BRCA genes are bound to the CDK2–cyclinA complex, p53 may prefer HR repair removing the Ku-DNApk heterodimer and replacing it with the MRN dimer. This will allow higher flexibility in moving the DNA ends ≈100 nm using the Rad50 dimer coiled coils to find, by homology search, the suitable sister chromatid for a more accurate HR repair [
4,
50]. Interestingly, the euchromatic carbon ion track in
Figure 12 may indicate that this can happen in some DSBs and DDSBs that miss 53BP1 (green dots) and possibly due to a switch to BRCA1 (cf
Supplementary Figure S2). This would steer toward HR repair (pink circles, just Ku70 red dots, no green 53BP1) as often preferred with high-LET radiations ([
9]: Figure 8, [
51,
56]) instead of NHEJ (blue circles, red dots with associated 53BP1 green dots).
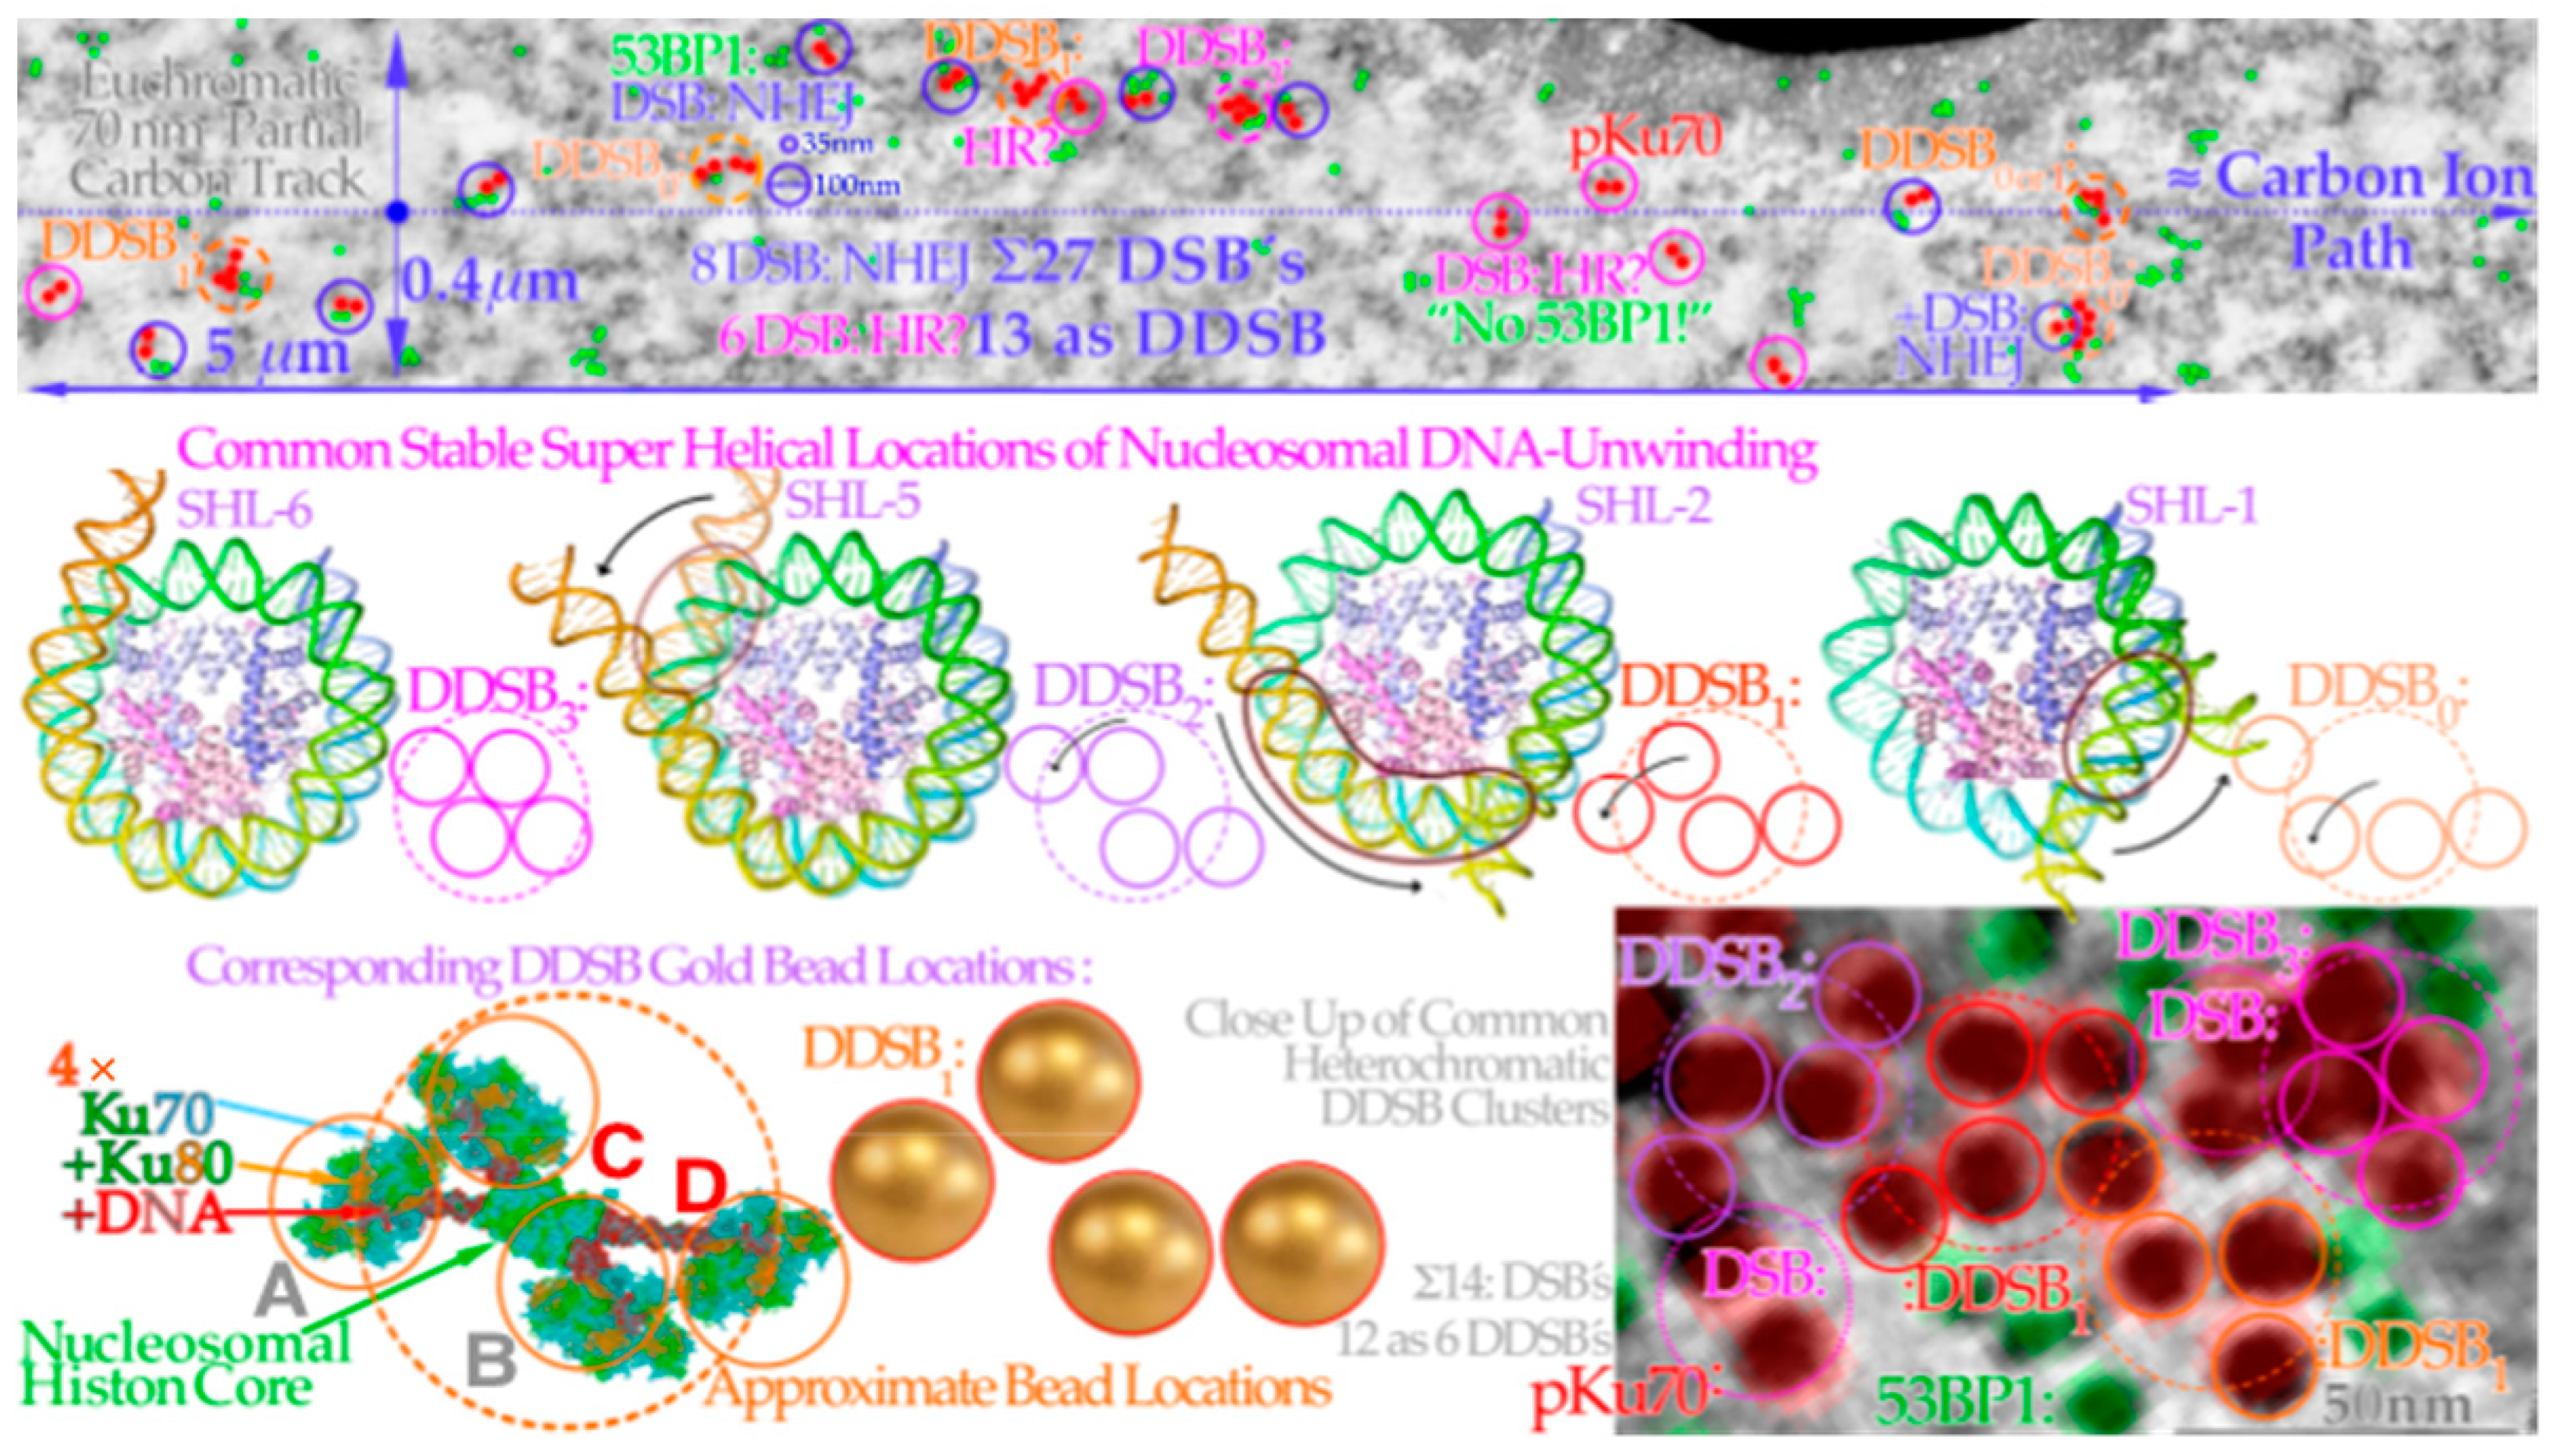
Figure 12.
Four key DDSB event types generated by carbon ion
δ-electron clusters on eu- (top lane) and heterochromatin (bottom lane). A carbon ion track through euchromatic DNA shown in the top row DSBs and DDSBs along a 5 μm path only visualized by pKu70-bound gold beads on both sides of DNA breaks (red dot pairs, cf
Figure 3,
Figure 7 and
Figure 8). 53BP1 may also be recruited as a sign of NHEJ repair (green dots) whereas its absence may indicate an unreached location, a microtomic cut out, or even a switch to HR repair recruiting BRCA (cf [
4,
50]). This switch would probably be more common if it was not for the present dominance of G0 cells. There are typically four types of DDSBs observed, as shown in the middle lane where the pair of DSB configurations seems to be linked to the different amounts of DNA unwinding necessary depending on where the hit took place to allow suitable mounting of the Ku70/80 heterodimers needed for closing the breaks by DNApkcs dimers. This is shown in more detail in the lowest row for a DDSB1-type hit before the DNApkcs dimer has arrived as seen 3 times along the upper track and twice in the lower right heterochromatic DNA DSB-DDSB cluster. It should also be pointed out that the dotted approximate ion path is not inside the upper 70 nm thick TEM slice, as that would have overloaded the picture with DSBs even more than, e.g., in
Figure 11. The maximum range of ion-generated δ-electrons is ≈0.4 μm. (top lane: modified from [
54]: part of Figure 2, middle lane: modified from [
57], bottom lane: modified close-up from [
55]).
![Biophysica 03 00045 g012]()
The HR pathway may be a more successful process and may allow the most critical free DNA turn to remain in contact with the nucleosome histone core. Simultaneously, the other free strand ends can work together with the coil coiled arms of Rad50 via MRE11 of the MRN dimer bound to the damaged DNA ends to find the right sister chromatid section [
4,
50]. For correct repair it is still important in the initial seconds after a hit, that the fast Ku-DNApk dimer step is working well, so the slower Rad50-MRE11 dimer complex can take over to more flexibly hold the correct DNA ends together during this often more optimal high-fidelity HR repair process [
1,
4,
9,
41,
42,
43]. This is clearly showing that there is also a fair amount of collaboration between the NHEJ and HR repair processes as seen previously by analyzing cell survival [
1,
8,
9]. Interestingly,
Figure 13 shows clusters of pKu80 and pDNApkcs nanoparticles just as seen to the left in
Figure 10. The width of this DDSB1-type event is more than 50 nm, indicating that the nucleosome was probably lost in the process. The other two are ≈DDSB3, one of which has 3× pDNApkcs (one hidden?) and the other none; maybe it is too deep in the layer or lost in the microtome. However, this also indicates that the gold nanoparticles on the Ku80 may not always block the recruitment of the DNApkcs dimers and the molecular view of the DDSB in
Figure 9 and
Figure 10 may not be too far from reality. We can also conclude that the more severe clusters due to multiple
δ-electron production (cf
Figure 11,
Figure 13 and
Figure 14) are most likely an unnecessary cellular overkill unless it only happens in the last few μm of the ion ranges. This again supports the idea that an LET well below 55 eV/nm is sufficient. Not only does a too high LET produce fewer apoptotic and senescent cells in the tumor [
1,
9], but it also increases this fraction in normal tissues where we prefer to avoid it [
1,
9,
16,
27,
58,
59,
60].
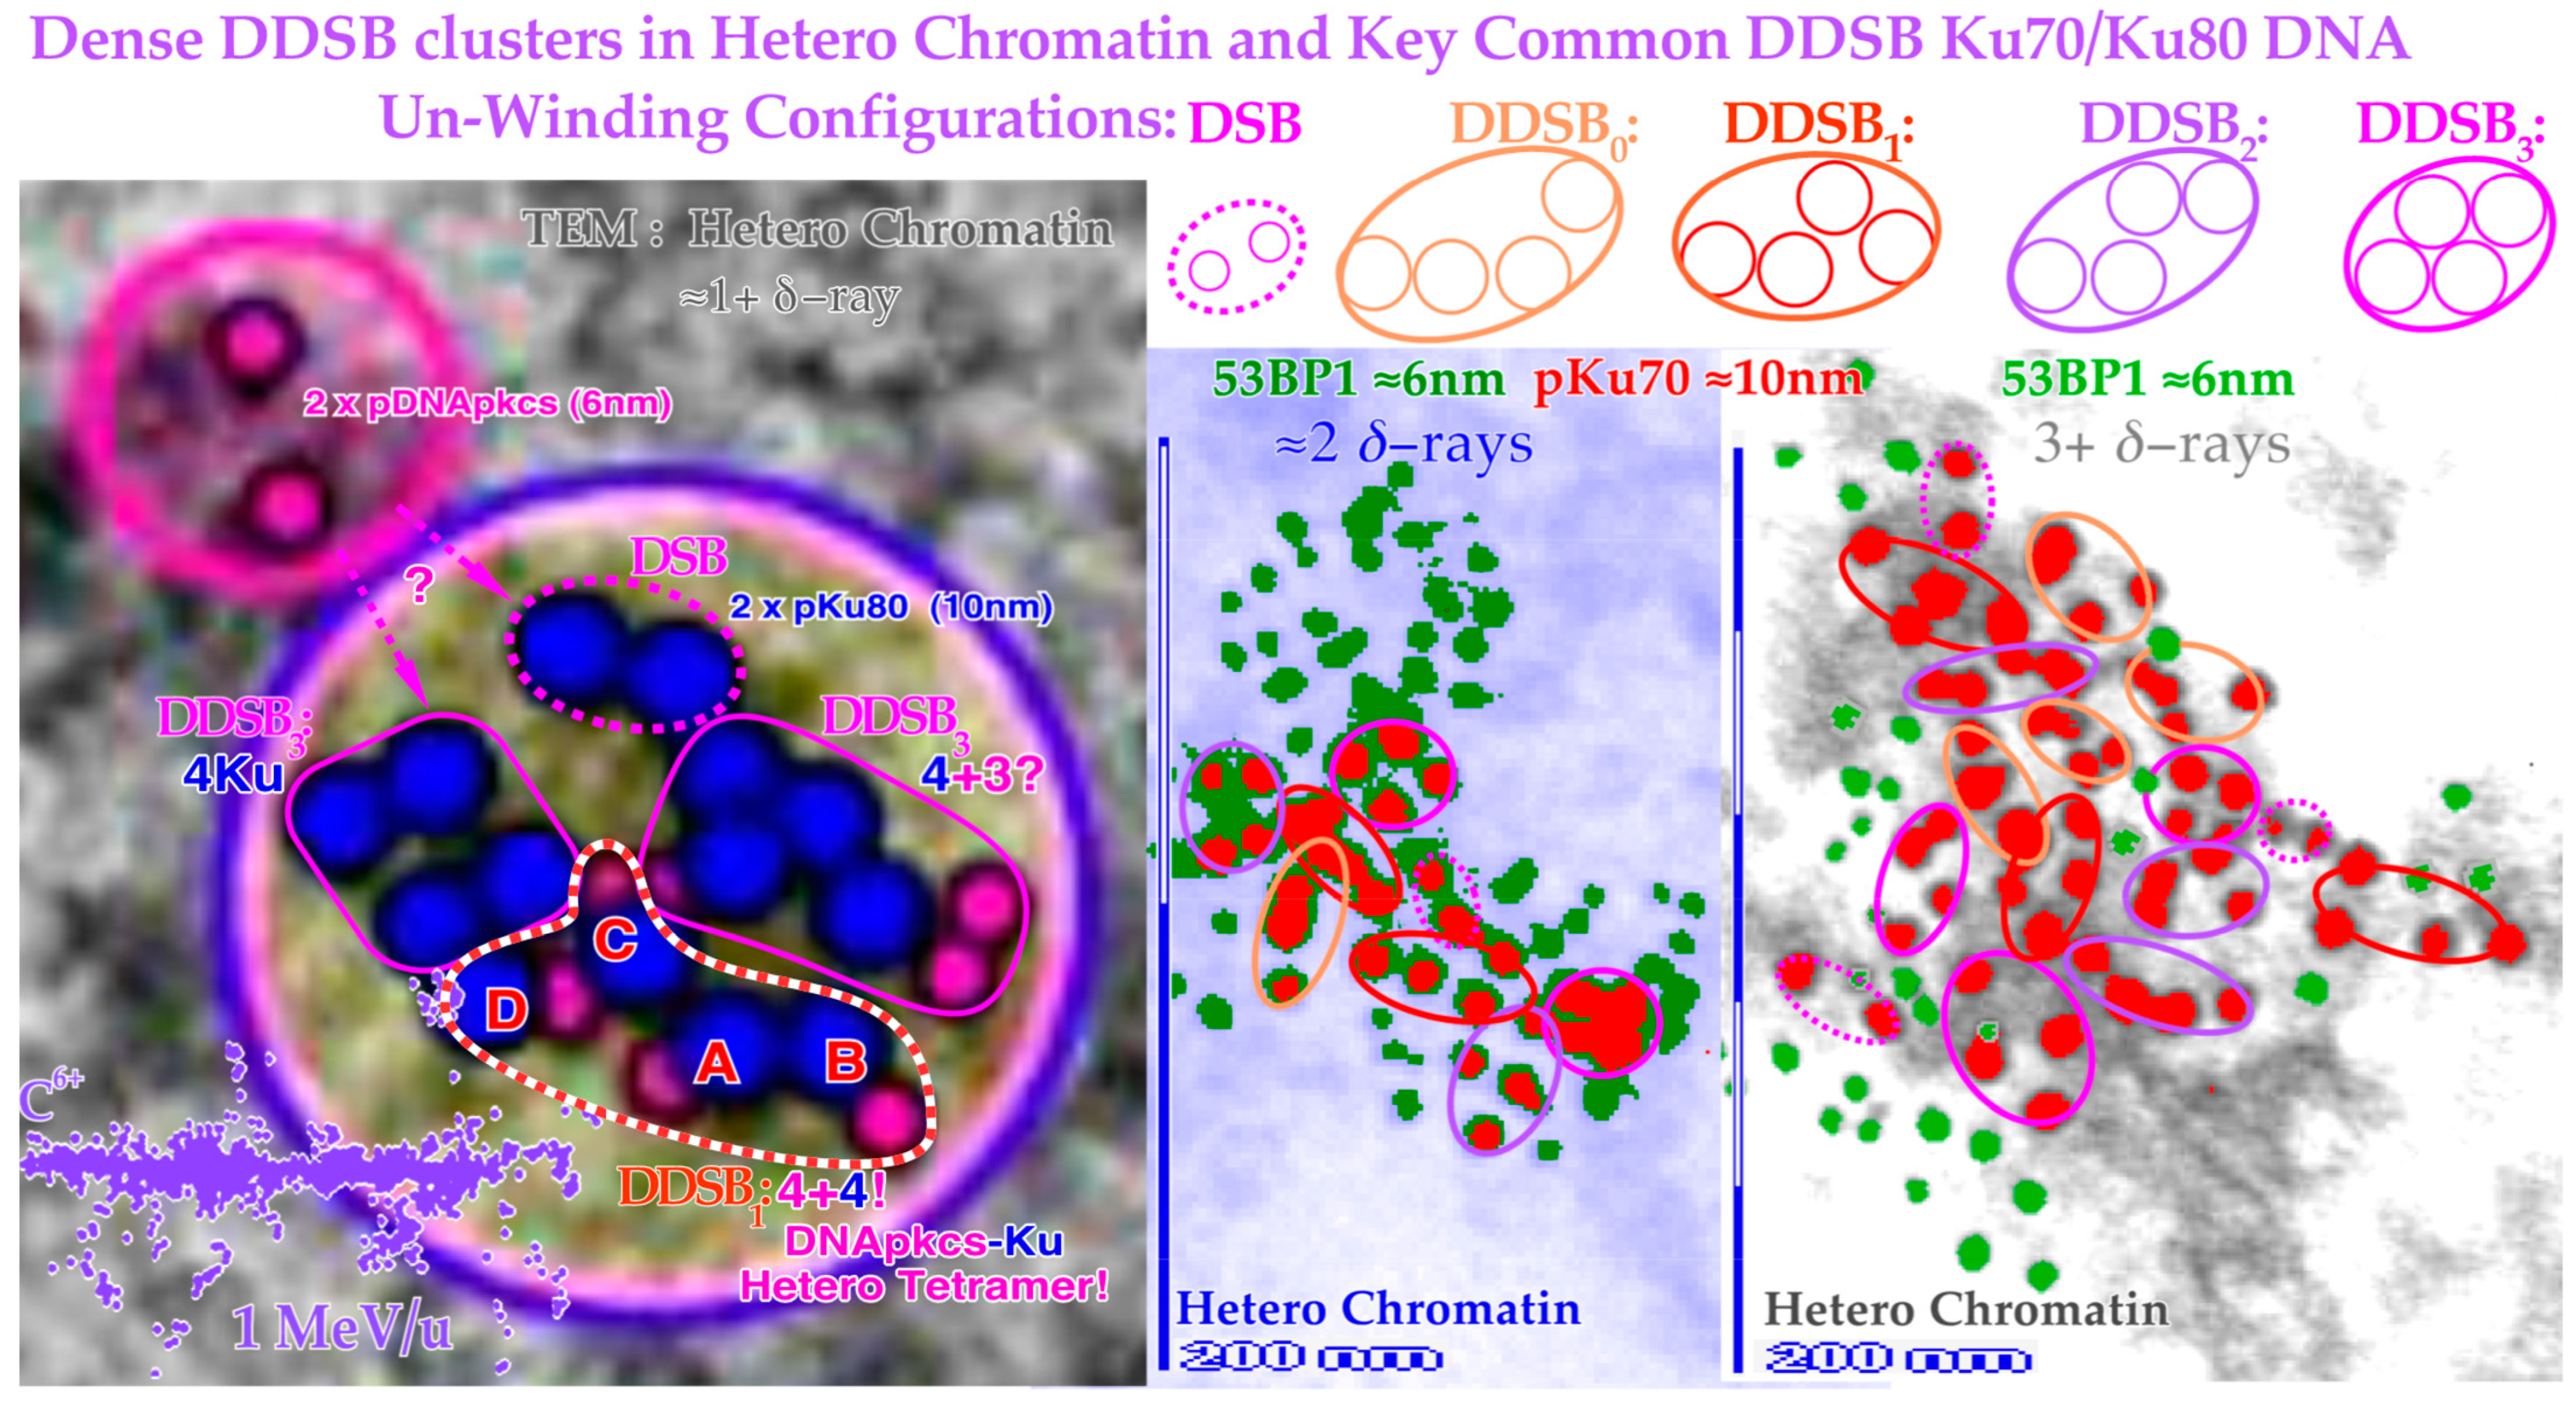
Figure 13.
Close-up view of three dense heterochromatin (gray, light blue, gray) clusters with 7, 15, and 29 DSBs and 3, 7, and 13 DDSBs (euchromatic regions have their original gray or light blue background). Approximately 1, 2, and 3
δ-electrons probably produce them, respectively (cf
Figure 12). Interestingly, one DDSB1 with 4× pKu80 (dark blue) and 4× pDNApkcs (smaller 6 nm dark pink beads inside black circles) is seen inside the red–white dashed curve in the first smallest DDSB cluster
almost as expected from Figure 10 with a DDSB1 cluster (cf also
Figure 11 and
Figure 12). Obviously, it is not always certain which configuration to choose, e.g., a DDSB could also sometimes be two separate DSBs. Simultaneously to the top right, a pDNApkcs dimer is possibly on its way to the simple DSB or the nearby DDSB
3.
11. Discussion: Clinical Consequences of DDSBs in Radiation Therapy Optimization
As seen above, the pKu70 and pKu80 gold nanoparticles are probably the optimal tracers for nm resolution DSB imaging, and they appear as expected in two foci for each DSB, one for each free DNA strand, as seen in
Figure 11,
Figure 12 and
Figure 13. Interestingly, there are also commonly four tight foci seen close together. They are often clear DDSBs and generally of four kinds: DDSB0–3 (cf
Figure 12).
Figure 5 clearly shows that simple DSBs are often imaged by
γ H2AX as single foci, and they are repaired to 99.1% at 2Gy (probably 100% of simple DSBs are repaired correctly [
1]) so there must be more severe damage that kills cells, such as MDSs and DDSBs! That is where the most common MDS comes in: the DDSB, and there are ≈ 1–2
δ-electrons per cell nucleus that can generate DDSBs at 2 Gy, low LET. So, if half of them or so hit the nucleosomes this would largely explain the ≈ 0.75% cells that are killed! They are ≈ 2–3 times more common for light ions resulting in an RBE ≈ 3. Therefore, they are key effectors of radiation therapy! The high survival (99.1%) means that 2 Gy (low LET) is clinically useful not to excessively harm normal tissues. Thus, we need to go higher to cure a tumor as seen in
Figure 3b and
Figure 4 (cf
Supplementary Figures S2 and S3) as they are often mutated at the TP53 site and less radiation sensitive (a low-dose-radiation-resistant phenotype, LDRR, generally little/no LDA and/or LDHS). This can best be carried out by inversely planned, biologically optimized intensity modulation radiation therapy, which has been extensively developed during the last 40 years (IMRT, [
1,
17,
27,
62,
63,
64,
65,
66,
67]).
For low-LET beams like photons, electrons, and protons, the induction of DDSBs is largely proportional to the absorbed dose. However, the biological effect is also dependent on the dose and temporal response of the DNA repair system as recently discussed in some detail [
1,
9,
27]. In particular, the identification of the common property of most intact normal tissues to be largely low-dose hyper-sensitivity (LDHS) is very important. This property of most normal tissues is linked to the gradual induction and initiation of full DNA repair efficiency. It takes ≈ ¼ Gy or 9 DSBs for ATM to be autophosphorylated and in turn phosphorylate p53 at serine 15. A further ¼ Gy is needed to also phosphorylate CHK2 and subsequently phosphorylate p53 on serine 20 [
1,
9,
40,
41]. Thus, first after ½Gy and ≈18 DSBs both NHEJ and HR repair are fully functional to clear the induced strand breaks as shown in
Figure 3b [
9,
41]. Below ½ Gy, p53 induces low-dose apoptosis [
9,
27,
41,
42,
43] as a precaution to avoid misrepair mutations before full functionality of the advanced cellular DNA repair systems (
Figure 2a). Interestingly, this means that the least damage per unit of absorbed dose of low LET in normal tissues is obtained at close to 2 Gy/Fr, as seen in the lower left inset in
Figure 3b and in more detail in
Figure 4. This is due to the induced effective NHEJ and HR repair that can then be most effectively used for DNA damage repair of the next 1½ Gy delivered before reaching ≈2 Gy. To be more exact, the shallowest tangent from the origin to a point on the cell survival curve defines the optimal dose per fraction. This reduces the adverse effect on normal tissues for a given dose to be imparted to the underlying tumor, as described in more detail in
Figure 4 [
1,
9,
17,
27]. Above that dose level, other high-dose problems may emerge such as high-dose apoptosis (HDA) induced by serine 46 phosphorylation and may complicate the treatment as clearly seen in
Figure 3b (beyond 2–2.5 GyE or >2 DDSBs). Thus, if we need to irradiate through normal tissue we should give ≈1.8–2.3 Gy/beam and use other non-overlapping IMRT beam directions to obtain ≈2.5–4 Gy in the tumor, as recently discussed in more detail [
17,
27].
The low
LET fractionation window is thus ≈1.8–2.3 Gy/Fr [
27] where the normal tissues are least damaged by delivering a given dose to the underlying tumor. For simplicity, the tumor may need 64 Gy with two perpendicular or preferably ≈ 120° separated IMRT beams [
17], for example, at a dose of ≈3.2 Gy/Fr to the tumor, only 20 treatment fractions with two beams at ≈ 2 Gy/beam are needed. However, since the dose per fraction to the tumor is now higher than the conventional 2 Gy it will probably suffice to deliver ≈16 to 18 fractions based on a simple linear quadratic conversion of the conventional 2 Gy/Fr in 32 fractions to the higher 3.2 Gy/Fr (cf [
17]: Equations (2) and (3)). Thus, there is simultaneously a gross reduction in normal tissue irradiation, making ≈ 52–58 Gy to the tumor sufficient using the optimal fractionation window, with just ≈32–36 Gy to normal tissues. Obviously, the advantage is increased by adding more beams, but the risk of secondary cancers is increased too, as larger volumes of normal tissues are irradiated with many overlapping low doses. This makes more than ≈4–5 beams undesirable for patients with more than about 15 years of life expectancy. This was recently discussed in some detail and the underlying molecular science is described in detail in
Figure 3a,b with its LDA and HDA (see [
17,
27]: Figure 6, cf also [
68,
69]). Thus, the so-called daily and weekly fractionation window in most normal tissues is doses between 1.8 and 2.3 Gy/Fr (strictly derived for low
LET lung epithelial cells in
Figure 4, [
17,
27]) which is the most effective dose range for each beam to deliver a much higher dose to the tumor with minimal damage to surrounding normal tissues (cf also [
27]: Figure 5 and [
17,
58,
59,
60,
66]). Interestingly, at the same time this also results in rather low DDSB values as shown in
Figure 5 (generally in intact normal tissues there is less than 0.9% cell death at 2 Gy). This approach is contrary to the classical radiation therapy approach during the era of parallel opposed beams (used to compensate for the dose attenuation of each beam). Then, the tumor and normal tissue doses were almost the same and around 2 Gy/Fr and this was truly the period when the suitability of 2 Gy/Fr was established as the best tolerated dose per fraction. Currently, mainly in the era of biologically optimized intensity modulated treatments [
17,
27,
59,
60,
62,
63,
64,
65,
66,
67,
69], parallel-opposed beams are generally avoided as they will have little therapeutic advantage [
17]. With biologically optimal intensity modulation, the best possible avoidance of high doses to normal tissues and a focus on the fundamental delivery of the
highest tolerable dose to the tumor are possible. We should therefore keep the ≈2 Gy/Fr to normal tissues (organs at risk) as was historically established as best tolerated and now use it primarily because we understand that it is optimal due to the LDHS-related fractionation window of most if not all normal tissues [
17,
27]. We should increase the tumor dose and produce as many DDSBs in the tumor as possible to most effectively eliminate clonogenic tumor cells remaining at ≈2 Gy/Fr in normal tissue at risk. With biologically optimized intensity modulation, it is now possible to effectively increase the tumor dose as much as desirable as long as the high-dose spillover to the surrounding normal tissue stroma does not cause problems, and sometimes special care may be needed with critical stroma inside the target volume. Furthermore, too high doses and massive tumor cell kill must be used with care passing the classical 2 Gy/Fr [
17]. Our better understanding of (1) the LDHS fractionation window of normal tissues, combined with (2) the biological power of intensity modulation and the clinical role of (3) a high DDSB density in the tumor and (4) a low density of DDSBs and
LET in normal tissues, will thus allow a real paradigm shift in curative radiation therapy as recently discussed in much detail [
17,
27]! Interestingly, the additional possibilities with the lightest ions (helium–boron, see
Figure 3b, the
Supplementary Figure S2 and [
16,
17,
27,
58,
60,
66]) with their modestly increased LET in normal tissues can make the probability of achieving complication-free tumor cure even higher. Furthermore, the valuable low-
LET fractionation window at 1.8–2.3 Gy/Fr also works for our lightest ions largely with low
LET in normal tissues and can deliver a further therapeutic boost, not least to hypoxic and TP53 mutant tumors. For the latter large group of difficult patients, the p53-reactivating compound APR246 is a very interesting adjuvant to improve the treatment possibilities of the multitude of LDRR tumors that have a mutant TP53 pathway (>50% of all tumors) [
9,
17]. However, here too we will require a renewed thinking, as we have to maximize the tolerance of the normal tissues much more carefully! It is very clear that optimal DDSB induction, as mentioned, will have an even more important role in light ion therapy [
17,
27].
In the early days of ion therapy, the primus motor Cornelius Tobias at Berkeley was focused on the classical problem of radiation therapy: he truly wanted to eliminate hypoxic tumor cells at all costs since they were hard to eliminate with low-
LET radiation. Therefore, he went all the way to neon ions. It was seen in vitro that one needs a very high
LET to reduce the oxygen enhancement ratio (OER) practically down to unity (≈1.15) so hypoxic tumor cells are unable to escape the treatment, and these ions could be produced in house by the Bevalac accelerator. Unfortunately, that also caused a biological effect in the entrance region where there were mainly normal tissues ([
58]: Figures 11, 12 and 16), thereby missing a large part of the therapeutic advantage, almost like with neutron therapy [
58,
70]. Helium ions were also successfully applied on large AVMs with significantly better results than the more conventional photon beams [
70,
71], indicating the value of lower-
LET ions. Hirohiko Tsujii at NIRS showed that carbon ions were sufficient with multiple improved clinical results [
72,
73].
The above discussion shows that we could improve the complication-free cure even further with the lightest ions, making use of the possibility that the normal tissue could then remain in regions that, as far as possible, remain at a low
LET. Recent studies have shown that there is a very low LDHS with carbon ions ([
27]: Figure 7, [
74]) and there is more to gain with the lower-
LET boron ions but not generally enough to obtain a true fractionation widow ([
17,
27,
58,
60]: Figures 12 and 14). To obtain that advantage, helium, lithium, and probably beryllium ions are better as the
LET outside the Bragg peak is mainly low (<10 eV/nm, lower lane of
Figure 3b, [
16]: Figure 8.9g, [
60,
66]). Helium, lithium, beryllium, and, to some extent, boron ions thus have the advantage of not generating too many DDSBs in normal tissues but instead significantly more in their Bragg peaks [
27,
58,
59,
60,
66,
75]. These ions may therefore improve the complication-free cure, keeping the low-dose hypersensitivity and a low DDSB probability in the normal tissues as clearly shown in the lowest third of
Figure 3b for lithium ions. The
LET is always below 10 eV/nm in normal tissues, so less than 20 eV is on average imparted to DNA, making ionization (requiring ≈ 30+ eV) less probable. Interestingly, the classical low-
LET fractionation window at 2 Gy/Fr is thus fully open for lithium ions, and it can be used in normal tissues almost as with photons, electrons, and protons. However, now, the high-
LET Bragg peak should only be directed into the tumor with all its increased biological effect as seen in
Figure 3b. Similar curves as in
Figure 3b for all light ions up to carbon have also been published [
17,
66] and more recently comparing boron and carbon [
17,
58], showing that carbon 12 is generally above 10 eV/nm whereas boron 8 is only above 10 eV/nm, less than half of its therapeutic range. Furthermore, the medium-
LET 10–20 eV/nm extends ≈ 1 cm in front of the Bragg peak for lithium, 5 cm for beryllium, 10–15 cm for boron, 25 cm for carbon, and nothing for helium. Therefore, boron ions are generally preferable to carbon ions at least for medium-sized tumors [
17,
58].
Unfortunately, there is no clinical facility using boron ions yet, but several have the capability to produce them and the same is true for lithium and beryllium ions. Beryllium ions have the risk that they may end up as beryllium oxide in the patient and it is very toxic, but it is mainly deposited in the tumor, so it may even be an advantage. However, the amounts are so small that the risk may be minimal as may the chemical activity by the lithium ions. In fact, lithium ions are probably the most optimal ions for small to medium-sized tumors, and the best ions for pediatric patients, since neutrons, fragment production, and secondary cancer induction are significantly reduced [
17,
27,
58,
66]. A key clinical advantage is also that the size of the accelerator is reduced so 400 MeV/nucleon carbon ion would be equal to the range of a ≈320 MeV/nucleon boron ion and ≈240 MeV/nucleon lithium ion, making the accelerator and gantry much more compact! An ideal accelerator for light ion radiation therapy should therefore use helium, lithium, and boron ions for biological optimized radiation quality modulated radiation therapy (QMRT, [
16]: Figure 8.30b, [
16,
27,
58,
60,
66]) and be combined with an advanced photon and electron IMRT clinic!
A large number of other factors also need to be taken into account in the optimal choice of ion species as recently discussed, always making it important to compare the effect in the tumor (
PB = probability of a beneficial treatment) but equally important in normal tissues (
PI = probability of normal tissue injury, [
58]: Figure 16, [
60]: Figures 12 and 13). A suitable positive quantifier is then the probability of achieving a complication-free cure;
P+ ≈
PB −
PI when they are correlated processes or
P+ ≈
PB(1 −
PI) when they are statistically independent processes [
76]. There is no doubt that boron is better than carbon for most medium-sized tumors and lithium is surely the ion of choice for pediatric tumors. Furthermore, their combination is truly the way to cure most tumors by biologically optimized QMRT [
16,
17]. It is sufficient to make elevated
LET-produced DDSBs in the tumor, but there is no need for 5–15-fold overkill as seen in the histogram in
Figure 14! For high-quality ion therapy, it is best to also use a low-
LET round-up for the last 10–15 GyE of the treatment to minimize normal tissue damage and obtain the steepest possible dose response with the highest possible final complication-free cure probability [
16,
17,
27,
66,
77]. This is the case since the last few remaining tumor clonogens during the last ion fractions are very hard to hit with certainty. The ion beam intrinsic microdosimetric heterogeneity may generate microscopic cold spots around tumor clonogens, causing risk of caspase-3-induced accelerated tumor clonogen repopulation after a treatment. Furthermore, tumor cells may not even be severely hypoxic, at least after a last weekend of HR repair and associated target tissue reoxygenation [
16,
17,
27,
60,
66,
78,
79].
12. Conclusions
The present paper discusses a large number of new ways to optimize radiation therapy based on recent results on imaging low- and high-
LET DNA damage with nm resolution in combination with a new DNA damage and cell survival formulation capable of quantifying NHEJ and HR repair as well as apoptosis and survival at low and high
LET. Quantifying low-
LET survival at therapeutic 2 Gy doses in normal human tissue show that less than 1% of the 75 DSBs are lethal (cf
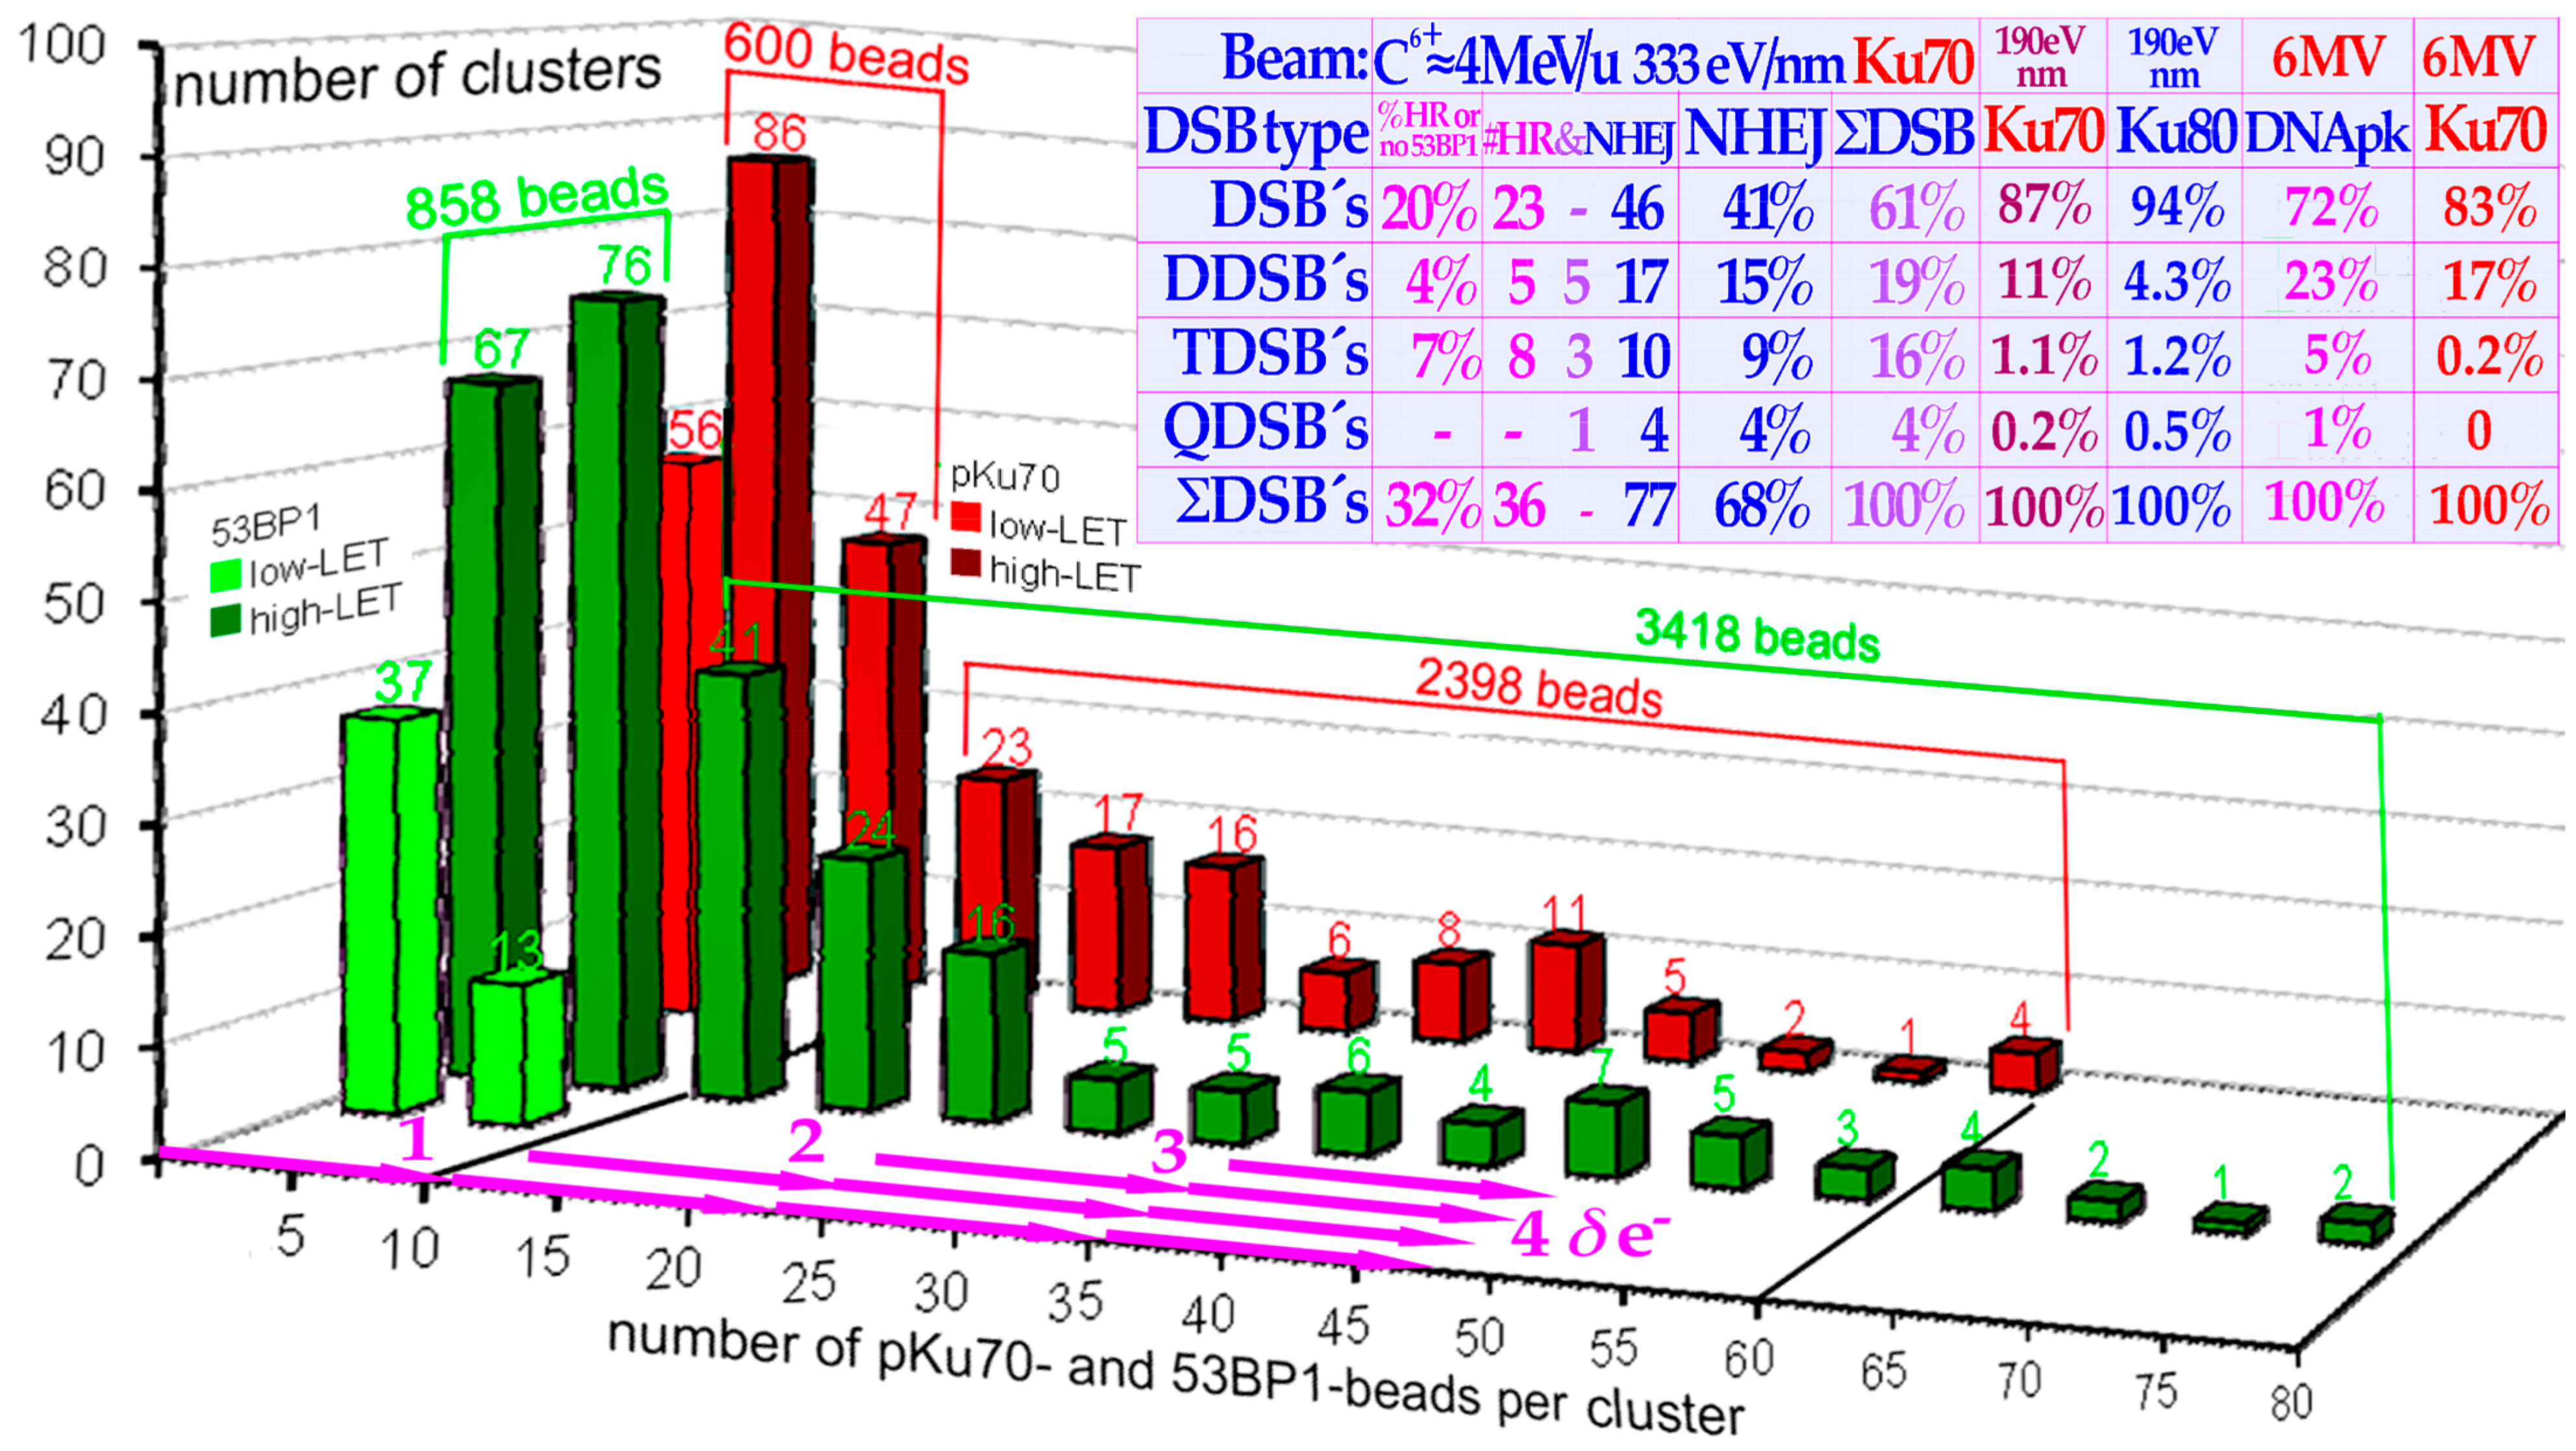
Figure 5), so what is then killing cells? The result is shown in the top lane of
Figure 12 where the DSBs are induced by
δ-electrons at an ≈100 nm distance from a 70 nm thick slice of beads-on-a-string nucleosomal DNA along a carbon ion path. The DSBs are quantified by pKu70-bound 6 nm gold beads binding to each and every broken DNA end pair. Interestingly, along this 5 μm track there are 27 DSBs and 6 × 2 of them are caused by dual DSBs that are four beads close together as a DDSB! At low
LET, there are 1–2 such identical
δ-electrons in each cell nucleus at 2 Gy as determined from the electron slowing down spectra in
Figure 1, all of which are capable of making DDSBs at the periphery of nucleosomal DNA. Therefore, DDSBs are by far the most common lethal event on cells as further seen in
Figure 8 since each DDSB generates almost a full turn of free DNA from around its nucleosome which is hard for the cell to accurately rejoin and repair (cf
Figure 10). At the same time, this also explains why 2 Gy is a kind of limiting dose in normal tissue as above ≈2.5 Gy too many normal tissue cells are damaged by DDSBs and HDA. This in turn explains the
low-LET and dose fractionation window and its generation by ATM and CHK2 phosphorylation of p53 in intact normal tissues but not in tumors that are mostly TP53 mutant and therefore more radiation resistant. This valuable fractionation window at ≈1.8–2.3 Gy/Fr also works for our lightest ions (helium–boron) largely with low
LET in normal tissues and can deliver a further therapeutic DDSB boost to hypoxic tumors. Unfortunately, the fractionation window is practically closed for carbon and heavier ions since the increased biological effect in the tumor spills over to normal tissues as practically proven with neon ions and neutrons. In addition, people are still working on introducing oxygen ions just because they are unhappy about the way carbon ions works, since they have not understood their optimal usefulness with a low-
LET treatment round-up, and they are already on the too-high
LET side using carbon. The lightest ions are also the way to minimize the risk of secondary cancers [
17] and reduce ion attenuation and the fragmentation and neutron tail for pediatric patients and, at the same time, their microscopic heterogeneity is low with steep dose response and high complication-free cure rate, keeping the fractionation window fully open and introducing a real paradigm shift in curative radiation therapy. Potential total dose reductions, for example, with the most recent advanced IMRT approaches are seen with the daily and weekly optimal fractionation window of around 10 Gy, whereas a 5–10 GyE ion therapy total dose equivalent boost is possible with a low-
LET treatment round-up or using boron ions [
17]. The resultant increase in complication-free cure is likely to be as much as 25% and more for many tumor sites and allow
apoptotic–senescent Bragg Peak molecular light ion radiation therapy (
Figure 3b and
Supplement)!


