1. Introduction
Lung cancer is one of the most frequently diagnosed cancers with a high mortality rate. There are an estimated 2 million new cases and 1.76 million deaths each year. Among all types of lung cancers, non-small-cell lung cancer (NSCLC) accounts for approximately 75–85%. The major cause of NSCLC is the activation of mutations in the epidermal growth factor receptor (EGFR) [
1]. EGFR belongs to the single-pass transmembrane tyrosine kinase receptor (TKR), which is involved with the signaling transduction of more than 200 intracellular reactions [
2].
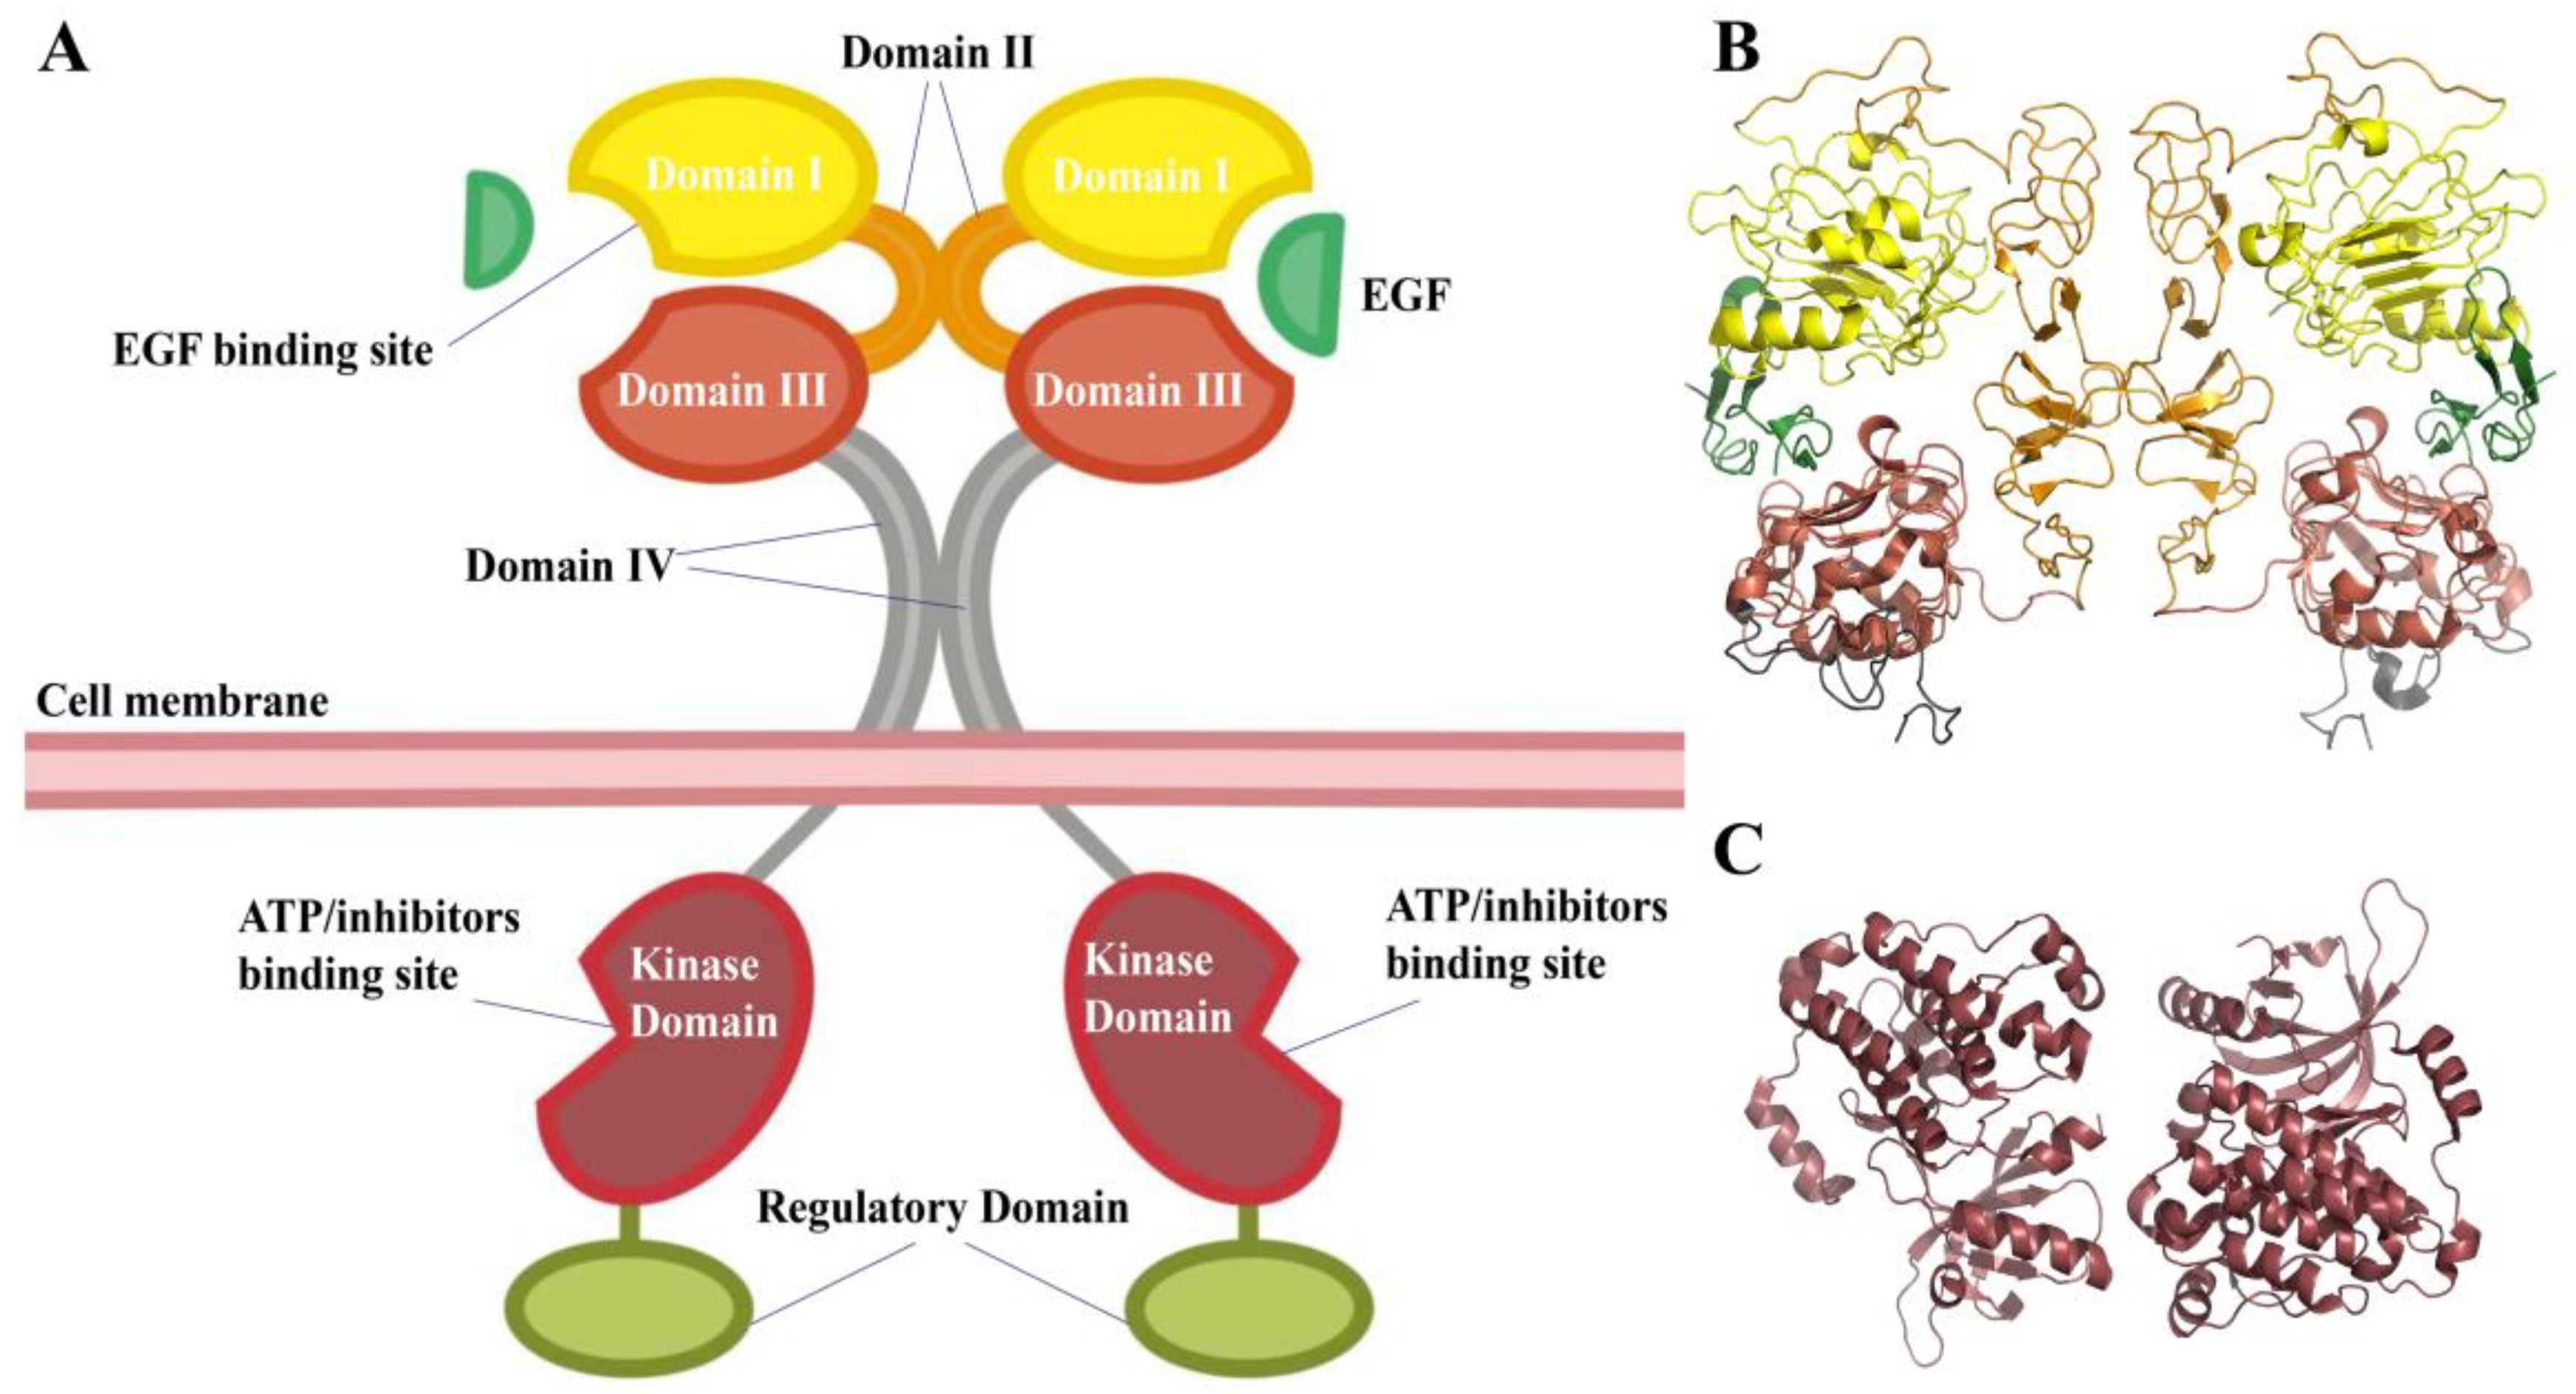
From extracellular to intracellular, the EGFR consists of a sizable extracellular region with four domains (
Figure 1), a trans-membrane region, a kinase domain, and a C-terminal regulatory region. The extracellular areas’ domains I and III are in charge of ligand binding. The cysteine-rich domains of domains II and IV are conducive to EGFR dimerization [
3]. The receptor will change from the tethered autoinhibited conformation to an extended activated state once it binds with the activating ligand, which aids in the dimerization of the receptor. Two kinase domains approach and phosphorylate each other as the dimerization process continues, and they subsequently recruit and phosphorylate more proteins to relay cascade signals that control gene expression, the cell cycle, and proliferation [
2].
The majority of the EGFR gene’s oncogenic mutations are located in exons 18–21. They settle in the ATP-binding pocket and will change the spatial structure of the kinase domain, causing EGFR kinase to independently and continuously activate the ligand. Amino acid deletion in exon19 (del19) and point mutation in exon 21 (L858R) make up 85% of EGFR mutant lung cancers [
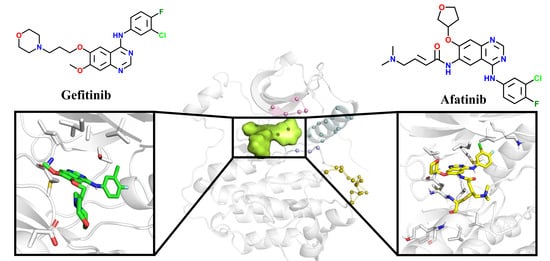
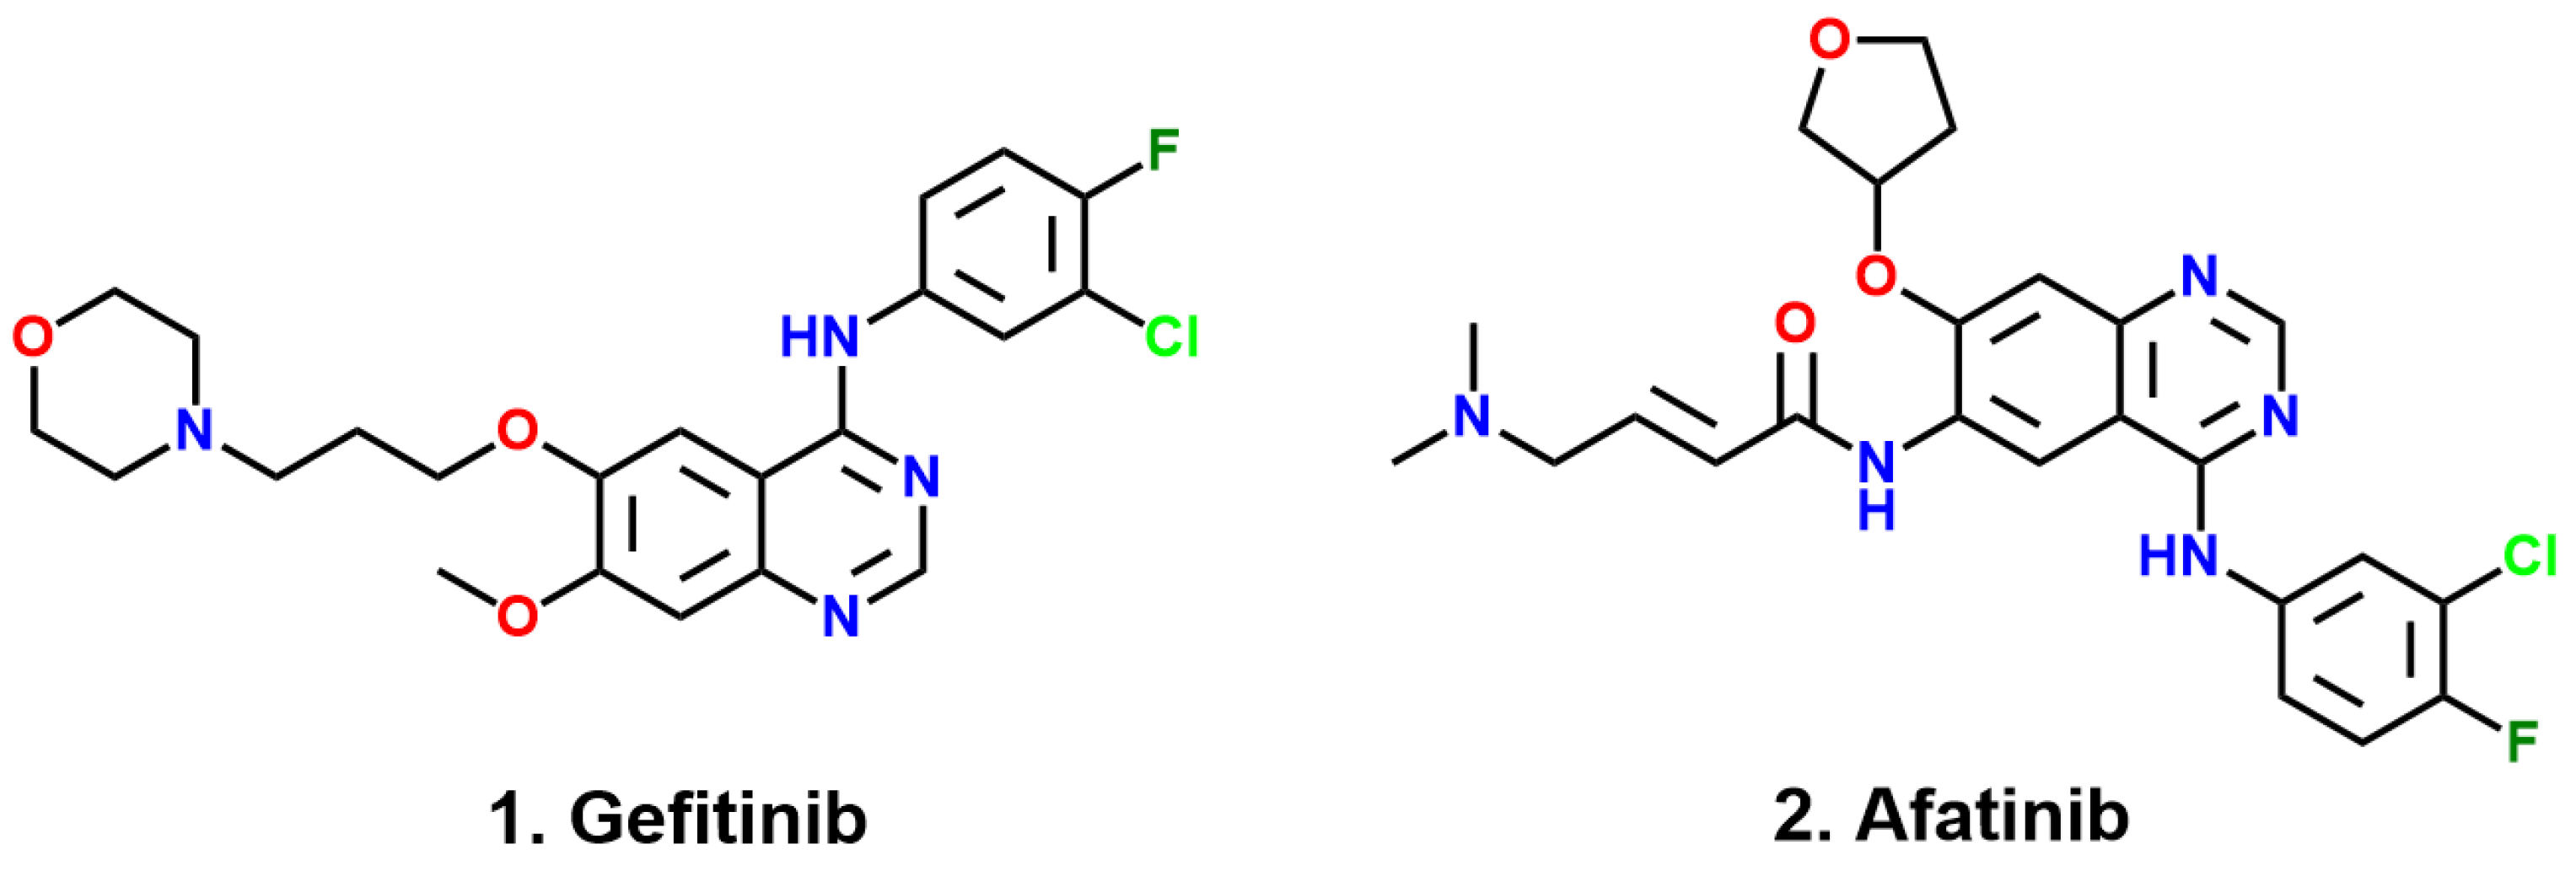
4]. The first-generation EGFR TKI, Gefitinib [
5,
6,
7], binds non-covalently to the ATP binding pocket of EGFR (
Figure 2), successfully inhibiting its activity and then blocking downstream signaling. Other first-generation drugs, such as Erlotinib [
8], are widely used in the clinical treatment of advanced non-small cell lung cancer, and the emergence of first-generation drugs has greatly encouraged people to explore targeted drugs for cancer treatment. However, more than half of patients harboring L858R/T790M double mutants develop resistance to Gefitinib. The second-generation medication Afatinib [
9,
10] is used to suppress EGFR with L858R/T790M double mutations following the failure of Gefitinib. It contains an acrylamide moiety to act as a Michael acceptor to interact with C797, forming an irreversible covalent bond. Why can Gefitinib inhibit the L858R mutant but not the L858R/T790M mutant? Why can Afatinib inhibit mutants harboring L858R/T790M? These issues remain obscure.
Here, we build four models to uncover these problems, including Gefitinib with L858R (G-SM system), Gefitinib with L858R/T790M (G-DM system), Afatinib with L858R (A-SM system), and Afatinib with L858R/T790M (A-DM system). The interactions between Gefitinib and SM, as well as DM, are first explored. The binding free energies are obtained by MM-PBSA. Critical residues contributing to the interactions are highlighted by energy decomposition. According to our MD simulations, the role of M790 is examined, and a theory for why Gefitinib loses its effectiveness in the G-DM system is eventually put out. When comparing the A-DM and G-DM systems, the binding energy and local induce-fit effect show more favorable conformations in the A-DM system, demonstrating the structural superiority of Afatinib in the binding pocket of DM. These results help to understand the interactions between EGFR and its inhibitors and shed light on designing and developing novel EGFR inhibitors and TKIs for lung cancer.
2. Materials and Methods
2.1. System Preparation
The structure of L858R EGFR with Gefitinib co-crystal structure (single mutant system, G-SM) was retrieved from the Protein Data Bank (PDB ID: 2ITZ) [
11], and the unresolved parts of the protein structure were reconstructed by SWISS-MODEL [
12] by homology modeling, which is an online web server for taking the protein sequence and correspondent structure template to build the 3D model of the sequence. 2ITZ was used as the template, and several model results were obtained. We chose the best one with the Global Model Quality Estimate (GMQE) value equaling 0.88 and the QMEANDisCo Global score [
13] equaling 0.82 ± 0.05. The structures of 2ITZ and the model can be aligned well in PyMol [
14]. The system of G-DM was obtained by mutating the T790 in the G-SM system to M790 in PyMol, keeping the pose of Gefitinib at the binding site. The clashed structure was refined by Discovery Studio. The system of Afatinib with T790M/L858R EGFR (A-DM) was constructed by replacing the Gefitinib in the DM system with Afatinib, referring to the position and pose of Afatinib in PDBID:4G5J [
10]. The protonated state of each residue of the protein was determined by the PDB2PQR web server [
15].
2.2. Preparation for Ligand Parameters
Gefitinib and Afatinib capping with NME (Aminomethyl ending) and ACE (Acetyl ending) was optimized, and the electrostatic surface potential (ESP) at the level of M062X [
16]/6-31G* was calculated [
17]. The bonds, angles, dihedral angles, and van der Waals radii parameters for Gefitinib and Afatinib without capping termini were generated by a two-step restrained electrostatic potential (RESP) [
18] charging fitting method embedded in the Multiwfn [
19] software (Kein Research Center for Natural Sciences, Beijing, China) and Antechamber [
20] package implemented in AMBER 18 [
21].
2.3. MD Simulations
After preparing the protonated protein and ligand parameters, we performed molecular dynamics. The simulations of the G-SM, G-DM, A-SM, and A-DM systems were executed through the AMBER 18 program suite with the parameters of the ff14SB force field [
22]. All complexes were solvated in a box of TIP3P water. In order to make systems in a charge-neutralized state, we added seven sodium ions in each system. The preparation steps before production simulation were minimization, heating, and equilibration. To remove inappropriate atomic collisions, a two-step minimization process for the system was performed, the first step was to remove the collision of all water molecules, and the second step was to avoid the protein and ligand’s inappropriate collision. Then, the systems were heated from 0 K to 300 K in 100 ps at the heating step. In the equilibrated step, the systems were put into constant pressure and temperature mode (NPT) for 200 ps to ensure the system was at the correct density. Finally, 100 ns classical MD simulations were carried out on all three systems.
In the simulation process, we introduced the particle mesh Ewald (PME) [
23] method for long-range electrostatic interactions and the SHAKE algorithm [
24] for fixing bonds and angles involving hydrogen atoms, respectively.
2.4. Binding Free Energy Calculations
For calculating the binding free energy between inhibitors with SM and DM, we introduced the molecular mechanics generalized Born surface area (MM-PBSA) method implemented in the python program MMPBSA.py [
25].
In total, 150 snapshots extracted from 70–100 ns trajectories were used to calculate the binding free energies. We decomposed the energy into each residue to search for critical residues which are important for inhibitor binding.
According to the above formulation, we calculated the binding free energy of inhibitors with different mutants, in which Gcomplex, Gprotein, and Gligand represent the free energy of the complex, protein, and ligand, respectively.
2.5. Analysis
In this study, all trajectories were analyzed by the
cpptraj module [
26] in AMBER 18. The beginning structure and clustered structure were chosen for visualization by PyMol. The root mean square deviation (RMSD) was calculated to show the deviation of the system from its beginning structures. Furthermore, root mean square fluctuation (RMSF) was calculated on the alpha carbon to show the fluctuation of the system, giving us an insight into how the structure moves. The distance command was used to reflect the state of relative movements of two specific residues. To gather data on hydrogen bonds between residues, the hbond command was used. The cluster command was carried out to obtain several dominant cluster structures from all structures in the simulation trajectories.
3. Results and Discussion
3.1. Computational Models of Gefitinib with EGFR Mutants
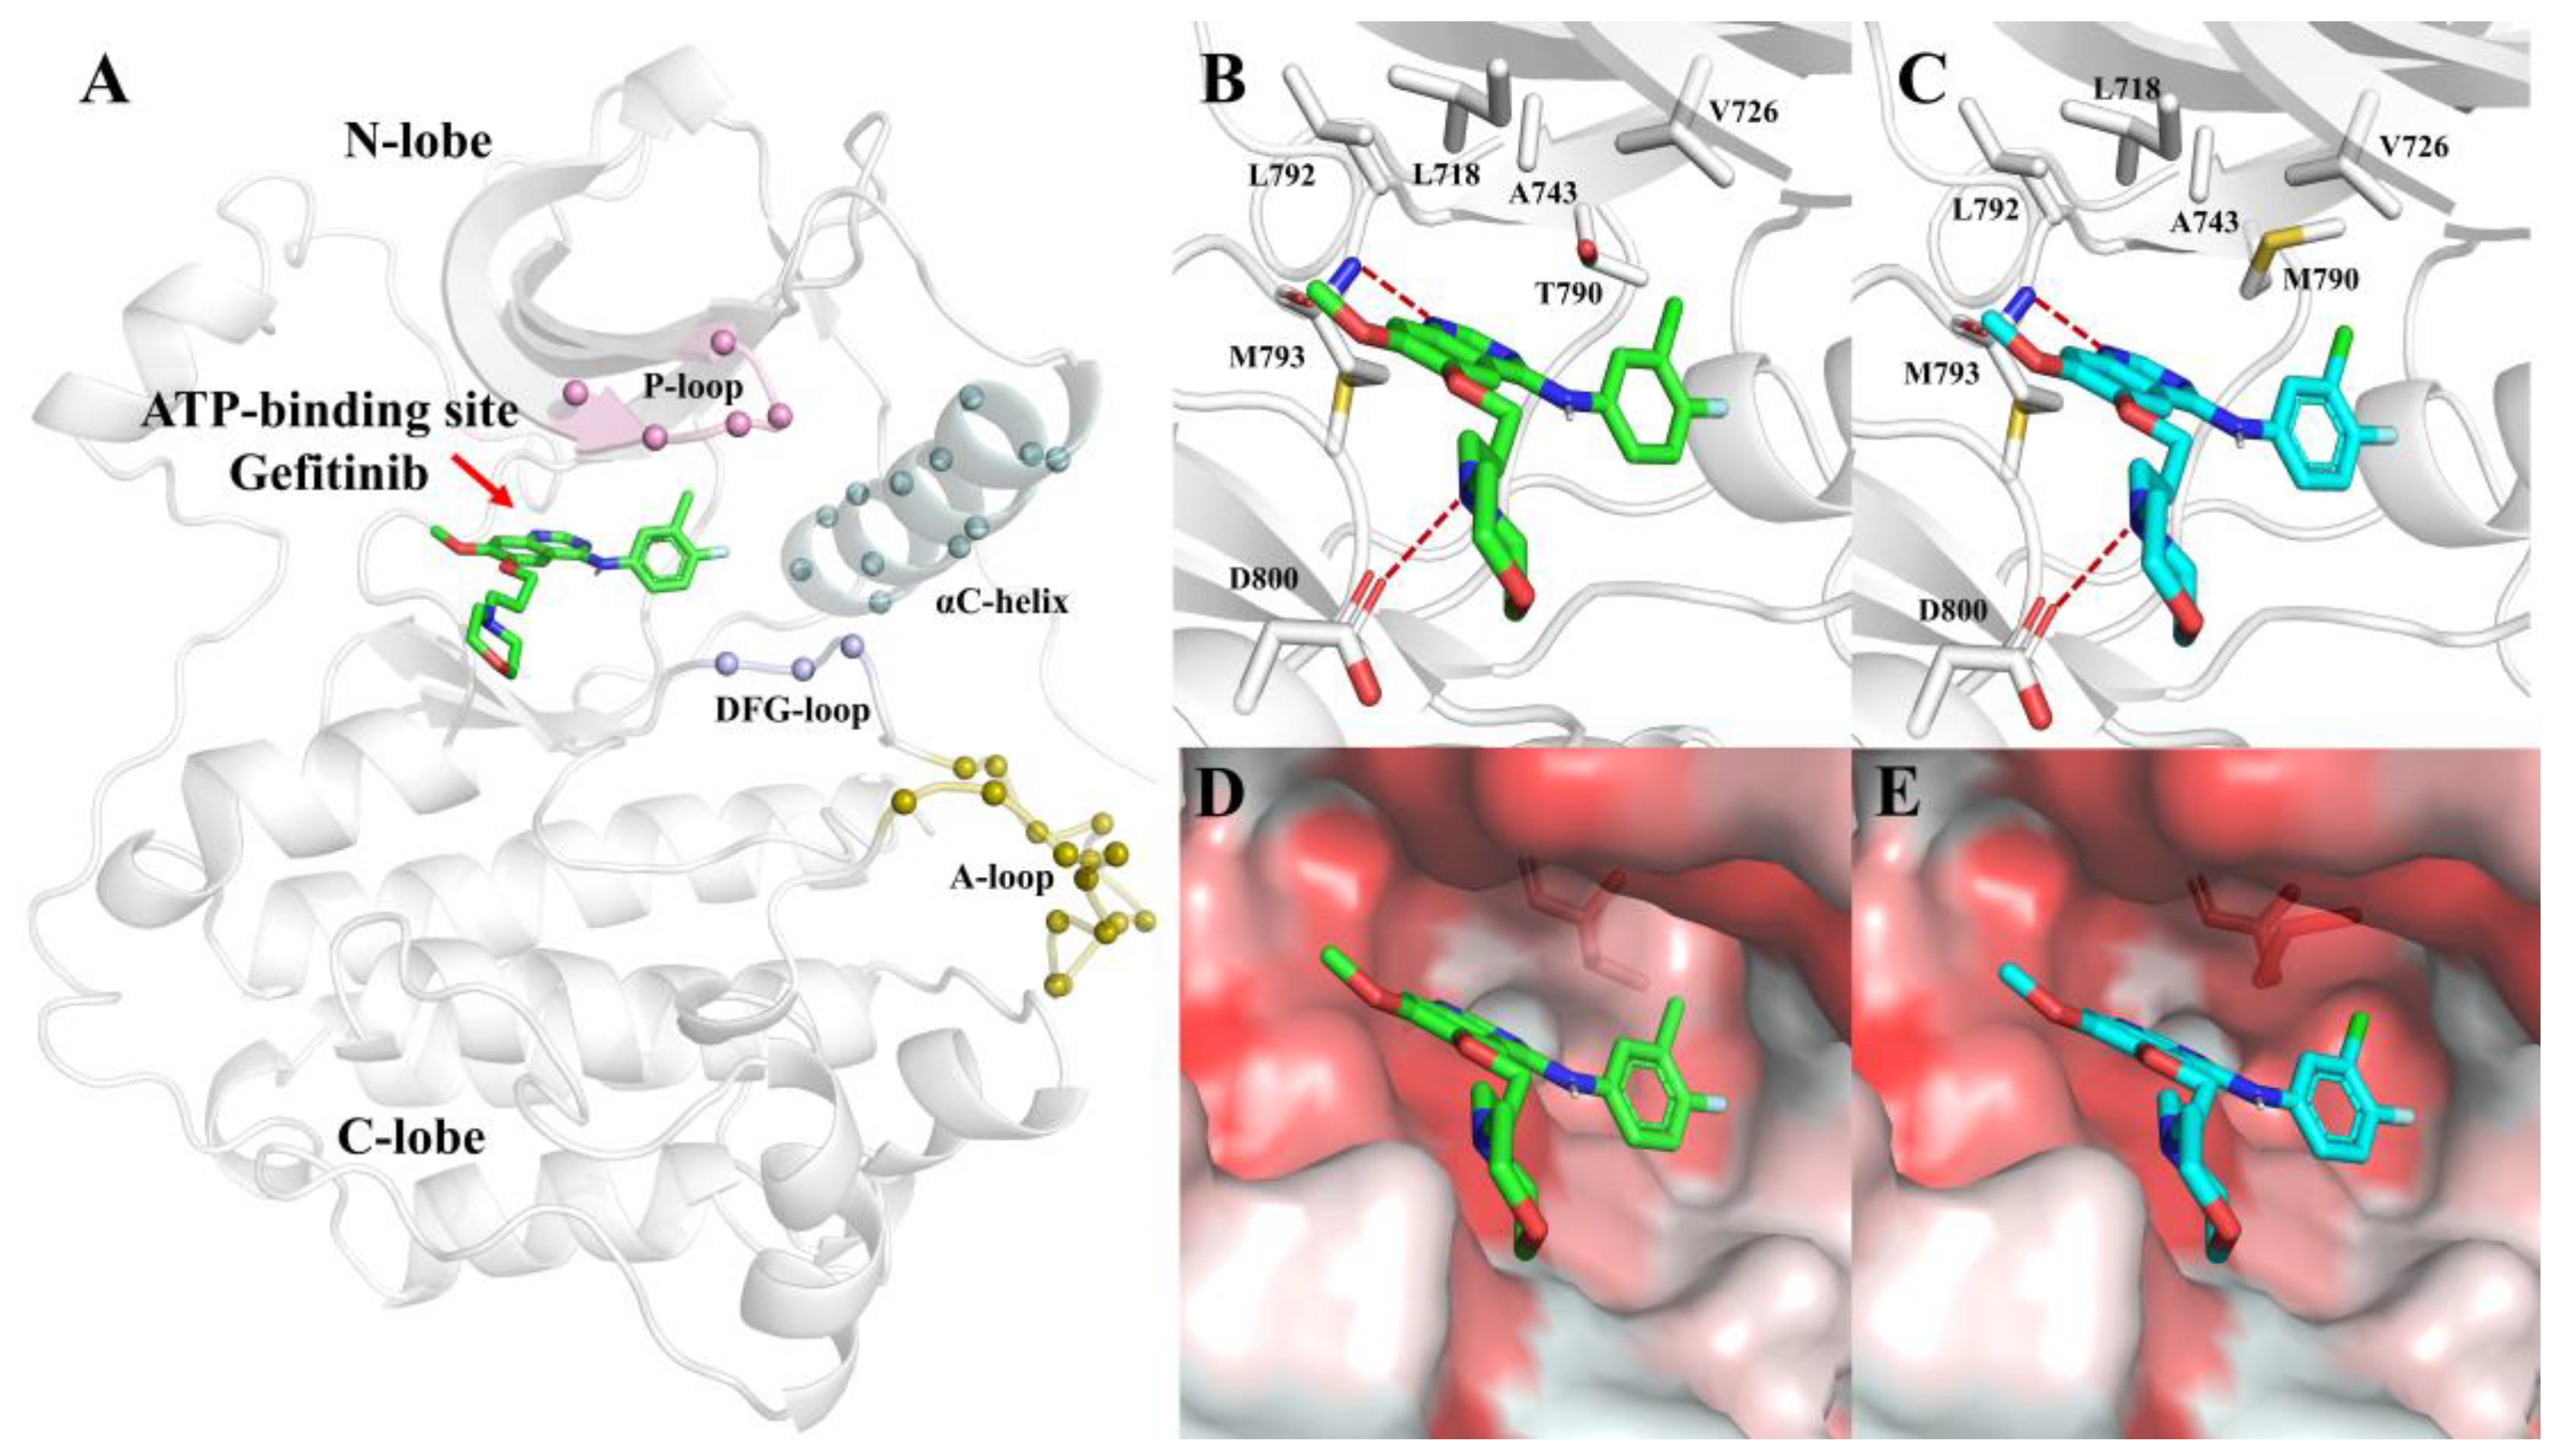
The kinase domain accounts for approximately 50% of the EGFR intracellular portion, which usually consists of three sections, including the NH
2-terminal lobe (N-lobe), the COOH-terminal lobe (C-lobe), and the ATP-binding pocket located in the cleft between the two lobes (
Figure 3A). The ATP-binding pocket is surrounded by a highly conserved Asp-Phe-Gly loop (DFG-loop), a conserved regulatory αC-helix, a glycine-rich nucleotide phosphate-binding loop (P-loop), and an activation loop (A-loop). Inhibitors compete with ATP to bind to the ATP-binding pocket [
27].
To investigate the structural properties of the binding pocket with inhibitors, we built two models, G-SM and G-DM, on behalf of Gefitinib with L858R mutation in EGFR and L858R/T790M mutation, respectively, retaining Gefitinib at the same position. For both systems, we found that the binding pocket was composed of lots of hydrophobic residues, such as L718, V726, A743, L792, and M793. Furthermore, M793 and D800 formed hydrogen bonds with Gefitinib, which stabilized the Gefitinib at the binding pocket (
Figure 3B,C). Comparing the pocket of SM and DM, after mutating T790 to M, the pocket became smaller because of the larger side chain of M. Furthermore, the binding pocket slightly changed from hydrophilic to hydrophobic (
Figure 3D,E).
To analyze the conformational changes, three times 100 ns MD simulations for G-SM and G-DM systems were performed, respectively. The root mean square deviation (RMSD) of all trajectories was checked first, and the tiny fluctuation of the RMSD value represented that both systems had reached their equilibrium states (
Figure S1), and all trajectories could be used for further analysis.
3.2. Binding Free Energy and Critical Residues in G-SM and G-DM Systems
We calculated the binding free energies of G-SM and G-DM, respectively, using the molecular mechanics Poisson Boltzmann surface area (MM/PBSA) approach to gain an understanding of why Gefitinib can inhibit SM but not DM [
28]. The results indicate that the binding free energy is 33.5 kcal mol
−1 in the G-SM system, while it decreases to 29.4 kcal mol
−1 in the G-DM system. Just as expected, Gefitinib binds more tightly with SM than DM, which, to some extent, can be used to explain why patients with DM are resistant to Gefitinib [
4].
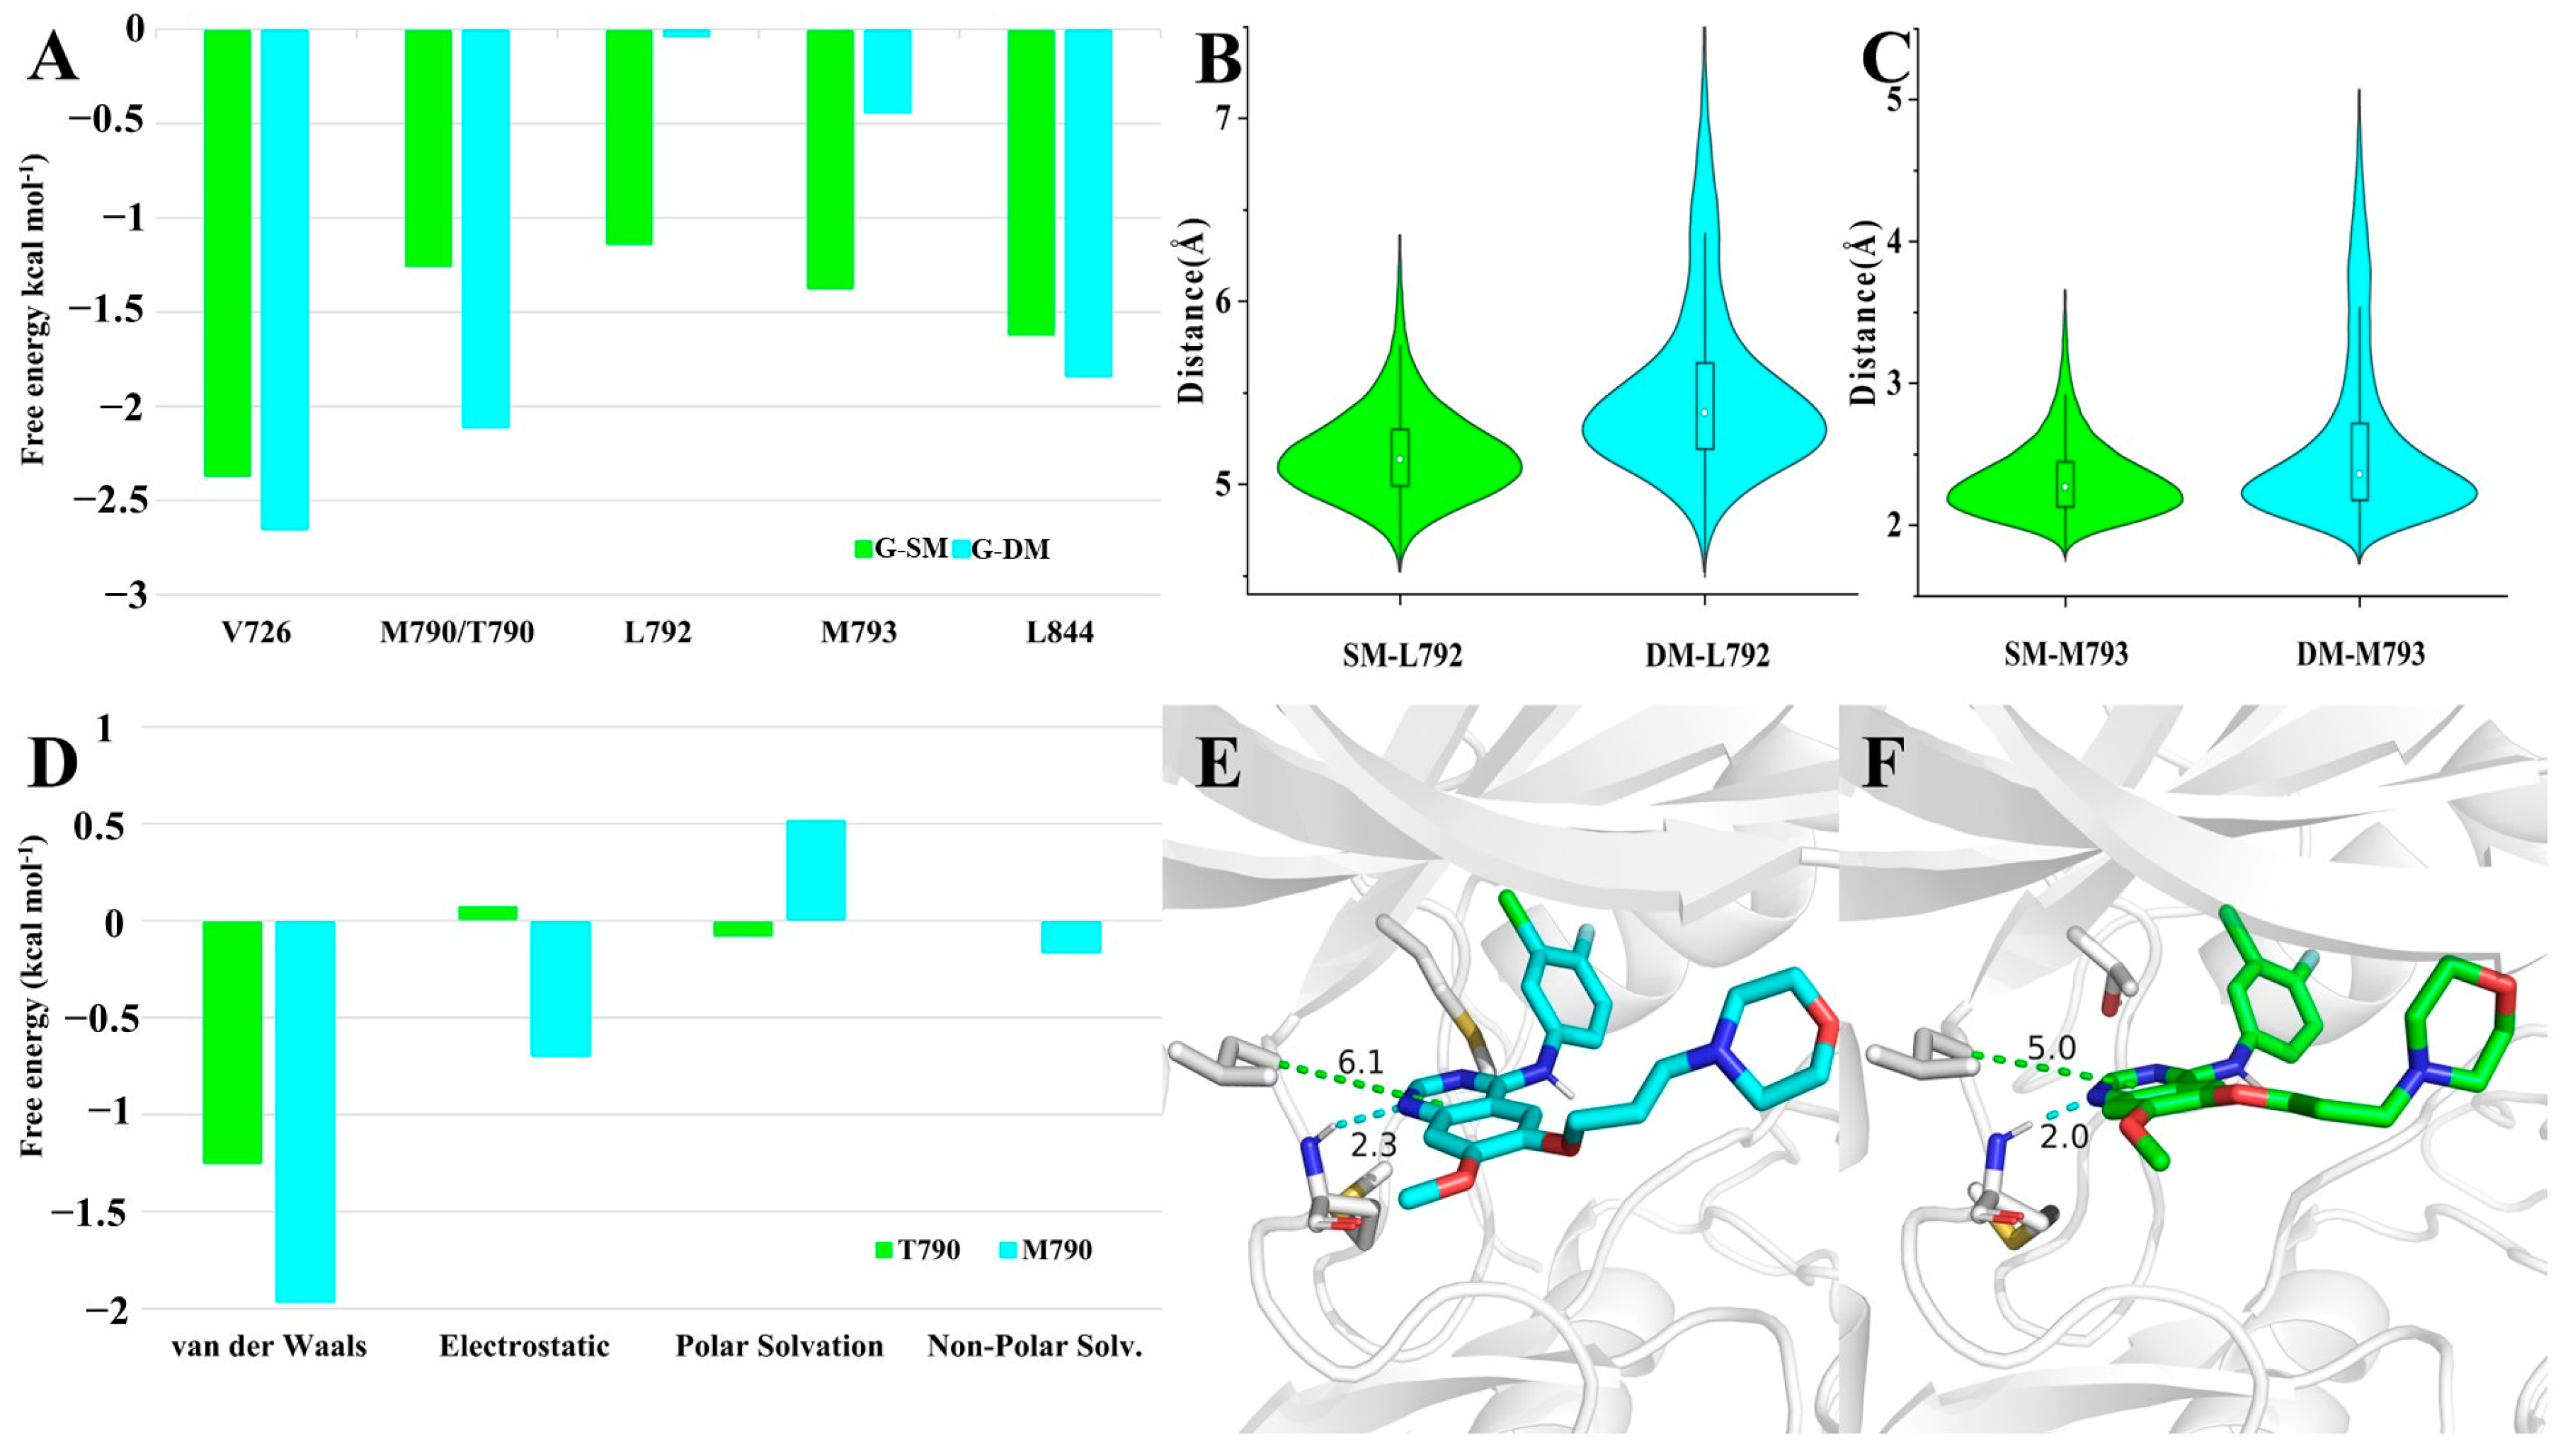
To further identify the critical residues for Gefitinib binding, we decomposed the energy into each residue. There were five residues contributing more than 1.0 kcal mol
−1 in any of the G-SM and G-DM systems. They were thought to play an important role in binding with the competitive inhibitor Gefitinib. The binding free energy contributed by V726 and L844 was almost the same in both systems. The former was approximately 2.5 kcal mol
−1, and the latter was nearly 1.6 kcal mol
−1. L792 and M793 in the G-SM system significantly contributed more than that in the G-DM system, as expected. The binding energy for L792 in the G-SM system was 1.1 kcal mol
−1, while that of L792 in the G-DM system was almost 0.0 kcal mol
−1. Regarding M793, the binding energy in the SM system was 1.4 kcal mol
−1, while it was 0.4 kcal mol
−1 in the G-DM system. Unexpectedly, we were shocked to learn that T790 in the G-SM system had a binding energy of 1.3 kcal mol
−1 and M790 in the G-DM system had a binding energy of 2.1 kcal mol
−1 (
Figure 4A).
Just as we described above, T790/M790, L792, and M793 had great differences in contributing binding free energy in G-SM and G-DM systems. To find the reasons behind that, we examined the differences in their movement behaviors. L792 bearing a large hydrophobic side chain mainly stabilized the inhibitor by hydrophobic interaction. The distance can be used to represent the strength of the hydrophobic effect. We measured the distance between the Cα of L792 and the geometry center of Gefitinib’s pyrimidine ring. The average distance between L792 and Gefitinib was 5.1 Å in the G-SM system, while it was 5.5 Å in the G-DM system. As for M793, we observed a hydrogen bond between M793 and Gefitinib. The hydrogen bond is important for M793 to stabilize the Gefitinib. The distance fluctuation of the hydrogen bond can also represent the strength of their interaction. The average distance between H1 and N3 was 2.3 Å in G-SM systems, while it increased to 2.6 Å in the G-DM system (
Figure 4B,C). Comparison of their representative clustered structures also clearly showed that the distances between Gefitinib and residues M793 and L792 were farther in the G-DM system than those in the G-SM system (
Figure 4E,F). In conclusion, we found that regardless of hydrophobic or hydrogen bonding interactions, the key distance between residue and Gefitinib was farther in the G-DM system than that in the G-SM system, which led to a smaller binding energy in the G-DM system.
Last but not least, beyond our expectations, M790 in the G-DM systems performed better in binding Gefitinib than T790 in the G-SM system. We further decomposed the binding energy contributed by residue 790 into four items, including van der Waals, electrostatic, polar solvation, and non-polar solvation. Among all these items, van der Walls, electrostatic, and non-polar solvation contributed by M790 in the G-DM system were larger than that contributed by T790 in the G-SM system. On account of M790 bearing a large hydrophobic chain than T790, it was intuitive that van der Walls, electrostatic, and non-polar solvation contributed more to the G-SM system (
Figure 4D).
3.3. Conformational Changes in G-SM and G-DM Systems
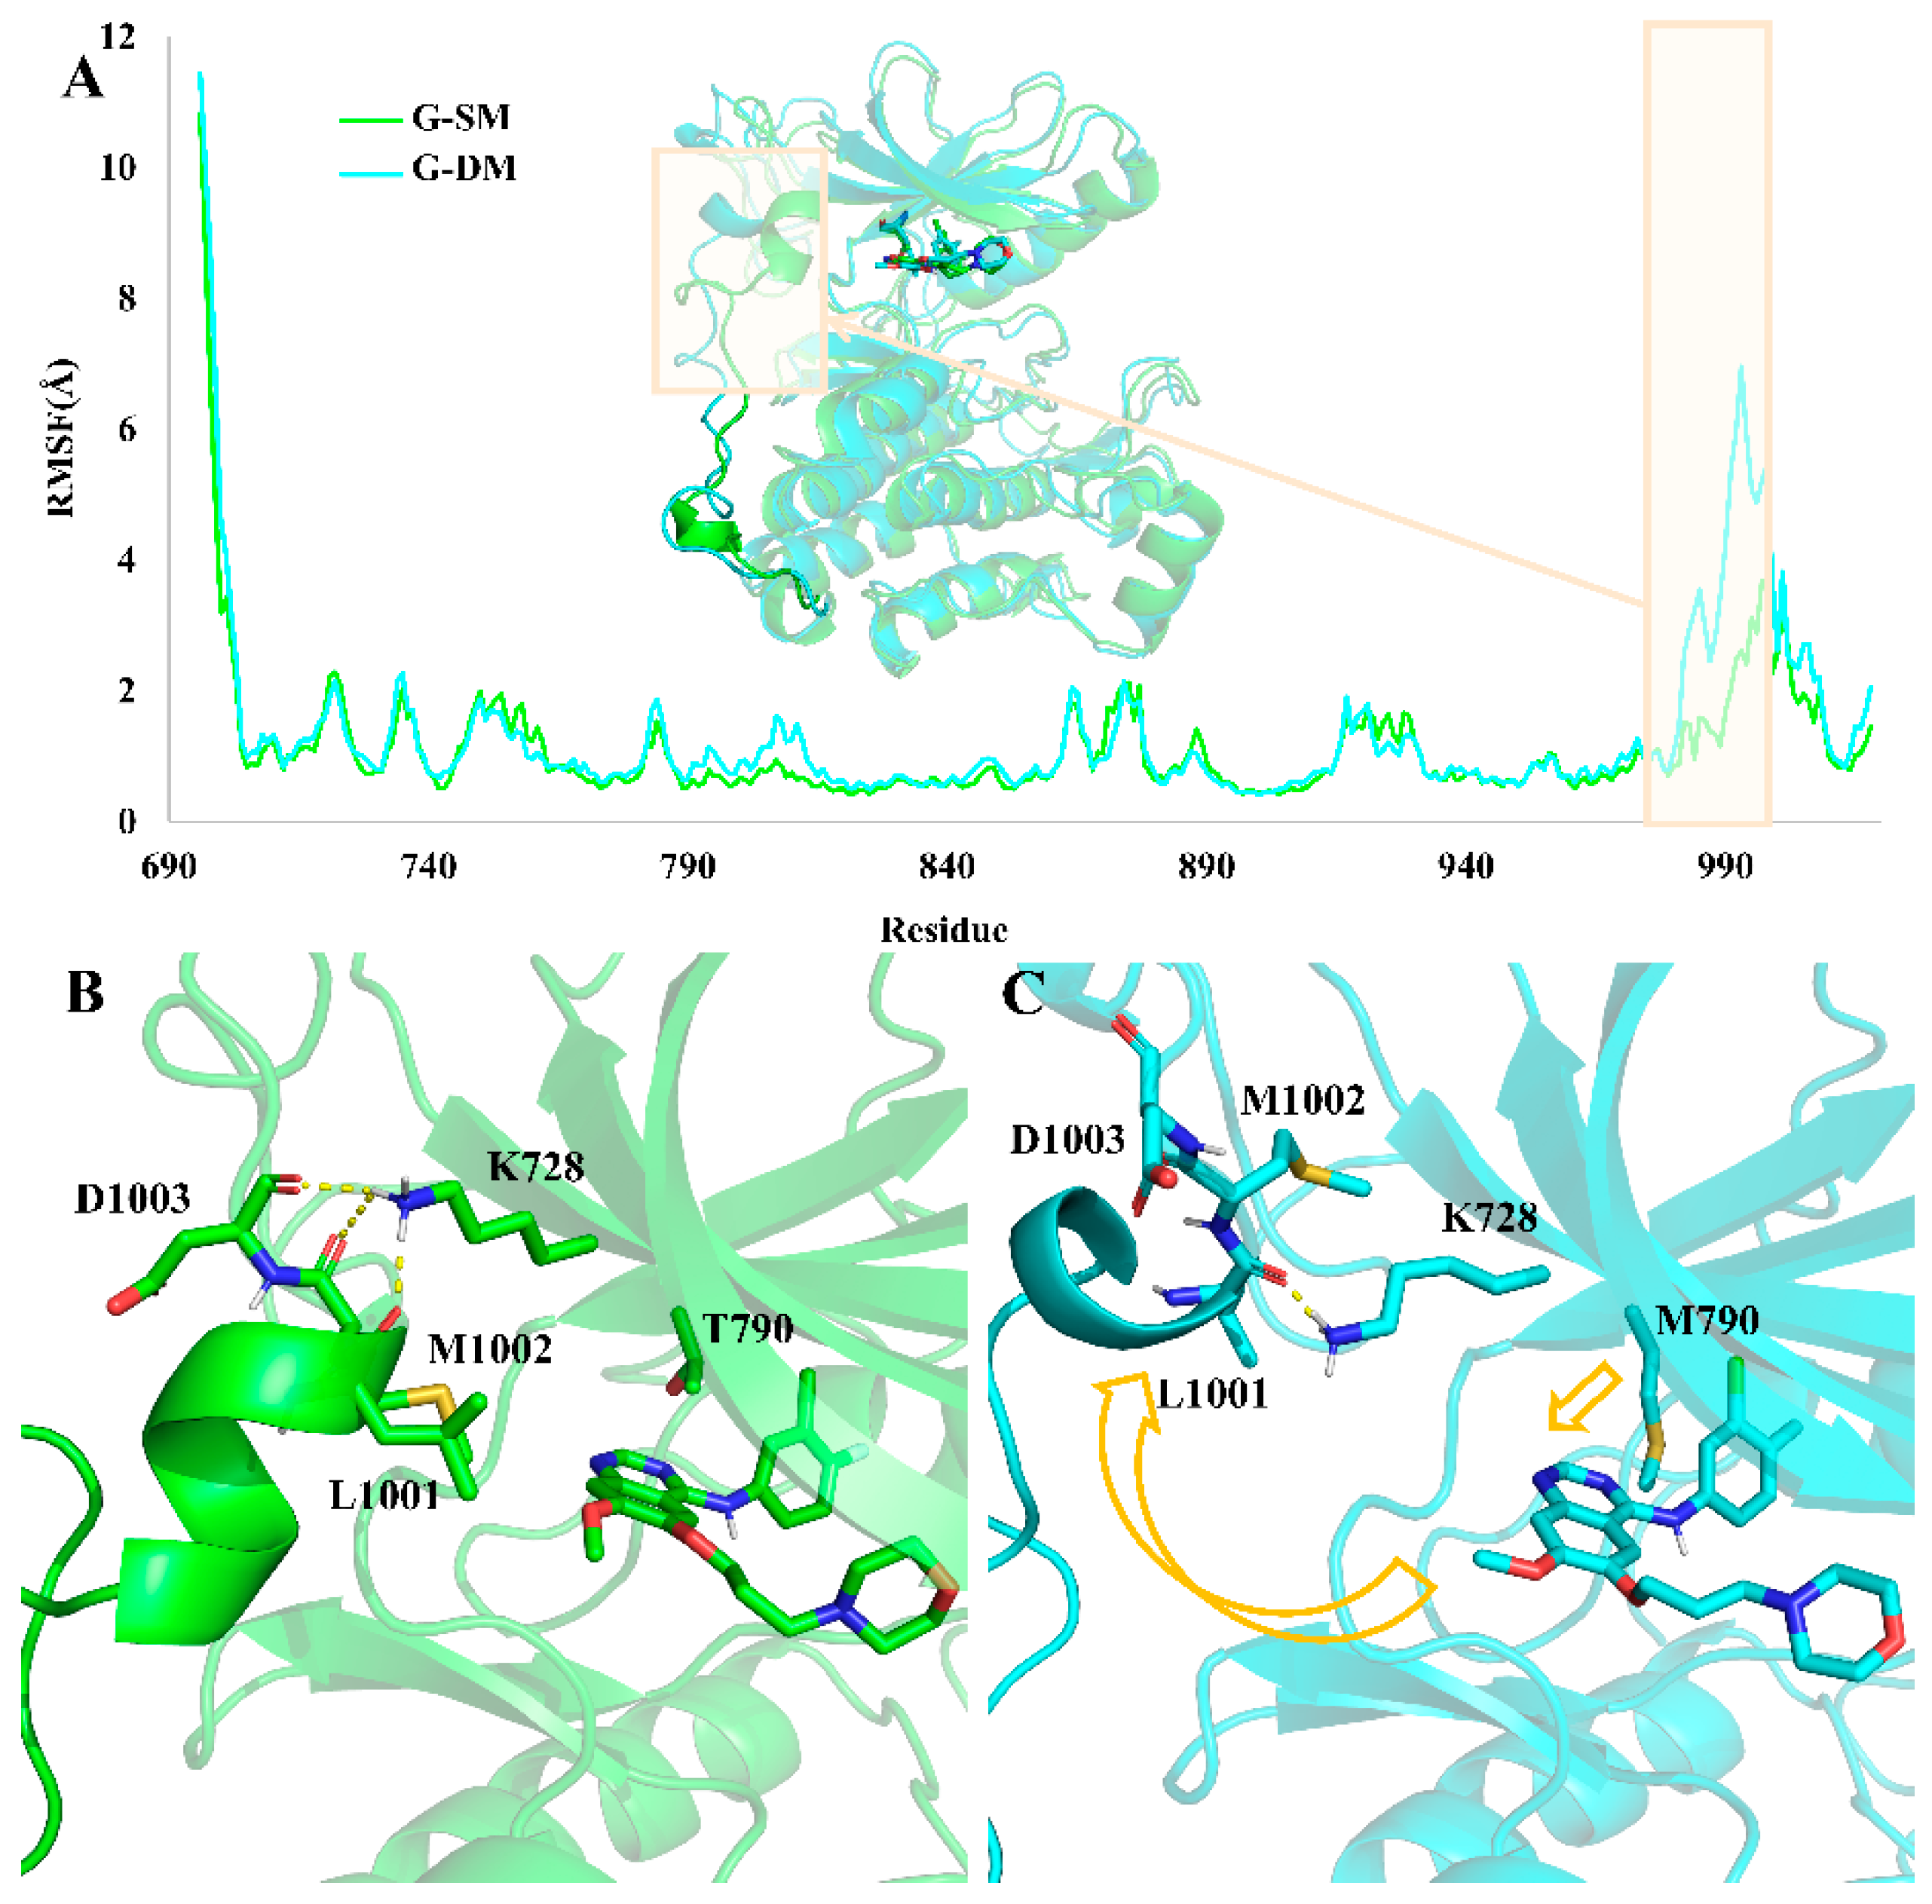
Root mean square fluctuation (RMSF) is commonly used to assess the flexibility of specific regions. Here, in order to compare the motion and structural differences in the two systems, we calculated the RMSF values in each of them. Comparing the RMSF value in the G-SM and G-DM systems, we found that the residues from 980–1000 were much more flexible in the G-DM system than in the G-SM system (
Figure 5A).
Through clustering analysis, we obtain the representative structure of the G-SM and G-DM systems. The aligned representative structure also demonstrated that the major difference between the G-SM and G-DM systems was located at residues from 980–1000 (
Figure 5A). In the G-DM system, M790 bearing a larger side chain will push the Gefitinib out of the pocket, which also causes Gefitinib to have a farther distance to interact with L792 and M793, thus having a weaker binding affinity (
Figure 4). Then, the shift Gefitinib will clash and push away the α-helix-loop region located at residues from 980–1000 next to the pocket, making the pocket volume as large as 2813 Å
3. While T790 bearing a smaller side chain can hold the Gefitinib properly, the α-helix-loop region next to the pocket also plays an important role in maintaining the pocket volume at an appropriate size of 2476 Å
3 to accommodate the Gefitinib.
Hydrogen bond analysis demonstrates K728 can form hydrogen bonds with the main chain of D1003, M1002, and L1001 in the G-SM system, which is important for keeping the α-helix-loop region in place to maintain a proper size pocket. In the G-DM system, the Gefitinib was pushed out of the pocket on account of the larger side chain of the M790. Then, the α-helix-loop region was pushed aside. At the same time, the hydrogen bond between K728 with the main chain of D1003 and M1002 was disrupted (
Figure 5B,C).
3.4. Structural Characteristics of Afatinib with EGFR Mutants (A-SM and A-DM System)
All trajectories of A-SM and A-DM systems reached stability (
Figure S2). Afatinib was covalently bound to the C797 in both A-SM and A-DM systems. The binding energy of A-SM and A-DM systems was 56.8 kcal mol
−1 and 62.0 kcal mol
−1, respectively, from which we can conclude that Afatinib will achieve better performance in inhibiting DM than SM. Furthermore the binding energy of A-DM was much higher than the G-DM system, 29.4 kcal mol
−1, which means Afatinib can bind much more tightly than Gefitinib in the pocket of DM. Once the pocket was occupied by Afatinib, there was no space for ATP binding, which terminated the downstream signal pathway.
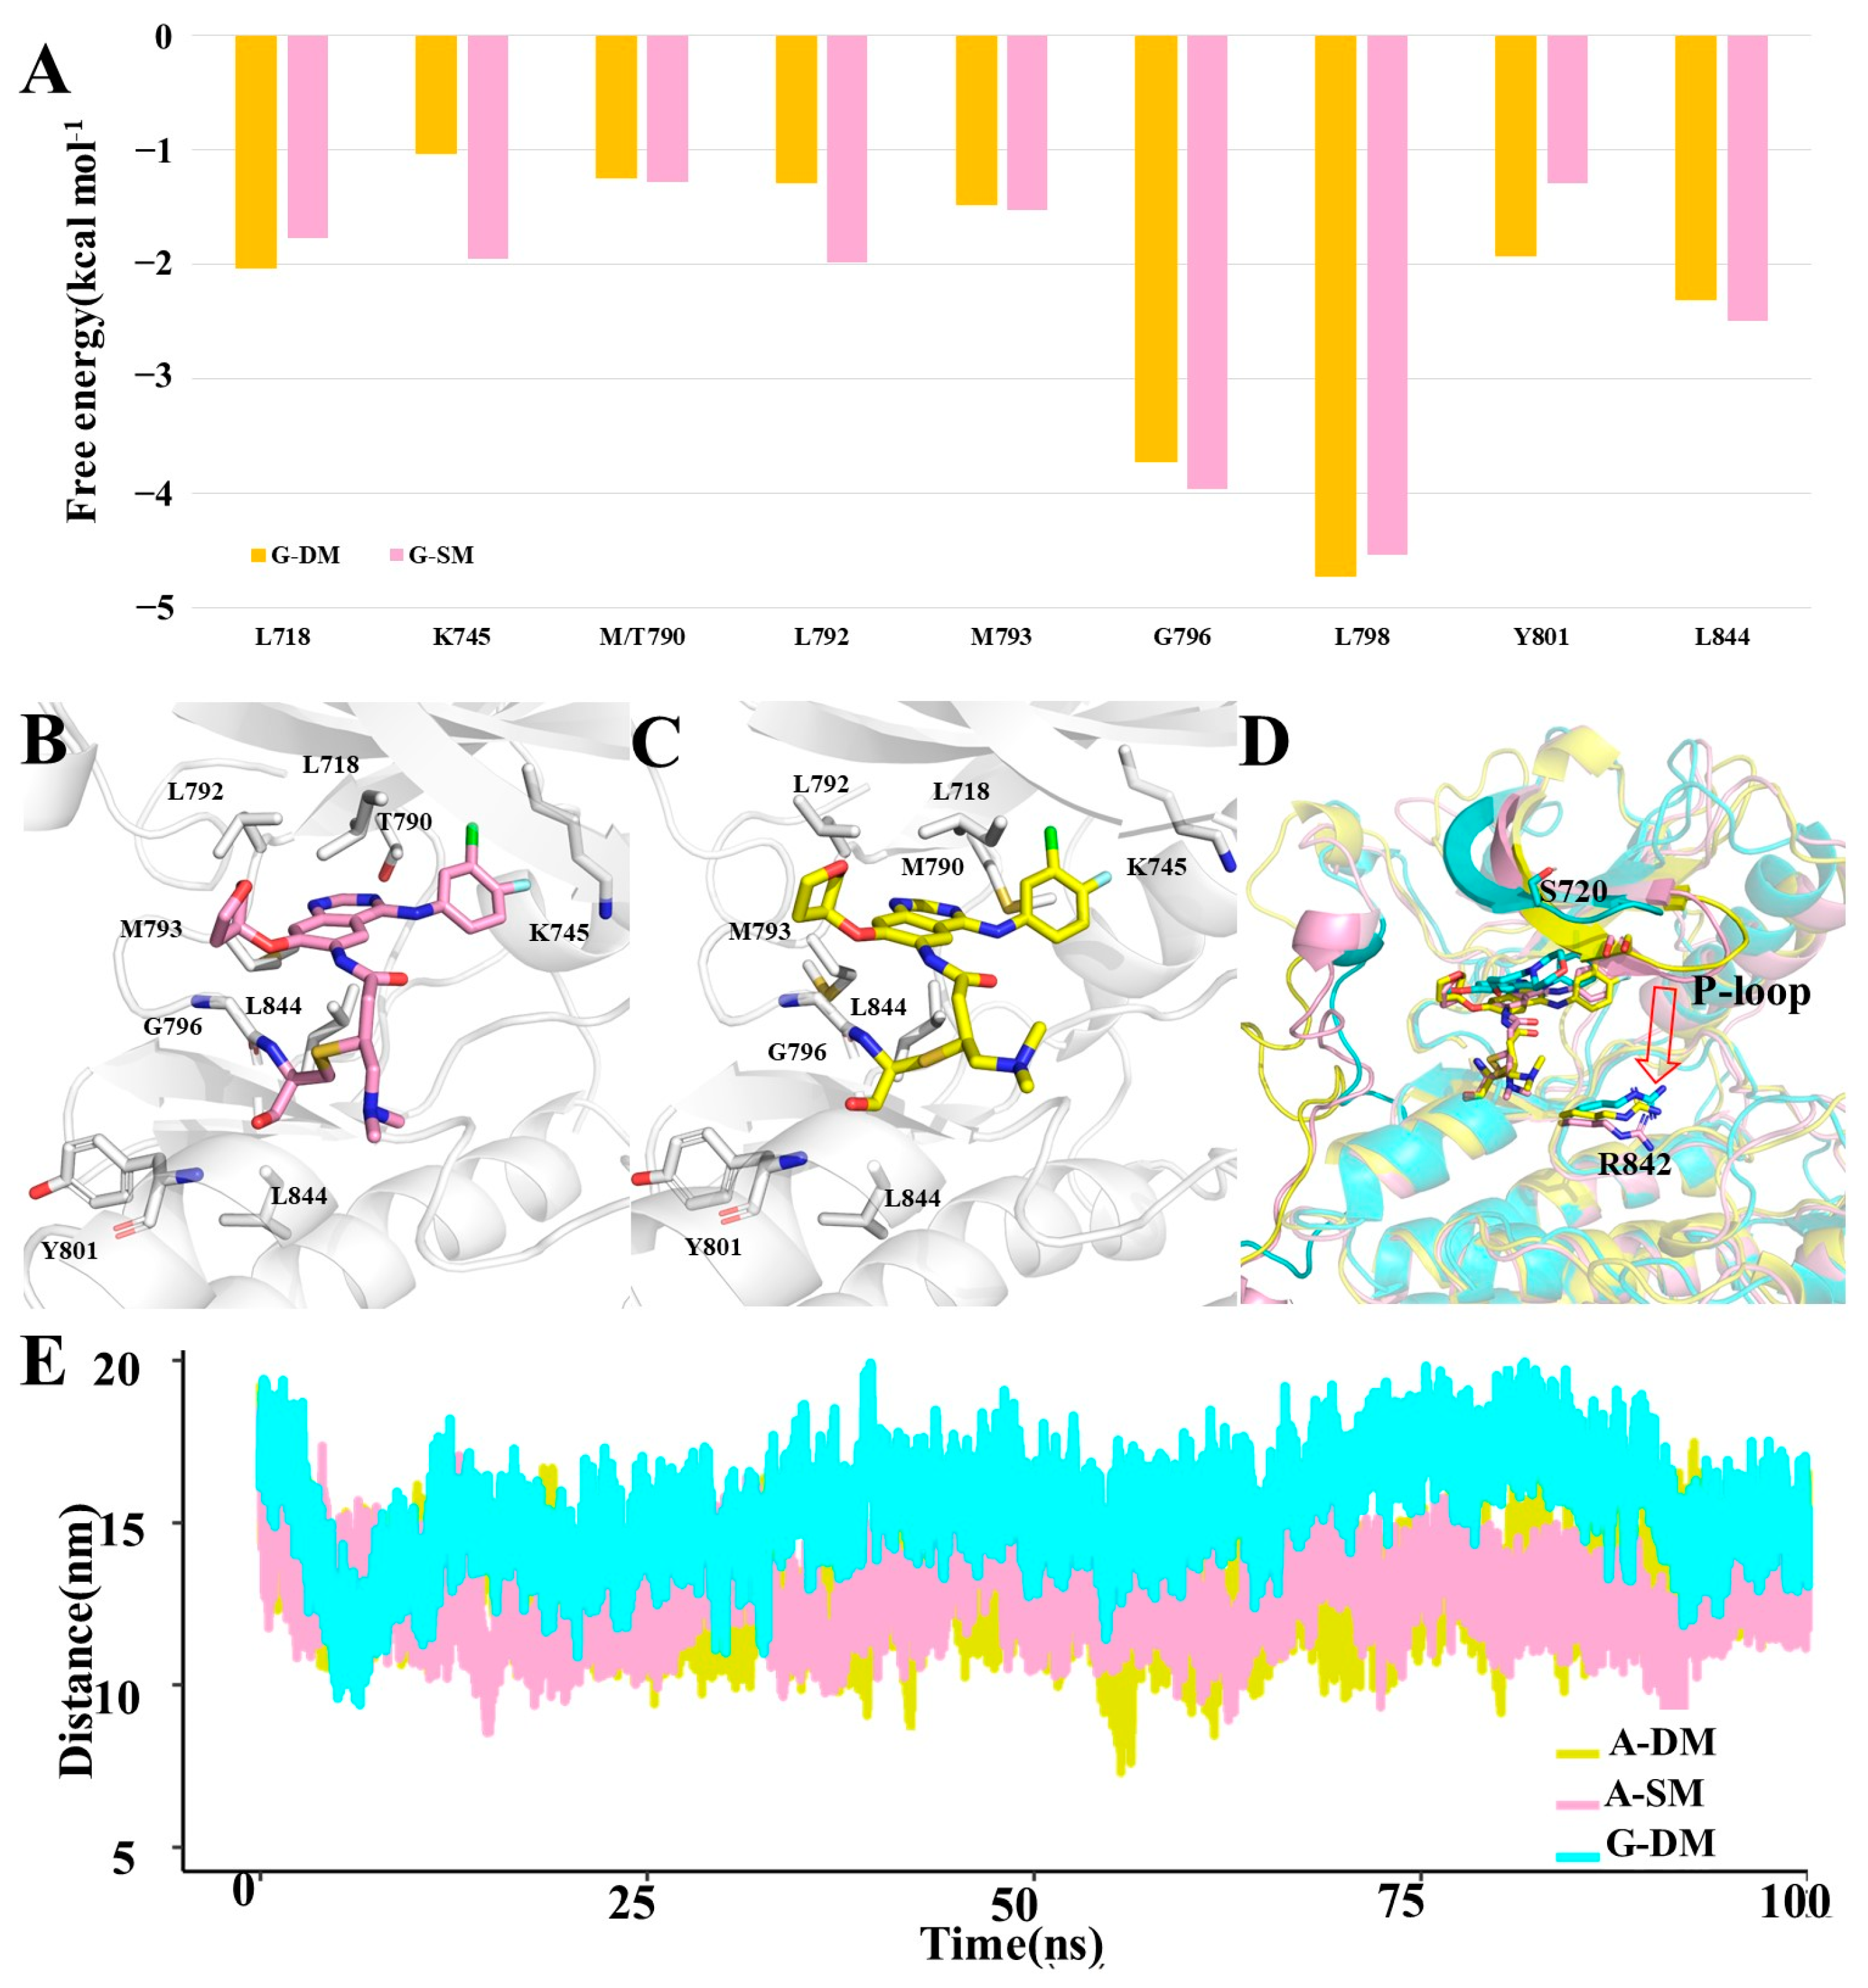
We further decomposed the binding energy into each residue and then found key residues that contributed more than 1.0 kcal mol
−1 in both A-SM and A-DM systems. Here, there was a total of nine residues, apart from T/M790, L792, and M793, which were also key residues for Gefitinib binding, including L718, K745, G796, L798, Y801, and L844 (
Figure 6A,B).
From a structural perspective, T790, known as the gatekeeper [
27], is situated in the deepest area of the pocket. Gefitinib and Afatinib will both be pushed toward the pocket’s entrance after mutating T790 to M790 in the G-SM, A-SM, and A-DM systems. Both Afatinib and Gefitinib will push the α-helix-loop region aside in all three systems, which will create more opportunities for Gefitinib out of the pocket in the G-SM system. However, Afatinib stays relatively stable in the pocket than Gefitinib because it is tethered to the sulfur of M797.
By comparing the G-DM, A-SM, and A-DM systems, we discovered that the P-loop in the A-SM and A-DM systems tends to move downward and therefore downsize the pocket entrance. S720 is located on the P-loop, standing on one side of the pocket entrance. R842 is located on another side of the pocket entrance. Here, we measured the distance from the center of mass of S720 to the center of mass of R842, representing the size of the pocket entrance. The average distance between S720 and R842 was 15.4 Å in the G-DM system, while that in the A-SM and A-DM system was 13.2 Å and 12.8 Å, respectively, reflecting that Afatinib can inhibit DM better (
Figure 6C,D). From all the above-mentioned distances, we concluded that the pocket entrance size of DM will be larger in the A-DM system, covering the Afatinib properly; however, this will be larger in the G-DM system, creating more chance for Gefitinib running out [
29,
30].
Last but not least, the root mean square deviation of the inhibitors can be used as an important parameter to evaluate the inhibiting performance, which usually checks how much it deviates from the reference structure. The high RMSD value represented the instability and large conformation change of the molecule. The specific ligand with high RMSD indicated that the weaker interaction discouraged it from being stable in the pocket of protein throughout the simulation period. The RMSD value for Gefitinib in the G-SM and G-DM systems was 1.9 and 2.5 Å, respectively, explaining that Gefitinib is effective in SM while ineffective in DM. Additionally, the average RMSD value for Afatinib in the A-SM and A-DM systems was 1.7 Å and 1.5 Å, respectively, demonstrating that Afatinib has a better ability to inhibit DM. Comparing the RMSD values of 1.5 Å and 2.5 Å in the G-DM and A-DM systems indicates that Afatinib can achieve better performance in inhibiting DM than Gefitinib, consistent with the experiment (
Figure S3).
4. Conclusions
In this study, four complex models, including Gefitinib with L858R (G-SM), Gefitinib with L858R/T790M(G-DM), Afatinib with L858R, as well as Afatinib with L858R/T790M (A-DM), were constructed to perform molecular dynamics to investigate why Gefitinib can inhibit SM but not DM, and why Afatinib can effectively inhibit DM, while Gefitinib cannot [
31,
32].
By comparing the system of G-SM and G-DM, we found the binding energy in the G-SM system (33.5 kcal mol−1) was much higher than that in the G-DM system (29.4 kcal mol−1), suggesting the strong interaction between Gefitinib with SM. The longer side chain of M790 in the G-DM system pushed the ligand slightly outwards, which considerably lowered the interaction of L792 and M793 with Gefitinib, even though it may contribute more to Gefitinib binding than T790 in G-SM. On account of the outwards shift of Gefitinib in the G-DM system, it pushed the α-helix region aside, which led to the pocket size being larger and further making the Gefitinib in the G-DM system unstable.
Furthermore, binding free energy calculations showed that Afatinib could bind much more tightly than Gefitinib in the DM system. There were also many more residues interacting with inhibitors in the A-DM system than in the G-DM system, which contributed more than 1.0 kcal mol−1 in binding free energy. When Afatinib binds in the pocket, the induce-fit effect makes the P-loop region tend to move downwards to downsize the entrance size of the pocket, which will retain the pocket at the proper volume to accommodate Afatinib.
All in all, our computational study clearly displayed the interaction between EGFR single/double mutations and their inhibitors, Gefitinib and Afatinib. These results provide a deep understanding of the structural details between EGFR and its inhibitors and provide guiding insights to develop novel competitive tyrosine kinase inhibitors for lung cancer.
Supplementary Materials
The following supporting information can be downloaded at:
https://www.mdpi.com/article/10.3390/biophysica3010013/s1, Figure S1: RMSD values for each 100 ns MD trajectory in the G-SM and G-DM system with three replicas; Figure S2: RMSD values for each 100 ns MD trajectory in the A-SM and A-DM system with three replicas; Figure S3: RMSD values for Gefitinib in the G-SM and G-DM system, Afatinib in the A-SM and A-DM system.
Author Contributions
Methodology, Z.D.; validation, T.S.; formal analysis, Y.G.; investigation, Y.G. and Z.D.; writing—original draft preparation, Y.G. and Z.D.; writing—review and editing, T.S.; visualization, Y.G. and Z.D.; supervision, T.S. All authors have read and agreed to the published version of the manuscript.
Funding
This research was funded by the National Key R&D Program of China (2019YFA0905400, 2021YFC2100600), the National Science Foundation of China (32270038, 32070041), and the SJTU-HPC computing facility award.
Institutional Review Board Statement
Not applicable.
Data Availability Statement
Acknowledgments
The authors thank Mei Ge for her helpful discussion and revision on language.
Conflicts of Interest
Authors declare no competing financial interest.
References
- Singh, P.K.; Silakari, O. Molecular dynamics and pharmacophore modelling studies of different subtype (ALK and EGFR (T790M)) inhibitors in NSCLC. SAR QSAR Environ. Res. 2017, 28, 221–233. [Google Scholar] [CrossRef]
- Oda, K.; Matsuoka, Y.; Funahashi, A.; Kitano, H. A comprehensive pathway map of epidermal growth factor receptor signaling. Mol. Syst. Biol. 2005, 1, 2005.0010. [Google Scholar] [CrossRef] [PubMed] [Green Version]
- Ferguson, K.M. Structure-Based View of Epidermal Growth Factor Receptor Regulation. Annu. Rev. Biophys. 2008, 37, 353–373. [Google Scholar] [CrossRef] [PubMed] [Green Version]
- Guan, H.; Du, Y.; Ning, Y.; Cao, X. A brief perspective of drug resistance toward EGFR inhibitors: The crystal structures of EGFRs and their variants. Future Med. Chem. 2017, 9, 693–704. [Google Scholar] [CrossRef] [PubMed]
- Wakeling, A.E.; Guy, S.P.; Woodburn, J.R.; Ashton, S.E.; Curry, B.J.; Barker, A.J.; Gibson, K.H. ZD1839 (Iressa): An orally active inhibitor of epidermal growth factor signaling with potential for cancer therapy. Cancer Res. 2002, 62, 5749–5754. [Google Scholar] [PubMed]
- Ayati, A.; Moghimi, S.; Salarinejad, S.; Safavi, M.; Pouramiri, B.; Foroumadi, A. A review on progression of epidermal growth factor receptor (EGFR) inhibitors as an efficient approach in cancer targeted therapy. Bioorg. Chem. 2020, 99, 103811. [Google Scholar] [CrossRef] [PubMed]
- Yan, X.E.; Ayaz, P.; Zhu, S.J.; Zhao, P.; Liang, L.; Zhang, C.H.; Wu, Y.C.; Li, J.L.; Choi, H.G.; Huang, X.; et al. Structural Basis of AZD9291 Selectivity for EGFR T790M. J. Med. Chem. 2020, 63, 8502–8511. [Google Scholar] [CrossRef]
- Stamos, J.; Sliwkowski, M.X.; Eigenbrot, C. Structure of the Epidermal Growth Factor Receptor Kinase Domain Alone and in Complex with a 4-Anilinoquinazoline Inhibitor *. J. Biol. Chem. 2002, 277, 46265–46272. [Google Scholar] [CrossRef] [Green Version]
- Miller, V.A.; Hirsh, V.; Cadranel, J.; Chen, Y.-M.; Park, K.; Kim, S.-W.; Zhou, C.; Su, W.-C.; Wang, M.; Sun, Y.; et al. Afatinib versus placebo for patients with advanced, metastatic non-small-cell lung cancer after failure of erlotinib, gefitinib, or both, and one or two lines of chemotherapy (LUX-Lung 1): A phase 2b/3 randomised trial. Lancet Oncol. 2012, 13, 528–538. [Google Scholar] [CrossRef]
- Solca, F.; Dahl, G.; Zoephel, A.; Bader, G.; Sanderson, M.; Klein, C.; Kraemer, O.; Himmelsbach, F.; Haaksma, E.; Adolf, G.R. Target Binding Properties and Cellular Activity of Afatinib (BIBW 2992), an Irreversible ErbB Family Blocker. J. Pharmacol. Exp. Ther. 2012, 343, 342–350. [Google Scholar] [CrossRef]
- Yun, C.-H.; Boggon, T.J.; Li, Y.; Woo, M.S.; Greulich, H.; Meyerson, M.; Eck, M.J. Structures of lung cancer-derived EGFR mutants and inhibitor complexes: Mechanism of activation and insights into differential inhibitor sensitivity. Cancer Cell 2007, 11, 217–227. [Google Scholar] [CrossRef] [PubMed] [Green Version]
- Arnold, K.; Bordoli, L.; Kopp, J.; Schwede, T. The SWISS-MODEL workspace: A web-based environment for protein structure homology modelling. Bioinformatics 2006, 22, 195–201. [Google Scholar] [CrossRef] [PubMed] [Green Version]
- Studer, G.; Rempfer, C.; Waterhouse, A.M.; Gumienny, R.; Haas, J.; Schwede, T. QMEANDisCo—Distance constraints applied on model quality estimation. Bioinformatics 2020, 36, 1765–1771. [Google Scholar] [CrossRef] [PubMed]
- The PyMOL Molecular Graphics System, Version 1.8; Schrodinger, LLC: New York, NY, USA, 2015.
- Dolinsky, T.J.; Nielsen, J.E.; McCammon, J.A.; Baker, N.A. PDB2PQR: An automated pipeline for the setup of Poisson-Boltzmann electrostatics calculations. Nucleic Acids Res. 2004, 32, W665–W667. [Google Scholar] [CrossRef]
- Zhao, Y.; Truhlar, D.G. The M06 suite of density functionals for main group thermochemistry, thermochemical kinetics, noncovalent interactions, excited states, and transition elements: Two new functionals and systematic testing of four M06 functionals and 12 other functionals. Theor. Chem. Acc. 2008, 119, 525. [Google Scholar] [CrossRef] [Green Version]
- Rassolov, V.A.; Ratner, M.A.; Pople, J.A.; Redfern, P.C.; Curtiss, L.A. 6-31G* basis set for third-row atoms. J. Comput. Chem. 2001, 22, 976–984. [Google Scholar] [CrossRef]
- Cornell, W.D.; Cieplak, P.; Bayly, C.I.; Gould, I.R.; Merz, K.M.; Ferguson, D.M.; Spellmeyer, D.C.; Fox, T.; Caldwell, J.W.; Kollman, P.A. A Second Generation Force Field for the Simulation of Proteins, Nucleic Acids, and Organic Molecules. J. Am. Chem. Soc. 1995, 117, 5179–5197. [Google Scholar] [CrossRef] [Green Version]
- Lu, T.; Chen, F. Multiwfn: A multifunctional wavefunction analyzer. J. Comput. Chem. 2012, 33, 580–592. [Google Scholar] [CrossRef]
- Wang, J.; Wang, W.; Kollman, P.A.; Case, D.A. Automatic atom type and bond type perception in molecular mechanical calculations. J. Mol. Graph. Modell. 2006, 25, 247–260. [Google Scholar] [CrossRef]
- Case, D.A.; Ben-Shalom, I.Y.; Brozell, S.R.; Cerutti, D.S.; Cheatham, T.E.; Cruzeiro, V.W.D., III; Darden, T.A.; Duke, R.E.; Ghoreishi, D.; Gilson, M.K.; et al. AMBER 2018; University of California: San Francisco, CA, USA, 2018. [Google Scholar]
- Maier, J.A.; Martinez, C.; Kasavajhala, K.; Wickstrom, L.; Hauser, K.E.; Simmerling, C. ff14SB: Improving the Accuracy of Protein Side Chain and Backbone Parameters from ff99SB. J. Chem. Theory Comput. 2015, 11, 3696–3713. [Google Scholar] [CrossRef] [Green Version]
- Darden, T.; York, D.; Pedersen, L. Particle mesh Ewald: An N·log(N) method for Ewald sums in large systems. J. Chem. Phys. 1993, 98, 10089–10092. [Google Scholar] [CrossRef] [Green Version]
- Ryckaert, J.P.; Ciccotti, G.; Berendsen, H. Numerical integration of the cartesian equations of motion of a system with constraints: Molecular dynamics of n-alkanes. J. Comput. Phys 1977, 23, 327–341. [Google Scholar] [CrossRef] [Green Version]
- Miller, B.R.; Mcgee, T.D.; Swails, J.M.; Homeyer, N.; Gohlke, H.; Roitberg, A.E. MMPBSA.py: An efficient program for end-state free energy calculations. J. Chem. Theory Comput. 2012, 8, 3314–3321. [Google Scholar] [CrossRef]
- Roe, D.R.; Cheatham, T.E. III, PTRAJ and CPPTRAJ: Software for Processing and Analysis of Molecular Dynamics Trajectory Data. J. Chem. Theory Comput. 2013, 9, 3084–3095. [Google Scholar] [CrossRef]
- Park, J.; McDonald, J.J.; Petter, R.C.; Houk, K.N. Molecular Dynamics Analysis of Binding of Kinase Inhibitors to WT EGFR and the T790M Mutant. J. Chem. Theory Comput. 2016, 12, 2066–2078. [Google Scholar] [CrossRef]
- Sharma, V.K.; Nandekar, P.P.; Sangamwar, A.; Pérez-Sánchez, H.; Agarwal, S.M. Structure guided design and binding analysis of EGFR inhibiting analogues of erlotinib and AEE788 using ensemble docking, molecular dynamics and MM-GBSA. RSC Adv. 2016, 6, 65725–65735. [Google Scholar] [CrossRef]
- Ribaudo, G.; Zanforlin, E.; Zagotto, G. Overcoming resistance in non-small-cell lung cancer: A practical lesson for the medicinal chemist. Arch. Der Pharm. 2018, 351, 1800037. [Google Scholar] [CrossRef]
- Westover, D.; Zugazagoitia, J.; Cho, B.C.; Lovly, C.M.; Paz-Ares, L. Mechanisms of acquired resistance to first- and second-generation EGFR tyrosine kinase inhibitors. Ann. Oncol. 2018, 29, i10–i19. [Google Scholar] [CrossRef]
- Gazdar, A.F. Activating and resistance mutations of EGFR in non-small-cell lung cancer: Role in clinical response to EGFR tyrosine kinase inhibitors. Oncogene 2009, 28, S24–S31. [Google Scholar] [CrossRef] [Green Version]
- Yu, H.A.; Pao, W. Targeted therapies: Afatinib-new therapy option for EGFR-mutant lung cancer. Nat. Rev. Clin. Oncol. 2013, 10, 551–552. [Google Scholar] [CrossRef]
| Disclaimer/Publisher’s Note: The statements, opinions and data contained in all publications are solely those of the individual author(s) and contributor(s) and not of MDPI and/or the editor(s). MDPI and/or the editor(s) disclaim responsibility for any injury to people or property resulting from any ideas, methods, instructions or products referred to in the content. |
© 2023 by the authors. Licensee MDPI, Basel, Switzerland. This article is an open access article distributed under the terms and conditions of the Creative Commons Attribution (CC BY) license (https://creativecommons.org/licenses/by/4.0/).


