
Neuronal Cultures: Exploring Biophysics, Complex Systems, and Medicine in a Dish

1
Departament de Física de la Matèria Condensada, Universitat de Barcelona, E-08028 Barcelona, Spain
2
Universitat de Barcelona Institute of Complex Systems (UBICS), E-08028 Barcelona, Spain
Biophysica 2023, 3(1), 181-202; https://doi.org/10.3390/biophysica3010012
Submission received: 16 January 2023
/
Revised: 6 March 2023
/
Accepted: 8 March 2023
/
Published: 10 March 2023
(This article belongs to the Special Issue State-of-the-Art Biophysics in Spain)
Abstract
:Neuronal cultures are one of the most important experimental models in modern interdisciplinary neuroscience, allowing to investigate in a control environment the emergence of complex behavior from an ensemble of interconnected neurons. Here, I review the research that we have conducted at the neurophysics laboratory at the University of Barcelona over the last 15 years, describing first the neuronal cultures that we prepare and the associated tools to acquire and analyze data, to next delve into the different research projects in which we actively participated to progress in the understanding of open questions, extend neuroscience research on new paradigms, and advance the treatment of neurological disorders. I finish the review by discussing the drawbacks and limitations of neuronal cultures, particularly in the context of brain-like models and biomedicine.
1. Introduction
Santiago Ramón y Cajal formulated the neuron doctrine in 1891, which states that the nervous system is constituted by individual cells connected to one another through specialized junctions [1,2]. These cells were coined ‘neurons’ (from the ancient Greek word for ‘nerve’) that same year by the German scientist Wilhelm von Waldeyer [3], and the junctions were termed ‘synapses’ in 1897 by the English neuroscientist Charles Sherrington. Since then, extensive debate enriched the neuroscience community to understand whether brain’s functioning was encoded in the neurons, the synapses or in an entangled melee of both, i.e., a neuronal network. It took indeed more than a century for neuroscience to evolve from its original cell-based physiological description of excitable cells to the modern view of complex, functionally rich neuronal assemblies [4].
In the fascinating quest to understand the brain and its information-processing building blocks, a question that became central already in Cajal’s times was whether neurons could be extracted from their natural environment and be maintained alive for a sufficient period of time in artificial in vitro conditions, thus allowing for a detailed inspection of neurons’ functioning principles as well as the mechanisms governing the propagation and synaptic transmission of electrical pulses. Such a question was answered in 1910, when the neuroscientist Ross Harrison at Yale University developed a technique that permitted to visualize and study living nerve cells in vitro. He not only demonstrated that the neuron doctrine hypothesis was correct but gave birth to the concept of neuronal culture, in which neurons and the networks they form can be explored in exquisite detail using a wide spectrum of techniques [5].
Since Harrison’s invention, neuronal cultures quickly evolved to increase their robustness, biological intricacy, and accessibility to both intracellular and extracellular processes [5]. Accurate intracellular recordings on neurons were achieved in the 1950s using electrophysiological techniques, setting the beginning of a fruitful alliance between neuronal cultures and new technological developments that ultimately allowed to record activity in several neurons at once, e.g., by using optical or electronic techniques, and in combination with all sort of strategies to understand the emergence of complex phenomena from an ensemble of neurons.
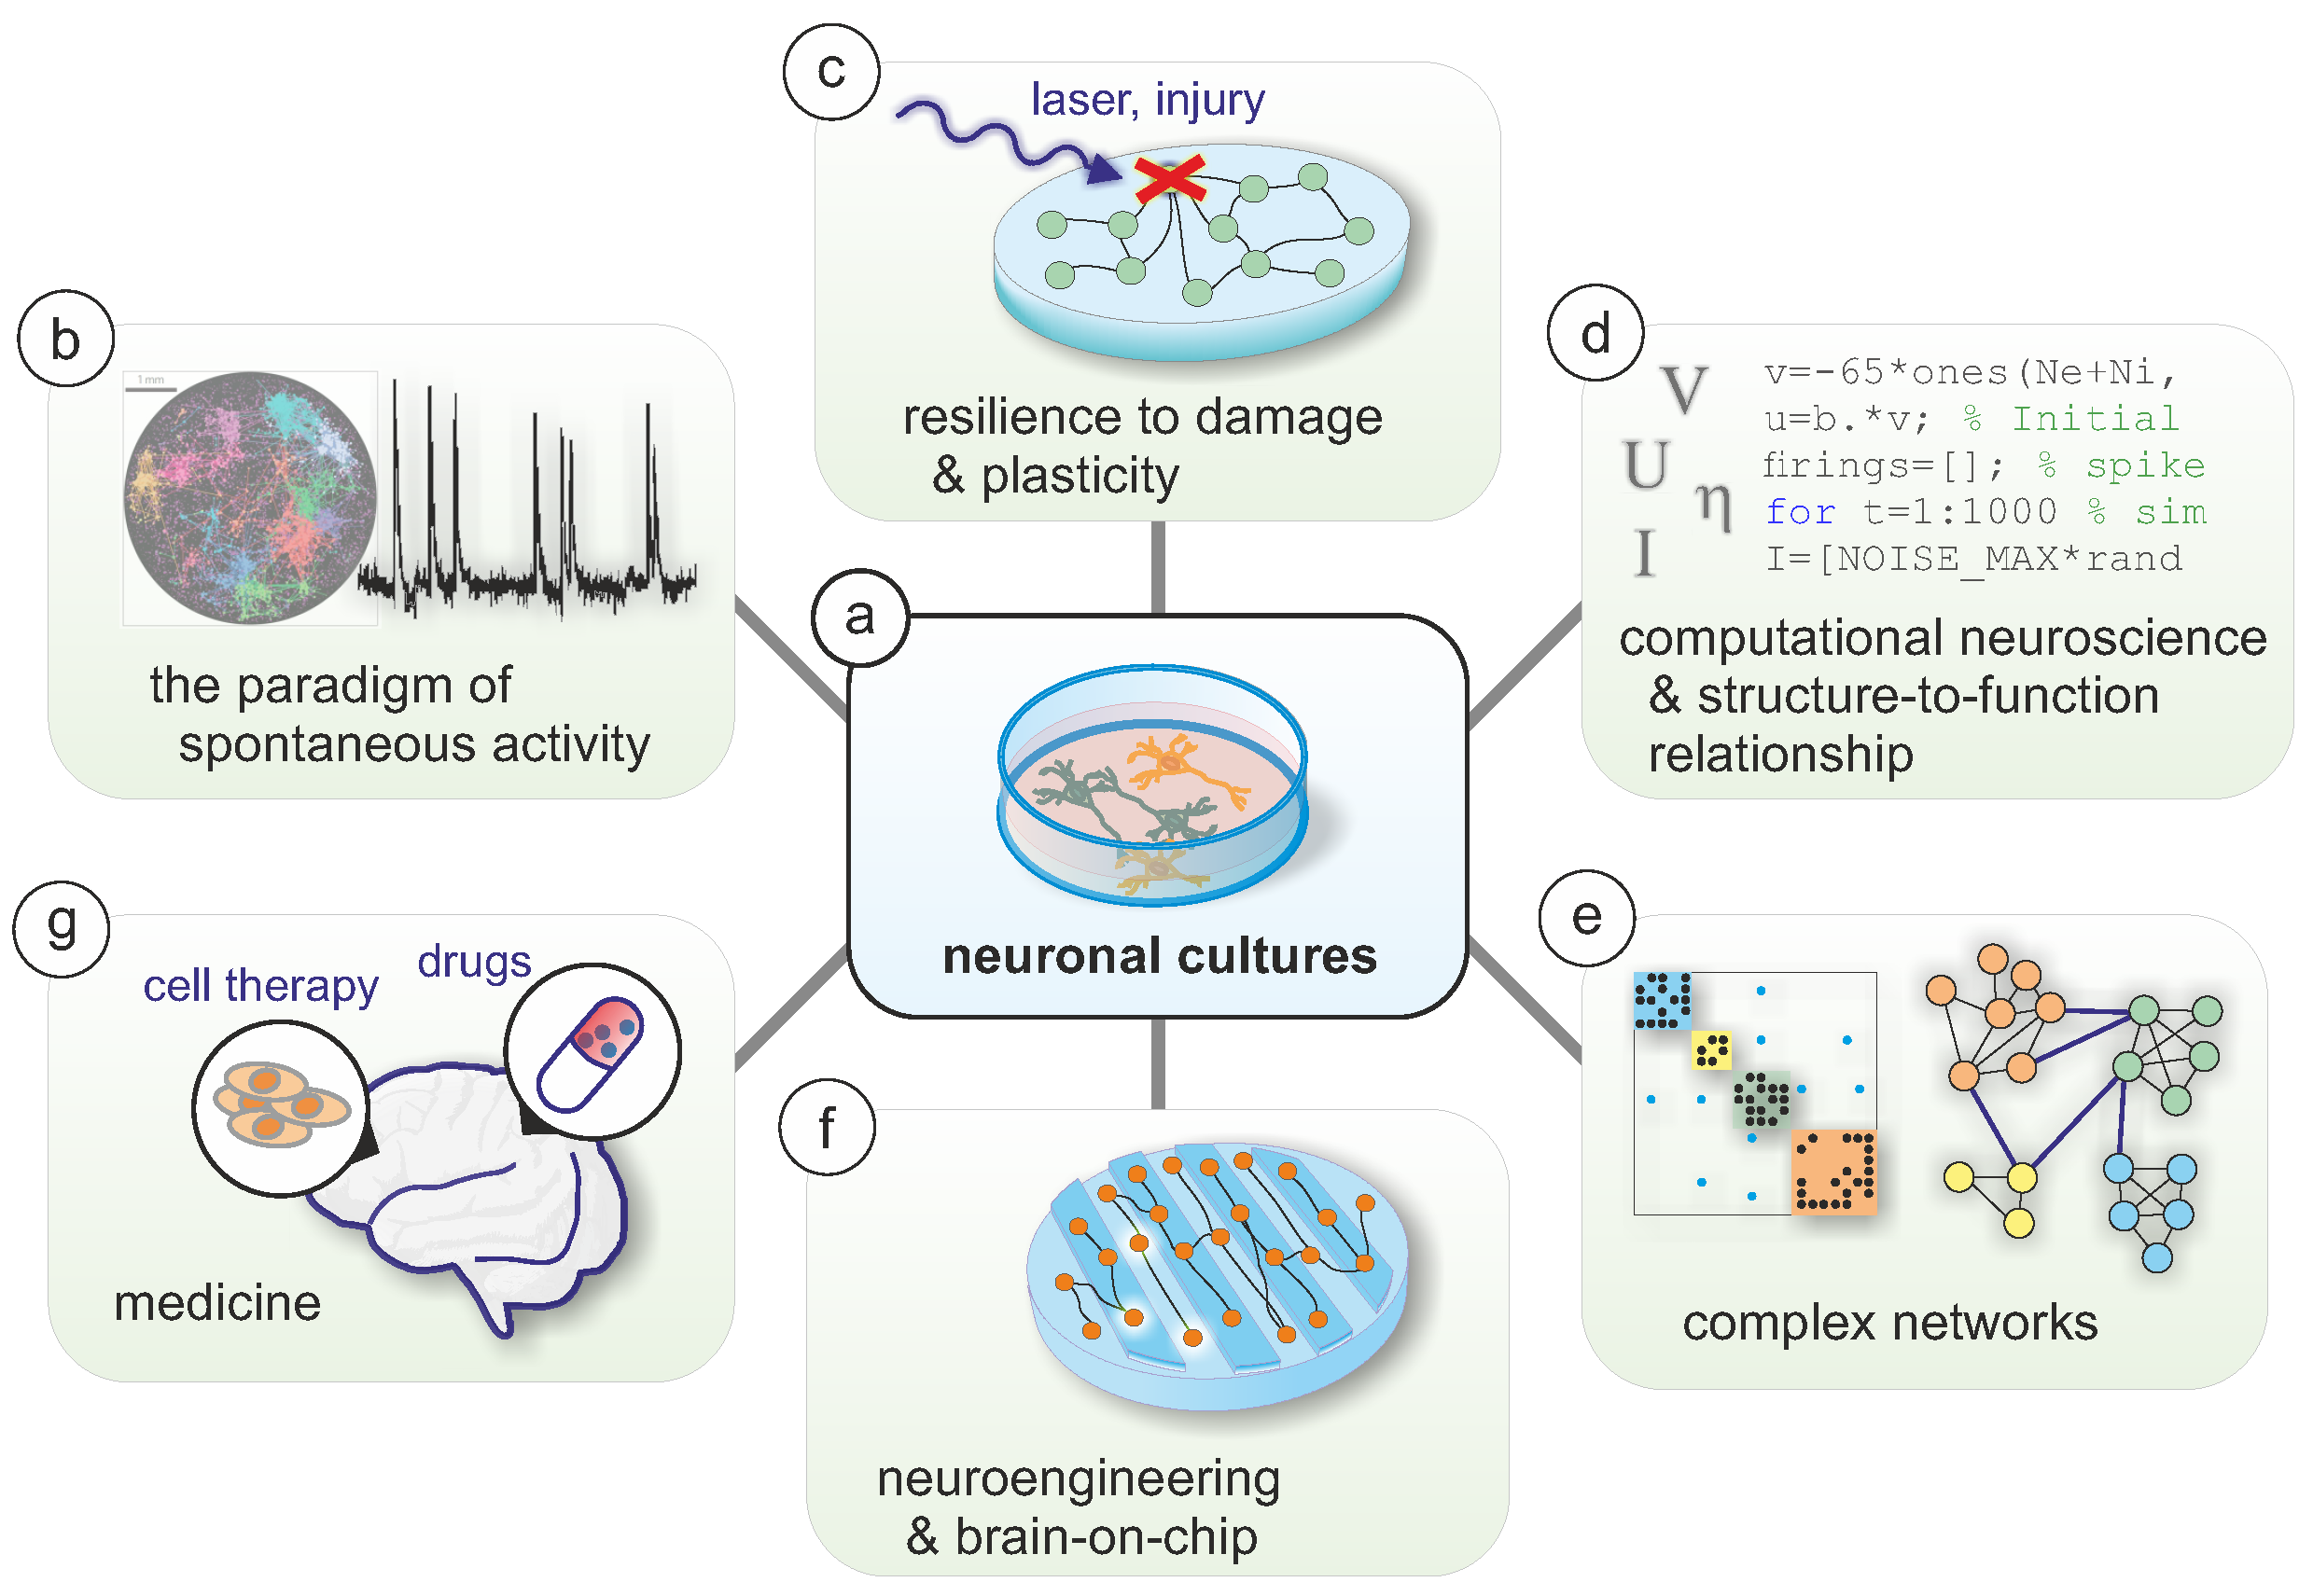
Although neuronal cultures today maintain their intrinsic biological, experimental nature, they have meritoriously excelled to the podium of transdisciplinary research, with direct presence in (or close relationship with) fields as diverse as medicine, bioengineering, robotics, mathematics, and physics of complex systems. In my ‘neurophysics’ laboratory at the Physics Faculty of the University of Barcelona, I prepare neuronal cultures and investigate the collective behavior of the formed neuronal assemblies. In partnership with research groups in medicine and neuroengineering across Europe, our goal is to understand key aspects related to living neuronal networks as a whole, including the emergence of spontaneous activity, the relation between dynamics and network connectivity, and the resilience to damage, among others (Figure 1). In the sections that follow, I will provide an overview of the main techniques used in our laboratory to prepare neuronal cultures and monitor their activity, to later delve into specific projects that have framed the research in my laboratory for the last 15 years.
2. An Overview of Neuronal Cultures
Neuroscience is the scientific discipline that, since its very origins, aimed at understanding how the nervous system organizes and operates [33], with special attention to what is considered the most complex organs of all: the human brain. For this reason, when thinking about neuronal cultures, one aims at accessing human neurons or, in their absence, neuronal cells or tissue that approach as best as possible the human ones.
Taking into account several ethical considerations that limit the access of human brain tissue for a broad laboratory use, the accessibility to neurons in most research teams in the world, including ours, comprises primary rodent neurons and human induced pluripotent stem cells (hiPSCs) [34,35,36].
Primary neuronal cultures are obtained from embryonic rats or mice whose neurons are extracted and cultured in vitro as quickly as possible to minimize tissue deterioration. Neurons are typically harvested from the cortex or hippocampus, dissociated mechanically, and plated on substrates such as glass or polymers in combination with a cocktail of nutrients for adequate development [37,38]. An almost nearly pure population of neurons are seeded on the substrate, but glial cells proliferate in the following days stimulated by growth factors present in the culture medium. Glia are a specialized group of cells that not only provide physical and chemical support to neurons, but also regulate synapse formation, neuronal network development and activity [39,40]. Refs. [6,15,19,41] provide detailed protocols for the preparation of primary cultures in our laboratory. The advantage of primary cultures is that the protocols are well established and robust after decades of widespread use and improvement, and that network-wide activity is already present by the end of the first week in vitro [6,15,42]. Additionally, the mammalian nature of both human and rodent neurons has helped viewing rodent tissue and derived cultures as a useful model to understand the human brain and its pathologies, pivoting rodents at the top of neuroscience experimental models.
hiPSCs, on the other hand, are obtained from direct reprogramming of human somatic cells to a pluripotent stage via specific transcription factors [43,44]. Once pluripotent, hiPSCs can be differentiated into neurons and other nerve cells [35,45]. Thus, hiPSCs-derived neuronal cultures preserve their intrinsic human traits and avoid any use of animals. More importantly, cell lines can be obtained from both healthy donors and patients affected by genetic neurodegenerative diseases, such as Huntington’s or some variants of Parkinson’s, allowing for investigating these diseases in detail in vitro and to develop human-specific treatments. Refs. [20,21,25] provide the protocols used for hiPSCs culturing in our laboratory or collaborators. It must be noted, however, that hiPSCs are a relatively new technology developed by Yamanaka and coworkers in 2006 (Nobel Prize in Medicine in 2012) [43], with protocols that are slow, difficult, and not completely well-settled.
Although hiPSCs are certainly viewed as the way to go in neuroscience, the difficulty in setting fast and reproducible cultures is hindering their widespread use. Indeed, typically 4–6 weeks are needed to start obtaining data in hiPSC-derived cultures, which is an important drawback for those research projects in which different disciplines converge, such as neuroengineering, and reliable cell culturing is needed to test the goodness of interwoven technologies. Additionally, the neurons in hiPSCs-derived cultures undergo important changes in their individual and collective activity as they mature, which makes the selection of the optimal time point for data acquisition or network analysis difficult. Thus, many research teams, including ours, combine experiments with primary and hiPSC-derived cultures when designing new projects. Primary cultures facilitate a fast exploration of experimental concepts and the acquisition of preliminary results, which are then used to plan more long-term experiments with hiPSCs.
Figure 2a–e provides representative images of neuronal cultures used in different research projects of our team. The images correspond to rat primary cultures, but they would look very similar with hiPSCs preparations, since just from a visual inspection, it is not possible to observe differences between primary and hiPSCs-derived cultures. Differences would include the repertoire of cellular types or the degree of maturity of the cells, and could be revealed using immunostaining or electrophysiological techniques (Figure 2f–g).
Regardless the preparation, neurons in our laboratory are typically grown on flat substrates such as circular cover glasses 3–6 mm in diameter [6,7,15]. By using adhesive proteins previously applied to the substrate, neurons cover homogeneously the surface (Figure 2a-left), although fluctuations in spatial distribution occur and neurons mildly aggregate. Calcium fluorescence markers can then be used to detect active neurons at a cellular resolution, with neurons appearing as bright round objects (Figure 2a-right). Alternatively, multielectrode arrays can be used to detect activity at high temporal resolutions (Figure 2b), but with the added difficulty that the strength of the detected signal depends on the proximity of the neurons to the electrode. When no adhesive proteins are applied to the substrate, neurons aggregate forming compact islands or clusters connected to one another (Figure 2c), a configuration that is often known as self-organized modular networks [41,46], in which the number, distribution, and interconnectivity of the clusters vary among preparations. By contrast, engineered neuronal networks are those in which neuronal modules as well as their interconnectivity are imprinted on the substrate using microfabrication techniques (Figure 2d), allowing for a higher control of the resulting network [22]. Neuronal networks that combine both free self-organization and rigid engineering can be shaped by using topographical designs [19], in which neurons grow on a two-level substrate with mild differences in height, and with the topography itself coarsely guiding the connectivity of the network (Figure 2e).
In must be noted that, in most of our studies, neuronal cultures comprise about 80% excitatory neurons and 20% inhibitory ones, values that were measured in our group and collaborators by combining experiments with statistical physics modeling [47,48,49], and that were confirmed later by others [50]. This ratio between excitation and inhibition can be altered by using antagonists for excitatory or inhibitory synaptic receptors, which provides a wealth of possibilities to pharmacologically perturb a neuronal culture and observe its changes in collective activity and network organization (see, e.g., Refs. [6,15]).
3. Data Acquisition and Analysis
The behavior of the neuronal cultures prepared in our laboratory is quantified, in most of our research projects, through the analysis of spontaneous activity and using an optical technique known as fluorescence calcium imaging [51]. This technique is based on the indirect detection of neuronal activations (action potentials or spikes), which are associated with the large increase in intracellular calcium concentration upon the opening of voltage-gated calcium channels. By using small organic compounds that exhibit fluorescent properties when bound to calcium, it is possible to monitor the behavior of a large population of neurons with cellular resolution.
These calcium-sensitive compounds, or calcium indicators, are classified as either chemical or genetically encoded. Chemical indicators [52] are directly loaded into the cells by increasing neurons’ membrane permeability through specific solvents, and are typically used for immediate, short-term recordings on the order of few hours. Genetically encoded calcium indicators (GECIs) [53] consist of assembling and packing the indicator into a virus particle, such as adeno-associated viruses (AAVs). Neurons are then infected by the virus and, as far as the neurons are alive, they will express the indicator. GECIs are particularly suited to study the evolution of the neurons in culture along several days, for instance to track the development of the neuronal network, or to investigate the action of perturbations or damage. GECIs, and in conjunction with AAVs, can be designed to be neuron-specific, in the sense that only neurons, and not other nerve cells such as glia, express the indicator. In our experiments, we initially used the chemical indicators Fluo-4 AM, e.g., as in Refs. [6,7,15,41,49], and Cal-520 AM [22], but switched to a GECI, specifically GCaMP6s, for its superior performance and suitability to monitor the same network over weeks, e.g., as in Refs. [11,19,21].
A full image acquisition setup is completed with a fluorescence microscope to access the prepared cultures, a high-speed camera, and a microincubator to maintain neurons in physiological conditions during the recording sessions. Our cultures, for instance, contain 1000 to 3000 neurons in typically 3 to 6 mm diameter substrates [7,19], which are monitored at about 50–100 frames per second, i.e., 10–20 ms time resolution, for typically 30 min. Altogether, our preparations and imaging system shape mesoscopic-scale systems that are tailored to investigate changes in network organization and collective behavior.
An example of the signal obtained in calcium imaging recordings from our laboratory is shown in Figure 3a, in which the traces for nine neurons along 30 s are depicted. To obtain the traces, neurons or neuronal aggregates are first selected as regions of interest on the images (yellow outline in Figure 2a) and then the average fluorescence of each neuron i extracted as a function of time, procuring the raw signal . Since all neurons have a basal, background fluorescence , the measure of interest is the fluorescence change relative to background, given by . The traces are characterized by a sharp increase upon the onset of neuronal activity, associated with the repeated emission of action potentials (neuronal bursts) followed by a slow decay associated with the unbinding of the calcium indicator. Due to the slow kinetics of the indicator, as compared to the characteristic timescales of the emitted action potentials (spikes), it is in general very difficult to resolve each spike contained in the fluorescence signal. Indeed, the fast increase in fluorescence upon activity may contain several spikes, but only the activity onset can be determined with precision. Different studies in the literature have provided deconvolution-like strategies to resolve the spike trains within the fluorescence signal [54,55,56,57,58], a still open problem known as spike inference in which too many variables (such as indicator brightness and kinetics, time resolution, or camera noise) are involved in the quality of inference. A recent study has simultaneously recorded the activity of neurons with calcium imaging and electrophysiology [59], thus providing a background to develop better inference algorithms.
For our data, we developed a Matlab platform known as Netcal [60] to analyze calcium imaging recordings in a semiautomatic and user-friendly manner, and included the spike-inference algorithms available in the literature. An example of the analysis of our data is shown in Figure 3b, in which we compare the results from a simple Schmitt trigger approach [54] (inferred spikes marked as green stars) and a biophysical one known as Oasis [57] that takes into account indicator kinetics (red calcium signal and black dots). The Schmitt approach just captures the onset of activity. The Oasis approach predicts well the overall behavior of the fluorescence signal and extracts the concatenated spikes within a neuronal burst, but also identifies spikes that seem noisy background (black arrowhead). The example illustrates not only the difficulty of spike inference, in which a compromise is needed between the number of spikes inferred and their reliability, but also on the dangers of excessive automation in data analysis. In our case, we used Schmitt inference when the details of repeated spikes within a neuronal burst were not important, e.g., to quantify overall network activity or the spatiotemporal structure of propagating fronts [15,19,21]. We used full spike inference in those studies in which neuron-level spike statistics was important, such as in medical investigations [26].
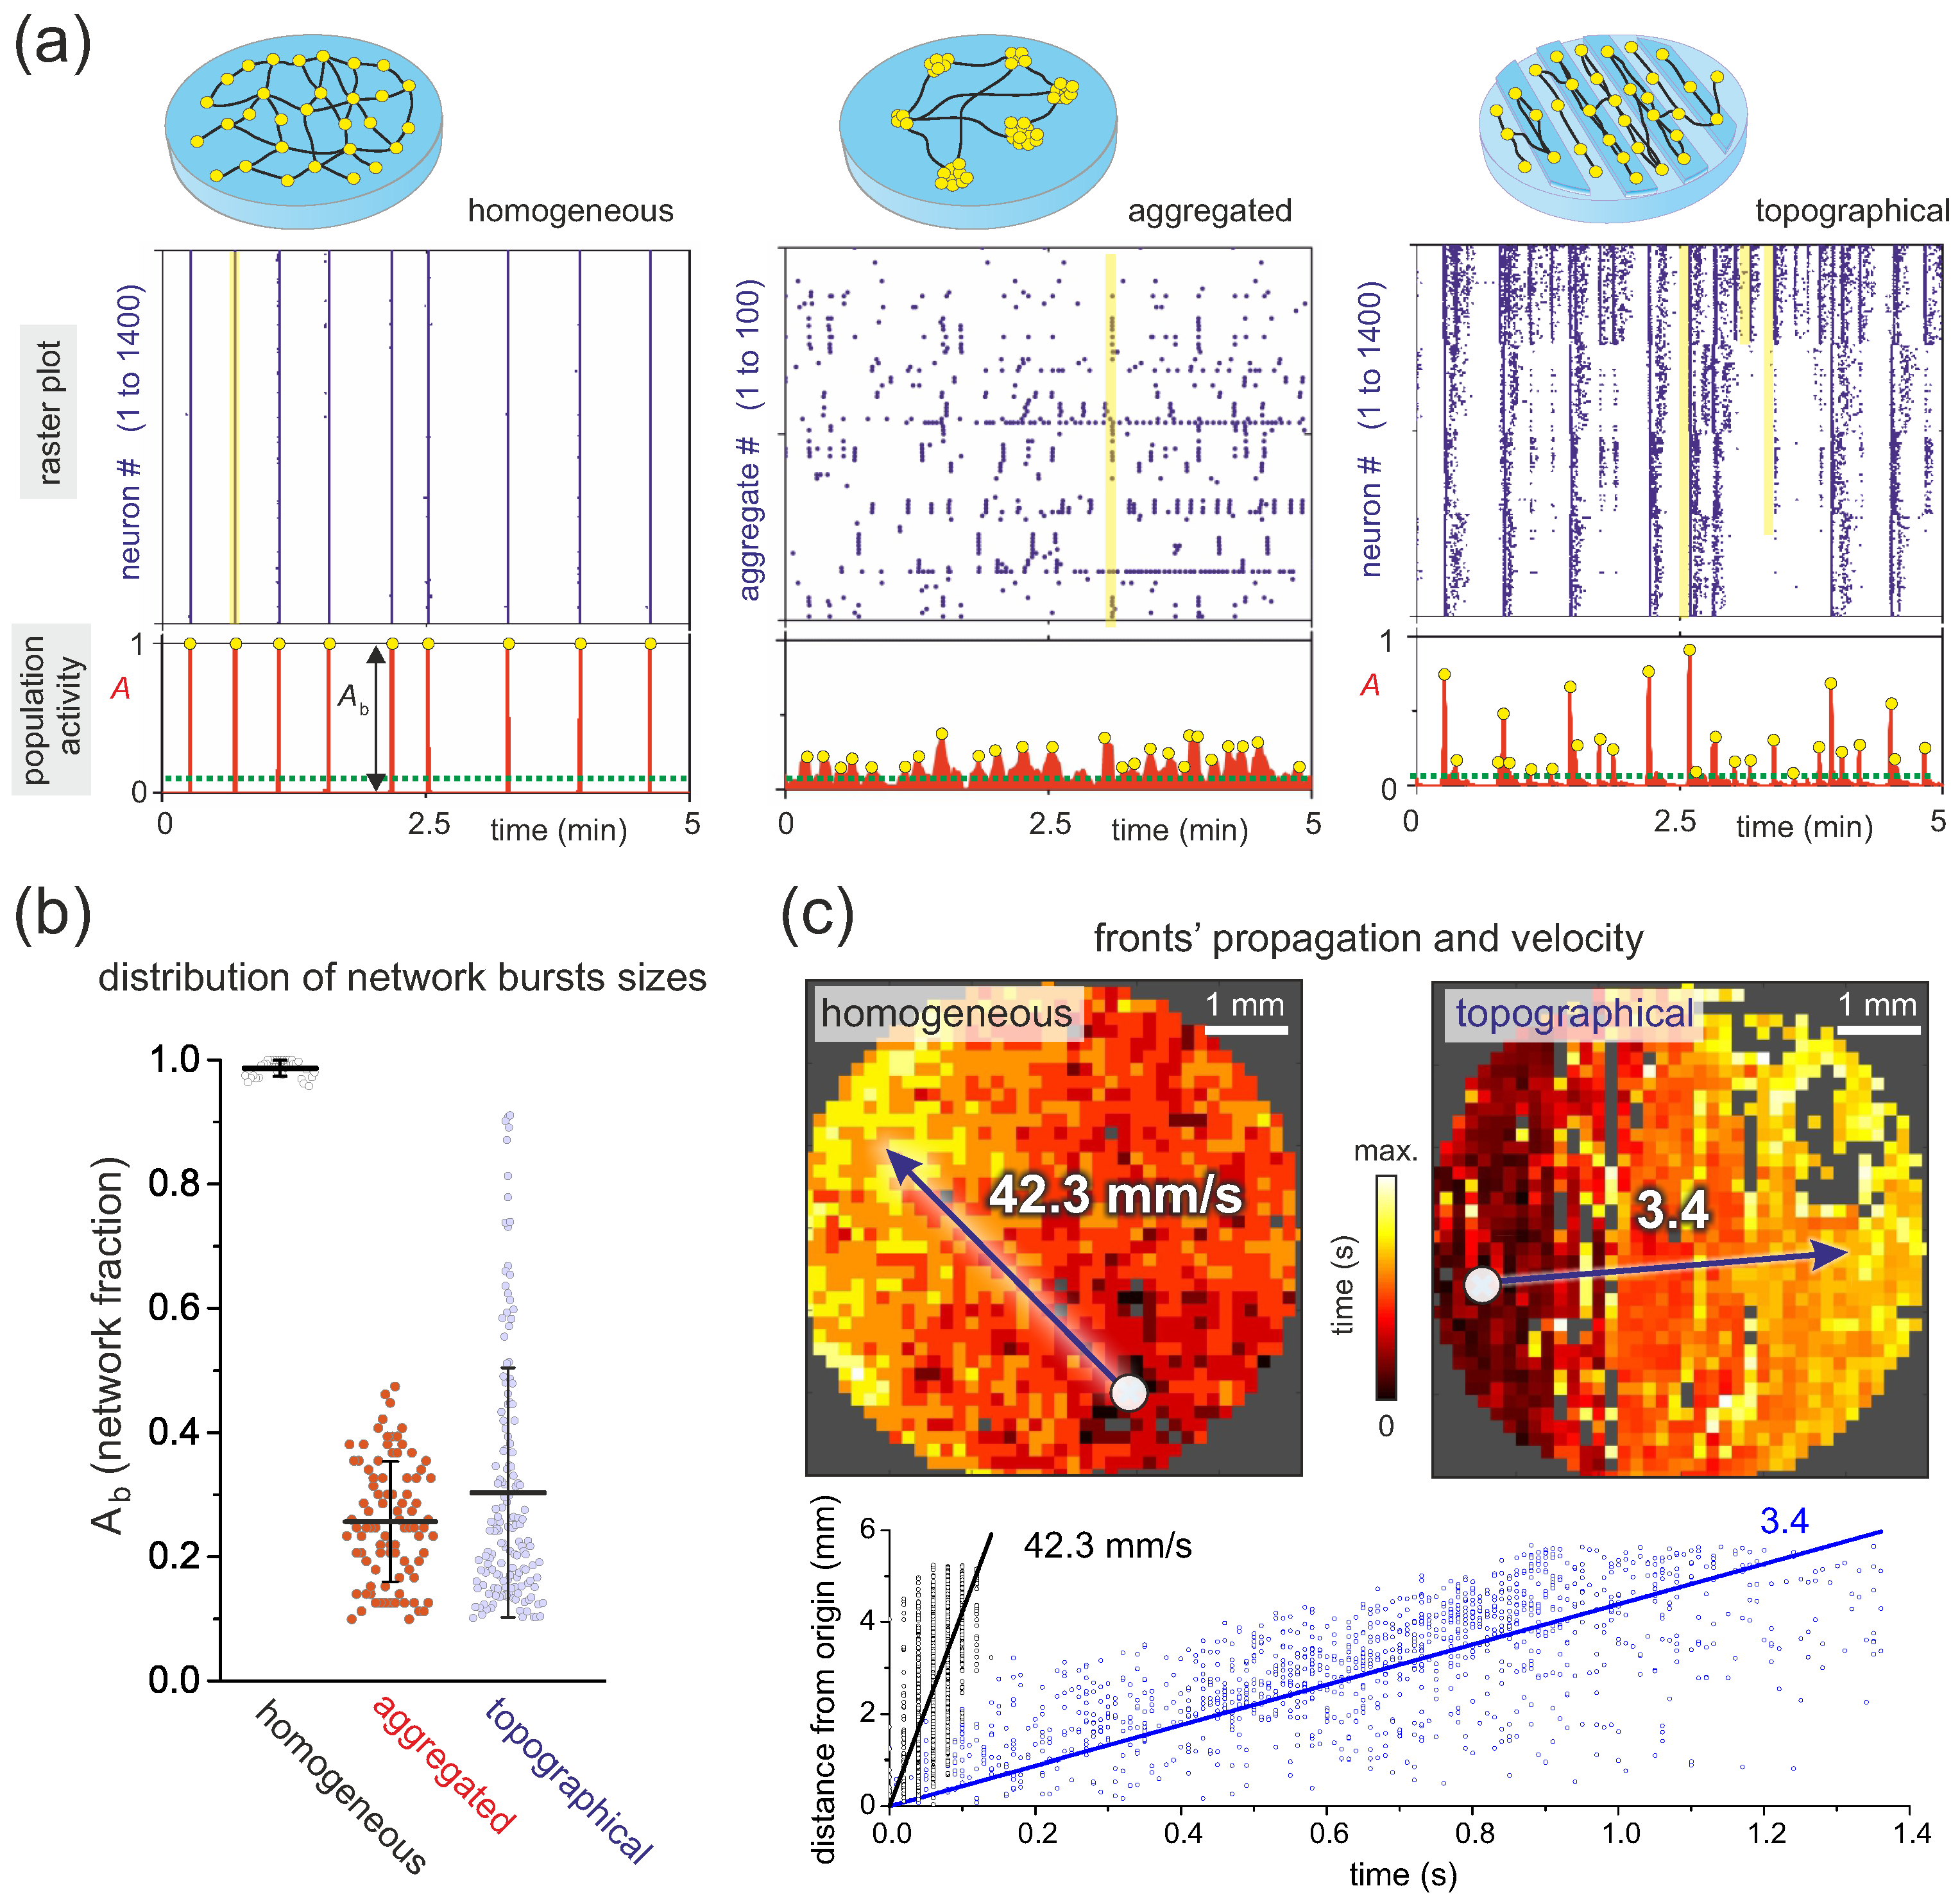
The obtained spike trains for the whole neuronal network are typically visualized in the form of raster plots, and provide the basis for a wealth of analyses, from simple statistical descriptions of network activity to functional connectivity and complex network measures. Figure 4a, top, compares the raster plots of three distinct culture preparations, in which Schmitt inference has been used. In a homogeneous culture, neurons tend to activate in a highly coherent manner (yellow outline), with all neurons lighting up in a short time window, shaping a rigid raster plot of quasi periodic, almost identical bands of activity termed network bursts that are combined with silent intervals. Raster plots are much richer in structure in cultures made of aggregates of neurons or topographical designs, in which coherent activity encompasses from small groups to the entire population, and in a varying manner along time.
To quantify the variability in the number of neurons participating in collective events, we introduced in different studies the concept of ‘population activity’ [19,22] (Figure 4a, bottom), which conceptually portrays the fraction of the network that activates together in a time window of typically 0.5 s. For the homogeneous network, the population activity is close to 1 in all collective events, while, for the other cultures, this collective activity is more varied. The size of collective activity events relative to background activity is then used to quantify the richness in the dynamic repertoire of the network [22]. As shown in Figure 4b, the distribution is peaked towards 1 for the homogeneous network but is broad for the others. We explored the implication of these distribution of values in Refs. [19,21,22] by using a magnitude termed ‘functional complexity’, , introduced by Zamora and coworkers [61]. This magnitude is 0 when all neurons activate identically or in a random manner, and 1 when all possible co-activation patterns are present. For the example shown in Figure 4b, takes values of approximately , , and for homogeneous, aggregated, and topographical designs, respectively, and in line with a gradually broader distributions. A high functional complexity reflects the capacity of a neuronal network to accommodate different dynamical states, from few active neurons to the entire network, a ubiquitous property of the brain that we aim at replicating in vitro. In our studies of Yamamoto et al. [22] and Montalà-Flaquer et al. [19], we observed that a modular organization is a fundamental trait to favor a high functional complexity, which we in general achieved by either shaping self-organized aggregated networks, precise engineering, or topographical patterning.
In addition to analyzing the raster plots from a population perspective, we also developed tools to characterize in detail each collective activity event or network burst. An idea that was particularly enlightening was the study of the velocity of propagating fronts. Some years ago, we showed experimentally and theoretically that the velocity of activity propagation depends on the average connectivity of the neurons and the balance between excitation and inhibition [62]. Thus, such a velocity analysis provides an elegant way to obtain indirect information on the connectivity of the network and its changes upon development or pharmacological action. An example is provided in Figure 4c in the context of the study by Montalà-Flaquer et al. [19] on topographical cultures, in which the guidance of axons promoted by imprinted parallel tracks favors a much higher connectivity and velocity along tracks than transverse to them. In the example of Figure 4c, top, the spatiotemporal structure of front propagation for a homogeneous and topographical fronts are compared, with the former propagating at about 40 mm/s in a quasi-circular manner and the latter at about 3 mm/s as a flat front transverse to the tracks’ orientation. In both cases, the initiation point of activity can be determined (white circle) and, by plotting the Euclidean distance to the initiation point as a function of time for each neuron or region in the culture, the propagation velocity can be determined as a linear fit (Figure 4c, bottom). The analysis of propagating fronts is a very enlightening and ongoing research since it indirectly reflects microscopic details on connectivity that are not easily accessible, providing also a strategy to help delineating accurate in silico models of two-dimensional neuronal cultures, as we did for instance in Refs. [7,16].
4. Spontaneous Activity in Cultures and the Importance of In Silico Modeling
A fundamental trait of neuronal cultures, and that has been intensively reported in the literature, is their capacity to spontaneously activate and generate diverse forms of collective spatiotemporal patterns [63,64,65,66,67] whose details are shaped by the connectivity traits of the network and the balance between excitation and inhibition [42,68]. As we illustrated in Figure 4a, the structure of collective activity is very different in homogeneous, aggregated, and topographically patterned cultures, but nonetheless they all show the same capacity to spontaneously activate. Since neuronal cultures lack any input stimuli, there should be intrinsic and robust mechanisms that promote coordinated neuronal activations, and in an ongoing, repeated manner. The problem is more important than one may think since spontaneous activity, broadly speaking, is fundamental for the development of brain circuits [69,70], e.g., the retina [71] or spinal cord [72], and the communication between distant brain areas [73].
We found the problem of spontaneous activity very intriguing and studied it by combining experiments, theoretical modeling, and numerical simulations [7,8]. We unveiled a new paradigm termed ‘noise focusing’ by which weak neuronal activity can be strongly amplified by noise and network topology, generating avalanches of spikes that converge towards specific regions of the neuronal network. These regions receive such a strong bombardment of spikes that activate a critical core of neurons and, ultimately, trigger the generation of a network burst, which propagates as a fast wave across the network. These regions were termed burst initiation points and could be measured experimentally (white dots in Figure 4c), bridging theoretical modeling with experimental observations.
The framework for the noise focusing phenomenon is illustrated in Figure 5a. On the one hand, ‘noise amplification’ is based on the idea that the number of minimum inputs needed for a neuron to activate can be effectively reduced by the presence of noise. In the absence of noise, a neuron needs to receive typically 15 inputs for it to activate and stimulate downstream neurons, a concept called quorum and that we extensively investigated in the past [47,49,74]. Noise provides additional spikes that relax the quorum condition (Figure 5a, top), thus greatly enhancing neuronal activity. On the other, ‘topological amplification’ is based on the idea that the presence of particular connectivity structures or network motifs can also enhance activity. As illustrated in Figure 5a, bottom, the activity of two neurons is amplified by motifs called ‘feed forwards loops’, leading to an increased bombardment of spikes onto a target neuron.
The beauty of our noise focusing framework is that we developed a detailed theoretico-numerical model whose outcomes and predictions could be explored in the laboratory. For instance, the most important prediction of noise focusing is that, in standard homogeneous cultures grown on a flat surface, burst initiation is strongly focalized in space, i.e., most network bursts initiate in the same location. This is what we indeed observed in the experiments, as illustrated in Figure 5b-left, in which most of the measured bursts initiate in the same neighborhood (yellow spot). Since the burst initiation zones depend on the topology of the network, in recent studies [19], we also observed that they change in location upon development, or even become more spread when anisotropies in the form of topographical patterning are introduced (Figure 5b-right). We also investigated numerically [8,9] and experimentally [11] the stability of spontaneous activity and burst initiation upon connectivity damage, and observed that they are extremely robust. A substantial damage has to be delivered (a deletion of about 50–70% of the neurons in the network) for spontaneous activity to cease [9].
To understand in depth the noise focusing phenomenon and the stability of spontaneous activity, we needed to develop highly detailed numerical simulations that captured the fundamental ingredients of biological neuronal networks, and including the connectivity and dynamical aspects. The former deals with the wiring among neurons and the formation of large-scale networks, while the latter deals with the excitable, integrate-and-fire nature of neurons.
For modeling connectivity, we observed that a key ingredient to shape realistic networks was to simulate neurons and connections as if they were on a two-dimensional surface, i.e., mimicking laboratory neuronal cultures grown on glass. As shown in Figure 5c, axons could be constructed as concatenated segments of length ℓ up to a total length given by a distribution of maximum distances, while the dendritic tree could be just be assumed to be a disc centered at the soma of the neurons [7]. Whenever an axon of a neuron i crossed the dendritic tree of another neuron j, a connection was established with some probability [7,9]. This construction was relatively simple to implement in a computer and advanced features could be easily included, such as interaction with obstacles [16]. An example of our constructed in silico networks is shown in Figure 5d. The importance of our construction is that networks were characterized by non-random traits, in which Euclidean distances and metric correlations mattered, and triangles such as feed forward loops naturally appeared. In a highly enlightening work by Hernández-Navarro and coworkers [10], we described in detail the importance of metric correlations and their relation to neuronal spatial distribution and axonal lengths. The whole concept of building neuronal network topologies inherited from biologically-realistic constructions helped us to model and understand a large set of experimental observations [7,8,15,16,19].
For modeling dynamics, we took advantage of the Izhikevich model [75,76], an integrate-and-fire model for neurons that balances biological accuracy and numerical efficiency to allow the simulation of thousands of neurons without extreme computational cost. The model can accommodate excitatory and inhibitory neurons, and may be easily extended to incorporate neuronal mechanisms that are pivotal for a network-scale biological realism, specifically the depletion of neurotransmitters at the synapses via ‘synaptic depression’ [77]. Depression reduces the capacity of neurons to activate again after the emission of spikes, and therefore provides a mechanism for activity to slow down or cease after intense firing, a trait that is linked to the periodicity of spontaneous activity [7,8].
Altogether, the modeling of spontaneous activity is a beautiful—and ongoing—problem with still many open questions. In recent years, for instance, we investigated the capacity of neuronal cultures to activate plasticity mechanisms to regulate their activity upon perturbations [12] or damage [11,13]. We also explored the repertoire of spontaneous activity patterns during development in primary and hiPSCs-derived cultures [21] or when connectivity was dictated through engineering [19,22].
5. Complex Networks in Neuroscience and Neuronal Cultures
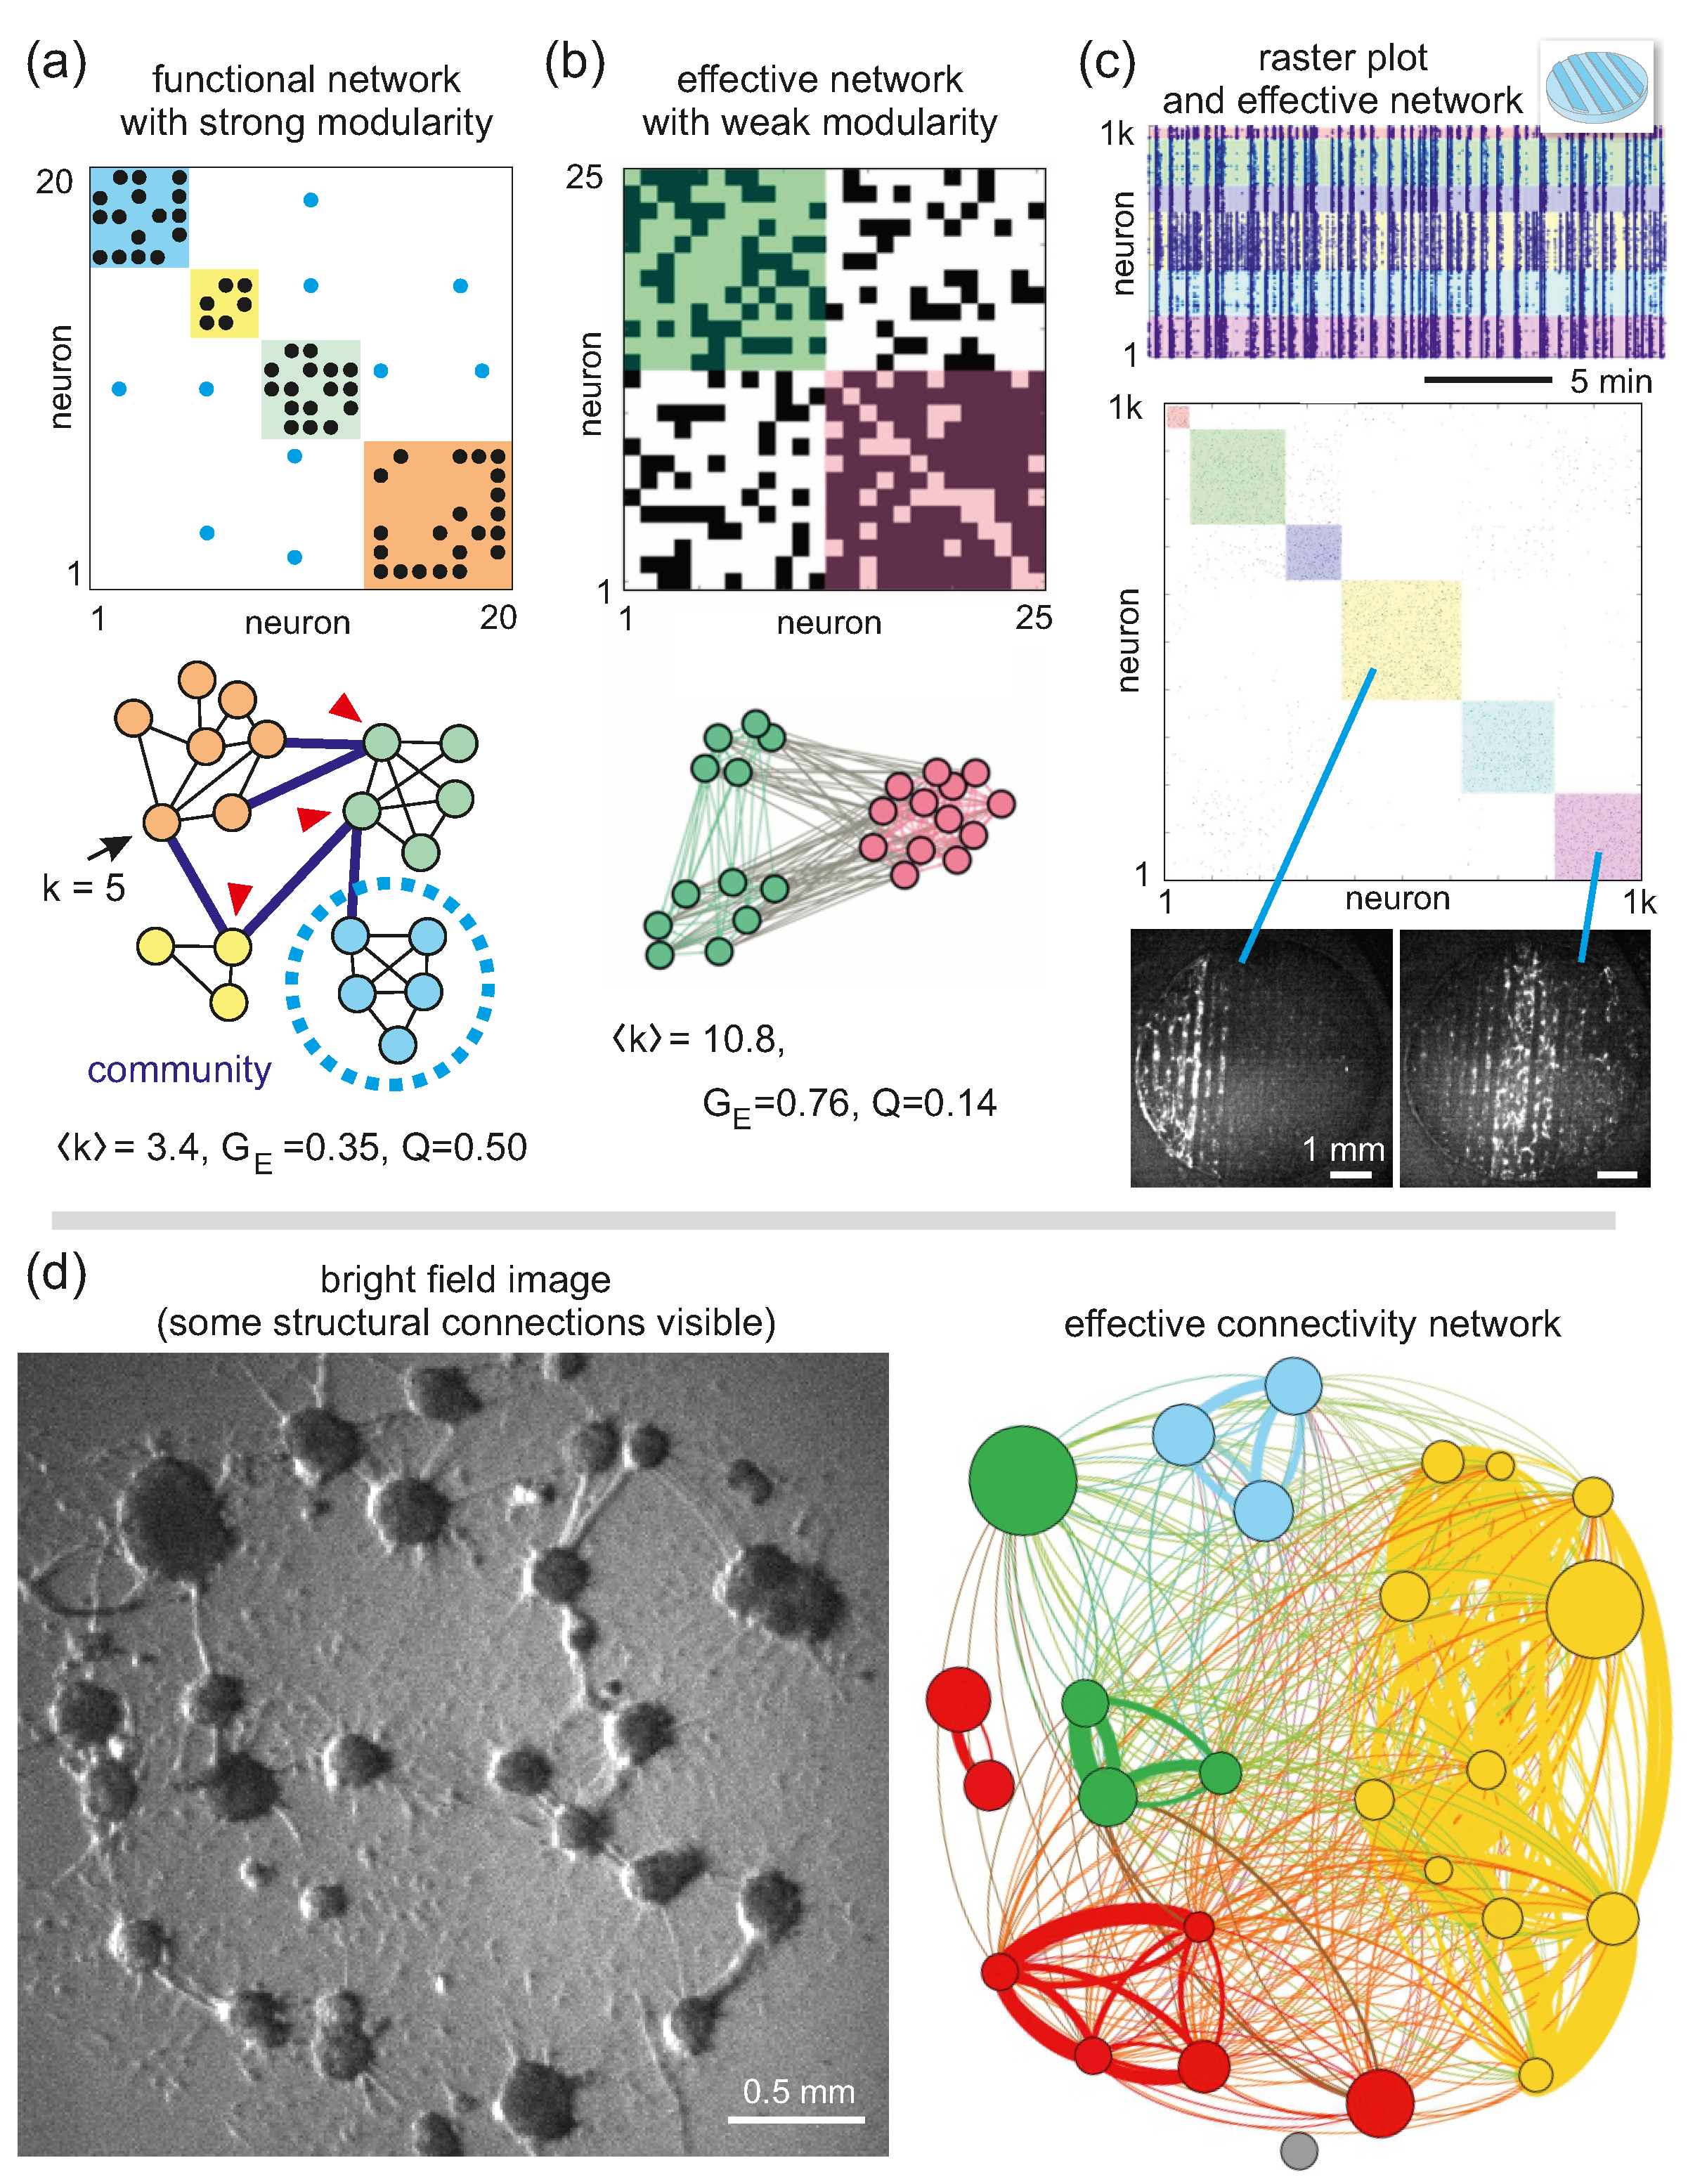
Neuronal cultures are ideal systems to be analyzed in the context of complex networks (or graph theory), a branch of knowledge that emerged from statistical physics [78,79] to become an active field of research by itself and a fundamental partner of modern neuroscience [80,81,82]. Broadly speaking, a complex network is based on an ensemble of nodes that interact to one another through links (Figure 6a). In neuroscience, nodes are typically neurons or brain regions, depending on the scale of the system under study, and links can be either structural connections, i.e., actual physical synapses, or activity-related interactions. The latter may take two forms, namely functional and effective connections [83]. A functional connection refers to a statistical dependence between the activity patterns of two nodes [84] and is typically computed using cross correlation. Thus, two neurons with a similar train of spikes would have a strong functional connectivity. Effective connectivity refers explicitly to the existence of a causal relationship, i.e., it accounts for the direct influence that one node exerts over another [85,86], and allows for establishing the directionality of the interaction. Effective connectivity is typically calculated by using information-theoretic approaches such as transfer entropy [87,88]. Thus, a neuron i whose activity causes a direct response on a neuron j would shape a strong effective connection .
Since functional connections do not capture the directionality of interactions, they shape connectivity matrices that are symmetric (Figure 6a, top), while effective connections shape asymmetric matrices (Figure 6b, top). Representations of matrices as network maps (Figure 6a,b, bottom) allow for better understanding the structure of networks, particularly when nodes are embedded in a physical space, such as neurons in culture or cortical circuits in the brain. Networks embedded in a physical space are termed ‘spatial networks’ [89] and are particularly important in neuroscience for the complex trade-off between spatial constraints, circuit organization, wiring costs, and overall performance [90,91].
Once an ensemble of nodes is defined and connectivity is established, the true power of complex networks analysis is that it allows for extracting a series of descriptors or ‘network measures’ that inform about the statistical properties of the studied network [80]. Some descriptors are relatively intuitive and straightforward, such as the number of connections k of a node or the average connectivity of the network (Figure 6a,b), while others require advanced knowledge of networks and computation of descriptors, such the global network efficiency , modularity Q, or the existence of hubs. Intuitively, the global efficiency refers to the easiness for information to flow across the network and is related to the number of topological steps required by any two nodes to reach one another [92]. The network in Figure 6a has much less connections that the one in Figure 6b, and therefore communication is much less efficient for the former, procuring a lower . Modularity is related to the presence of modules or communities [93,94], understood as sets of nodes that are more densely linked between themselves than with nodes in other communities. Communities in the network of Figure 6a are neatly defined as compared to those in Figure 6b, and therefore the former network has a much higher Q. Hubness refers to the presence of nodes (hubs) that are crucial for network structure and performance, for instance because they have a high connectivity or because they link communities together [95,96]. Hubs are thus important in the context of network robustness and resilience to damage, since their loss may totally disrupt network organization. The red arrows in Figure 6a mark those nodes that link communities, thus playing a role as ‘connector hubs’.
In our research, we extensively used resources from complex networks to describe, quantify, and model the organization of our in vitro and in silico cultures, particularly during development [19,21], when modeling the impact of modularity and spatial constraints [16,22], or when physicochemical perturbations were applied [12,14]. In most cases, we computed effective connectivity from raster plots and extracted all relevant information. It must be noted that we, and other groups, often used the term functional organization to refer to all set of network properties exhibited by our neuronal cultures, although the obtained connectivity matrices are effective, i.e., computed using transfer entropy.
In the process of analyzing our data in the context of complex networks, we poured substantial efforts to develop new mathematical tools to compute effective connectivity from calcium imaging recordings, which is our main source of experimental data. Thus, and in partnership with theoretical research groups, we developed a new analysis framework termed ‘generalized transfer entropy’ that allows for separating different dynamic regimes, particularly those involving strongly correlated activity (networks bursts) or less correlated, individual activations [15,17,18]. In these studies, we also investigated under which conditions structural connectivity could be predicted from spontaneous activity recordings, and even launched an international initiative to develop new methods for connectivity inference [97].
The typical analysis pipeline of our experimental data is illustrated in Figure 6c. The original fluorescence data are converted into a raster plot as explained before and then data processed to consider either events of coordinated activity or individual activations. We typically focus on coordinated activity since it reflects large-scale network interactions, which may notably change during development, engineering actions or perturbations. Causal relationships between the activity patterns of neuronal pairs are then quantified using transfer entropy, and results compared with null models or data surrogates to establish the significance of detected effective interactions. The final effective network, with non-significant connections excluded, is typically a directed and weighted matrix, where the weight represents the strength of the effective interaction, for instance neurons that very frequently influence one another. The data are often binarized for simplicity, as shown in Figure 6c, retaining (and setting to ‘1’) the connections above a threshold, leaving the rest as ‘0’. Network properties (, , Q, hubness and many others) are then computed on these networks and the matrix rearranged to highlight the communities. The raster plot is also ordered accordingly, so that interesting dynamic events can be easily portrayed. For instance, for the particular experiments of Figure 6c with topographical patterns, we observed that the observed communities corresponded to network activations of specific spatiotemporal structure: the yellow and pink communities correspond to coordinated activation on the left side of the culture and in its center, respectively [19].
In general, interpreting the obtained effective networks and the implications of the computed network properties is very difficult, and we often required substantial control experiments and numerical simulations to fully grasp the implications of observed phenomena. An example is provided in Figure 6d, in which we recorded activity in an aggregated culture and obtained its effective network [41], characterized by a modular organization that, again, reflected the most common activity patterns. Additionally, by using a bright field image of the culture, we could extract the most important structural connections and compared them with those from the effective network. We observed that effective connections were much more abundant than structural ones, indicating that the flow of information and dynamic correlations are difficult to predict just from observing major structural traits. We also observed that, in general, it is not possible to obtain effective networks that match structural connectivity from just spontaneous activity recordings.
6. The Study of Neurological Disorders In Vitro
The above complex networks framework has become, in just a decade, the most important analytical toolbox to understand and model neurological and psychiatric disorders [98,99]. Disorders broadly include those alterations caused by acute damage (e.g., stroke and traumatic brain injury), neurodevelopmental deficits (autism, schizophrenia), and neurodegenerative diseases (Alzheimer’s, Huntington’s, Parkinson’s) [100,101,102]. Modern studies aim at relating structural alterations due to disease with functional or cognitive deficits and their evolution over time. For that, it has been necessary to develop experimental and analytical resources to adequately compare structural and functional networks, both in health and disease. Then, different network measures are evaluated, such as the , , Q, or hubness outlined above (among many others) in an effort to understand those network traits that more prominently describe the observed alterations. Finally, models can be constructed based on the gathered data to develop better prognosis tools, design treatments, or test the goodness of therapies. The effort is substantially difficult since the spectrum of relevant network measures to explore is very broad [80] and their relative importance may change from one disease to another. However, two network measures that are in the spotlight of most studies are modular organization and hubness, since they are ubiquitous properties in brain networks [96,103,104] and are in general severely affected upon disease or network damage. For instance, some studies suggested that modularity is weakened in schizophrenia, leading to an excessive integration of brain circuits [105], while, in Alzheimer’s disease, it was shown that the pathology targeted high-connectivity hub regions, accelerating cognitive damage [96,106].
The medical complexity of neurological diseases, in which altered genetic, molecular, or physiological mechanisms echo across multiple brain circuits and spatiotemporal scales, has favored the use of neuronal cultures as a complementary tool to carry out experiments in a control environment, help developing models and new network metrics, and even provide an exploratory scenario to test pharmacological agents or therapies. It is in this context that our laboratory joined the medical community in different research institutes and universities to provide experiments and analysis tools that have demonstrated to be highly valuable and informative.
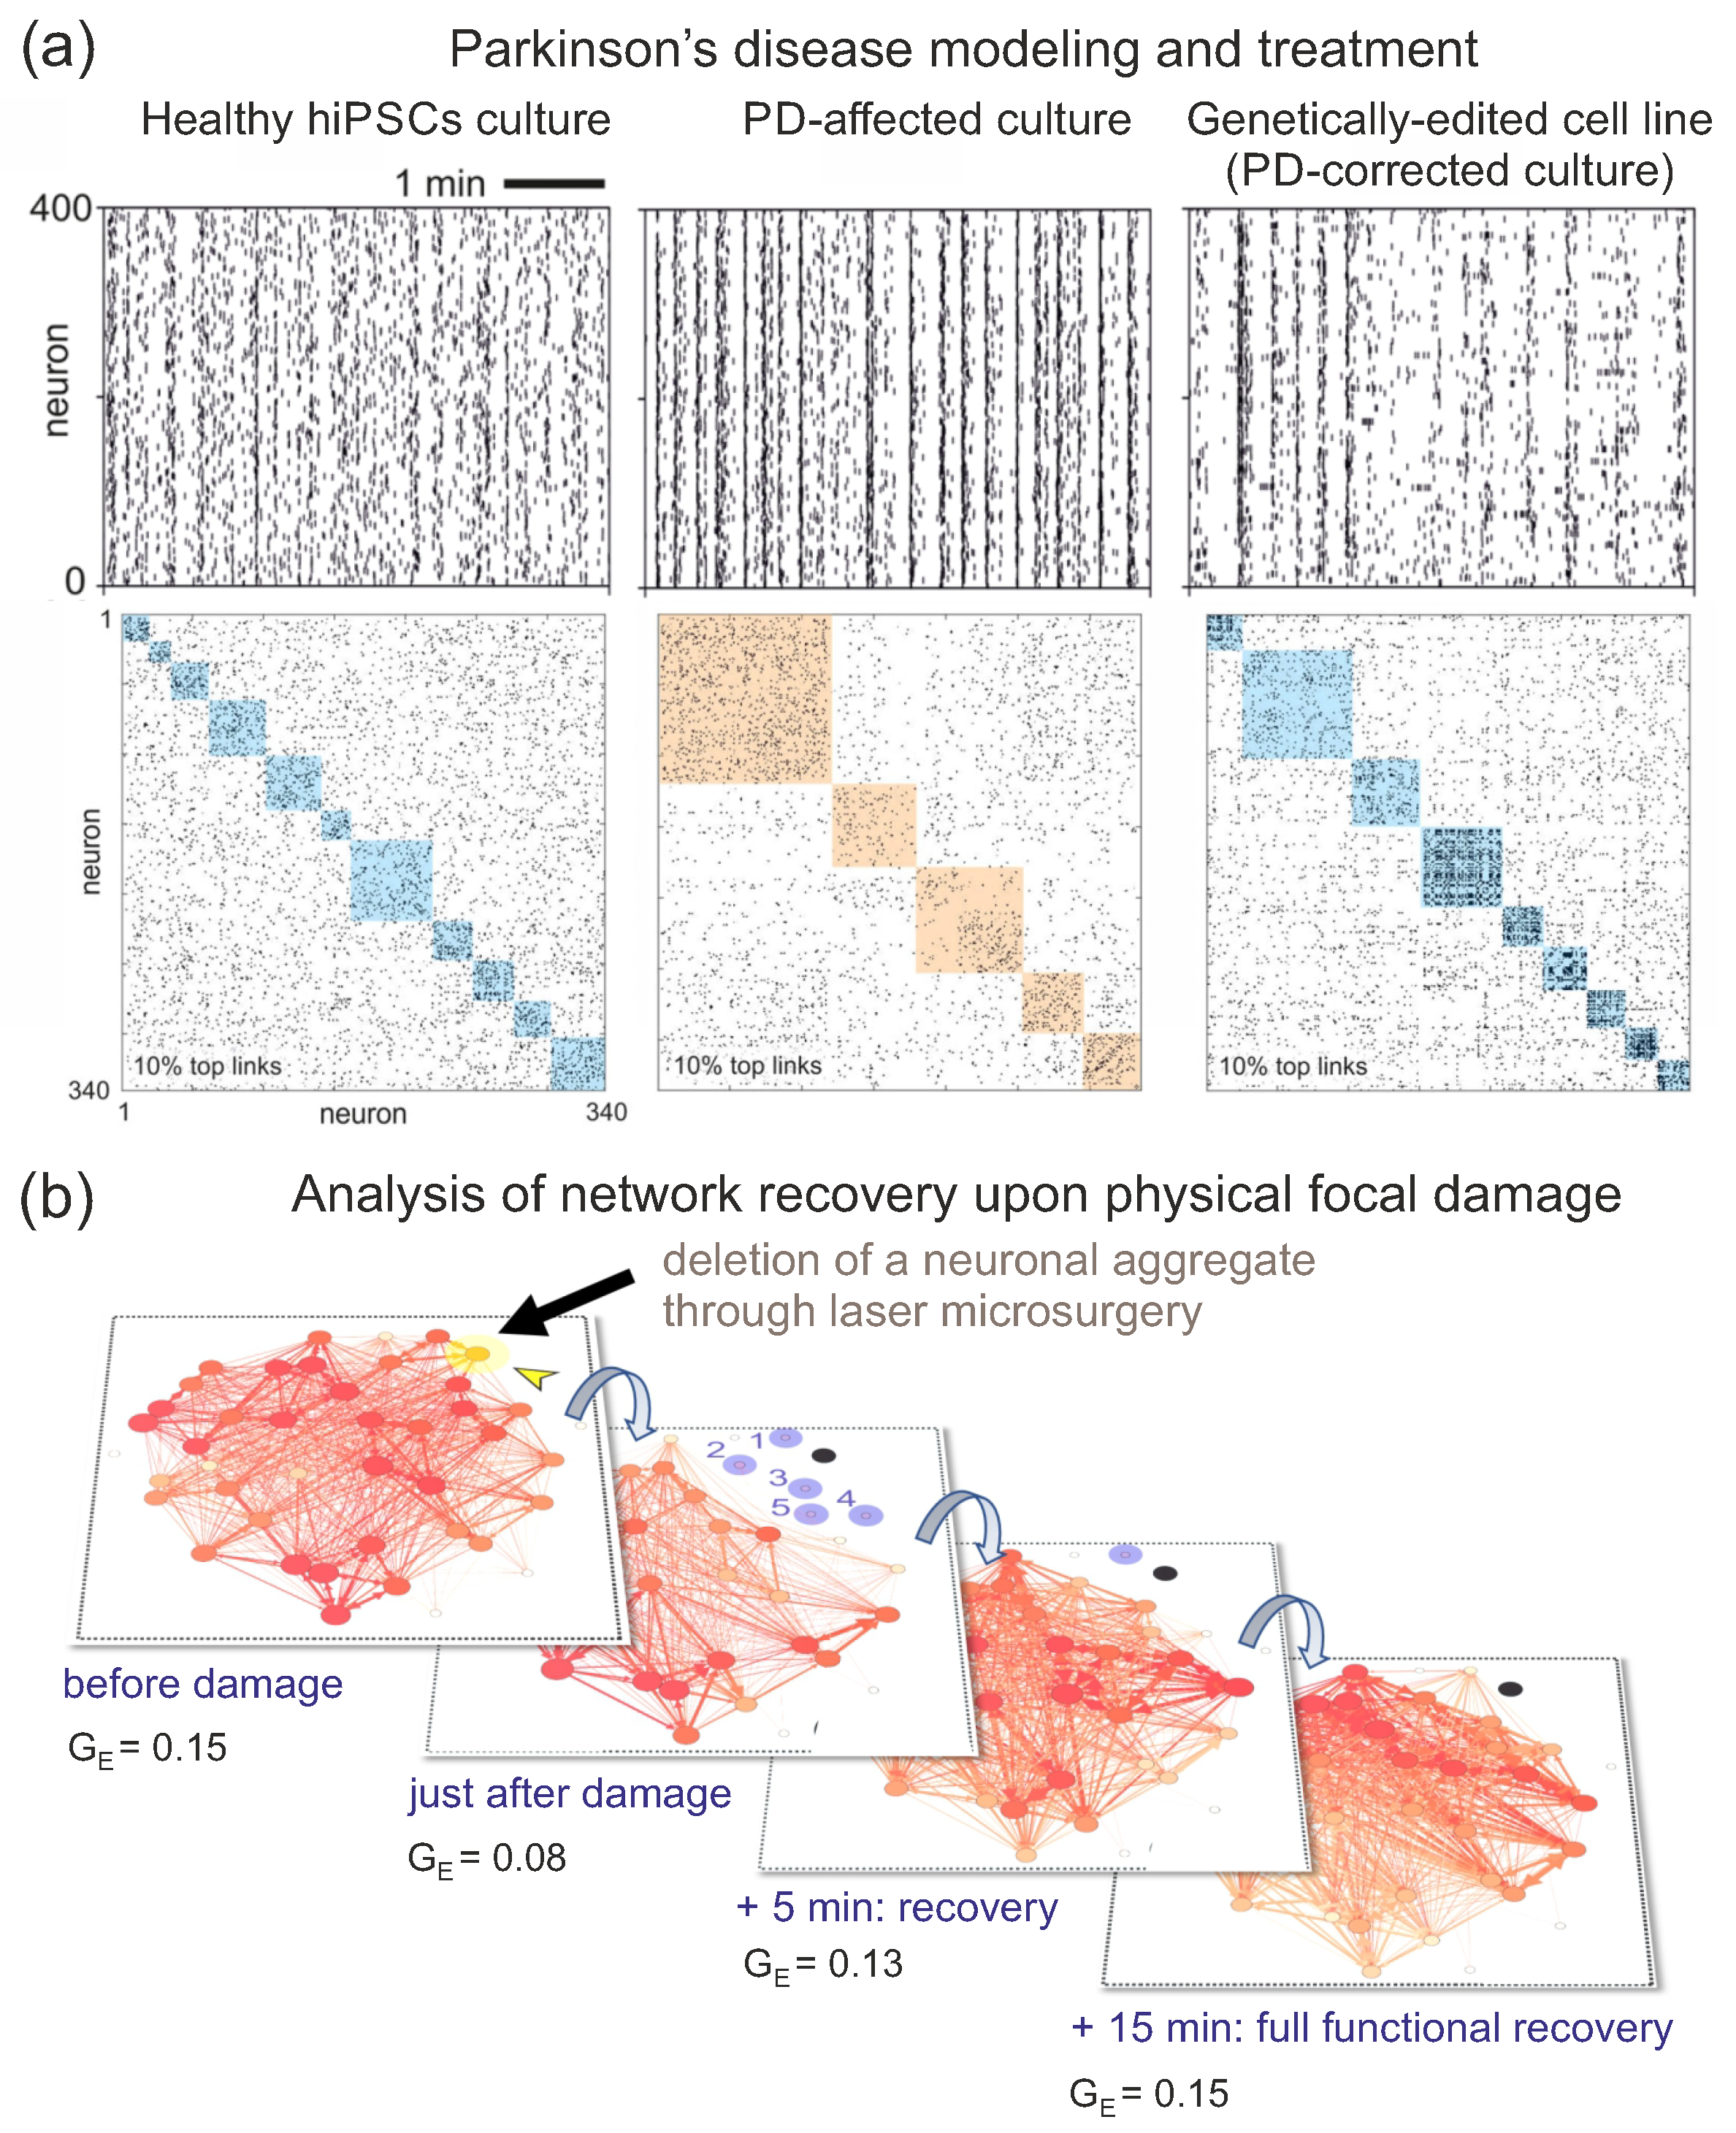
A first example of our efforts is in the context of genetic variants of Parkinson’s disease (PD), in which we investigated network alterations during the development of affected hiPSC-derived cultures [20,27] and explored the capacity of CRISPR-Cas9 gene editing to correct for the genetic anomaly and restore cultures’ health [20,28,29]. As shown in Figure 7a, left, healthy cultures display raster plots in which mild network bursts are combined with abundant individual activations, leading to effective connectivity matrices with a rich set of small communities. For PD cultures, by contrast (Figure 7a, center), raster plots are dominated by strong network-wide bursts that shape an effective networks with relatively bigger communities, indicating an excessive integration in the network, i.e., PD cultures have a smaller Q than controls [20]. Interestingly, the gene-edited cell line exhibits a behavior that relaxes this strong bursting (Figure 7a, right), leading to a raster plot and an effective connectivity matrix that approaches the healthy condition.
A second example is shown in Figure 7b, in which we used aggregated rat primary cultures to study the impact of a focal lesion in network communication, and explored the characteristic time of the cultures to recover their pre-damage activity levels [13]. The experiment was designed as an in vitro model of stroke, in which a focal lesion can cause a cascade of damage and network degradation. As shown in the figure, damage caused the irreversible loss of the targeted aggregate and led to the silencing (functional disconnection) of the aggregates surrounding the damage focus. Overall network communication was also affected, as revealed by a decrease in the density of effective connections throughout the network as well as a drop of the global efficiency by a factor 2. However, only 5 min were required for the network to functionally reconnect with most of the silent aggregates, reaching full restoration of activity and communication in another 15 min, with the system exhibiting the same as before damage. This experiment demonstrated the capacity of neuronal circuits to cope with damage, activate response mechanisms, and restore network activity and communication. We carried out similar explorations in other investigations, specifically to quantify response to damage upon a chemical perturbation [12], biochemical damage [14], physical injury [11], and loss of hubs through focal lesions [11].
Altogether, our partnership with medical teams provided answers to difficult human-level explorations or preliminary results for future human therapies. Our compromise is strong and, in addition to Parkinson’s disease and the above physicochemical actions, we have contributed to advance biomedical questions in Sanfilippo [30], Huntington’s disease [25,26,31], Alzheimer’s disease [14], and cellular prion pathogenesis [32].
7. Towards Brain-on-Chip Systems
The experiments in neuronal cultures delineated here are just a fraction of ongoing research projects in our group and collaborators. One of the most fascinating ideas that we are presently exploring is to increase neuronal cultures organizational complexity to approach brain-like structure and dynamics, both to understand its functioning, e.g., processing of information, memory and learning, and to develop advanced platforms for the modeling and treatment of neurological disorders using hiPSCs. For instance, we are exploring the capacity of designing and visualizing three-dimensional (3D) neuronal cultures, which allow for richer structural designs and more accurately replicating human-like physiology. In these 3D networks, neurons grow within scaffolds that provide structural support and connectivity guidance, as we showed in recent works [23,24]. We are also exploring the possibility to combine different neuronal types and ratios of excitation and inhibition, with the goal to expand our understanding of the repertoire of collective activity patterns in relation to the underpinned network layout.
8. Limitations and Challenges of Neuronal Cultures
Despite the success of neuronal cultures as experimental model systems, they have important drawbacks that limit their use as brain models, both in primary and hiPSCs-derived cultures.
For primary neuronal cultures, a first drawback is associated with the loss of native network organization, both in connectivity and neuronal types. Thus, whereas native neuronal circuits exhibit a predefined organization to suit in vivo functions, neuronal cultures just shape random assemblies of interconnected neurons with no specific tasks. The neuronal network that emerges has to be tailored through engineering, stimulation, or other means to shape circuits with computational capacities, e.g., pattern recognition [107], motor control [108], or interaction with the environment [109,110]. A second drawback is the characteristic bursting behavior of standard primary cultures [42,64,66], in which most neurons in the culture spontaneously activate in a highly coherent manner in a short time window. This bursting appears by the end of the first week in vitro [42], may remain for the entire lifetime of the culture [111], and it is in general resilient to biochemical perturbations [6] or damage [112]. Although connectivity evolves in a non-random manner and rich micro-architectures emerge during development [113,114,115], such a dominant network-wide bursting may be problematic in those studies that explore development or alterations in a neuronal culture from a functional point of view, since the ever present bursting portrays a highly correlated network in which details of interest at the micro-scale are masked or difficult to resolve. This may explain the challenge in assessing strong functional differences between healthy and diseased neuronal networks in models of neurological disorders in vitro, e.g., as in our work in Ref. [26]. In addition, a third drawback is the lack of any intrinsic stimulation that plays the role of sensory input. A growing number of experiments are providing evidence on the capacity of stimulation to modulate spontaneous bursting activity [116,117] and induce learning [109,118]. Stimulation may therefore be a crucial ingredient to shape more accurate and versatile brain-like in vitro models.
For hiPSCs-derived cultures, a first drawback is the variability in cell types and maturation levels within the same culture and that often leads to a large variety of neuronal activity patterns difficult to classify, e.g., as in our study in Ref. [25]. This variability makes it difficult to design tailored, brain-on-chip network designs, such as cortical assemblies with desired excitation and inhibition populations. A second drawback is the gradual evolution of hiPSCs-derived cultures during maturation, both in dynamics and functional organization, as we reported recently in Estévez-Priego et al. [21], and in agreement with other studies [119,120]. Along this development, the neuronal population gradually evolves from sparse activations to network-wide bursting events in about 3 weeks [21], and that contrasts with the ever present network bursting of primary cultures. Although this evolution of activity in hiPSCs-derived culture is interesting by itself to understand the formation and development of brain circuits, it may also be problematic when investigating alterations due to disease, since intrinsic maturation crisscrosses with neuronal death or connectivity deterioration, making a comprehensive characterization of network dysfunction very difficult.
Finally, drawbacks and difficulties that are common to both primary and hiPSCs-derived cultures include the role of glial cells and plasticity. On the one hand, glial cells are typically grown together with neurons in culture, and it is generally accepted that glia support the formation of the neuronal network. However, the density of glia and their interrelation with neurons are often disregarded, despite growing evidence of an intimate relation between the two populations [39,121,122]. On the other hand, living neuronal networks exhibit strong homeostatic plasticity [123,124], i.e., neurons adjust their connectivity strength, among other mechanisms, to counterbalance perturbations and maintain a similar level of activity. We studied this problem by itself [12] or in the context of damage [11,13], and realized how quickly and strongly the neuronal cultures react to perturbations. Plasticity is difficult to quantify and track, and may therefore mask other biological mechanisms or blend with them, making it very cumbersome to precisely understand what occurs in the network. Thus, altogether, despite the goodness of neuronal cultures as models systems, it is important to be aware of all the intrinsic, and often uncontrollable, multi-scale mechanisms that simultaneously occur in the culture, and be cautious in the interpretation of results and the elaboration of conclusions, particularly in the context of neurological disorders.
9. Future Directions
New technologies, such as optogenetics [125,126] or high-density multielectrode arrays [127], are offering interesting perspectives to act on neuronal cultures while activity is monitored, and addresses some of the drawbacks outlined above. Indeed, external actuation can be viewed as sensory input, e.g., by delivering patterns of stimulation in specific areas of the culture. Stimulation enables training and feedback responses of the neuronal cultures [128], a necessary ingredient to investigate biological computation at a neuronal network level and, possibly, to develop artificial intelligence and machine learning capabilities in in vitro systems. In this direction, our group and collaborators are exploring the capacity of neuronal cultures to interlink with electronic systems and robots. Such concepts are enlightening from a scientific point of view in the quest for developing implants and biohybrid systems [109]. Experiments in the last several years have demonstrated the capacity of neuronal cultures to interact with robotic arms [108] or simulated game-worlds [110], opening new and exciting avenues in the near future in which we will actively engage.
Altogether, present research in neuronal cultures faces the challenge to integrate engineering, stimulation, control of developmental cues, and access to neuronal activity in a single setup. This illustrates the long way to go and the fascinating goal to integrate different disciplines and technologies.
Funding
This research was supported by the European Union’s Horizon 2020 research and innovation program under Grant No. 713140 (project MESO-BRAIN) and No. 964977 (project NEU-ChiP), by the Spanish Ministerio de Ciencia e Innovación under project PID2019-108842GB-C21, and by the Generalitat de Catalunya under project 2021-SGR-00450. The project leading to these results also received funding from “la Caixa” Foundation (ID 100010434) under the agreement LCF/PR/HR19/52160007.
Data Availability Statement
No new data were created or analyzed in this study. Data sharing is not applicable to this article.
Acknowledgments
I would to like to thank the senior scientists that strongly supported the research presented here, in particular Elisha Moses, Jaume Casademnunt, and Hideaki Yamamoto. I would also like to thank all PhD students and postdocs that carried out the research, either in the laboratory, in their computers, or in their brains: Javier G. Orlandi, Sara Teller, Elisenda Tibau, Lluís Hernández, Daniel Malagarriga, Giulia Carola, Estefanía Estévez, Adriaan Ludl, Clara Fernández, Marc Montalà, Sergio Faci, Laia Barjuan, Sàlem Ayasreh, Imanol Jurado, Akke Houben, Anna-Christina Häb, and Daniel Tornero.
Conflicts of Interest
The author declares no conflict of interest.
References
- Ramón y Cajal, S. Neuron Theory or Reticular Theory (1935); Purkiss, M.U., Fox, C.A., Eds.; Consejo Superior de Investigaciones Cientificas, Instituto Ramon y Cajal: Madrid, Spain, 1954. [Google Scholar]
- Guillery, R. Observations of synaptic structures: Origins of the neuron doctrine and its current status. Philos. Trans. R. Soc. B Biol. Sci. 2005, 360, 1281–1307. [Google Scholar] [CrossRef] [PubMed] [Green Version]
- Saceleanu, V.M.; Mohan, A.G.; Covache-Busuioc, R.A.; Costin, H.P.; Ciurea, A.V. Wilhelm von Waldeyer: Important Steps in Neural Theory, Anatomy and Citology. Brain Sci. 2022, 12, 224. [Google Scholar] [CrossRef] [PubMed]
- Yuste, R. From the neuron doctrine to neural networks. Nat. Rev. Neurosci. 2015, 16, 487–497. [Google Scholar] [CrossRef] [PubMed]
- Millet, L.J.; Gillette, M.U. Over a century of neuron culture: From the hanging drop to microfluidic devices. Yale J. Biol. Med. 2012, 85, 501–521. [Google Scholar] [PubMed]
- Tibau, E.; Valencia, M.; Soriano, J. Identification of neuronal network properties from the spectral analysis of calcium imaging signals in neuronal cultures. Front. Neur. Circ. 2013, 7, 199. [Google Scholar] [CrossRef]
- Orlandi, J.G.; Soriano, J.; Alvarez-Lacalle, E.; Teller, S.; Casademunt, J. Noise focusing and the emergence of coherent activity in neuronal cultures. Nat. Phys. 2013, 9, 582–590. [Google Scholar] [CrossRef]
- Hernández-Navarro, L.; Faci-Lázaro, S.; Orlandi, J.G.; Feudel, U.; Gómez-Gardeñes, J.; Soriano, J. Noise-driven amplification mechanisms governing the emergence of coherent extreme events in excitable systems. Phys. Rev. Res. 2021, 3, 023133. [Google Scholar] [CrossRef]
- Faci-Lázaro, S.; Soriano, J.; Gómez-Gardeñes, J. Impact of targeted attack on the spontaneous activity in spatial and biologically-inspired neuronal networks. Chaos 2019, 29, 083126. [Google Scholar] [CrossRef]
- Hernández-Navarro, L.; Orlandi, J.G.; Cerruti, B.; Vives, E.; Soriano, J. Dominance of Metric Correlations in Two-Dimensional Neuronal Cultures Described through a Random Field Ising Model. Phys. Rev. Lett. 2017, 118, 208101. [Google Scholar] [CrossRef] [Green Version]
- Ayasreh, S.; Jurado, I.; López-León, C.; Montalà-Flaquer, M.; Soriano, J. Dynamic and Functional Alterations of Neuronal Networks In Vitro upon Physical Damage: A Proof of Concept. Micromachines 2022, 13, 2259. [Google Scholar] [CrossRef]
- Estévez-Priego, E.; Teller, S.; Granell, C.; Arenas, A.; Soriano, J. Functional strengthening through synaptic scaling upon connectivity disruption in neuronal cultures. Netw. Neurosci. 2020, 4, 1160–1180. [Google Scholar] [CrossRef]
- Teller, S.; Estévez-Priego, E.; Granell, C.; Tornero, D.; Andilla, J.; Olarte, O.E.; Loza-Alvarez, P.; Arenas, A.; Soriano, J. Spontaneous functional recovery after focal damage in neuronal cultures. eNeuro 2020, 7, 0254-19.2019. [Google Scholar] [CrossRef] [PubMed]
- Teller, S.; Tahirbegi, I.B.; Mir, M.; Samitier, J.; Soriano, J. Magnetite-Amyloid-β deteriorates activity and functional organization in an in vitro model for Alzheimer’s disease. Sci. Rep. 2015, 5, 17261. [Google Scholar] [CrossRef] [PubMed] [Green Version]
- Tibau, E.; Ludl, A.A.; Rudiger, S.; Orlandi, J.G.; Soriano, J. Neuronal Spatial Arrangement Shapes Effective Connectivity Traits of in vitro Cortical Networks. IEEE Trans. Netw. Sci. Eng. 2020, 7, 435–448. [Google Scholar] [CrossRef] [Green Version]
- Ludl, A.A.; Soriano, J. Impact of Physical Obstacles on the Structural and Effective Connectivity of in silico Neuronal Circuits. Front. Comput. Neurosci. 2020, 14, 77. [Google Scholar] [CrossRef]
- Stetter, O.; Battaglia, D.; Soriano, J.; Geisel, T. Model-free reconstruction of excitatory neuronal connectivity from calcium imaging signals. PLoS Comput. Biol. 2012, 8, e1002653. [Google Scholar] [CrossRef] [Green Version]
- Orlandi, J.G.; Stetter, O.; Soriano, J.; Geisel, T.; Battaglia, D. Transfer entropy reconstruction and labeling of neuronal connections from simulated calcium imaging. PLoS ONE 2014, 9, e98842. [Google Scholar] [CrossRef] [Green Version]
- Montalà-Flaquer, M.; López-León, C.F.; Tornero, D.; Houben, A.M.; Fardet, T.; Monceau, P.; Bottani, S.; Soriano, J. Rich dynamics and functional organization on topographically designed neuronal networks in vitro. iScience 2022, 25, 105680. [Google Scholar] [CrossRef]
- Carola, G.; Malagarriga, D.; Calatayud, C.; Pons-Espinal, M.; Blasco-Agell, L.; Richaud-Patin, Y.; Fernandez-Carasa, I.; Baruffi, V.; Beltramone, S.; Molina, E.; et al. Parkinson’s disease patient-specific neuronal networks carrying the LRRK2 G2019S mutation unveil early functional alterations that predate neurodegeneration. npj Parkinson’s Dis. 2021, 7, 1–14. [Google Scholar] [CrossRef]
- Estévez-Priego, E.; Moreno-Fina, M.; Monni, E.; Kokaia, Z.; Soriano, J.; Tornero, D. Long-term calcium imaging reveals functional development in hiPSC-derived cultures comparable to human but not rat primary cultures. Stem Cell Rep. 2023, 18, 1–15. [Google Scholar] [CrossRef]
- Yamamoto, H.; Moriya, S.; Ide, K.; Hayakawa, T.; Akima, H.; Sato, S.; Kubota, S.; Tanii, T.; Niwano, M.; Teller, S.; et al. Impact of modular organization on dynamical richness in cortical networks. Sci. Adv. 2018, 4, eaau4914. [Google Scholar] [CrossRef] [PubMed] [Green Version]
- Crowe, J.A.; El-Tamer, A.; Nagel, D.; Koroleva, A.V.; Madrid-Wolff, J.; Olarte, O.E.; Sokolovsky, S.; Estevez-Priego, E.; Ludl, A.A.; Soriano, J.; et al. Development of two-photon polymerised scaffolds for optical interrogation and neurite guidance of human iPSC-derived cortical neuronal networks. Lab Chip 2020, 20, 1792–1806. [Google Scholar] [CrossRef] [PubMed]
- Koroleva, A.; Deiwick, A.; El-Tamer, A.; Koch, L.; Shi, Y.; Estévez-Priego, E.; Ludl, A.A.; Soriano, J.; Guseva, D.; Ponimaskin, E.; et al. In Vitro Development of Human iPSC-Derived Functional Neuronal Networks on Laser-Fabricated 3D Scaffolds. ACS Appl. Mater. Interfaces 2021, 13, 7839–7853. [Google Scholar] [CrossRef] [PubMed]
- Comella-Bolla, A.; Orlandi, J.G.; Miguez, A.; Straccia, M.; García-Bravo, M.; Bombau, G.; Galofré, M.; Sanders, P.; Carrere, J.; Segovia, J.C.; et al. Human Pluripotent Stem Cell-Derived Neurons Are Functionally Mature In Vitro and Integrate into the Mouse Striatum Following Transplantation. Mol. Neurobiol. 2020, 57, 2766–2798. [Google Scholar] [CrossRef]
- Fernández-García, S.; Orlandi, J.G.; Barriga, G.A.G.D.; Rodríguez, M.J.; Masana, M.; Soriano, J.; Alberch, J. Deficits in coordinated neuronal activity and network topology are striatal hallmarks in Huntington’s disease. BMC Biol. 2020, 18, 58. [Google Scholar] [CrossRef]
- di Domenico, A.; Carola, G.; Calatayud, C.; Pons-Espinal, M.; Muñoz, J.P.; Richaud-Patin, Y.; Fernandez-Carasa, I.; Gut, M.; Faella, A.; Parameswaran, J.; et al. Patient-Specific iPSC-Derived Astrocytes Contribute to Non-Cell-Autonomous Neurodegeneration in Parkinson’s Disease. Stem Cell Rep. 2019, 12, 213–229. [Google Scholar] [CrossRef] [Green Version]
- Fernández-Santiago, R.; Carballo-Carbajal, I.; Castellano, G.; Torrent, R.; Richaud, Y.; Sánchez-Danés, A.; Vilarrasa-Blasi, R.; Sánchez-Pla, A.; Mosquera, J.L.; Soriano, J.; et al. Aberrant epigenome in iPSC--derived dopaminergic neurons from Parkinson’s disease patients. EMBO Mol. Med. 2015, 7, 1529–1546. [Google Scholar] [CrossRef]
- Calatayud, C.; Carola, G.; Fernández-Carasa, I.; Valtorta, M.; Jiménez-Delgado, S.; Díaz, M.; Soriano-Fradera, J.; Cappelletti, G.; García-Sancho, J.; Raya, Á.; et al. CRISPR/Cas9-mediated generation of a tyrosine hydroxylase reporter iPSC line for live imaging and isolation of dopaminergic neurons. Sci. Rep. 2019, 9, 6811. [Google Scholar] [CrossRef] [Green Version]
- Canals, I.; Soriano, J.; Orlandi, J.G.; Torrent, R.; Richaud-Patin, Y.; Jiménez-Delgado, S.; Merlin, S.; Follenzi, A.; Consiglio, A.; Vilageliu, L.; et al. Activity and high-order effective connectivity alterations in sanfilippo C patient-specific neuronal networks. Stem Cell Rep. 2015, 5, 546–557. [Google Scholar] [CrossRef] [Green Version]
- Barriga, G.G.D.; Giralt, A.; Anglada-Huguet, M.; Gaja-Capdevila, N.; Orlandi, J.G.; Soriano, J.; Canals, J.M.; Alberch, J. 7,8-dihydroxyflavone ameliorates cognitive and motor deficits in a Huntington’s disease mouse model through specific activation of the PLCγ1 pathway. Hum. Mol. Genet. 2017, 26, 3144–3160. [Google Scholar] [CrossRef]
- Matamoros-Angles, A.; Hervera, A.; Soriano, J.; Martí, E.; Carulla, P.; Llorens, F.; Nuvolone, M.; Aguzzi, A.; Ferrer, I.; Gruart, A.; et al. Analysis of co-isogenic prion protein deficient mice reveals behavioral deficits, learning impairment, and enhanced hippocampal excitability. BMC Biol. 2022, 20, 17. [Google Scholar] [CrossRef] [PubMed]
- Cobb, M. The Idea of the Brain: The Past and Future of Neuroscience; Hachette: London, UK, 2020. [Google Scholar]
- Wellbourne-Wood, J.; Chatton, J.Y. From Cultured Rodent Neurons to Human Brain Tissue: Model Systems for Pharmacological and Translational Neuroscience. ACS Chem. Neurosci. 2018, 9, 1975–1985. [Google Scholar] [CrossRef] [PubMed] [Green Version]
- Shi, Y.; Inoue, H.; Wu, J.C.; Yamanaka, S. Induced pluripotent stem cell technology: A decade of progress. Nature Reviews Drug Discovery 2017, 16, 115–130. [Google Scholar] [CrossRef] [PubMed]
- Nikolakopoulou, P.; Rauti, R.; Voulgaris, D.; Shlomy, I.; Maoz, B.M.; Herland, A. Recent progress in translational engineered in vitro models of the central nervous system. Brain 2021, 143, 3181–3213. [Google Scholar] [CrossRef]
- Salazar, I.; Mele, M.; Caldeira, M.; Costa, R.; Correia, B.; Frisari, S.; Duarte, C. Preparation of Primary Cultures of Embryonic Rat Hippocampal and Cerebrocortical Neurons. Bio-protocol 2017, 7, 1–11. [Google Scholar] [CrossRef]
- Spanu, A.; Tedesco, M.; Martinoia, S.; Bonfiglio, A. In Vitro Neuronal Networks; Advances in Neurobiology; Springer International Publishing: Berlin, Germany, 2019; Volume 22, pp. 155–167. [Google Scholar] [CrossRef]
- Allen, N.J.; Barres, B.A. Glia—More than just brain glue. Nature 2009, 457, 675–677. [Google Scholar] [CrossRef]
- Shi, M.; Majumdar, D.; Gao, Y.; Brewer, B.M.; Goodwin, C.R.; McLean, J.A.; Li, D.; Webb, D.J. Glia co-culture with neurons in microfluidic platforms promotes the formation and stabilization of synaptic contacts. Lab. Chip. 2013, 13, 3008–3021. [Google Scholar] [CrossRef] [Green Version]
- Teller, S.; Granell, C.; De Domenico, M.; Soriano, J.; Gómez, S.; Arenas, A. Emergence of Assortative Mixing between Clusters of Cultured Neurons. PLoS Comput. Biol. 2014. [Google Scholar] [CrossRef] [Green Version]
- Cohen, E.; Ivenshitz, M.; Amor-Baroukh, V.; Greenberger, V.; Segal, M. Determinants of spontaneous activity in networks of cultured hippocampus. Brain Res. 2008, 1235, 21–30. [Google Scholar] [CrossRef]
- Takahashi, K.; Yamanaka, S. Induction of Pluripotent Stem Cells from Mouse Embryonic and Adult Fibroblast Cultures by Defined Factors. Cell 2006, 126, 663–676. [Google Scholar] [CrossRef] [Green Version]
- Takahashi, K.; Tanabe, K.; Ohnuki, M.; Narita, M.; Ichisaka, T.; Tomoda, K.; Yamanaka, S. Induction of Pluripotent Stem Cells from Adult Human Fibroblasts by Defined Factors. Cell 2007, 131, 861–872. [Google Scholar] [CrossRef] [PubMed] [Green Version]
- Nishikawa, S.i.; Goldstein, R.A.; Nierras, C.R. The promise of human induced pluripotent stem cells for research and therapy. Nat. Rev. Mol. Cell Biol. 2008, 9, 725–729. [Google Scholar] [CrossRef] [PubMed]
- Idelson, M.S.; Ben-Jacob, E.; Hanein, Y. Innate Synchronous Oscillations in Freely-Organized Small Neuronal Circuits. PLoS ONE 2010, 5, e14443. [Google Scholar] [CrossRef] [PubMed]
- Breskin, I.; Soriano, J.; Moses, E.; Tlusty, T. Percolation in living neural networks. Phys. Rev. Lett. 2006, 97, 188102. [Google Scholar] [CrossRef] [PubMed] [Green Version]
- Eckmann, J.P.; Feinerman, O.; Gruendlinger, L.; Moses, E.; Soriano, J.; Tlusty, T. The physics of living neural networks. Phys. Rep. 2007, 449, 54–76. [Google Scholar] [CrossRef] [Green Version]
- Soriano, J.; Martínez, M.R.; Tlusty, T.; Moses, E. Development of input connections in neural cultures. Proc. Natl. Acad. Sci. USA 2008, 105, 13758–13763. [Google Scholar] [CrossRef] [PubMed] [Green Version]
- le Feber, J.; Dummer, A.; Hassink, G.C.; van Putten, M.J.A.M.; Hofmeijer, J. Evolution of Excitation–Inhibition Ratio in Cortical Cultures Exposed to Hypoxia. Front. Cell. Neurosci. 2018, 12. [Google Scholar] [CrossRef]
- Grienberger, C.; Konnerth, A. Imaging Calcium in Neurons. Neuron 2012, 73, 862–885. [Google Scholar] [CrossRef] [Green Version]
- Paredes, R.M.; Etzler, J.C.; Watts, L.T.; Zheng, W.; Lechleiter, J.D. Chemical calcium indicators. Methods 2008, 46, 143–151. [Google Scholar] [CrossRef] [Green Version]
- Knöpfel, T. Genetically encoded optical indicators for the analysis of neuronal circuits. Nat. Rev. Neurosci. 2012, 13, 687–700. [Google Scholar] [CrossRef]
- Grewe, B.F.; Langer, D.; Kasper, H.; Kampa, B.M.; Helmchen, F. High-speed in vivo calcium imaging reveals neuronal network activity with near-millisecond precision. Nat. Methods 2010, 7, 399–405. [Google Scholar] [CrossRef] [PubMed]
- Lütcke, H.; Gerhard, F.; Zenke, F.; Gerstner, W.; Helmchen, F. Inference of neuronal network spike dynamics and topology from calcium imaging data. Front. Neural Circuits 2013, 7, 201. [Google Scholar] [CrossRef] [PubMed] [Green Version]
- Deneux, T.; Kaszas, A.; Szalay, G.; Katona, G.; Lakner, T.; Grinvald, A.; Rózsa, B.; Vanzetta, I. Accurate spike estimation from noisy calcium signals for ultrafast three-dimensional imaging of large neuronal populations in vivo. Nat. Commun. 2016, 7, 12190. [Google Scholar] [CrossRef] [PubMed] [Green Version]
- Friedrich, J.; Zhou, P.; Paninski, L.; Staneva, V.; Chklovskii, D.; Pnevmatikakis, E. Fast online deconvolution of calcium imaging data. PLoS Comput. Biol. 2017, 13, e1005423. [Google Scholar] [CrossRef] [Green Version]
- Pnevmatikakis, E.A.; Soudry, D.; Gao, Y.; Machado, T.A.; Merel, J.; Pfau, D.; Reardon, T.; Mu, Y.; Lacefield, C.; Yang, W.; et al. Simultaneous Denoising, Deconvolution, and Demixing of Calcium Imaging Data. Neuron 2016, 89, 285–299. [Google Scholar] [CrossRef] [PubMed] [Green Version]
- Wei, Z.; Lin, B.J.; Chen, T.W.; Daie, K.; Svoboda, K.; Druckmann, S. A comparison of neuronal population dynamics measured with calcium imaging and electrophysiology. PLoS Comput. Biol. 2020, 16, 1–29. [Google Scholar] [CrossRef]
- Orlandi, J.G.; Fernández-García, S.; Comella-Bolla, A.; Masana, M.; Barriga, G.G.D.; Yaghoubi, M.; Kipp, A.; Canals, J.M.; Colicos, M.A.; Davidsen, J.; et al. NETCAL: An interactive platform for large-scale, NETwork and population dynamics analysis of CALcium imaging recordings. Zenodo 2017. [Google Scholar] [CrossRef]
- Zamora-López, G.; Chen, Y.; Deco, G.; Kringelbach, M.L.; Zhou, C. Functional complexity emerging from anatomical constraints in the brain: The significance of network modularity and rich-clubs. Sci. Rep. 2016, 6, 38424. [Google Scholar] [CrossRef] [Green Version]
- Jacobi, S.; Soriano, J.; Moses, E. BDNF and NT-3 increase velocity of activity front propagation in unidimensional hippocampal cultures. J. Neurophysiol. 2010, 104, 2932–2939. [Google Scholar] [CrossRef]
- Chiappalone, M.; Bove, M.; Vato, A.; Tedesco, M.; Martinoia, S. Dissociated cortical networks show spontaneously correlated activity patterns during in vitro development. Brain Res. 2006, 1093, 41–53. [Google Scholar] [CrossRef]
- Wagenaar, D.A.; Pine, J.; Potter, S.M. An extremely rich repertoire of bursting patterns during the development of cortical cultures. BMC Neurosci. 2006, 7, 11. [Google Scholar] [CrossRef] [PubMed]
- Mazzoni, A.; Broccard, F.D.; Garcia-Perez, E.; Bonifazi, P.; Ruaro, M.E.; Torre, V. On the dynamics of the spontaneous activity in neuronal networks. PLoS ONE 2007, 2, e439. [Google Scholar] [CrossRef] [PubMed] [Green Version]
- Pasquale, V.; Massobrio, P.; Bologna, L.; Chiappalone, M.; Martinoia, S. Self-organization and neuronal avalanches in networks of dissociated cortical neurons. Neuroscience 2008, 153, 1354–1369. [Google Scholar] [CrossRef] [PubMed]
- Ham, M.I.; Bettencourt, L.M.; McDaniel, F.D.; Gross, G.W. Spontaneous coordinated activity in cultured networks: Analysis of multiple ignition sites, primary circuits, and burst phase delay distributions. J. Comput. Neurosci. 2008, 24, 346–357. [Google Scholar] [CrossRef] [Green Version]
- Okujeni, S.; Kandler, S.; Egert, U. Mesoscale architecture shapes initiation and richness of spontaneous network activity. J. Neurosci. 2017, 37, 3972–3987. [Google Scholar] [CrossRef] [Green Version]
- Spitzer, N.C. Electrical activity in early neuronal development. Nature 2006, 444, 707–712. [Google Scholar] [CrossRef]
- Blankenship, A.G.; Feller, M.B. Mechanisms underlying spontaneous patterned activity in developing neural circuits. Nat. Rev. Neurosci. 2010, 11, 18–29. [Google Scholar] [CrossRef]
- Soto, F.; Ma, X.; Cecil, J.L.; Vo, B.Q.; Culican, S.M.; Kerschensteiner, D. Spontaneous Activity Promotes Synapse Formation in a Cell-Type-Dependent Manner in the Developing Retina. J. Neurosci. 2012, 32, 5426–5439. [Google Scholar] [CrossRef] [Green Version]
- Warp, E.; Agarwal, G.; Wyart, C.; Friedmann, D.; Oldfield, C.S.; Conner, A.; Bene, F.D.; Arrenberg, A.B.; Baier, H.; Isacoff, E.Y. Emergence of patterned activity in the developing zebrafish spinal cord. Curr. Biol. CB 2012, 22, 93–102. [Google Scholar] [CrossRef] [Green Version]
- Buzsáki, G.; Draguhn, A. Neuronal oscillations in cortical networks. Science 2004, 304, 1926–1929. [Google Scholar] [CrossRef] [Green Version]
- Cohen, O.; Keselman, A.; Moses, E.; Martínez, M.R.; Soriano, J.; Tlusty, T. Quorum percolation in living neural networks. Europhys. Lett. 2010, 89, 18008. [Google Scholar] [CrossRef] [Green Version]
- Izhikevich, E.M. Simple model of spiking neurons. IEEE Trans. Neural Netw. 2003, 14, 1569–1572. [Google Scholar] [CrossRef] [PubMed] [Green Version]
- Izhikevich, E.M. Which model to use for cortical spiking neurons? IEEE Trans. Neural Netw. 2004, 15, 1063–1070. [Google Scholar] [CrossRef]
- Tsodyks, M.; Markram, H. The neural code between neocortical pyramidal neurons depends on neurotransmitter release probability. Proc. Natl. Acad. Sci. USA 1997, 94, 719–723. [Google Scholar] [CrossRef] [Green Version]
- Albert, R.; Barabási, A.L. Statistical mechanics of complex networks. Rev. Mod. Phys. 2002, 74, 47–97. [Google Scholar] [CrossRef] [Green Version]
- Boccaletti, S.; Latora, V.; Moreno, Y.; Chavez, M.; Hwang, D. Complex networks: Structure and dynamics. Phys. Rep. 2006, 424, 175–308. [Google Scholar] [CrossRef]
- Rubinov, M.; Sporns, O. Complex network measures of brain connectivity: Uses and interpretations. NeuroImage 2010, 52, 1059–1069. [Google Scholar] [CrossRef]
- Sporns, O. Structure and function of complex brain networks. Dialogues Clin. Neurosci. 2013, 15, 247–262. [Google Scholar] [CrossRef]
- Bassett, D.S.; Sporns, O. Network neuroscience. Nat. Neurosci. 2017, 20, 353–364. [Google Scholar] [CrossRef] [Green Version]
- Friston, K.J. Functional and Effective Connectivity: A Review. Brain Connect. 2011, 1, 13–36. [Google Scholar] [CrossRef]
- Wang, H.E.; Bénar, C.G.; Quilichini, P.P.; Friston, K.J.; Jirsa, V.K.; Bernard, C. A systematic framework for functional connectivity measures. Front. Neurosci. 2014, 8, 405. [Google Scholar] [CrossRef] [PubMed]
- Valdes-Sosa, P.A.; Roebroeck, A.; Daunizeau, J.; Friston, K. Effective connectivity: Influence, causality and biophysical modeling. NeuroImage 2011, 58, 339–361. [Google Scholar] [CrossRef] [PubMed]
- Vicente, R.; Wibral, M.; Lindner, M.; Pipa, G. Transfer entropy-a model-free measure of effective connectivity for the neurosciences. J. Comput. Neurosci. 2011, 30, 45–67. [Google Scholar] [CrossRef] [PubMed] [Green Version]
- Schreiber, T. Measuring Information Transfer. Phys. Rev. Lett. 2000, 85, 461–464. [Google Scholar] [CrossRef] [PubMed] [Green Version]
- Wibral, M.; Vicente, R.; Lindner, M. Transfer Entropy in Neuroscience. In Directed Information Measures in Neuroscience; Wibral, M., Vicente, R., Lizier, J.T., Eds.; Springer: Berlin/Heidelberg, Germany, 2014; pp. 3–36. [Google Scholar] [CrossRef]
- Barthélemy, M. Spatial networks. Physics Reports 2011, 499, 1–101. [Google Scholar] [CrossRef] [Green Version]
- Bullmore, E.; Sporns, O. The economy of brain network organization. Nat. Rev. Neurosci. 2012, 13, 336–349. [Google Scholar] [CrossRef]
- Stiso, J.; Bassett, D.S. Spatial Embedding Imposes Constraints on Neuronal Network Architectures. Trends Cogn. Sci. 2018, 22, 1127–1142. [Google Scholar] [CrossRef] [PubMed]
- Latora, V.; Marchiori, M. Efficient behavior of small-world networks. Phys. Rev. Lett. 2001, 87, 198701. [Google Scholar] [CrossRef] [Green Version]
- Variano, E.A.; McCoy, J.H.; Lipson, H. Networks, dynamics, and modularity. Phys. Rev. Lett. 2004, 92, 188701. [Google Scholar] [CrossRef] [Green Version]
- Fortunato, S. Community detection in graphs. Phys. Rep. 2010, 486, 75–174. [Google Scholar] [CrossRef] [Green Version]
- Sporns, O.; Honey, C.J.; Kötter, R. Identification and classification of hubs in brain networks. PLoS ONE 2007, 2, e1049. [Google Scholar] [CrossRef] [PubMed]
- van den Heuvel, M.P.; Sporns, O. Network hubs in the human brain. Trends Cogn. Sci. 2013, 17, 683–696. [Google Scholar] [CrossRef] [PubMed]
- Battaglia, D.; Guyon, I.; Lemaire, V.; Orlandi, J.; Ray, B.; Soriano, J. Neural Connectomics Challenge; Springer: Berlin, Germany, 2017. [Google Scholar]
- Stam, C.J. Modern network science of neurological disorders. Nat. Rev. Neurosci. 2014, 15, 683–695. [Google Scholar] [CrossRef] [PubMed]
- Medaglia, J.D.; Bassett, D.S. Network Analyses and Nervous System Disorders; Oxford University Press: Oxford, UK, 2018. [Google Scholar] [CrossRef] [Green Version]
- Bassett, D.S.; Bullmore, E.T. Human brain networks in health and disease. Curr. Opin. Neurol. 2009, 22, 340–347. [Google Scholar] [CrossRef] [Green Version]
- He, Y.; Evans, A. Graph theoretical modeling of brain connectivity. Curr. Opin. Neurol. 2010, 23, 341–350. [Google Scholar] [CrossRef] [Green Version]
- Griffa, A.; Baumann, P.S.; Thiran, J.P.; Hagmann, P. Structural connectomics in brain diseases. NeuroImage 2013, 80, 515–526. [Google Scholar] [CrossRef]
- Meunier, D.; Lambiotte, R.; Bullmore, E.T. Modular and hierarchically modular organization of brain networks. Front. Neurosci. 2010, 4, 200. [Google Scholar] [CrossRef] [Green Version]
- Sporns, O.; Betzel, R.F. Modular Brain Networks. Annu. Rev. Psychol. 2016, 67, 613–640. [Google Scholar] [CrossRef] [Green Version]
- Alexander-Bloch, A.F.; Vértes, P.E.; Stidd, R.; Lalonde, F.; Clasen, L.; Rapoport, J.; Giedd, J.; Bullmore, E.T.; Gogtay, N. The Anatomical Distance of Functional Connections Predicts Brain Network Topology in Health and Schizophrenia. Cereb. Cortex 2013, 23, 127–138. [Google Scholar] [CrossRef] [Green Version]
- Buckner, R.L.; Sepulcre, J.; Talukdar, T.; Krienen, F.M.; Liu, H.; Hedden, T.; Andrews-Hanna, J.R.; Sperling, R.A.; Johnson, K.A. Cortical hubs revealed by intrinsic functional connectivity: Mapping, assessment of stability, and relation to Alzheimer’s disease. J. Neurosci. 2009, 29, 1860–1873. [Google Scholar] [CrossRef] [Green Version]
- Ruaro, M.; Bonifazi, P.; Torre, V. Toward the Neurocomputer: Image Processing and Pattern Recognition With Neuronal Cultures. IEEE Trans. Biomed. Eng. 2005, 52, 371–383. [Google Scholar] [CrossRef] [PubMed]
- Novellino, A.; D’Angelo, P.; Cozzi, L.; Chiappalone, M.; Sanguineti, V.; Martinoia, S. Connecting Neurons to a Mobile Robot: An In Vitro Bidirectional Neural Interface. Comput. Intell. Neurosci. 2007, 2007, 012725. [Google Scholar] [CrossRef] [PubMed] [Green Version]
- George, R.; Chiappalone, M.; Giugliano, M.; Levi, T.; Vassanelli, S.; Partzsch, J.; Mayr, C. Plasticity and Adaptation in Neuromorphic Biohybrid Systems. iScience 2020, 23, 1–26. [Google Scholar] [CrossRef] [PubMed]
- Kagan, B.J.; Kitchen, A.C.; Tran, N.T.; Habibollahi, F.; Khajehnejad, M.; Parker, B.J.; Bhat, A.; Rollo, B.; Razi, A.; Friston, K.J. In vitro neurons learn and exhibit sentience when embodied in a simulated game-world. Neuron 2022, 110, 3952–3969.e8. [Google Scholar] [CrossRef]
- Pelt, J.V.; Corner, M.; Wolters, P.; Rutten, W.; Ramakers, G. Longterm stability and developmental changes in spontaneous network burst firing patterns in dissociated rat cerebral cortex cell cultures on multielectrode arrays. Neurosci. Lett. 2004, 361, 86–89. [Google Scholar] [CrossRef]
- Kuebler, E.S.; Tauskela, J.S.; Aylsworth, A.; Zhao, X.; Thivierge, J.P. Burst predicting neurons survive an in vitro glutamate injury model of cerebral ischemia. Sci. Rep. 2015, 5, 17718. [Google Scholar] [CrossRef] [Green Version]
- Downes, J.H.; Hammond, M.W.; Xydas, D.; Spencer, M.C.; Becerra, V.M.; Warwick, K.; Whalley, B.J.; Nasuto, S.J. Emergence of a Small-World Functional Network in Cultured Neurons. PLoS Comput. Biol. 2012, 8, e1002522. [Google Scholar] [CrossRef] [Green Version]
- Okujeni, S.; Egert, U. Self-organization of modular network architecture by activity-dependent neuronal migration and outgrowth. eLife 2019, 8, 1–29. [Google Scholar] [CrossRef]
- Antonello, P.C.; Varley, T.F.; Beggs, J.; Porcionatto, M.; Sporns, O.; Faber, J. Self-organization of in vitro neuronal assemblies drives to complex network topology. eLife 2022, 11. [Google Scholar] [CrossRef]
- Wagenaar, D.A.; Madhavan, R.; Pine, J.; Potter, S.M. Controlling Bursting in Cortical Cultures with Closed-Loop Multi-Electrode Stimulation. J. Neurosci. 2005, 25, 680–688. [Google Scholar] [CrossRef] [Green Version]
- Bisio, M.; Pimashkin, A.; Buccelli, S.; Tessadori, J.; Semprini, M.; Levi, T.; Colombi, I.; Gladkov, A.; Mukhina, I.; Averna, A.; et al. Closed-Loop Systems and In Vitro Neuronal Cultures: Overview and Applications. In In Vitro Neuronal Networks; Springer: Berlin, Germany, 2019; pp. 351–387. [Google Scholar] [CrossRef]
- le Feber, J.; Stegenga, J.; Rutten, W.L.C. The Effect of Slow Electrical Stimuli to Achieve Learning in Cultured Networks of Rat Cortical Neurons. PLoS ONE 2010, 5, e8871. [Google Scholar] [CrossRef] [PubMed]
- Kirwan, P.; Turner-Bridger, B.; Peter, M.; Momoh, A.; Arambepola, D.; Robinson, H.P.C.; Livesey, F.J. Development and function of human cerebral cortex neural networks from pluripotent stem cells in vitro. Development 2015, 142, 3178–3187. [Google Scholar] [CrossRef] [PubMed] [Green Version]
- Hyvärinen, T.; Hyysalo, A.; Kapucu, F.E.; Aarnos, L.; Vinogradov, A.; Eglen, S.J.; Ylä-Outinen, L.; Narkilahti, S. Functional characterization of human pluripotent stem cell-derived cortical networks differentiated on laminin-521 substrate: Comparison to rat cortical cultures. Sci. Rep. 2019, 9, 17125. [Google Scholar] [CrossRef] [PubMed] [Green Version]
- Perea, G.; Araque, A. Glial calcium signaling and neuron–glia communication. Cell Calcium 2005, 38, 375–382. [Google Scholar] [CrossRef] [PubMed] [Green Version]
- Sancho, L.; Contreras, M.; Allen, N.J. Glia as sculptors of synaptic plasticity. Neurosci. Res. 2021, 167, 17–29. [Google Scholar] [CrossRef] [PubMed]
- Keck, T.; Hübener, M.; Bonhoeffer, T. Interactions between synaptic homeostatic mechanisms: An attempt to reconcile BCM theory, synaptic scaling, and changing excitation/inhibition balance. Curr. Opin. Neurobiol. 2017, 43, 87–93. [Google Scholar] [CrossRef]
- Zierenberg, J.; Wilting, J.; Priesemann, V. Homeostatic Plasticity and External Input Shape Neural Network Dynamics. Phys. Rev. X 2018, 8. [Google Scholar] [CrossRef] [Green Version]
- Fenno, L.; Yizhar, O.; Deisseroth, K. The Development and Application of Optogenetics. Annu. Rev. Neurosci. 2011, 34, 389–412. [Google Scholar] [CrossRef]
- Emiliani, V.; Entcheva, E.; Hedrich, R.; Hegemann, P.; Konrad, K.R.; Lüscher, C.; Mahn, M.; Pan, Z.H.; Sims, R.R.; Vierock, J.; et al. Optogenetics for light control of biological systems. Nat. Rev. Methods Prim. 2022, 2, 55. [Google Scholar] [CrossRef]
- Lonardoni, D.; Amin, H.; Zordan, S.; Boi, F.; Lecomte, A.; Angotzi, G.N.; Berdondini, L. Active High-Density Electrode Arrays: Technology and Applications in Neuronal Cell Cultures. In In Vitro Neuronal Networks; Springer: Berlin, Germany, 2019; pp. 253–273. [Google Scholar] [CrossRef]
- Chen, Z.; Liang, Q.; Wei, Z.; Chen, X.; Shi, Q.; Yu, Z.; Sun, T. An Overview of In Vitro Biological Neural Networks for Robot Intelligence. Cyborg Bionic Syst. 2023, 4, 0001. [Google Scholar] [CrossRef]
Figure 1.
Overview of research projects in Jordi Soriano’s laboratory. (a) Neuronal cultures, prepared from either human induced pluripotent stem cells or rodent primary cultures, constitute the central experimental tool. Activity in these cultures is typically recorded using calcium fluorescence imaging; (b) spontaneous activity in cultures, which refers to the capacity of a neuronal network to activate without the need of any external drive. We investigated this phenomenon and observed that spontaneous activity emerges as a subtle interplay between connectivity and noise. See Refs. [6,7,8,9,10]. (c) The easy accessibility of neuronal cultures offers a unique scenario to investigate resilience to damage, in which neurons are targeted using a laser or a sharp tool. In our studies, we observed that neuronal networks can cope with substantial damage and recover from it. See Refs. [9,11,12,13,14]. (d) Computational models are used as complementary tools to experimental data, allowing us to better understand key results from experiments and theoretical models and make predictions. See Refs. [7,8,9,15,16,17,18]. (e) Complex networks provide the analytic backbone to understand experimental and numerical data, specifically to quantify the physical organization and information flow in neuronal networks. See Refs. [7,8,9,10,12,16,19,20,21,22]. (f) Neuroengineering deals with the concept of controlling the positioning and connectivity of neurons, with the goal to induce brain-like architectures in vitro, and in an effort to understand major principles of brain functioning. See Refs. [19,22,23,24]. (g) The relative simplicity of neuronal cultures makes them excellent platforms to investigate neurological disorders, in which neuronal connectivity or dynamics are compromised. In partnership with different research institutes in medicine, we have helped investigating the goodness of cell therapies, e.g., gene editing or transplantation, as well as the potential use of new chemical compounds as pharmacological agents. See Refs. [14,20,25,26,27,28,29,30,31,32].

Figure 2.
Examples of primary neuronal cultures. (a) left, bright field image of neurons grown in a homogeneous manner on a glass substrate. Neurons appear as round objects. Right, corresponding fluorescence image (Fluo-4 recordings), in which neurons appear as bright spots on a dark background. The yellow outline highlights the same neuron in both images; (b) bright field image of neurons grown on multielectrode arrays. Neurons appear as gray round objects, and the electrodes as black circles and lines. Each electrode reads the combined electrical signal of several neurons, making direct analyses at cellular resolution difficult; (c) bright field image of an aggregated neuronal culture, in which neurons form compact islands about 100 m in diameter connected to one another with bundles of axons (straight lines); (d) fluorescence image (Cal-520 recordings) of an engineered neuronal culture in which neurons grow only in small squared modules of 200 m lateral size. The connectivity between modules is achieved through thin corridors that only allow the pass of axons. In the example shown, each module pair is connected by three corridors, shaping a modular yet strongly integrated network; (e) fluorescence image (GCaMP6s recordings) of an engineered neuronal culture in which neurons grow on a topographical pattern (top-right sketch) made by periodic tracks 300 m wide and 70 m high separated by 300 m (bottom-right inset, the white dotted lines indicate the boundaries between tracks). This topographical culture is characterized by a rich dynamics in which activity encompasses different areas of the culture or its entireness. For the example shown, two tracks towards the left of the culture activate while the rest is silent; (f) immunostaining in hiPSC-derived cultures to reveal the neuronal nuclei of mature cells (blue), glia (red), and neuronal connections (green); (g) equivalent immunostaining for rat primary cultures grown on a topographical pattern (as in panel (e)). Several connections follow the edges of the tracks.

Figure 3.
Fluorescence calcium imaging and spikes inference. (a) example of normalized fluorescence traces for nine neurons in a typical experiment with primary cultures. Data were acquired with the genetically encoded calcium indicator GCaMP6s. Sharp increases in the signal reveal the emission of action potentials; (b) neuronal spikes inference, in which the original fluorescence trace (blue signal) is analyzed to obtain the spikes via the Schmitt trigger method (green lines and stars) or the Oasis method (red curve and black dots). The latter uses biophysical information to predict the fluorescence signal and its containing spikes, but errors occur (black arrowhead towards the beginning of the recording), with noisy fluctuations in the signal being ascribed as activations.

Figure 4.
Data analysis. (a) spontaneous activity in three different neuronal culture configurations, obtained from recordings with GCaMP6s as calcium indicator. The collection of inferred spikes is visualized in the form of raster plots (top plots, each blue dot corresponding to a spike). Collective activity events or network bursts appear as bands of coherent activity (yellow outline). Population activity (bottom plots) is quantified by vertically summing up the raster plot. Strong network bursting leads to sharp peaks in the signal, denoted . (b) The distribution of values reveals the richness in dynamical states of the network. Homogeneous cultures are locked in a strong bursting behavior and in all events, while aggregated and topographical cultures exhibit a broader distribution; (c) top, each individual network burst can be analyzed to portray its spatiotemporal structure (black-yellow color pattern) and initiation point (white circle). Bottom, the data of activity propagation can be plotted to obtain the characteristic propagation velocity as a linear fit. In the examples shown, front propagation in a topographical substrate is about 10 times slower than in a homogeneous one.

Figure 5.
Noise focusing’ concept and numerical simulations. (a) sketch of the two major ingredients that shape noise focusing. Top, ‘noise amplification’ concept. Without noise, neuron B needs to receive a quorum of inputs (black arrows and upper vertical bars) in a time window from neurons to activate. Input noise (red arrows and bars) relaxes the quorum condition and the neuron B can effectively activate with fewer spikes from other neurons. Bottom, ‘topological amplification’, by which spikes elicited by neurons are amplified by network motifs such as feed forward loops (gray triangle). In the sketch, neurons and emit two spikes, which become amplified by the loops involving neurons and , effectively providing an input of four spikes to neuron C; (b) distribution of burst initiation in standard and topographical cultures, and comparing two developmental stages of the cultures. The black dots are the observed initiation points of network bursts, and the blue-yellow pattern is the corresponding probability distribution function (pdf) of burst initiation. The yellower a region of the culture is, the higher the probability of burst initiation is in that region; (c) in silico model of a neuron grown on a two-dimensional substrate. The neuronal soma and dendritic tree are simulated as discs, and the axon as concatenated segments of length ℓ. Interactions with obstacles are implemented as a simple rule by which an incident axon onto a surface is reflected with the same angle . Connectivity is established whenever the axon of a neuron 1 crosses the dendritic tree of a neuron 2; (d) examples of positioned axons in the absence (left) and presence (right) of obstacles. Neurons are shown as triangles for clarity, with their color intensity proportional to their connectivity. Blue scale bars represent 100 m.

Figure 6.
Complex networks and neuronal cultures. (a) schematic representation of important concepts in complex networks. Top: adjacency connectivity matrix of a sparse functional network (symmetric matrix) with 20 nodes (ascribed as neurons) and four communities, with the matrix ordered to highlight communities (color boxes). Black dots are intra-community connections and blue ones are inter-community connections. Bottom: representation of the matrix as a network map. Circles are neurons colored according to the community they belong to, and lines are connections (black or blue for intra- or inter-community connections). Red arrowheads indicate hub nodes. The quantities k, , , and Q indicate different network measures; (b) example of a dense effective network (asymmetric matrix) with two strongly bonded communities; (c) typical effective connectivity analysis pipeline in data from a ‘tracks’ topographical culture. Spike trains of neuronal pairs in a raster plot (with 1000 neurons) are analyzed to extract the effective connectivity network, which effectually captures the dynamic interaction between neurons. Both the effective network and the raster plot are ordered to highlight communities (color bands or boxes). Communities reflect distinct spatiotemporal patterns of activity; (d) comparison between structural and effective connectivity. Left, bright field image of an aggregated culture in which major paths of structural connections (straight filaments) are visible. Right, map of effective connections extracted from spontaneous activity recordings on the same network. Colors highlight the network organization in communities. Discs represent the aggregates, with their diameter proportional to the size of the aggregates in the bright field image. Curves are effective connections, with their width proportional to the connectivity strength. The directionality of connections is omitted for clarity. Data in (c) and (d) were obtained by using GCaMP6s and Fluo-4 as calcium indicators, respectively.

Figure 7.
Neurological disorders and damage in vitro. (a) comparison of hiPSC-derived cultures in a model for Parkinson’s disease (PD), showing raster plots of spontaneous activity on top and effective connectivity matrices at the bottom. Color boxes in the matrices highlight communities. From left to right, data correspond to a healthy culture, a culture derived from cells affected by a genetic form of PD, and a culture whose cells were genetically-edited to correct for the disease.The PD culture exhibits an excessive integration, with stronger synchronization in the raster plots and bigger communities; (b) recovery of an aggregated culture after laser microsurgery (yellow spot before damage, black spots after it). Colored discs and lines represent aggregates and effective connections, respectively, with their color intensity proportional to their connectivity or strength. The discs in blue mark those aggregates that became silent just after damage but that gradually recovered activity and effective connections along recovery. In both panels (a) and (b), data were obtained using Fluo-4 as a calcium indicator.

Disclaimer/Publisher’s Note: The statements, opinions and data contained in all publications are solely those of the individual author(s) and contributor(s) and not of MDPI and/or the editor(s). MDPI and/or the editor(s) disclaim responsibility for any injury to people or property resulting from any ideas, methods, instructions or products referred to in the content. |
© 2023 by the author. Licensee MDPI, Basel, Switzerland. This article is an open access article distributed under the terms and conditions of the Creative Commons Attribution (CC BY) license (https://creativecommons.org/licenses/by/4.0/).
Share and Cite
MDPI and ACS Style
Soriano, J. Neuronal Cultures: Exploring Biophysics, Complex Systems, and Medicine in a Dish. Biophysica 2023, 3, 181-202. https://doi.org/10.3390/biophysica3010012
AMA Style
Soriano J. Neuronal Cultures: Exploring Biophysics, Complex Systems, and Medicine in a Dish. Biophysica. 2023; 3(1):181-202. https://doi.org/10.3390/biophysica3010012
Chicago/Turabian StyleSoriano, Jordi. 2023. "Neuronal Cultures: Exploring Biophysics, Complex Systems, and Medicine in a Dish" Biophysica 3, no. 1: 181-202. https://doi.org/10.3390/biophysica3010012