


On the State-of-the-Art of Solar, Wind, and Other Green Energy Resources and Their Respective Storage Systems

Abstract
:1. Introduction
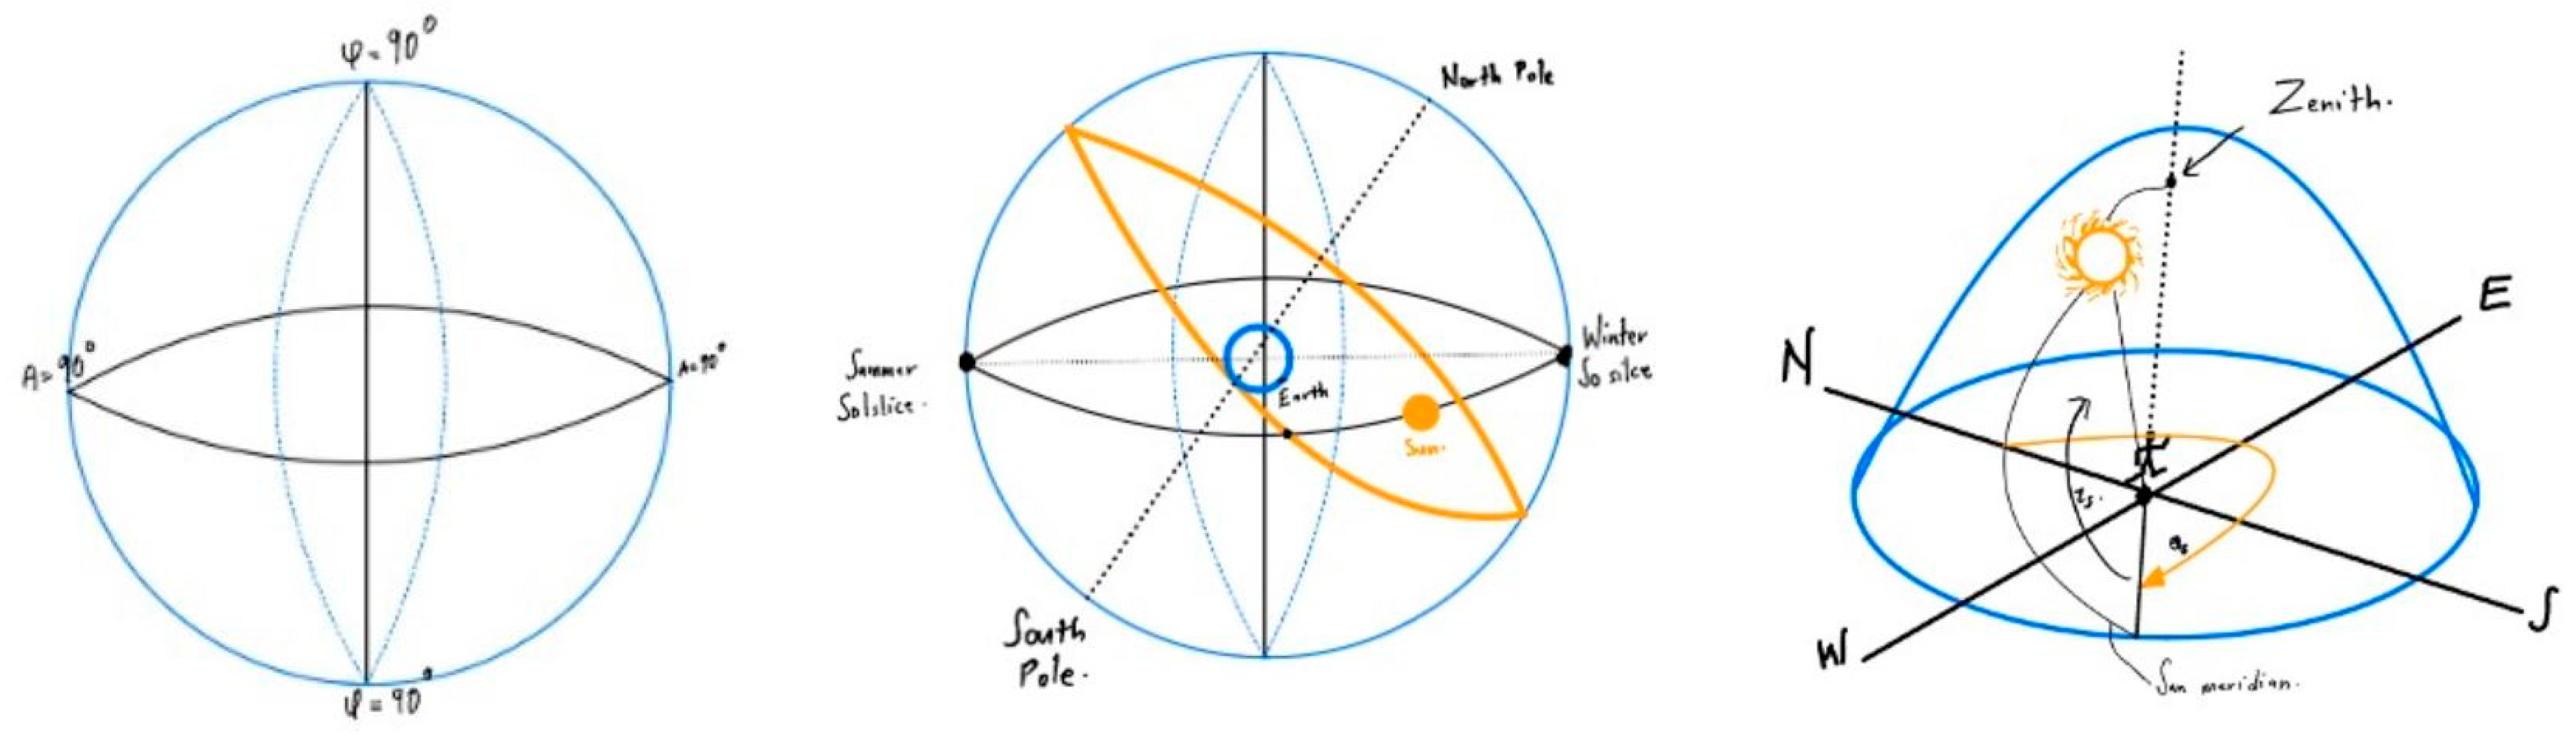
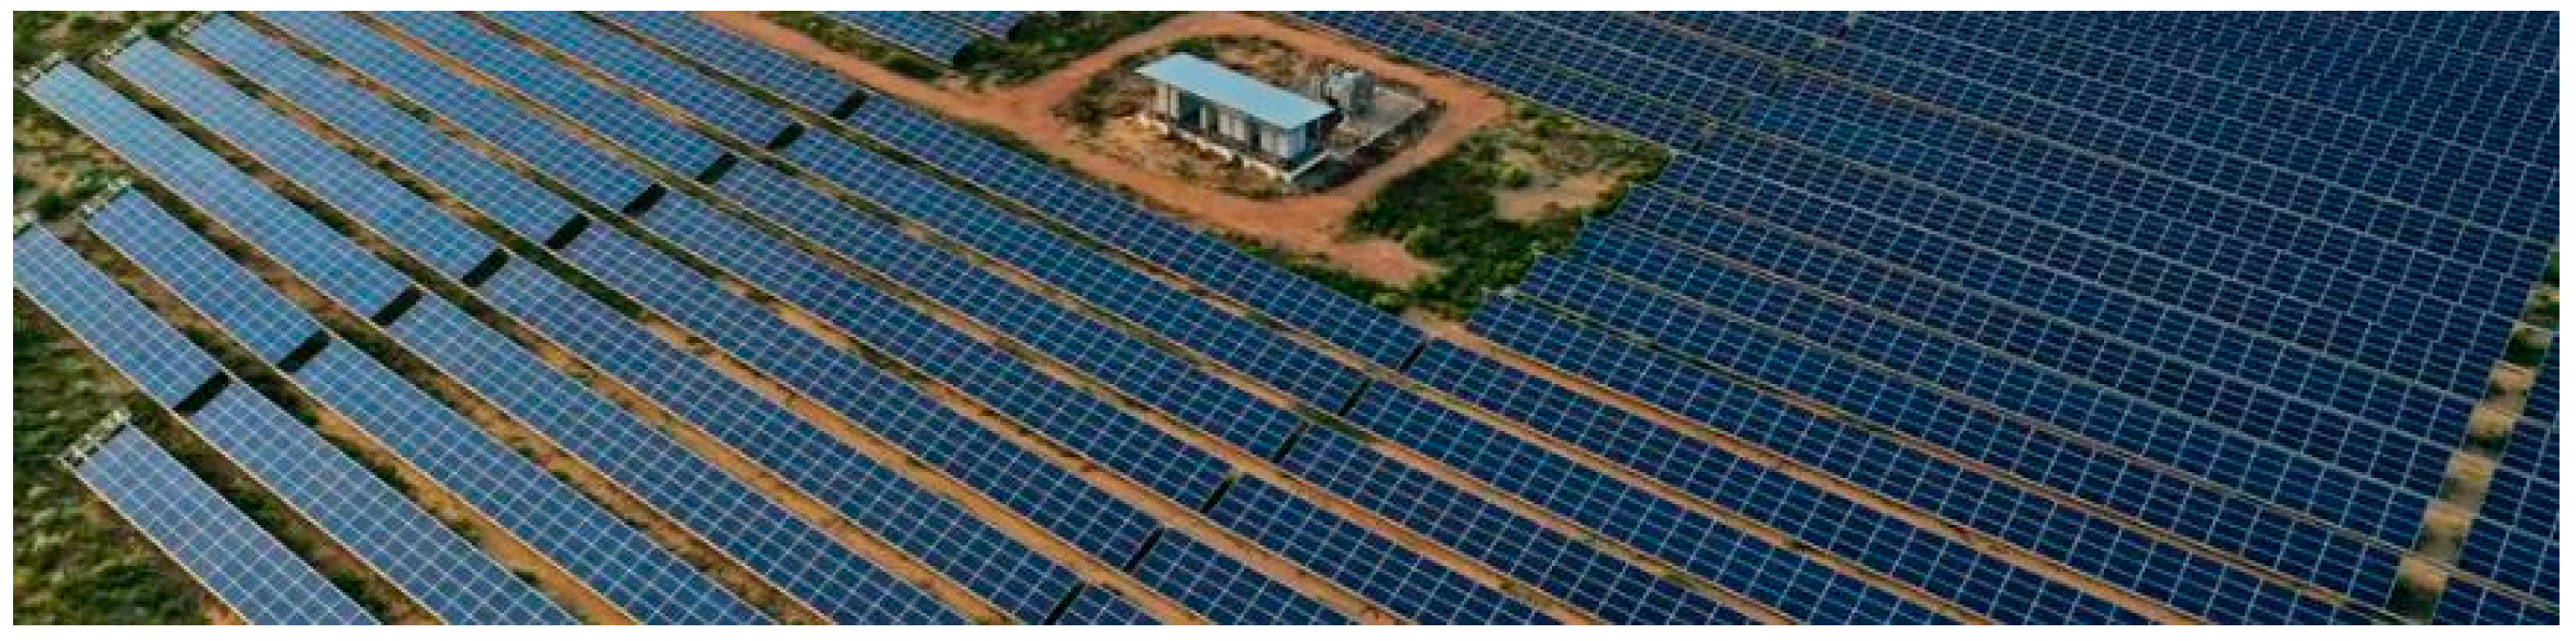
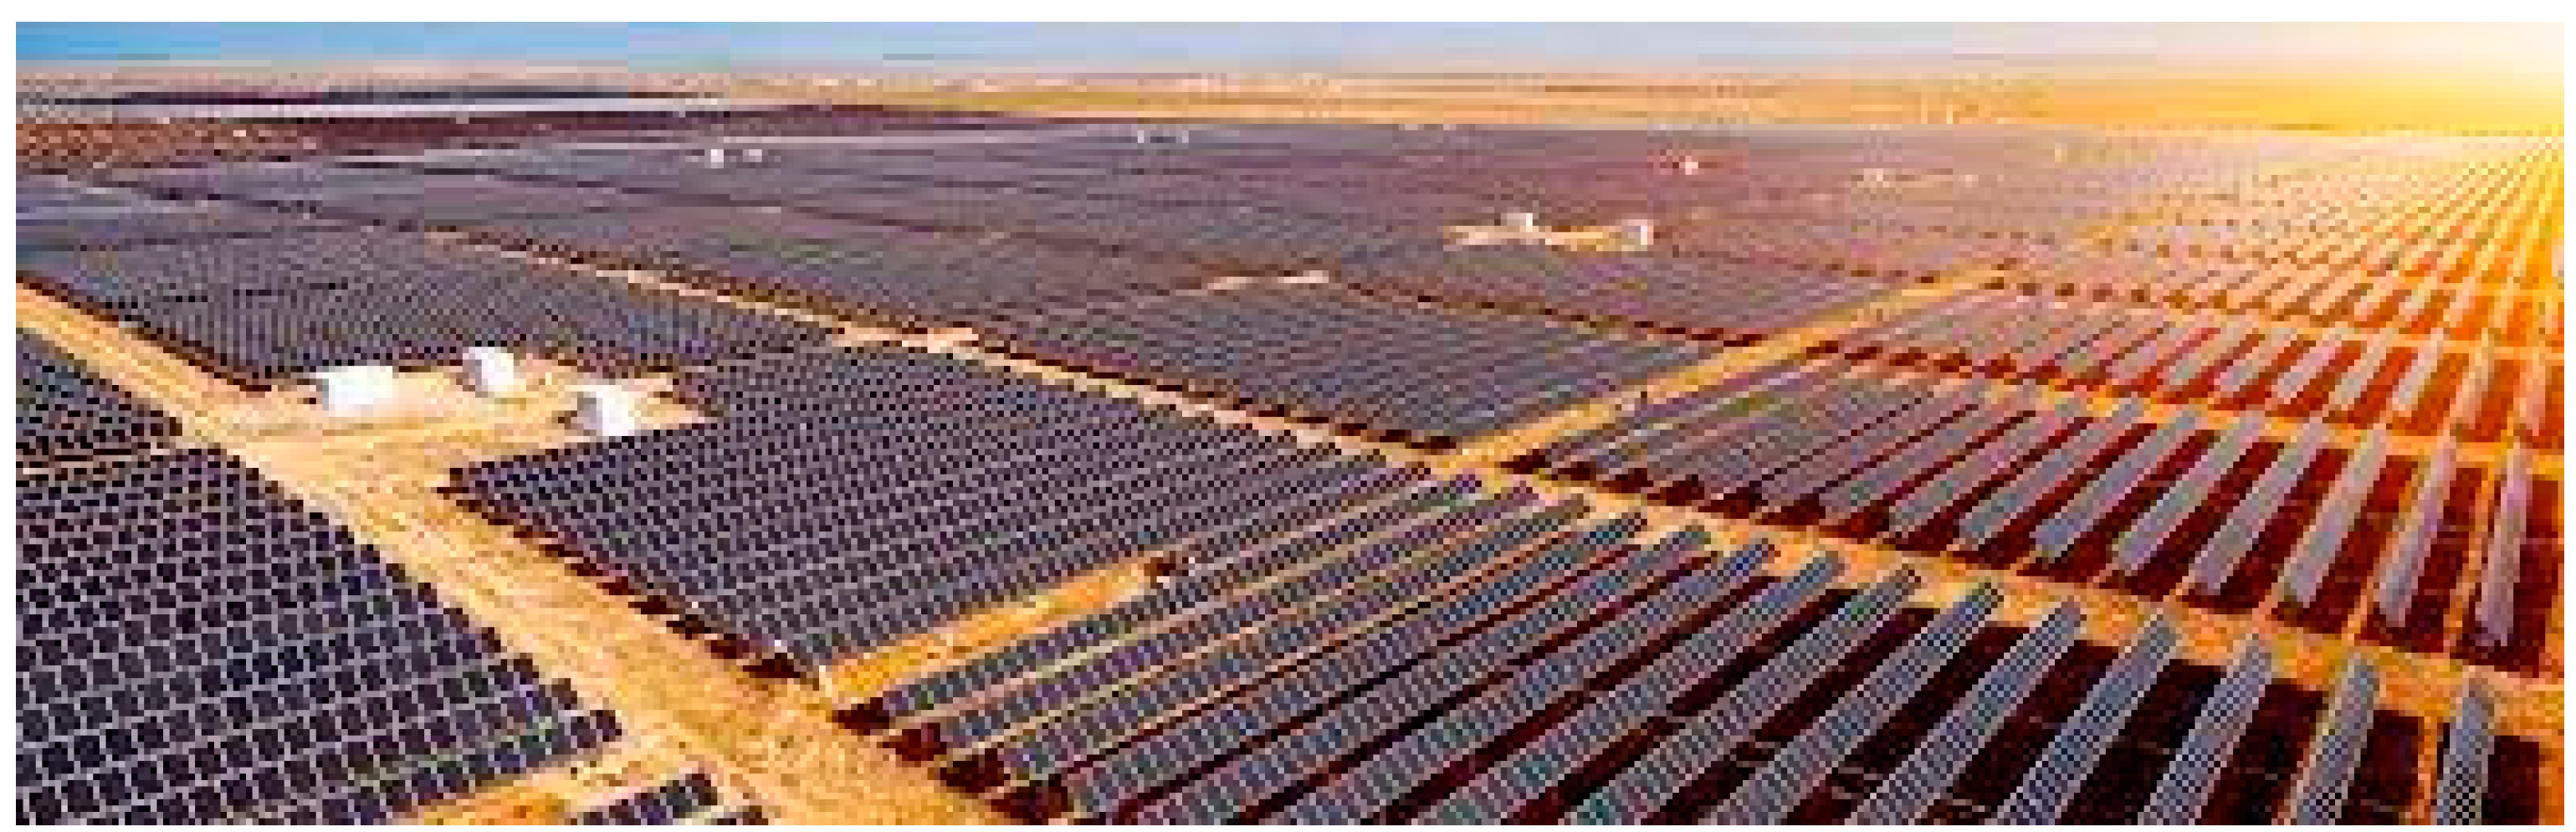
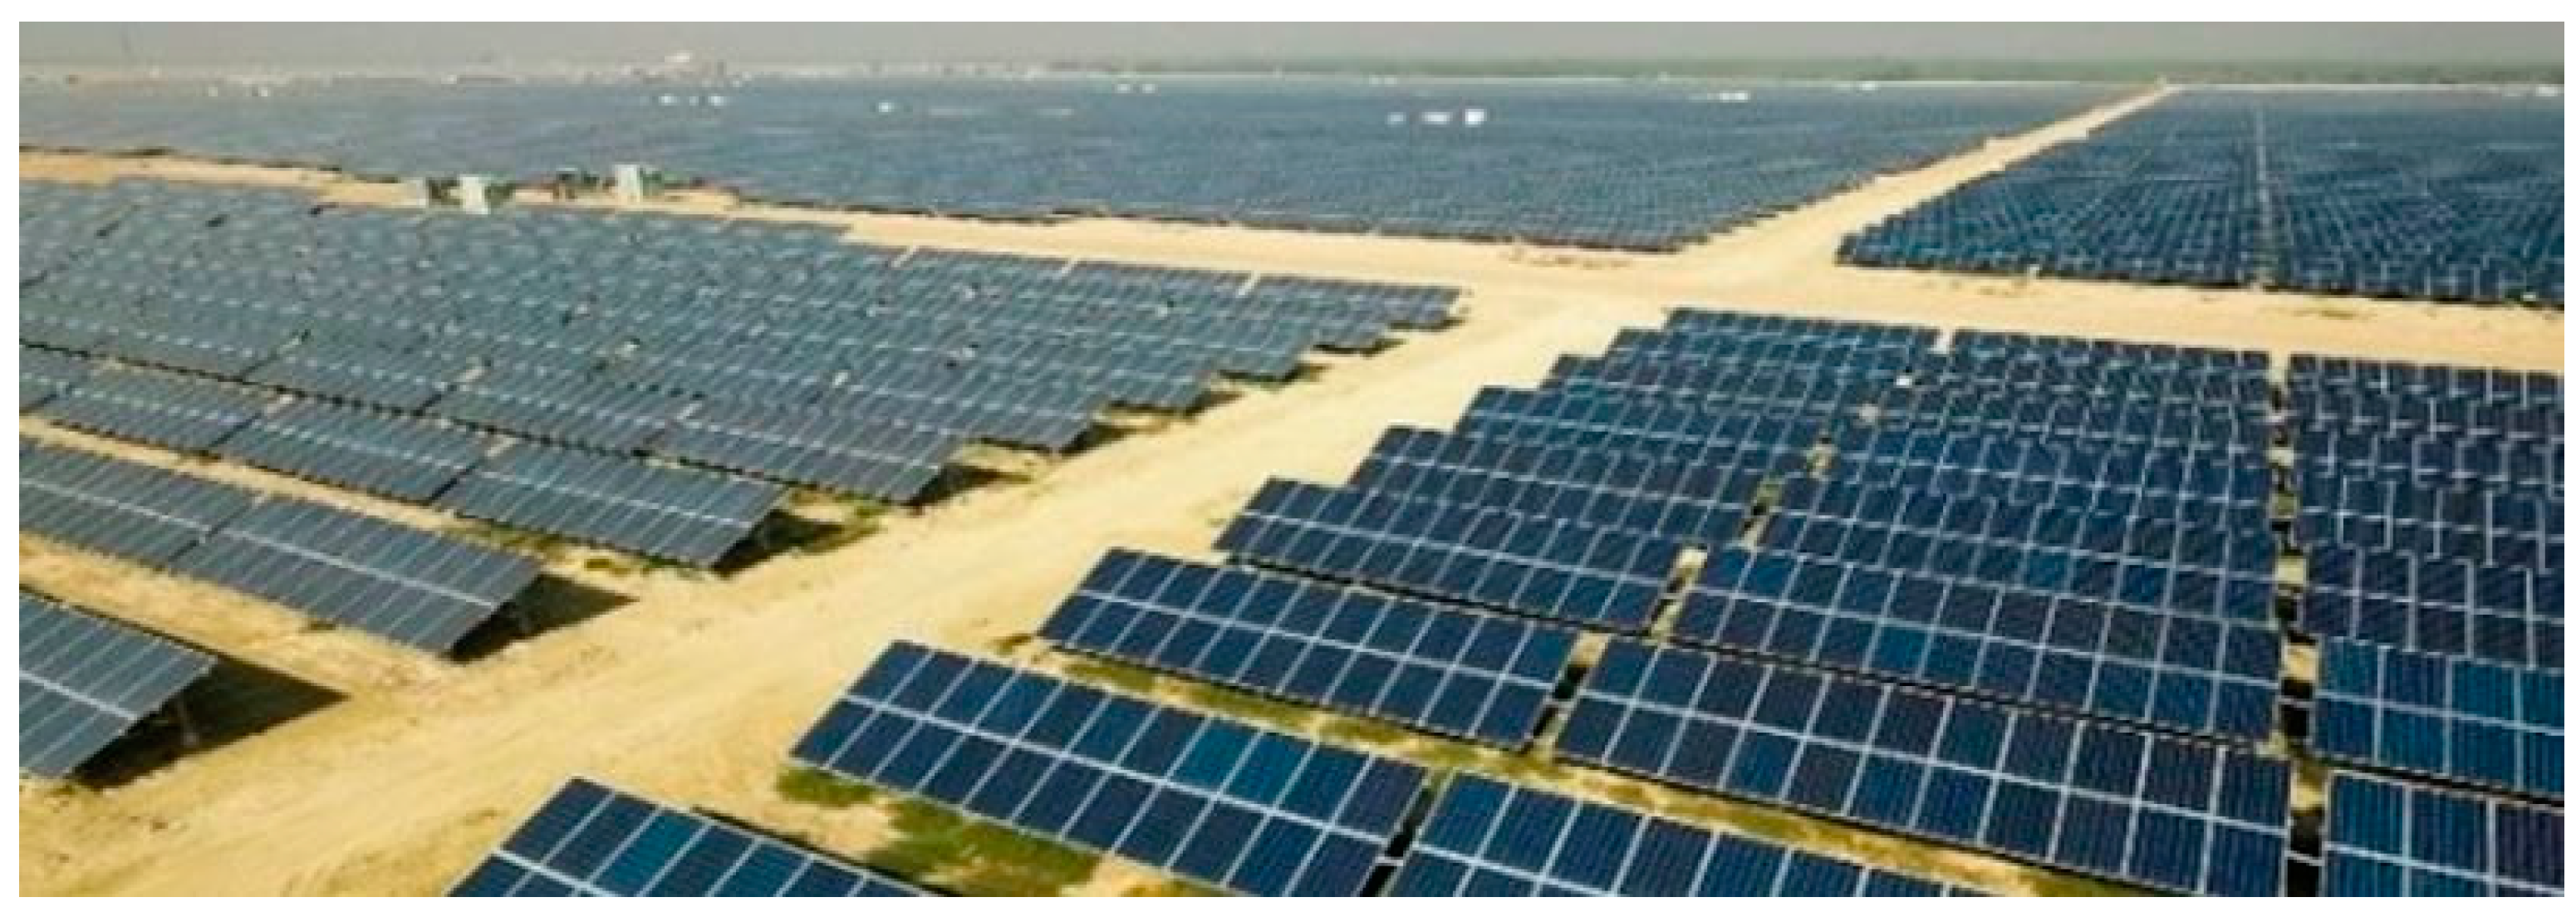
2. Solar Energy
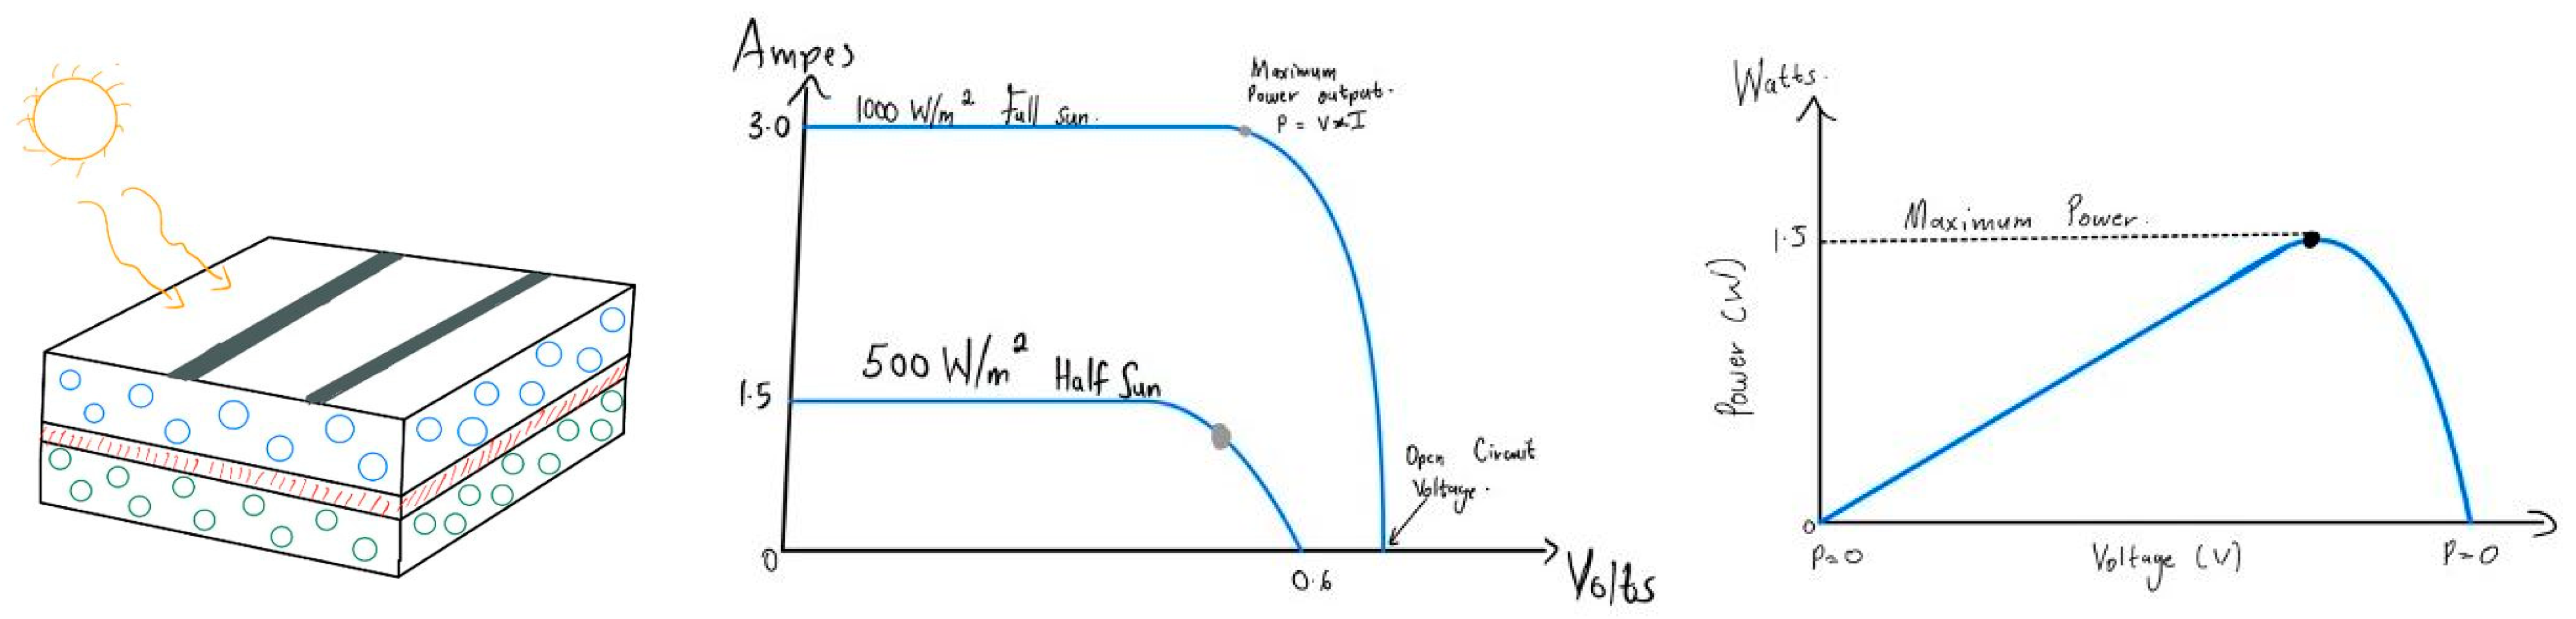
2.1. Solar Voltaic Portion of Energy
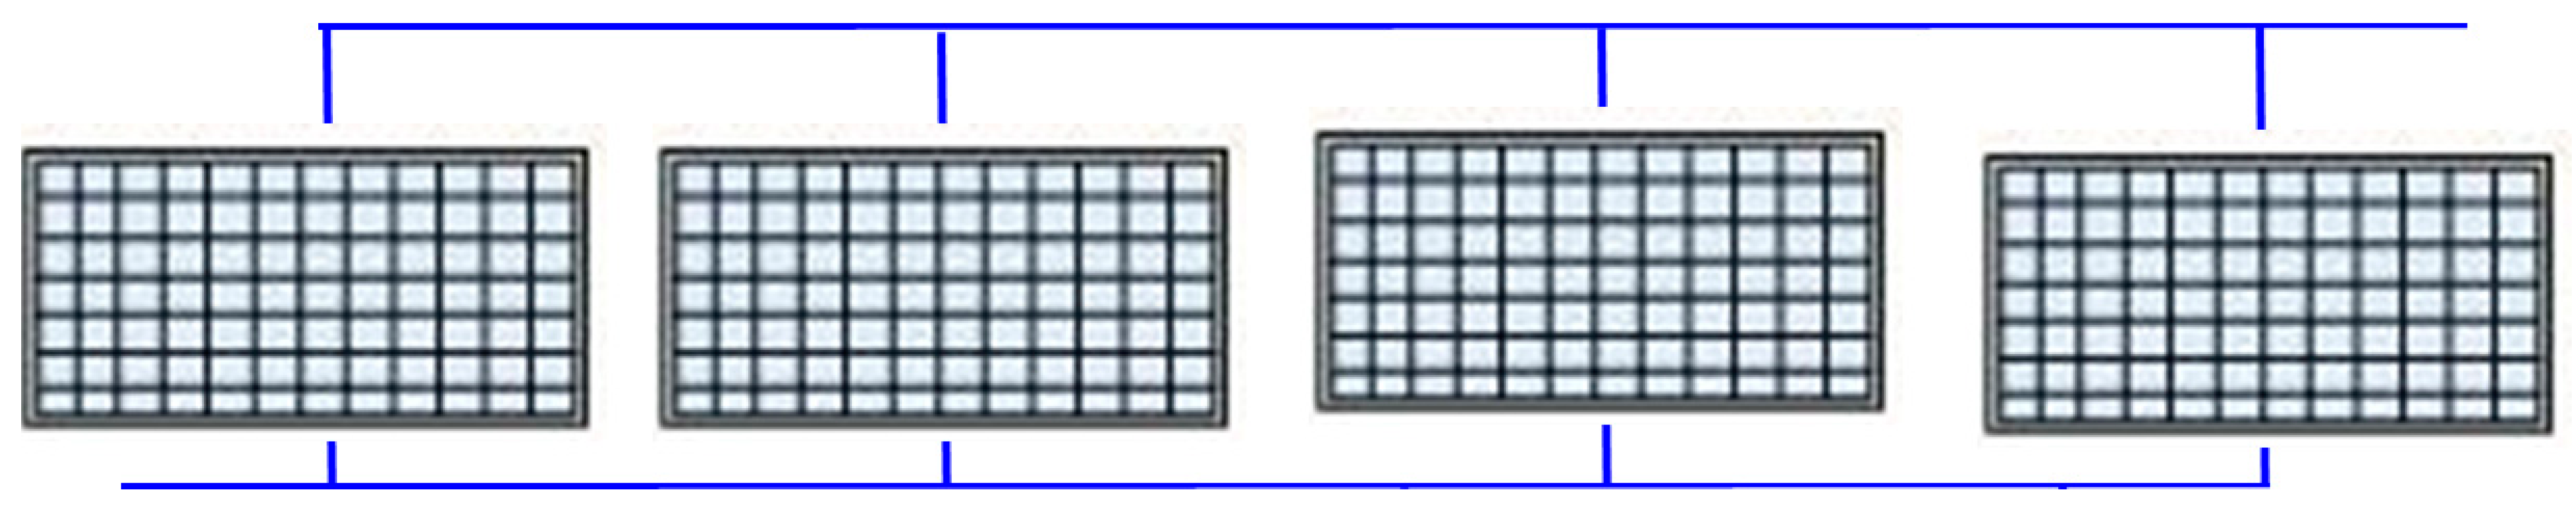
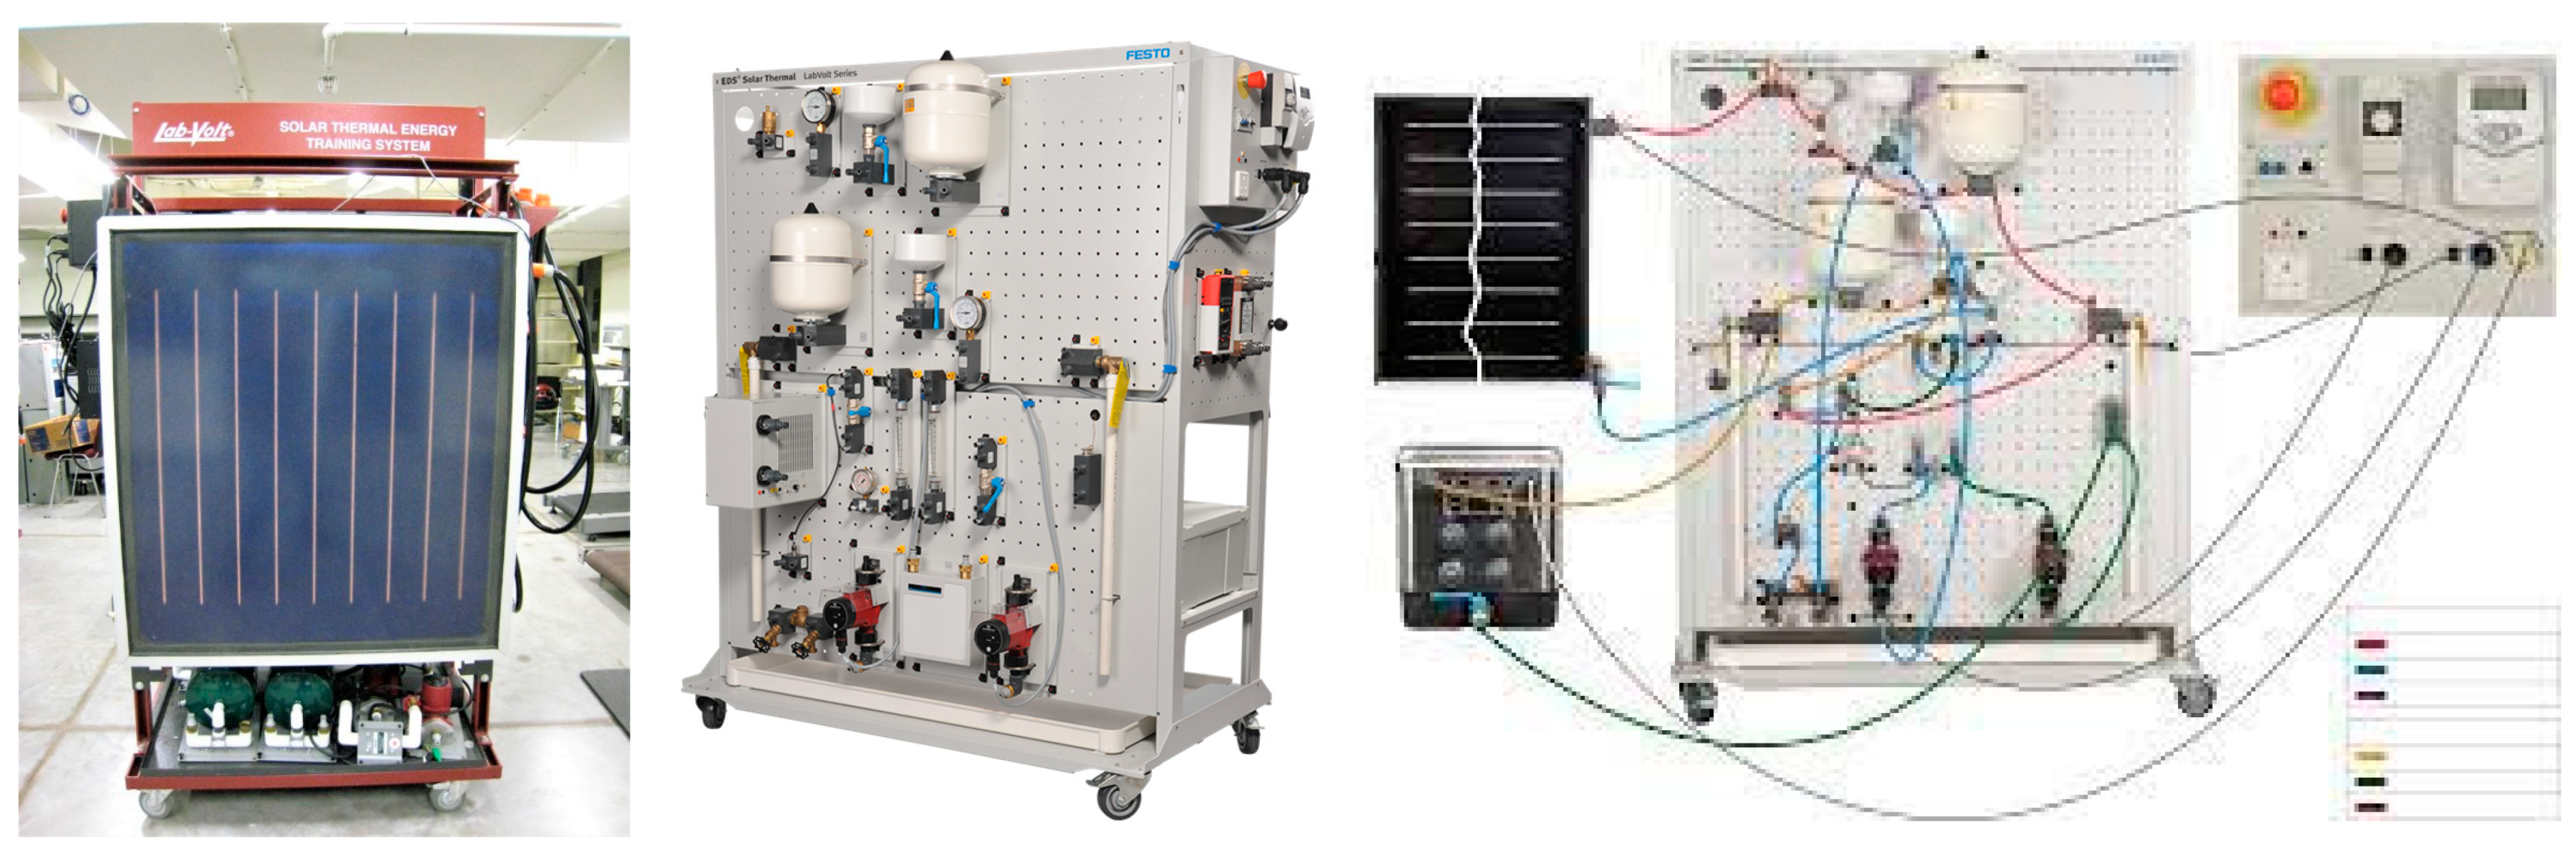
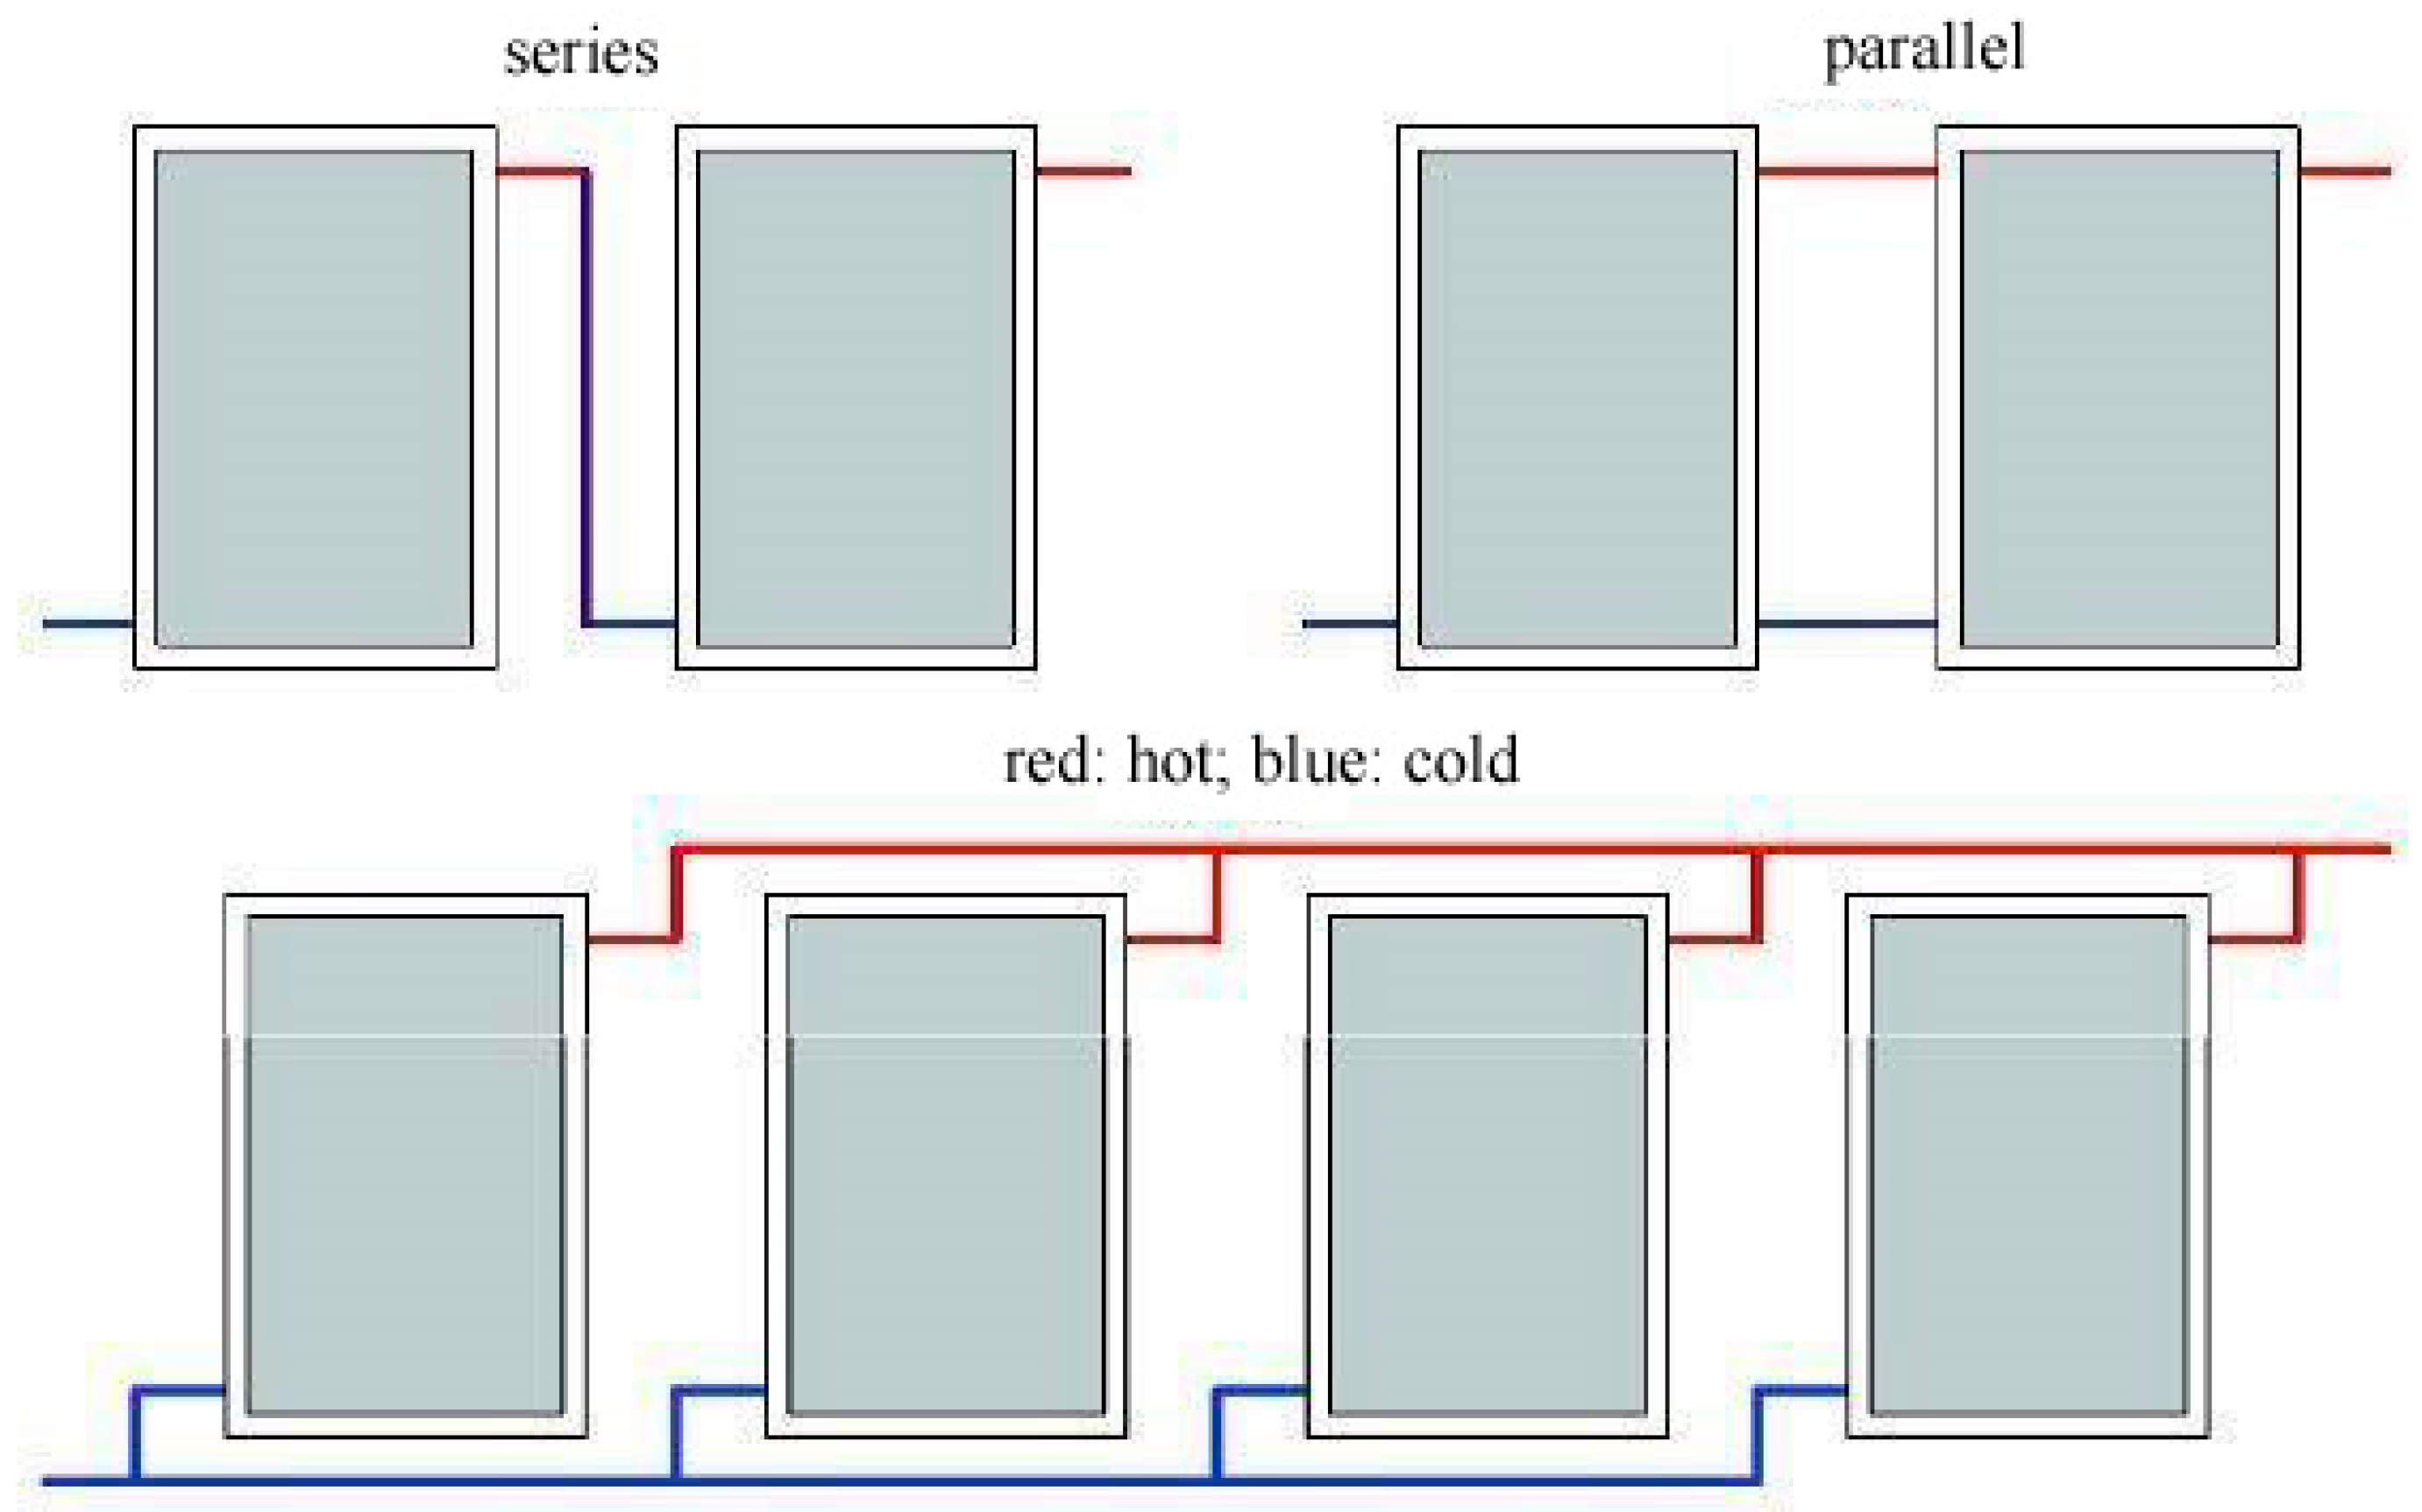
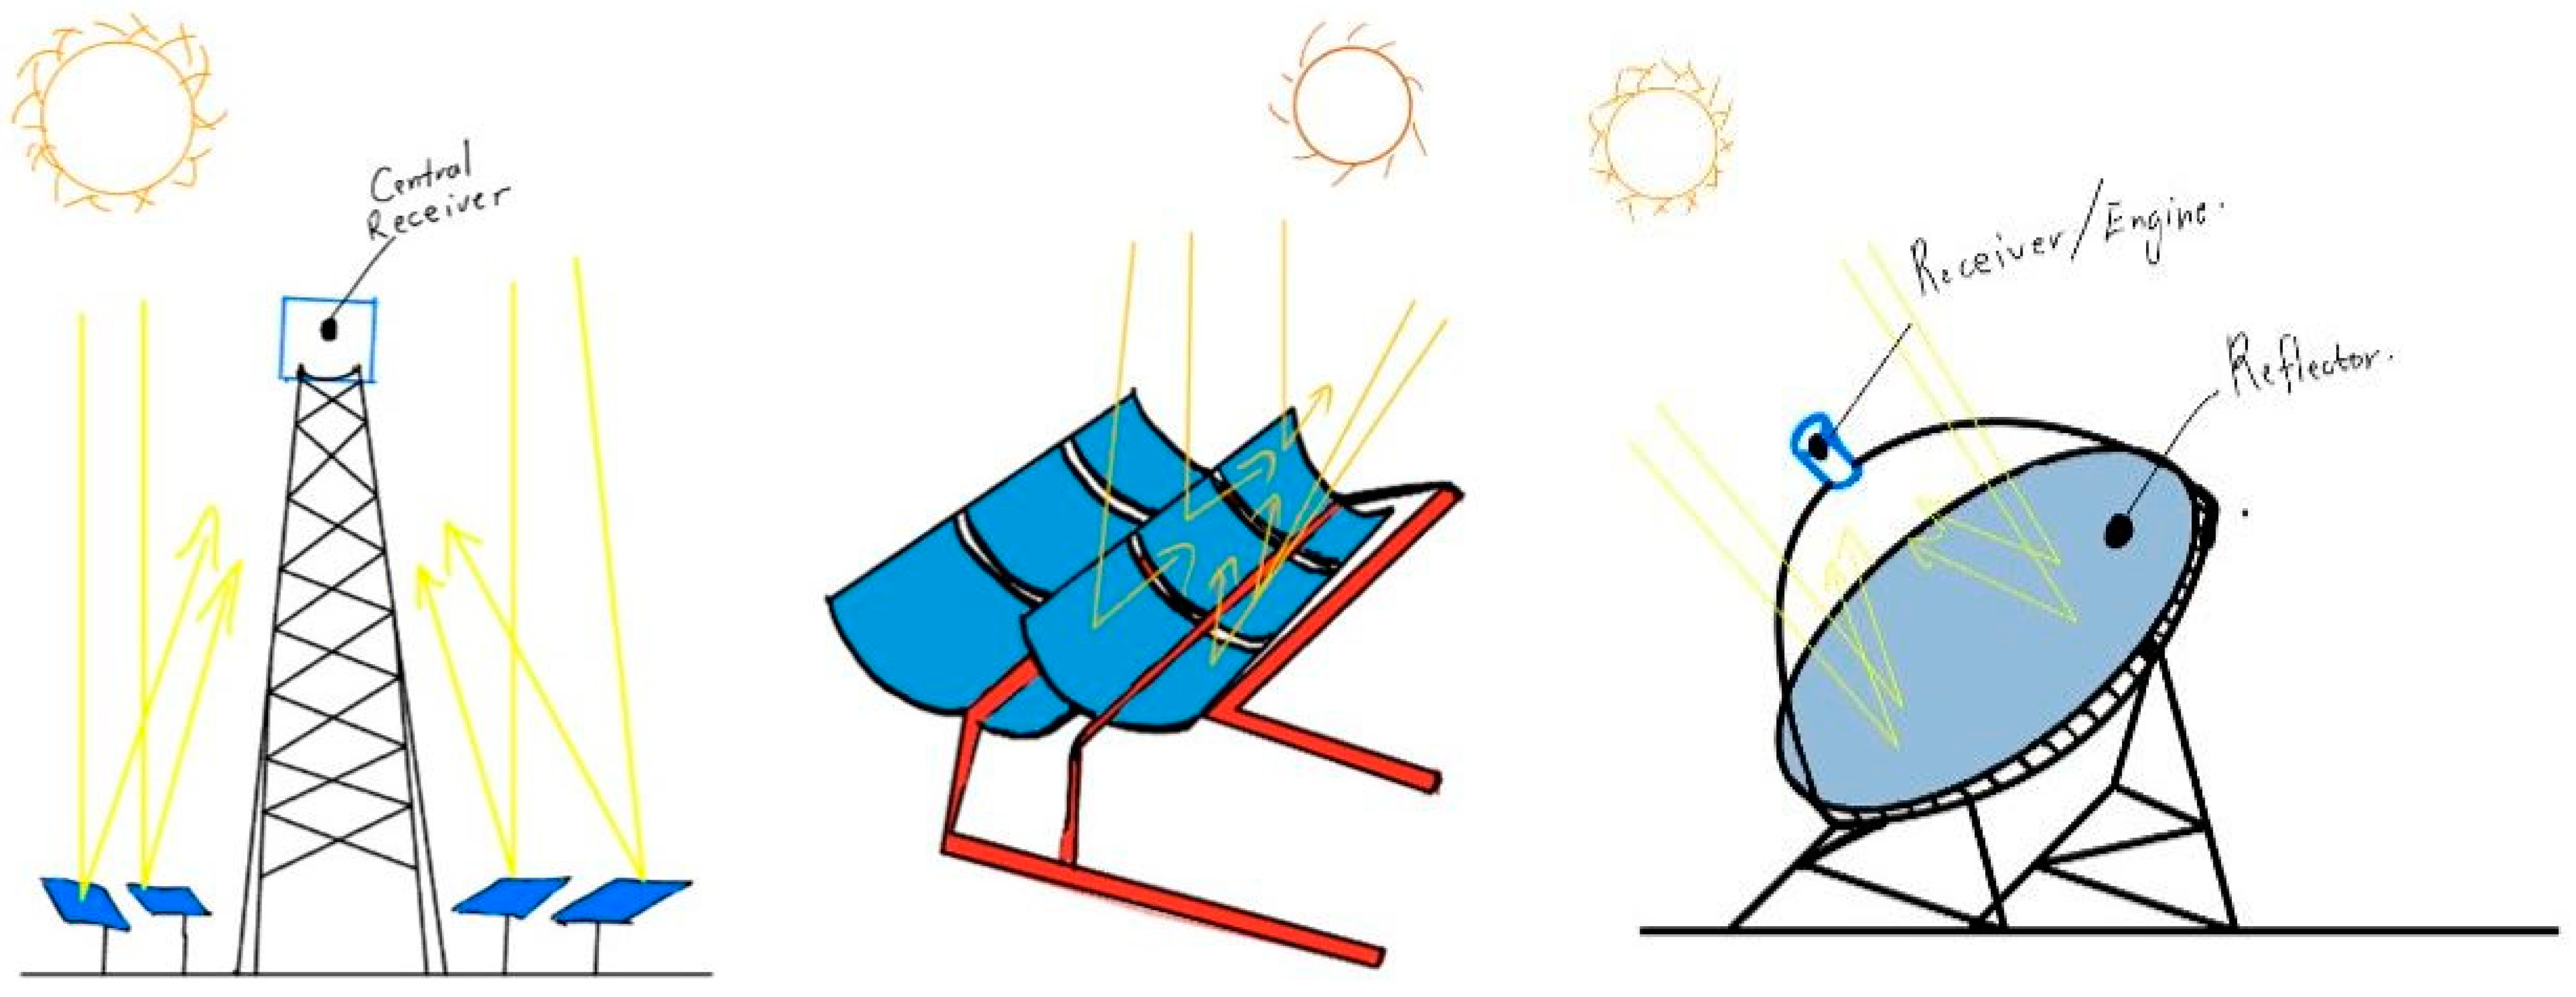
2.2. Solar Thermal Portion of Energy
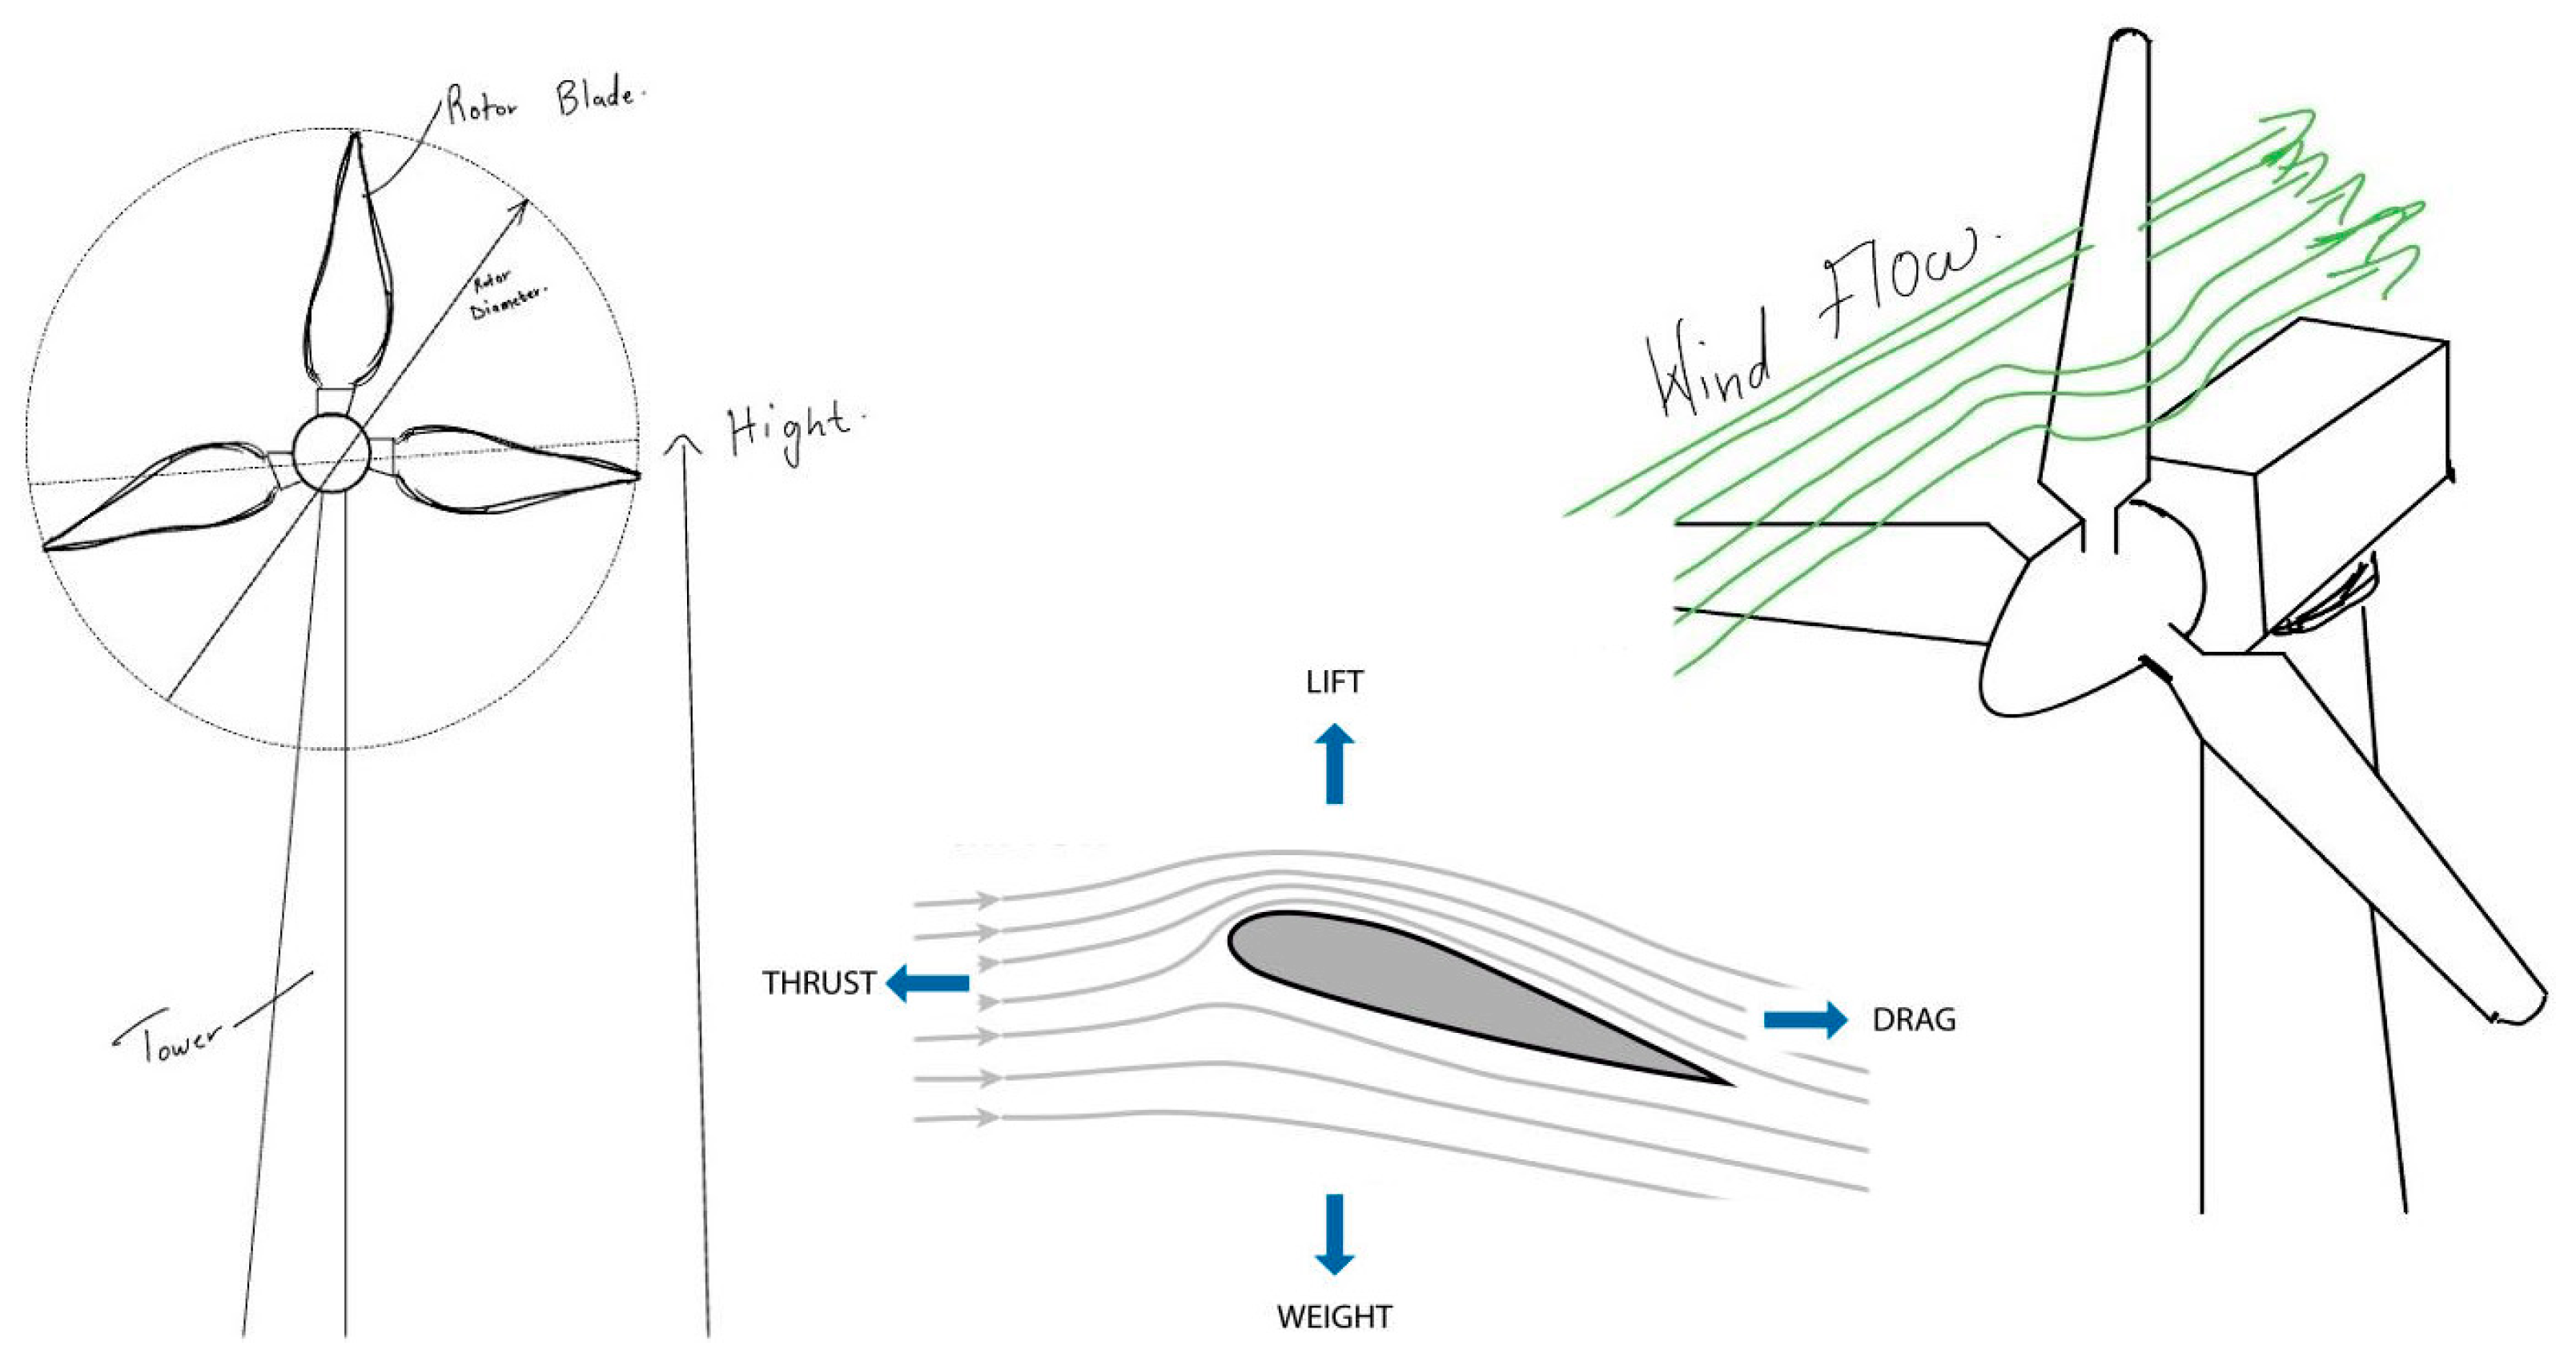
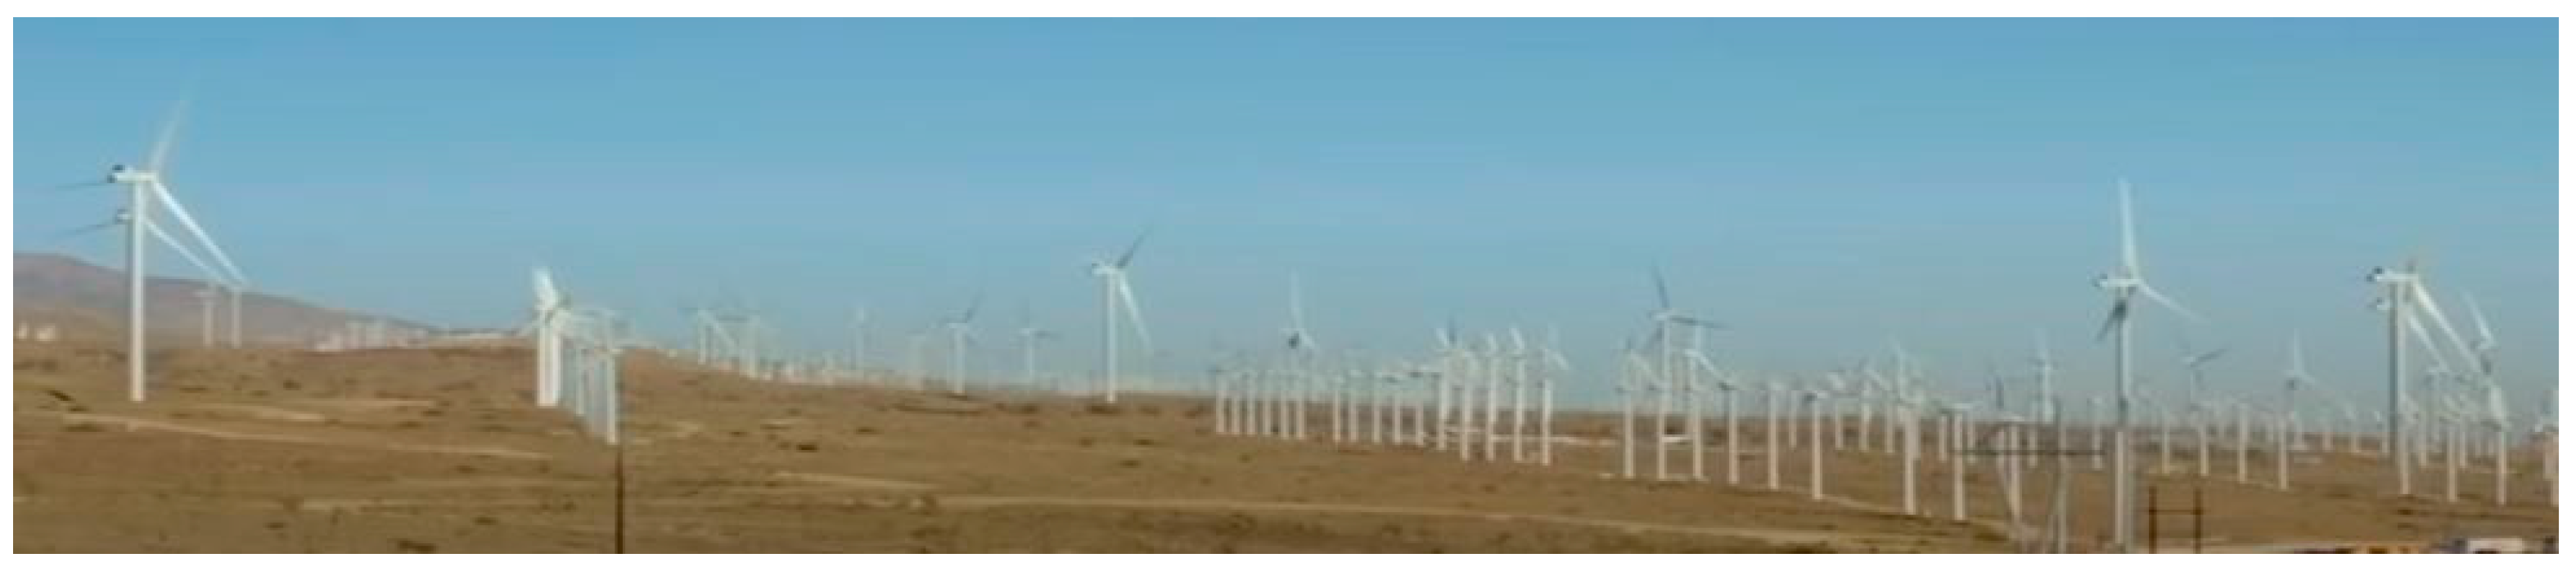
3. Wind Energy
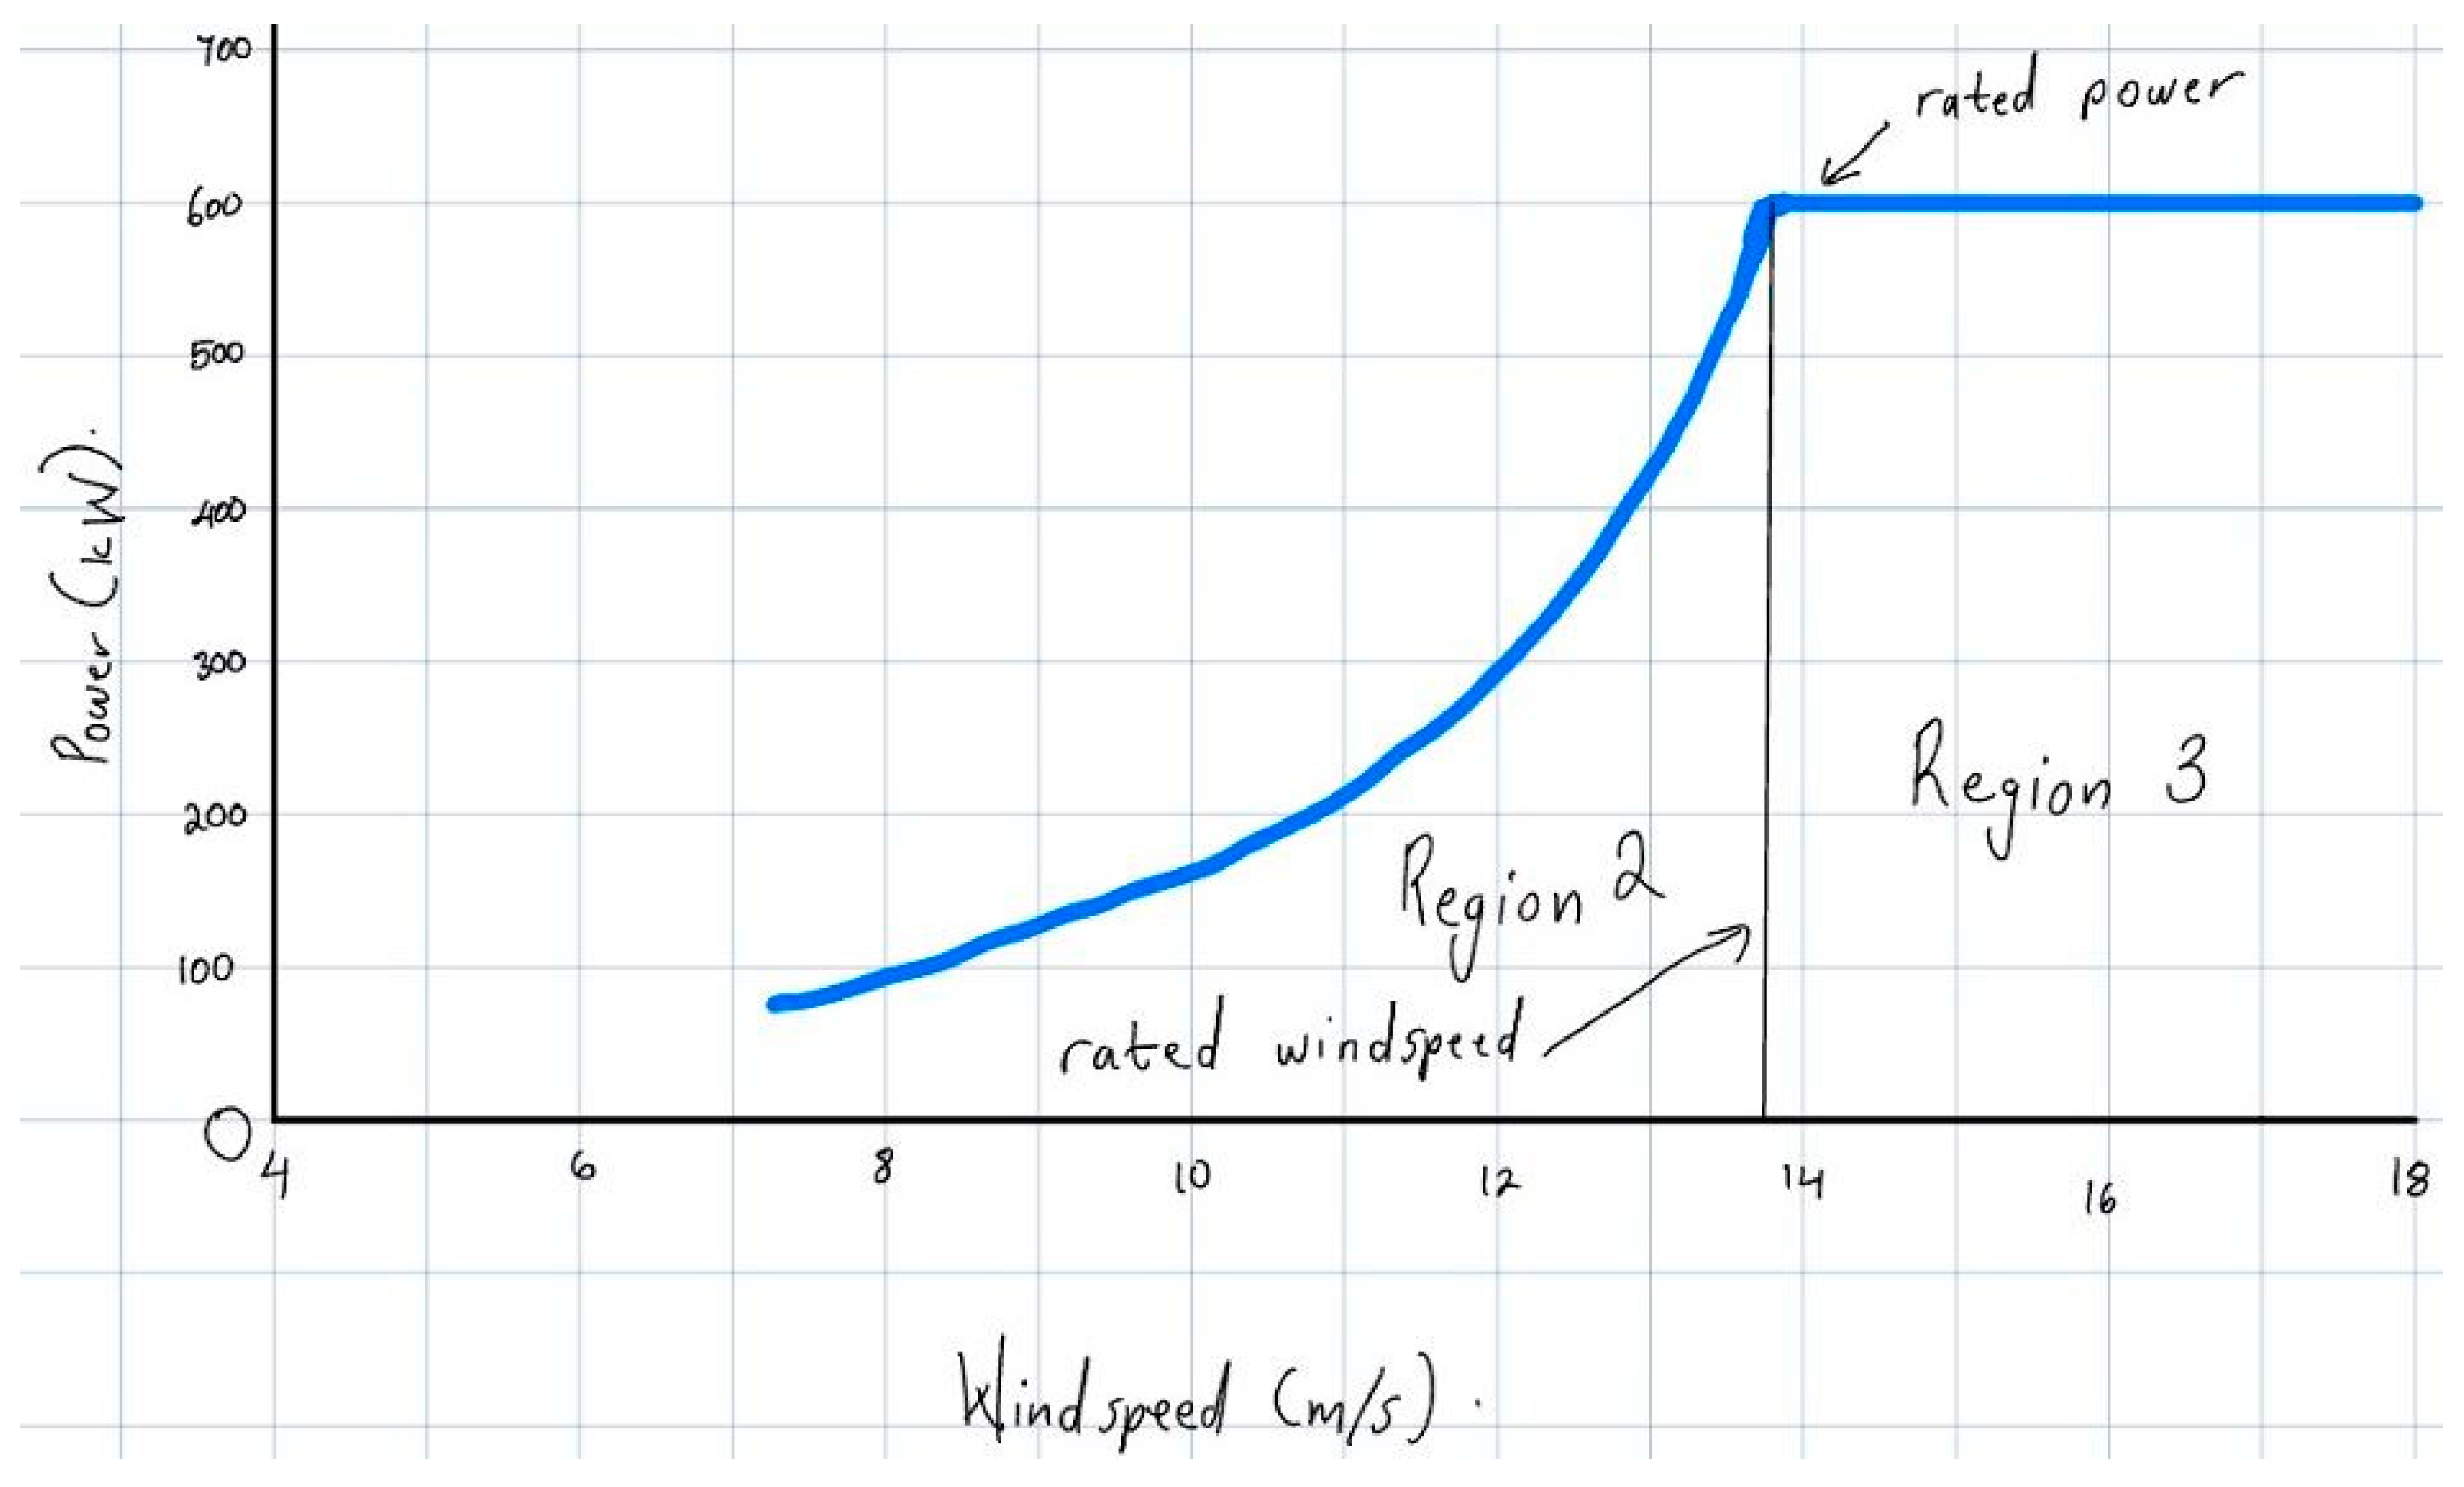
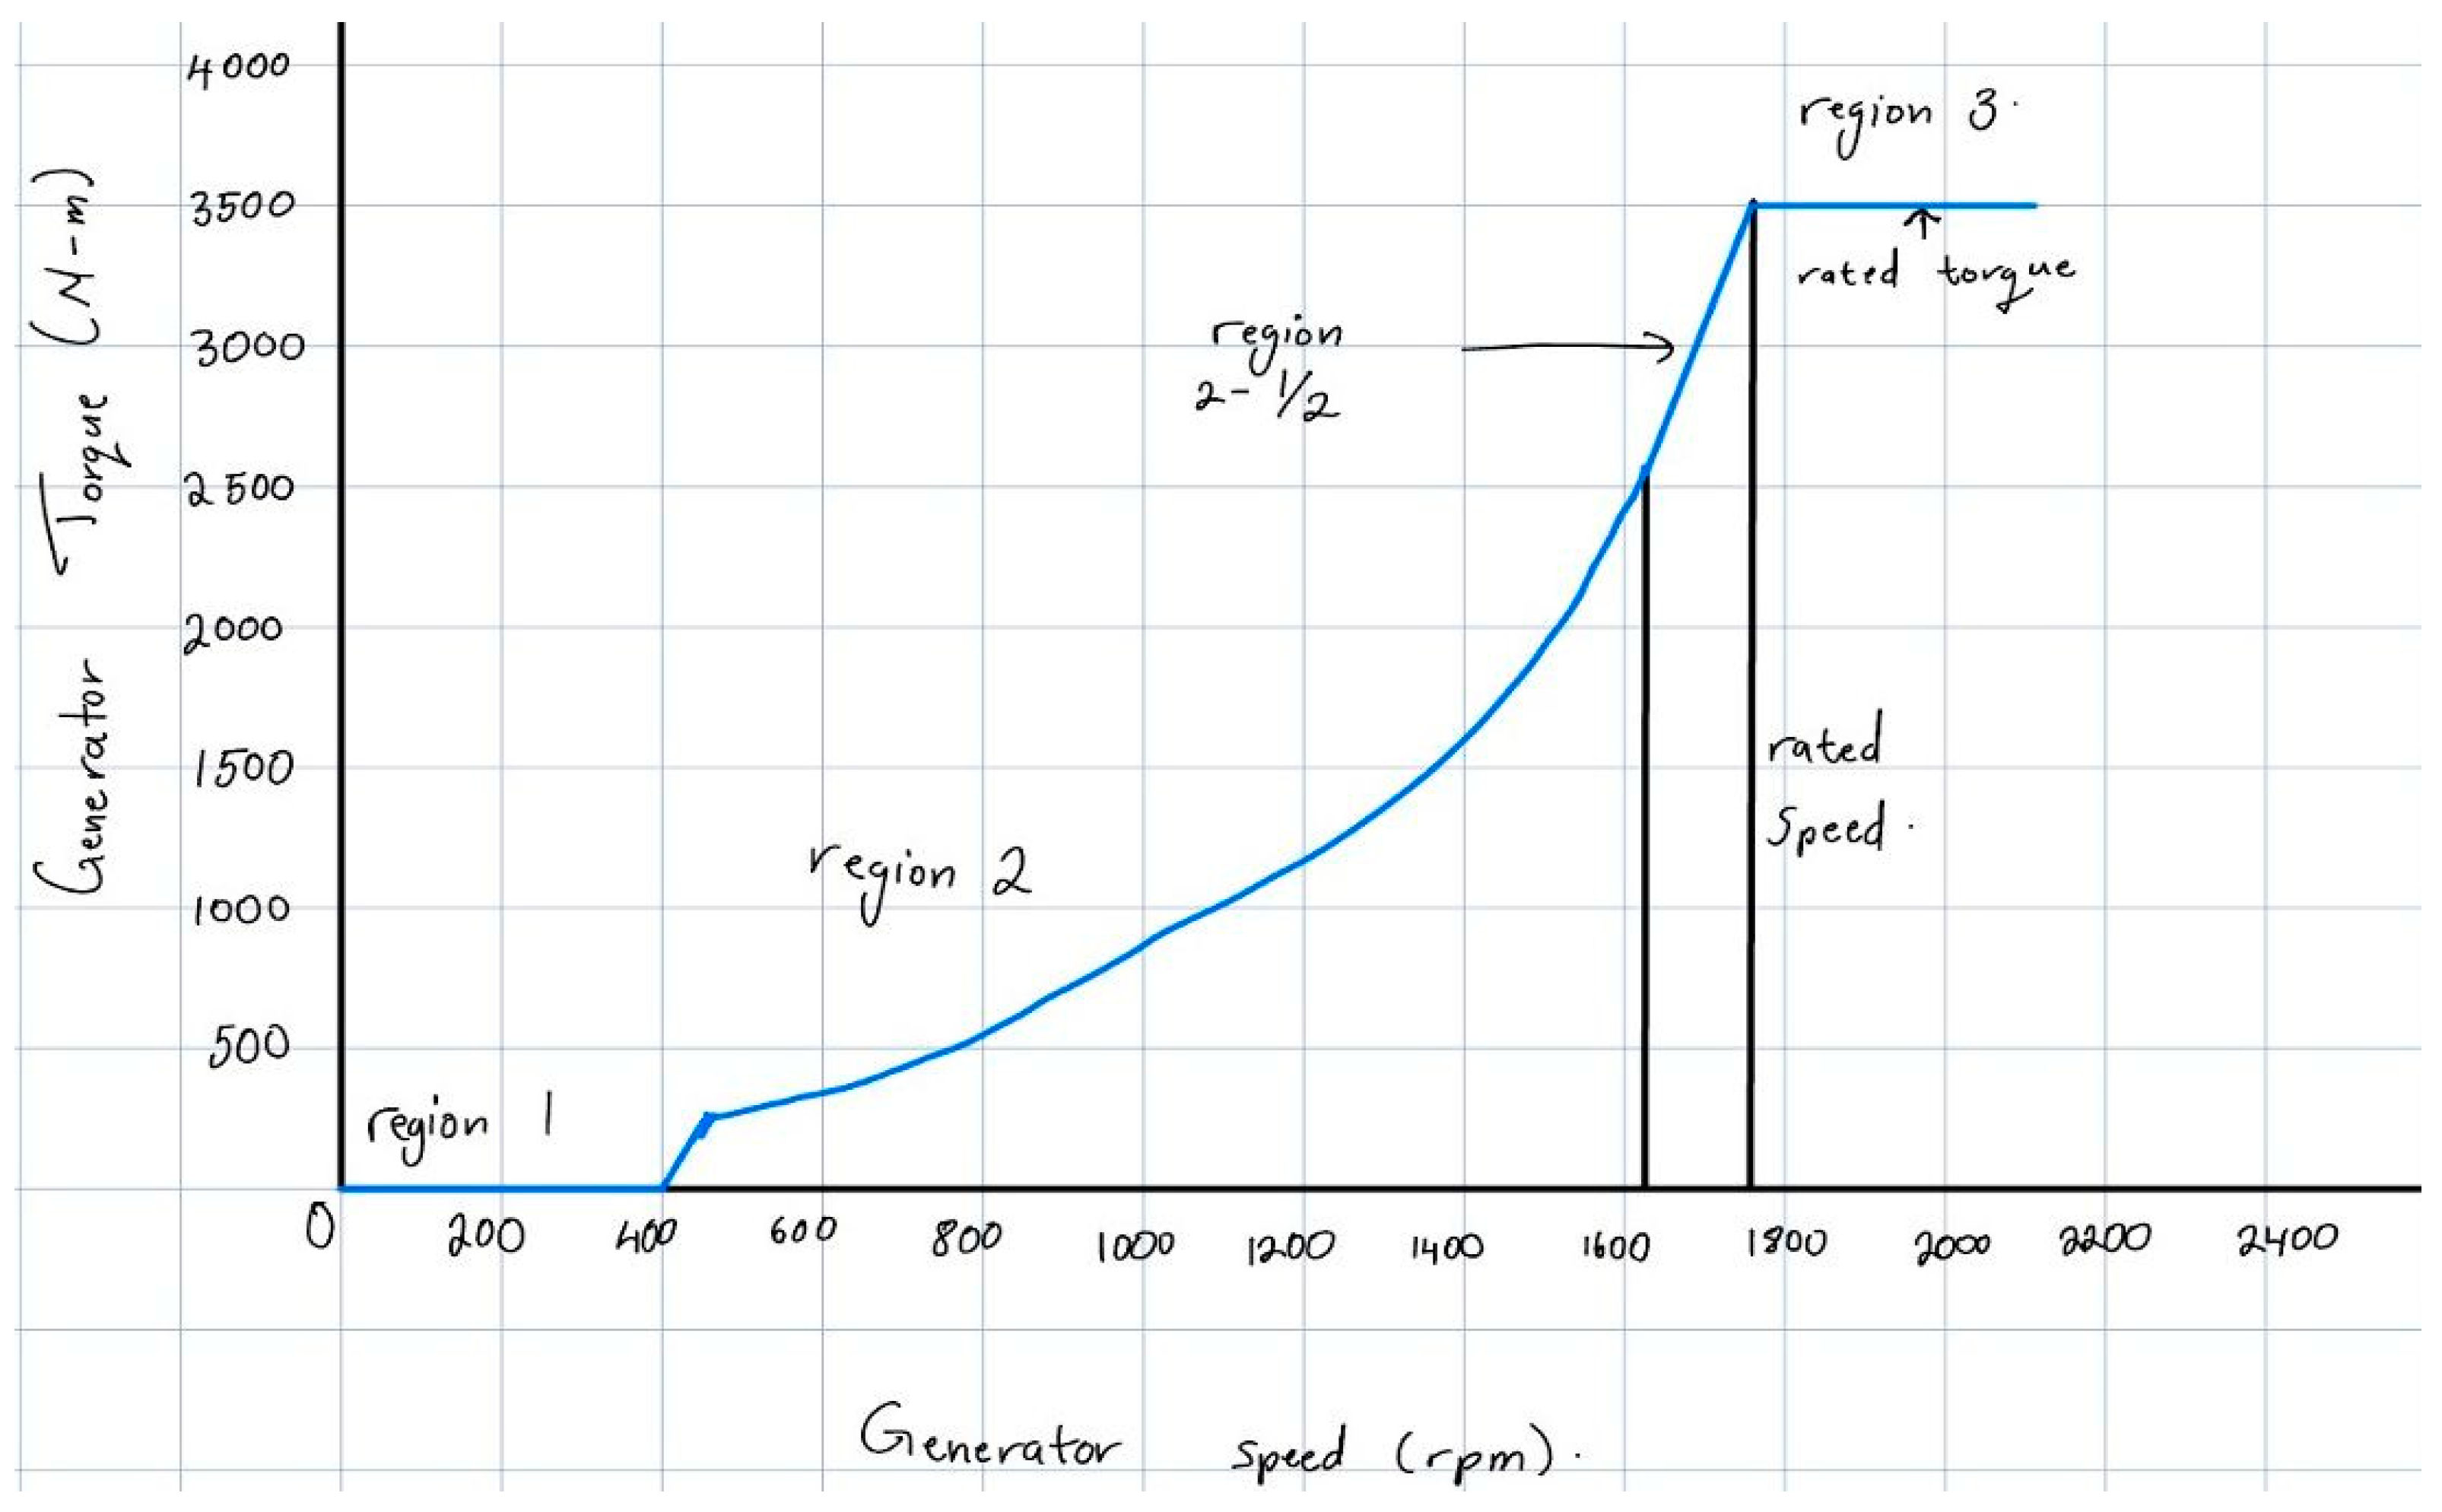
3.1. Horizontal Axis Wind Turbine
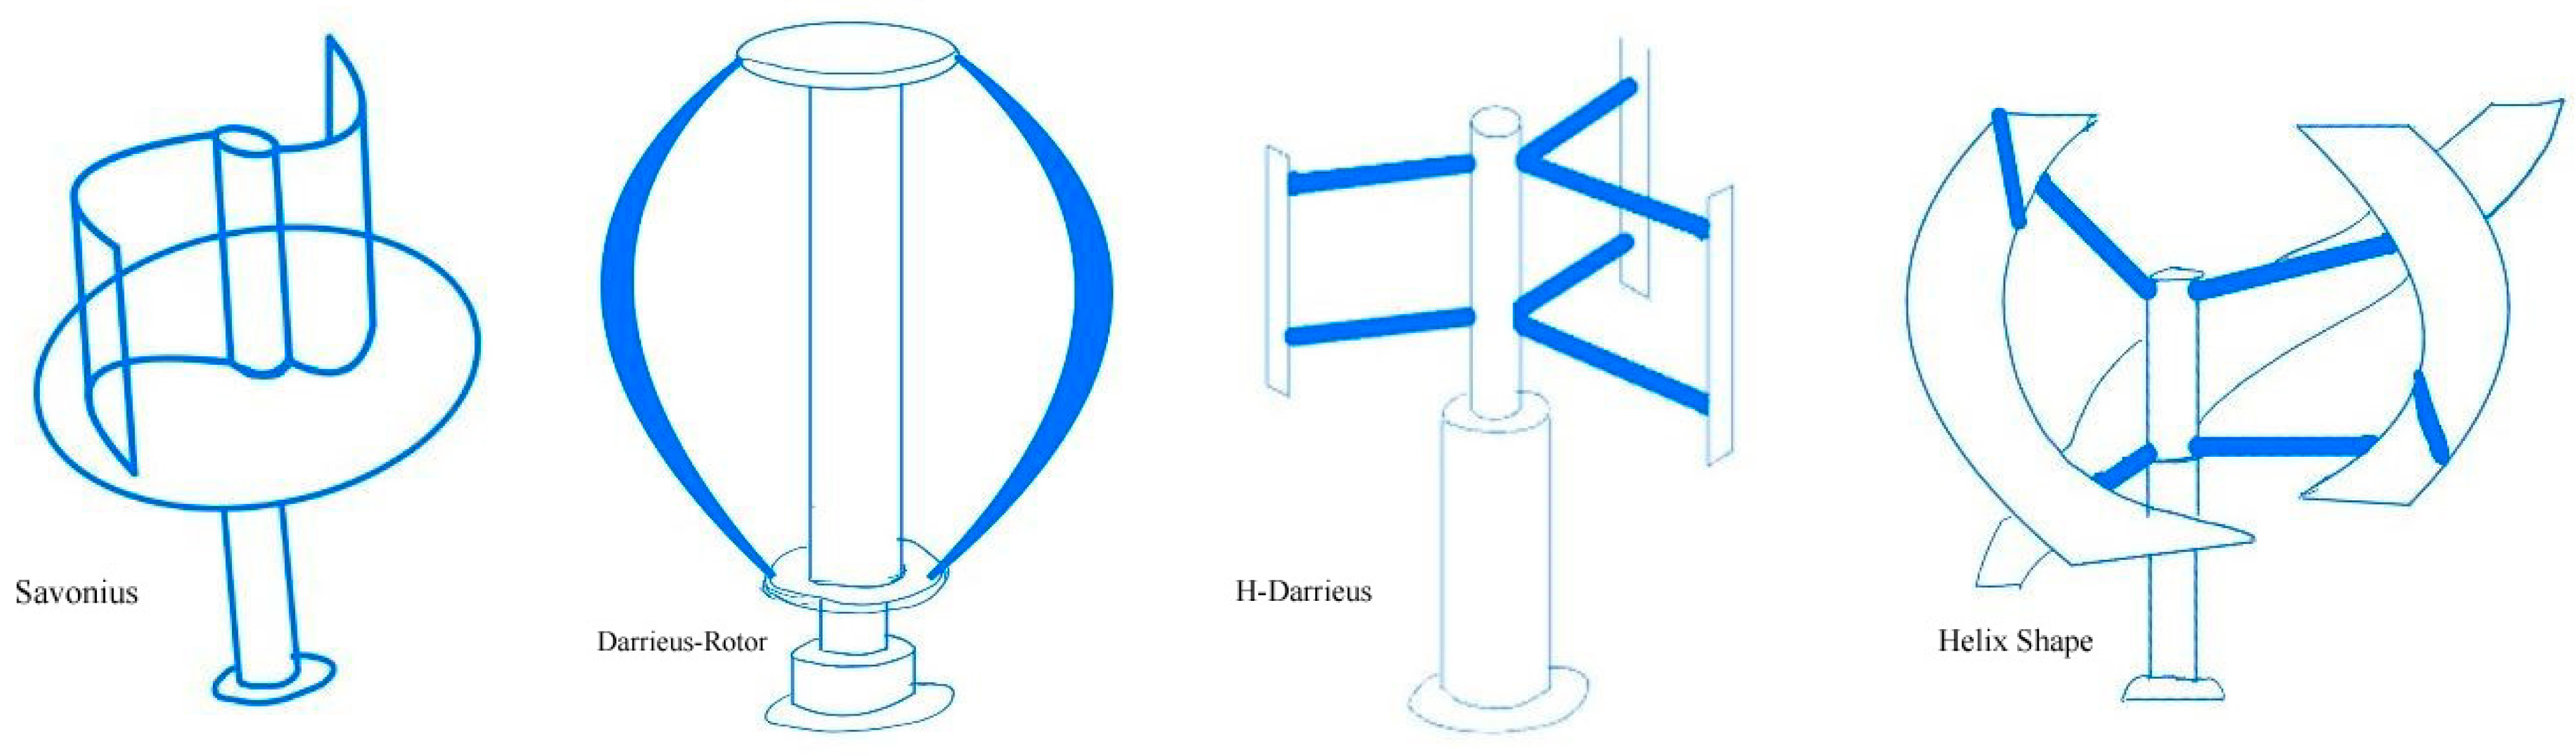
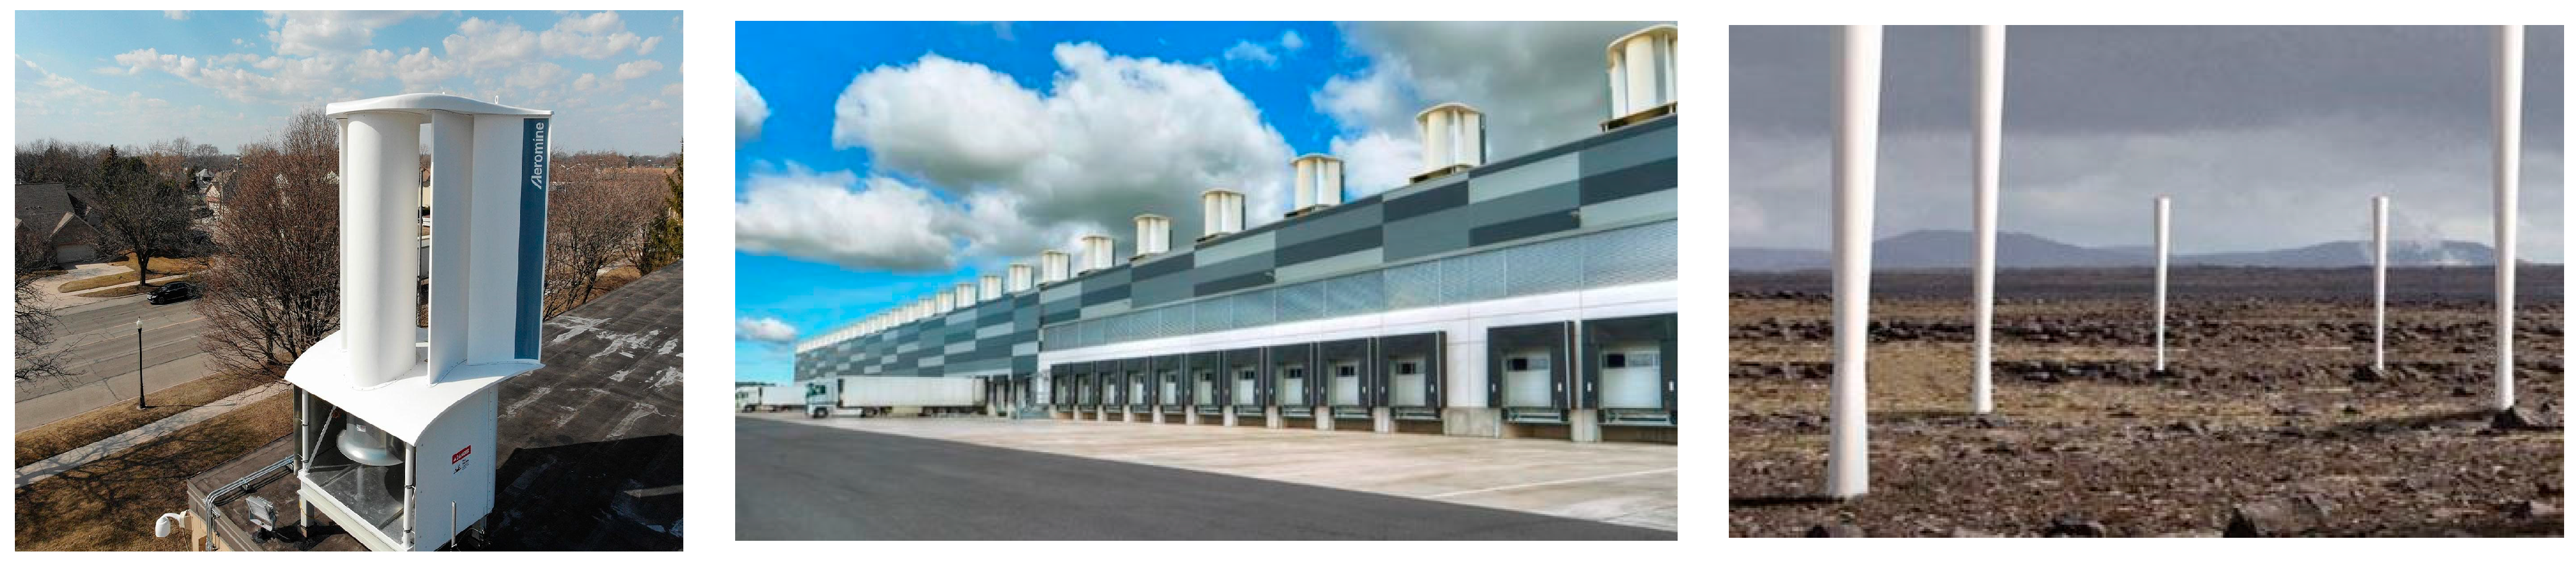
3.2. Vertical Axis Wind Turbine
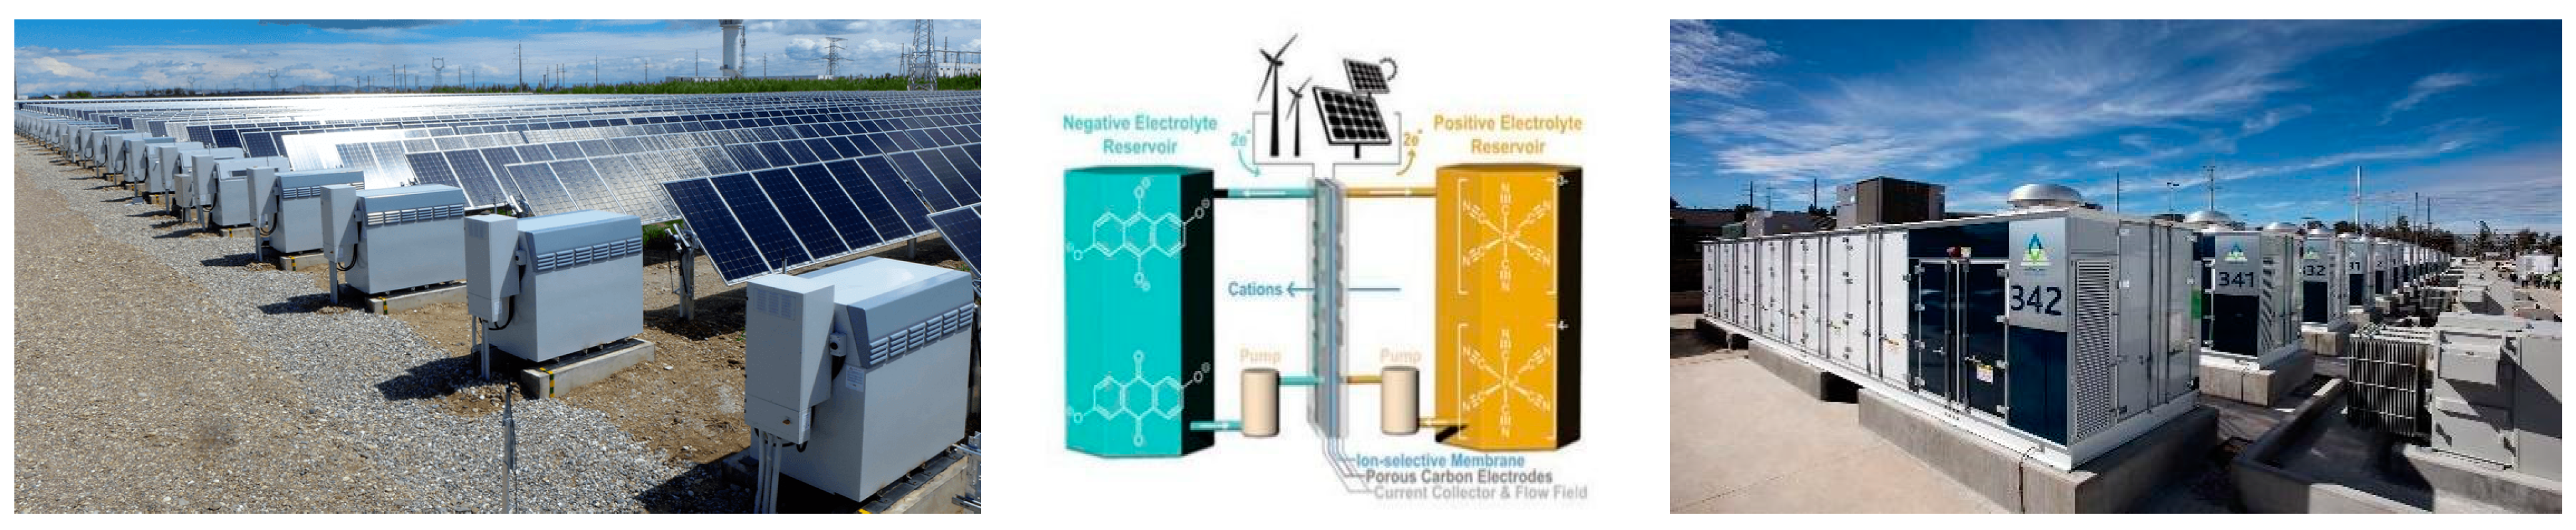
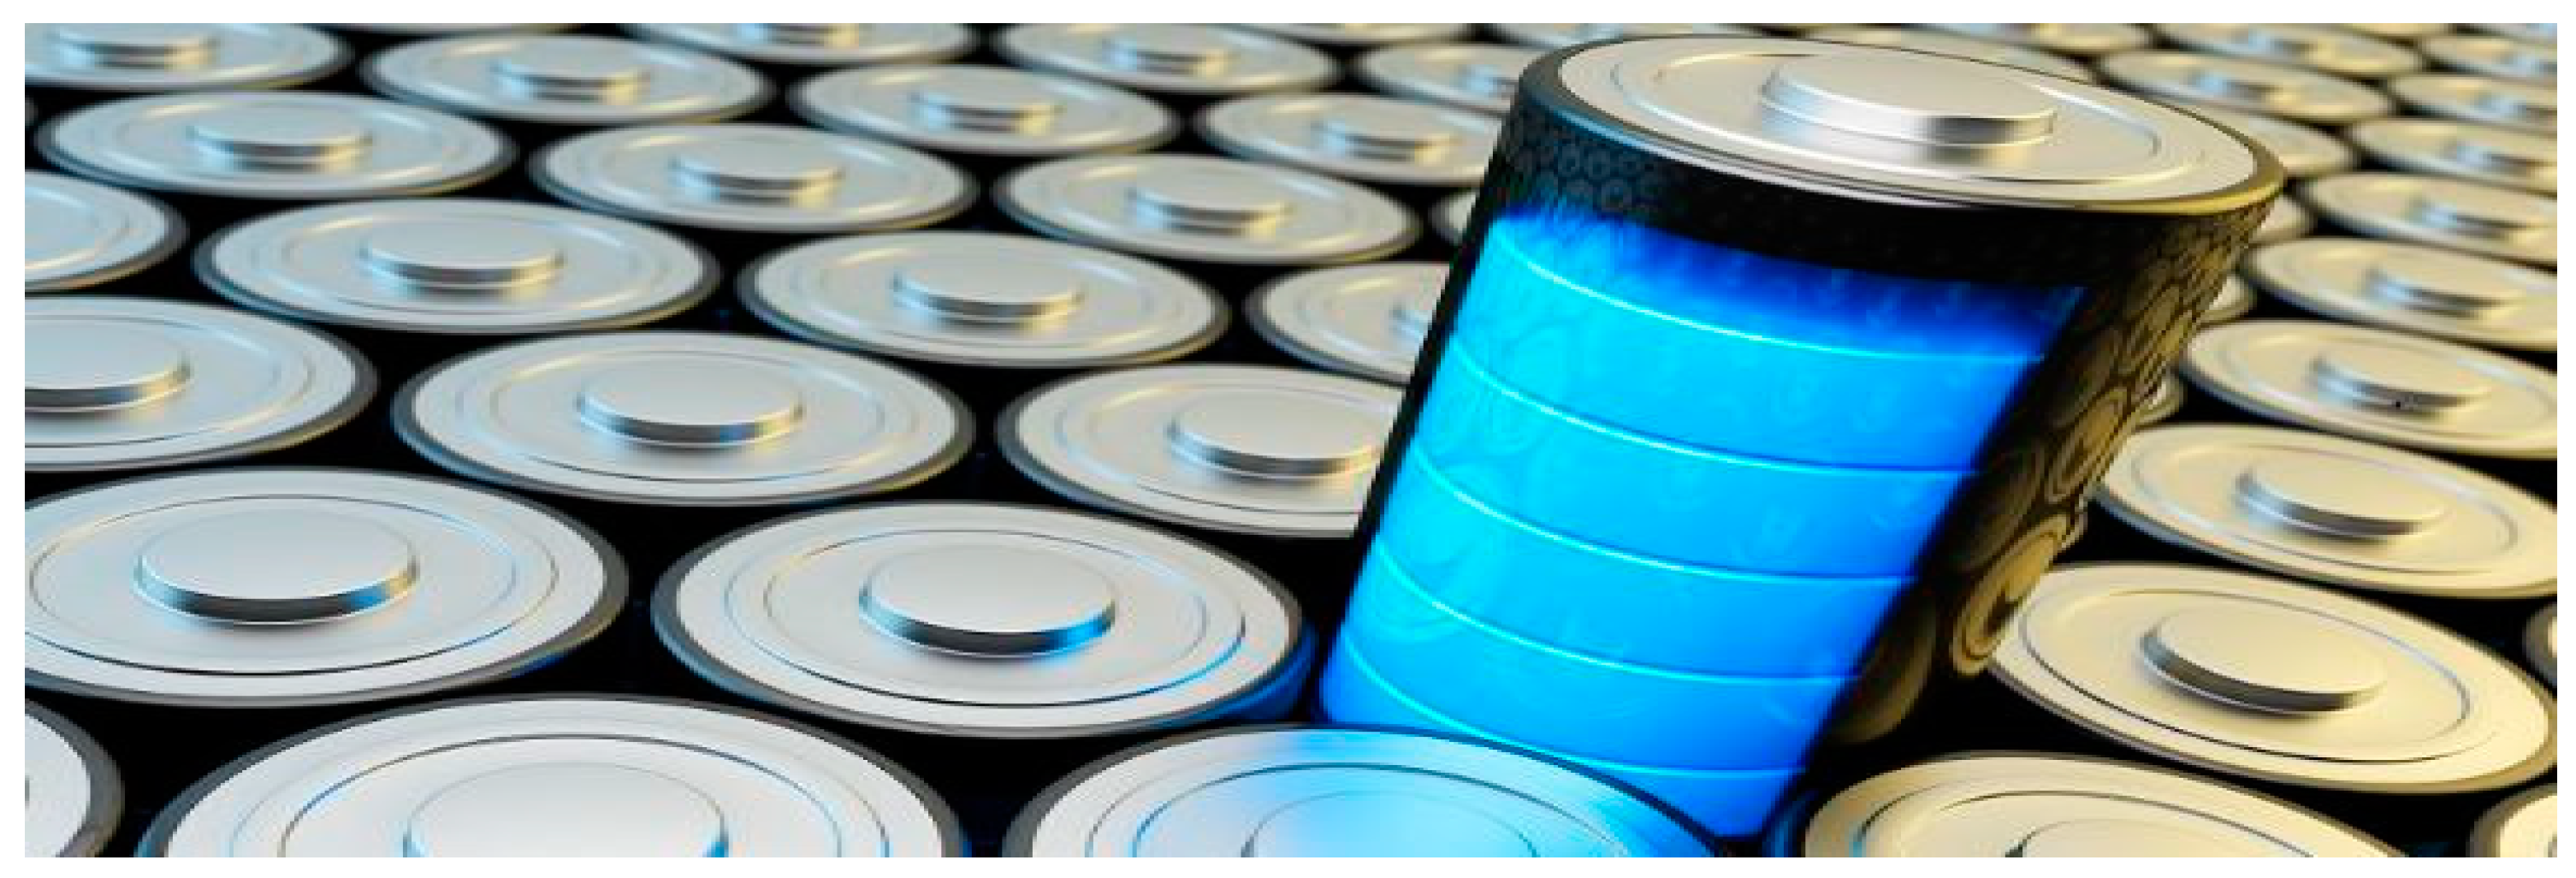
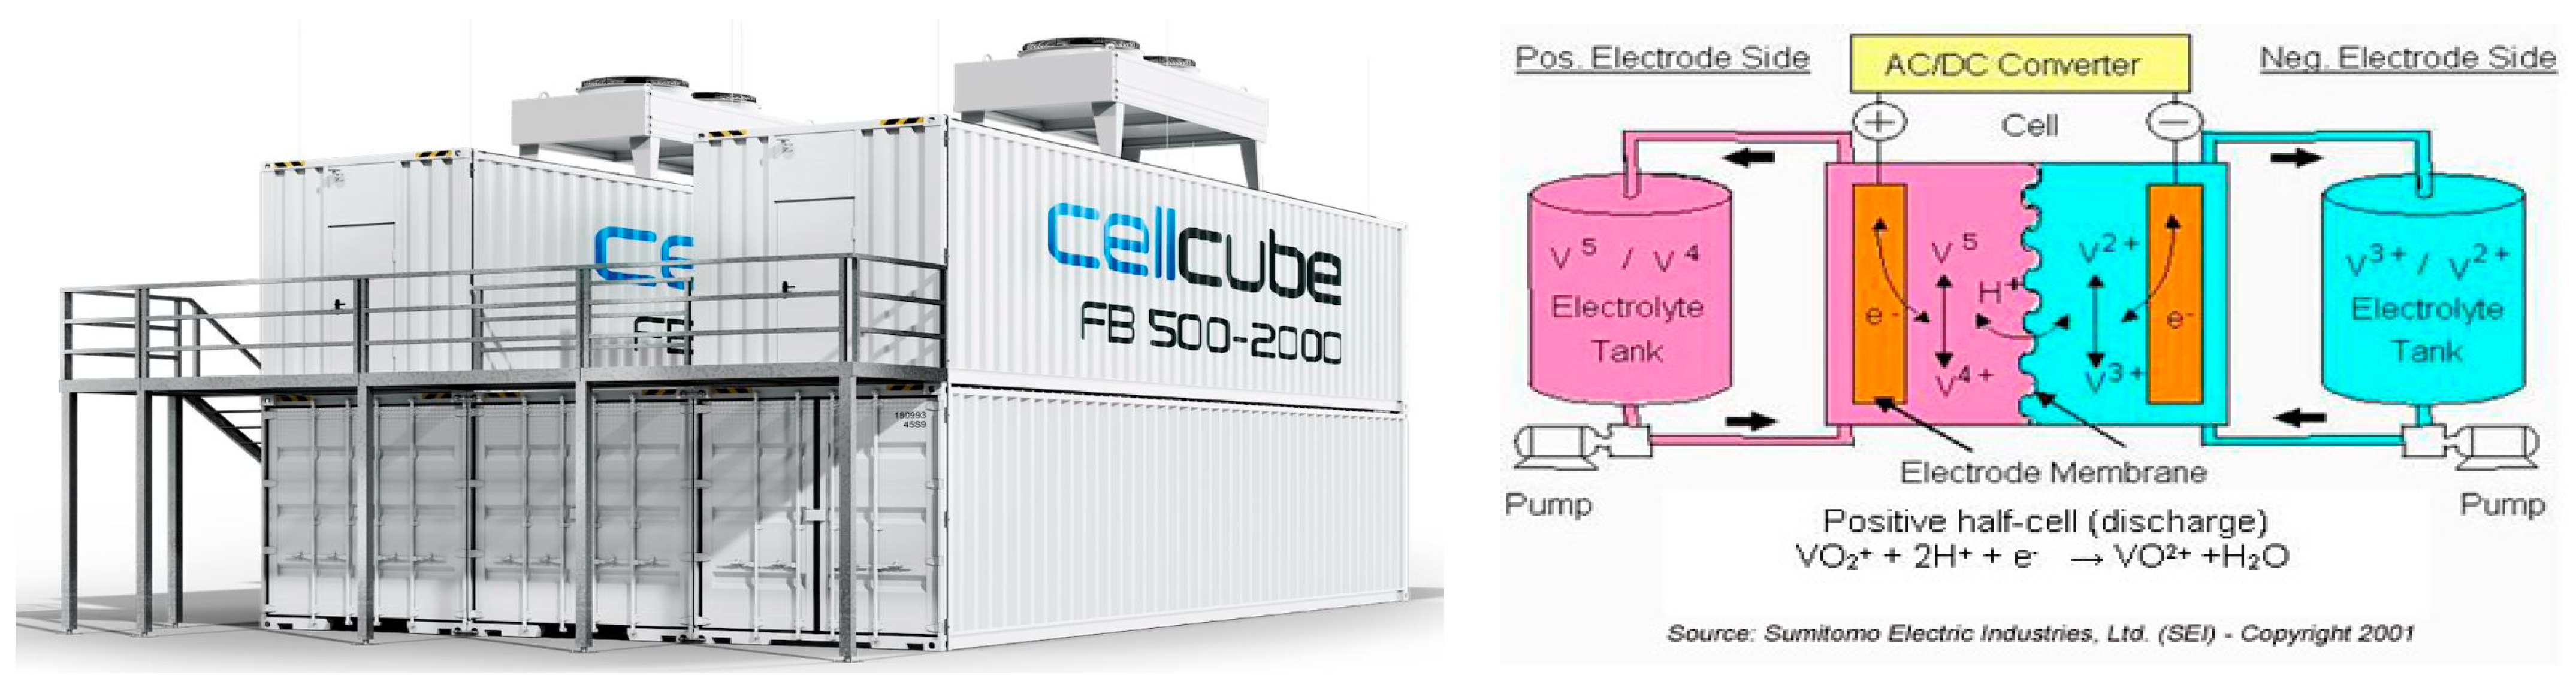
4. Energy Storage
5. Hydrogen Fuel Cells, Bioenergy and Biomass, and Other Renewable Energy
5.1. Hydrogen Fuel Cells


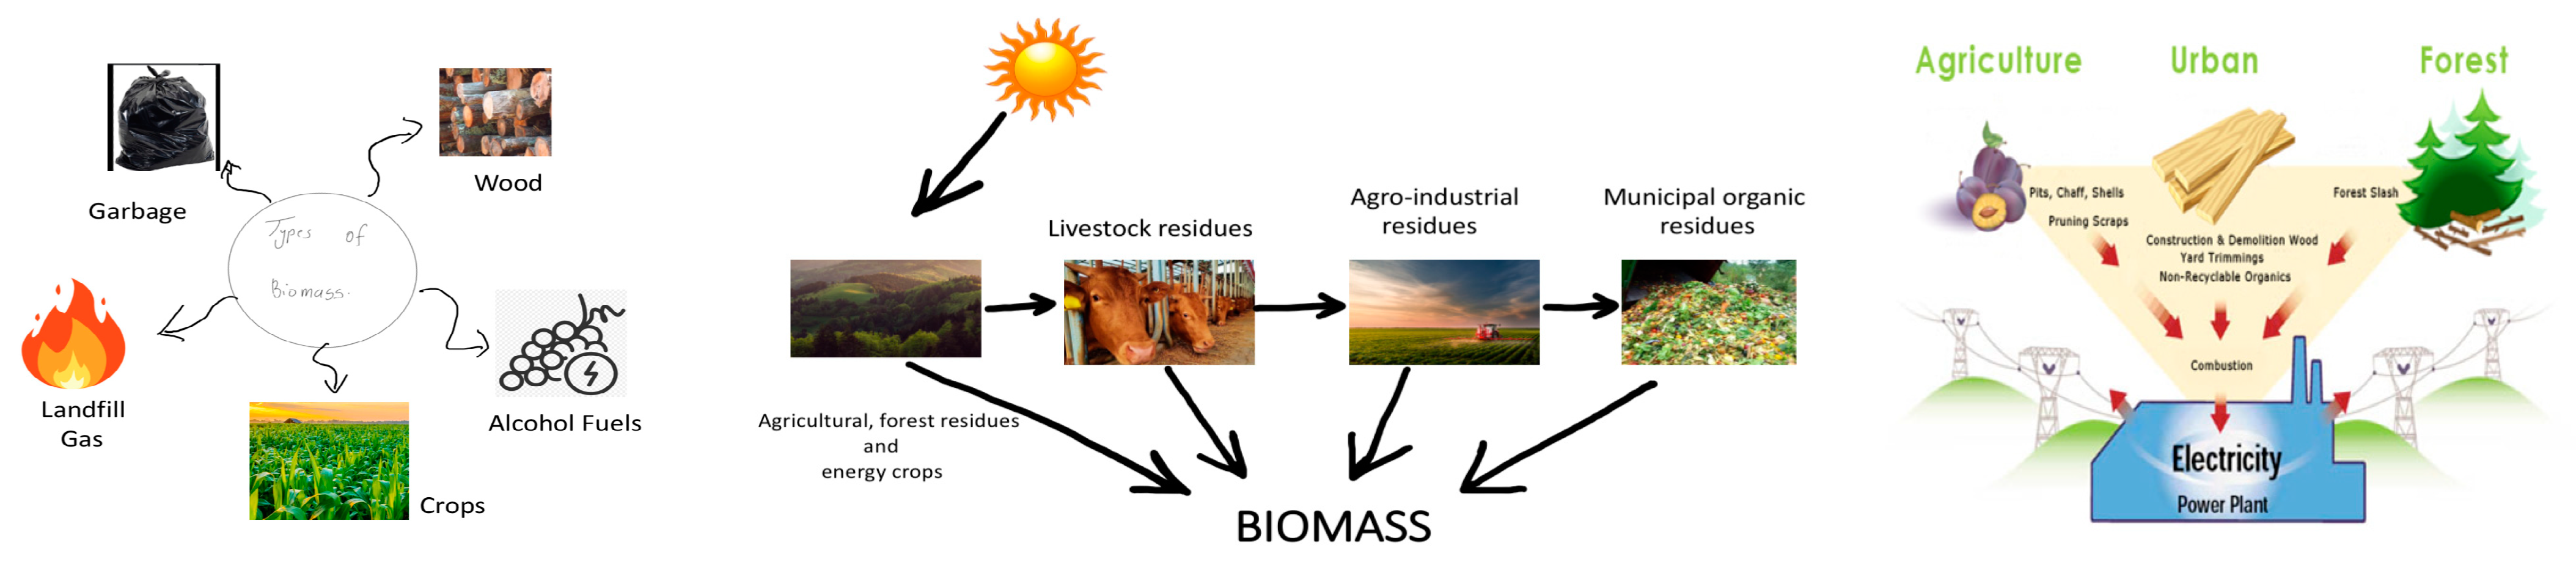
5.2. Bioenergy and Biomass
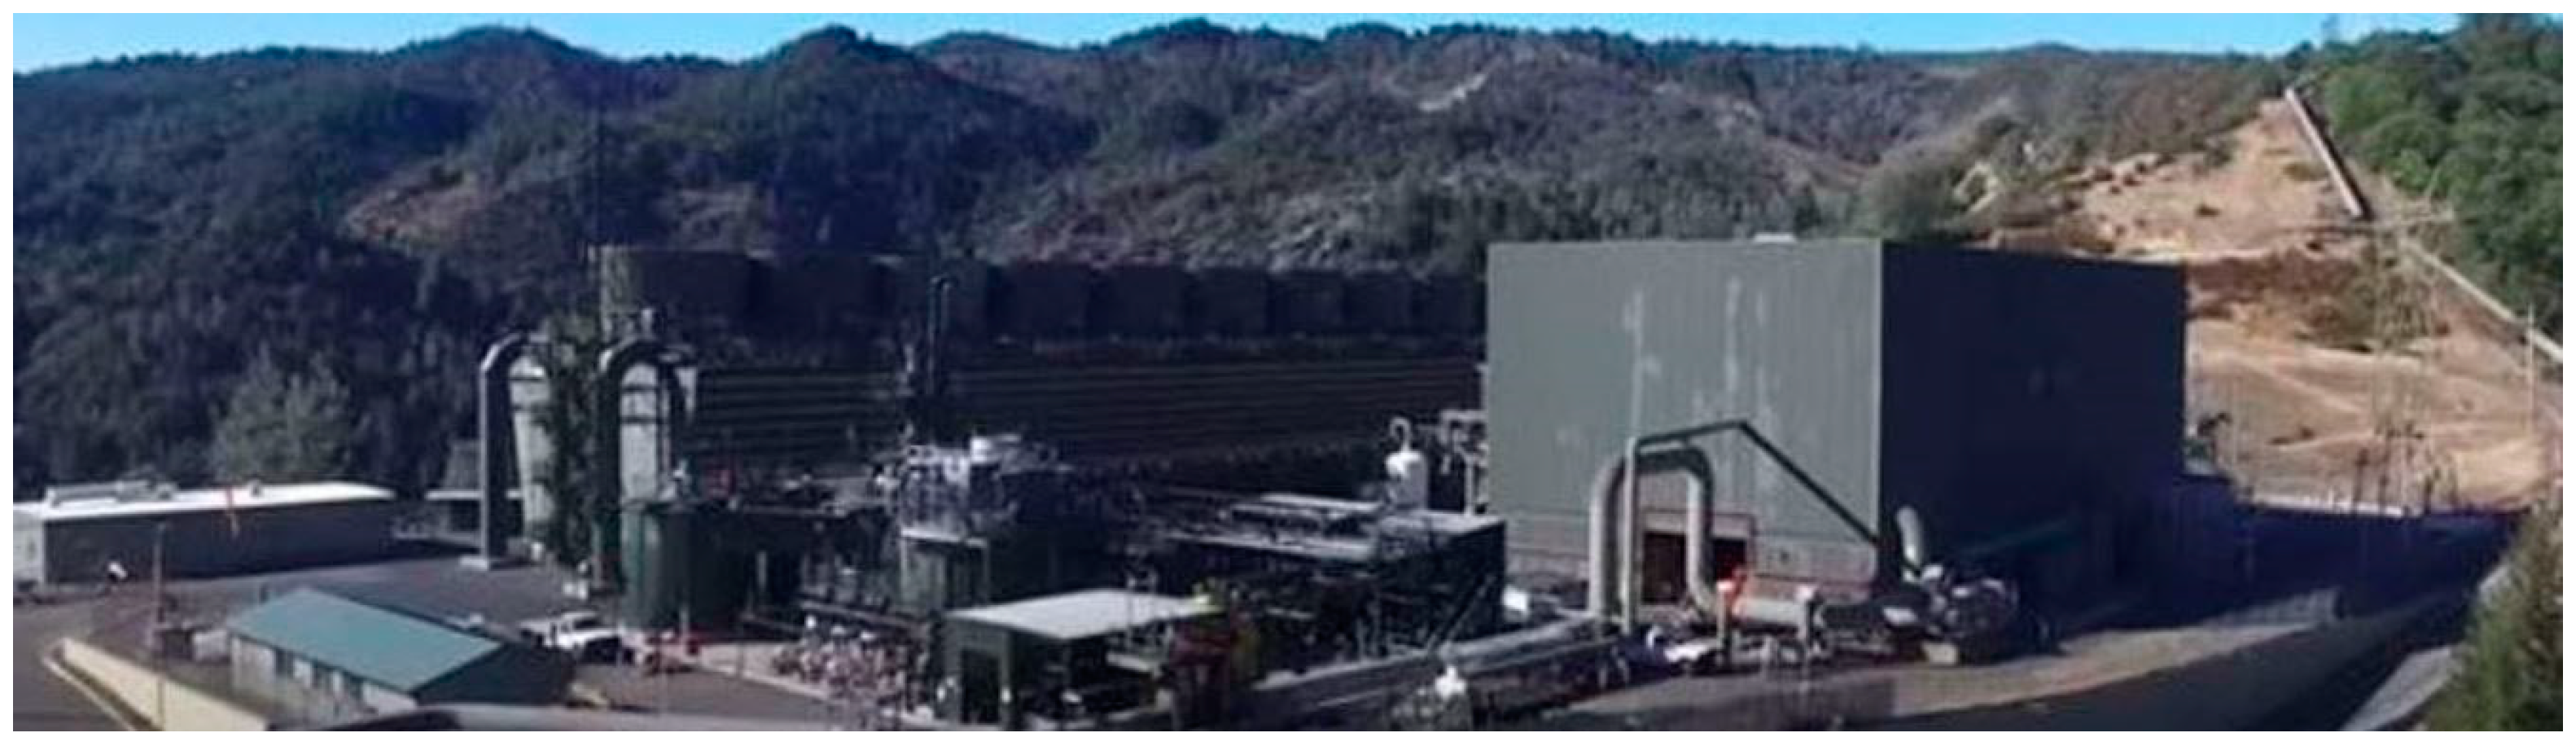
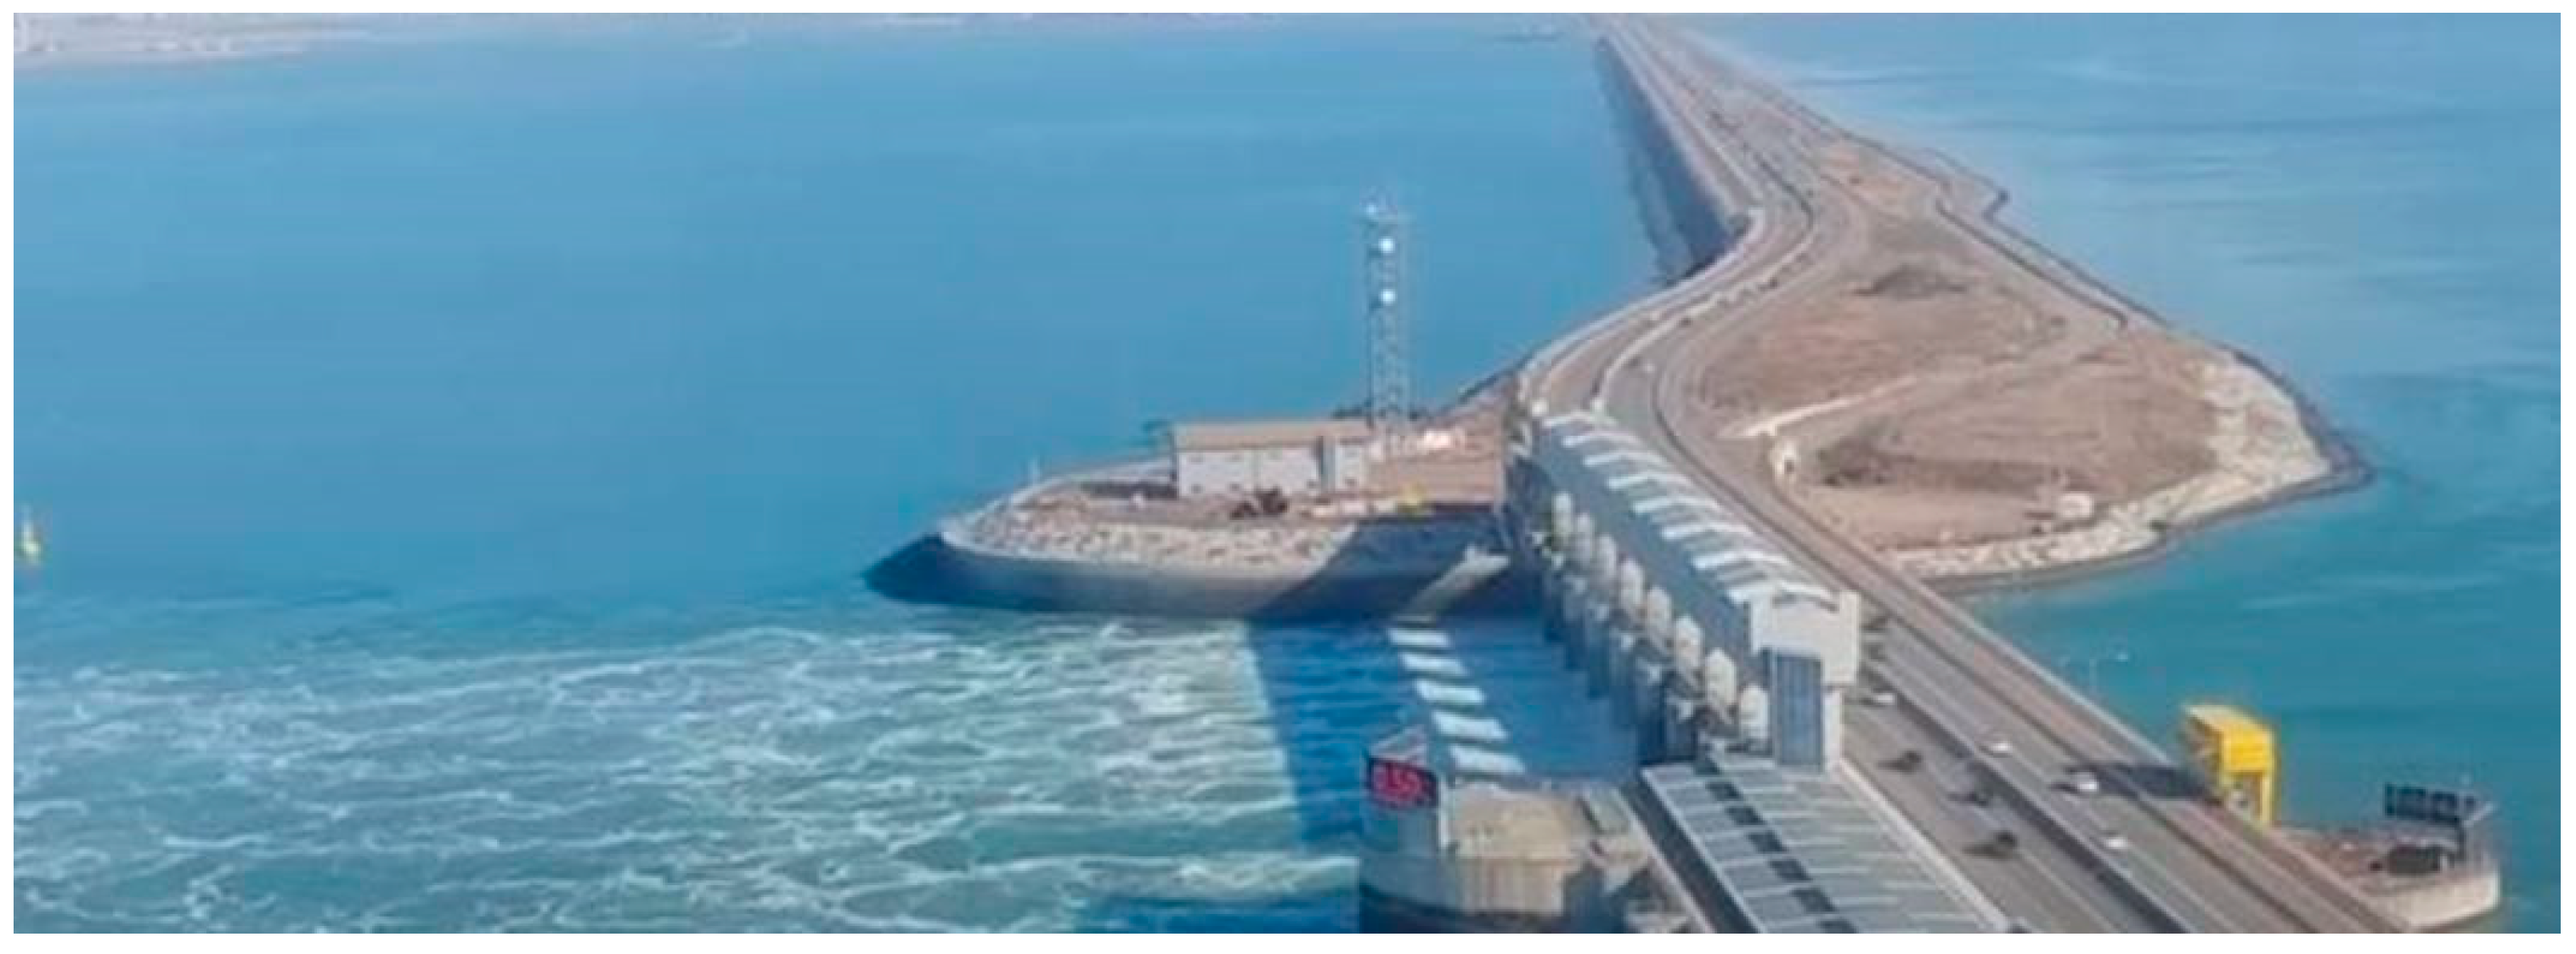
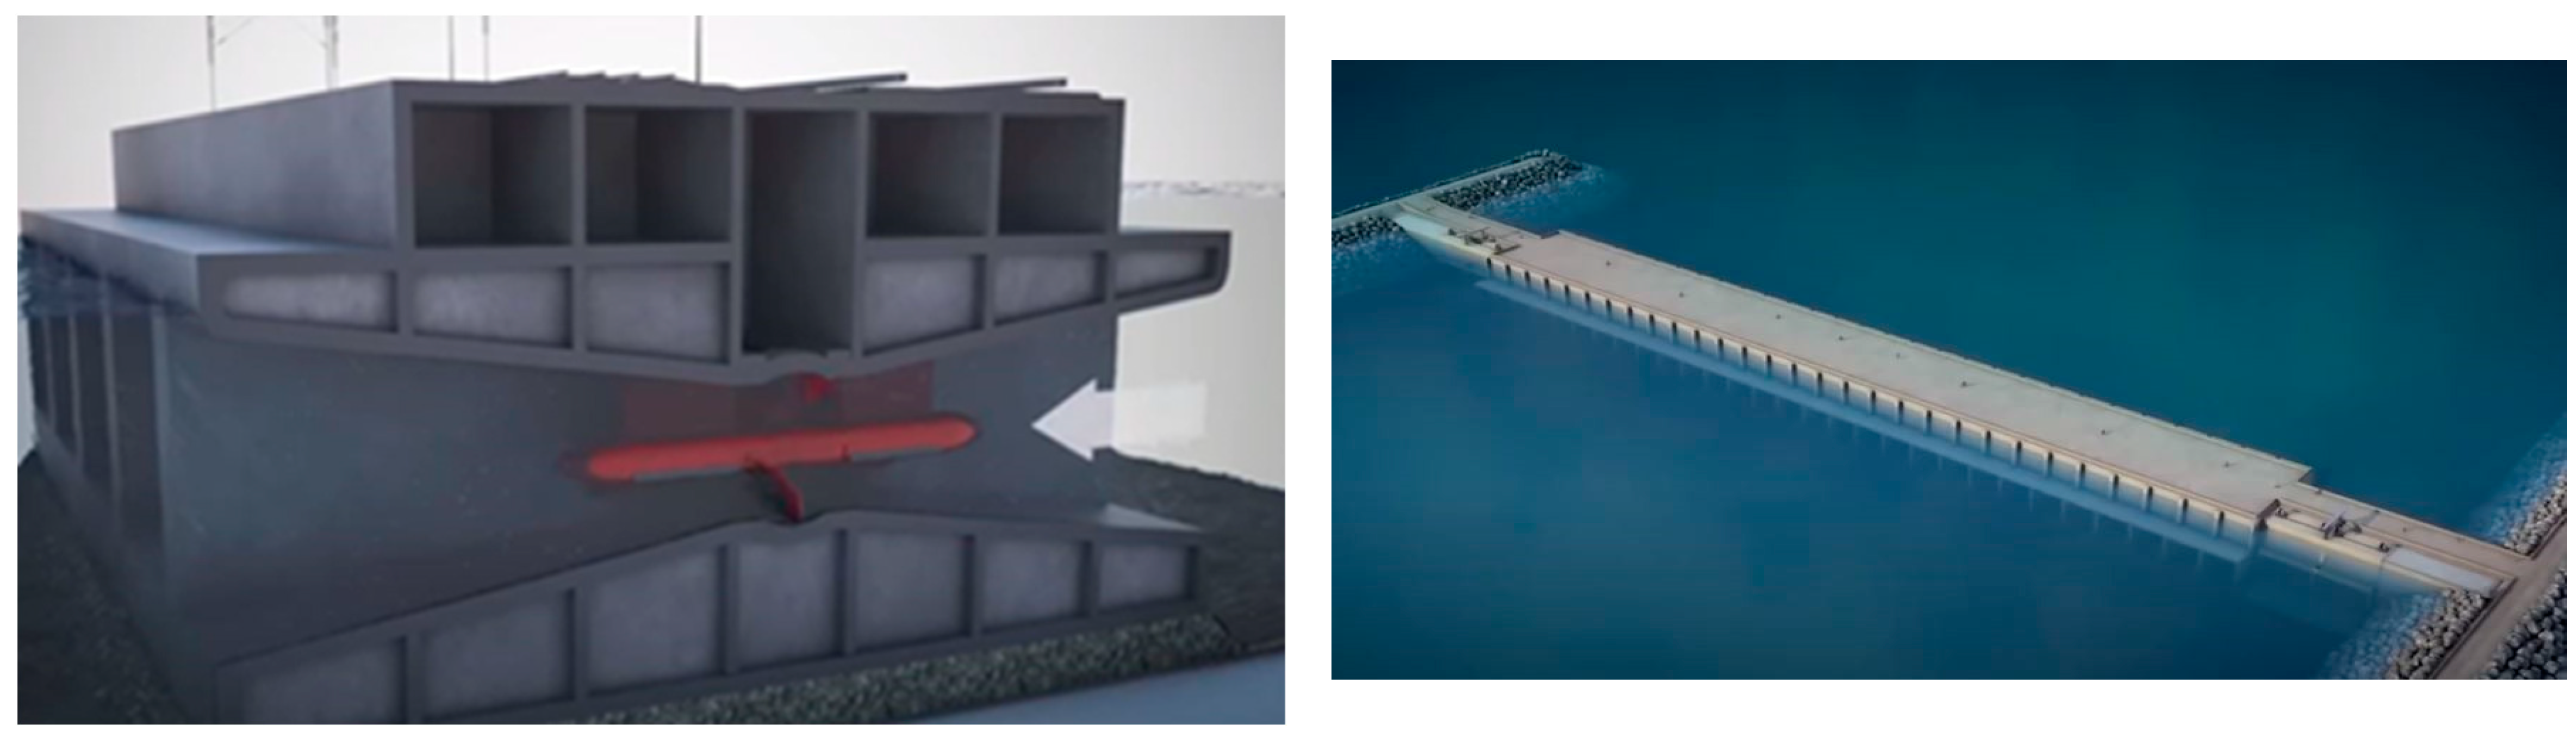
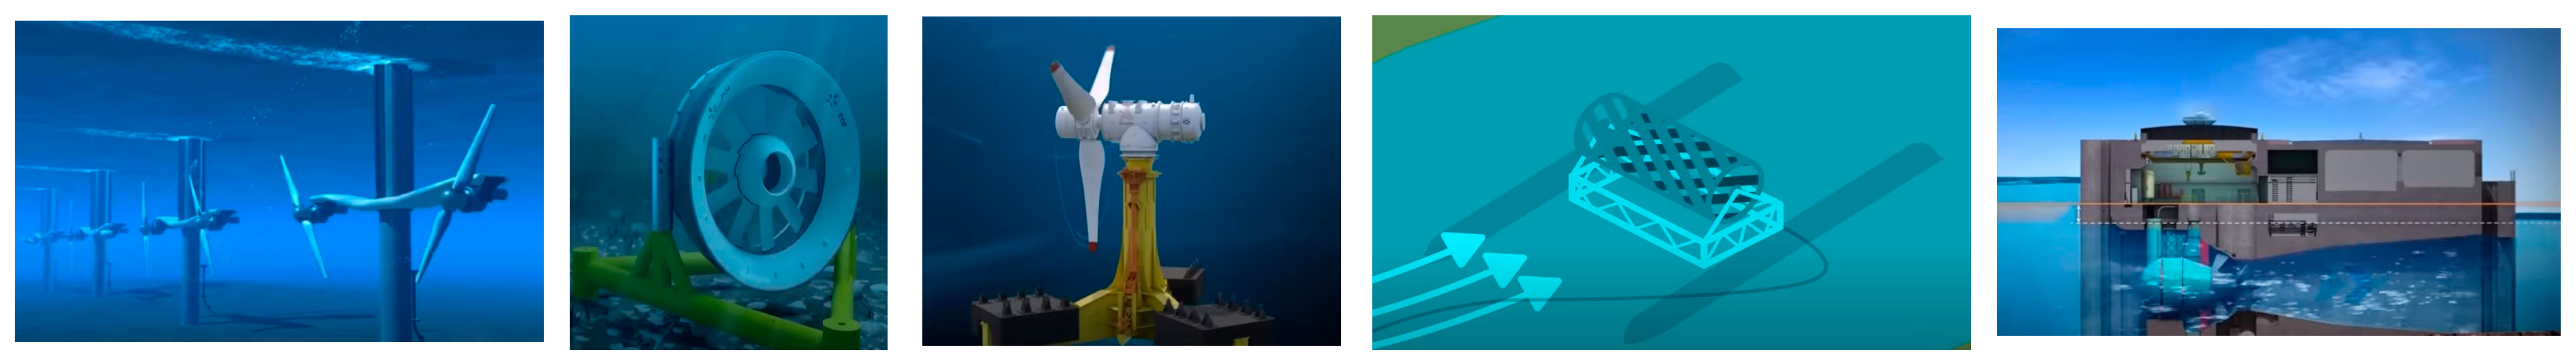
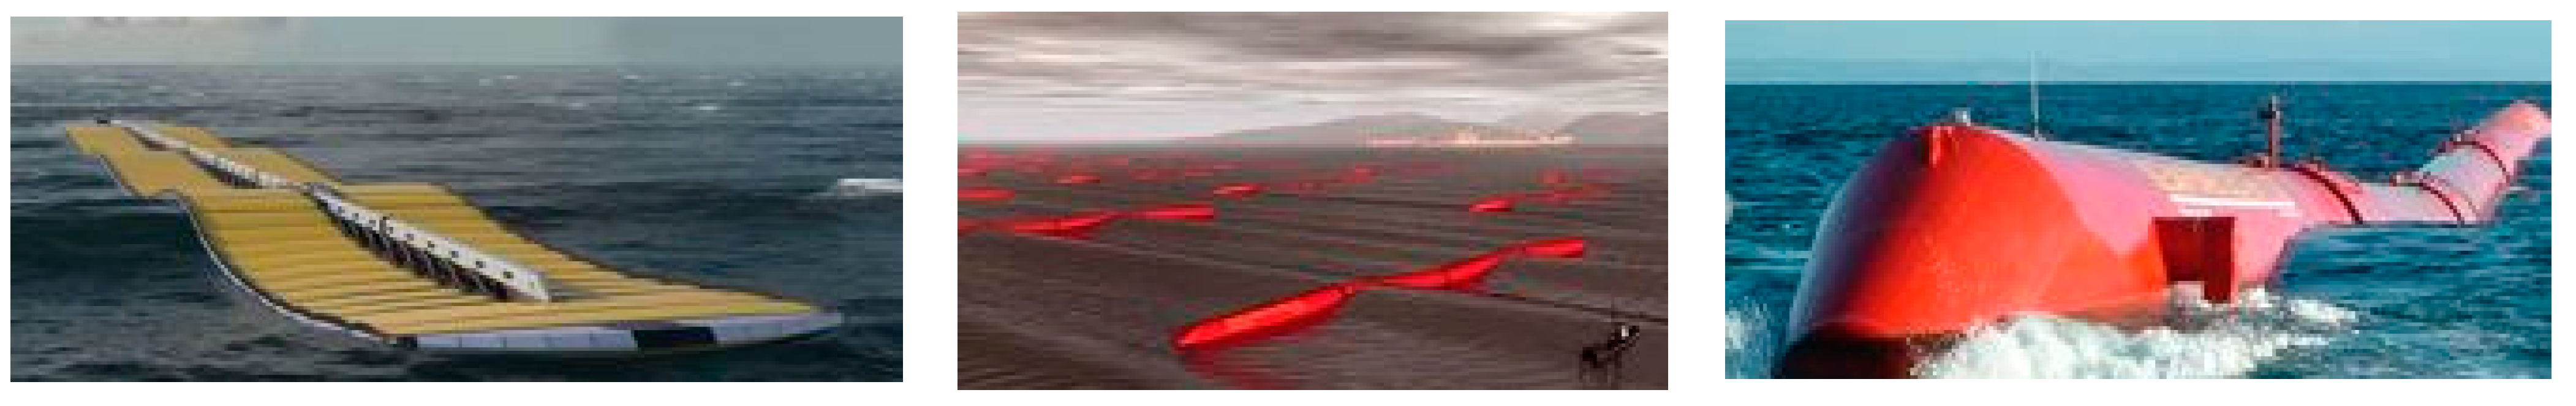
5.3. Other Renewable Energy
6. Conclusions
Funding
Data Availability Statement
Acknowledgments
Conflicts of Interest
References and Notes
- Center for Sustainable Systems, University of Michigan. Photovoltaic Energy. 2022. Available online: https://css.umich.edu/sites/default/files/2022-09 (accessed on 11 October 2022).
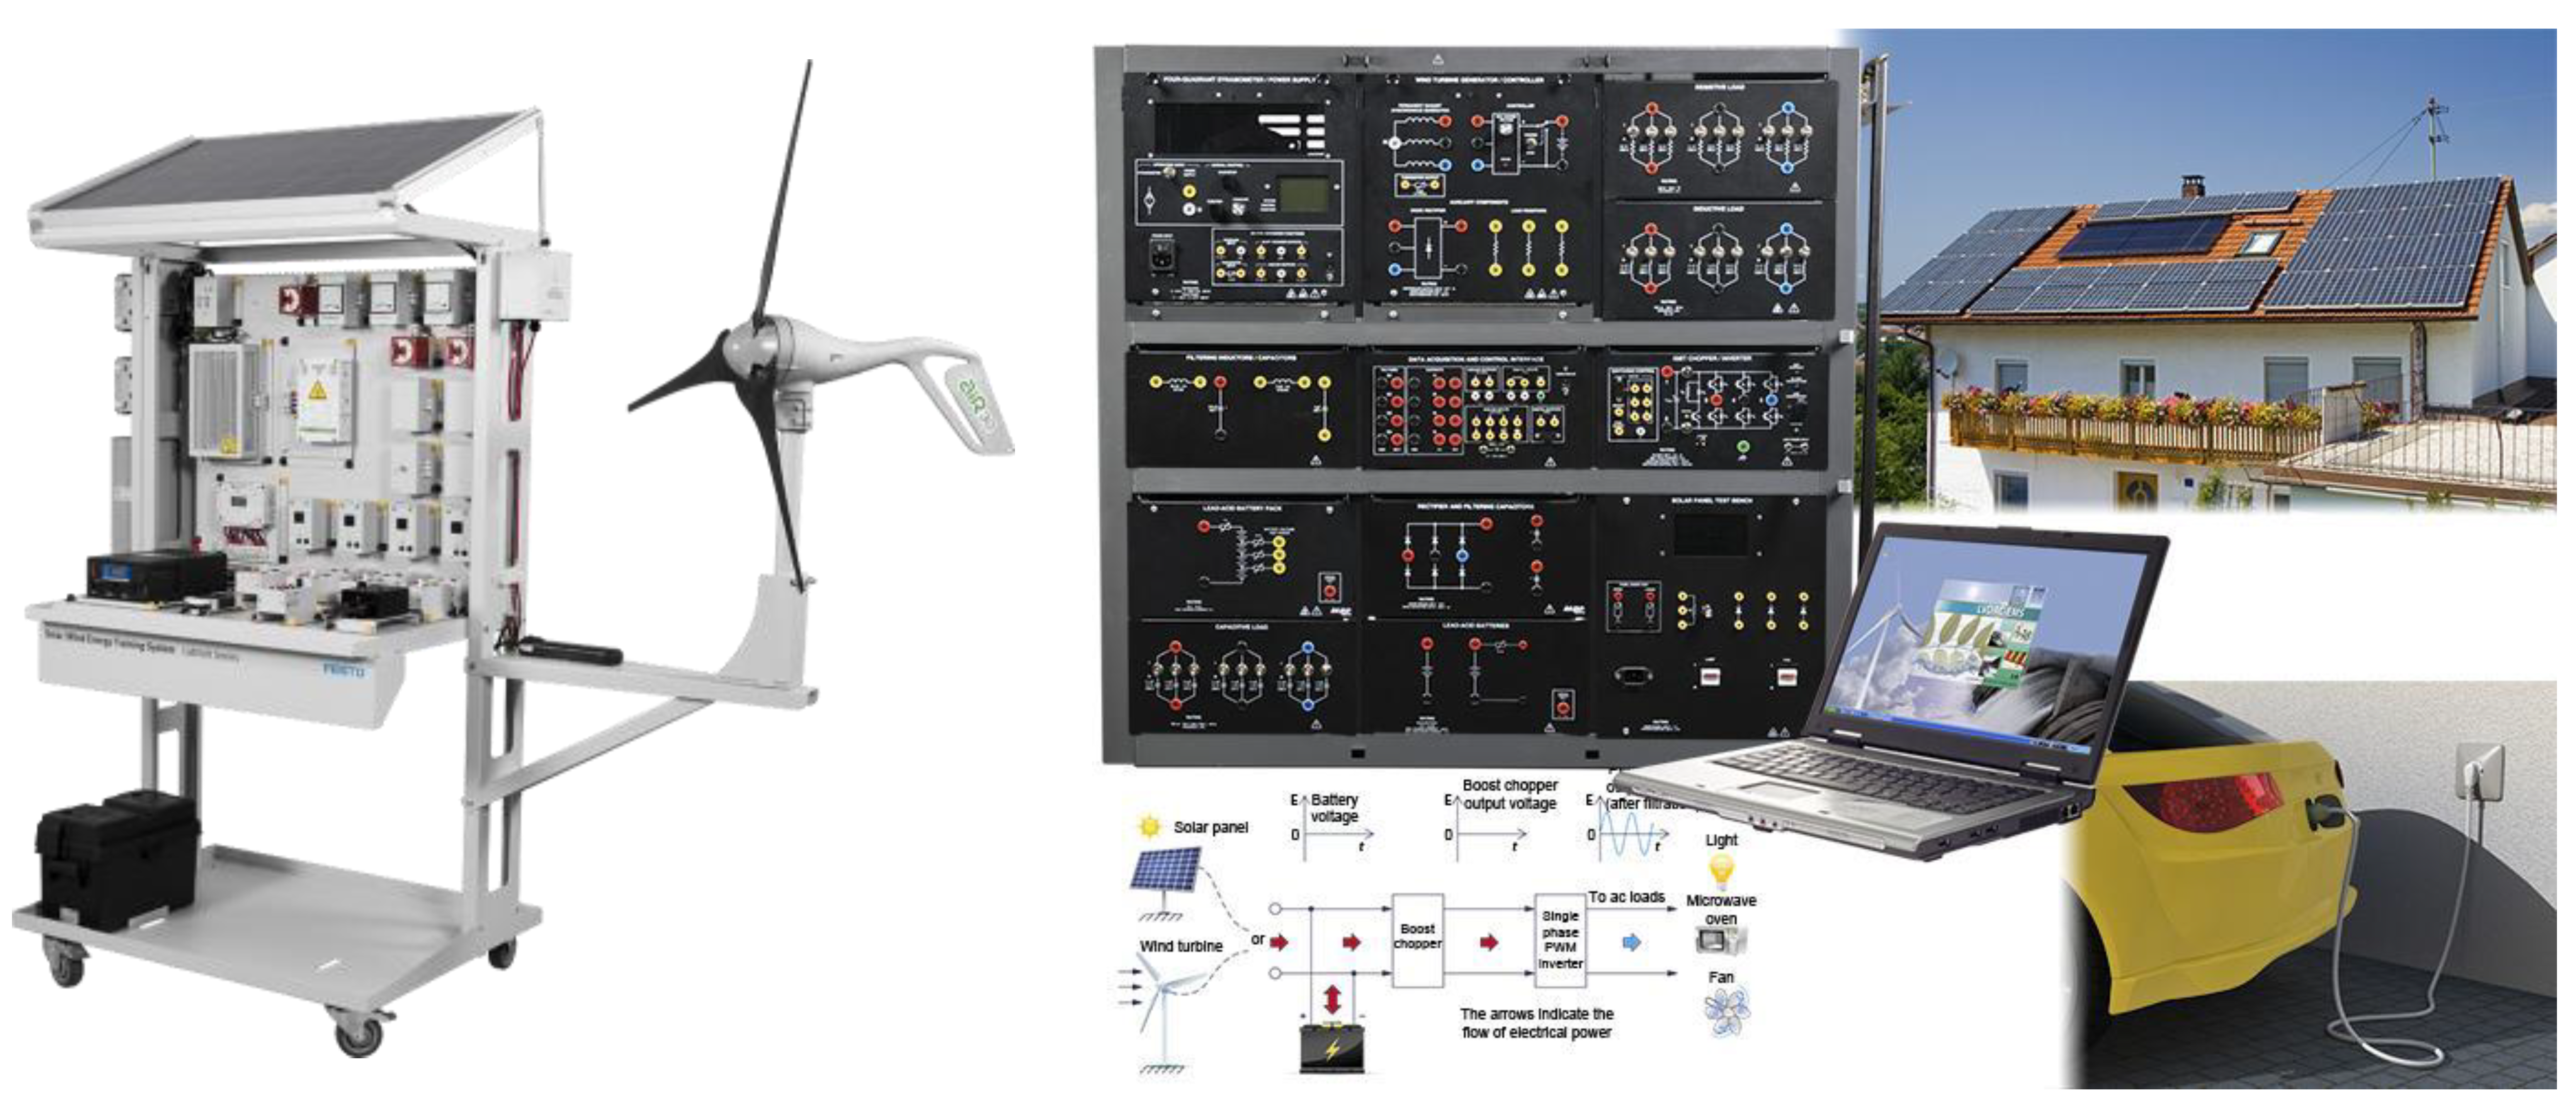
- FESTO Didactic. 2022. Available online: https://labvolt.festo.com/about_us (accessed on 28 February 2023).
- U.S. Energy Information Administration (EIA). Wind Explained: Types of Wind Turbines. 2022. Available online: https://www.eia.gov/energyexplained/wind (accessed on 29 January 2023).
- Electrek; Lewis, M. World’s Most Powerful Wind Turbine’s Blades Arrive for Installation. 2022. Available online: https://electrek.co/2022/12/22 (accessed on 29 January 2023).
- LUVSIDE. What Is Vertical Axis Wind Turbine and How Does It Work? 2020. Available online: https://www.luvside.de/en (accessed on 29 January 2023).
- Office of Energy Efficiency & Renewable Energy. Energy.gov. WindExchange. 2023. Available online: https://windexchange.energy.gov (accessed on 29 January 2023).
- Total Energies Fondation. Planete Energies. The Two Types of Solar Energy. 2022. Available online: https://www.planete-energies.com/en/medias/close/two-types-solar-energy (accessed on 11 October 2022).
- Solar Power by Country. 2022. Available online: https://worldpopulationreview.com/country-rankings/solar-power-by-country (accessed on 11 October 2022).
- Seattle, P.I. Does the Location of the Sun Affect the Amount of Energy Solar Panels Collect? 2022. Available online: https://education.seattlepi.com (accessed on 14 September 2022).
- MSU Texas BS Mechanical Engineering Program Senior Design Project. Portable Solar Tracker, Matt Capps, Clide Cadette, Leron Marrast, Laura Wittle. Faculty Advisor Dr. Salim Azzouz. 2010.
- MSU Texas BS Mechanical Engineering Program Senior Design Project. Dalquest Water System. Aaron Smith, Nick Moore, Tony Burson, Karu Anto, and Philip Ray. Faculty Advisor Dr. Idir Azouz, 2010.
- Zhu, H.; Blackborow, P. ENERGETIQ. A HAMAMATSU Company. Technical Note: Understanding Radiance (Brightness), Irradiance, and Radiant Flux. 2022. Available online: https://www.energetiq.com/technote-understanding-radiance-brightness-irradiance-radiant-flux (accessed on 30 September 2022).
- Solar Dynamics Observatory. NASA. Solar Irradiance. 2022. Available online: https://www.nasa.gov/mission_pages/sdo/science/Solar%20Irradiance.html (accessed on 30 September 2022).
- Murse, T.; ThoughtCo. A Brief History of White House Solar Panels. 2021. Available online: https://www.thoughtco.com/history-of-white-house-solar-panels-3322255 (accessed on 30 September 2022).
- Yang, F.; Xu, M.; Bao, S.-J.; Wei, H.; Chai, H. Self-assembled hierarchical graphene/polyaniline hybrid aerogels for electrochemical capacitive energy storage. Electrochim. Acta 2014, 137, 381–387. [Google Scholar] [CrossRef]
- Energy. Manufacturing.NET. Nanotech Shows Off ‘Bullet-Proof’ Graphene Battery. Energy Manufacturing. 2022. Available online: https://www.manufacturing.net/energy/news/22552437 (accessed on 10 November 2022).
- SolarPACES. How CSP Works: Tower, Trough, Fresnel or Dish. 2018. Available online: https://www.solarpaces.org/how-csp-works (accessed on 8 September 2022).
- IRENA Working Paper. Renewable Energy Technologies: Cost Analysis Series. Conc. Solar Power 2012, 1, 1–48. [Google Scholar]
- Solar Energy Perspectives. International Energy Agency. 2011. Available online: https://www.iea.org/reports/solar-energy-perspectives (accessed on 7 September 2022).
- Bhadla Solar Park, Rajasthan. NS Energy. 2015. Available online: https://www.nsenergybusiness.com/projects/bhadla-solar-park-rajasthan (accessed on 25 October 2022).
- Topaz Solar Farm. Wikipedia, the Free Encyclopedia. 2022. Available online: https://en.wikipedia.org/wiki/Topaz_Solar_Farm (accessed on 29 January 2023).
- Power Technology. Alta Wind Energy Center (AWEC), California. 2014. Available online: https://www.power-technology.com/projects/alta-wind-energy-center-awec-california (accessed on 25 October 2022).
- NDC Partnership. 1000 MW Quaid-e-Azam Solar Park in Pakistan. 2022. Available online: https://ndcpartnership.org/case-study/1000-mw-quaid-e-azam-solar-park-pakistan (accessed on 25 October 2022).
- Betz’s Law. Wikipedia, the Free Encyclopedia. 2022. Available online: https://en.wikipedia.org/wiki/Betz%27s_law (accessed on 29 January 2023).
- United States Environmental Protection Agency (EPA). Renewable Energy Fact Sheet: Wind Turbines; United States Environmental Protection Agency (EPA): Washington, DC, USA, 2013; pp. 1–5.
- Energy Sage. Smarter Energy Decision. Wind Energy Pros and Cons. 2022. Available online: https://www.energysage.com/about-clean-energy/wind (accessed on 29 January 2023).
- INSIDEEVs; Kane, M. PG&E Commissions Its Moss Landing Elkhorn Battery: 256 Tesla Megapacks. 2022. Available online: https://insideevs.com/news/590551/pge-moss-landing-elkhorn-battery (accessed on 29 January 2023).
- Wright, A.; Fingersh, L.; National Renewable Energy Laboratory. Advanced Control Design for Wind Turbines. Part I: Control Design, Implementation, and Initial Tests; National Renewable Energy Lab. (NREL): Golden, CO, USA, 2008; pp. 1–148. [Google Scholar]
- MSU Texas BS Mechanical Engineering Program Senior Design Project. Gear Based Quasi Continuous Variable Transmission. Krista Duke, Dania Wilson, Kyle Ressel, Martin Soto, Justus Nwoke. Faculty Advisor Dr. Salim Azzouz. 2014.
- MSU Texas BS Mechanical Engineering Program Senior Design Project. Rotational Speed/Displacement Motion Conversion Machine. Shawn Blackette, Yusuke Nakanishi, and Jason Meisel. Faculty Advisor Dr. Salim Azzouz. 2008.
- MSU Texas BS Mechanical Engineering Program Senior Design Project. Variable Inertia Motion Control Flywheel/Shaft System. Donley Antoine, Brittney Franklin, Rayon Austrie. Faculty Advisor Dr. Salim Azzouz. 2009.
- MSU Texas BS Mechanical Engineering Program Senior Design Project. Active Gearing System for Wind Turbines. Anh Dao, Daniel McMullan, and Daniel Brooking. Faculty Advisor Dr. Salim Azzouz. 2011.
- Sun Cable. Australia-Asia PowerLink. Sun Cable’s Vision Is to See the Indo-Pacific Region Powered by Renewable Energy Harnessing High-Quality Solar Resources. 2022. Available online: https://suncable.energy/australia-asia-power-link (accessed on 25 October 2022).
- Tangarie Alternative Power LLC Report 2011; 12399 Hamp Naylor Drive: Vernon, TX, USA, 2011.
- IEA. Wind Electricity. Tracking Report. 2022. Available online: https://www.iea.org/reports/wind-electricity (accessed on 29 January 2023).
- Office of Energy Efficiency and Renewable Energy. Next-Generation Wind Technology. 2022. Available online: https://www.energy.gov/eere/wind/next-generation-wind-technology (accessed on 29 January 2023).
- Bardakjian, A.; Mandadakis, P.; Tingle, A. Efficiency comparison of horizontal axis wind turbines and bladeless turbines. PAM Rev. Energy Sci. Technol. 2017, 4, 59–75. [Google Scholar] [CrossRef] [Green Version]
- The Renewable Energy Hub UK. How a Wind Turbine Works. 2022. Available online: https://renewableenergyhub.co.uk/main/wind-turbines (accessed on 29 January 2023).
- Darrieus Wind Turbine. Wikipedia, the Free Encyclopedia. 2022. Available online: https://en.wikipedia.org/wiki/Darrieus_wind_turbine (accessed on 29 January 2023).
- Infineon. Electric Power Transmission, Distribution and Storage. 2022. Available online: https://www.infineon.com/cms/en/about-infineon/energy-efficiency-technologies (accessed on 24 November 2022).
- Energy Storage. Solar-Estimate.org. Vanadium Flow Batteries Could Leapfrog over Pumped Hydro for Long Duration Energy Storage. 2022. Available online: https://cleantechnica.com/2022/11/25 (accessed on 24 November 2022).
- Bellini, E. PV Magazine. Lithium-Vanadium Battery for Renewables Storage. 2022. Available online: https://www.pv-magazine.com/2022/11/23 (accessed on 24 November 2022).
- Lango, L.; INVESTORPLACE. The Forever Battery That Promises to Change the EV Industry. 2022. Available online: https://investorplace.com/hypergrowthinvesting/2022/11 (accessed on 24 November 2022).
- Thomson, E.; MIT News. Donald Sadoway Wins European Inventor Award for Liquid Metal Batteries. 2022. Available online: https://news.mit.edu/2022 (accessed on 29 January 2023).
- Bradwell, D.; Kim, H.; Sirk, A.; Sadoway, D. Magnesium–Antimony Liquid Metal Battery for Stationary Energy Storage. J. Am. Chem. Soc. 2012, 134, 1895–1897. [Google Scholar] [CrossRef] [PubMed]
- Office of Energy Efficiency & Renewable Energy. Hydrogen: A Clean, Flexible Energy Carrier. 2017. Available online: https://www.energy.gov/eere/articles/hydrogen-clean-flexible-energy-carrier (accessed on 7 September 2022).
- Office of Energy Efficiency & Renewable Energy. Hydrogen Production: Microbial Biomass Conversion. 2022. Available online: https://www.energy.gov/eere/fuelcells/hydrogen-production-microbial-biomass-conversion (accessed on 9 September 2022).
- Lindorfer, J.; Rosenfeld, D.C.; Böhm, H. Fuel Cells: Energy Conversion Technology. Future Energy 2020, 495–517. [Google Scholar] [CrossRef]
- Office of Energy Efficiency & Renewable Energy. Hydrogen Storage Challenges. 2022. Available online: https://www.energy.gov/eere/fuelcells (accessed on 9 September 2022).
- U.S. Energy Information Administration (EIA). Hydrogen. 2022. Available online: https://www.eia.gov/energyexplained/hydrogen (accessed on 9 September 2022).
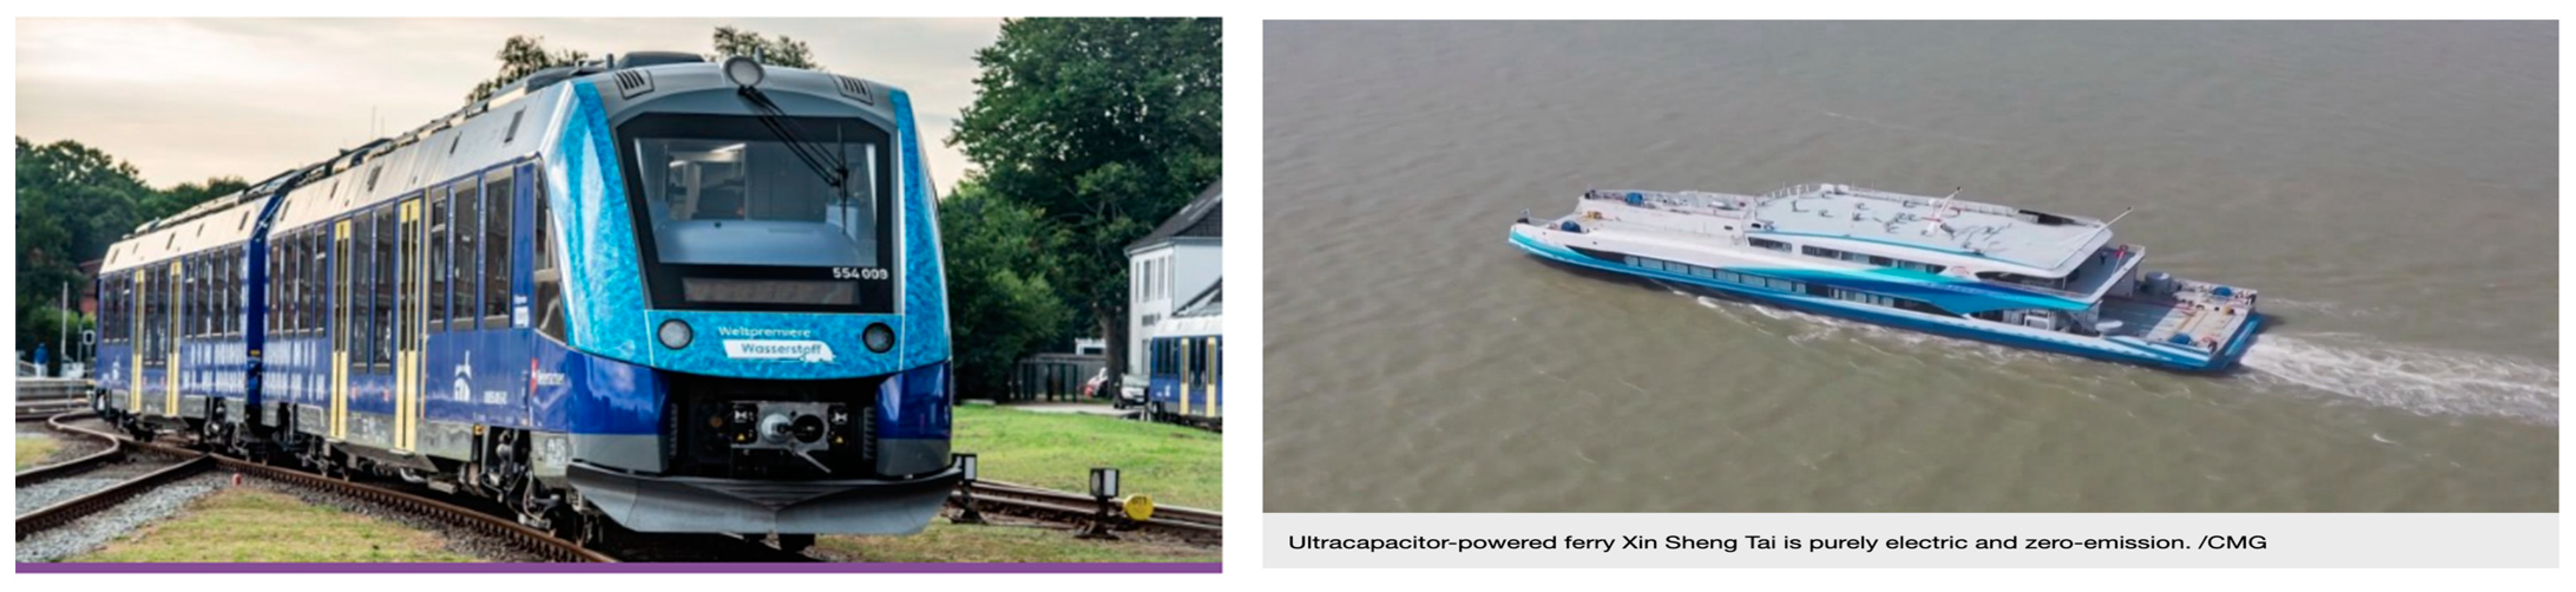
- Randall, C. Battery & Fuel Cell. Electrive.com. Hydrogen Train Network Goes Live in Germany. 2022. Available online: https://www.electrive.com/2022/08/25 (accessed on 9 September 2022).
- White, L.; Oleksiewicz, A. Fuel Cells. Illinois.edu. Benefits and Disadvantages. 2023. Available online: https://publish.illinois.edu/fuel-cells (accessed on 9 September 2022).
- Office of Energy Efficiency & Renewable Energy. Hydrogen and Fuel Cell Technologies. 2022. Available online: https://www.energy.gov/eere (accessed on 9 September 2022).
- Kulikovsky, A.A. Fuel cell basics. In Analytical Modeling of Fuel Cells; Elsevier: Amsterdam, The Netherlands, 2019; pp. 1–33. [Google Scholar]
- Oneindia News. Hydrogen Fuel Cell Car: How Does It Work and Compare to Electric Car. 2022. Available online: https://www.bing.com/videos (accessed on 9 September 2022).
- Anstrom, J.R. Hydrogen as a fuel in transportation. In Advances in Hydrogen Production, Storage and Distribution; Woodhead Publishing: Sawston, UK, 2014. [Google Scholar]
- China Global Television Network (CGTN). China’s Electric, Zero-Emission Ferry to Begin Service in October. 2022. Available online: https://news.cgtn.com/news/2022-09-27 (accessed on 9 September 2022).
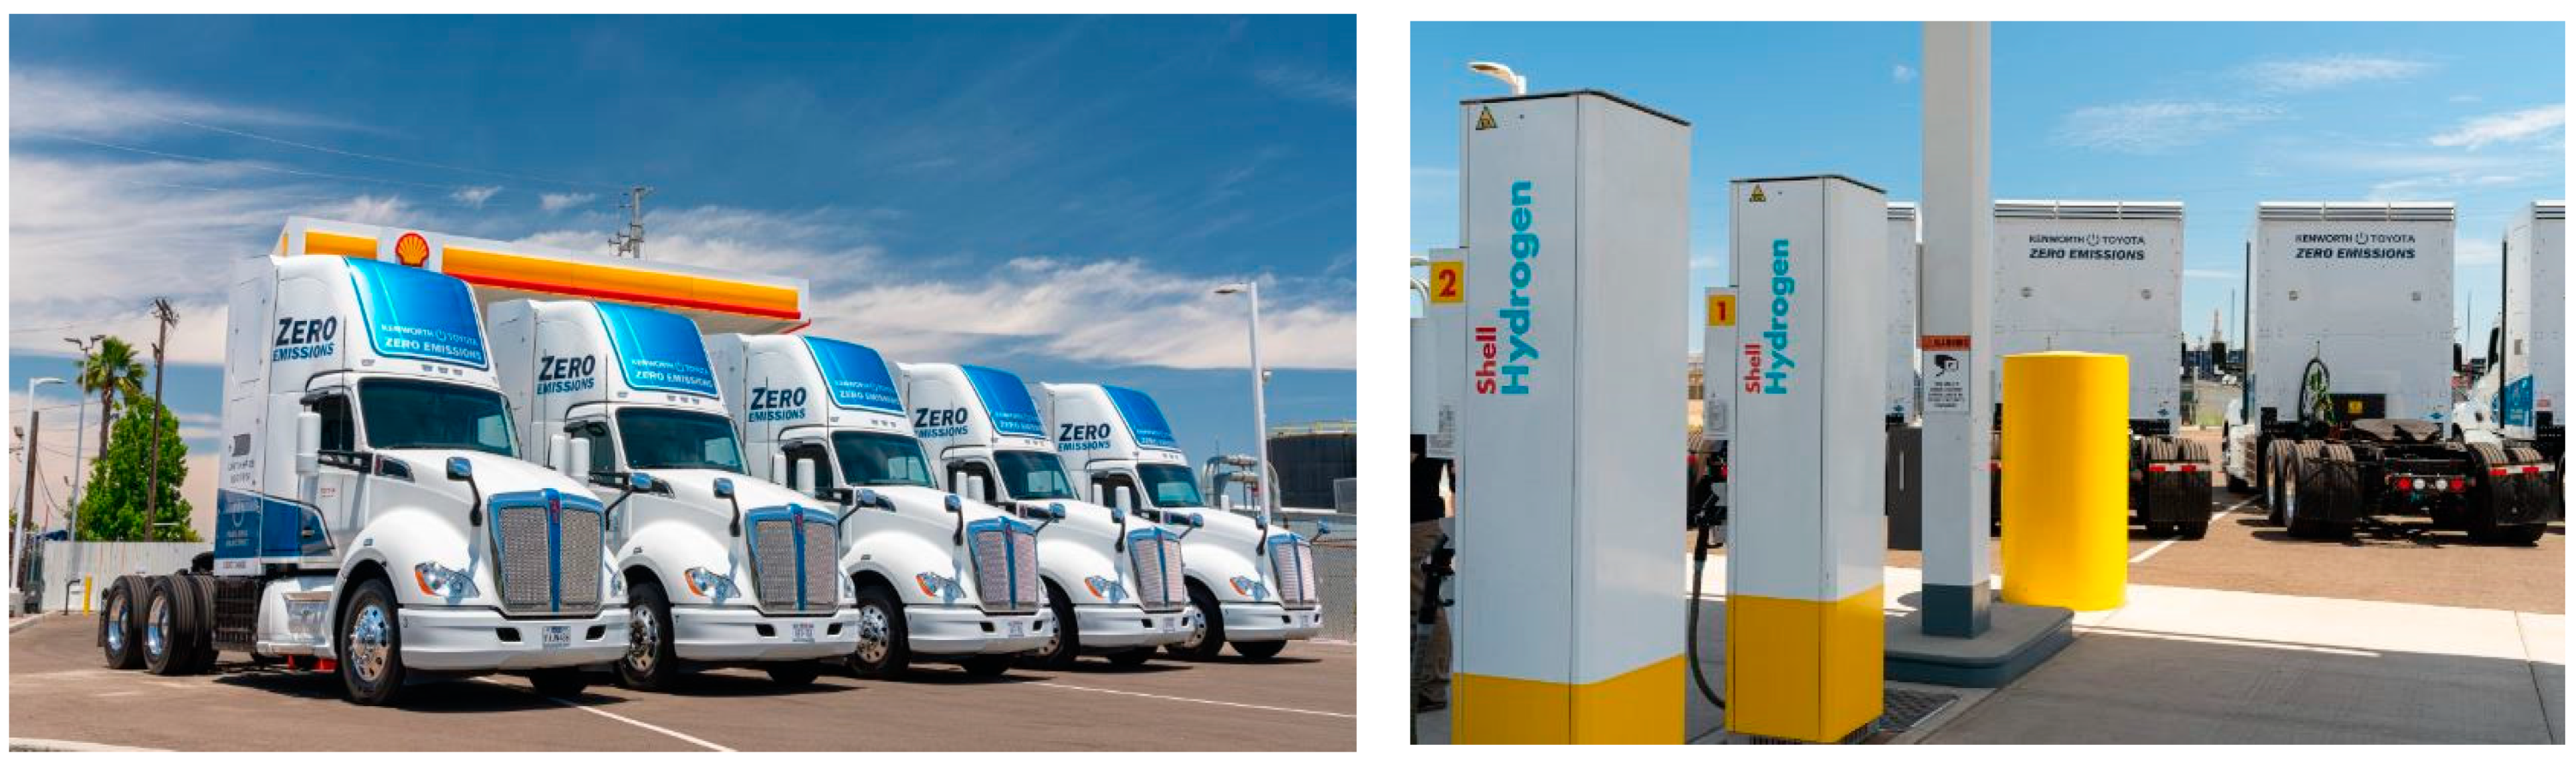
- Plungis, J. TOYOTANEWSROOM. Trucking World Endorses Toyota’s Hydrogen-Powered Fuel Cells as a Step Toward a Cleaner Planet. 2022. Available online: https://pressroom.toyota.com (accessed on 30 November 2022).
- Office of Energy Efficiency & Renewable Energy. How Do Wind Turbines Work? 2022. Available online: https://www.energy.gov/eere/wind (accessed on 29 January 2023).
- National University of Singapore. PHYS.ORG. Revolutionary Technique to Generate Hydrogen More Efficiently from Water. 2022. Available online: https://phys.org/news (accessed on 10 November 2022).
- Sequeira, C.; Pedro, M. Lead-Acid battery storage. Cienc. E Tecnol. Dos Mater. 2007, 19, 1–7. [Google Scholar]
- Ragheb, M. Energy Storage with Wind Power. 2017, pp. 1–14. Available online: https://www.electricscotland.com (accessed on 29 January 2023).
- EARTH.ORG. Top 5 Fastest-Growing Renewable Energy Sources Around the World. 2021. Available online: https://earth.org (accessed on 29 January 2023).
- Power Technology. The Geysers Geothermal Field. 2012. Available online: https://www.power-technology.com/projects (accessed on 25 October 2022).
- International Hydropower Association. Technology Case Study: Sihwa Lake Tidal Power Station. 2016. Available online: https://www.hydropower.org/blog (accessed on 25 October 2022).
- Tidal Power Will Beat Wind and Solar Energy in No Time. 2022. Available online: https://www.youtube.com/watch?v=MFm-dvC8hvw (accessed on 21 November 2022).
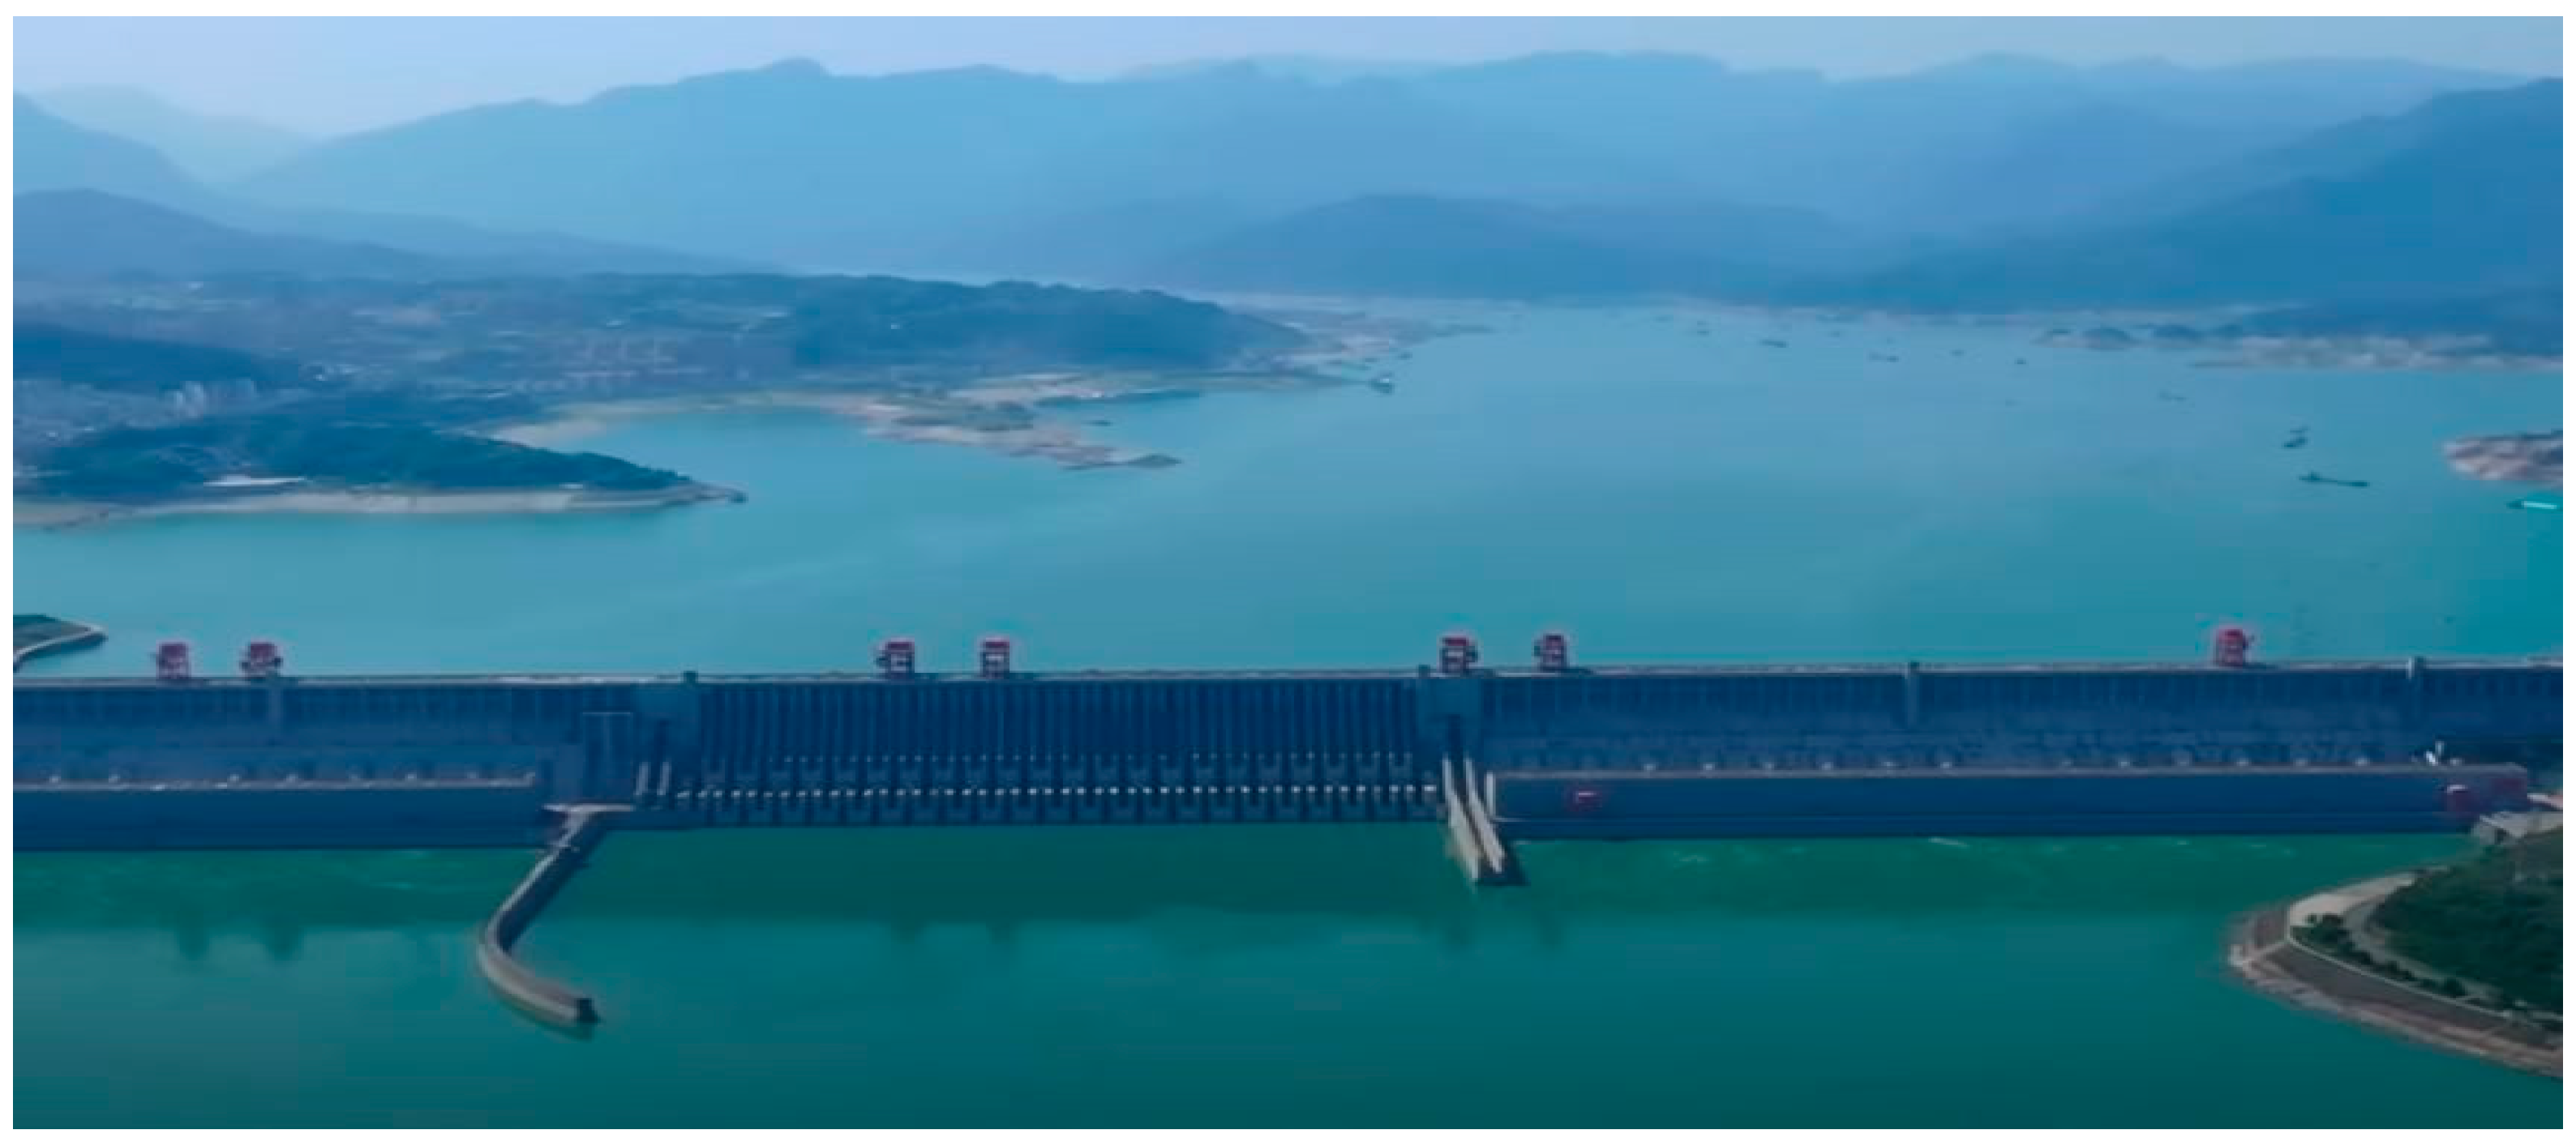
- Petruzzello, M. Britannica. Three Gorges Dam. 2022. Available online: https://www.britannica.com/topic/Three-Gorges-Dam (accessed on 25 October 2022).
- Matalucci, S. PV Magazine. The Hydrogen Stream: Egypt to Host 3.6 GW of Electrolyzers at Suez Canal. 2022. Available online: https://www.pv-magazine.com/2022/11/22 (accessed on 24 November 2022).
- YouTube.com Global Updat. This Spine Like Floating Device can Convert Wave Power into Electricity. 2022. Available online: https://www.youtube.com/watch?v=WytbO1OI_aM (accessed on 24 November 2022).
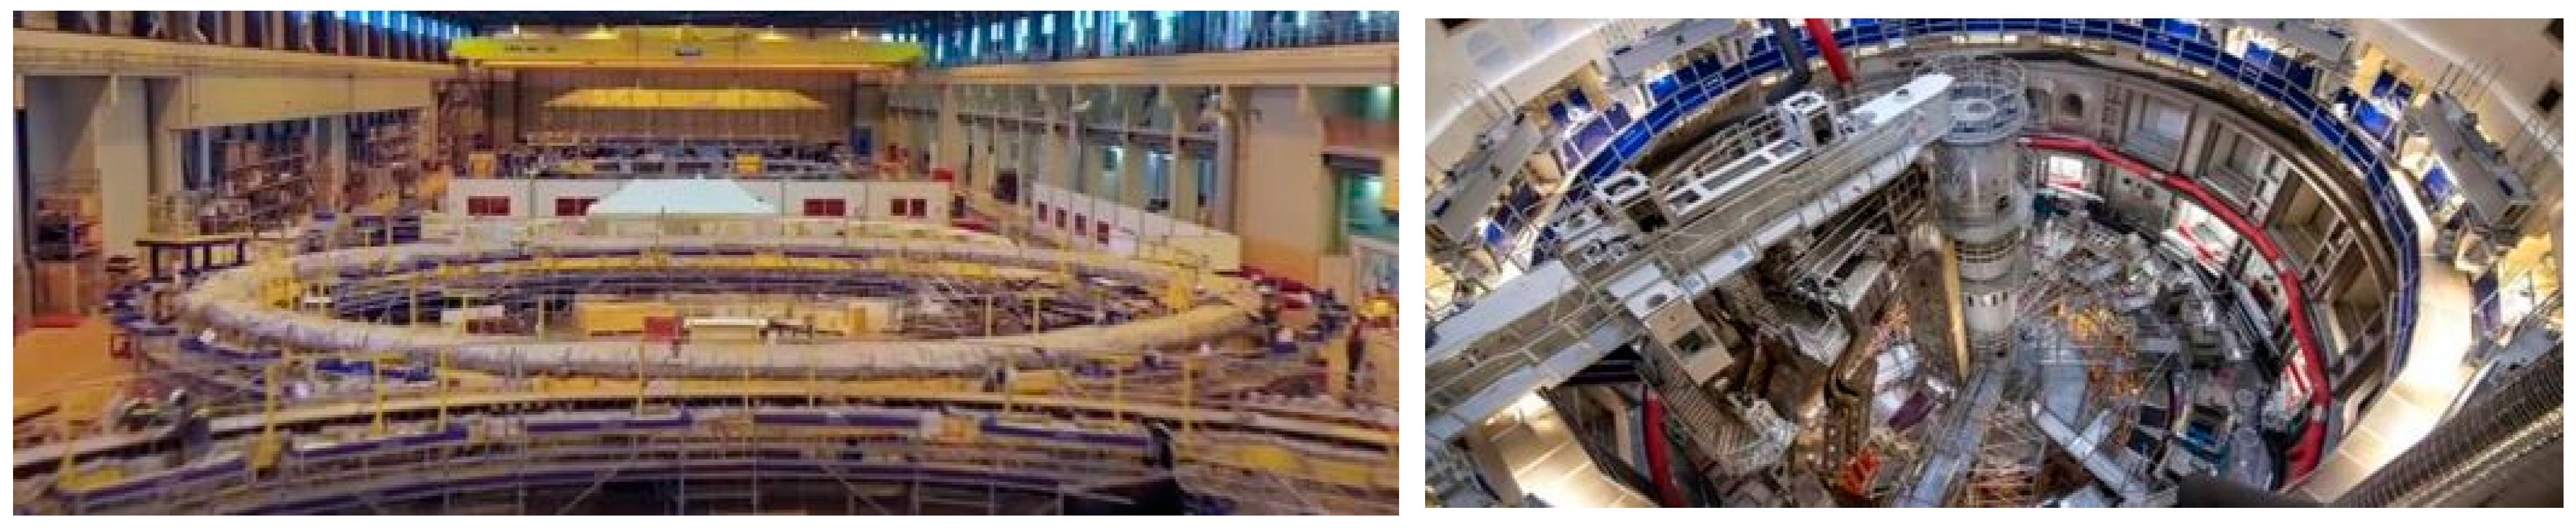
- ITER Fusion World. 2023. Available online: https://www.iter.org (accessed on 24 February 2023).
- Chinese State Media. Fusion Energy is One Step Closer Thanks to Developments in China. 2022. Available online: https://interestingengineering.com/science/china-and-iter-fusion-reactor (accessed on 24 November 2022).
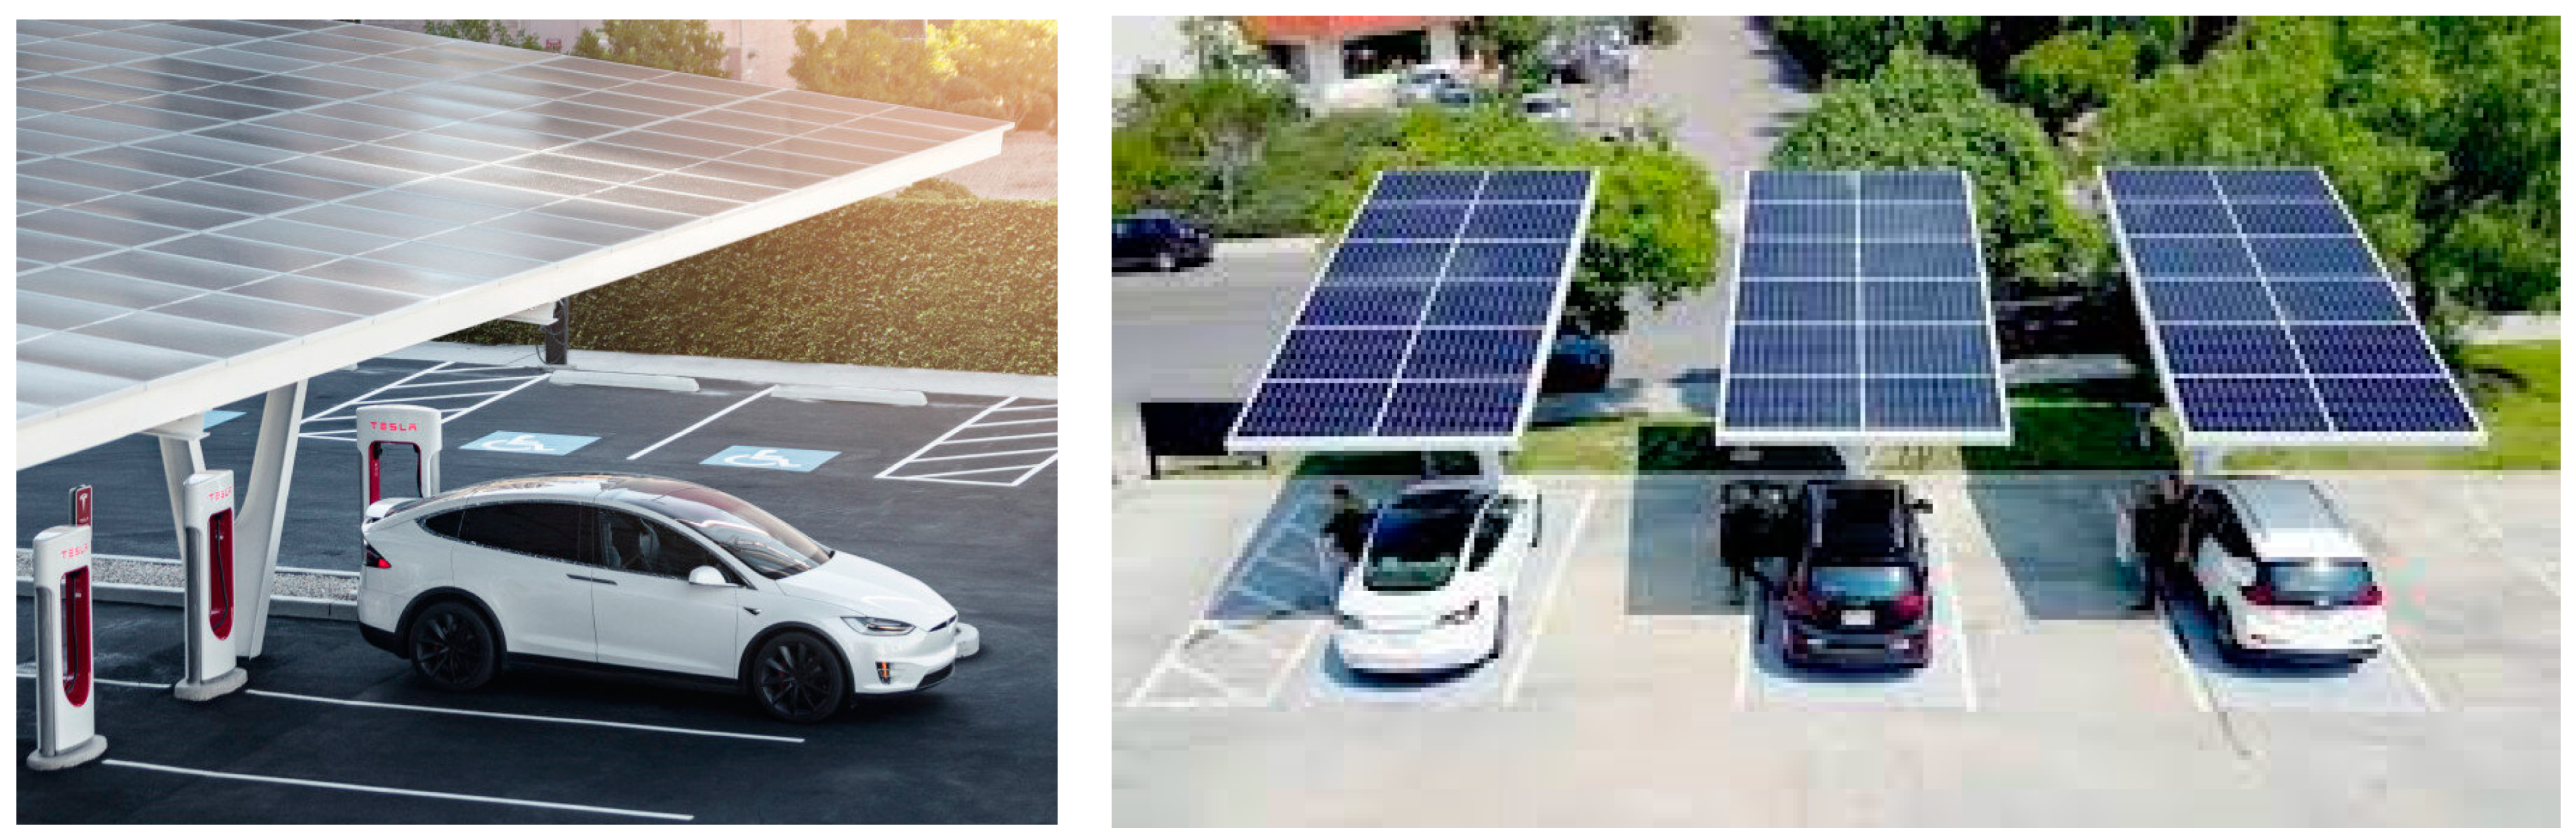
- Shahan, Z. CleanTechnica. CARS. Solar-Powered EV Charging for More Americans. 2021. Available online: https://cleantechnica.com/2021/07/01 (accessed on 24 November 2022).
- Johnson, P. Electrek. EV Chargers. First Off-Grid Solar-Powered EV Charger Deployed in Puerto Rico in Wake of Rising Natural Disasters. 2022. Available online: https://electrek.co/2022/11/22 (accessed on 24 November 2022).
- MSU Texas BS Mechanical Engineering Program Senior Design Project. Hybrid Open and Closed Loop Wind Tunnel. Stephen Albright, Lindy Hammon, Eurydice Kanimba. Faculty Advisor Dr. Sheldon Wang. 2014.
- MSU Texas BS Mechanical Engineering Program Senior Design Project. Wind Turbine teetering Hub Damping System Design. Austin Smith, Ben Shields, Amanda Jinks, Haley Bragg. Faculty Advisor Dr. Sheldon Wang. 2015.
- MSU Texas BS Mechanical Engineering Program Senior Design Project. Solar-Powered Steam Turbine. Kayode Crump, Zachary Skelton, Vjekoslav Stipanic, Khalid Walters. Faculty Advisor Dr. Idir Azouz. 2012.
- MSU Texas BS Mechanical Engineering Program Senior Design Project. Mobile Wireless Surveillance System with Unpredictable Coherent Motion., Juwel Williams, Virgil Henry, Mamgoree Sock, Darrell Middlesworth. Faculty Advisor Dr. Sheldon Wang. 2019.
- MSU Texas BS Mechanical Engineering Program Senior Design Project. Active Road Rumble Energy Harvest Panels. Robert Rorabaugh, Abhishek Chatterjee, and Chris Venegas. Faculty Advisor Dr. Salim Azzouz. 2013.
- MSU Texas BS Mechanical Engineering Program Senior Design Project. Solar-Powered Stirling Engine. Rip Martin, Raul Hazel, and Dane Vincent. Faculty Advisor Dr. Salim Azzouz. 2013.
- MSU Texas BS Mechanical Engineering Program Senior Design Project. Protective Solar Panel. Chukwudalu Mokah, Matt Mourning, Alex Petree, and Eguro Makeri. Faculty Advisor Dr. Sheldon Wang. 2014.


| Parabolic Trough | Solar Tower | |
|---|---|---|
| Typical Capacity (MW) | 10–300 | 10–200 |
| Tech Development Risk | Low | Medium |
| Operating Temp (℃) | 350–550 | 250–565 |
| Plant Peak Efficiency (%) | 14–20 | 23—35 |
| Annual Net Efficiency (%) | 11–16 | 7–22 |
| Storage System | Indirect or Direct | Direct |
| Grid Stability | Medium to High | High |
| Storage with Molten Salt | 380 °C or 550 °C | 550 °C |
Disclaimer/Publisher’s Note: The statements, opinions and data contained in all publications are solely those of the individual author(s) and contributor(s) and not of MDPI and/or the editor(s). MDPI and/or the editor(s) disclaim responsibility for any injury to people or property resulting from any ideas, methods, instructions or products referred to in the content. |
© 2023 by the authors. Licensee MDPI, Basel, Switzerland. This article is an open access article distributed under the terms and conditions of the Creative Commons Attribution (CC BY) license (https://creativecommons.org/licenses/by/4.0/).
Share and Cite
Wang, S.; Tonge, E.; Sekanyo, I.; Portmann, E.; Azzouz, S.M. On the State-of-the-Art of Solar, Wind, and Other Green Energy Resources and Their Respective Storage Systems. Eng 2023, 4, 857-883. https://doi.org/10.3390/eng4010052
Wang S, Tonge E, Sekanyo I, Portmann E, Azzouz SM. On the State-of-the-Art of Solar, Wind, and Other Green Energy Resources and Their Respective Storage Systems. Eng. 2023; 4(1):857-883. https://doi.org/10.3390/eng4010052
Chicago/Turabian StyleWang, Sheldon, Ernuel Tonge, Isaac Sekanyo, Elijah Portmann, and Salim M. Azzouz. 2023. "On the State-of-the-Art of Solar, Wind, and Other Green Energy Resources and Their Respective Storage Systems" Eng 4, no. 1: 857-883. https://doi.org/10.3390/eng4010052