Article

Further Development of Gasoline from the bioliq® Process with Focus on Particulate and Hydrocarbon Emissions

1
Institute of Internal Combustion Engines (IFKM), Karlsruhe Institute of Technology (KIT), Rintheimer Querallee 2, 76131 Karlsruhe, Germany
2
Institute of Catalysis Research and Technology (IKFT), Karlsruhe Institute of Technology (KIT), Hermann-von Helmholtz-Platz 1, 76344 Eggenstein-Leopoldshafen, Germany
*
Author to whom correspondence should be addressed.
Fuels 2023, 4(2), 205-220; https://doi.org/10.3390/fuels4020013
Submission received: 2 December 2022 / Revised: 10 February 2023 / Accepted: 25 April 2023 / Published: 15 May 2023
(This article belongs to the Special Issue Advances in Synthetic Fuel)

Abstract

:
The production of CO2-neutral fuels is a key technology to achieve the European Union’s targets of greenhouse gas reduction in the transport sector. For a straightforward application such as drop-in fuel, regenerative gasoline must meet emission requirements without causing significant changes in engine parameters. The objective of this work was to demonstrate the emission reduction potential of fuel from the bioliq® plant by reducing the content of heavy aromatics in the product refinement. For three blends with varying contents of bioliq® fuel, the spray behavior was studied in a pressurized chamber and the particulate and hydrocarbon emissions were investigated using a single-cylinder research engine. With increasing bioliq® fuel content, atomization was degraded by lower flash boiling at low pressure. This effect vanished at higher chamber pressures. Measurements of particulate and hydrocarbon emissions showed significant improvements of 50% to 100% and 10%, respectively, compared to previously investigated bioliq® fuel fractions from 2017. The formation of particulate emissions is virtually unaffected by the blending of bioliq® fuel, due to the absence of heavy aromatics in the refined bioliq® product. Hydrocarbon emissions increased by 20% with higher bioliq® fuel content and late injection timings due to inferior mixture formation as a result of slightly reduced atomization. However, near the optimum injection timing, the hydrocarbon emissions are independent of the bioliq® fuel admixture.

1. Introduction

To achieve the legislative targets of greenhouse gas emission reduction in the transport sector, aligned with the SDGs and the UN’s Net Zero 2050 Target [1], the production and application of sustainable fuels from renewable feedstocks is crucial. Generally, many pathways for the production of carbon dioxide-neutral fuels are known, for example, via the biomass-to-liquids (BtL) process route [2]. According to the EU Renewable Energy Directive II (RED II), advanced biofuels of the second and third generation are characterized by production from nonfood cellulosic material [3]. The bioliq® process, which is operated in a pilot-scale plant at the Karlsruhe Institute of Technology (KIT), realizes the conversion of biomass to hydrocarbons in the boiling range of gasoline. Starting from biomass residues such as straw, synthesis gas (carbon monoxide and hydrogen) is produced via pyrolysis with subsequent gasification and dimethyl ether (DME) synthesis [4,5,6]. In the final step, the conversion of DME to gasoline (DtG) generates fuel in a sustainable manner.
The DtG conversion typically produces high proportions of aromatics [7]. Aromatics contribute to a high density and a high octane number of a fuel, which is advantageous to accomplish the requirements of the gasoline standard EN228 [8]. However, aromatics are known precursors of particle formation by agglomeration during combustion [9]. Thus, the content of highly methylated aromatics, especially molecules with ten or more carbon atoms, should be as low as possible, to avoid their tremendous impact on particle formation.
In [10], the performance of bioliq® fuel blended with commercial RON95 E5 gasoline in a ratio of 10 vol . - % bioliq® fuel and 90 vol . - % RON95 E5 in an internal combustion engine was investigated and published for the first time. It was shown that a higher amount of heavy aromatics leads to an increase in particulate and hydrocarbon emissions. However, combustion behavior was not significantly affected by the bioliq® 2017 fuel, which was obtained in a production campaign in 2017 and which is designated as bioliq®/100 2017 in the following. A beneficial effect was the higher research octane number (RON) of the bioliq® blend, which improved the knocking behavior at higher loads.
It is well known that the fuel composition [11,12] and atomization of the fuel spray have a significant effect on the combustion and exhaust gas emissions of internal combustion engines. In [13], the authors studied the spray characteristics of gasoline, bioethanol and a mixture of the two. They showed the strong influence of the kinematic viscosity and surface tension on the spray atomization. Similar investigations were made by [14]. They mixed gasoline with diesel fuel and observed a larger penetration depth of the spray due to the higher surface tension and density with increasing diesel content. Moreover, Refs. [15,16] showed the increase in particulate emissions due to higher aromatic contents of different fuels. In studies such as those mentioned above, the influence of blends of similar gasoline fuels with each other has not been observed, but oxygenated fuels have often been investigated. The advantage of the nonoxygenated bioliq® is that the blends are within the limits of the EN 228 standard, and can therefore be used as drop-in fuels.
The objective of this work is to demonstrate that modifications of the product refinement of the bioliq® raw gasoline can help to prevent the increase in particulate and hydrocarbon emissions. For this purpose, higher aromatics (>C9) were removed from the bioliq® fuel by distillation. Various blends with ratios of up to 30 vol . - % bioliq® distillate in 70 vol . - % commercial RON95 E5 gasoline were prepared, characterized and evaluated in terms of important boiling, combustion and emission properties.

2. Fuel Production and Properties

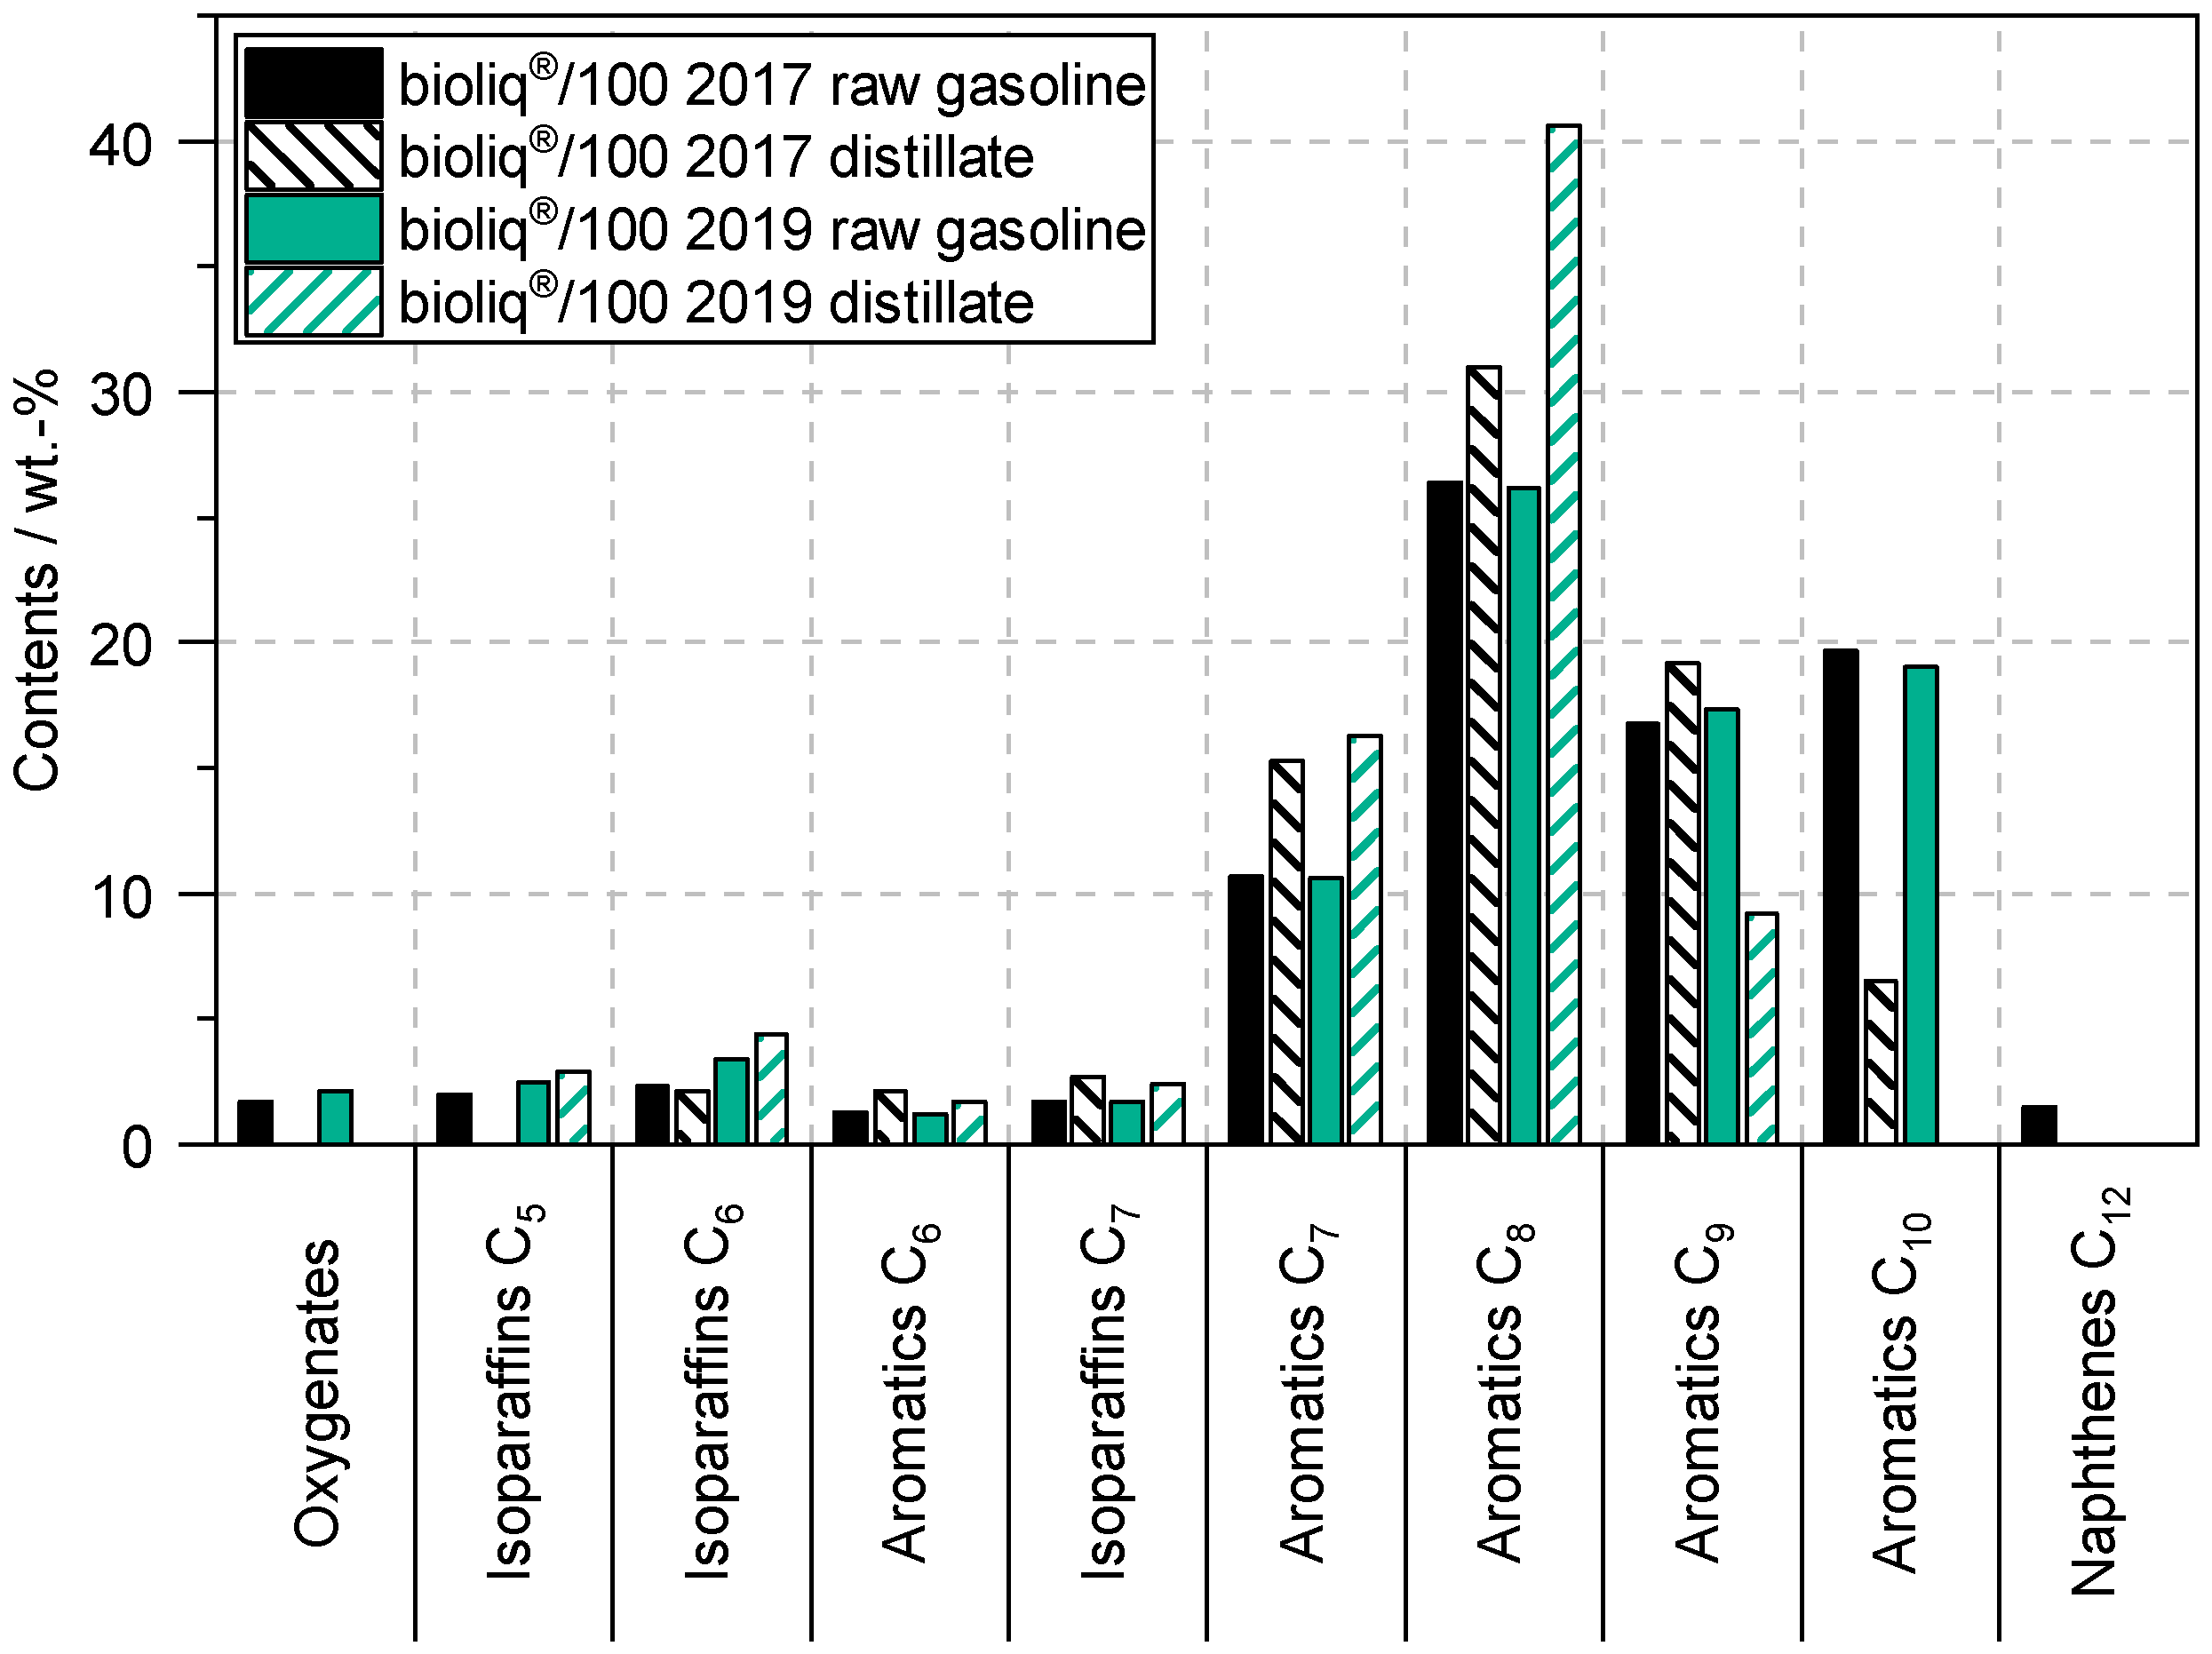
2.1. Further Development of the bioliq® Product Refinement

The design of the bioliq® plant and the concept of the process were described before [10] and have not changed since. The raw gasoline feedstock used in this work was produced in the bioliq® campaign in May 2019 and is designated as bioliq®/100 2019 in the following. Consistent with our previous work, biobased gasoline from the bioliq® plant was taken from the middle of a rectification column. The composition of the bioliq®/100 2019 gasoline was determined via gas chromatography according to the ASTM D6730-01 (2016) standard. The product spectrum of oxygenates and hydrocarbons with a mass content above 1 wt . - % is shown in Figure 1. The comparison with the data of the bioliq®/100 2017 raw gasoline reveals an almost identical composition of the bioliq®/100 2019 raw gasoline. To remove the high-boiling components, the bioliq®/100 2019 raw gasoline was distilled in a laboratory-scale setup. Our previous work has shown that heavy aromatics are one of the main causes of emission formation during fuel combustion [10]. Thus, the conditions of product refinement were adjusted. While the bioliq®/100 2017 raw gasoline was distilled up to a temperature of 210 C , the boiling cut of the bioliq®/100 2019 distillate was drawn at 160 C . Thereby, the C10 aromatics are completely removed and the C9 aromatics are significantly reduced in the head product (Figure 1).

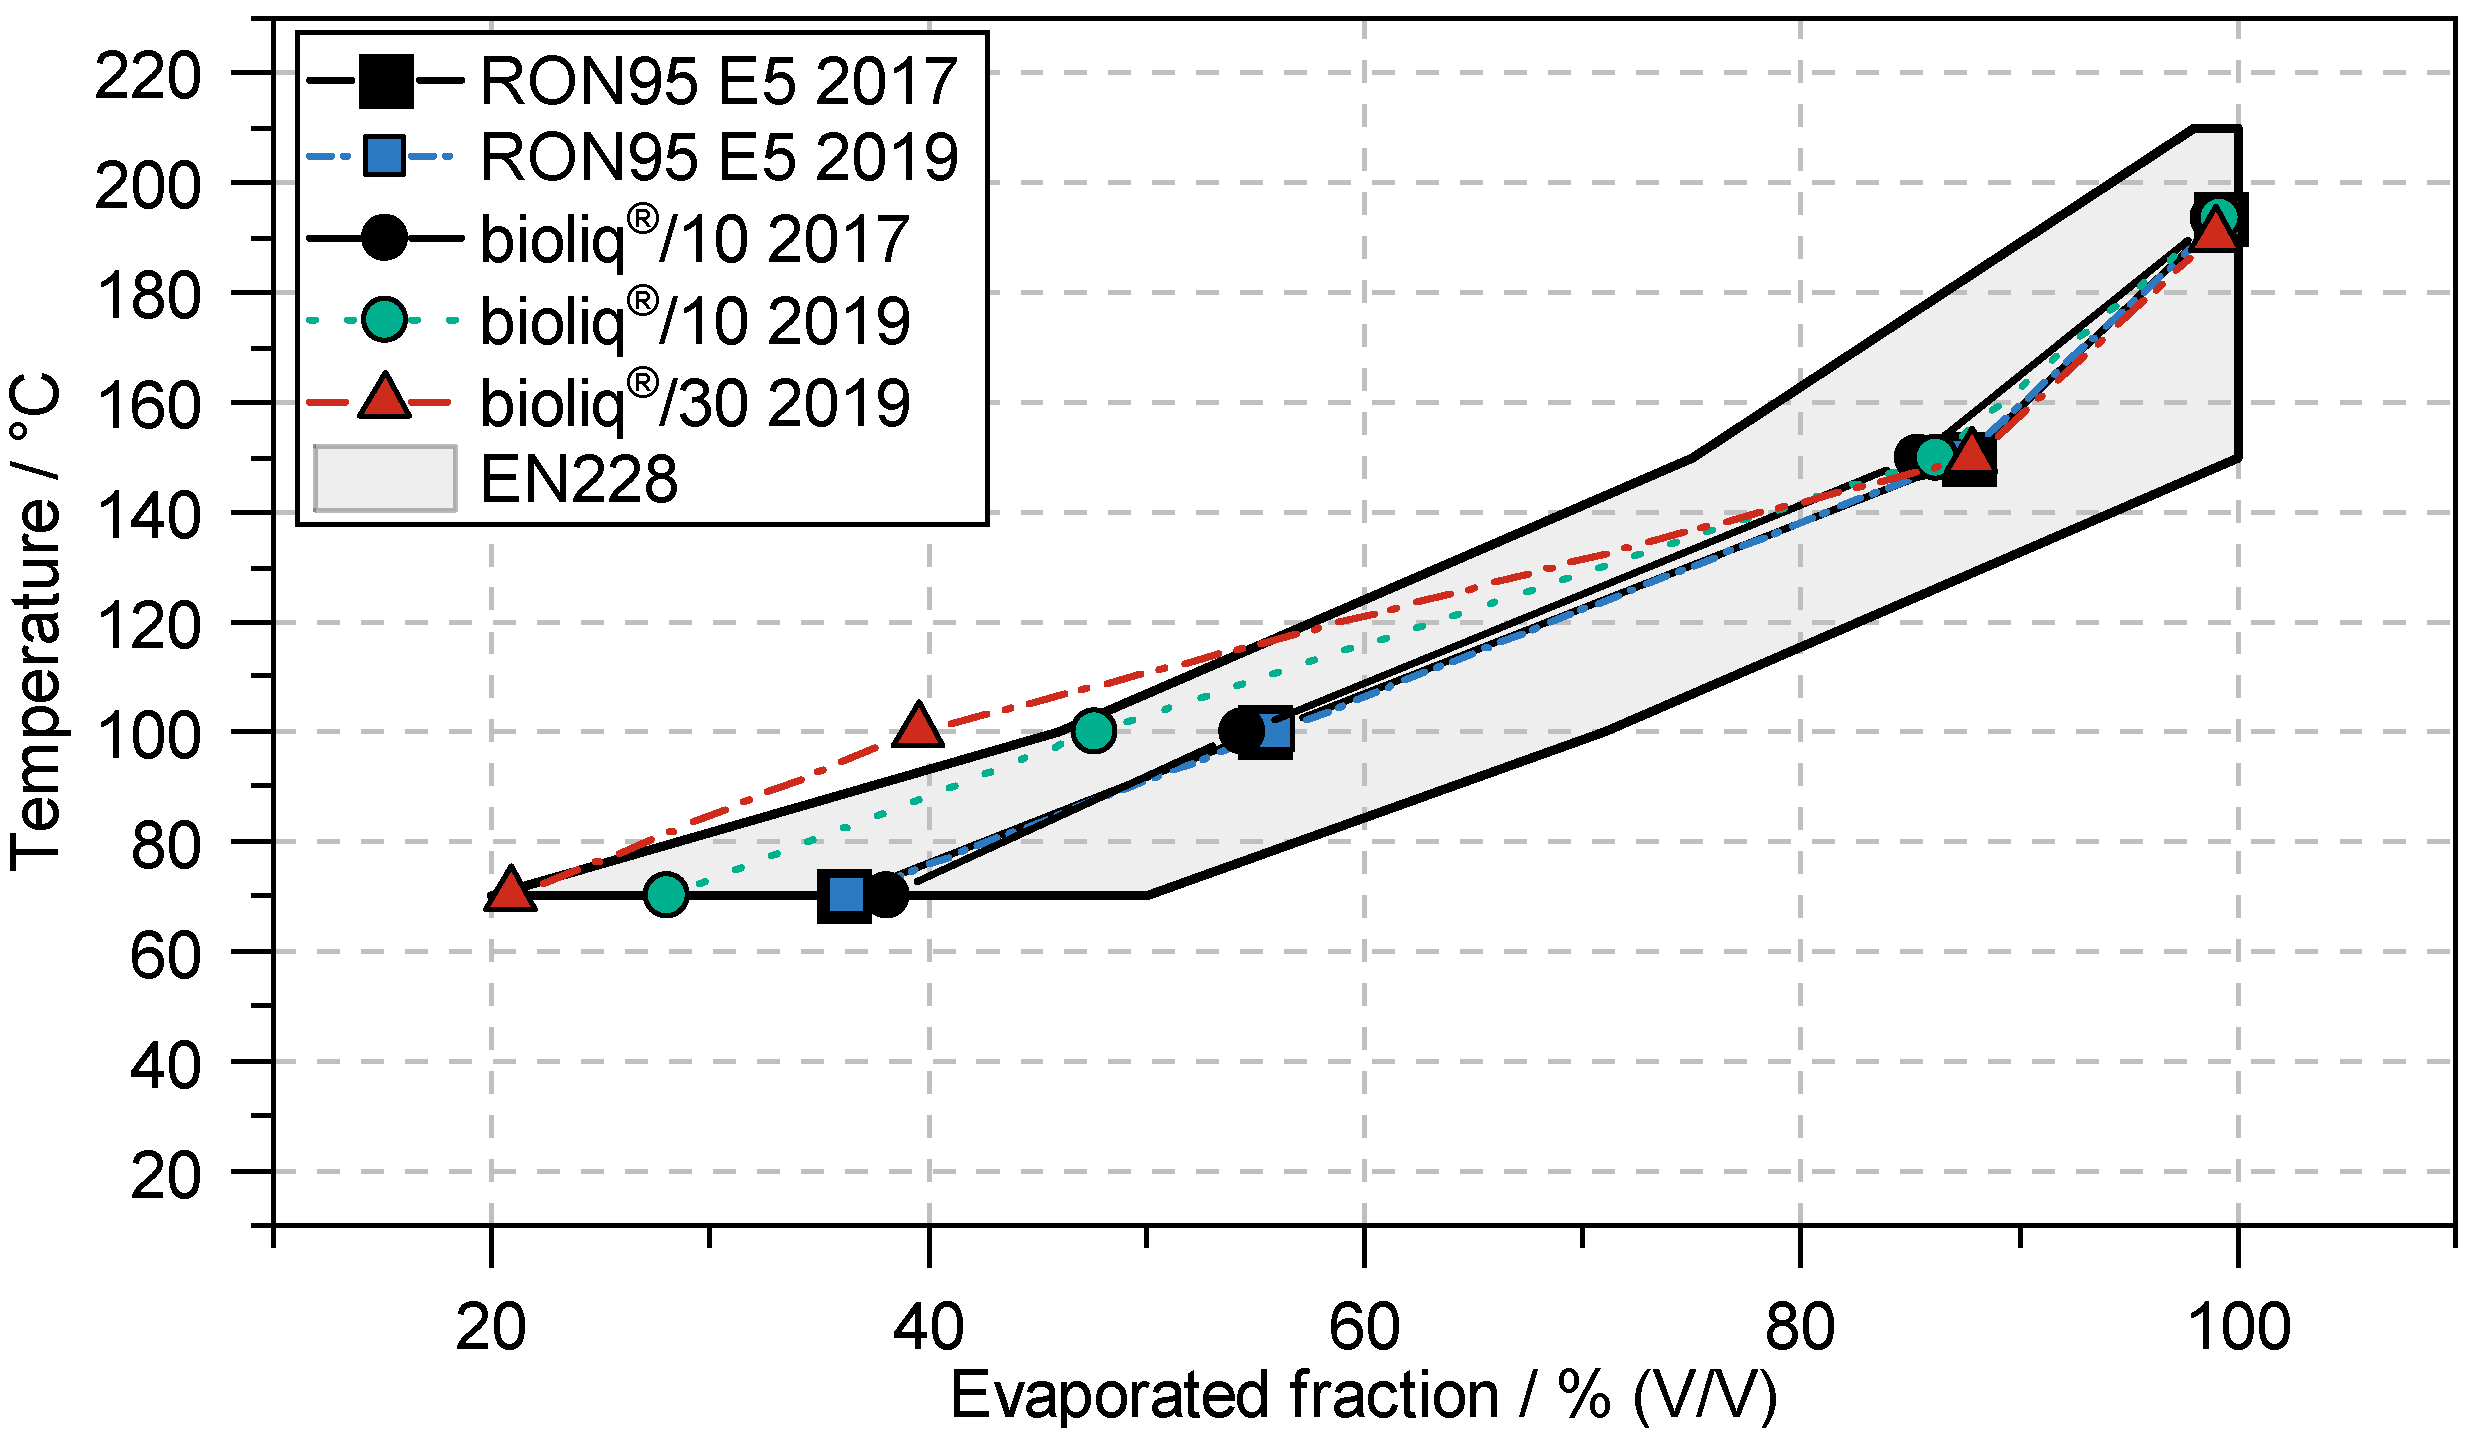
2.2. Comparison of Fuel Characteristics

The bioliq®/100 2019 distillate is completely miscible with conventional RON95 E5 gasoline, up to a proportion of 30 vol . - % . Mixtures of 10 vol . - % bioliq®/100 2019 distillate and 90 vol . - % RON95 E5; 20 vol . - % bioliq®/100 2019 distillate and 80 vol . - % RON95 E5; and 30 vol . - % bioliq®/100 2019 distillate and 70 vol . - % RON95 E5 were prepared in order to investigate their behavior regarding emission formation during combustion. In the following, the mixtures are designated as bioliq®/10 2019, bioliq®/20 2019 and bioliq®/30 2019, respectively. Relevant fuel properties of the samples bioliq®/10 2019, bioliq®/30 2019 and the unblended RON95 E5 base fuel are shown in Table 1. The data of the bioliq®/10 2019 enable direct comparison with the bioliq®/10 2017 mixture from our previous work [10], which is also listed in Table 1, together with its corresponding unblended RON95 E5 base fuel. Thus, the impact of the adjusted bioliq® product refinement can be evaluated. The bioliq®/30 2019 fuel represents the case of maximum blending content. Additionally, the requirements of the listed properties according to the EN228 standard for gasoline fuels are specified in Table 1.
As shown in Figure 1, both blends, bioliq®/100 2017 and bioliq®/100 2019, contain aromatics as major hydrocarbon fractions. Consequently, the sum of aromatics increases for all blends compared to the corresponding base fuels. With 10 vol . - % blending content, both fuels are in good accordance with the EN228 standard. In contrast, the bioliq®/30 2019 gasoline exceeds the maximum amount of aromatics with 50.4   wt . - % . Due to the higher content of aromatics, a slight increase in the octane number can be observed for all blends compared to the corresponding base fuels. This way, the requirements of the EN228 standard are exceeded. Furthermore, the density increases with the addition of the bioliq® distillate, but the values remain within the limits of the EN228 standard. For all fuels considered in Table 1, the end of the boiling curve is below the EN228 limit of 210 C , with a distillation residue clearly below 2.0   vol . - % . A remarkable difference is apparent for the vapor pressures of the blends. While bioliq®/10 2017 revealed a drastic increase in the vapor pressure compared to the base fuel, from 63.8   k Pa to 74.1   k Pa , the blends with bioliq®/100 2019 distillate each showed a slight decrease from 56.4   k Pa to 53.3   k Pa and 49.2   k Pa , respectively. Thus, the vapor pressure of bioliq®/10 2019 is reduced by about one third compared to bioliq®/10 2017, which may affect the atomization and boiling behavior of the fuels. In both bioliq® campaigns, 2017 and 2019, methanol and other oxygenates were completely removed from the raw gasoline by distillation. Consequently, the addition of the bioliq® distillate reduces the sum of oxygen in each blend. Thus, the values of the blends are within the specifications of the EN228 standard. Figure 2 depicts the distillation curves of the fuels presented in Table 1. Both blends with 10 vol . - % bioliq® gasoline are within the limits of the EN228 standard. However, up to 100 C , a significantly lower amount of bioliq®/10 2019 fuel (green circles) is evaporated compared to bioliq®/10 2017 (black circles). This effect results from the lower vapor pressure of bioliq®/10 2019. On the other hand, the distillation curve of bioliq®/30 2019 (red triangles) exceeds the maximum limit of the EN228 standard in the range of low temperatures. Generally, the bioliq®/10 2019 and bioliq®/30 2019 blends reveal a higher fraction of components boiling in the temperature range up to 150 C compared to the other samples, which exhibit an almost congruent progression of the measured curves.

3. Measurement Setup

3.1. Engine and Emission Measurement Setup

A single-cylinder gasoline research engine was used for the experiments; the specifications of that engine can be obtained from Table 2. The engine was operated under naturally aspirated conditions with direct injection (DI) in homogenous operation mode at an air–fuel ratio (AFR) of 14.7. A six-hole BOSCH HDEV5 injector was used. All tests were performed at an engine speed of 2000 min 1 and an indicated mean effective pressure (IMEP) of 0.5   M Pa and 0.8   M Pa , respectively. The coolant and oil temperature were 90 C and the air temperature in the intake manifold was 30 C .
To measure hydrocarbon emissions (HC), a flame ionization detector (FID) of an AVL AMA4000 that was calibrated with propane (C3H8) was used. The measurement uncertainty of the analyzer u H C is given in its manual, and consists of the four components of drift, linearity error, noise and reproducibility, which are summated. The following Equation (1) shows the measurement uncertainty, and in parentheses, the components in the previously mentioned order.
u H C = ( 0.5 % × m v H C + 2 × d l h ) + ( 1 % × m v H C + d l ) + ( 1 % × m v H C + 2 × d l ) + ( 0.5 × m v H C + 2 × d l )
In the equation m v H C is the measured hydrocarbon concentration in parts per million, h is the operation time of the analyzer after the latest calibration in hours and d l is the detection limit, which is 8 ppb.
The particulate concentration and size distribution were measured with a Model 3090 Engine Exhaust Particle Sizer (EEPS) from TSI. This device can measure particulates from 5.6   n m up to 560 n m in 32 size classes, with 16 size classes per decade. The measurement principle is based on charging particulates and accelerating them towards electrometers, where the particulates discharge and a current is measured [17]. Therefore, a so-called inversion matrix has to be used to convert the current into a particulate density. In these experiments, the “soot” inversion matrix is used, which is presented in [18]. The sample of the exhaust gas was diluted in two dilution stages. First, a rotation disk diluter MDE19-E from Matter Engineering with a dilution of 16.5 and a temperature of 120 C was used to dilute the sampled exhaust gas. In a second dilution, the evaporation chamber, the aerosol is heated up to 300 C and then diluted by a factor of 6.3. The total dilution is 104, the product of both dilution stages, and was considered in the results. A detailed description of the setup is given in [10].

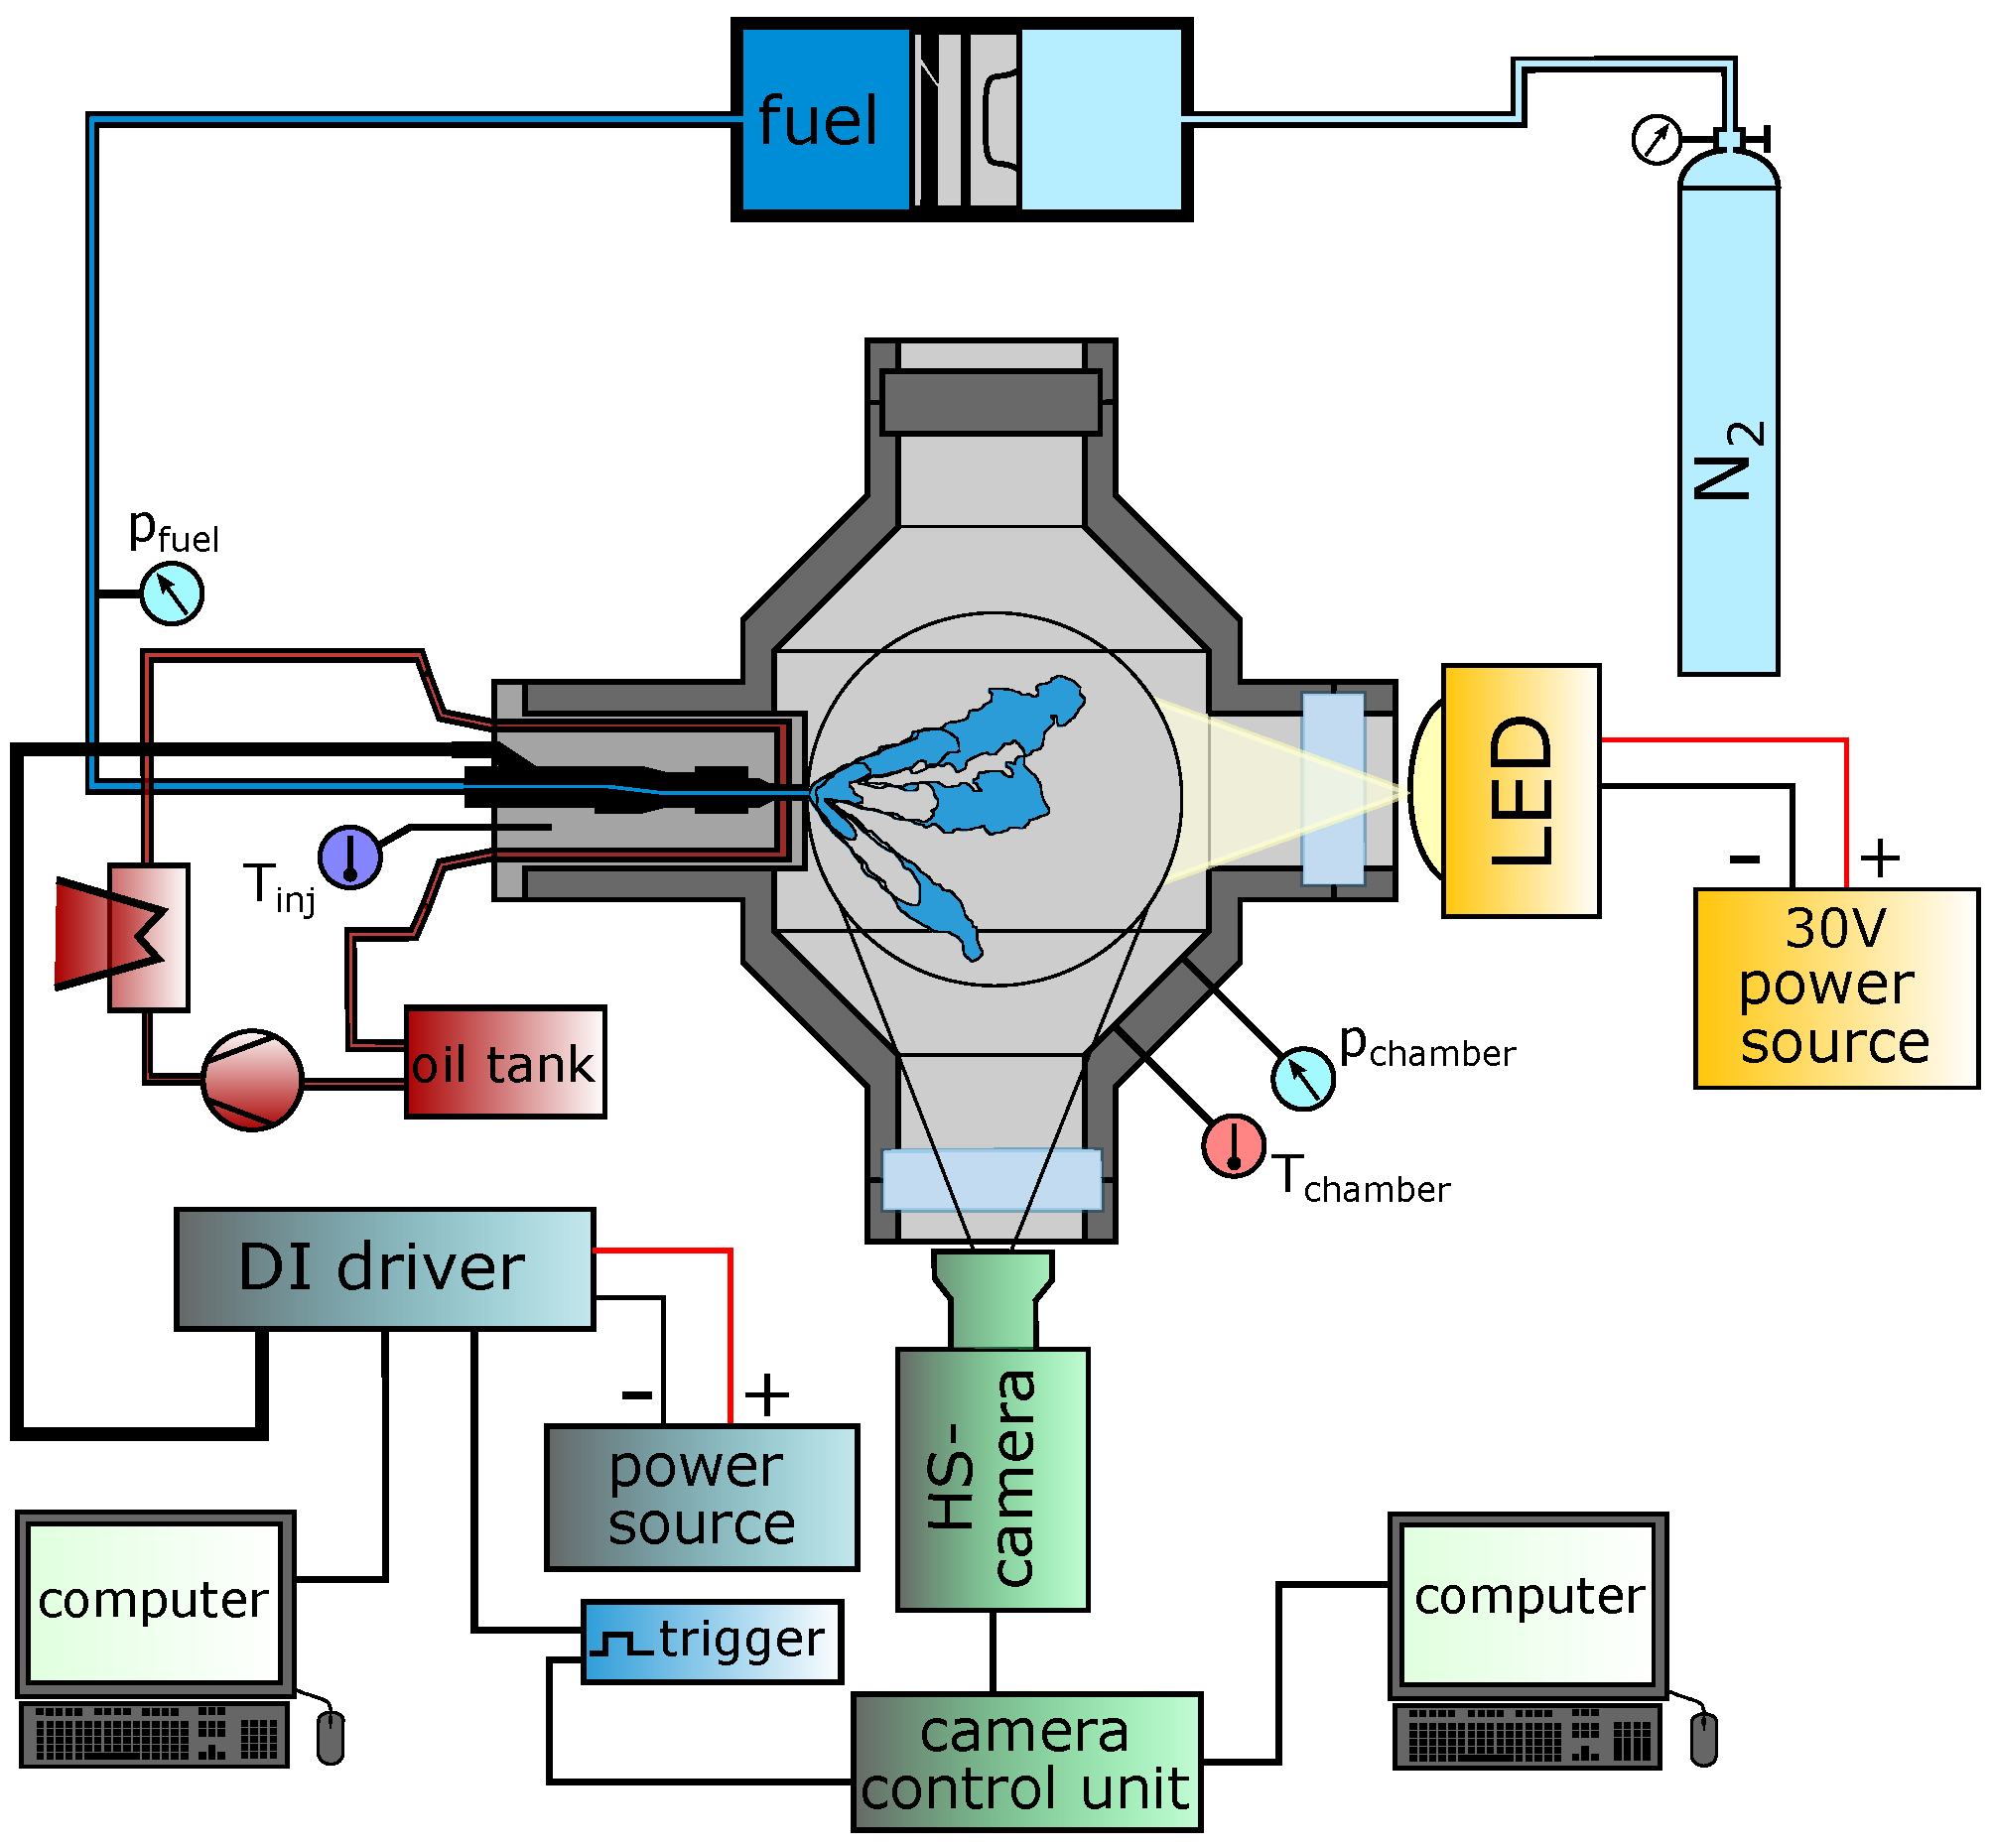
3.2. Pressure Chamber

For analyzing the spray of the 2019 bioliq® fuel blends, an experimental setup in a pressure chamber, which is shown in Figure 3, and the Mie-scattering method were used. The pressure chamber was operated with nitrogen at a pressure of 0.1   M Pa and 0.25   M Pa , respectively. The ambient temperature in the pressure chamber was 40 C , which is approximately the gas temperature at the time of the injection in the engine. To provide the fuel pressure of 20 M Pa , a piston accumulator was used, which was operated by a high-pressure nitrogen bottle. Due to the position of the injector in the cylinder head of the engine, it can be assumed that the injector has the same temperature as the cylinder head, and thus that the temperature of the coolant is 90 C . As in the engine, an HDEV5 injector from Bosch with a symmetrical six-hole nozzle was used.
An LED was used as the light source, which illuminates from the underside of the injector. A high-speed (HS) camera was placed perpendicular to the LED. The image rate used was 8 k Hz , and the resolution of the image was 0.17   m m /pixel. For the analysis, the penetration length and the projected spray area were determined using a Matlab script described by [19], and the average of five measurements was used. In addition, the shape of the spray was observed based on the time series of each injection. Due to the measurement methodology, only fuel droplets—and no gaseous phase—could be measured.
A detailed explanation of the measurement setup and the calculation method used is given in [19].

4. Results and Discussion
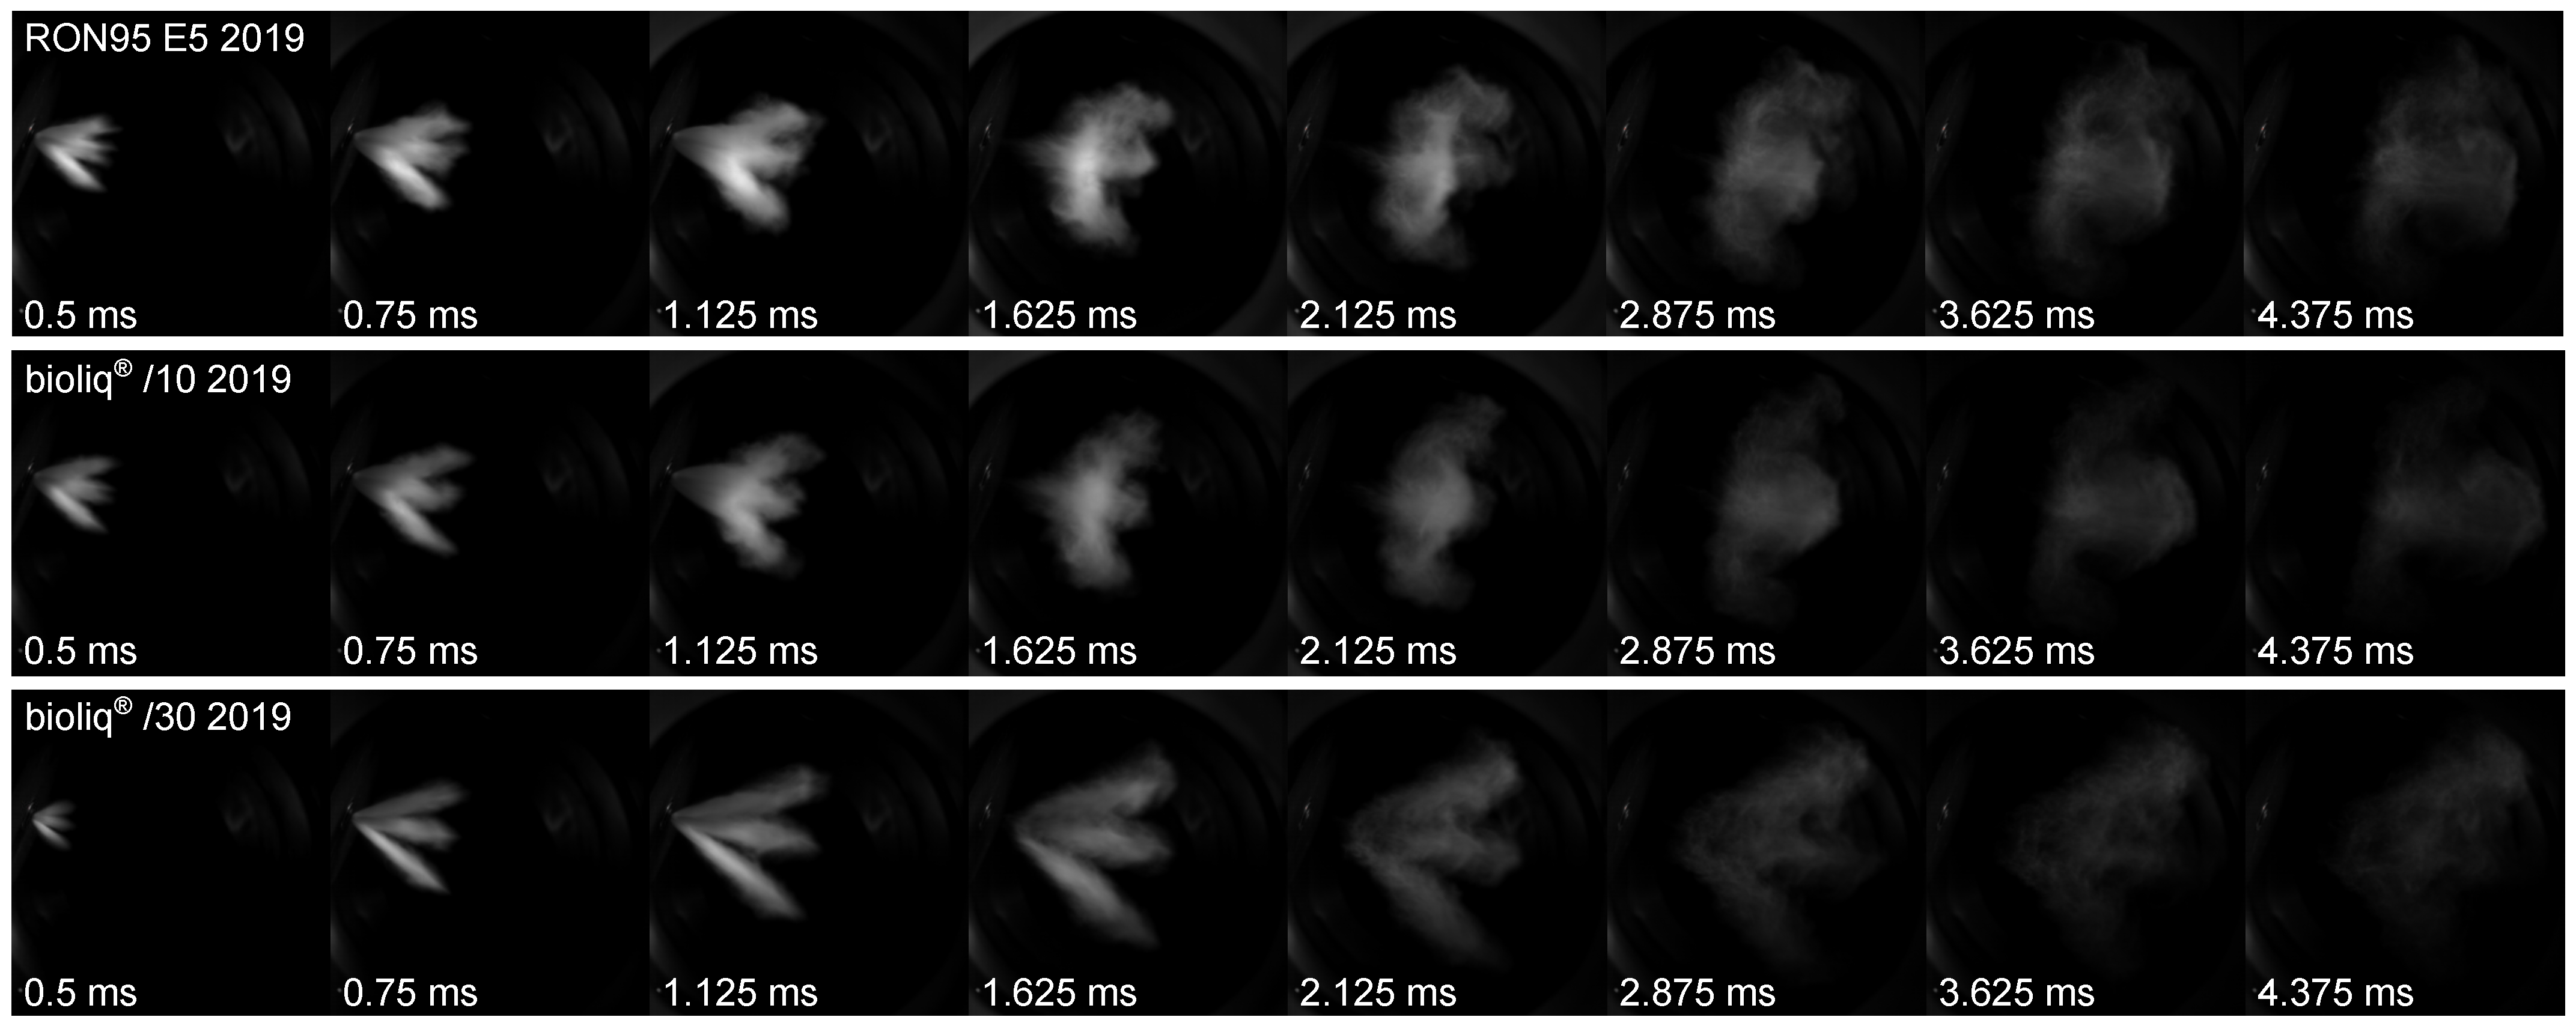
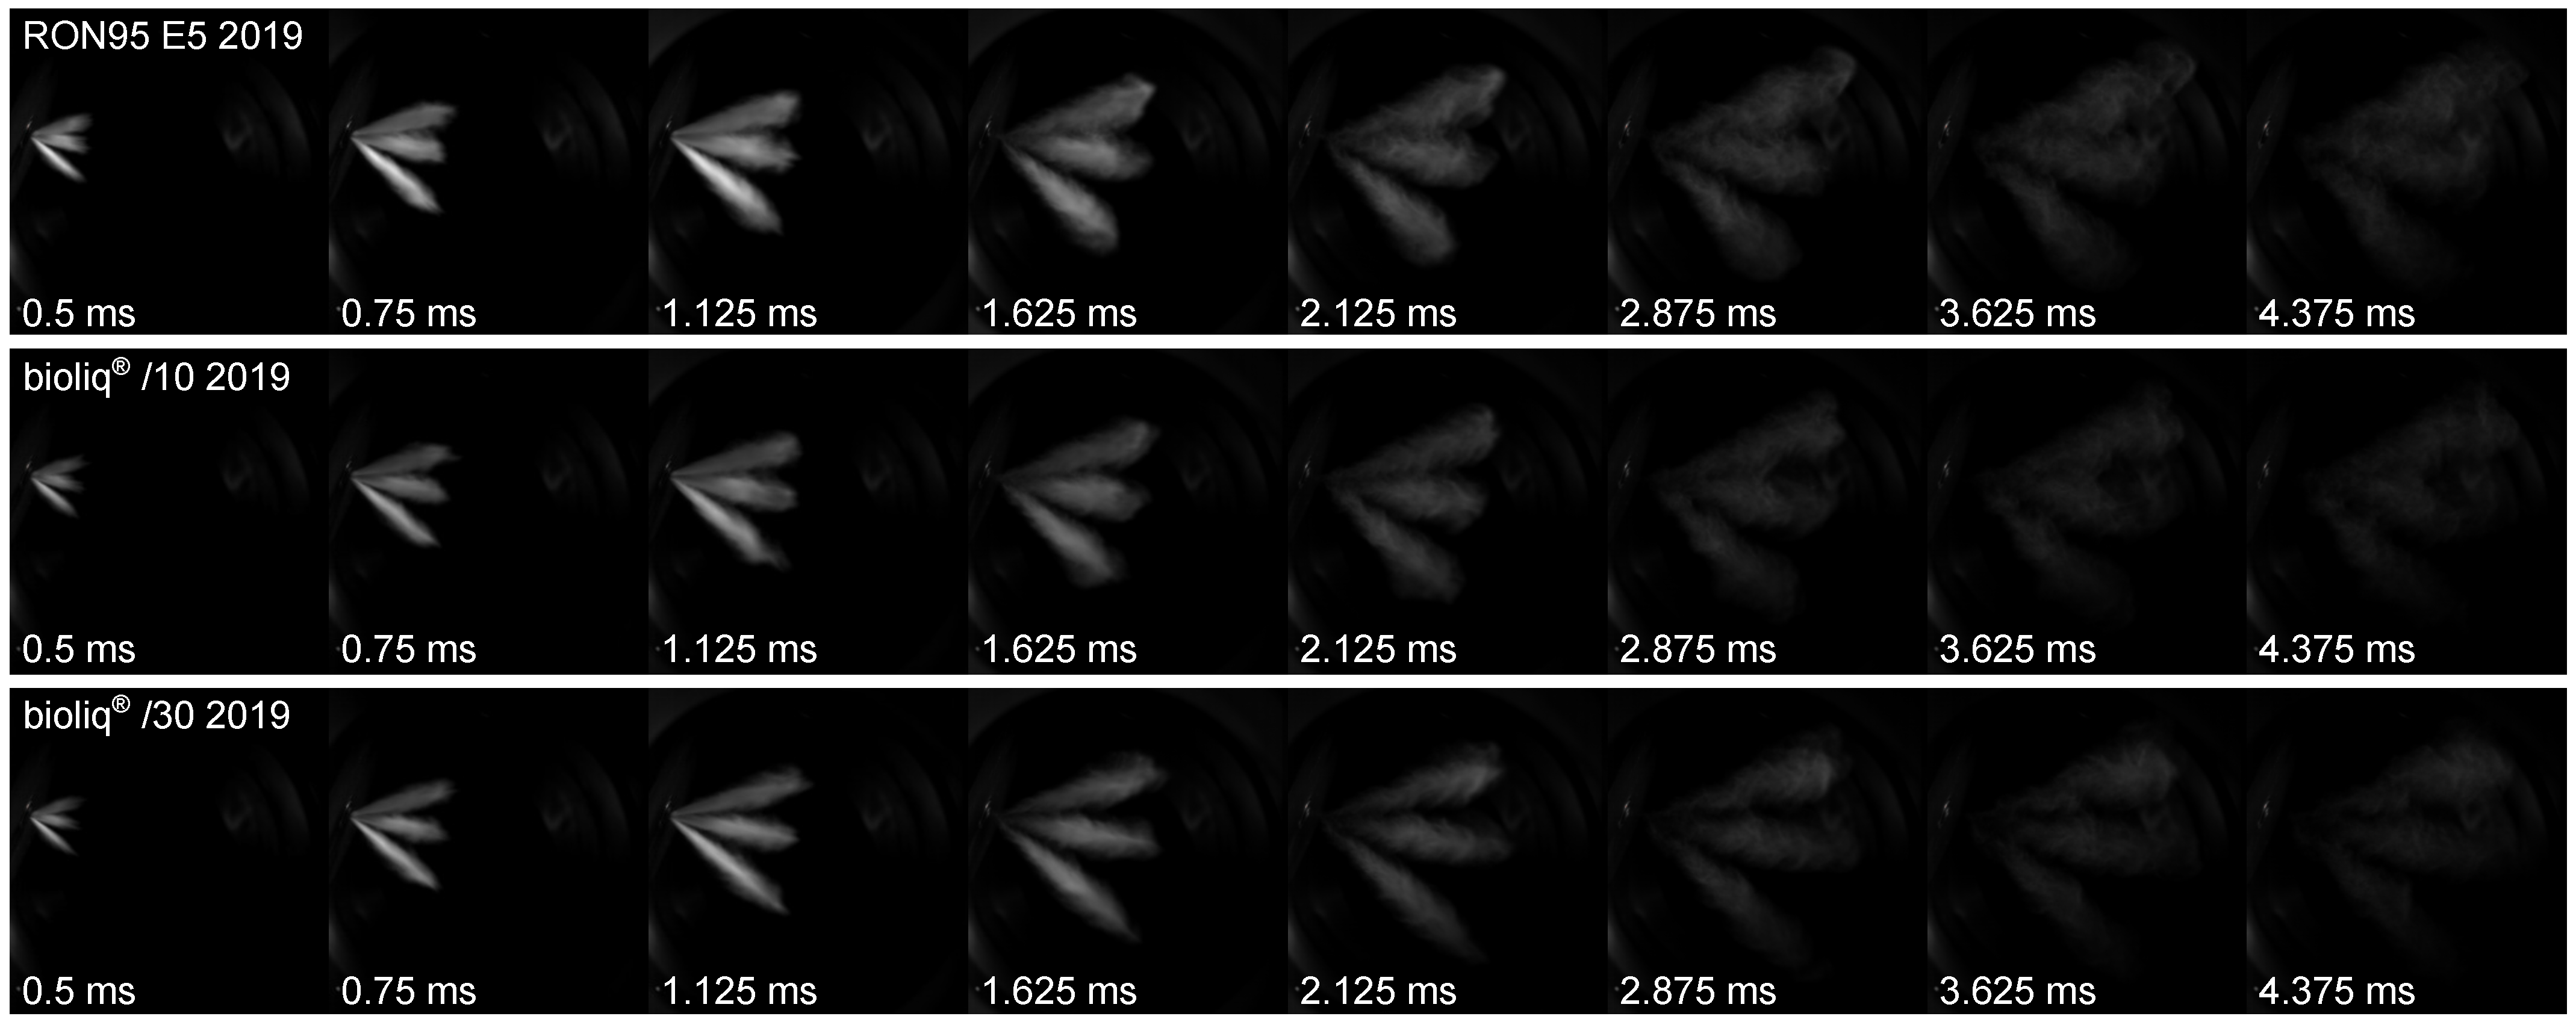
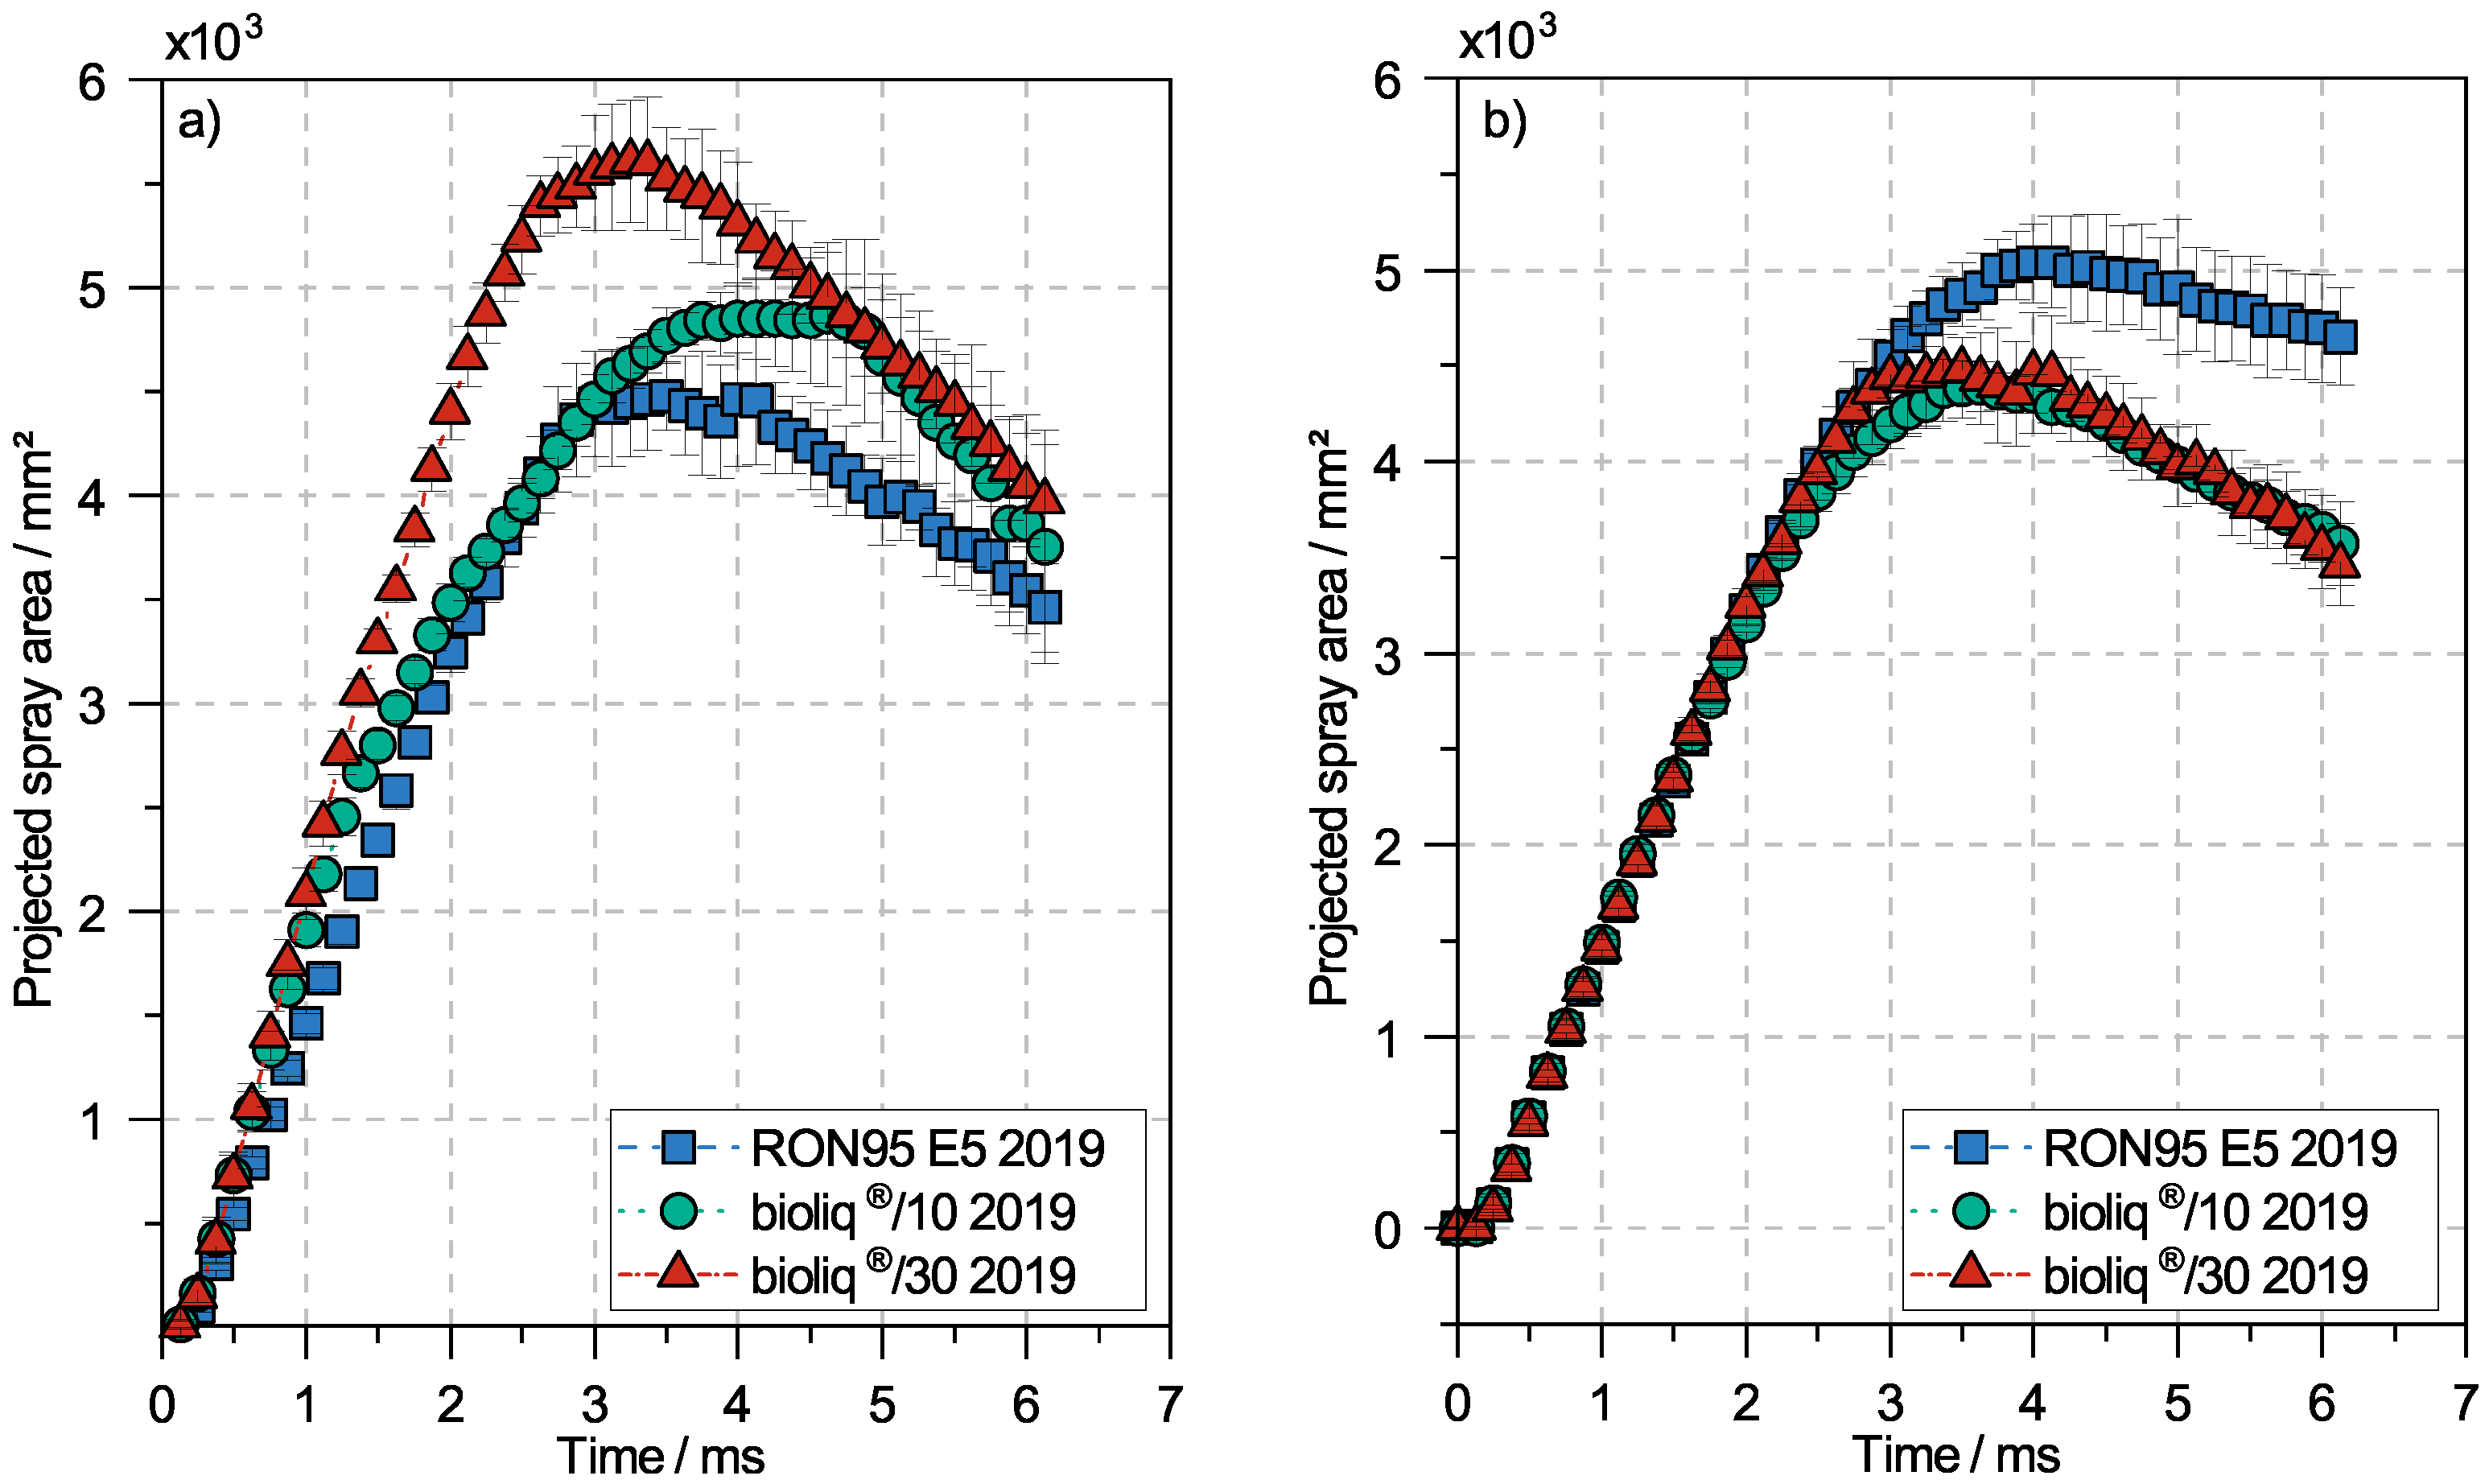
This section begins with the analysis of the spray of three fuels (RON95 E5 base fuel, bioliq®/10 and bioliq®/30 fuel blends, all 2019). Unfortunately, no spray analysis of the 2017 fuels was performed. Afterwards, the particulate and hydrocarbon emissions are presented. Due to the change in the base fuel, the emissions are normalized to their reference base fuel (bioliq® 2017 fuel blends to RON95 E5 2017 and bioliq® 2019 fuel blends to RON95 E5 2019).

4.1. Spray Analysis

The processes in an internal combustion engine strongly depend on the mixture formation, and thus on the fuel injection parameters. For example, the spray shape, the penetration length and the spray area have a significant influence on the spray targeting and the homogenization of the air and the fuel in the combustion chamber, which has a major impact on the emissions. The authors of [19,20,21] pointed out a significant influence of fuel characteristics on the mentioned spray parameters. Due to different boiling and vapor temperatures, effects such as flash boiling and spray collapse have to be considered. In [22,23] the authors used the ambient-to-saturation pressure ratio pa/ps as a value to quantify the degree of flash boiling. In these publications, a pa/ps value larger than one indicates no flash boiling. A ratio between 1.0 and 0.3 defines the flash boiling transition zone, and a ratio smaller than this indicates the spray collapse.
Figure 4 shows the spray development of the RON95 E5, bioliq®/10 2019 and bioliq®/30 2019 at eight different time steps at an ambient pressure of 0.1   M Pa , an injection pressure of 20 M Pa and a fuel temperature of 90 C . The injection duration was 1.1   m s , so the injector was closed at the third picture ( 1.125   m s ). A comparison between the RON95 E5 2019 and the bioliq®/30 2019 fuel in Figure 4 shows that by using the bioliq®/30 2019 fuel, the spray coils are clearly separated from each other, while with RON95 E5, the spray coils are merged together. On the one hand, this can be explained by a decrease in flash boiling with increasing bioliq® fuel content, resulting in a deterioration of the atomization behavior, and thus the mixture formation in the combustion engine. The bioliq®/10 2019 fuel behaves similarly to the RON95 E5, and also shows flash boiling. The shapes of the sprays and the amount of flash boiling correlate with the vapor pressures of the fuels (see Table 1), and thus with the ambient-to-saturation pressure ratio. In addition, at a fuel temperature of 90 C , the bioliq®/30 2019 fuel shows a significantly lower vaporized volume than the other fuels, as shown by the distillation curve in Figure 2. A similar behavior between the vapor pressure and the boiling temperature of fuels is observed by [24]. On the other hand, different surface tensions of the fuels have an influence on the atomization of the fuels. A higher surface tension leads to larger droplets, which means that the momentum of these droplets is higher, resulting in less expansion of the spray perpendicular to the direction of propagation. Unfortunately, no informations on the surface density of the fuels is known to quantify this effect. Considering furthermore the densities of the fuel blends, an increase in bioliq® fuel content should also have an effect on the droplet size and shape due to its higher density and its linear increase in Weber number. This would lead to an improvement in the evaporation of the spray with increasing bioliq® fuel content, which is not observed. Thus, the influence of density seems to be of minor importance in the considered application.
The increased pressure leads to increased atomization due to the higher air resistance, but also less flash boiling of all fuels due to the higher ambient-to-saturation pressure ratio, which is shown in Figure 5. In particular, the RON95 E5 and bioliq®/10 2019 fuels have clearly separated spray coils under these conditions. In comparison, the spray shape of the bioliq®/30 2019 fuel does not change significantly. The spray coils of this fuel are still clearly separated from each other. Only from a time point of 1.625   m s is a slightly lower atomization of the spray observed, compared to a chamber pressure of 0.1   M Pa . Therefore, the lower vapor pressure and the less evaporated fraction at a fuel temperature of 90 C with increasing bioliq® fuel content also have a lower influence on the mixture formation at higher engine loads.
Alongside the shape of the spray, the penetration length of the spray is also relevant, as it increases component impingement. Figure 6 shows the penetration length development of the spray in dependence of the time at a chamber pressure of (a) 0.1   M Pa and (b) 0.25   M Pa for RON95 E5, bioliq®/10 2019 and bioliq®/30 2019. At a chamber pressure of 0.1   M Pa , a higher content of bioliq® results in a higher penetration length. In this study, the difference is approximately 7 m m , which corresponds to an increase of nearly 10%. With increasing pressure, this tendency decreases, and the bioliq® fuel content has only a minor influence, considering the standard deviation. This is partly due to the higher air resistance, which reduces the overall penetration length, and partly due to less flash boiling, which would lead to improved atomization. The results agree well with those of [25], which showed the difference between kerosene and gasoline under comparable conditions. They found that kerosene has a narrower spray angle due to its higher density and viscosity, resulting in a longer spray penetration length.
The projected spray area is another value for evaluating the spray properties of different fuels. Figure 7 shows the projected spray area at a chamber pressure of (a) 0.1   M Pa and (b) 0.25   M Pa for the three fuels mentioned. The initial curve shape always shows an approximately linear increase in the projected spray area until a maximum is reached. Afterwards, the evaporation of the spray results in a decrease in the area, as the gaseous phase of the fuels is not visible with the described method.
At a lower chamber pressure, an increase in the bioliq® fuel content results in a larger projected spray area. One explanation for this is the lower amount of flash boiling, leading to less evaporation of the fuel, in combination with a higher penetration length. Separated spray coils imply less overlap of these spray coils, and thus a higher projected area. This effect is mitigated by higher chamber pressures, resulting in less flash boiling due to the increased ambient-to-saturation pressure ratio. At a chamber pressure of 0.25   M Pa , the spray coils of all fuels are clearly separated, but the higher amount of flash boiling using the RON95 E5 fuel results in a spray expansion while still having separated spray coils. As a result, the projected spray area is the largest using RON95 E5. Adding bioliq® fuel to the RON95 E5 base fuel decreases the projected spray area due to less flash boiling and the spray expansion, as Figure 7b shows. This figure illustrates no significant difference of the projected spray area between bioliq®/10 2019 and bioliq®/30 2019 fuels. This is due to the fact that the atomization due to the boiling process decreases at higher pressure because of the increasing pa/ps.

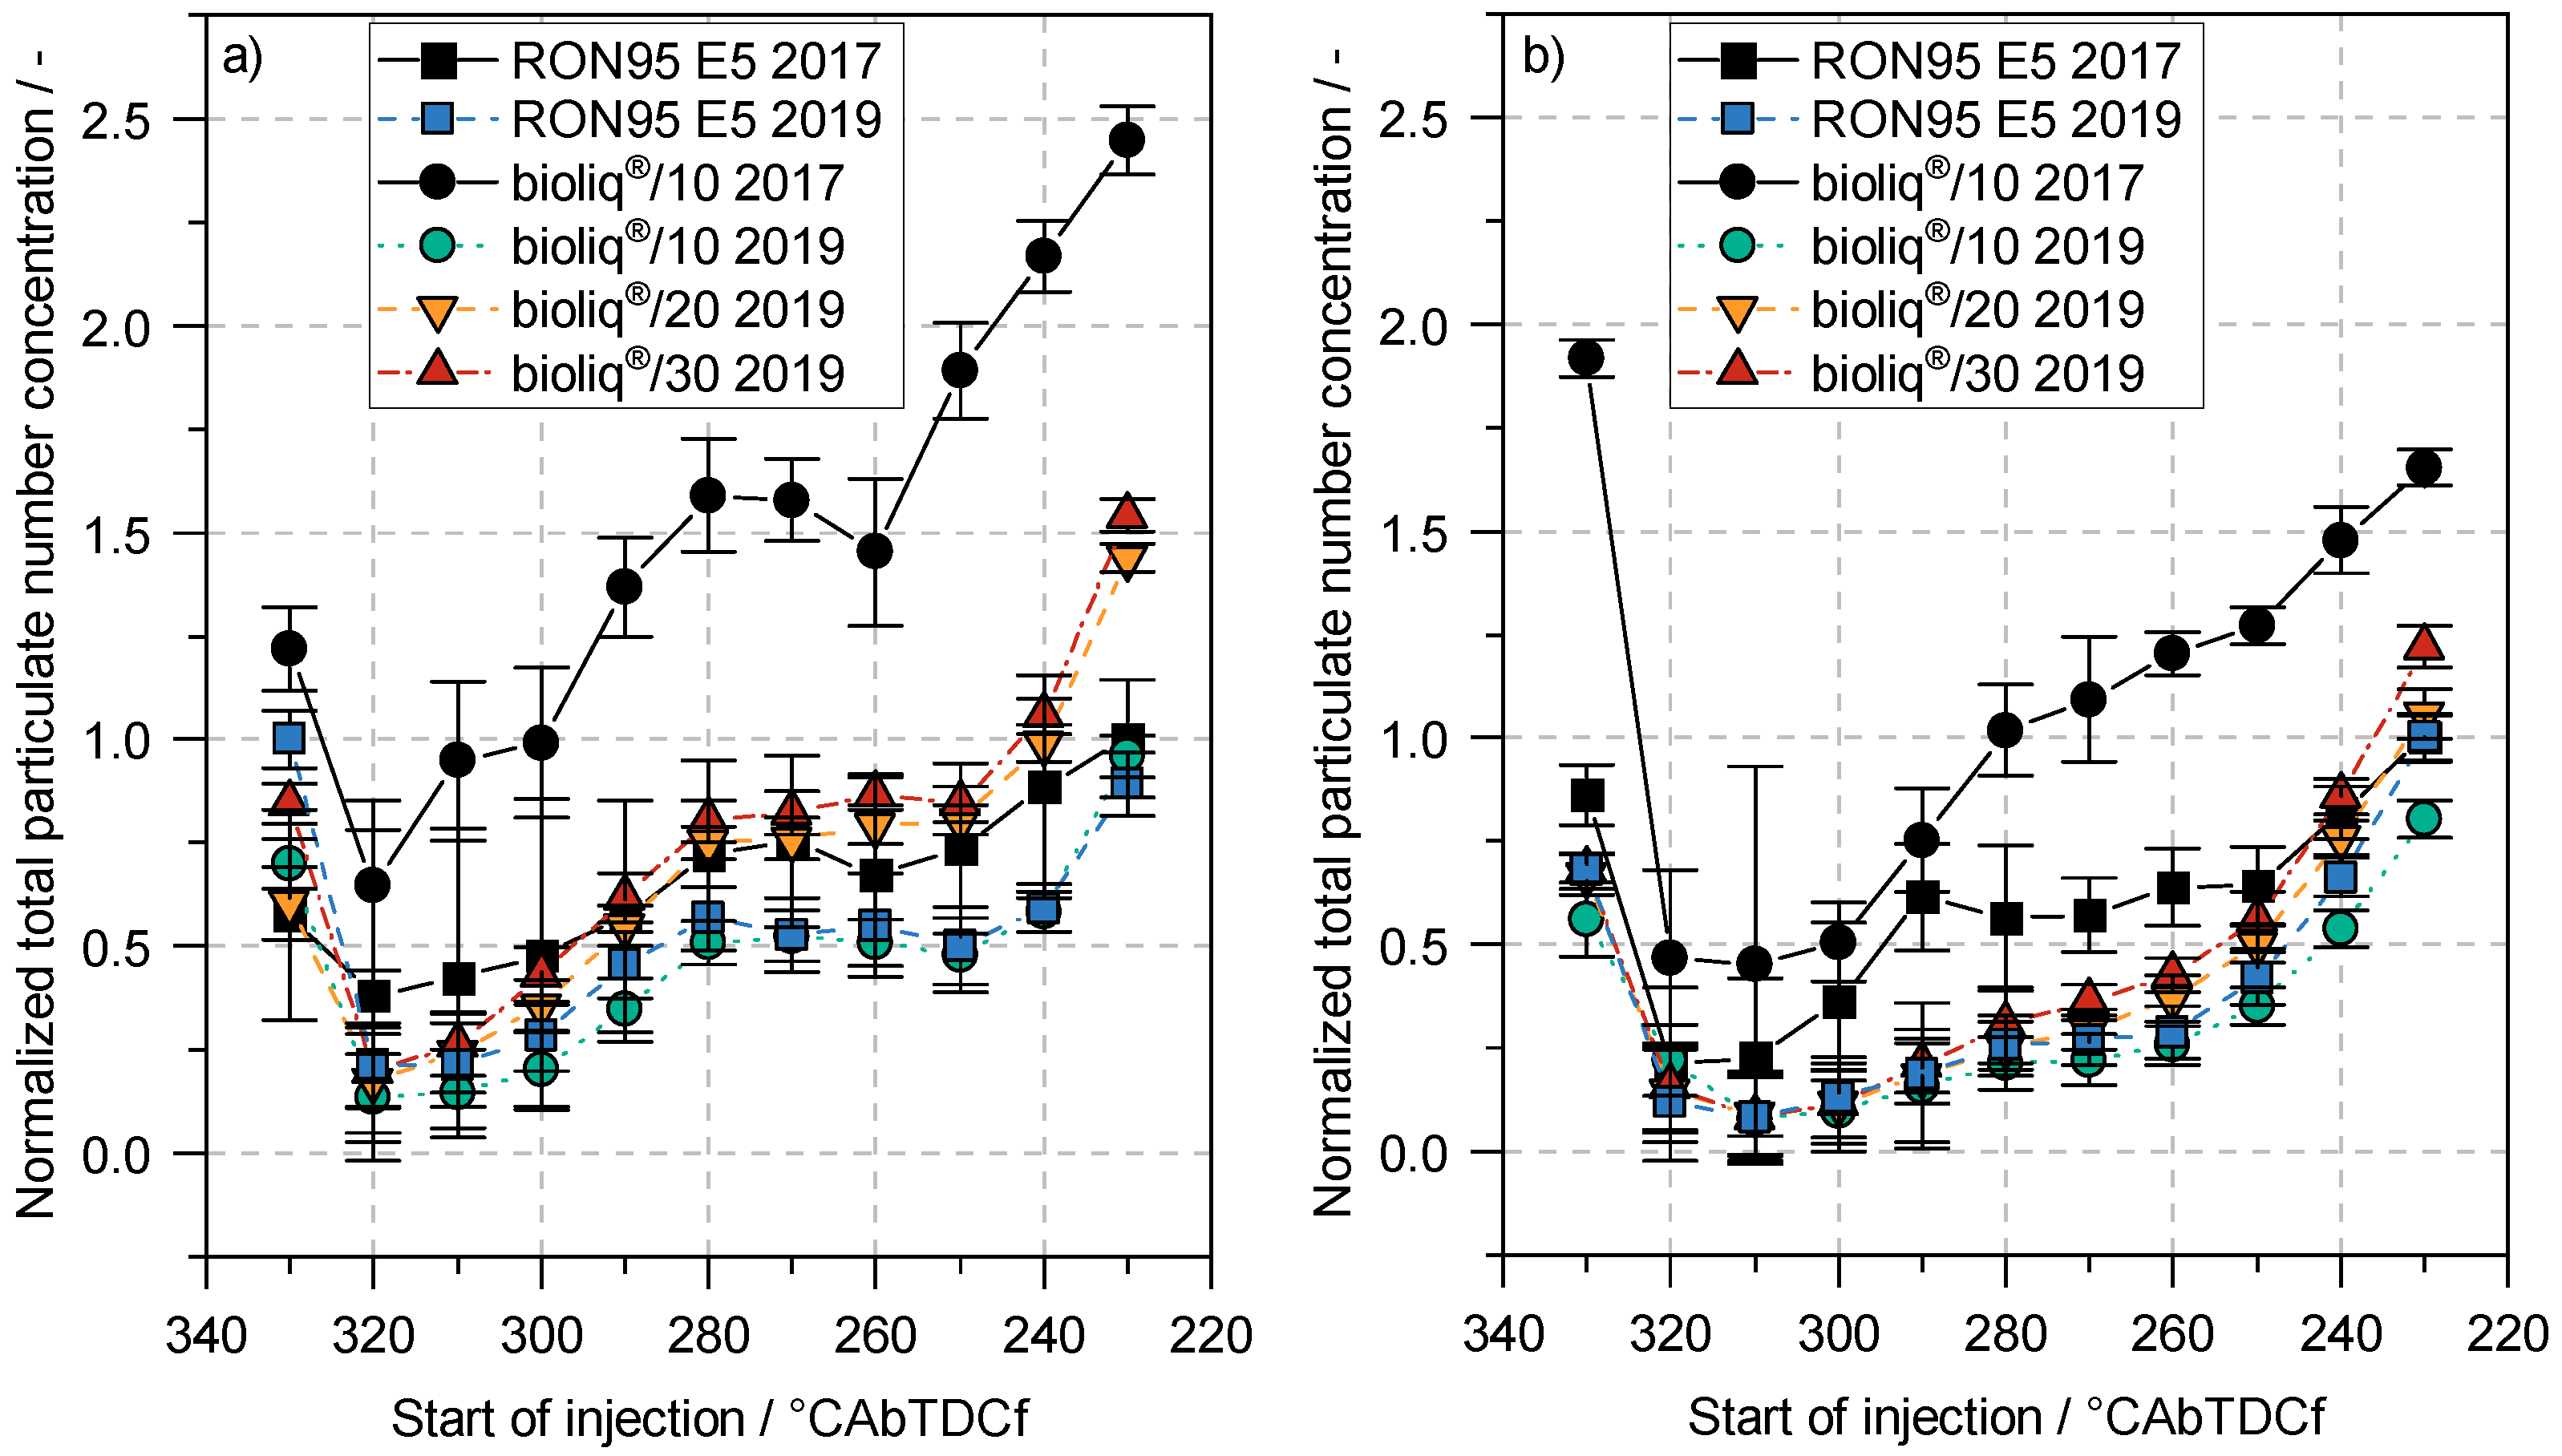
4.2. Particulate Emissions

A previous publication [10] shows the performance of the bioliq®/10 2017 fuel in terms of particulate emissions as a function of the injection timing. It showed higher particulate emissions, mainly due to the higher aromatic content of heavy aromatics (>C9). Therefore, Figure 8 shows the normalized total particulate number concentration in dependency of the injection timing of the 2017 (black markers) and 2019 (colored markers) fuels. Two engine loads of 0.5   M Pa and 0.8   M Pa demonstrate the improvement of the 2019 bioliq® fuel. The values are normalized to their reference fuel (2017 and 2019 RON95 E5 to the associated bioliq® fuel blend), due to a change in the base fuel.
The general curve shape is similar for all fuels and both engine loads, and starts with a high total particulate number concentration caused by the impingement of the fuel spray on the piston, and thus a diffusive, rich combustion of the fuel, the so-called pool fire. Thereafter, the total particulate number concentration decreases to a minimum due to the downward movement of the piston, which prevents the injected fuel from impinging on the piston. This minimum is in the range of 320 ° CAbTDCf and 310 ° CAbTDCf for all fuels at an engine load of 0.5   M Pa and 0.8   M Pa , respectively. The following increase in the total particulate number concentration at a later injection timing is a result of the poorer mixture formation due to the shorter time between injection and combustion. Another reason described by [26,27,28] is the wetting of the liner by the fuel spray.
Figure 8 also shows the improvement of the bioliq® 2019 fuel compared to the bioliq® 2017 fuel. Both engine loads show increased total particulate number concentrations regardless of the injection timing using bioliq®/10 2017 fuel. At the lower engine load in Figure 8a, the factor between RON95 E5 2017 and the bioliq®/10 2017 fuel is almost 2.5, so the bioliq® fuel blend produced a 2.5 times higher particulate concentration in the worst-case scenario at a late injection timing at 230 ° CAbTDCf . In comparison, the 2019 bioliq® fuel blends show a significant improvement regarding the total particulate number concentration. The bioliq®/10 2019 fuel does not significantly influence the particulate concentration, and follows the reference line of the RON95 E5 from 2019. Higher bioliq® 2019 fuel contents result in an increase in particulate emissions at late injection timings. However, the difference between the reference fuel and the bioliq® fuel blends is significantly smaller, and only about 1.5 times the reference fuel. The particulate emission of the bioliq® 2019 fuel blends at injection timings between 320 ° CAbTDCf and 290 ° CAbTDCf should be positively emphasized at this point. The bioliq® fuel content does not deteriorate the particulate emissions in the normal engine operation’s relevant injection timing window. At the higher engine load in Figure 8b, the bioliq® 2019 fuel blends do not significantly change the particulate number concentration, independent of the injection timing. Although the bioliq®/10 2017 fuel performs better compared to the lower engine load, however, it has a higher particulate number emission under all injection conditions.
The difference of the fuel performances is caused by the two factors of aromatic content and the mixture formation. It is known that heavy aromatics (>C9) favor the particulate formation, resulting in higher total particulate emissions [29,30,31,32]. Despite the fact that the aromatic content of the bioliq® 2019 fuel has not decreased compared to the bioliq® 2017 fuel, the aromatics are smaller than C9, and thus improve the particulate emissions, which is also shown by [33]. In addition, [33] remarks that the aromatic size has a stronger influence than the total aromatics content on the particulate emissions. Comparing the two engine loads, the size of the aromatic should not be the only effect influencing the particulate formation. The higher engine load increases the ambient-to-saturation pressure ratio, and thus reduces the difference in the spray characteristics at higher bioliq® fuel content, which is described in detail in Section 4.1. This explains the weaker performance of bioliq® 2019 fuel blends at late injection timing at the lower engine load, as here, the lower boiling curve of the RON95 E5 2019 has a noticeable influence on the spray shape.
In summary, the improvements on the content of heavy aromatics between the 2017 and 2019 bioliq® fuel are also reflected in an improvement in particulate number emissions at all observed injection timings. In addition, the bioliq® 2019 fuel blends no longer show a deterioration in particulate number emissions at an IMEP of 0.8   M Pa .

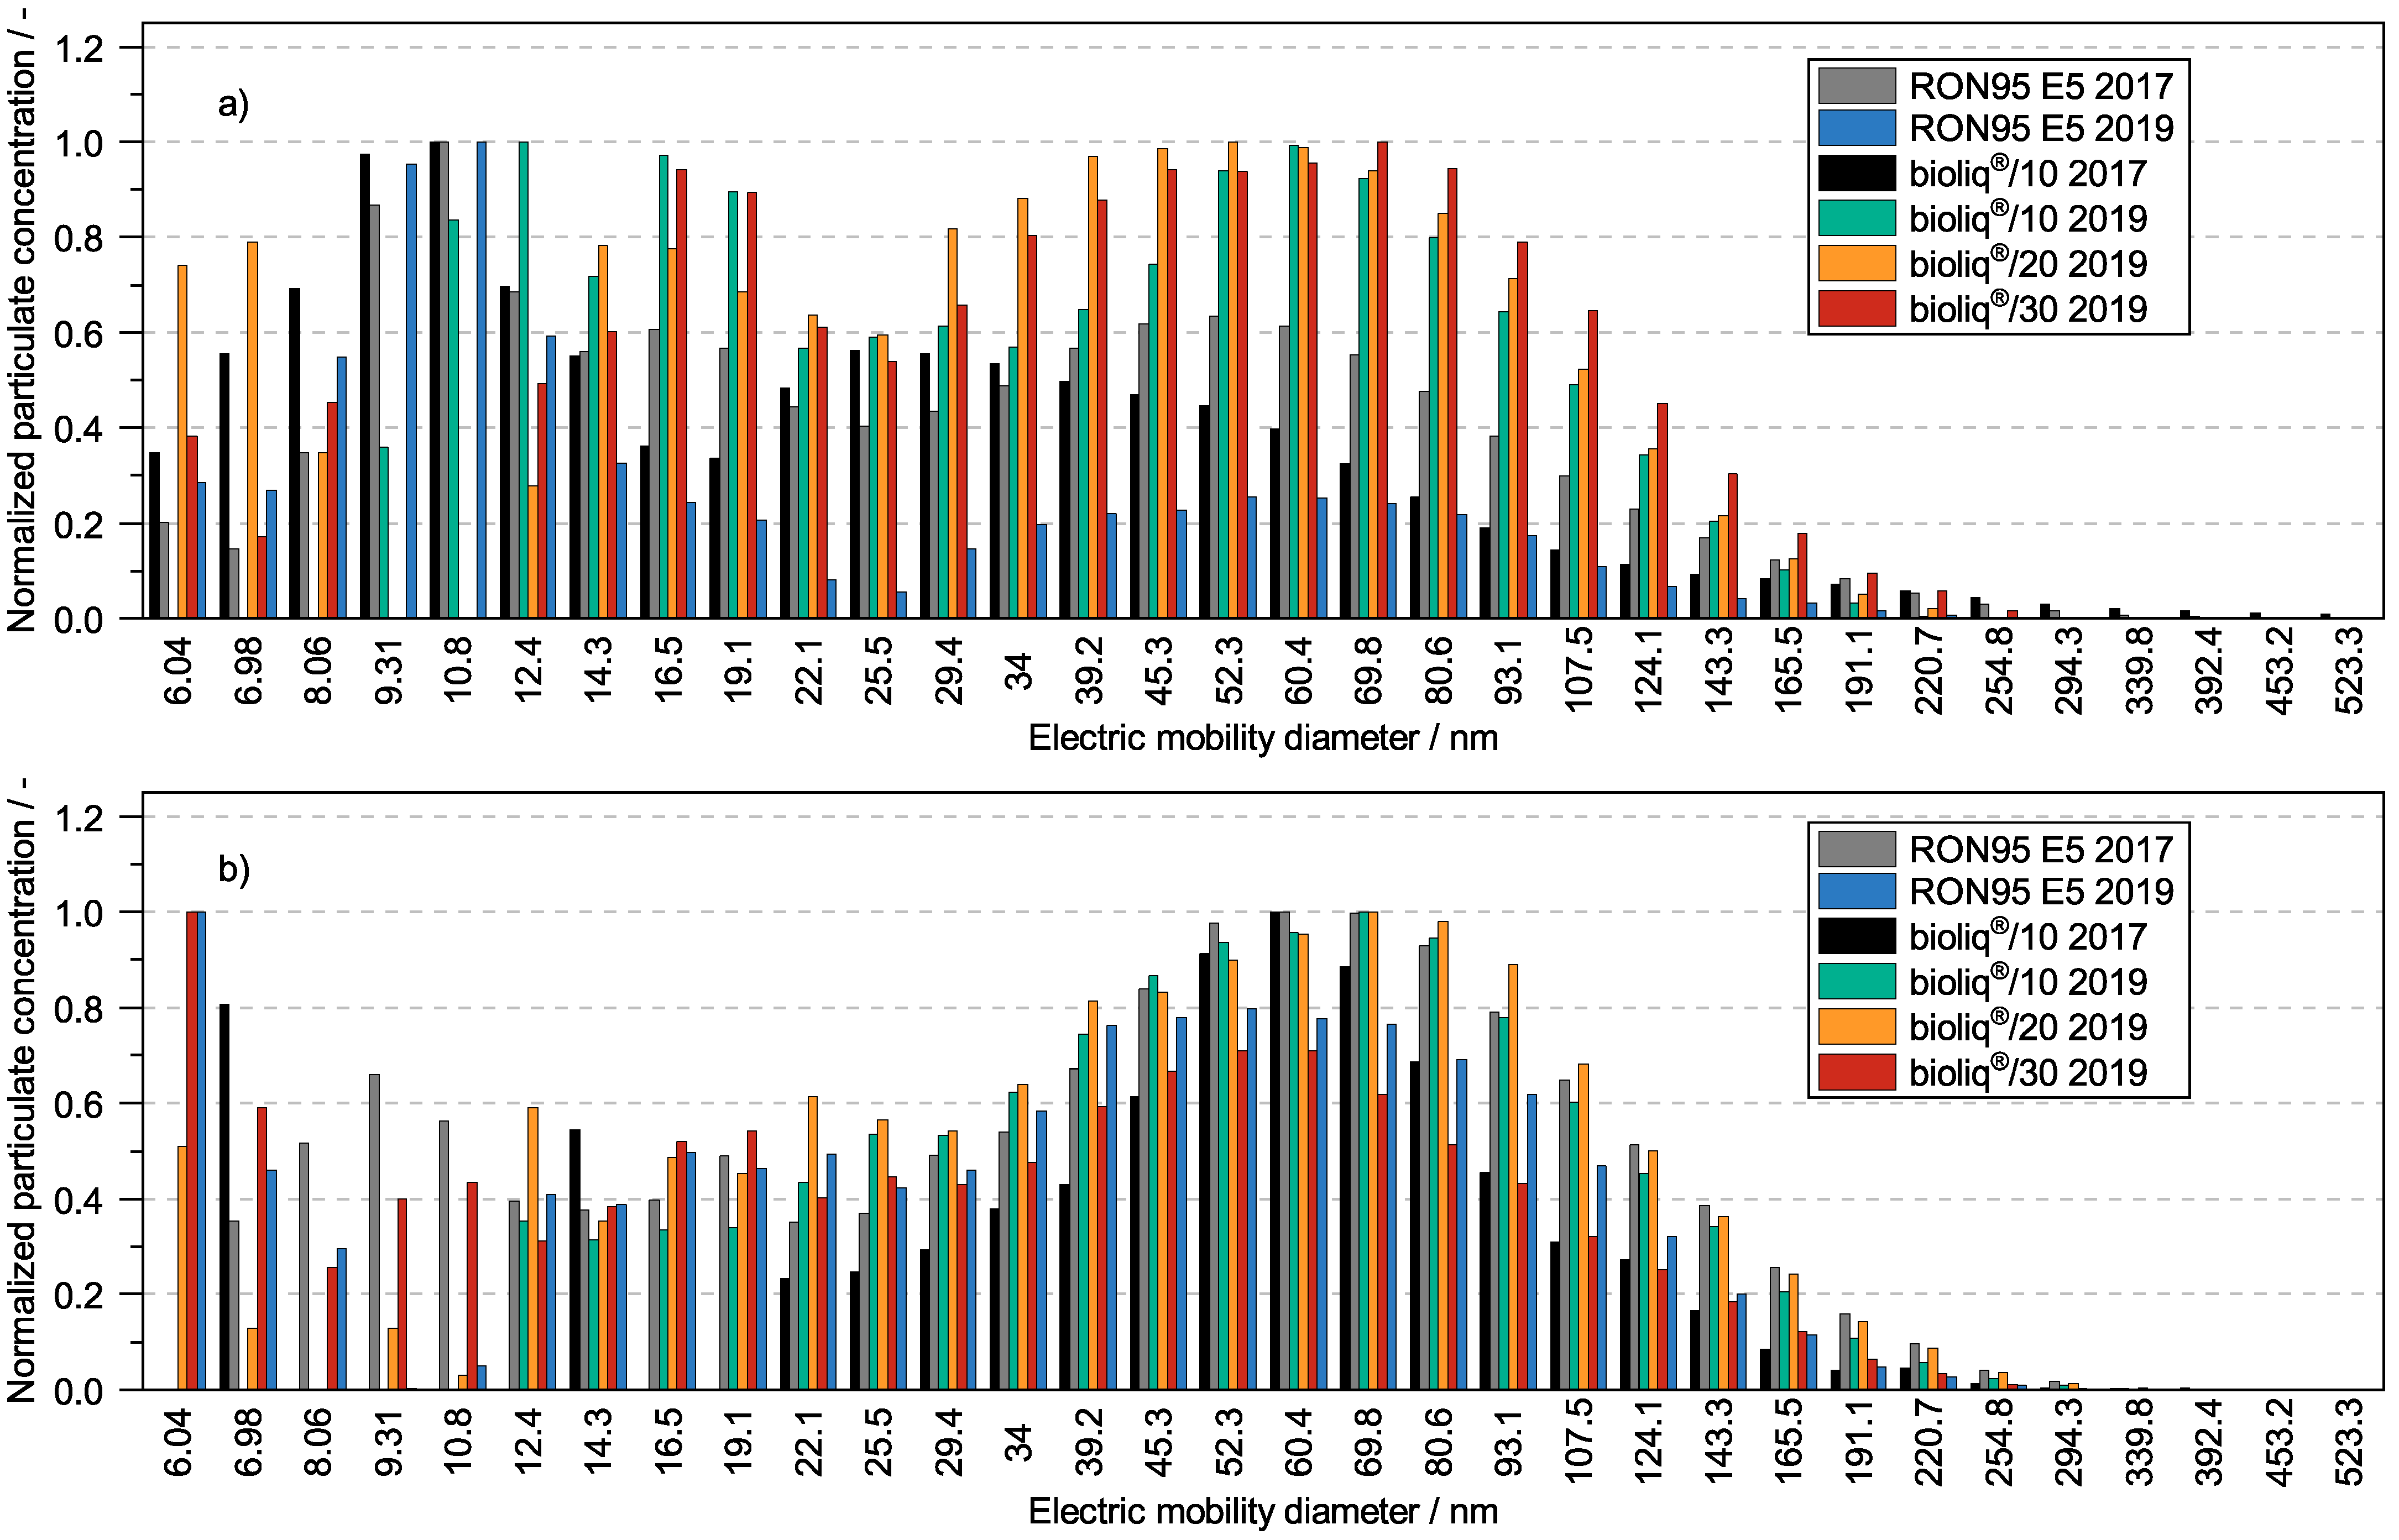
4.3. Particulate Size Distribution
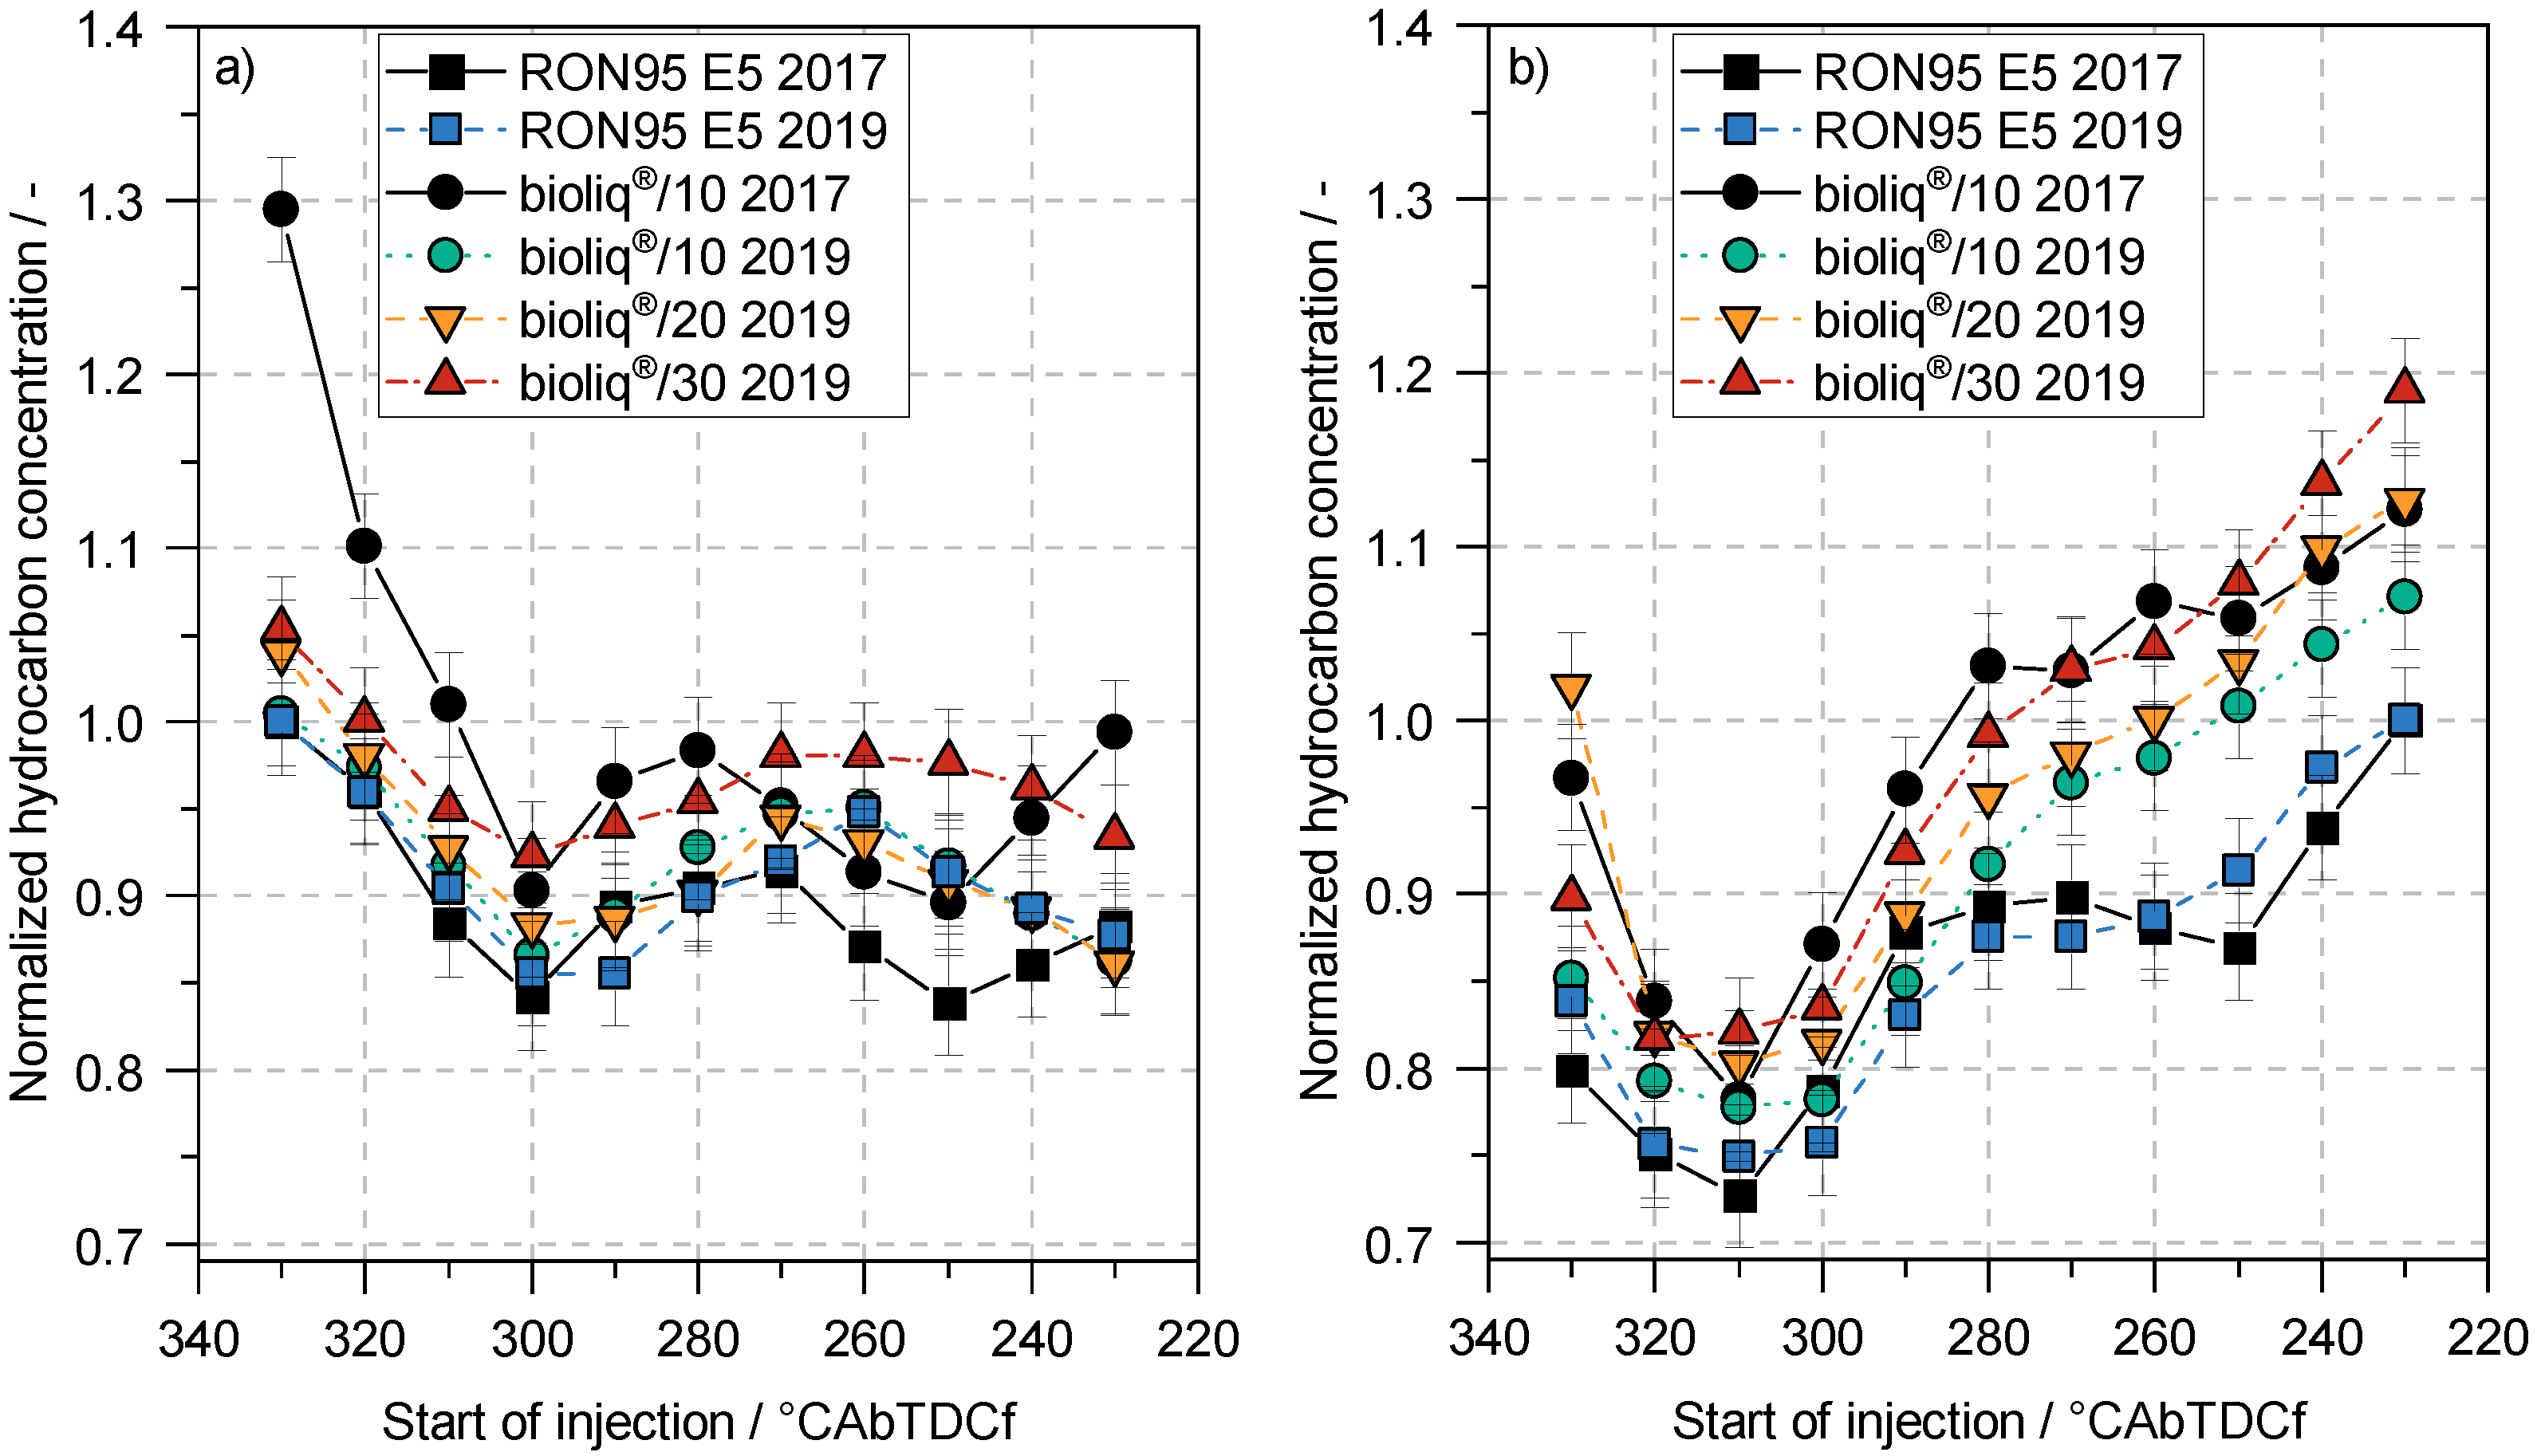
The characterization of the particulates can be performed by observing the particulate size distribution (PSD). It gives information about the formation of particulates and how gasoline particulate filters (GPF) can handle these particulates, due to the filtration efficiency, which depends on the particulate size [34,35]. Another piece of information is the regeneration habit of these GPFs, which depends on different properties such as the soot reactivity of the filtered soot particulates [36,37].
Although particulate size distributions are available for each of the total particulate number concentrations presented in the previous subsection, only the particulate size distributions at the lowest particulate number concentrations are considered in Figure 9 below, in order to preserve clarity. The PSDs shown are for the operation points (a) at an IMEP of 0.5   M Pa and an SOI of 320 ° CAbTDCf and (b) at an IMEP of 0.8   M Pa at an SOI of 310 ° CAbTDCf . First, in both engine operation points, all fuels show a bimodal particulate size distribution, with a nucleation mode below 15 n m and an accumulation mode with a maximum at approximately 60 n m . Notable is the small difference in the PSD shape between the low IMEP in (a) and the high IMEP in (b) using the bioliq® 2019 fuels, while the RON95 E5 2019 base fuel shows a shift in shape towards larger particulates in the accumulation mode, aligning with the PSD shape of the bioliq® fuel blends. A possible explanation is the lower difference in the spray formation, which is discussed in Section 4.1. The higher pressure at the injection timing reduces flash boiling of the RON95 E5 2019 fuel, resulting in a similar spray shape, and thus mixture formation, compared to the bioliq® 2019 fuel blends.
Comparing the two bioliq® fuel campaigns from 2017 and 2019, only a difference at an IMEP of 0.5   M Pa is observed. The bioliq® 2017 fuel shows a higher number of small particulates in the nucleation mode. Moreover, the accumulation mode of the bioliq® 2017 fuel behaves similarly to that of the RON95 E5 2017 base fuel. A significant difference between the two fuel campaigns is the larger amount of heavy aromatics (>C9) in the bioliq® 2017 fuel. These aromatics act as a precursor of polycyclic aromatics, which leads to a formation of particulates [38], and thus an increase in the particulate number concentration in the nucleation mode. In [38], the authors also showed a similar trend, and concluded that the total aromatic content of small aromatics has a small effect on the particulate size distribution, while the content of large aromatics leads to an increase in the nucleation mode in the particulate size distribution. This is in good agreement with the results in this work.

4.4. Hydrocarbons

The hydrocarbon emissions at different injection timings for the different fuels are shown in Figure 10. As before, in this Figure 10, (a) and (b) also show the two operation points at an IMEP of 0.5   M Pa and 0.8   M Pa , respectively. The fuels show a similar behavior at each engine operation point, with the curve depending on the operation point. At the lower engine load in (a), the hydrocarbon emissions peak at the earliest injection timing of 330 ° CAbTDCf and decrease steadily to their minimum value at an SOI of 300 ° CAbTDCf . Due to the early injection timing and the piston wetting, the diffusive flame leads to incomplete combustion of the fuel, resulting in a higher hydrocarbon emission. However, at later injection timings, this effect diminishes, leading to the minimum. Subsequently, the hydrocarbon emissions increase slightly at first, but then remain relatively constant. The slight increase in emissions can be explained by the shorter time for the mixture formation and evaporation of the spray. With increasing load, showed in (b), the hydrocarbon emissions show a similar trend at early injection timing than at an IMEP of 0.5   M Pa . However, after the minimum at an SOI of 310 ° CAbTDCf , the hydrocarbon emissions show a strong increase with later injection timings. The reasons for this are the shorter time for mixture formation, the higher fuel mass and the increased ambient pressure, resulting in less flash boiling, and thus to poorer mixture formation.
At the lower engine load in Figure 10a, and at early SOIs until 300 ° CAbTDCf , the bioliq®/10 2017 fuel shows the highest concentration of hydrocarbon emissions, while the other fuels do not show significant differences. In [39], the authors showed a correlation between the volatility of the fuel and the hydrocarbon emissions of the fuel. Considering the distillation residue from Table 1, the bioliq®/10 2017 fuel has the highest value of all fuels. Therefore, it is a possible explanation that this distillation residue, among others, leads to increased hydrocarbon emissions. The higher engine load in (b) shows a slight tendency towards higher hydrocarbon emissions at early injection timings by adding bioliq® fuel to the base fuel. At later injection timings, this influence becomes clearly visible, and the hydrocarbon emission increases with the bioliq® fuel content. However, it must be considered that the bioliq® 2019 fuel can be blended in higher contents until similar hydrocarbon emissions are reached compared to the bioliq® 2017 fuel. This illustrates the improvements made in the production process of the fuel.

5. Conclusions

By modifying the product refinement, heavy aromatics (>C9) were completely removed from the hydrocarbon mixture of the bioliq® plant. Blends of 10 vol . - % , 20 vol . - % and 30 vol . - % bioliq® fuel with commercial RON95 E5 gasoline were prepared in order to investigate the effects of the reduced content of high-boiling aromatics on the spray characteristics in a pressure chamber and the particulate and hydrocarbon emissions in a single-cylinder research engine. The exhaust gas emissions were then compared to those for the bioliq®/10 2017 fuel, which have been described previously. The main findings are as follows:
  • Measurement of the spray characteristics at 0.1   M Pa showed decreasing atomization with increasing bioliq® fuel content, partly due to the lower vapor pressure of the bioliq® 2019 fuel. Increasing the pressure to 0.25   M Pa resulted in a leveling of the spray characteristics due generally to less flash-boiling.
  • The reduction in heavy aromatics results in a direct reduction in the particulate number concentration in the case of all investigated blends.
  • By adding bioliq® fuel to the base fuel, an increase in the particulate diameter can be observed at low engine loads. This effect is distinguished at higher engine loads; thus, no significant difference between the base fuel and the blends can be observed.
  • The hydrocarbon emissions were significantly reduced. At injection timings close to the optimized conditions for low hydrocarbon emissions, the addition of bioliq® fuel did not lead to a deterioration in emission formation. Only for later timed injections, accompanied by shorter time of mixture formation, hydrocarbon emissions also increased with higher bioliq® fuel content. However, compared to the bioliq®/10 2017 fuel, the percentage of renewably produced hydrocarbons could be doubled in a blend with 20 vol . - % bioliq® fuel.
Finally, it should be noted that the fuel blends used were not specifically additivated, and only the inherent additive package of the base fuels was presented. With an additive package optimized for these fuel blends, there is further potential for a significant reduction in particulate and hydrocarbon emissions.

Author Contributions

Conceptualization, O.T., T.K. and J.S.; methodology, T.M.; software, T.M.; validation, T.M.; formal analysis, T.M.; investigation, T.M.; resources, O.T., T.K. and J.S.; data curation, T.M.; writing—original draft preparation, T.M., B.N. and C.F.; writing—review and editing, O.T. and U.A.; visualization, T.M.; supervision, O.T., T.K. and J.S.; project administration, T.M. and O.T.; funding acquisition, O.T. All authors have read and agreed to the published version of the manuscript.

Funding

This research was funded by the “Ministerium für Wissenschaft, Forschung und Kunst Baden Württemberg”. We also thank the “Ministerium für Verkehr Baden Württemberg” and the “Strategiedialog Automobilwirtschaft BW” for sponsoring the project “reFuels—rethinking Fuels”.

Acknowledgments

The authors want to thank Alexander Plaß and Malki Maliha for performing the tests in the pressure chamber and providing the results of the spray analysis. In addition, the authors gratefully acknowledge Herbert Lam for supervising the bioliq® campaigns and providing the associated data.

Conflicts of Interest

The authors declare no conflict of interest.

Abbreviations

The following abbreviations are used in this manuscript:
AFRAir–fuel ratio
BtLBiomass-to-liquids
CAbTDCfCrank angle before top dead center firing
DIDirect injection
d l Detection limit of the FID
DMEDimethyl ether
DtGDimethyl ether-to-Gasoline
EEPSEngine Exhaust Particle Sizer
ENEuropean standard
ETBEEthyl tertiary-butyl ether
EUEuropean Union
FIDFlame ionization detector
GPFGasoline particulate filter
hOperation time after last analyzer calibration
HCHydrocarbons
HSHigh-speed
IMEPIndicated mean effective pressure
KITKarlsruhe Institute of Technology
LEDLight-emitting diode
MONMotor octane number
m v H C Measured value of hydrocarbon concentration
PSDParticulate size distribution
REDRenewable Energy Directive
RONResearch octane number
SISpark-ignited
SOIStart of injection
u H C Uncertainty of hydrocarbon concentration measurement

References

  1. United Nations. Sustainable Transport, Sustainable Development. Interagency Report for Second Global Sustainable Transport Conference; United Nations: San Francisco, CA, USA, 2021. [Google Scholar]
  2. Dinjus, E.; Arnold, U.; Dahmen, N.; Höfer, R.; Wach, W. Chapter 8. Green Fuels—Sustainable Solutions for Transportation. In Sustainable Solutions for Modern Economies; Green Chemistry Series; Hofer, R., Ed.; Royal Society of Chemistry: Cambridge, UK, 2009; Volume 4, pp. 125–163. [Google Scholar] [CrossRef]
  3. European Parliament and the Council. Directive (EU) 2018/2001 of the European Parliament and of the Council of 11 December 2018 on the Promotion of the Use of Energy from Renewable Sources (Recast); EUR-Lex: Brussels, Belgium, 2018. [Google Scholar]
  4. Dinjus, E.; Dahmen, N. Das bioliq®-Verfahren Konzept, Technologie und Stand der Entwicklung. Mot. Z. 2010, 71, 864–868. [Google Scholar] [CrossRef]
  5. Dahmen, N.; Dinjus, E.; Kolb, T.; Arnold, U.; Leibold, H.; Stahl, R. State of the art of the bioliq® process for synthetic biofuels production. Environ. Prog. Sustain. Energy 2012, 31, 176–181. [Google Scholar] [CrossRef]
  6. Dahmen, N.; Abeln, J.; Eberhard, M.; Kolb, T.; Leibold, H.; Sauer, J.; Stapf, D.; Zimmerlin, B. The bioliq® process for producing synthetic transportation fuels. WIREs Energy Environ. 2017, 6, 425. [Google Scholar] [CrossRef]
  7. Keil, F.J. Methanol-to-hydrocarbons: Process technology. Microporous Mesoporous Mater. 1999, 29, 49–66. [Google Scholar] [CrossRef]
  8. Eckert, P.; Eichlseder, H.; Rakowski, S.; Tschöke, H. Brennstoffe. In Grundlagen Verbrennungsmotoren; Merker, G.P., Teichmann, R., Eds.; Springer Fachmedien Wiesbaden: Wiesbaden, Germany, 2019; Volume 1, pp. 541–573. [Google Scholar] [CrossRef]
  9. Karavalakis, G.; Short, D.; Vu, D.; Russell, R.; Hajbabaei, M.; Asa-Awuku, A.; Durbin, T.D. Evaluating the Effects of Aromatics Content in Gasoline on Gaseous and Particulate Matter Emissions from SI-PFI and SIDI Vehicles. Environ. Sci. Technol. 2015, 49, 7021–7031. [Google Scholar] [CrossRef]
  10. Michler, T.; Wippermann, N.; Toedter, O.; Niethammer, B.; Otto, T.; Arnold, U.; Pitter, S.; Koch, T.; Sauer, J. Gasoline from the bioliq® process: Production, characterization and performance. Fuel Process. Technol. 2020, 206, 106476. [Google Scholar] [CrossRef]
  11. Said, Z.; Le, D.T.N.; Sharma, P.; Dang, V.H.; Le, H.S.; Nguyen, D.T.; Bui, T.A.E.; van Nguyen, G. Optimization of combustion, performance, and emission characteristics of a dual-fuel diesel engine powered with microalgae-based biodiesel/diesel blends and oxyhydrogen. Fuel 2022, 326, 124987. [Google Scholar] [CrossRef]
  12. Sharma, P.; Le, M.P.; Chhillar, A.; Said, Z.; Deepanraj, B.; Cao, D.N.; Bandh, S.A.; Hoang, A.T. Using response surface methodology approach for optimizing performance and emission parameters of diesel engine powered with ternary blend of Solketal-biodiesel-diesel. Sustain. Energy Technol. Assessments 2022, 52, 102343. [Google Scholar] [CrossRef]
  13. Park, S.H.; Kim, H.J.; Suh, H.K.; Lee, C.S. Atomization and spray characteristics of bioethanol and bioethanol blended gasoline fuel injected through a direct injection gasoline injector. Int. J. Heat Fluid Flow 2009, 30, 1183–1192. [Google Scholar] [CrossRef]
  14. Das, S.K.; Kim, K.; Lim, O. Experimental study on non-vaporizing spray characteristics of biodiesel-blended gasoline fuel in a constant volume chamber. Fuel Process. Technol. 2018, 178, 322–335. [Google Scholar] [CrossRef]
  15. Brem, B.T.; Durdina, L.; Siegerist, F.; Beyerle, P.; Bruderer, K.; Rindlisbacher, T.; Rocci-Denis, S.; Andac, M.G.; Zelina, J.; Penanhoat, O.; et al. Effects of Fuel Aromatic Content on Nonvolatile Particulate Emissions of an In-Production Aircraft Gas Turbine. Environ. Sci. Technol. 2015, 49, 13149–13157. [Google Scholar] [CrossRef] [PubMed]
  16. Short, D.Z.; Vu, D.; Durbin, T.D.; Karavalakis, G.; Asa-Awuku, A. Components of Particle Emissions from Light-Duty Spark-Ignition Vehicles with Varying Aromatic Content and Octane Rating in Gasoline. Environ. Sci. Technol. 2015, 49, 10682–10691. [Google Scholar] [CrossRef] [PubMed]
  17. Michler, T.; Dörnhöfer, J.; Erforth, D.; Heinz, A.; Scheiber, K.; Weber, P.; Nowak, N.; Kubach, H.; Meyer, J.; Koch, T.; et al. Comparison of Different Particle Measurement Techniques at a Heavy-Duty Diesel Engine Test Bed. In SAE International400 Commonwealth Drive; SAE Technical Paper Series; SAE International: Warrendale, PA, USA, 2019. [Google Scholar] [CrossRef]
  18. Wang, X.; Grose, M.A.; Caldow, R.; Osmondson, B.L.; Swanson, J.J.; Chow, J.C.; Watson, J.G.; Kittelson, D.B.; Li, Y.; Xue, J.; et al. Improvement of Engine Exhaust Particle Sizer (EEPS) size distribution measurement—II. Engine exhaust particles. J. Aerosol Sci. 2016, 92, 83–94. [Google Scholar] [CrossRef]
  19. Plaß, A.; Maliha, M.; Kubach, H.; Koch, T. Spray characterization of DMC and MeFo on multi-hole injectors for highly boosted DISI combustion engines. Int. J. Engine Res. 2021, 6, 146808742110381. [Google Scholar] [CrossRef]
  20. Wen, L.B.; Xin, C.Y.; Yang, S.C. The effect of adding dimethyl carbonate (DMC) and ethanol to unleaded gasoline on exhaust emission. Appl. Energy 2010, 87, 115–121. [Google Scholar] [CrossRef]
  21. Matsumoto, A.; Zheng, Y.; Xie, X.B.; Lai, M.C.; Moore, W. Characterization of Multi-hole Spray and Mixing of Ethanol and Gasoline Fuels under DI Engine Conditions. In SAE International400 Commonwealth Drive; SAE Technical Paper Series; SAE International: Warrendale, PA, USA, 2010. [Google Scholar] [CrossRef]
  22. Zeng, W.; Xu, M.; Zhang, G.; Zhang, Y.; Cleary, D.J. Atomization and vaporization for flash-boiling multi-hole sprays with alcohol fuels. Fuel 2012, 95, 287–297. [Google Scholar] [CrossRef]
  23. Xu, M.; Zhang, Y.; Zeng, W.; Zhang, G.; Zhang, M. Flash Boiling: Easy and Better Way to Generate Ideal Sprays than the High Injection Pressure. SAE Int. J. Fuels Lubr. 2013, 6, 137–148. [Google Scholar] [CrossRef]
  24. Zeng, W.; Xu, M.; Zhang, M.; Zhang, Y.; Cleary, D.J. Macroscopic characteristics for direct-injection multi-hole sprays using dimensionless analysis. Exp. Therm. Fluid Sci. 2012, 40, 81–92. [Google Scholar] [CrossRef]
  25. Hu, J.; Liu, B.; Zhang, C.; Gao, H.; Zhao, Z.; Zhang, F.; Wang, Y. Experimental study on the spray characteristics of an air-assisted fuel injection system using kerosene and gasoline. Fuel 2019, 235, 782–794. [Google Scholar] [CrossRef]
  26. Bertsch, M.; Koch, T.; Velji, A. Influence of charge motion and injection pressure on the particulate emission of a gasoline DI-SI engine at homogeneous, boosted operation. SIA-Société des Ingénieurs de Lautomobile (ed.). In Proceedings of the SIA Powertrain: The Low CO2 Spark Ignition Engine The low CO2 Spark Ignition Engine of the Future and its Hybridization, Versailles, France, 27–28 May 2015. [Google Scholar]
  27. Dageförde, H. Untersuchung Innermotorischer Einflussgrößen auf die Partikelemission eines Ottomotors mit Direkteinspritzung. Ph.D. Thesis, Karlsruhe Institute of Technology, Karlsruhe, Germany, 2015. [Google Scholar] [CrossRef]
  28. Bertsch, M. Experimental Investigations on Particle Number Emissions from GDI Engines. Ph.D. Thesis, Karlsruhe Institute of Technology, Karlsruhe, Germany, 2016. [Google Scholar] [CrossRef]
  29. Wiese, W.; Laidig, C.; Schünemann, E.; Balthasar, F.; Cahal, J. Effects of Fuel Composition, Additives and Injection Parameters on Particulate Formation of Gasoline DI Engines. In Proceedings of the 39th International Vienna Motor Symposium, Vienna, Austria, 26–27 April 2018; Geringer, B., Lenz, H.P., Eds.; VDI Verlag: Düsseldorf, Germany, 2018; Volume 2, pp. 556–574. [Google Scholar] [CrossRef]
  30. Tahtouh, T.; Ben Amara, A.; Anselmi, P.; Starck, L. Impact of Ethanol and Aromatic Hydrocarbons on Particulate Emissions from a Gasoline Vehicle. In SAE International400 Commonwealth Drive; SAE Technical Paper Series; SAE International: Warrendale, PA, USA, 2019. [Google Scholar] [CrossRef]
  31. Fatouraie, M.; Frommherz, M.; Mosburger, M.; Chapman, E.; Li, S.; McCormick, R.; Fioroni, G. Investigation of the Impact of Fuel Properties on Particulate Number Emission of a Modern Gasoline Direct Injection Engine. In SAE International400 Commonwealth Drive; SAE Technical Paper Series; SAE International: Warrendale, PA, USA, 2018. [Google Scholar] [CrossRef]
  32. Leach, F.; Knorsch, T.; Laidig, C.; Wiese, W. A Review of the Requirements for Injection Systems and the Effects of Fuel Quality on Particulate Emissions from GDI Engines. In SAE International400 Commonwealth Drive; SAE Technical Paper Series; SAE International: Warrendale, PA, USA, 2018. [Google Scholar] [CrossRef]
  33. Zhang, W.; Ma, X.; Shuai, S.; Wu, K.; Macias, J.R.; Shen, Y.; Yang, C.; Guan, L. Effect of gasoline aromatic compositions coupled with single and double injection strategy on GDI engine combustion and emissions. Fuel 2020, 278, 118308. [Google Scholar] [CrossRef]
  34. Liu, H.; Li, Z.; Zhang, M.; Xu, H.; Ma, X.; Shuai, S. Exhaust non-volatile particle filtration characteristics of three-way catalyst and influencing factors in a gasoline direct injection engine compared to gasoline particulate filter. Fuel 2021, 290, 120065. [Google Scholar] [CrossRef]
  35. Guo, D.; Ge, Y.; Wang, X.; Liu, H.; Su, S.; Li, C.; Tao, T. Evaluating the filtration efficiency of close-coupled catalyzed gasoline particulate filter (cGPF) over the WLTC and simulated RDE cycles. Chemosphere 2022, 301, 134717. [Google Scholar] [CrossRef] [PubMed]
  36. Fiebig, M.; Schönen, M.; Grütering, U.; Pischinger, S. Einflüsse motorischer Betriebsparameter auf die Reaktivität von Dieselruss. Mot. Z. 2010, 71, 524–531. [Google Scholar] [CrossRef]
  37. Massner, A.; Gärtner, U.; Koch, T. Die Reaktivität von Dieselruß und die Auswirkungen auf den Betrieb von Abgasnachbehandlungssystemen. In Proceedings of the 9 FAD Conference, Ludwigsburg, Germany, 3 October 2011. [Google Scholar]
  38. Yao, C.; Dou, Z.; Wang, B.; Liu, M.; Lu, H.; Feng, J.; Feng, L. Experimental study of the effect of heavy aromatics on the characteristics of combustion and ultrafine particle in DISI engine. Fuel 2017, 203, 290–297. [Google Scholar] [CrossRef]
  39. Qian, Y.; Wang, J.; Li, Z.; Jiang, C.; He, Z.; Yu, L.; Lu, X. Improvement of combustion performance and emissions in a gasoline direct injection (GDI) engine by modulation of fuel volatility. Fuel 2020, 268, 117369. [Google Scholar] [CrossRef]
Figure 1. Composition of bioliq®/100 gasoline from the 2017 and 2019 campaigns according to ASTM D6730-01 (2016). Only compounds with a content above 1 wt . - % are considered.
Fuels 04 00013 g001
Figure 2. Distillation range defined by the EN228 standard and distillation curves of the fuels measured according to DIN EN ISO 3405:2019-09.
Fuels 04 00013 g002
Figure 3. Schematic experimental setup for the spray analysis [19].
Fuels 04 00013 g003
Figure 4. Spray development of the fuels at a rail pressure of 20 M Pa , a fuel temperature of 90 C and a pressure chamber temperature of 40 C , at a chamber pressure of 0.1 M Pa .
Fuels 04 00013 g004
Figure 5. Spray development of the fuels at a rail pressure of 20 M Pa , a fuel temperature of 90 C and a pressure chamber temperature of 40 C , at a chamber pressure of 0.25 M Pa .
Fuels 04 00013 g005
Figure 6. Penetration length of the 2019 fuels at a rail pressure of 20 M Pa , a fuel temperature of 90 C and a pressure chamber temperature of 40 C , at (a) a chamber pressure of 0.1 M Pa ; (b) a chamber pressure of 0.25 M Pa . The error bars indicate the standard deviation of each measurement.
Fuels 04 00013 g006
Figure 7. Projected spray area of the 2019 fuels at a rail pressure of 20 M Pa , a fuel temperature of 90 C and a pressure chamber temperature of 40 C , at (a) a chamber pressure of 0.1 M Pa ; (b) a chamber pressure of 0.25 M Pa . The error bars indicate the standard deviation of each measurement.
Fuels 04 00013 g007
Figure 8. Normalized total particulate number concentration in dependency of the injection timing at an IMEP of 0.5 M Pa (a) and 0.8 M Pa (b). The error bars are indicating the standard deviation of each measurement.
Fuels 04 00013 g008
Figure 9. Particulate size distribution at minimum total particulate number concentration at (a) IMEP 0.5 M Pa and an SOI of 320 ° CAbTDCf ; (b) IMEP 0.8 M Pa and an SOI of 310 ° CAbTDCf .
Fuels 04 00013 g009
Figure 10. Normalized hydrocarbon concentration in dependency of the injection timing at an IMEP of 0.5 M Pa (a) and 0.8 M Pa (b). The errors bars indicate the measurement uncertainty of the FID used.
Fuels 04 00013 g010
Table 1. Fuel properties of the base fuel and different blends.
PropertyUnitRON95 E5 2017bioliq®/10 2017RON95 E5 2019bioliq®/10 2019bioliq®/30 2019EN228 LimitsMethod Used
RON-95.696.495.196.097.2>95.0DIN EN ISO 5164:2014
MON-85.585.585.285.586.1>85.0DIN EN ISO 5163:2014
Density at 15 C k g / m 3 740.6747.0747.5751.7772.2720.0–775.0DIN EN ISO 12185:1997
End of boiling curve C 199.5196.9197.1197.1190.2<210.0DIN EN ISO 3405:2011
Distillation residue vol . - % 0.81.10.70.81.0<2.0DIN EN ISO 3405:2011
Vapor pressure k Pa 63.874.156.453.349.245.0–90.0DIN EN 13016-1:2018
Sum oxygen wt . - % 1.91.81.91.6<1.5<2.7DIN EN ISO 22854:2016
Sum aromatics wt . - % 36.538.737.141.450.4<42.0DIN EN ISO 22854:2016
Table 2. Engine data.
PropertyValue
Displaced volume/ cm 3 498
Stroke/ m m 90
Bore/ m m 84
Compression ratio/-10.5:1
Injection systemCentral-mounted DI
Rail pressure/ MPa 20
Disclaimer/Publisher’s Note: The statements, opinions and data contained in all publications are solely those of the individual author(s) and contributor(s) and not of MDPI and/or the editor(s). MDPI and/or the editor(s) disclaim responsibility for any injury to people or property resulting from any ideas, methods, instructions or products referred to in the content.

