Article

Standard-Compliant Gasoline by Upgrading a DTG-Based Fuel through Hydroprocessing the Heavy-Ends and Blending of Oxygenates

Division of Fuel Technology (EBI-ceb), Engler-Bunte-Institute, Karlsruhe Institute of Technology (KIT), Engler-Bunte-Ring 1a, 76131 Karlsruhe, Germany
*
Author to whom correspondence should be addressed.
Fuels 2023, 4(2), 156-173; https://doi.org/10.3390/fuels4020010
Submission received: 27 January 2023 / Revised: 5 March 2023 / Accepted: 24 March 2023 / Published: 12 April 2023
(This article belongs to the Special Issue Advances in Synthetic Fuel)

Abstract

:
Methanol-to-gasoline (MTG) and dimethyl ether-to-gasoline (DTG) fuels are rich in heavy aromatics such as 1,2,4,5-tetramethylbenzene, resulting in low volatilities due to a lack of light ends, increased emission tendencies and drivability problems due to crystallization. Approaches addressing these issues mainly focus on single aspects or are optimized for petroleum-based feedstocks. This research article introduces an upgrading strategy for MTG and DTG fuels through hydroprocessing (HP) heavy-ends and applying a sophisticated blending concept. Different product qualities were prepared by HP heavy gasoline (HG) and Fischer-Tropsch wax using commercially available Pt/HZSM-5 and Pt/SAPO-11 catalysts in a fixed-bed reactor. The products were used for blending experiments, focusing on gasoline volatility characteristics. Accordingly, methanol, ethanol, methyl tert-butyl ether (MTBE), and ethyl tert-butyl ether (ETBE) were evaluated in a second blending experiment. The results were finally considered for preparing blends meeting EN 228. HP of HG was found to improve the amount of light-ends and the vapor pressure of the DTG fuel with increasing reaction temperature without, however, satisfying EN 228. The front-end volatility was further improved by blending methanol due to the formation of near-azeotropic mixtures, while ethyl tert-butyl ether (ETBE) considerably supported the mid-range volatility. A final blend with an alcohol content of less than 3 vol.%, mostly meeting EN 228, could be provided, making it suitable even for older vehicles.

Graphical Abstract

1. Introduction

The global climate crisis and its increasingly reported repercussions have caused a rethinking regarding the urgency of transforming the economy and society toward increasing sustainability. With the Green Deal, the European Union (EU) set the framework for complete greenhouse gas (GHG) neutrality by 2050 by focusing on the sustainable use of raw materials while preserving biodiversity [1]. In 2021, the European Commission presented the “Fit for 55” action plan to reduce the EU’s GHG emissions by at least 55% until 2030 compared to 1990 [2]. This legislative overhaul recommends a broad package of measures for the traffic and transportation sectors. One major proposal is to cut the carbon emissions of newly registered cars by 100% until 2035 compared to 2021. In June 2022, the European member states’ environmental ministers supported to ban the sale of CO2-emitting cars and light-duty vehicles by 2035 [3], which was later approved by the EU [4]. A ban, however, is not tantamount to the sudden disappearance of vehicles relying on hydrocarbon fuels. The EU might work out rules for using vehicles powered with carbon-neutral fuels [3,5].
While the role of synthetic fuels compared with technologies such as electrification is controversial, their contribution as a bridging technology is essential to reach the ambitious climate targets set by the EU. Registration rates of new cars with alternative drive technologies are still modest nowadays. In 2021, Europe and China, as the fasted growing markets for electromobility, counted 17% and 16%, respectively, for sales of electric and plug-in-hybrid vehicles [6]. Additionally, the medium age of a car is about twelve years on European roads [7]. Consequently, the number of vehicles relying on hydrocarbon fuels will gradually reduce over the coming decades. A more extended period can be expected internationally. Volkswagen, for instance, announced to stop selling internal combustion engines by 2035 in Europe, somewhat later, however, in countries such as the United States or China [8]. An even more distinct situation is emerging in sectors that are not easily electrified, i.e., aviation and maritime transport. Long-distance transport requires energy carriers with high energy densities, unrivaled provided by liquid hydrocarbons. Altogether, this leaves the necessity for developing supply concepts for renewable synthetic fuels that meet the applicable standards.
To date, the highest renewable share in the fuel market is covered by blending biogenic ethanol [9]. However, the share of bio-ethanol in gasoline can only be increased with limitations. Ethanol can lead to corrosion problems of engine parts [10,11], for example, the fuel injection delivery system [12]. Furthermore, blending rates of alcohol might result in the swelling or stiffening of polymeric materials, as used for O-rings and hoses [10,11]. Therefore, vehicles must be suitable for blends with high shares of ethanol or must be modified. The mentioned issues limit the potential impact of alcohol–gasoline blends, as a large share of the fleet is left out due to incompatibility. Besides blending single oxygenates, there is the approach to replace fossil gasoline with a renewable gasoline-like synthetic hydrocarbon mix. The clear advantage is that a vehicle’s engine does not need to be modified, as synthetic fuels are chemically similar and meet the required standard. Therefore, such an approach provides a solution for all systems relying on fossil gasoline. Processes for the synthesis of hydrocarbons in the boiling range of gasoline are the Fischer–Tropsch (FT) synthesis, the methanol-to-gasoline (MTG) synthesis, and the further developed dimethyl ether (DME)-to-gasoline (DTG) synthesis. Porsche, Siemens Energy, and Exxon Mobil, for example, invested in an MTG plant in Punta Arenas, Chile commissioned in December 2022 [13]. During the pilot phase, the plant is expected to produce 130,000 liters per year, which shall be scaled up to 550 mil liters per year within the last years of this decade.
These processes, however, do not directly produce standard-compliant gasoline and consequently require an after-treatment and sophisticated blending concept. This paper presents an after-treatment and blending route based on a DTG process to provide gasoline with a high renewable share, which can replace fossil gasoline without constraints. We first discuss the requirements of EN 228 and highlight the challenges to meeting the standard. In this regard, we show that hydroprocessing (HP) can help to convert heavy-ends into low-boiling blending components. We further discuss ways in which a deliberated combination of oxygenates plays a major role in adjusting the boiling characteristics. Finally, we present and discuss a blend and its petrochemical parameters, which can be easily implemented based on an MTG or DTG synthesis and a regular blending infrastructure.

1.1. Requirements for Synthetic Gasoline to Meet EN 228

The use of fuels in internal combustion engines is linked to compliance with standards such as EN 228 for gasoline in Europe [14]. Fossil and renewable fuels are subject to the same regulations. In recent years, the government released directives to increase the renewable share of gasoline. An increase in renewables is, for example, notable by an increased oxygen content of up to 3.7 wt.% of O2-equivalent in EN 228. Ethanol is the most common blended oxygenate in gasoline, as it is accessible via biological fermentation using sugar-containing feedstocks [15,16]. Further oxygenates such as ethers possessing five or more carbon atoms and higher alcohols are also permitted. Certain concentration limits apply to the various oxygenates, but these must not exceed the 3.7 wt.% O2-equivalent already mentioned. Additional discussions on the pros and cons of oxygenates are offered in the following chapters. Besides an increased renewable share, oxygenates are blended due to their high octane numbers (ONs) [17]. The ON is essential because it is directly linked to a gasoline’s market price [18] and is crucial for the engine’s performance and efficiency. With the ON, the propensity of the fuel to resist auto-ignition when the fuel/air mixture is compressed within a spark ignition engine is expressed [19]. A higher ON allows for an increased compression ratio, hence a higher thermal efficiency [20]. Several definitions for the ON exist, of which the research octane number (RON) and motor octane number (MON) are applied within EN 228. The RON represents a drive under mild conditions, whereby the MON is measured under severe conditions, as it is to expect, for example, on a climb with a high load and increased engine speed [21,22]. Besides oxygenates, aromatics are used to adjust the ON [9]. However, aromatics tend to increase engine-out hydrocarbons [23,24] and to form soot [25], wherefore their concentration is limited to 35 vol.% in EN 228. Besides RON and MON, the volatility of gasoline is of particular importance. In EN 228, the volatility is provided in terms of the boiling curve and vapor pressure. The boiling curve is defined by the evaporation characteristics E70, E100, and E150, representing the volume fractions evaporated at 70 °C, 100 °C, and 150 °C, respectively, and the final boiling point (FBP). As high ambient temperatures result in environmental issues due to the evaporation of highly volatile substances, which contribute to atmospheric pollution [26], the E70 has to stay within a certain range, which varies slightly depending on the time of the year. The front-end volatility is further important to ensure good cold-starting [18,27,28] and to assess the potential vapor lock under hot weather conditions [27]. The mid-range volatility (E100) is related to the cold weather performance and a hot engine’s operational readiness and acceleration behavior under load [27]. The end-point volatility (E150 and FBP) is important to ensure a good fuel economy after engine warm-up, minimum engine deposits, fuel dilution of oil, and emissions of volatile organic hydrocarbons [27,28]. Automotive manufacturers usually demand fuels whose FBP is below the maximum value of 210 °C defined in EN 228, as large molecules tend to form soot [29]. The vapor pressure pv is closely connected to the boiling curve and regulated in EN 228. As roughly proportional to the losses by evaporation, a high vapor pressure contributes to pollution [30], while a low one negatively influences cold start conditions [31]. It is also reasonable that low vapor pressures contribute to increased particle emissions due to diffusion combustion, as it bears an additional risk of condensation in the combustion chamber [32]. Consequently, the vapor pressure has to stay within a certain range depending on the time of the year. Finally, the gasoline density ρ must comply with EN 228, which is usually the case if the other parameters meet EN 228.

1.2. Synthesis Gas-Based Renewable Gasoline Supply and Associated Challenges

Well-investigated processes for the supply of synthetic gasoline are the FT, MTG, and DTG synthesis. These processes are based on syngas, which can be provided on a biomass basis by gasification or using renewable electric energy.

1.2.1. Fischer–Tropsch

FT was developed in the 1920s and is a synthesis route based on Co or Fe catalysts for producing linear paraffins, olefins, and oxygenates from syngas via a polymerization reaction [33]. The high-temperature FT is best suited for producing liquid hydrocarbons in the gasoline boiling range. It was successfully demonstrated in 1989 and commercialized under the Sasol Advanced Synthol (SAS) process [34,35]. With a carbon selectivity of 48%, the process produces gasoline and diesel in a ratio of 3:1, both rich in olefins [35]. However, further downstream processing is inevitable to increase the ON due to the low degree of olefin branching and low aromatic content [36].
FT in its low-temperature variant (LTFT) is applied to synthesize high-quality diesel [37]. LTFT is furthermore discussed for producing kerosene from syngas [38]. The German Federal Ministry for the Environment, Nature Conservation, Nuclear Safety and Consumer Protection (BMUV) aims with its power-to-liquid (PTL) roadmap for a ramp-up to at least 200,000 t a−1 of PTL kerosene by 2030 [39], underlining the perspective of processes like LTFT. Besides diesel and kerosene, LTFT yields a certain amount of waxes due to the underlying chain growth mechanism [40]. Downstream hydrocracking of waxes is usually considered to increase kerosene yields and obtain valuable iso-paraffins that meet the freezing point requirements for Jet A-1 [38]. Hydrocracking of waxes also yields iso-paraffins in the gasoline boiling range, which show similar properties to fossil isomerate (see also Section 2).
This study discusses the ways in which gasoline from hydrocracking of waxes can be used as a valuable isomerate replacement.

1.2.2. Methanol and Dimethyl Ether to Gasoline

In the 1970s, Chang and Silvestri (MobilOil) discovered a synthesis route of high-octane gasoline from methanol using a zeolite catalyst [41]. A complex reaction network of aromatics methylation and subsequent cracking yields paraffins, naphthenes, olefins, and mono-ring aromatics [42]. The product spectrum strongly depends on the zeolite topology and aromatic species trapped therein [43]. MTG and DTG processes are usually catalyzed using an HZSM-5 zeolite as it produces hydrocarbons in the desired boiling range and possesses superior stability against coking [42]. The first commercial MTG plant was commissioned in New Zealand by Mobil in 1985, which supplied approx. 33% of the country’s gasoline needs [44]. Other plants were brought into operation, e.g., in Shanxi, China in 2009 [42].
Haldor Topsøe was the first company to demonstrate the feasibility of direct DME synthesis as part of a 1 t d−1 plant for the production of synthetic gasoline [45]. DTG combines methanol synthesis and subsequent DME formation in one reactor. The integrated synthesis increases process efficiency and lowers investment costs, as no methanol isolation is required [42]. Since then, much effort has been made in further developing the DTG synthesis. The bioliq® demonstration plant was commissioned in 2014 [46,47]. A decentralized biomass fast pyrolysis is used to increase the energy density of the feedstock significantly [48,49]. The so-called biosyncrude® is then transported and fed to a centralized entrained flow gasifier where syngas free of tar is produced [50]. After several gas conditioning steps, the syngas is fed to a direct DME synthesis [51,52], followed by a DTG reactor [53].
This study shows that DTG synthesis such as the bioliq® process can be used to supply high-quality gasoline and highlights remaining challenges with potential solutions. It is important to note that MTG and DTG provide similar gasoline compositions [54]. Therefore, considerations made within this work apply to both process variants.

1.2.3. Suitability of MTG and DTG for Providing Drop-In and Stand-Alone Fuels

Recently, the suitability of synthetic DTG fuel as a drop-in was demonstrated. Michler et al. could successfully blend 10 vol.% of bioliq® gasoline into conventional E95 [55]. However, in their experiments, the aromatic concentration reached 33 vol.% with a relatively low drop-in rate. The high aromatic content resulted in limited direct applicability, as the blend must meet a maximum concentration of 35 vol.% according to EN 228 [14]. Additionally, the fuel had to be separated into light gasoline (LG) and heavy gasoline (HG) to get rid of 1,2,4,5-tetramethylbenzene (durene) as part of the HG. Durene is the largest aromatic hydrocarbon emerging in significant quantities due to the underlying mechanism in the methanol-to-hydrocarbon reaction [56]. Due to its symmetry, it has a high melting temperature of 79 °C and tends to crystallize, which can clog fuel injection systems or cause drivability problems [42]. Michler et al. only used the LG for their blending experiments. As a result, valuable bio-based hydrocarbons are left out, which directly affects the economics of the underlying process. In the conducted engine tests, the blend showed significantly increased particle emissions compared to the pure E95 since high molecular aromatics in general form soot [57,58]. Therefore, a sophisticated after-treatment is necessary, which allows the use of the entire product but also reduces the aromatic content. Mobil also recognized this problem originating from the heavy aromatics and decided to split the product into LG and HG for their fixed bed MTG process in New Zealand and the pilot-scale fluidized bed version [59]. The HG was forwarded to a treatment reactor where the durene concentration could be lowered below 2 wt.% and was subsequently blended back into the LG. The HG treatment was developed to improve issues resulting from durene but neglected emission issues related to heavy aromatics. In an earlier study, we converted HG from the bioliq® process into highly isomerized paraffins and naphthenes by HP using a 0.3 wt.% Pt/HZSM-5 catalyst and conducted blending experiments [60]. The combination of noble metals with zeolites gained much attention for processing biomass(-derivatives) due to superior shape selectivity coupled with an increased hydrogenation activity [61]. As a result, the aromatic concentration could be significantly lowered while simultaneously improving petrochemical parameters. The suitability as drop-in fuel was greatly improved, but a stand-alone DTG fuel could not be achieved. Especially the E70 and E100 were significantly too low and needed to be addressed further.
In the present study, we highlight HP from a blending perspective, as the process was already discussed previously [60]. We produced three fuel qualities and investigated their influence on gasoline volatility in blending experiments.

1.3. The Potential of Oxygenates in Blending and Associated Challenges

Oxygenates are interesting blending components as they possess superior ONs and high renewable shares. Table 1 shows petrochemical parameters and properties of oxygenates permitted within EN 228 [20,62,63,64,65]. Methanol, ethanol, methyl tert-butyl ether (MTBE), and ethyl tert-butyl ether (ETBE) are considered in this study due to their low boiling temperatures of well below 100 °C.
Ethanol is mainly produced by fermentation and thus comes with a renewable share of 100% [15]. The methanol synthesis is a well-established syngas-based process, which can be sustainably operated by using biomass or renewable electrical energy [66]. MTBE and ETBE are produced based on methanol and ethanol, respectively. To the authors’ best knowledge, there is no process commissioned for the renewable synthesis of iso-butene yet, which is also required for the synthesis. Therefore, MTBE and ETBE have a renewable share of 35.1 wt.% and 44.1 wt.%, respectively, the one of ETBE being higher as the molecular contribution of ethanol is higher compared to the one of methanol.
Oxygenates in general reduce emissions of incomplete combustion, i.e., CO and hydrocarbons, by the so-called “leaning effect”, which means a replacement of high-sooting hydrocarbons by less-sooting oxygenates [67]. Oxygenates can further help to reduce soot formation, which is one main reason for reduced life expectancy worldwide [68]. However, the physical properties of oxygenates also bear a risk of increased soot formation. Table 1 shows the heat of vaporization (HoV) for the prior discussed oxygenates. Small alcohols such as methanol and ethanol possess high HoVs compared to MTBE and ETBE, which have HoVs in the gasoline range. When the fuel/air mixture is loaded into the combustion chamber and evaporates, a high HoV results in the charge-cooling effect [69]. Charge-cooling improves knocking resistance as the fuel/air mixture’s temperature is reduced, which is, in general, positive [70]. However, charge-cooling might lead to disadvantages for existing engines, e.g., increased emissions for aromatic-rich fuels [63,71]. Oxygenates with high HoVs delay the evaporation of the fuel, which might result in the impingement of the spray with the cylinder walls or the piston top, resulting in fuel-rich combustion [69] and, consequently, the formation of particulate matter [72]. Additionally, alcohols are associated with an increased vapor pressure and depression of the front end of the boiling curve due to the formation of positive azeotropic mixtures with hydrocarbons [65]. A high vapor pressure leads to increased evaporative emissions and a request after more expensive high-boiling blending fractions such as reformate in place of cheaper ones such as butane [18]. Due to their carbon-rich structure, ethers do not form azeotropic mixtures with hydrocarbons and therefore blend similarly to hydrocarbons [73]. MTBE and ETBE have boiling temperatures below 100 °C, hence are known to alter the mid-section of a gasoline’s boiling curve [65]. As shown in Table 1, MTBE and ETBE can be blended in higher ratios than methanol, and ethanol until EN 228′s limit of 3.7 wt.% is reached due to their lower oxygen content. While methanol and ethanol have a molecular oxygen content of 49.9 wt.% and 34.7 wt.%, MTBE and ETBE only come with 18.2 wt.% and 15.7 wt.%, respectively.
The present study examines the extent to which the mentioned oxygenates can improve the volatility of a DTG fuel to meet EN 228. Careful balancing must be observed in the case of alcohols, as a high blending rate carries the risk of emission issues and may limit applicability in older vehicles. However, a certain azeotropic effect might be beneficial as the considered DTG base fuel is of heavy nature and fossil butane as a volatility booster shall not be considered.

2. Materials and Methods

Table 2 lists the petrochemical parameters of bioliq® LG and hydrocarbon fractions originating from the HP of bioliq® HG (HG-HP) and FT wax (FT-HP), as used for the blending experiments in this study.
The compositions of all samples were measured with a Reformulyzer M4 from AC PAC (Houston, TX, USA) and can be found in the Supplementary Materials in Tables S1–S5. Figure 1 shows the boiling curves, measured according to ASTM D7345 [74] using an OptiPMD from PAC. Each boiling curve is measured with a resolution of 1 vol.% and depicted as a solid line for clearness reasons. The boiling curve is further used to calculate the boiling characteristics E70, E100, and E150.
For the reasons discussed in the Introduction, bioliq® raw gasoline was rectified, yielding LG and HG (for composition, see Tables S1 and S6 in the Supplementary Materials) in a ratio of 2:1. The LG, with an FBP of 163.0 °C, is free of C10 aromatics such as durene. Due to its high C7 and C8 aromatic content (16.0 vol.% toluene, 43.1 vol.% C8 aromatics, 16.3 vol.% C9 aromatics) resulting in a high ON, the LG is considered a valuable blending component. It has to be mentioned that the gasoline slightly differs from the one used for our last publication [60] due to variations in the bioliq® synthesis and rectification. However, the challenges remain the same. Significant derivations of 20.9 vol.% and 38.0 vol.% compared to EN 228 can be seen for E70 and E100, respectively. Thus, bioliq® LG lacks a significant amount of light boiling components with temperatures up to 100 °C. The heavy nature of the bioliq® LG is also reflected in the relatively flat boiling curve shown in Figure 1. Following the procedure described in our earlier study [60], the bioliq® HG was hydroprocessed at 270 °C, 310 °C and 330 °C using a 0.3 wt.% Pt/HZSM-5 catalyst in a fixed bed reactor. The final blending components were obtained by rectification to an FBP slightly above 160 °C. Depending on the reaction temperature, the HP experiments were either conducted under hydrogenation or hydrocracking conditions yielding streams rich in naphthenes and paraffins. In Table 2, it can be seen that E70, E100, and E150 increase significantly from 0 vol.% to 14.7 vol.%, 1.2 vol.% to 37.6 vol.% and 39.5 vol.% to 81.7 vol.%, respectively, for the process temperature increased from 270 °C to 330 °C. In Figure 1, the improvement of the boiling characteristics also can be seen as the front end of the boiling curve is further depressed as the reaction temperature increases.
For an HP temperature of 270 °C, the boiling curve lies above the one of bioliq® LG because the reaction was carried out in the hydrogenation regime where cracking reactions were strongly suppressed. Therefore, the product is rich in heavy C9 and C10 naphthenes, having boiling temperatures of approx. 140–155 °C.
RON and MON were determined using an OptiFuel from PAC. The device’s method was extended by training the underlying model with a data set obtained from a frequently inspected Cooperative Fuel Research (CFR) test engine at PetroLab in Speyer, Germany. RON and MON could be predicted using a held-back validation data set with an accuracy of ±2.7 and ±1.0, respectively. Interestingly, the MONs are higher than the RONs for HG hydroprocessed at 270 °C and 310 °C, and both are equal for an HP temperature of 330 °C. Comparably high MONs are detected due to the high content of naphthenes, which was already reported in our previous work [60]. The difference between MON and RON decreases for higher reaction temperatures as the paraffin content increases due to intensified cracking reactions. The comparably high MONs are of interest as blending could result in gasoline having a lower octane sensitivity (difference of RON and MON), which provides higher reliability under different driving conditions [73].
The FT gasoline was produced by HP of wax, as described in our early publication [75]. Neuner et al. studied the production of high-quality pharmaceutical oils from low-valuable FT wax using a 0.3 wt.% Pt/SAPO-11 catalyst. Besides the desired oil, 10–20 wt.% of highly isomerized paraffinic gasoline was produced. As no laboratory FT synthesis in the required scale was available, wax from SASOL (Sandton, South Africa) was used for simulating a potentially GHG-neutral FT wax. The FT gasoline was rectified to an FBP of approx. 168 °C. Due to its high paraffinic content and high content of light-ends, it can be most likely compared to fossil isomerate [65,73]. The main difference is a comparably lower ON and a higher FBP of the FT gasoline.
In addition to the mentioned hydrocarbon streams, methanol (≥99.5%, VWR chemicals, Radnor, PA, USA), ethanol (99.95%, VWR chemicals), MTBE (≥99.0%, Merck, Darmstadt, Germany), and ETBE (77.7 vol.%, Mineralölraffinerie Oberrhein, Karlsruhe, Germany) were used for the blending experiments. ETBE was provided by Mineralölraffinerie Oberrhein, Germany from an industrial scale plant in operation, therefore having approx. 22 vol.% by-products, mainly iso-butene (10.5 vol.%) and pentane (6.5 vol.%).
An HVP 972 from Herzog PAC (Houston, TX, USA) was used for measuring the vapor pressure at 37.8 °C according to ASTM D6378 [76]. The density was measured with a density meter Excellent D5 from Mettler Toledo (Columbus, OH, USA) using a self-developed method.
For the blending experiments, the share of each compound or fraction was calculated on a volume basis, as most of the petrochemical parameters listed in EN 228 are given as volume fractions. However, due to the higher precision of weighting, we measured the density of each fraction or substance at 20 °C and calculated the mass required for a given volume.
All measurements were repeated whenever possible and were statistically evaluated according to the student’s t-distribution, assuming a 95% confidential interval.

3. Results and Discussion

As mentioned, we distilled the bioliq® raw gasoline and hydroprocessed the HG according to our previous study [60] at different reaction temperatures. In the following, we discuss the ways in which HP can help to improve the blending volatility characteristics, especially E70 and E100. We also investigate the ways in which oxygenates might help to further improve the boiling characteristics. Finally, we examine if a blend with a high renewable share while meeting the petrochemical parameters of EN 228 can be provided.

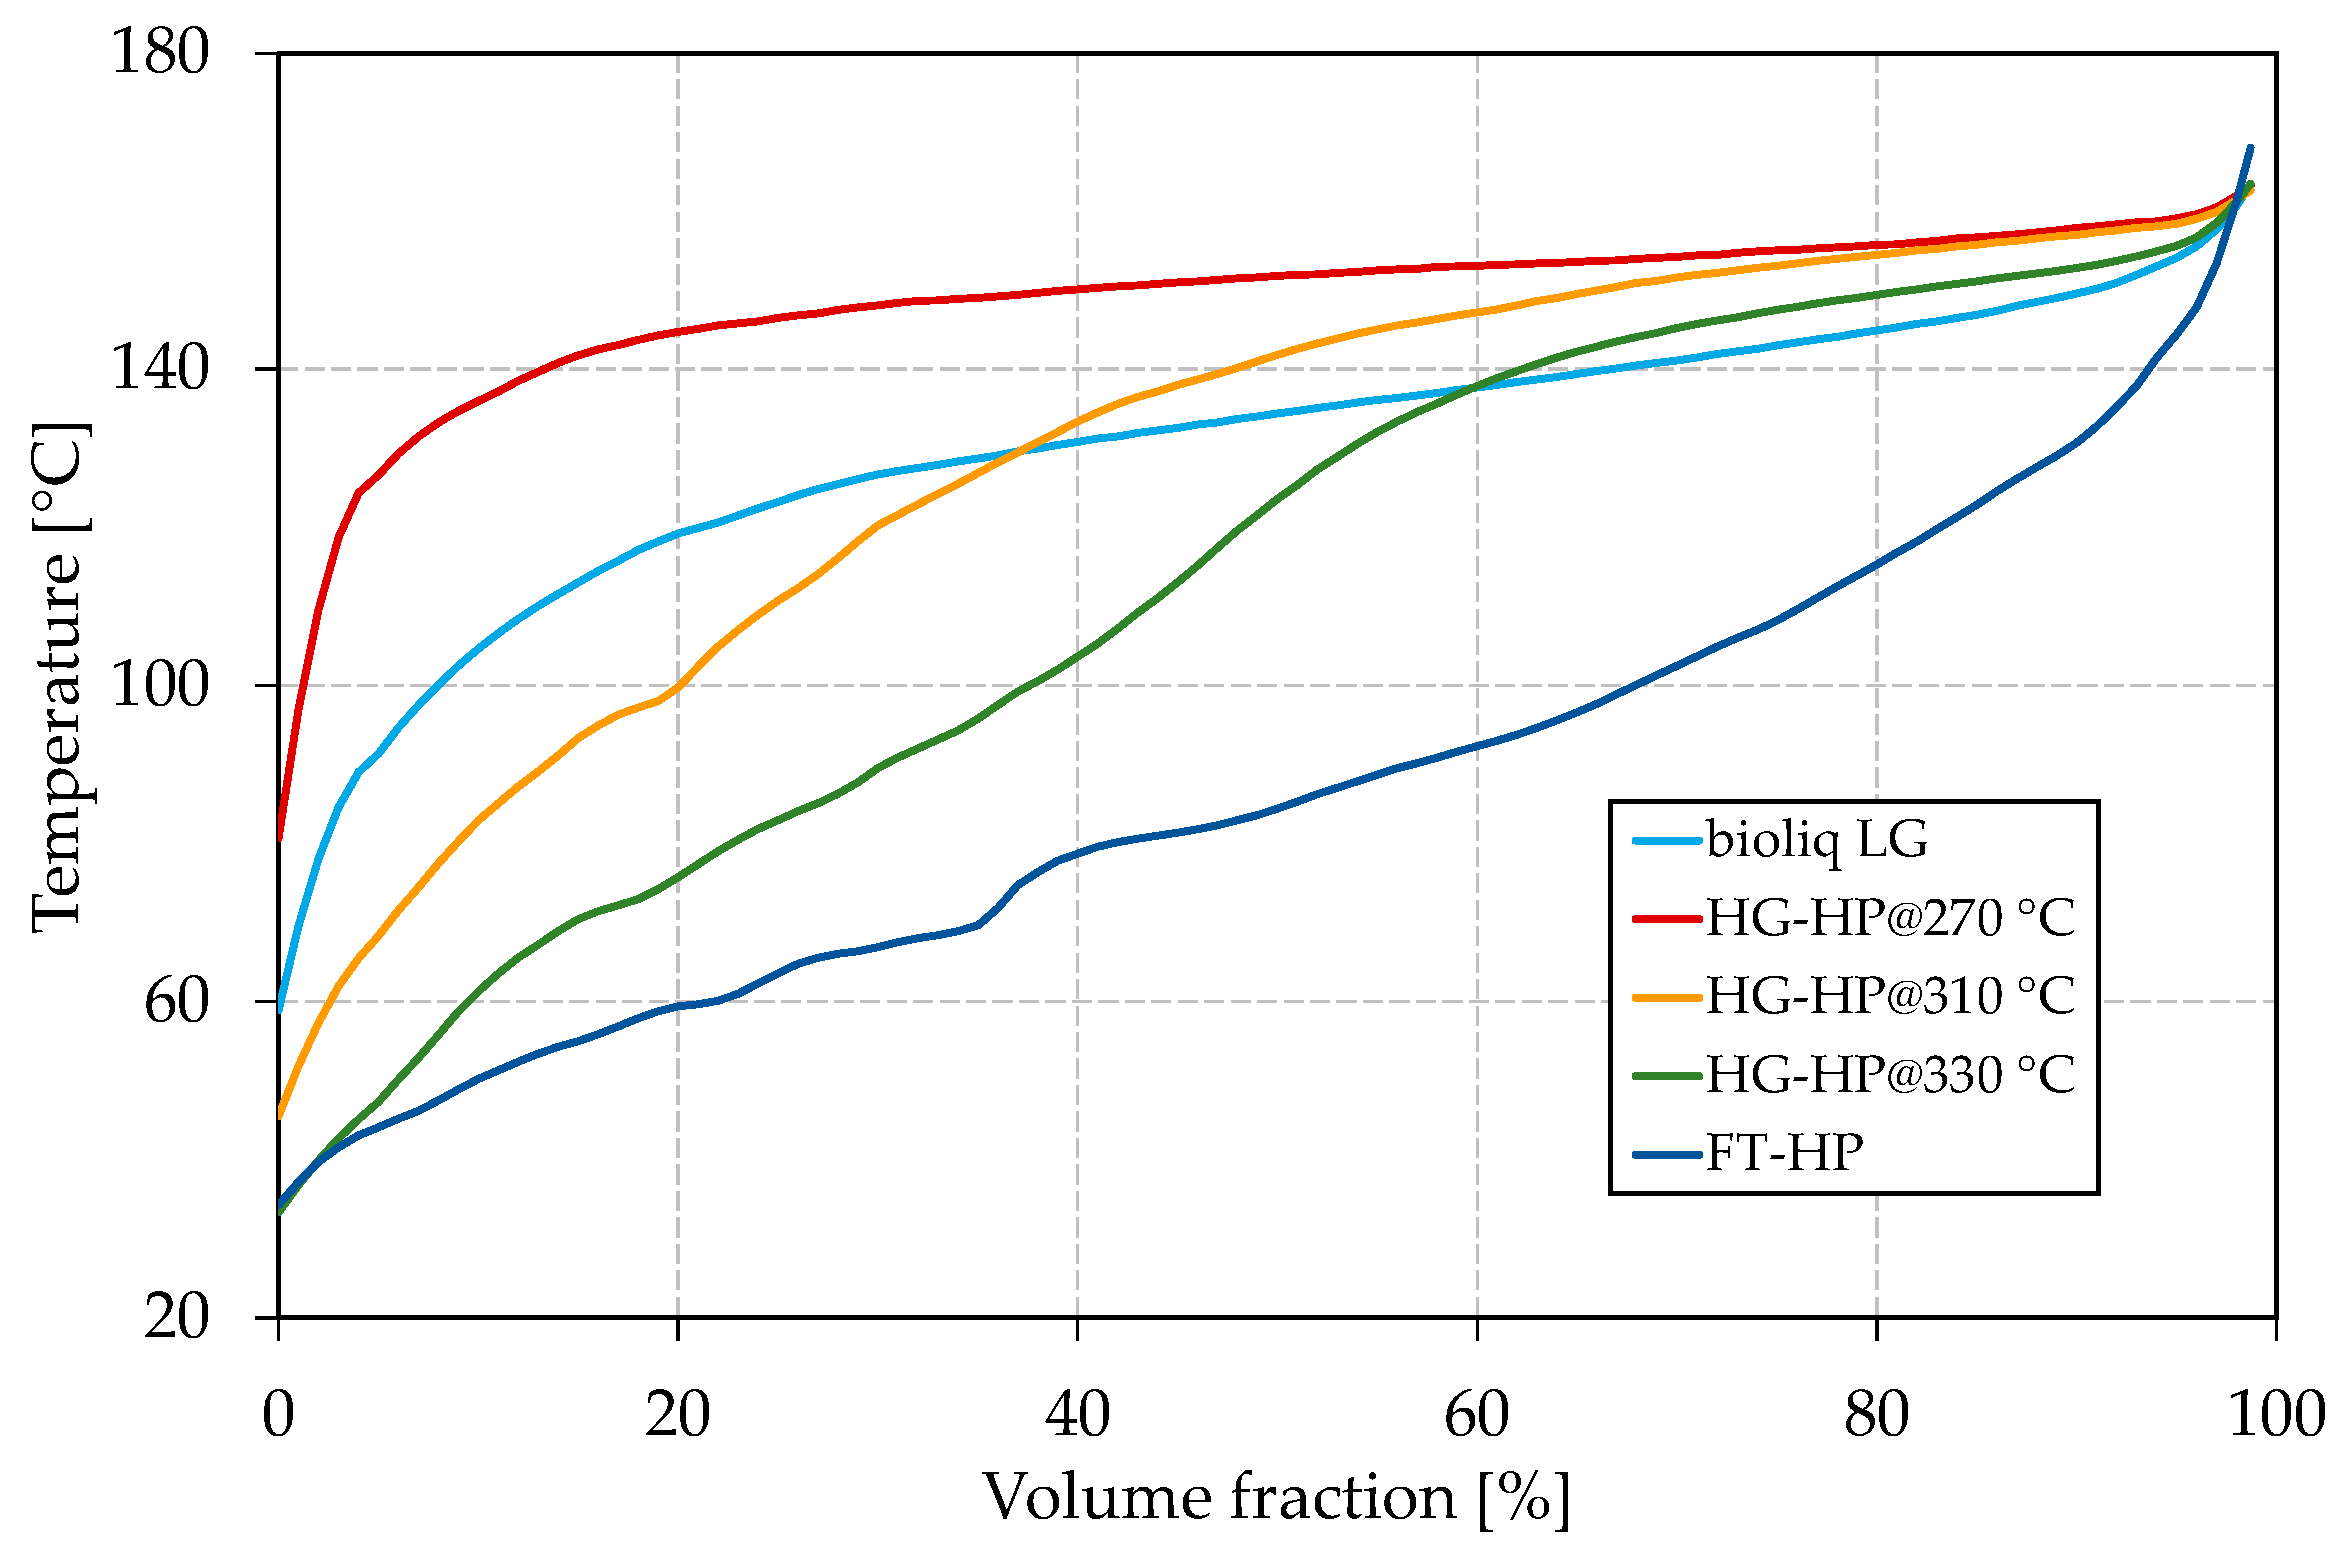
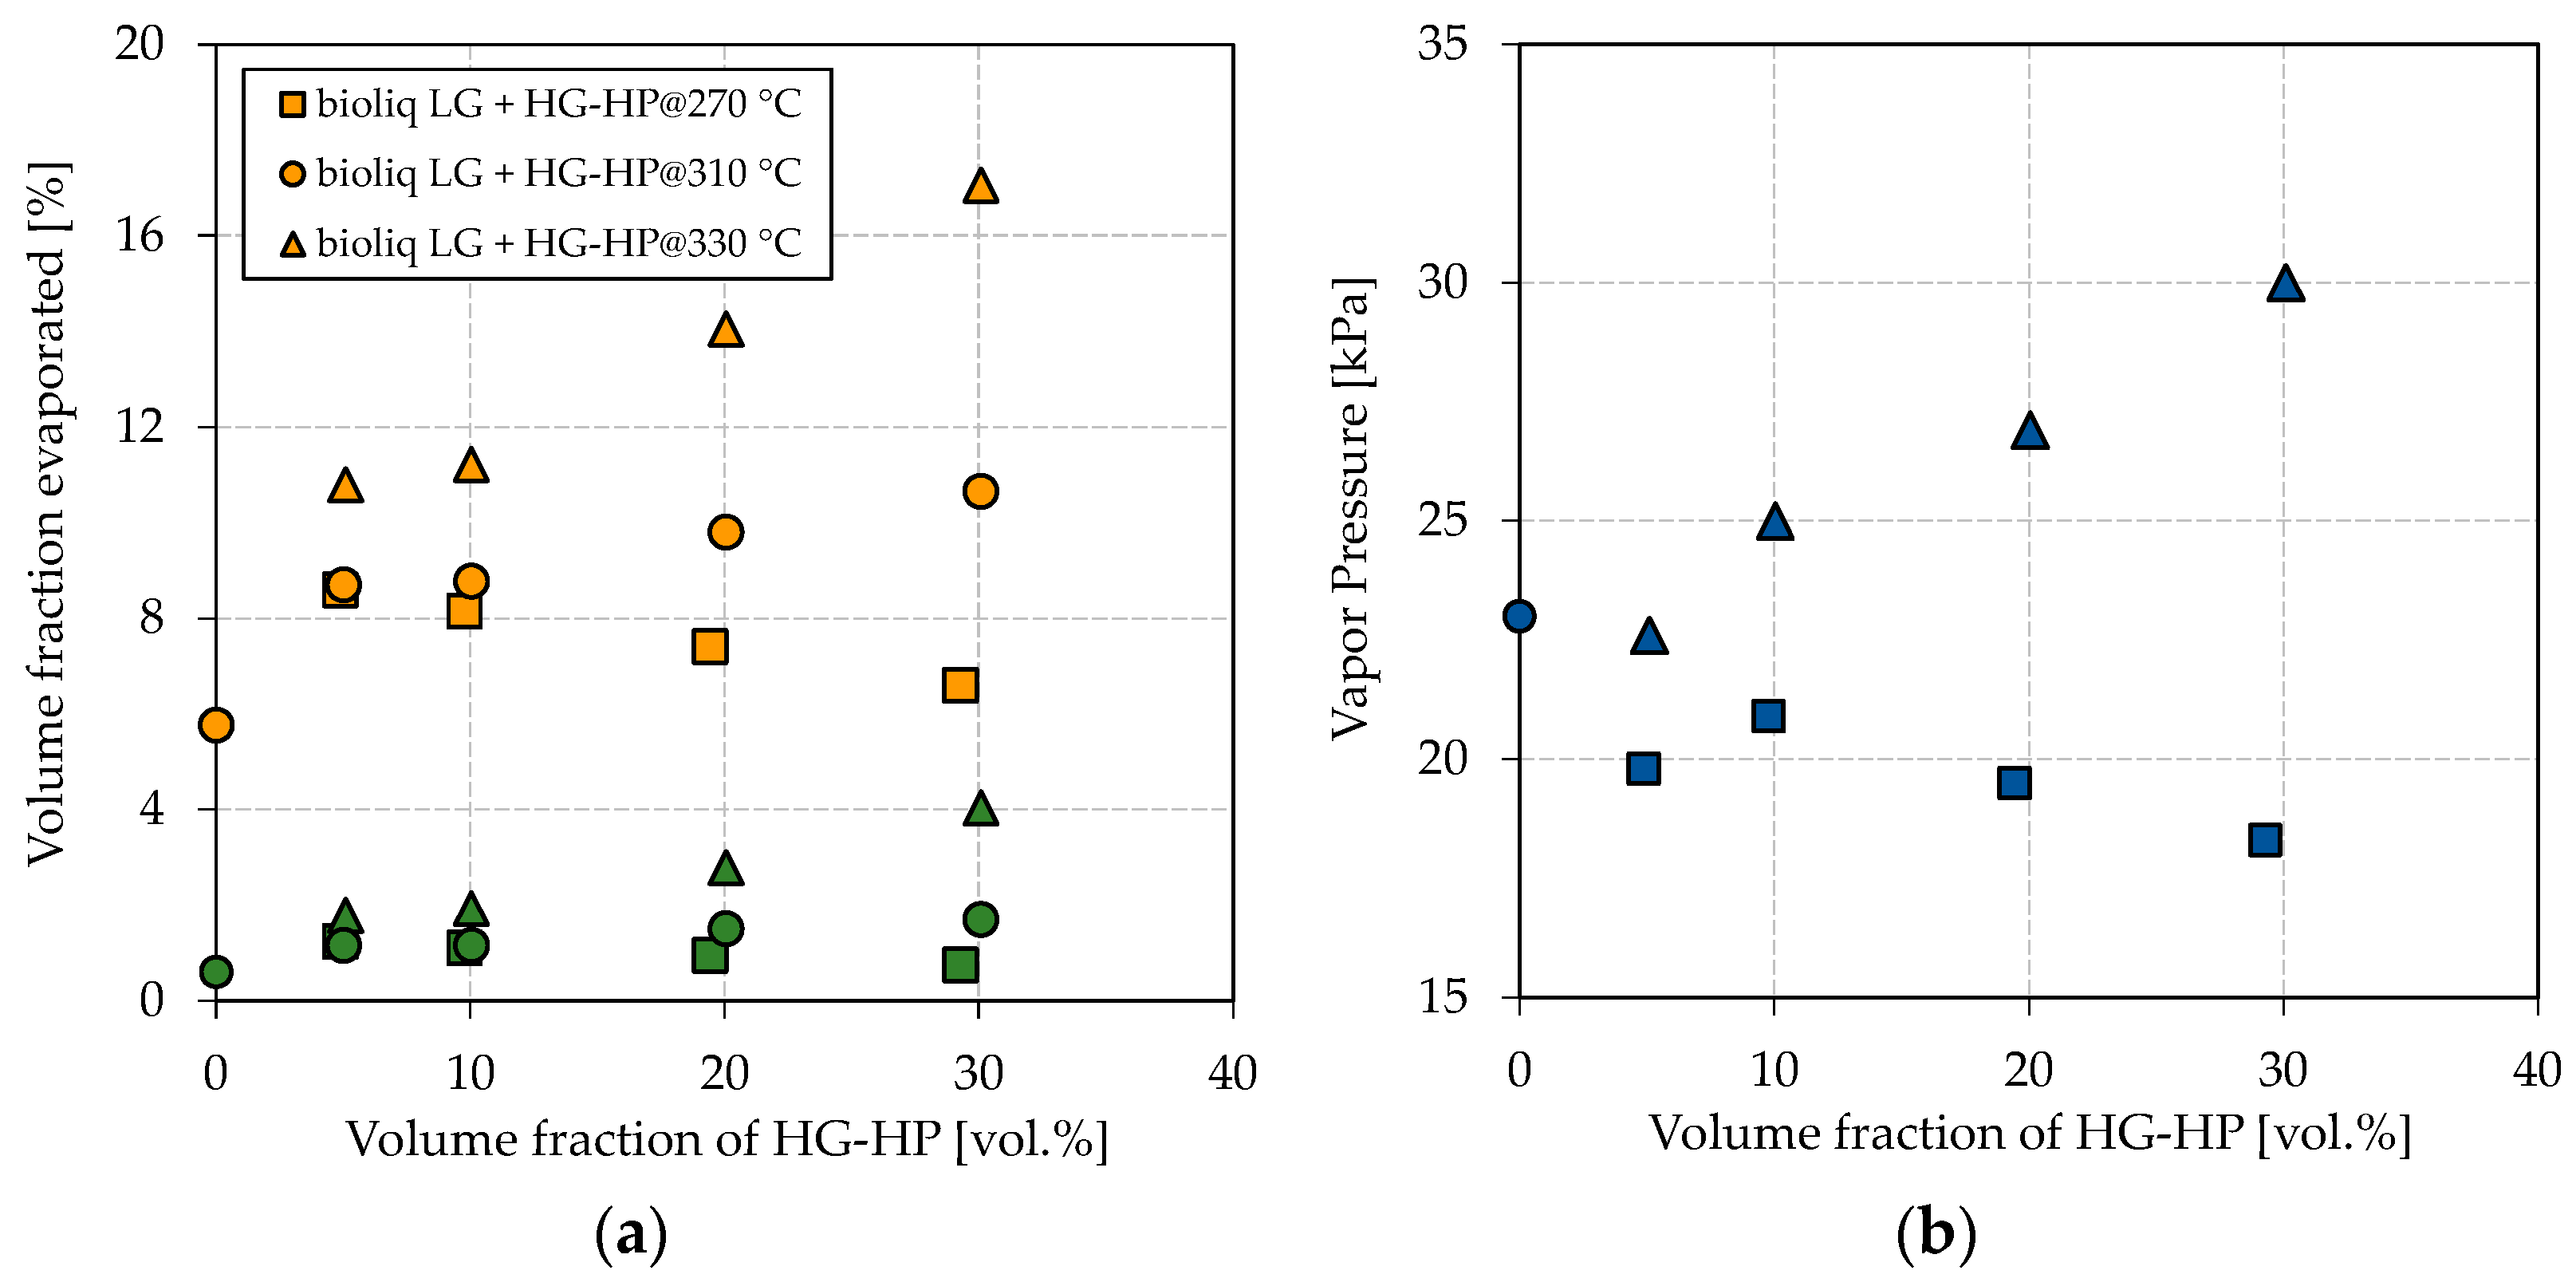
3.1. Influence of Hydroprocessing on Boiling Characteristics and Vapor Pressure

The hydroprocessed HG’s petrochemical parameters are greatly dependent on the reaction temperature; thus, three qualities were produced in this study. Figure 2 shows the obtained results for the E70, E100, and vapor pressure for the blending experiments by continuously increasing the blending rate of HG-HP into bioliq® LG.
Figure 2a shows a directly proportional dependency of the E70 and E100 on the blending rate of the respective HG-HP fractions. This dependency can be attributed to the similar nature of bioliq® LG and HG-HP, consisting exclusively of hydrocarbons. A more substantial increase in E70 and E100 can be seen for HG-HP@330 °C than for HG-HP@310 °C as that fraction contains more light-ends in the respective boiling ranges. The same applies to HG-HP@270 °C, for which E70 and E100 decrease with the blending rate. For an HP temperature of 330 °C and a blending rate of 30 vol.%, E70 and E100 reach 4.0 vol.% and 17.1 vol.%, respectively. However, E70 and E100 have to meet 22 vol.% and 46 vol.%, respectively, according to EN 228. Therefore, HP can help to increase the light-ends, but further measures must be taken. A higher blending ratio of LG:HG-HP of 2:1 cannot be realized in our specific case, as this was roughly the split right after the rectification, as explained in Materials and Methods. A higher HP temperature has not been investigated, as we expected the cracking losses would no longer be justified.
Similar tendencies as for the boiling characteristics can be observed for the vapor pressure, as shown in Figure 2b. A higher overall vapor pressure is observed for blends with HG-HP@330 °C than those with HG-HP@270 °C. While the vapor pressure increases for a higher blending ratio of HG-HP@330 °C, it decreases for HG-HP@270 °C. The direct proportional dependency can again be attributed to the similar nature of the hydrocarbon fractions. As outlined in the Introduction, the vapor pressure is crucial for a correct engine functioning but is also connected to evaporative emissions. For 330 °C, the highest reaction temperature investigated, and a blending rate of 30 vol.%, the vapor pressure is far from violating the upper boundary of 60 kPa of EN 228 for summertime gasoline (Class A). HP seems to be an effective tool for adjusting the vapor pressure in a particular range.
As outlined above, comparing E70, E100, and vapor pressure to EN 228, the necessity of further blending components becomes apparent, even for an HP temperature of 330 °C. In the Introduction, we discussed that oxygenates can help to lower the boiling curve due to low boiling temperatures and by forming an azeotropic mixture with gasoline hydrocarbons. Therefore, the influence of the common oxygenates methanol, ethanol, MTBE, and ETBE on the boiling curve of the bioliq® gasoline is discussed in the following.

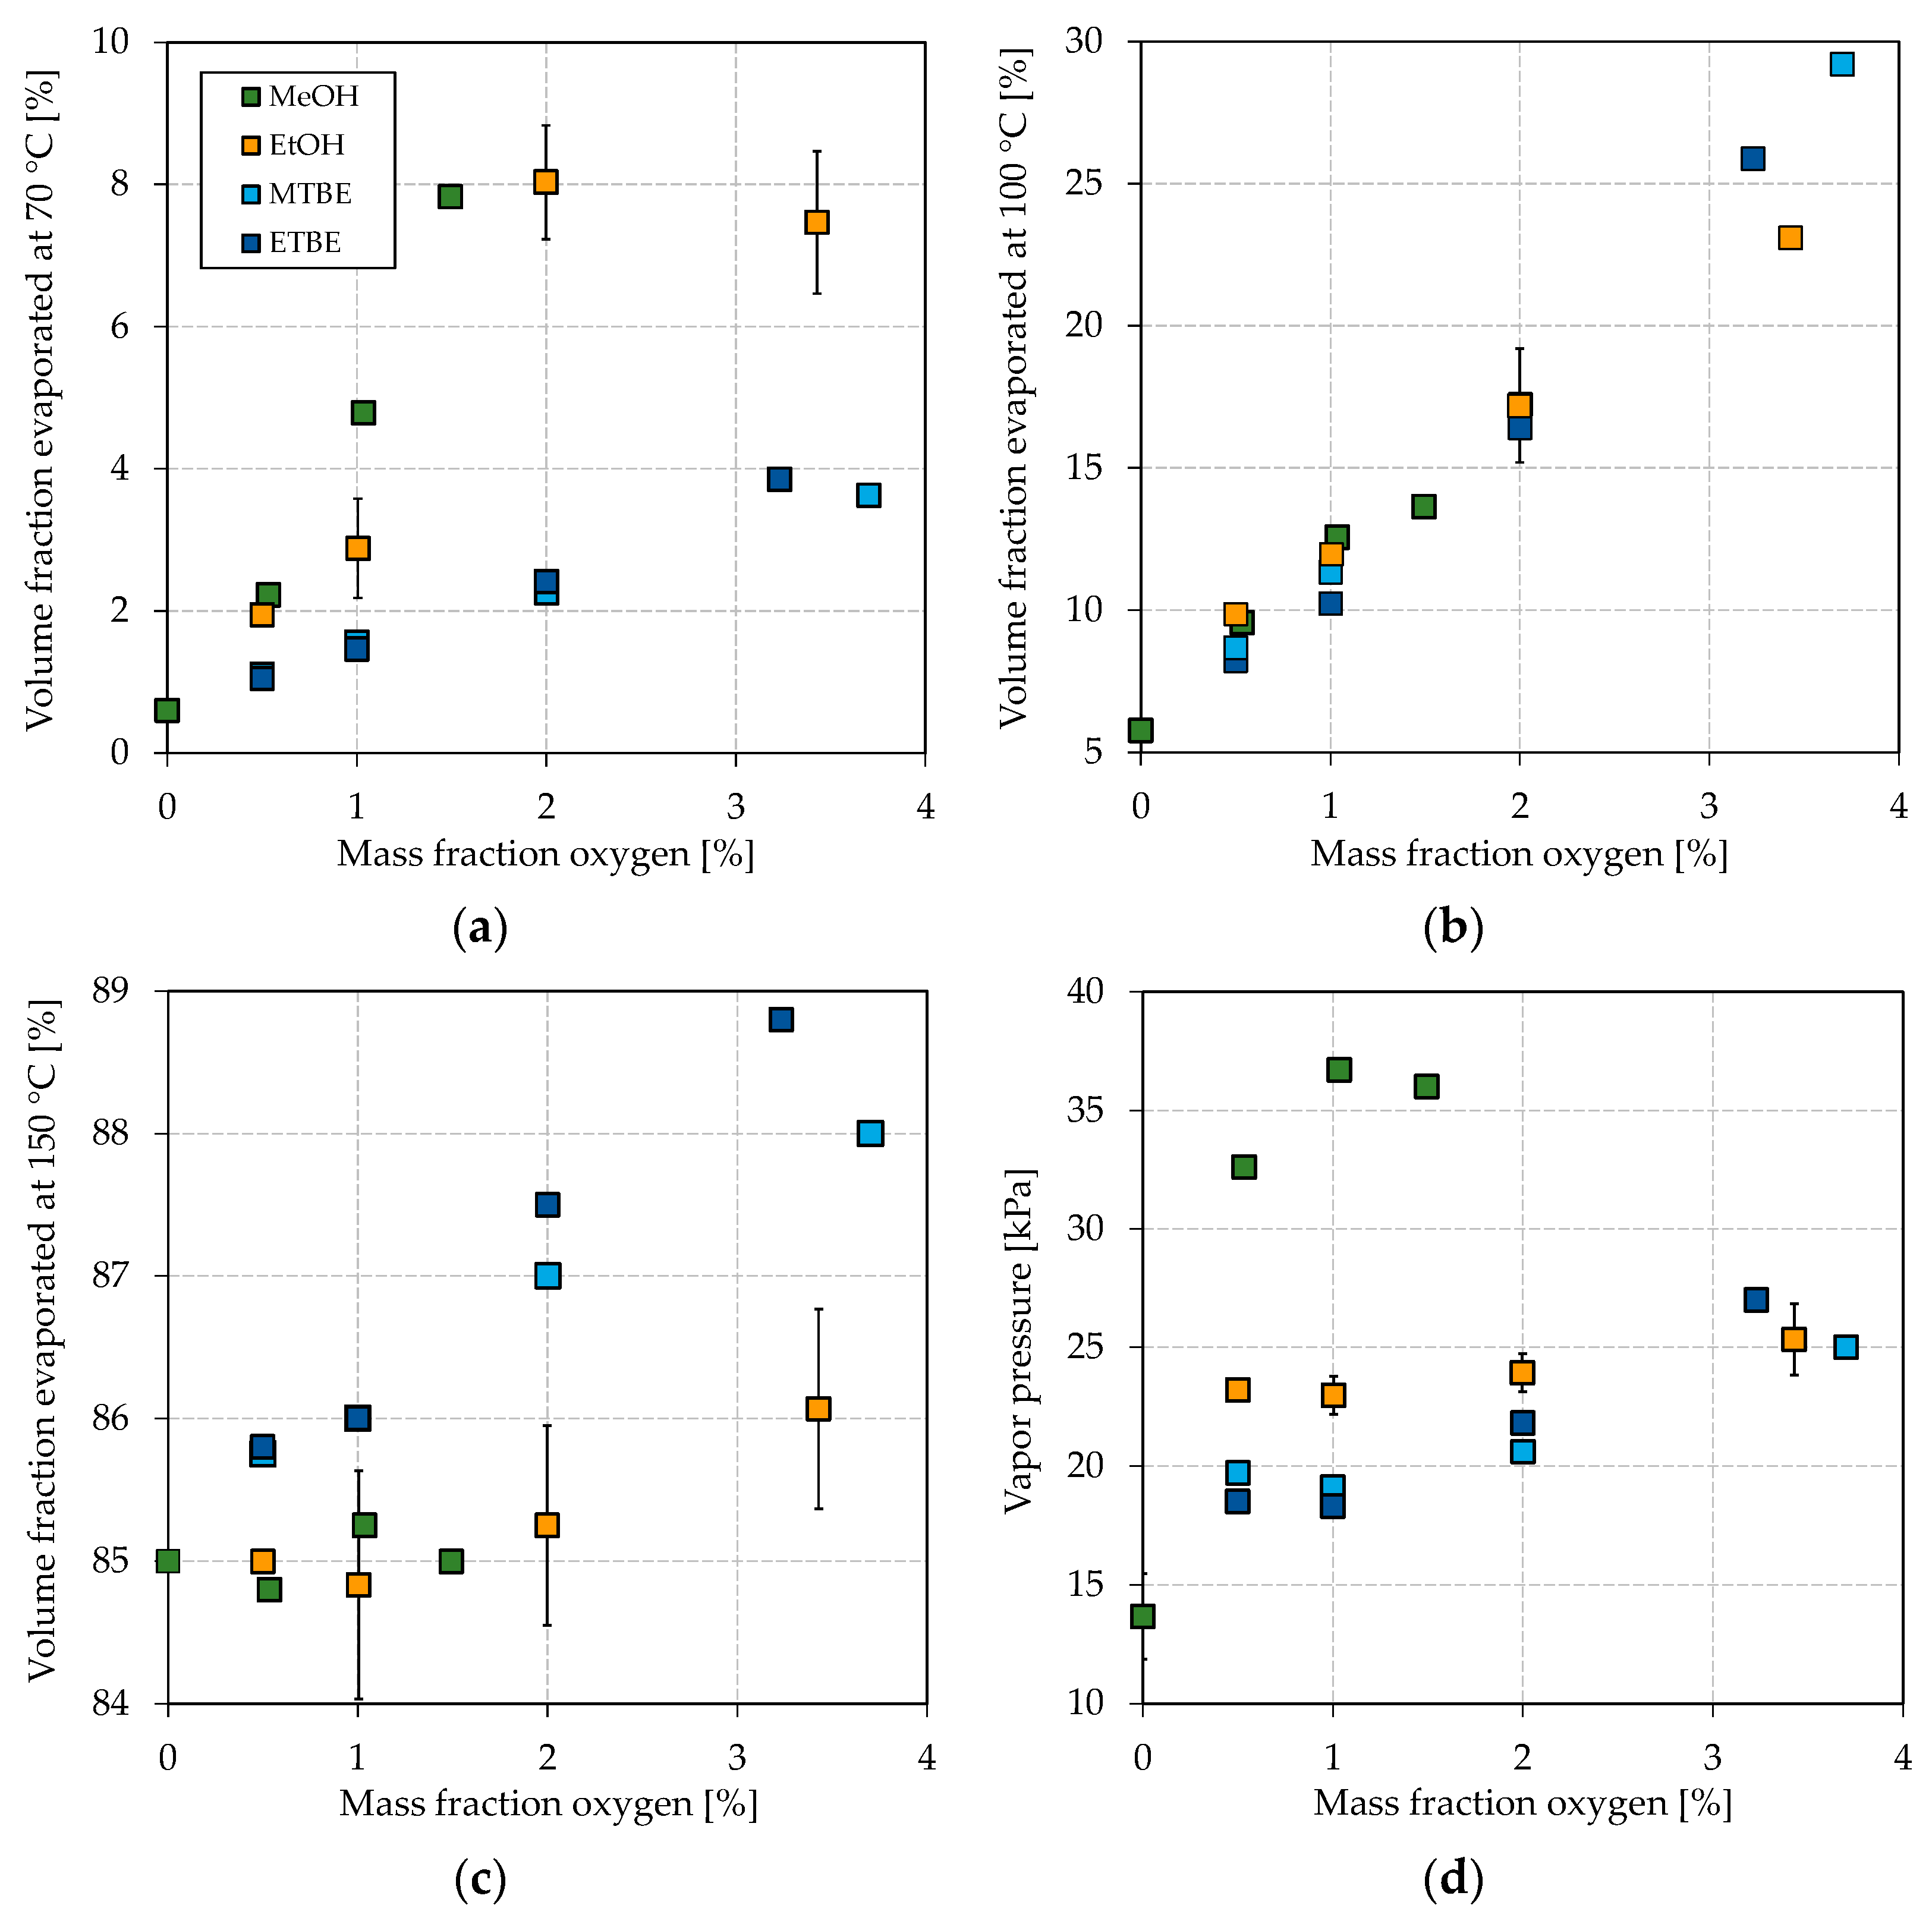
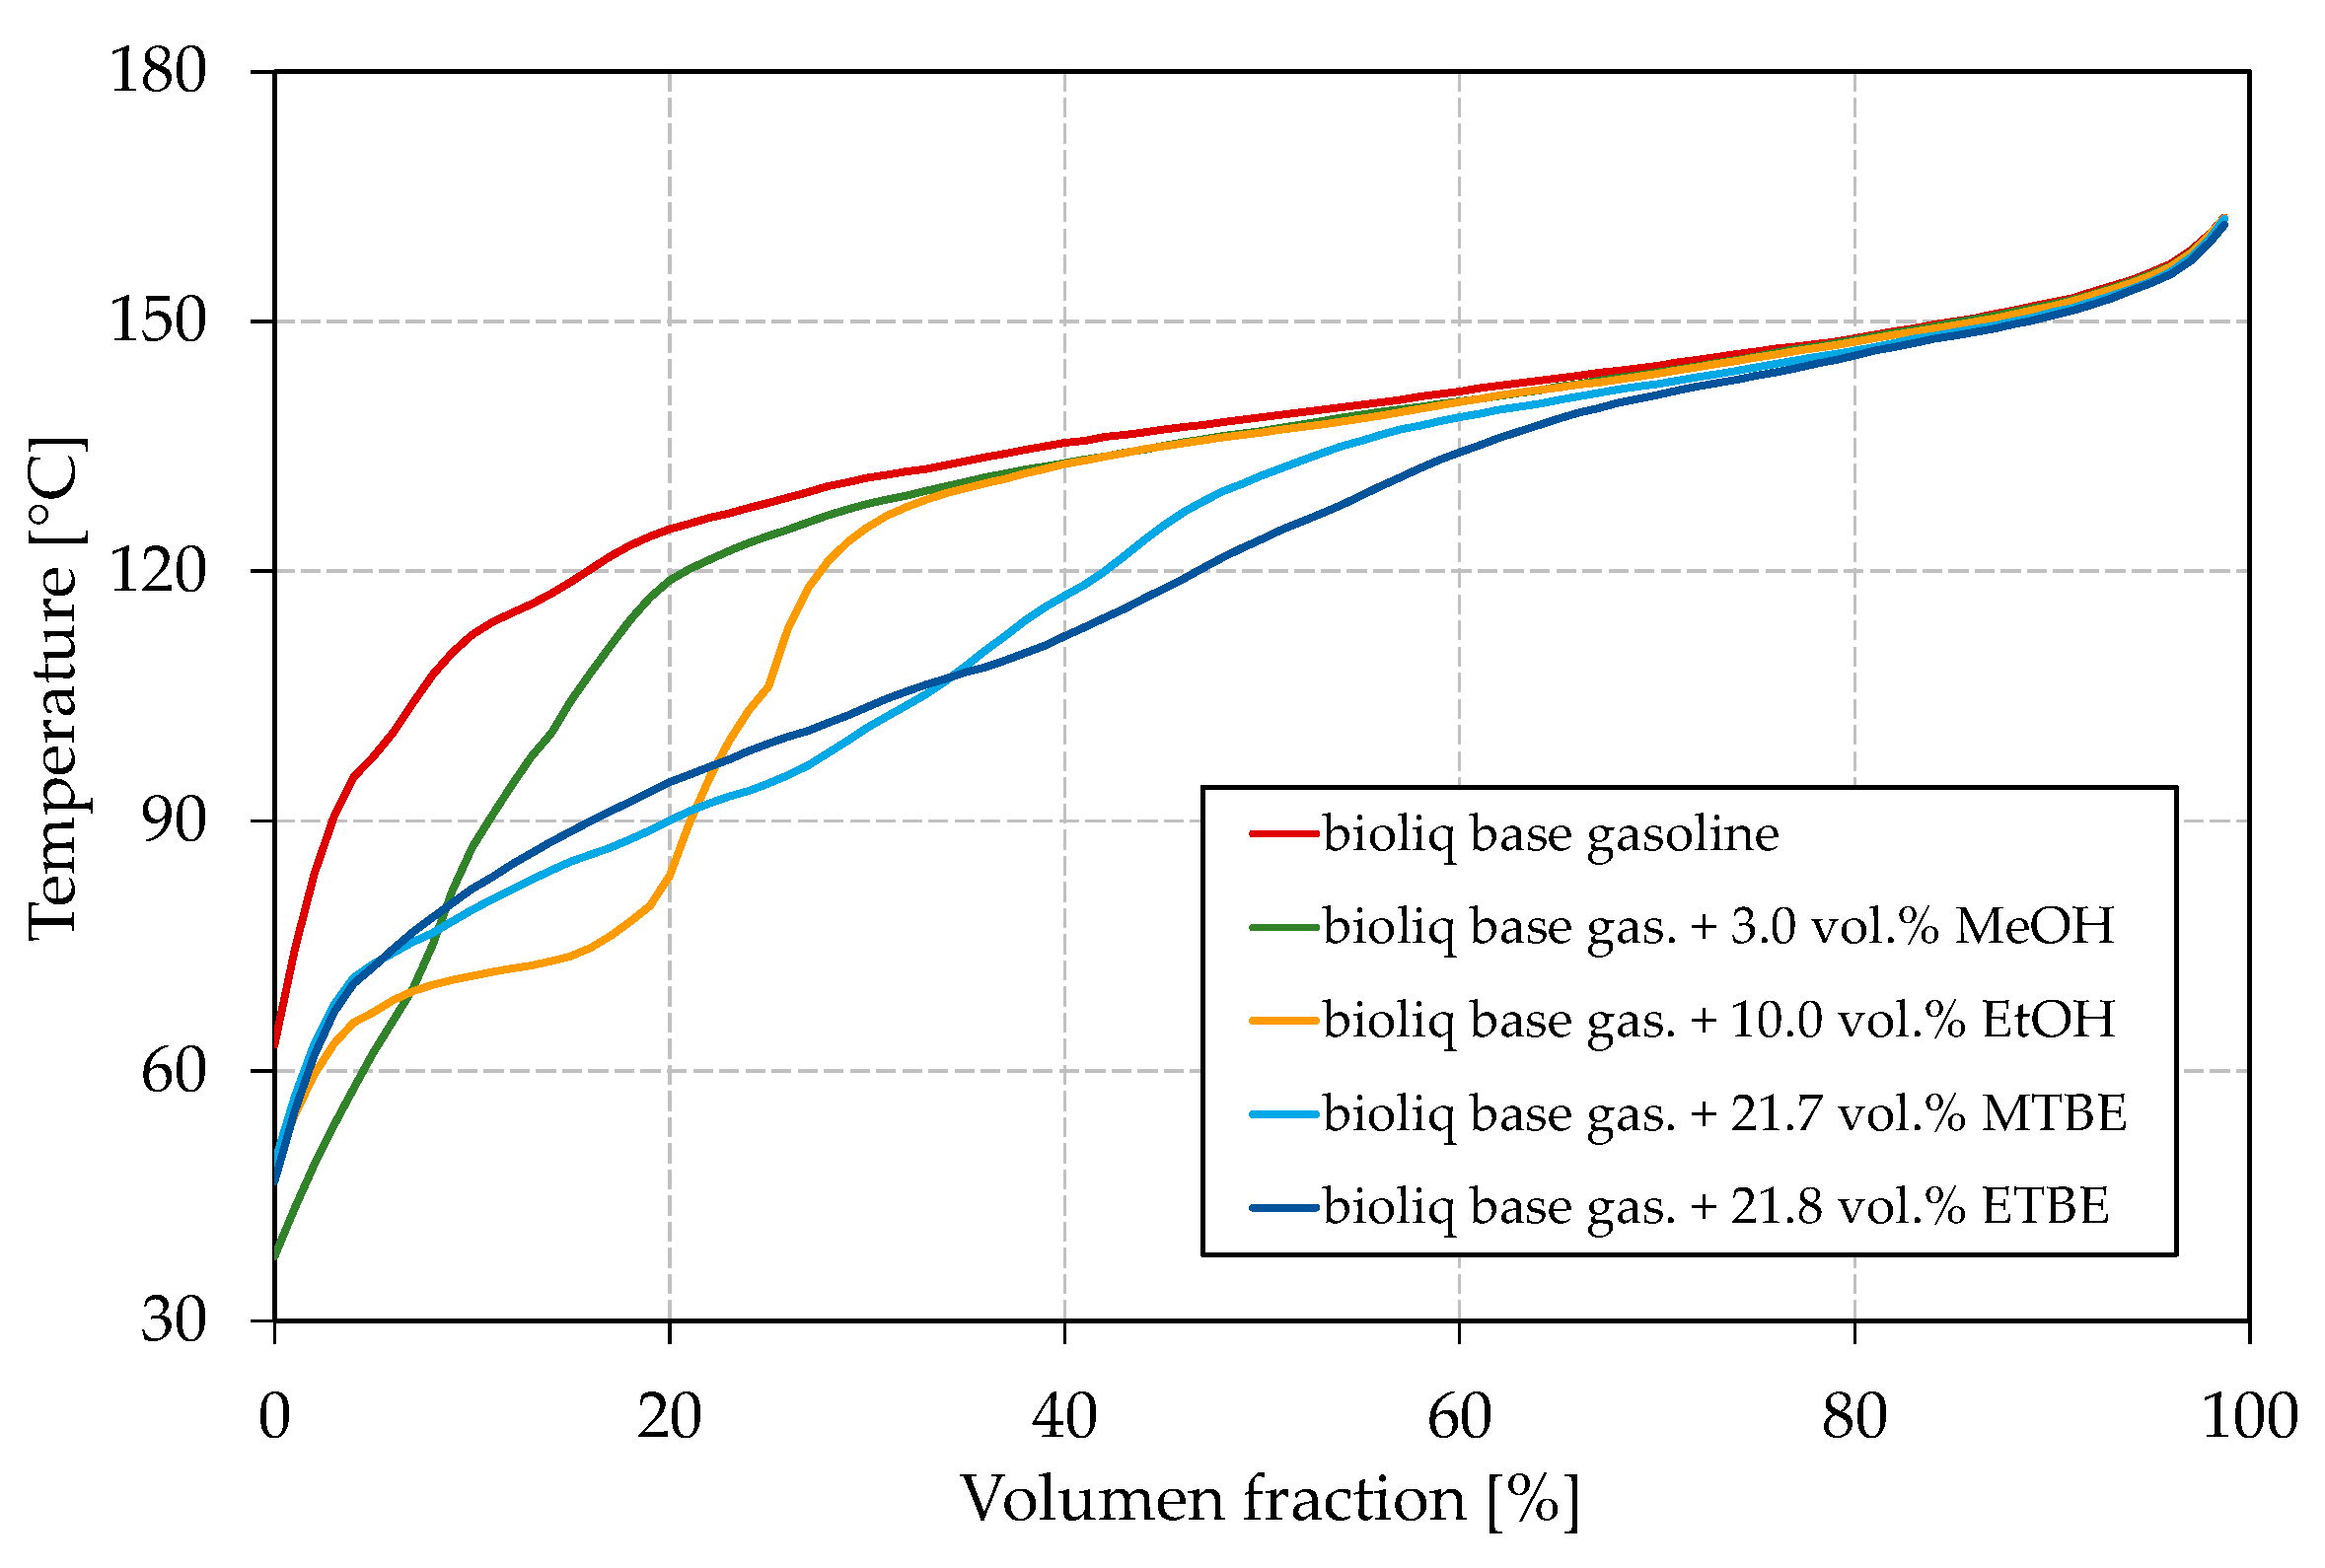
3.2. Influence of Oxygenates on Boiling Characteristics and Vapor Pressure

Figure 3 shows the boiling characteristics E70, E100, and E150 together with the vapor pressure in dependence on the oxygen mass fraction. The oxygen mass fraction is limited in EN 228 to 3.7 wt.% and thus chosen over the blended volume fraction. The maximum share of each oxygenate is chosen accordingly to the maximum permitted in EN 228, such that Figure 3 represents the potential effect of each oxygenate. As base gasoline, a blend of two-thirds bioliq® LG and one-third HG-HP@270 °C was chosen, with an E70, E100, and E150 of 0.6 vol.%, 5.8 vol.%, and 85.0 vol.%, respectively, and a vapor pressure of 13.7 kPa. Therefore, it represents the heavy nature of a typical DTG or MTG fuel.
As shown in Figure 3a, all blended oxygenates increase the E70 as their boiling points are below or in the region of 70 °C (see Table 1 for boiling temperatures). While MTBE and ETBE increase the E70 up to approx. 4 vol.%, blending of methanol and ethanol results in a maximum E70 of 7.8 vol.% and 8.0 vol.%, respectively. It has to be noted that ETBE contains approx. 22 vol.% by-products. Such a strong increase for methanol and ethanol can be attributed to the formation of azeotropic mixtures, as explained in the Introduction. Methanol shows the strongest effect with the blended oxygen equivalent, while a maximum of 3 vol.% could be blended to meet the restriction of EN 228. The overall greatest increase can be seen for ethanol at about 2 wt.% oxygen (5.9 vol.% ethanol) blended. A further addition leads to no further increase of the E70. The strong azeotropic effect of methanol and ethanol can also be seen in Figure 4, where the oxygenates’ boiling curves for their highest blending rates are shown. Both alcohols strongly depress the front end of the boiling curve, which is in accordance with other studies [65,73]. Especially for the blend with ethanol, a distinct step shape can be observed, which indicates the formation of an azeotropic mixture [77]. The boiling curve again reaches the base gasoline’s one after the alcohol is distilled completely [77]. No azeotrope seems to be formed for methanol due to the lower volume blended and as smaller alcohols in general tend to form an azeotropic mixture at higher blending rates [62]. An azeotropic mixture is unfavorable as it results in an unsteady evaporating behavior of the fuel, as explained in the Introduction. Thus, methanol seems more promising than ethanol for adjusting the front-end volatility of the considered bioliq® fuel. As indicated above, MTBE and ETBE only slightly increase E70. However, considering Figure 4, both ethers show a significant flattening, especially of the mid-part of the curve, which is also confirmed by other researchers [65,73,78].
The influence on the mid-section can also be seen for the E100 in Figure 3b, which increases the most for ETBE and MTBE. Blending MTBE leads to the most substantial increase in the E100, as also determined by Petre et al. [78]. In general, however, no significant differences between the investigated oxygenates regarding their influence on the E100 with oxygen equivalent blended can be emphasized. Karonis et al. also detected no apparent difference in the E100 whether they blended ethanol or ETBE [73]. The overall substantial increase in the E100 for MTBE and ETBE can be attributed to the high volume blended, resulting from a low molecular oxygen content and a high permitted blending rate by EN 228.
As shown in Figure 3c, the E150 increases most by blending ETBE, followed by MTBE, and less significantly by ethanol and methanol. The considered alcohols show a less distinct effect on the back end of the boiling curve, as the (near-)azeotropic mixtures do not influence this part of the boiling curve.
Besides a smooth boiling curve, the vapor pressure is important for a well-working engine, emitting fewer emissions, as explained in the Introduction. The influence of the different oxygenates on the vapor pressure can be seen in Figure 3d. Remarkable is the substantial increase in the base fuel’s vapor pressure if methanol is blended, while the ones of the ethanol blends are in the region of the MTBE and ETBE blends. In other studies, ethanol increased the vapor pressure more significantly [21,73]. The weak influence of ethanol on the vapor pressure in this study might be due to the heavy nature of the bioliq® gasoline, as the effect of an oxygenate on the volatility is always connected to the base fuel [21,73]. bioliq® gasoline considered in this study is rich in aromatics, which exhibit a lower increase in the vapor pressure when blended with alcohols [21]. As shown in Figure 4, the ethanol/gasoline azeotrope does not significantly influence the initial part of the boiling curve compared to MTBE and ETBE. In contrast, a significant lowering can be observed for methanol, probably because it can form a near-azeotropic mixture with light-ends, available in low concentrations. This becomes more obvious by comparing the different blends’ initial boiling points (IBPs). For the blends reported in Figure 4 with methanol, ethanol, MTBE, and ETBE, the IBPs are 37.8 °C, 48.7 °C, 48.9 °C, and 46.7 °C, respectively. For each oxygenate considered, the vapor pressure increases with a growing blending rate of oxygen equivalent, except for a blending rate of 1 wt.% oxygen equivalent of methanol, after which the vapor pressure seems to drop. This observation is not significant, as not enough data were collected. However, sources report behavior in which the vapor pressure increased for low blending rates and decreased for higher ones or stayed almost the same [73,79]. For blending rates of up to 2 wt.% oxygen equivalent, the vapor pressure is slightly higher for ethanol than both ethers. The differences disappear for blending rates higher than 3 wt.% oxygen equivalent.
It can be concluded that methanol is promising to improve the boiling characteristics and vapor pressure. Interestingly, the results were obtained with a maximum blending rate of 3 vol.%, which makes it likely that such a fuel would be compatible with older engines, since standard gasoline in Europe contains up to 5 vol.% ethanol. It further seems ETBE is promising as it has a remarkable flattening effect on the boiling curve. MTBE increased the E100 the most, which makes it the favorite oxygenate for adjusting the mid-section of the bioliq® fuel.
In the following, we blended 3 vol.% methanol into the bioliq® base gasoline (two-thirds LG and one-third HG-HP@270 °C) and investigated the effect of a second oxygenate blended, i.e., ethanol, MTBE, and ETBE until an oxygen content of 3.7 wt.% was reached. Methanol was chosen as it increases the E70 most considerably with the blended oxygen equivalent, as shown in Figure 3. There is also no drawback regarding the E100 compared to the other oxygenates. Both parameters are critical if the bioliq® DTG gasoline is considered [60]. Methanol also seems a good choice as it is available as a process intermediate in the case of MTG. Figure 5 shows the dual-oxygenate blends’ boiling characteristics, vapor pressures, and boiling curves.
As shown in Figure 5a, the E70, E100, and vapor pressure are greatly improved for all oxygenates blended into the methanol-containing base gasoline. A significant increase in the E70 can be observed for ethanol and a lower one for MTBE and ETBE, which are at similar levels. The differences also become visible in Figure 3a, where the same tendencies are observable for the single oxygenate blends. E150 increases for the added oxygenates in the order ETBE > MTBE > ethanol, which is once more what was detected for the single-oxygenate blends in Figure 3c. E100 also improves significantly for the dual-oxygenate blends, whereby all values are of the same magnitude. The same was discovered in Figure 3b, where all oxygenates improved the E100 similarly.
Figure 5a shows the vapor pressure for the dual-oxygenate blends. The vapor pressure decreases in the order ETBE > MTBE > ethanol, which is turned around when Figure 3d is considered. For the blend containing methanol/ethanol, the vapor pressure lies between the vapor pressures measured for the blends with the single oxygenates (Figure 3d). The vapor pressure of the blends containing methanol/MTBE and methanol/ETBE are clearly above the values obtained for the blends containing only MTBE and ETBE (Figure 3d) and slightly above the one just containing methanol. The observed can be explained in two ways. First, methanol/ethanol may not increase the vapor pressure as significantly as methanol/MTBE and methanol/ETBE since an increased blending rate of alcohol leads to a decrease in vapor pressure after a certain point. Second, alcohols can form azeotropic mixtures with ethers, as reported, for example, by Domańska et al. [80], which could also explain the disproportionate increase in vapor pressures for these mixtures. A higher vapor pressure for blending methanol/ETBE than methanol/MTBE can be explained by the formation of an (near-)azeotropic mixture of the low-boiling by-products contained in ETBE with methanol. The aforementioned can also be seen in Figure 5b, where the IBPs are significantly lower for the blends with methanol/MTBE and methanol/ETBE than for those with methanol/ethanol. For all blends, the vapor pressures are within EN 228. Regarding the boiling curve, the observations from Figure 4 can be approved for the dual-oxygenate blends. The blend with methanol/ethanol shows a strong step shape, indicating an azeotropic mixture. Both methanol/MTBE and methanol/ETBE help to flatten the boiling curve, whereby the effect is the strongest for methanol/ETBE, as can be seen around a distilled volume of 40%, where the methanol/MTBE curve shows a slight bump.
The boiling characteristics could be improved by simultaneously blending two different of oxygenates into the bioliq® base gasoline. A combination of methanol and ethanol achieved the highest E70 of 15.5 vol.%, while for methanol/MTBE and methanol/ETBE, E70 reached 10.0 vol.% and 9.6 vol.%, respectively. Regarding E100 and E150, the values were within a range of 21.6–23.8 vol.% and 86.0–87.4 vol.%, respectively, for all investigated dual-oxygenate blends. E70 and E100 thus do not meet EN 228, for which at least 22 vol.% and 46 vol.% are required, respectively. Therefore, further light boiling components free of oxygen must be considered. As discussed, the HP of HG at higher temperatures can increase the E70 and E100 to some extent. In the Introduction, we also discussed the possibility of using an FT gasoline fraction as an isomerate replacement. In the following, we combine all these measures. We used a combination of methanol/ethanol and methanol/ETBE in our experiments, as they were superior in terms of the boiling characteristics and the shape of the boiling curve, respectively. To prove its suitability as a possible fossil gasoline replacement, we measured the remaining petrochemical parameters covered by EN 228.

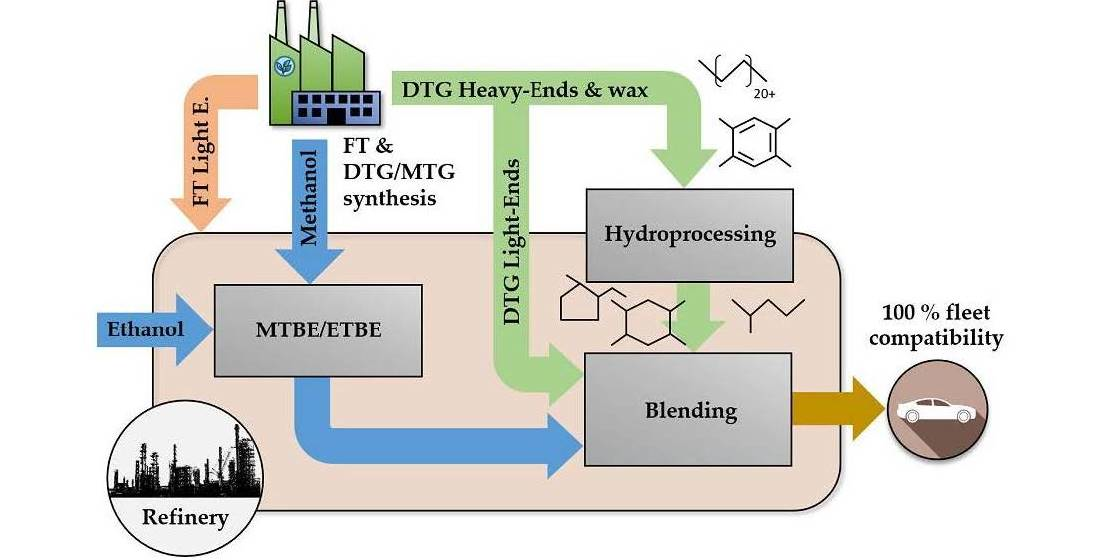
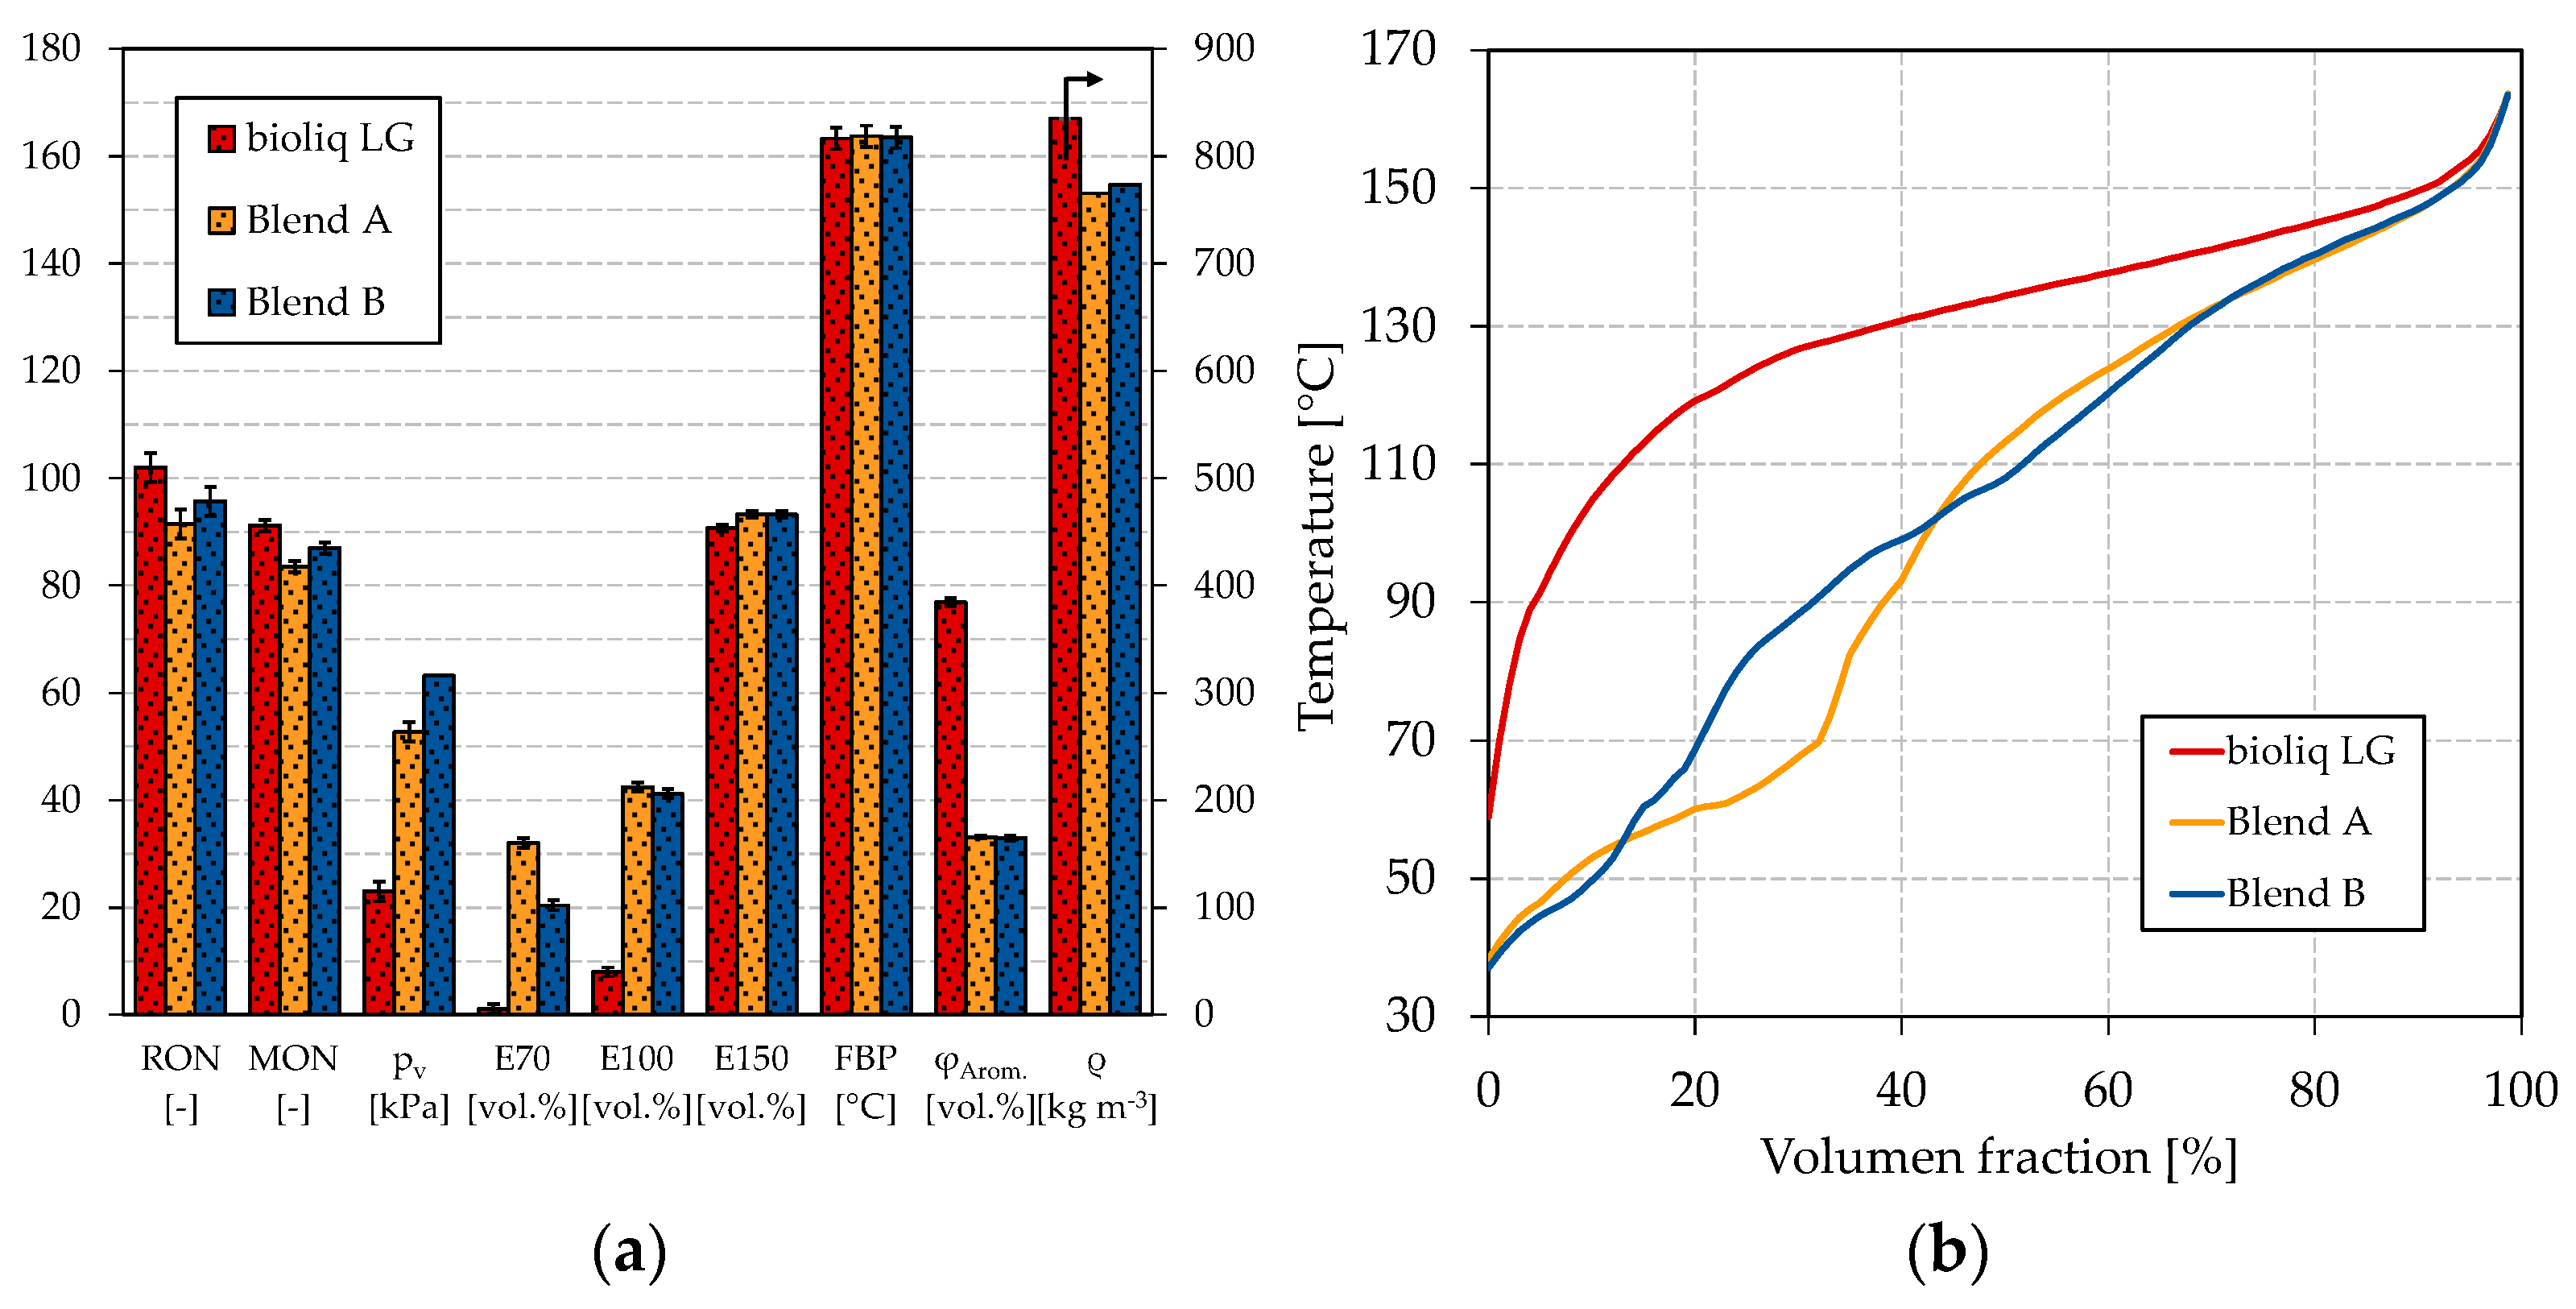
3.3. Expanded Blending Concept

Table 3 shows the fractions used to prepare the final blends A and B.
For blends A and B, we chose a blend of bioliq® LG and HG-HP@330 °C as base gasoline, as outlined before. The ratio of LG:HG-HP was lowered due to two reasons. First, a higher HP temperature means increased cracking losses. Second, the ON of the HG-HP is comparably low; thus, we decided to blend more of the high-octane bioliq® LG. Figure 6 shows the petrochemical parameters of the blends compared to bioliq® LG and the respective boiling curves. The exact composition of the blends A and B can be found in Tables S7 and S8 in the Supplementary Materials.
As can be seen in Figure 6a, the boiling characteristics of blend A and B are significantly improved compared to bioliq® LG. The E70 counts 32.1 vol.% and 20.4 vol.% for blends A and B, respectively. As already shown in Figure 5a, the combination of methanol and ethanol highly improves the E70 due to forming of an azeotropic mixture. This can also be seen in Figure 6b, where blend A shows a strong depression up to a distilled volume of 30 vol.%. Blend B scarce does not meet the 22 vol.% of EN 228 for the E70. Regarding the E100, blend A counts 42.4 vol.% and blend B 41.2 vol.%; thus, both do not meet EN 228’s minimum value of 46 vol.%. For E150, both blends meet EN 228. In general, the boiling characteristics show similar results to the dual-oxygenate blends shown in Figure 5a. Regarding the vapor pressure, only blend A was measured, as the quantity of blend B was too low; however, we made an estimate based on the similarity to the dual-oxygenate blends. The vapor pressure of blend A and blend B is 52.7 kPa and 63.2 kPa, respectively. Blend A is within 45–60 kPa for Class A gasoline according to EN 228, while blend B is slightly too high. One might already conclude that MTBE is probably the better choice over ETBE. In Figure 5a, E70 and E100 are slightly higher for the dual-oxygenate blend with MTBE, while the vapor pressure is lower.
For blend A, the RON and MON are 91.5 and 83.5, respectively, which is too low to satisfy EN 228. The low ONs are explainable by the comparably low ON of HG-HP@330 °C and FT-HP (see Table 2), which cannot be compensated by ethanol as its blending rate is relatively low due to its high molecular oxygen content. Counting 95.7 and 87.0 for the RON and MON, respectively, significantly higher ONs, meeting EN 228, are detected for blend B. ETBE compensates better for the ON loss because its lower molecular oxygen content allows it to be blended at a higher ratio until the 3.7 wt.% oxygen equivalent is reached. Additionally, ETBE was determined to increase the RON and MON more distinct than ethanol [73]. The higher ON of blend A offers the possibility to increase the quantity of light-ends, for example, by increasing the share of HG-HP@330 °C or FT-HP. Additionally, with MTBE instead of ETBE, this could help to finally meet EN 228. MTBE and ETBE have similar RONs and MONs (see Table 1); therefore, the ON should not be a limiting factor.
The remaining parameters, density, and aromatics content lie within EN 228 for both blends. Regarding the boiling curves, a significant improvement can be seen for both blends compared to bioliq® LG. The stepped shape for blend A with methanol and ethanol is still observable. However, compared to Figure 5b, it is shifted towards higher volume fractions. The shift is not surprising, as a higher share of light boiling components was contained in the blends considered in Figure 6, as FT-HP and HG-HP@330 °C were blended here. A smoother boiling curve can be seen for blend B with methanol and ETBE, where no distinct disturbances are visible besides a flat bump between 20 vol.% and 40 vol.%. Therefore, a similar smooth boiling curve would be expected for MTBE, as only a slight difference was detected in Figure 5b. Further blending experiments are thus encouraging.

4. Conclusions

The bioliq® LG’s critical volatility parameters E70 and E100 could be improved from 0.6 vol.% to 4.0 vol.% and 5.8 vol.% to 17.1 vol.%, respectively, through HP the HG, using a Pt-HZSM-5 catalyst. A more substantial improvement of the E70 from 0.6 vol.% to 7.8 vol.% and 0.6 vol.% to 8.0 vol.% was achieved by blending methanol and ethanol, respectively, within their permitted blending volumes by EN 228. ETBE and MTBE significantly improved the E100 from 5.8 vol.% to 25.9 vol.% and from 5.8 vol.% to 29.2 vol.%, respectively. The blending of ETBE additionally led to a considerable flattening of the boiling curve, while ethanol caused deformations due to formation of an azeotropic mixture. All vapor pressures were within EN 228, while blending of methanol led to the most substantial increase in the bioliq® gasoline’s low vapor pressure from 13.7 kPa to 36.7 kPa. A blending of methanol and ethanol with bioliq® gasoline further improved the E70 to 15.5 vol.%, while it reached approx. 10 vol.% when methanol was blended with MTBE or ETBE. The E100 increased for all dual-oxygen blends to a similar level of 21.6 vol.% to 23.8 vol.%. Due to the high alcohol content, the boiling curve showed strong deformations for the blend with methanol and ethanol, while it was smooth for blending methanol and ETBE. Two final blends were prepared using bioliq® LG, HP-HG@330 °C, FT-HP, and a combination of methanol and ethanol or methanol and ETBE. With 91.5 and 83.5 for the RON and MON, respectively, the blend with methanol and ethanol did not meet EN 228 in this regard. The blend with methanol and ETBE met the standard, with a RON and MON of 95.7 and 87, respectively. With the exceptions of E70 and E100 having slightly too low values of 20.4 vol.% and 41.2 vol.%, respectively, all petrochemical parameters could be met for the latter blend. The blend comes additionally with a low alcohol content of 3 vol.% and should thus be compatible even with older vehicles. A clear advantage over established upgrading processes such as Mobil’s [59] is the complete conversion of heavy aromatics to saturated compounds, resulting in lower emission tendencies as reported for such fuels [55].
E70 and E100 could be further increased by server cracking of whether the FT wax or the HG. Since blending methanol and MTBE into the bioliq® gasoline increased the E70 and E100 slightly more than a blend with methanol and ETBE, it should be investigated whether replacing ETBE with MTBE could contribute to meet EN 228. A blend with methanol and MTBE would be additionally beneficial, as these oxygenates would be based entirely on methanol (and iso-butene). It should also be examined to lower the separation temperature of LG and HG in the rectification right after the gasoline synthesis. This would lower the boiling curve and is additionally promising as the gasoline supply might be based solely on MTG/DTG with additional oxygenates, allowing the omission of FT wax cracking. Finally, further research should include engine tests, especially under high loads, to investigate whether any evaporation issues exist.

Supplementary Materials

The following are available online at https://www.mdpi.com/article/10.3390/fuels4020010/s1, Table S1: Composition of bioliq® LG in vol.%., Table S2: Composition of HG-HP@270 °C in vol.%., Table S3: Composition of HG-HP@310 °C in vol.%., Table S4: Composition of HG-HP@330 °C in vol.%., Table S5: Composition of FT-HP in vol.%., Table S6: Composition of bioliq® HG in vol.%., Table S7: Composition of blend A in vol.%., Table S8: Composition of blend B in vol.%.

Author Contributions

Conceptualization, D.G.; Data curation, D.G.; Formal analysis, D.G.; Funding acquisition, R.R.; Investigation, D.G. and P.N.; Methodology, D.G.; Project administration, R.R.; Resources, R.R.; Software, D.G.; Supervision, R.R.; Validation, D.G., P.N. and R.R.; Visualization, D.G.; Writing—Original draft, D.G.; Writing—Review and editing, D.G., P.N. and R.R. All authors have read and agreed to the published version of the manuscript.

Funding

This work was supported by the Strategic Dialogue Automotive Industry SDA and the Ministry of Transport Baden Wuerttemberg as part of the project “refuels–rethinking fuels”.

Data Availability Statement

The data presented in this study, if not included in the Supplementary Materials, are available on request from the corresponding author.

Acknowledgments

We thank Thomas Otto and Doreen Neumann-Walter from the Institute of Catalysis Research and Technology (IKFT) as part of Karlsruhe Institute of Technology for their strong support in characterizing the fuels.

Conflicts of Interest

The authors declare no conflict of interest. The funders had no role in the design of the study; in the collection, analyses, or interpretation of data; in the writing of the manuscript, or in the decision to publish the results.

References

  1. European Commission. Communication from the Commission of the European Parliament, the European Council, the Council, the European Economic and Social Committee and the Committee of the Regions; The European Green Deal: Brussels, Belgium, 2019. [Google Scholar]
  2. European Commission. Communication from the Commission to the European Parliament, the Council, the European Economic and Social Committee and the Committee of the Regions: ‘Fit for 55’: Delivering the EU’s 2030 Climat Target on the way to climate neutrality; European Commission: Brussels, Belgium, 2021. [Google Scholar]
  3. Sean Goulding Carroll. EU Deal on Car CO2 Standards Leaves Door Ajar for e-Fuels. Available online: https://www.euractiv.com/section/alternative-renewable-fuels/news/eu-deal-on-car-co2-standards-leaves-door-ajar-for-e-fuels/ (accessed on 7 July 2022).
  4. Abnett, K. EU Approves Effective Ban on New Fossil Fuel Cars from 2035. Available online: https://www.reuters.com/markets/europe/eu-approves-effective-ban-new-fossil-fuel-cars-2035-2022-10-27/ (accessed on 25 November 2022).
  5. Jonathan, M.G. No New Combustion-Engine Cars From 2035, Says European Union. Available online: https://arstechnica.com/cars/2022/10/eu-agrees-to-ban-new-combustion-engine-cars-from-2035/ (accessed on 25 November 2022).
  6. International Energy Agency (IEA). Global EV Outlook 2022: Securing Supplies for an Electric Future; IEA: Paris, France, 2022. [Google Scholar]
  7. European Automobile Manufacturers’ Association (ACEA). Vehicles in Use Europe 2023; ACEA: Brussels, Belgium, 2023. [Google Scholar]
  8. Randall, C. VW to Phase Out Combustion Vehicles by 2035. Available online: https://www.electrive.com/2021/06/27/vw-to-phase-out-combustion-vehicles-by-2035/ (accessed on 27 January 2023).
  9. Surisetty, V.R.; Dalai, A.K.; Kozinski, J. Alcohols as alternative fuels: An overview. Appl. Catal. A 2011, 404, 1–11. [Google Scholar] [CrossRef]
  10. Jeuland, N.; Montagne, X.; Gautrot, X. Potentiality of Ethanol as a Fuel for Dedicated Engine. Oil Gas Sci. Technol. 2004, 59, 559–570. [Google Scholar] [CrossRef] [Green Version]
  11. Munsin, R.; Laoonual, Y.; Jugjai, S.; Imai, Y. An experimental study on performance and emissions of a small SI engine generator set fuelled by hydrous ethanol with high water contents up to 40%. Fuel 2013, 106, 586–592. [Google Scholar] [CrossRef]
  12. Jafari, H.; Idris, M.H.; Ourdjini, A.; Rahimi, H.; Ghobadian, B. EIS study of corrosion behavior of metallic materials in ethanol blended gasoline containing water as a contaminant. Fuel 2011, 90, 1181–1187. [Google Scholar] [CrossRef]
  13. Stappen, H.-J.; Gräve, P. eFuels Pilot Plant in Chile Officially Opened. Available online: https://newsroom.porsche.com/en/2022/company/porsche-highly-innovative-fuels-hif-opening-efuels-pilot-plant-haru-oni-chile-synthetic-fuels-30732.html (accessed on 27 January 2023).
  14. DIN Deutsches Institut für Normung e. V. Automotive Fuels–Unleaded Petrol–Requirements and Test Methods; German Version EN 228:2012+A1:2017; Beuth Verlag GmbH: Berlin, Germany, 2017. [Google Scholar]
  15. Federal Office for Agriculture and Food. Evaluation and Progress Report 2020; Federal Office for Agriculture and Food: Bonn, Germany, 2021. [Google Scholar]
  16. Turdera, M.V. Energy balance, forecasting of bioelectricity generation and greenhouse gas emission balance in the ethanol production at sugarcane mills in the state of Mato Grosso do Sul. Renew. Sustain. Energy Rev. 2013, 19, 582–588. [Google Scholar] [CrossRef]
  17. Ghosh, P.; Hickey, K.J.; Jaffe, S.B. Development of a Detailed Gasoline Composition-Based Octane Model. Ind. Eng. Chem. Res. 2006, 45, 337–345. [Google Scholar] [CrossRef]
  18. Jiang, Y.; Phillips, S.D.; Singh, A.; Jones, S.B.; Gaspar, D.J. Potential economic values of low-vapor-pressure gasoline-range bio-blendstocks: Property estimation and blending optimization. Fuel 2021, 297, 120759. [Google Scholar] [CrossRef]
  19. Heywood, J.B. Internal Combustion Engine Fundamentals, 2nd ed.; McGraw-Hill: New York, NY, USA, 1988; ISBN 0071004998. [Google Scholar]
  20. Milpied, J.; Jeuland, N.; Plassat, G.; Guichaous, S.; Dioc, N.; Marchal, A.; Schmelzle, P. Impact of Fuel Properties on the Performances and Knock Behaviour of a Downsized Turbocharged DI SI Engine: Focus on Octane Numbers and Latent Heat of Vaporization. SAE Int. J. Fuels Lubr. 2009, 2, 118–126. [Google Scholar] [CrossRef]
  21. da Silva, R.; Cataluña, R.; de Menezes, E.W.; Samios, D.; Piatnicki, C.M.S. Effect of additives on the antiknock properties and Reid vapor pressure of gasoline. Fuel 2005, 84, 951–959. [Google Scholar] [CrossRef]
  22. Santikunaporn, M.; Alvarez, W.E.; Resasco, D.E. Ring contraction and selective ring opening of naphthenic molecules for octane number improvement. Appl. Catal. A 2007, 325, 175–187. [Google Scholar] [CrossRef]
  23. Morgan, T.D.B.; den Otter, G.J.; Lange, W.W.; Doyon, J.; Barnes, J.R.; Yamashita, T. An Integrated Study of the Effects of Gasoline Composition on Exhaust Emissions Part I: Programme Outline and Results on Regulated Emissions. SAE Tech. Pap. 1993, 932678, 1–18. [Google Scholar] [CrossRef]
  24. Petit, A.; Montagne, X. Effects of the Gasoline Composition on Exhaust Emissions of Regulated and Speciated Pollutants. SAE Tech. Pap. 1993, 932681, 1–11. [Google Scholar] [CrossRef]
  25. Nakakita, K.; Ban, H.; Takasu, S.; Hotta, Y.; Inagaki, K.; Weissman, W.; Farrell, J.T. Effect of Hydrocarbon Molecular Structure in Diesel Fuel on In-Cylinder Soot Formation and Exhaust Emissions. SAE Int. J. Fuels Lubr. 2003, 112, 1763–1775. [Google Scholar] [CrossRef]
  26. Meyers, R.A. Handbook of Petroleum Refining Processes, 3rd ed.; McGraw-Hill: New York, NY, USA, 2003; ISBN 978-0-07-139109-2. [Google Scholar]
  27. Bruno, T.J.; Wolk, A.; Naydich, A. Composition-Explicit Distillation Curves for Mixtures of Gasoline with Four-Carbon Alcohols (Butanols). Energy Fuels 2009, 23, 2295–2306. [Google Scholar] [CrossRef]
  28. Tan, E.C.D.; Talmadge, M.; Dutta, A.; Hensley, J.; Snowden-Swan, L.J.; Humbird, D.; Schaidle, J.; Biddy, M. Conceptual process design and economics for the production of high-octane gasoline blendstock via indirect liquefaction of biomass through methanol/dimethyl ether intermediates. Biofuels Bioprod. Bioref. 2016, 10, 17–35. [Google Scholar] [CrossRef]
  29. Calcote, H.F.; Manos, D.M. Effect of Molecular Structure on Incipient Soot Formation. Combust. Flame 1983, 49, 289–304. [Google Scholar] [CrossRef]
  30. Furey, R.L.; King, J.B. Emissions, Fuel Economy, and Driveability Effects of Methanol/Butanol/Gasoline Fuel Blends. SAE Tech. Pap. 1982, 821188, 47–59. [Google Scholar] [CrossRef]
  31. Yanowitz, J.; Christensen, E.; McCormick, R.L. Utilization of Renewable Oxygenates as Gasoline Blending Components, Technical Report NREL/TP-5400-50791; National Renewable Energy Laboratory: Colorado, CO, USA, 2011. [Google Scholar]
  32. Aikawa, K.; Sakurai, T.; Jetter, J.J. Development of a Predictive Model for Gasoline Vehicle Particulate Matter Emissions. SAE Int. J. Fuels Lubr. 2010, 3, 610–622. [Google Scholar] [CrossRef]
  33. Jess, A.; Wasserscheid, P. Chemical Technology: An Integral Textbook; Wiley-VCH Verlag GmbH & Co. KGaA: Weinheim, Germany, 2013; ISBN 978-3-527-30446-2. [Google Scholar]
  34. Duvenhage, D.J.; Shingles, T. Synthol reactor technology development. Catal. Today 2002, 71, 301–305. [Google Scholar] [CrossRef]
  35. Steynberg, A.P.; Espinoza, R.L.; Jager, B.; Vosloo, A.C. High temperature Fischer–Tropsch synthesis in commercial practice. Appl. Catal. A 1999, 186, 41–54. [Google Scholar] [CrossRef]
  36. Kamara, B.I.; Coetzee, J. Overview of High-Temperature Fischer−Tropsch Gasoline and Diesel Quality. Energy Fuels 2009, 23, 2242–2247. [Google Scholar] [CrossRef]
  37. Dry, M.E. High quality diesel via the Fischer-Tropsch process–a review. J. Chem. Technol. Biotechnol. 2002, 77, 43–50. [Google Scholar] [CrossRef]
  38. Meurer, A.; Kern, J. Fischer–Tropsch Synthesis as the Key for Decentralized Sustainable Kerosene Production. Energies 2021, 14, 1836. [Google Scholar] [CrossRef]
  39. Federal Ministry for the Environment, Nature Conservation, Nuclear Safety and Consumer Protection. PtL Roadmap: Sustainable Aviation Fuel from Renewable Energy Sources for Aviation in Germany; Federal Ministry for the Environment, Nature Conservation, Nuclear Safety and Consumer Protection: Bonn, Germany, 2021. [Google Scholar]
  40. Schulz, H. Short history and present trends of Fischer–Tropsch synthesis. Appl. Catal. A 1999, 186, 3–12. [Google Scholar] [CrossRef]
  41. Chang, C.D.; Silvestri, A.J. The Conversion of Methanol and Other O-Compounds to Hydrocarbons over Zeolite Catalysts. J. Catal. 1977, 47, 249–259. [Google Scholar] [CrossRef]
  42. Olsbye, U.; Svelle, S.; Bjørgen, M.; Beato, P.; Janssens, T.V.W.; Joensen, F.; Bordiga, S.; Lillerud, K.P. Conversion of Methanol to Hydrocarbons: How Zeolite Cavity and Pore Size Controls Product Selectivity. Angew. Chem. Int. Ed. 2012, 51, 5810–5831. [Google Scholar] [CrossRef]
  43. Teketel, S.; Olsbye, U.; Lillerud, K.-P.; Beato, P.; Svelle, S. Selectivity control through fundamental mechanistic insight in the conversion of methanol to hydrocarbons over zeolites. Microporous Mesoporous Mater. 2010, 136, 33–41. [Google Scholar] [CrossRef]
  44. Chang, C.D. The New Zealand Gas-to-Gasoline plant: An engineering tour de force. Catal. Today 1992, 13, 103–111. [Google Scholar] [CrossRef]
  45. Topp-Jørgensen, J. Topsøe Integrated Gasoline Synthesis–The Tigas Process. Stud. Surf. Sci. Catal. 1988, 36, 293–305. [Google Scholar] [CrossRef]
  46. Dahmen, N.; Abeln, J.; Eberhard, M.; Kolb, T.; Leibold, H.; Sauer, J.; Stapf, D.; Zimmerlin, B. The bioliq process for producing synthetic transportation fuels. Wiley Interdiscip. Rev. Energy Environ. 2017, 6, e236. [Google Scholar] [CrossRef]
  47. Dahmen, N.; Dinjus, E.; Kolb, T.; Arnold, U.; Leibold, H.; Stahl, R. State of the Art of the Bioliq® Process for Synthetic Biofuels Production. Environ. Prog. Sustain. Energy 2012, 31, 176–181. [Google Scholar] [CrossRef]
  48. Pfitzer, C.; Dahmen, N.; Tröger, N.; Weirich, F.; Sauer, J.; Günther, A.; Müller-Hagedorn, M. Fast Pyrolysis of Wheat Straw in the Bioliq® Pilot Plant. Energy Fuels 2016, 30, 8047–8054. [Google Scholar] [CrossRef]
  49. Trippe, F.; Fröhling, M.; Schultmann, F.; Stahl, R.; Henrich, E. Techno-Economic Analysis of Fast Pyrolysis as a Process Step Within Biomass-to-Liquid Fuel Production. Waste Biomass Valorization 2010, 1, 415–430. [Google Scholar] [CrossRef]
  50. Dahmen, N.; Henrich, E.; Dinjus, E.; Weirich, F. The bioliq® bioslurry gasification process for the production of biosynfuels, organic chemicals, and energy. Energy Sustain. Soc. 2012, 2, 3. [Google Scholar] [CrossRef]
  51. Ahmad, R.; Schrempp, D.; Behrens, S.; Sauer, J.; Döring, M.; Arnold, U. Zeolite-based bifunctional catalysts for the single step synthesis of dimethyl ether from CO-rich synthesis gas. Fuel Process. Technol. 2014, 121, 38–46. [Google Scholar] [CrossRef]
  52. Stiefel, M.; Ahmad, R.; Arnold, U.; Döring, M. Direct synthesis of dimethyl ether from carbon-monoxide-rich synthesis gas: Influence of dehydration catalysts and operating conditions. Fuel Process. Technol. 2011, 92, 1466–1474. [Google Scholar] [CrossRef]
  53. Zimmermann, M.C.; Otto, T.N.; Wodarz, S.; Zevaco, T.A.; Pitter, S. Mesoporous H-ZSM-5 for the Conversion of Dimethyl Ether to Hydrocarbons. Chem. Ing. Tech. 2019, 91, 1302–1313. [Google Scholar] [CrossRef] [Green Version]
  54. Fujimoto, K.; Asami, K.; Saima, H.; Shikada, T.; Tominaga, H.-O. Two-Stage Reaction System for Synthesis Gas Conversion to Gasoline. Ind. Eng. Chem. Prod. Res. Dev. 1986, 25, 262–267. [Google Scholar] [CrossRef]
  55. Michler, T.; Wippermann, N.; Toedter, O.; Niethammer, B.; Otto, T.; Arnold, U.; Pitter, S.; Koch, T.; Sauer, J. Gasoline from the bioliq® process: Production, characterization and performance. Fuel Process. Technol. 2020, 206, 106476. [Google Scholar] [CrossRef]
  56. Liederman, D.; Yurchak, S.; Kuo, J.C.W.; Lee, W. Mobil Methanol-to-Gasoline Process. J. Energy 1982, 6, 340–341. [Google Scholar] [CrossRef]
  57. Do, P.T.M.; Crossley, S.; Santikunaporn, M.; Resasco, D.E. Catalytic strategies for improving specific fuel properties. Catalysis 2007, 20, 33–64. [Google Scholar] [CrossRef] [Green Version]
  58. McEnally, C.S.; Pfefferle, L.D. Improved sooting tendency measurements for aromatic hydrocarbons and their implications for naphthalene formation pathways. Combust. Flame 2007, 148, 210–222. [Google Scholar] [CrossRef]
  59. Mokrani, T.; Scurrell, M. Gas Conversion to Liquid Fuels and Chemicals: The Methanol Route-Catalysis and Processes Development. Catal. Rev. 2009, 51, 1–145. [Google Scholar] [CrossRef]
  60. Graf, D.; Neuner, P.; Rauch, R. Hydroprocessing and Blending of a Biomass-Based DTG-Gasoline. Energy Eng. 2022, 119, 2169–2192. [Google Scholar] [CrossRef]
  61. Serrano, D.P.; Melero, J.A.; Morales, G.; Iglesias, J.; Pizarro, P. Progress in the design of zeolite catalysts for biomass conversion into biofuels and bio-based chemicals. Catal. Rev. 2017, 60, 1–70. [Google Scholar] [CrossRef]
  62. Andersen, V.F.; Anderson, J.E.; Wallington, T.J.; Mueller, S.A.; Nielsen, O.J. Distillation Curves for Alcohol−Gasoline Blends. Energy Fuels 2010, 24, 2683–2691. [Google Scholar] [CrossRef]
  63. Chen, Y.; Yihao Zhang, Y.; Cheng, W.K. Effects of Ethanol Evaporative Cooling on Particulate Number Emissions in GDI Engines. SAE Tech. Pap. 2018, 2018, 1–9. [Google Scholar] [CrossRef]
  64. Kubic, W.L. A Group Contribution Method for Estimating Cetane and Octane Numbers LA-UR-16-25529; Los Alamos National Lab. (LANL): Los Alamos, NM, USA, 2016. [Google Scholar]
  65. Michalopoulou, D.-P.; Komiotou, M.; Zannikou, Y.; Karonis, D. Impact of Bio-Ethanol, Bio-ETBE Addition on the Volatility of Gasoline with Oxygen Content at the Level of E10. Fuels 2021, 2, 501–520. [Google Scholar] [CrossRef]
  66. Bozzano, G.; Manenti, F. Efficient methanol synthesis: Perspectives, technologies and optimization strategies. Prog. Energy Combust. Sci. 2016, 56, 71–105. [Google Scholar] [CrossRef]
  67. Taljaard, H.C.; Jordaan, C.F.P.; Botha, J.J. The Effect of Oxygen Content in Different Oxygenate-Gasoline Blends on Performance and Emissions in a Single Cylinder, Spark-Ignition Engine. SAE Tech. Pap. 1991, 910379, 1–17. [Google Scholar] [CrossRef]
  68. Lim, S.S.; Vos, T.; Flaxman, A.D.; Danaei, G.; Shibuya, K.; Adair-Rohani, H.; AlMazroa, M.A.; Amann, M.; Anderson, H.R.; Andrews, K.G.; et al. A comparative risk assessment of burden of disease and injury attributable to 67 risk factors and risk factor clusters in 21 regions, 1990–2010: A systematic analysis for the Global Burden of Disease Study 2010. Lancet 2012, 380, 2224–2260. [Google Scholar] [CrossRef] [PubMed] [Green Version]
  69. Ratcliff, M.A.; Windom, B.; Fioroni, G.M.; St. John, P.; Burke, S.; Burton, J.; Christensen, E.D.; Sindler, P.; McCormick, R.L. Impact of ethanol blending into gasoline on aromatic compound evaporation and particle emissions from a gasoline direct injection engine. Appl. Energy 2019, 250, 1618–1631. [Google Scholar] [CrossRef]
  70. Stein, R.A.; House, C.J.; Leone, T.G. Optimal Use of E85 in a Turbocharged Direct Injection Engine. SAE Int. J. Fuels Lubr. 2009, 2, 670–682. [Google Scholar] [CrossRef]
  71. He, X.; Ratcliff, M.A.; Zigler, B.T. Effects of Gasoline Direct Injection Engine Operating Parameters on Particle Number Emissions. Energy Fuels 2012, 26, 2014–2027. [Google Scholar] [CrossRef]
  72. Ketterer, J.E.; Cheng, W.K. On the Nature of Particulate Emissions from DISI Engines at Cold-Fast-Idle. SAE Int. J. Engines 2014, 7, 986–994. [Google Scholar] [CrossRef] [Green Version]
  73. Karonis, D.; Anastopoulos, G.; Lois, E.; Stournas, S. Impact of Simultaneous ETBE and Ethanol Addition on Motor Gasoline Properties. SAE Int. J. Fuels Lubr. 2009, 1, 1584–1594. [Google Scholar] [CrossRef]
  74. ASTM D7345; Standard Test Method for Distillation of Petroleum Products and Liquid Fuels at Atmospheric Pressure (Micro Distillation Method). ASTM International: West Conshohocken, PA, USA, 2017.
  75. Neuner, P.; Graf, D.; Mild, H.; Rauch, R. Catalytic Hydroisomerisation of Fischer–Tropsch Waxes to Lubricating Oil and Investigation of the Correlation between Its Physical Properties and the Chemical Composition of the Corresponding Fuel Fractions. Energies 2021, 14, 4202. [Google Scholar] [CrossRef]
  76. ASTM D6378; Standard Test Method for Determination of Vapor Pressure (VPX) of Petroleum Products, Hydrocarbons, and Hydrocarbon-Oxygenate Mixtures (Triple Expansion Method). ASTM International: West Conshohocken, PA, USA, 2020.
  77. Smith, B.L.; Bruno, T.J. Improvements in the Measurement of Distillation Curves. 3. Application to Gasoline and Gasoline + Methanol Mixtures. Ind. Eng. Chem. Res. 2007, 46, 297–309. [Google Scholar] [CrossRef]
  78. Petre, M.N.; Rosca, P.; Dragomir, R.-E. The Effect of Bio-ethers on the Volatility Properties of Oxygenated Gasoline. Rev. Chim. 2011, 62, 567–574. [Google Scholar]
  79. Furey, R.L.; Perry, K.L. Vapor Pressures of Mixtures of Gasolines and Gasoline-Alcohol Blends. SAE Int. J. Fuels Lubr. 1986, 95, 779–789. [Google Scholar] [CrossRef]
  80. Domańska, U.; Żołek-Tryznowska, Z.; Tshibangu, M.M.; Ramjugernath, D.; Letcher, T.M. Separation of an Alcohol and a Tetrahydrofuran, Methyl tert -Butyl Ether, or Ethyl tert -Butyl Ether by Solvent Extraction with a Hyperbranched Polymer at T = 298.15 K. J. Chem. Eng. Data 2010, 55, 2879–2885. [Google Scholar] [CrossRef]
Figure 1. Boiling curves of bioliq® light gasoline (LG), hydroprocessed (HP) heavy gasoline (HG) for different processing temperatures and hydroprocessed Fischer–Tropsch (FT) wax.
Fuels 04 00010 g001
Figure 2. Influence of blending HG-HP@270 °C (squares), HG-HP@310 °C (circles) and HG-HP@330 °C (triangles) into bioliq® LG on (a) the volatility characteristics E70 (green), E100 (orange) and (b) the vapor pressure.
Fuels 04 00010 g002
Figure 3. Influence of different oxygenates on the volatility characteristics. (a) E70, (b) E100, (c) E150, and (d) vapor pressure.
Fuels 04 00010 g003
Figure 4. Influence of different oxygenates on the boiling curve.
Fuels 04 00010 g004
Figure 5. Influence on (a) the boiling characteristics and vapor pressure and (b) the boiling curve for blends of bioliq® base gasoline and methanol with ethanol, MTBE, and ETBE.
Fuels 04 00010 g005
Figure 6. (a) Petrochemical parameters and (b) boiling curves of blend A and B and bioliq® LG.
Fuels 04 00010 g006
Table 1. Properties of oxygenates in comparison to fossil oxygenate-free gasoline [20,62,63,64,65].
MethanolEthanolMTBEETBEGasoline
RON [-]122111118118≥95
MON [-]9396101102≥85
Tb [°C]64.678.455.273.0≤210
HoV [kJ kg−1]1170921338290≈335–350
O2-content [wt.%]49.934.718.215.7none
Renewable share [wt.%]10010035.2144.100
Table 2. Petrochemical parameters of hydrocarbon streams used for the blending experiments.
ParameterEN 228 [14]bioliq® LGbioliq® HG-HP @ 270 °Cbioliq® HG-HP @ 310 °Cbioliq® HG-HP @ 330 °CFT-HP
RON [-]≥95102.0 ± 2.776.9 ± 2.775.9 ± 2.777.0 ± 2.779.9 ± 2.7
MON [-]≥8591.2 ± 1.079.6 ± 1.077.4 ± 1.077.0 ± 1.073.9 ± 1.0
ρ 1 @ 15 °C [kg m−3]720–775835.02 ± 0.05n.A.n.A.n.A.n.A.
ρ 1 @ 20 °C [kg m−3]-829.30 ± 0.05782.78 ± 0.05753.86 ± 0.05731.20 ± 0.05673.03 ± 0.05
pv 1 (Class A) [kPa]45–6023.0 ± 2.010.0 ± 2.036.0 ± 2.041.0 ± 2.0n.A.
E70 1 (Class A) [vol.%]22–501.1 ± 0.90.05.5 ± 0.914.7 ± 0.935.1 ± 0.9
E100 1 (Class A) [vol.%]46–728.0 ± 0.81.2 ± 0.820.1 ± 0.837.6 ± 0.867.9 ± 0.8
E150 1 (Class A) [vol.%]7590.7 ± 0.639.5 ± 0.666.0 ± 0.681.7 ± 0.696.4 ± 0.6
FBP 1 [°C]≤210163.0 ± 2.0163.0 ± 2.0163.0 ± 2.0163.0 ± 2.0168.0 ± 2.0
φBenzene 1 [vol.%]≤11.4 ± 0.70.00.2 ± 0.70.00.0
φOlefins 1 [ vol.%]≤182.3 ± 0.10.1 ± 0.10.00.00.0
φNaphthenes 1 [vol.%]-5.5 ± 0.196.2 ± 0.179.6 ± 0.167.0 ± 0.14.5 ± 0.1
φParaffins1 [vol.%]-15.3 ± 0.63.2 ± 0.618.8 ± 0.632.5 ± 0.695.5 ± 0.6
φAromatics1 [ vol.%]≤3576.9 ± 0.70.5 ± 0.71.6 ± 0.70.4 ± 0.70.1 ± 0.7
1 Measurement errors estimated using a representative sample.
Table 3. Fractions used for the blends A and B.
Volume Fraction [%]bioliq® LGHG-HP@330 °CFT-HPMethanolEthanolETBE
Blend A42.814.633.73.05.90.0
Blend B42.714.521.23.10.018.5
Disclaimer/Publisher’s Note: The statements, opinions and data contained in all publications are solely those of the individual author(s) and contributor(s) and not of MDPI and/or the editor(s). MDPI and/or the editor(s) disclaim responsibility for any injury to people or property resulting from any ideas, methods, instructions or products referred to in the content.

