

Oxalamide Based Fe(II)-MOFs as Potential Electrode Modifiers for Glucose Detection

 , , ,
, , ,  , , and
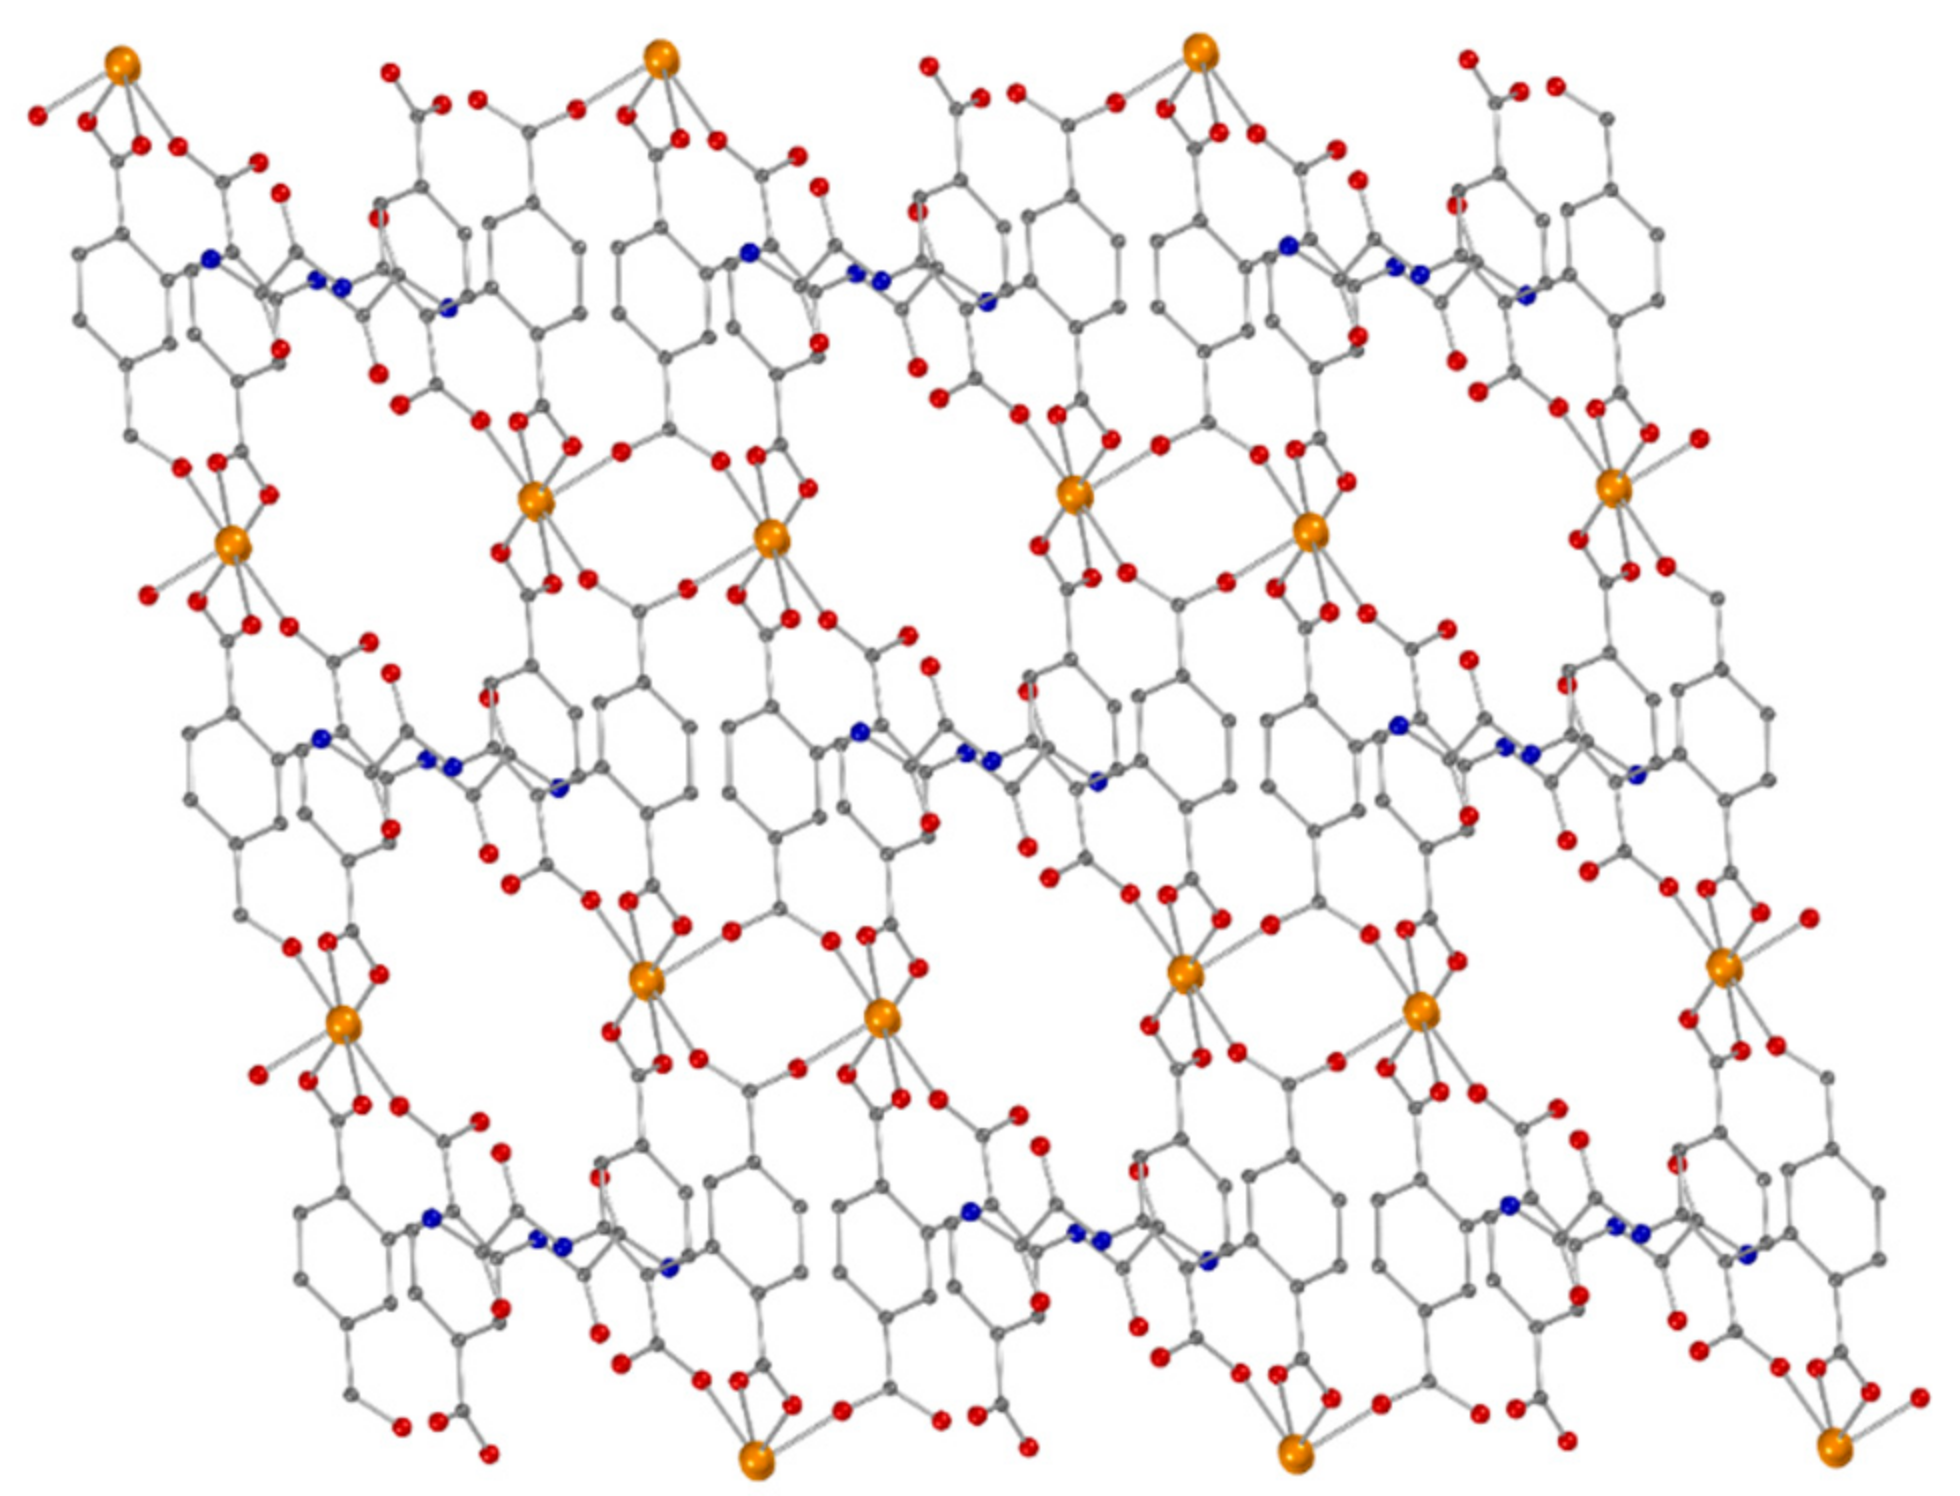
Abstract
:1. Introduction
2. Materials and Methods
2.1. Synthesis and Characterization
2.2. Single Crystal X-ray Crystallography
2.3. Sorption Studies
2.4. Electrochemical Application
3. Results and Discussion
3.1. Synthesis
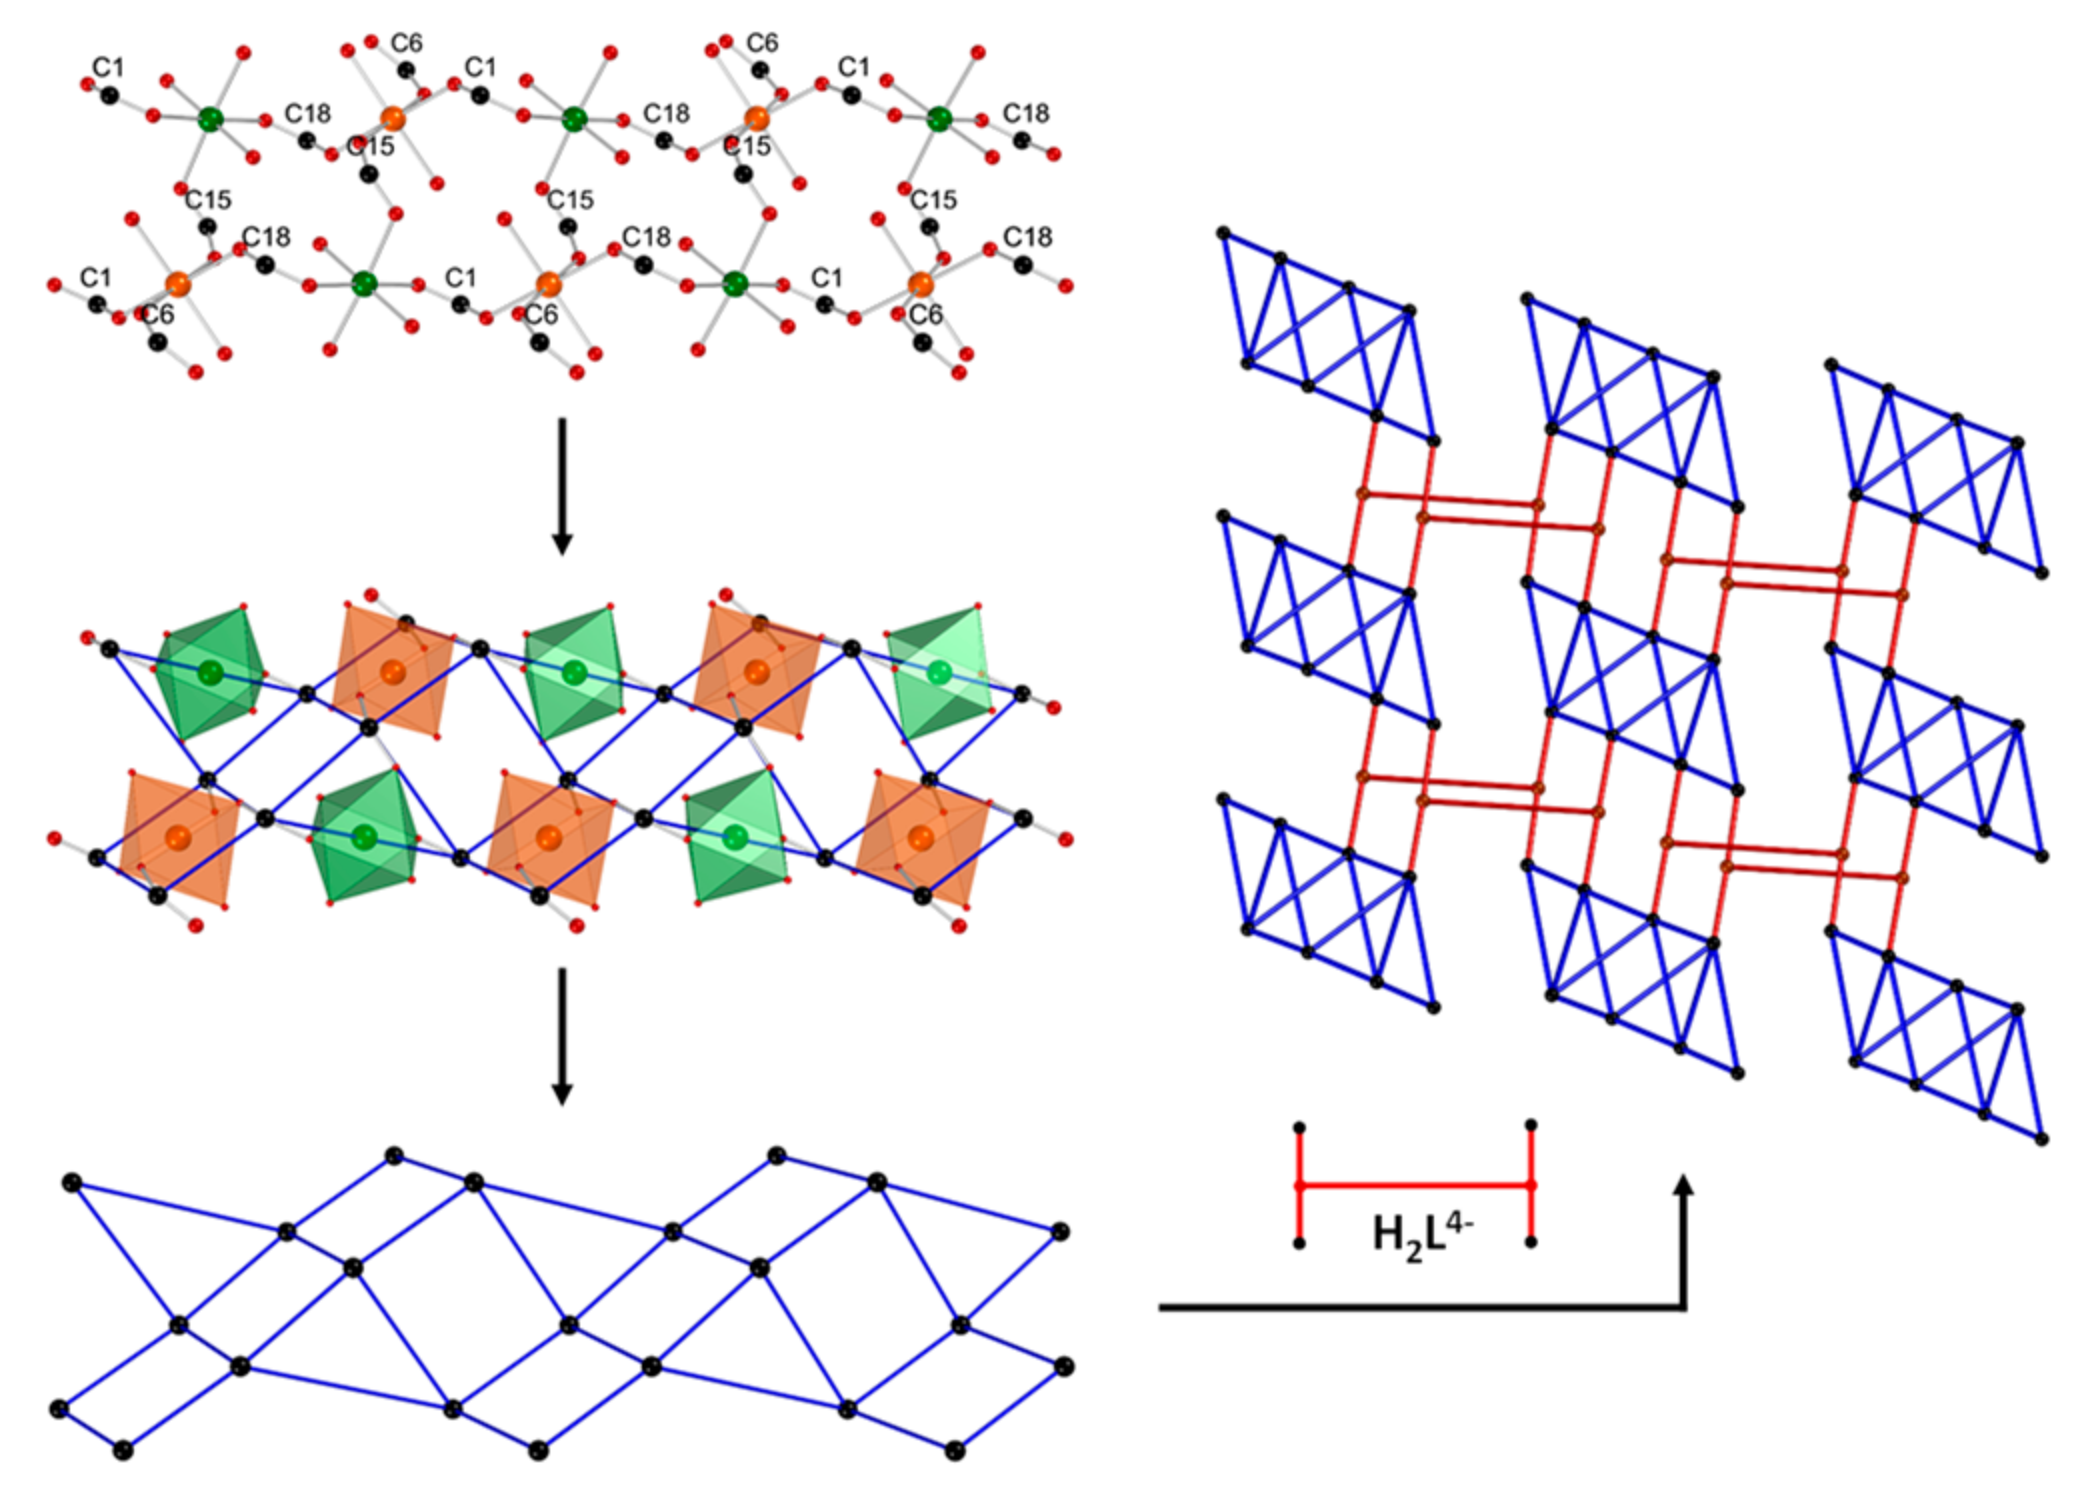
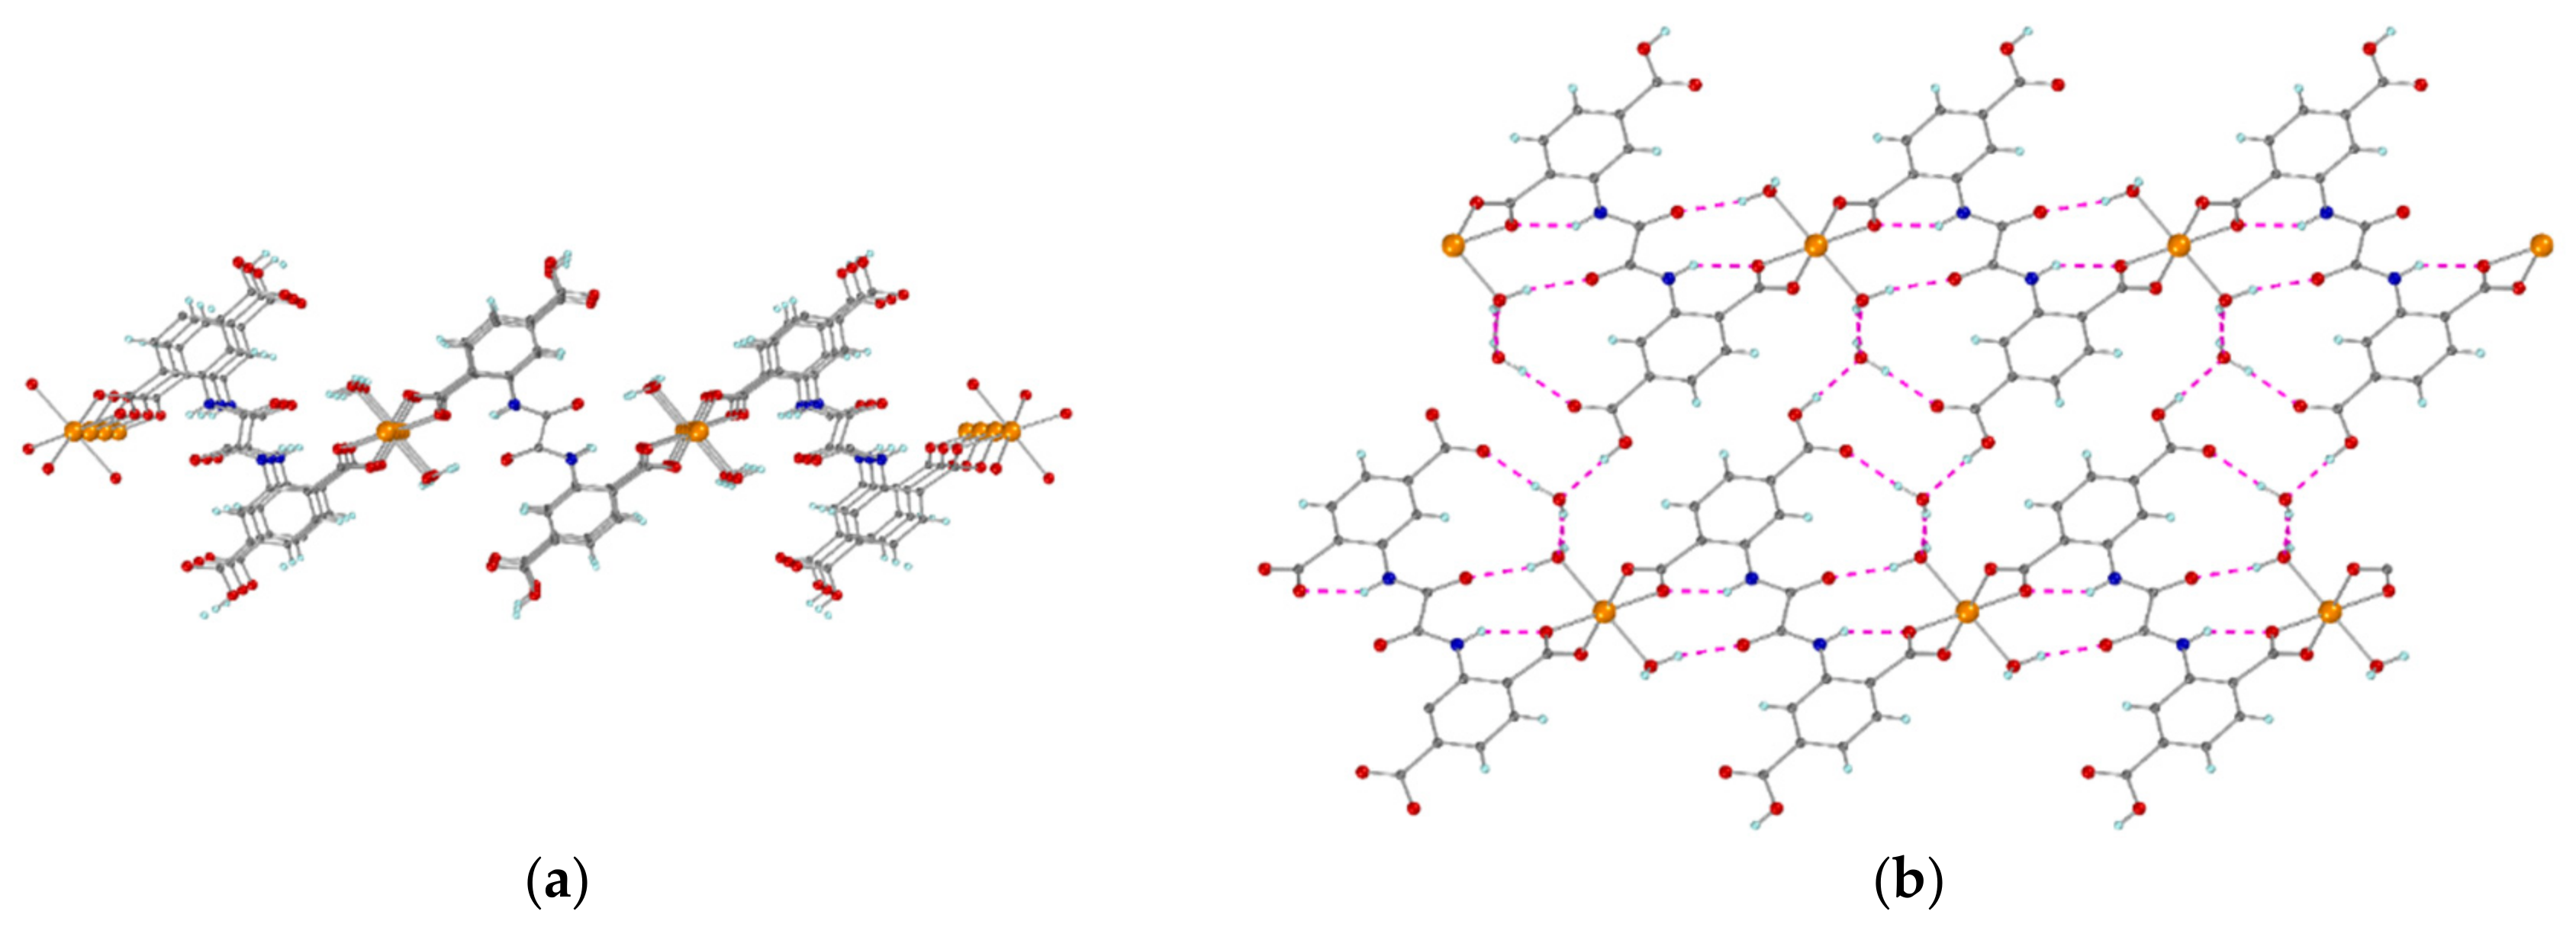
3.2. Description of Structures
3.3. Sorption Study
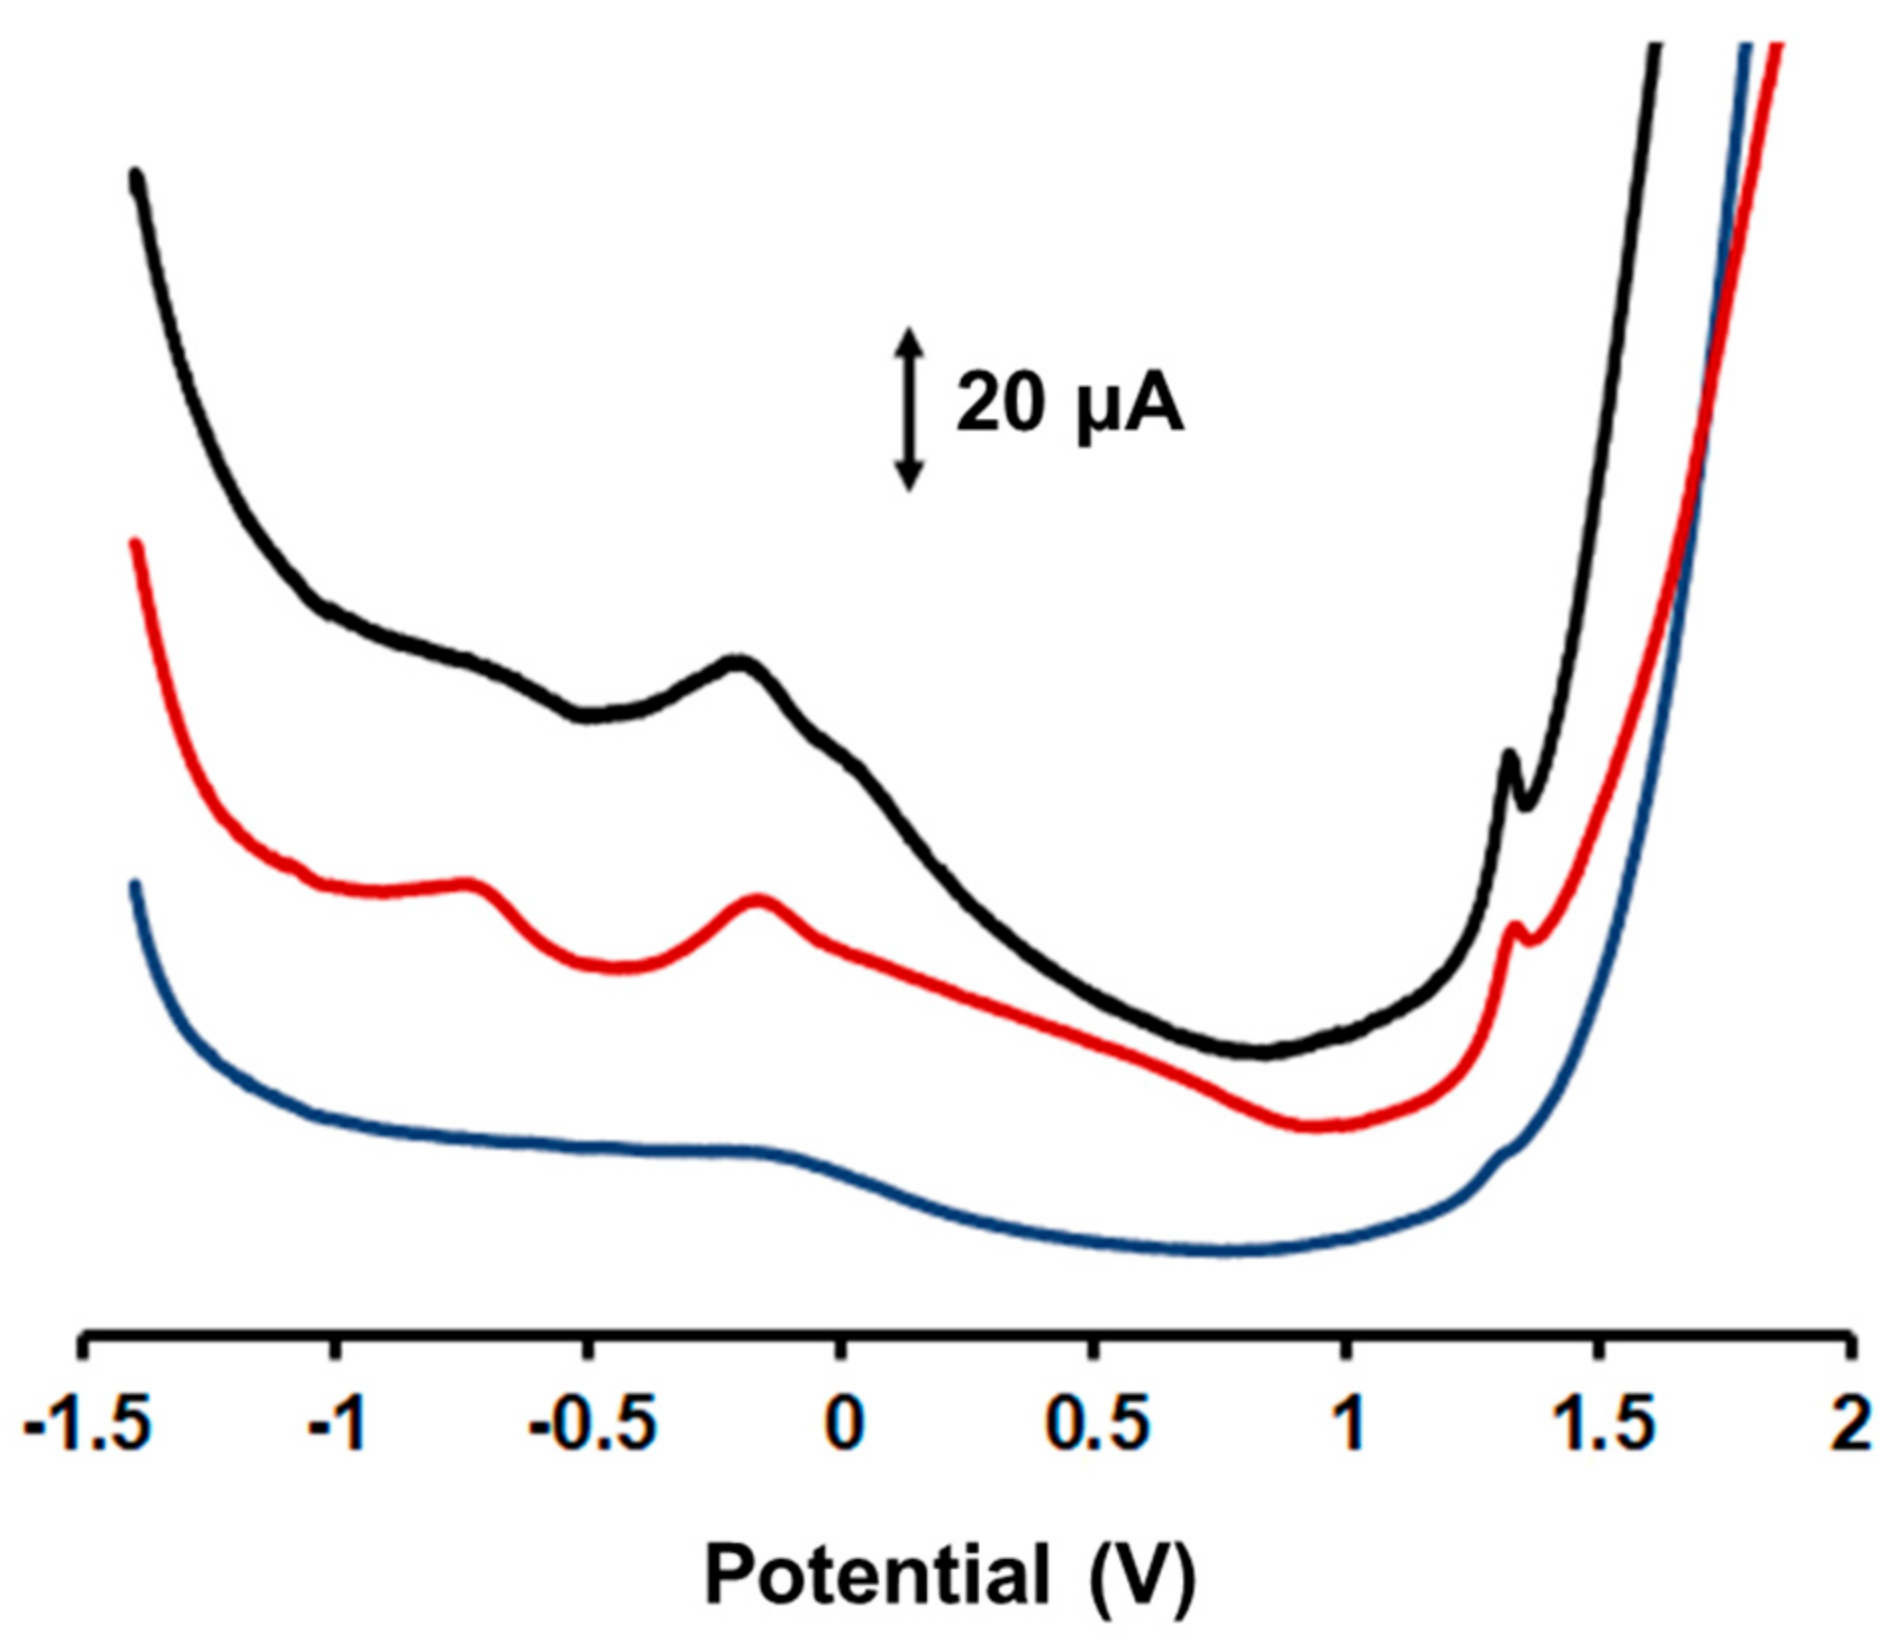
3.4. Preliminary Electrochemical Evaluation of the GPE Modified with 3D-Fe-MOF
4. Conclusions
Supplementary Materials
Author Contributions
Funding
Institutional Review Board Statement
Informed Consent Statement
Data Availability Statement
Conflicts of Interest
References
- Galant, A.L.; Kaufman, R.C.; Wilson, J.D. GLU: Detection and Analysis. Food Chem. 2015, 188, 149–160. [Google Scholar] [CrossRef] [PubMed]
- Sehit, E.; Altintas, Z. Significance of Nanomaterials in Electrochemical GLU Sensors: An Updated Review (2016–2020). Biosens. Bioelectron. 2020, 159, 112165. [Google Scholar] [CrossRef] [PubMed]
- Heller, A.; Feldman, B. Electrochemistry in Diabetes Management. Acc. Chem. Res. 2010, 43, 963–973. [Google Scholar] [CrossRef] [PubMed]
- Guth, U.; Vonau, W.; Zosel, J. Recent Developments in Electrochemical Sensor Application and Technology—A Review. Meas. Sci. Technol. 2009, 20, 14. [Google Scholar] [CrossRef]
- Bandodkar, A.J.; Jeang, W.J.; Ghaffari, R.; Rogers, J.A. Wearable Sensors for Biochemical Sweat Analysis. Annu. Rev. Anal. Chem. 2019, 12, 201–224. [Google Scholar] [CrossRef] [Green Version]
- Karpova, E.V.; Karyakina, E.E.; Karyakin, A.A. Wearable Non-Invasive Monitors of Diabetes and Hypoxia through Continuous Analysis of Sweat. Talanta 2020, 215, 120922. [Google Scholar] [CrossRef]
- Xue, Q.; Li, Z.; Wang, Q.; Pan, W.; Chang, Y.; Duan, X. Nanostrip Flexible Microwave Enzymatic Biosensor for Noninvasive Epidermal GLU Sensing. Nanoscale Horiz. 2020, 5, 934–943. [Google Scholar] [CrossRef]
- Park, S.; Boo, H.; Chung, T.D. Electrochemical Non-Enzymatic GLU Sensors. Anal. Chim. Acta 2006, 556, 46–57. [Google Scholar] [CrossRef]
- Hwang, D.W.; Lee, S.; Seo, M.; Chung, T.D. Recent Advances in Electrochemical Non-Enzymatic GLU Sensors—A Review. Anal. Chim. Acta 2018, 1033, 1–34. [Google Scholar] [CrossRef]
- Katseli, V.; Economou, A.; Kokkinos, C. Smartphone-Addressable 3D-Printed Electrochemical Ring for Nonenzymatic Self-Monitoring of GLU in Human Sweat. Anal. Chem. 2021, 93, 3331–3336. [Google Scholar] [CrossRef]
- Abrori, S.A.; Septiani, N.L.W.; Nugraha; Anshori, I.; Suyatman; Suendo, V.; Yuliarto, B. Metal-Organic-Framework Febdc-Derived Fe3o4 for Non-Enzymatic Electrochemical Detection of GLU. Sensors 2020, 20, 4891. [Google Scholar] [CrossRef]
- Vasiliou, F.; Plessas, A.K.; Economou, A.; Thomaidis, N.; Papaefstathiou, G.S.; Kokkinos, C. Graphite Paste Sensor Modified with a Cu(II)-Complex for the Enzyme-Free Simultaneous Voltammetric Determination of GLU and Uric Acid in Sweat. J. Electroanal. Chem. 2022, 917, 116393. [Google Scholar] [CrossRef]
- Zhou, H.C.; Long, J.R.; Yaghi, O.M. Introduction to Metal-Organic Frameworks. Chem. Rev. 2012, 112, 673–674. [Google Scholar] [CrossRef] [PubMed]
- Moutzouris, N.; Moushi, E.E.; Tziotzi, T.G.; Tarlas, G.D.; Tasiopoulos, A.J.; Escuer, A.; Papaefstathiou, G.S. Metallo-Ligand Based 3d/4f Coordination Polymers: Synthesis, Structure and Magnetic Properties. Eur. J. Inorg. Chem. 2022, 12, e202200024. [Google Scholar] [CrossRef]
- Li, L.; Zou, J.; Han, Y.; Liao, Z.; Lu, P.; Nezamzadeh-Ejhieh, A.; Liu, J.; Peng, Y. Recent advances in Al(iii)/In(iii)-based MOFs for the detection of pollutants. N. J. Chem. 2022, 46, 19577–19592. [Google Scholar] [CrossRef]
- Zheng, M.; Chen, J.; Zhang, L.; Cheng, Y.; Lu, C.; Liu, Y.; Singh, A.; Trivedi, M.; Kumar, A.; Liu, J. Metal Organic Frameworks as Efficient Adsorbents for Drugs from Wastewater. Mater. Today Commun. 2022, 31, 103514. [Google Scholar] [CrossRef]
- Zhong, Y.; Chen, C.; Liu, S.; Lu, C.; Liu, D.; Pan, Y.; Sakiyama, H.; Muddassir, M.; Liu, J. A New Magnetic Adsorbent of Eggshell-Zeolitic Imidazolate Framework for Highly Efficient Removal of Norfloxacin. Dalton Trans. 2021, 50, 18016–18026. [Google Scholar] [CrossRef] [PubMed]
- Dong, X.; Li, Y.; Li, D.; Liao, D.; Qin, T.; Prakash, O.; Kumar, A.; Liu, J. A New 3D 8-Connected Cd(II) MOF as a Potent Photocatalyst for Oxytetracycline Antibiotic Degradation. CrystEngComm 2022, 24, 6933–6943. [Google Scholar] [CrossRef]
- Yi, X.; Dong, W.; Zhang, X.; Xie, J.; Huang, Y. MIL-53(Fe) MOF-Mediated Catalytic Chemiluminescence for Sensitive Detection of GLU. Anal. Bioanal. Chem. 2016, 408, 8805–8812. [Google Scholar] [CrossRef]
- Hu, Q.; Qin, J.; Wang, X.F.; Ran, G.Y.; Wang, Q.; Liu, G.X.; Ma, J.P.; Ge, J.Y.; Wang, H.Y. Cu-Based Conductive MOF Grown in Situ on Cu Foam as a Highly Selective and Stable Non-Enzymatic GLU Sensor. Front. Chem. 2021, 9, 786970. [Google Scholar] [CrossRef]
- Xuan, X.; Qian, M.; Pan, L.; Lu, T.; Han, L.; Yu, H.; Wan, L.; Niu, Y.; Gong, S. A Longitudinally Expanded Ni-Based Metal-Organic Framework with Enhanced Double Nickel Cation Catalysis Reaction Channels for a Non-Enzymatic Sweat GLU Biosensor. J. Mater. Chem. B 2020, 8, 9094–9109. [Google Scholar] [CrossRef] [PubMed]
- Zhao, Z.; Huang, Y.; Liu, W.; Ye, F.; Zhao, S. Immobilized GLU Oxidase on Boronic Acid-Functionalized Hierarchically Porous MOF as an Integrated Nanozyme for One-Step GLU Detection. ACS Sustain. Chem. Eng. 2020, 8, 4481–4488. [Google Scholar] [CrossRef]
- Zhang, D.; Zhang, J.; Zhang, R.; Shi, H.; Guo, Y.; Guo, X.; Li, S.; Yuan, B. 3D Porous Metal-Organic Framework as an Efficient Electrocatalyst for Nonenzymatic Sensing Application. Talanta 2015, 144, 1176–1181. [Google Scholar] [CrossRef] [PubMed]
- Zhang, L.; Ding, Y.; Li, R.; Ye, C.; Zhao, G.; Wang, Y. Ni-Based Metal-Organic Framework Derived Ni@C Nanosheets on a Ni Foam Substrate as a Supersensitive Non-Enzymatic GLU Sensor. J. Mater. Chem. B 2017, 5, 5549–5555. [Google Scholar] [CrossRef]
- Zhang, L.; Ma, X.; Liang, H.; Lin, H.; Zhao, G. A Non-Enzymatic GLU Sensor with Enhanced Anti-Interference Ability Based on a MIL-53(NiFe) Metal-Organic Framework. J. Mater. Chem. B 2019, 7, 7006–7013. [Google Scholar] [CrossRef]
- Liu, Y.L.; Zhao, X.J.; Yang, X.X.; Li, Y.F. A Nanosized Metal-Organic Framework of Fe-MIL-88NH2 as a Novel Peroxidase Mimic Used for Colorimetric Detection of GLU. Analyst 2013, 138, 4526–4531. [Google Scholar] [CrossRef]
- Margariti, A.; Rapti, S.; Katsenis, A.D.; Friščić, T.; Georgiou, Y.; Manos, M.J.; Papaefstathiou, G.S. Cu2+ Sorption from Aqueous Media by a Recyclable Ca2+ Framework. Inorg. Chem. Front. 2017, 4, 773–781. [Google Scholar] [CrossRef]
- Margariti, A.; Pournara, A.D.; Manos, M.J.; Lazarides, T.; Papaefstathiou, G.S. Towards White-Light Emission by Tb3+/Eu3+ Substitution in a Ca2+ Framework. Polyhedron 2018, 153, 24–30. [Google Scholar] [CrossRef]
- Tarlas, G.D.; Katsenis, A.D.; Papaefstathiou, G.S. An I2O1 Barium Framework Derived from an In-Situ Metal-Assisted Ligand Transformation. Eur. J. Inorg. Chem. 2018, 2018, 4458–4464. [Google Scholar] [CrossRef]
- Pournara, A.D.; Tarlas, G.D.; Papaefstathiou, G.S.; Manos, M.J. Chemically Modified Electrodes with MOFs for the Determination of Inorganic and Organic Analytes via Voltammetric Techniques: A Critical Review. Inorg. Chem. Front. 2019, 6, 3440–3455. [Google Scholar] [CrossRef]
- Pournara, A.D.; Margariti, A.; Tarlas, G.D.; Kourtelaris, A.; Petkov, V.; Kokkinos, C.; Economou, A.; Papaefstathiou, G.S.; Manos, M.J. A Ca2+ MOF Combining Highly Efficient Sorption and Capability for Voltammetric Determination of Heavy Metal Ions in Aqueous Media. J. Mater. Chem. A 2019, 7, 15432–15443. [Google Scholar] [CrossRef] [Green Version]
- Kokkinos, C.; Economou, A.; Pournara, A.; Manos, M.; Spanopoulos, I.; Kanatzidis, M.; Tziotzi, T.; Petkov, V.; Margariti, A.; Oikonomopoulos, P.; et al. 3D-Printed Lab-in-a-Syringe Voltammetric Cell Based on a Working Electrode Modified with a Highly Efficient Ca-MOF Sorbent for the Determination of Hg(II). Sens. Actuators B Chem. 2020, 321, 128508. [Google Scholar] [CrossRef]
- Margariti, A.; Moushi, E.; Tasiopoulos, A.J.; Escuer, A.; Papaefstathiou, G.S. Oxalamide Based Coordination Polymers. J. Coord. Chem. 2021, 74, 252–265. [Google Scholar] [CrossRef]
- Vlachou, E.; Margariti, A.; Papaefstathiou, G.S.; Kokkinos, C. Voltammetric Determination of Pb(II) by a Ca-MOF-Modified Carbon Paste Electrode Integrated in a 3D-Printed Device. Sensors 2020, 20, 4442. [Google Scholar] [CrossRef]
- Bruker. APEX2 (v2010.5-0); Bruker AXS Inc.: Madison, WI, USA, 2010. [Google Scholar]
- Sheldrick, G.M. Program for Empirical Absorption Correction of Area Detector Data; University of Gottingen: Gottingen, Germany, 1996. [Google Scholar]
- Sheldrick, G.M. A Short History of SHELX. Acta Crystallogr. Sect. A Found. Crystallogr. 2008, 64, 112–122. [Google Scholar] [CrossRef] [Green Version]
- Dolomanov, O.V.; Bourhis, L.J.; Gildea, R.J.; Howard, J.A.K.; Puschmann, H. OLEX2: A Complete Structure Solution, Refinement and Analysis Program. J. Appl. Crystallogr. 2009, 42, 339–341. [Google Scholar] [CrossRef]
- Zhao, J.P.; De Han, S.; Zhao, R.; Yang, Q.; Chang, Z.; Bu, X.H. Tuning the Structure and Magnetism of Heterometallic Sodium(1+)-Cobalt(2+) Formate Coordination Polymers by Varying the Metal Ratio and Solvents. Inorg. Chem. 2013, 52, 2862–2869. [Google Scholar] [CrossRef]
- Mylonas-Margaritis, I.; Mayans, J.; Tong, W.; Farràs, P.; Escuer, A.; McArdle, P.; Papatriantafyllopoulou, C. Synthesis and Characterization of New Coordination Compounds by the Use of 2-Pyridinemethanol and Di- or Tricarboxylic Acids. CrystEngComm 2021, 23, 5489–5497. [Google Scholar] [CrossRef]
- Zhao, J.P.; Xu, J.; De Han, S.; Wang, Q.L.; Bu, X.H. A Niccolite Structural Multiferroic Metal–Organic Framework Possessing Four Different Types of Bistability in Response to Dielectric and Magnetic Modulation. Adv. Mater. 2017, 29, 1606966. [Google Scholar] [CrossRef]
- Li, Y.W.; Yan, H.; Hu, T.L.; Ma, H.Y.; Li, D.C.; Wang, S.N.; Yao, Q.X.; Dou, J.M.; Xu, J.; Bu, X.H. Two Microporous Fe-Based MOFs with Multiple Active Sites for Selective Gas Adsorption. Chem. Commun. 2017, 53, 2394–2397. [Google Scholar] [CrossRef]
- Zhang, T.Z.; Lu, Y.; Li, Y.G.; Zhang, Z.; Chen, W.L.; Fu, H.; Wang, E.B. Metal-Organic Frameworks Constructed from Three Kinds of New Fe-Containing Secondary Building Units. Inorganica Chim. Acta 2012, 384, 219–224. [Google Scholar] [CrossRef]
- Neravathu, D.; Paloly, A.R.; Sajan, P.; Satheesh, M.; Bushiri, M.J. Hybrid nanomaterial of ZnFe2O4/α-Fe2O3 implanted graphene for electrochemical glucose sensing application. Diam. Relat. Mater. 2020, 106, 107852. [Google Scholar] [CrossRef]
- Xia, C.; Ning, W. A novel non-enzymatic electrochemical glucose sensor modified with FeOOH nanowire. Electrochem. Commun. 2010, 12, 1581–1584. [Google Scholar] [CrossRef]


Disclaimer/Publisher’s Note: The statements, opinions and data contained in all publications are solely those of the individual author(s) and contributor(s) and not of MDPI and/or the editor(s). MDPI and/or the editor(s) disclaim responsibility for any injury to people or property resulting from any ideas, methods, instructions or products referred to in the content. |
© 2022 by the authors. Licensee MDPI, Basel, Switzerland. This article is an open access article distributed under the terms and conditions of the Creative Commons Attribution (CC BY) license (https://creativecommons.org/licenses/by/4.0/).
Share and Cite
Oikonomopoulos, P.; Pagkali, V.; Kritikou, E.; Panara, A.; Kostakis, M.G.; Thomaidis, N.S.; Tziotzi, T.G.; Economou, A.; Kokkinos, C.; Papaefstathiou, G.S. Oxalamide Based Fe(II)-MOFs as Potential Electrode Modifiers for Glucose Detection. Chemistry 2023, 5, 19-30. https://doi.org/10.3390/chemistry5010002
Oikonomopoulos P, Pagkali V, Kritikou E, Panara A, Kostakis MG, Thomaidis NS, Tziotzi TG, Economou A, Kokkinos C, Papaefstathiou GS. Oxalamide Based Fe(II)-MOFs as Potential Electrode Modifiers for Glucose Detection. Chemistry. 2023; 5(1):19-30. https://doi.org/10.3390/chemistry5010002
Chicago/Turabian StyleOikonomopoulos, Panagiotis, Varvara Pagkali, Evangelia Kritikou, Anthi Panara, Marios G. Kostakis, Nicolaos S. Thomaidis, Thomais G. Tziotzi, Anastasios Economou, Christos Kokkinos, and Giannis S. Papaefstathiou. 2023. "Oxalamide Based Fe(II)-MOFs as Potential Electrode Modifiers for Glucose Detection" Chemistry 5, no. 1: 19-30. https://doi.org/10.3390/chemistry5010002