Article

Automatic Detection of Electrodermal Activity Events during Sleep

by
Jacopo Piccini
1,2,*,
Elias August
1,2,
Sami Leon Noel Aziz Hanna
1,2,
Tiina Siilak
1 and
Erna Sif Arnardóttir
1,2,3,4
1
Reykjavik University Sleep Institute, Reykjavik University, Menntavegur 1, 102 Reykjavik, Iceland
2
Department of Engineering, Reykjavik University, Menntavegur 1, 102 Reykjavik, Iceland
3
Department of Computer Science, Reykjavik University, Menntavegur 1, 102 Reykjavik, Iceland
4
Landspitali University Hospital, Hringbraut 101, 101 Reykjavik, Iceland
*
Author to whom correspondence should be addressed.
Signals 2023, 4(4), 877-891; https://doi.org/10.3390/signals4040048
Submission received: 7 October 2023 / Revised: 22 November 2023 / Accepted: 7 December 2023 / Published: 18 December 2023
(This article belongs to the Special Issue Advanced Methods of Biomedical Signal Processing)

Abstract

:
Currently, there is significant interest in developing algorithms for processing electrodermal activity (EDA) signals recorded during sleep. The interest is driven by the growing popularity and increased accuracy of wearable devices capable of recording EDA signals. If properly processed and analysed, they can be used for various purposes, such as identifying sleep stages and sleep-disordered breathing, while being minimally intrusive. Due to the tedious nature of manually scoring EDA sleep signals, the development of an algorithm to automate scoring is necessary. In this paper, we present a novel scoring algorithm for the detection of EDA events and EDA storms using signal processing techniques. We apply the algorithm to EDA recordings from two different and unrelated studies that have also been manually scored and evaluate its performances in terms of precision, recall, and F 1 score. We obtain F 1 scores of about 69% for EDA events and of about 56% for EDA storms. In comparison to the literature values for scoring agreement between experts, we observe a strong agreement between automatic and manual scoring of EDA events and a moderate agreement between automatic and manual scoring of EDA storms. EDA events and EDA storms detected with the algorithm can be further processed and used as training variables in machine learning algorithms to classify sleep health.

1. Introduction

Thermoregulation is a delicate task, deviations from a relatively tight temperature range can lead to organ failure and death. During wakefulness, thermoregulation keeps brain and organ temperatures in homeostasis. During sleep, thermoregulation aligns core body temperature (CBT) with the circadian rhythm [1]. Notably, during rapid eye movement (REM) sleep, a significant reduction in thermoregulatory capabilities has been observed. This decrease has been explained through energy considerations: during REM sleep, the brain’s activity resembles wakefulness and it requires more energy, which reduces the energy available for thermoregulation [2]. One of the mechanisms used by the sympathetic nervous system (SNS) to decrease CBT is sweat, which enables heat dissipation through vaporisation [3]. Abnormal sweat patterns have been observed in connection with sleep-related breathing disorders [4]. Particularly, obstructive sleep apnoea (OSA) is known to cause excessive sweating [5]. A person with OSA repeatedly stops breathing [6], which hinders heat dissipation by means of exhalation and triggers heat dissipation by means of sweating instead.
Since, during sleep, sweat dynamics vary depending on sleep stage and health conditions, analysing sweat dynamics provides means to determine the latter two. Furthermore, sweat dynamics strongly relate to SNS activations, which provides a unique opportunity to study the SNS with minimal external disturbance. A proxy for capturing changes in sweat production is measuring fluctuations in the electrical properties of the skin caused by changes in skin hydration levels. They are measured indirectly either by measuring the resistance or the conductance of the skin, after externally applying a voltage (exosomatic method), or by measuring the voltage of the skin without externally applying a voltage (endosomatic method). One commonly refers to the resulting signal as the electrodermal activity (EDA) signal [7,8]. Despite being the less commonly used method, the endosomatic method is easier to implement [9] and provides “more” physiological insight. We refer the reader to [8] for more details about the two methods.
The first experimental observations of EDA date back to 1860s [7]. However, using the EDA signal became popular only in recent years due to the rise of wearable devices able to record EDA signals [9,10]. During wakefulness, the EDA signal has been used to monitor students’ engagement in the classroom [11], to detect epileptic seizures [12], to assess task-induced stress [13], and to classify emotions [14], to cite but few applications. While the use of the EDA signal during wakefulness is relatively well established now, the use of the EDA signal for assessing sleep is a relatively new field and most algorithms have been developed in the last two years. During sleep, EDA signals are typically used to detect sleep stage [15], to predict sleep quality [16], and to predict the presence of OSA [17].
Analysing or scoring EDA sleep recordings mainly consists of detecting EDA events and EDA storms. EDA events are oscillations in the EDA signal with well-defined amplitude and frequency [18]. These oscillations are not uniformly spread throughout the night. They are more commonly found in non-REM sleep 2, slow wave sleep (SWS), and late-night REM sleep [19,20]. Moreover, it has been observed that abnormal EDA patterns are caused by OSA [21]. EDA storms are time intervals with a significant number of EDA events. They have been first described by Burch [22] as consisting of “a minimum of 5 galvanic skin response peaks per minute for ten consecutive minutes of sleep”. Currently, several alternative definitions, both for EDA events and EDA storms, exist; we refer the interested reader to [23]. In this work, because we apply the endosomatic method for recording the EDA signal, we use the EDA event definition given in [18]; that is, we consider changes in skin potential with amplitude > 50 μV and duration > 1.5 s. The endosomatic method is less commonly used because it records oscillations that are not only monophasic but also biphasic or triphasic and, thus, the recorded EDA events are more difficult to interpret. On the other hand, as mentioned previously, it provides “more” physiological insight. While for exosomatic recordings, several algorithms for the detection of EDA events have been developed using signal processing [24], model-based analysis [25], and convex optimisation [26]; to our knowledge, none have been developed for endosomatic recordings. Note that several alternative definitions of an EDA event have been proposed in the literature for exosomatic recordings. A summary is given in [23].
A common problem that affects EDA recordings, particularly ones of longer duration, is the presence of artefacts in the signal, i.e., the presence of sudden and out-of-scale spikes. Artefacts have different causes [20]. The most prominent ones are movements during sleep and a poor connection between skin and electrodes. To address this problem, supervised as well as unsupervised machine learning (ML) techniques have been proposed for artefact detection in EDA signals [24,27].
In this paper, we present a novel algorithm for the automatic detection of EDA events in endosomatic recordings. We use a traditional signal processing approach rather than a supervised ML one for two reasons. The first one is the relative scarcity of scored endosomatic EDA sleep signal datasets. Manual scoring of EDA events is traditionally not performed due to the difficulty of distinguishing EDA events from artefacts, the tediousness of scoring whole-night EDA signals, and the difficulty of interpreting collected information. The second reason is that the scoring that provides labels for ML algorithms might be incomplete or even wrong, due to the complexity of the EDA signal. As in [19], we use wavelet transforms (WT) to identify and remove artefacts. The basic idea behind wavelet theory is to decompose the signal into a set of wavelets, which are “brief oscillations”, in order to describe it [28,29]. After removing artefacts, we use the Fourier transform (FT) to evaluate the oscillations in terms of frequency and amplitude. We then use the definitions given by Sano and colleagues [23] to detect EDA events and EDA storms. Finally, we validate our algorithm against manual scorings. We use data from both healthy participants and participants with OSA. The participants diagnosed with OSA had various severities of OSA, ranging from mild to severe.
The remainder of the paper is organised as follows. In Section 2.1, we present the data used in this work, the instrumentation used to collect it, and the guidelines used to score EDA signals. In Section 2.2 and Section 2.3, we introduce the theoretical foundations of WT theory and the definition of EDA events. In Section 2.4, we present the algorithm. Section 2.5, Section 2.6, Section 2.7, Section 2.8 and Section 2.9 describe in detail the different parts of the algorithm and the performance indices used to evaluate the algorithm in Section 2.10. The results are presented in Section 3 and then discussed in Section 4. Finally, Section 5 concludes the paper.

2. Materials and Methods

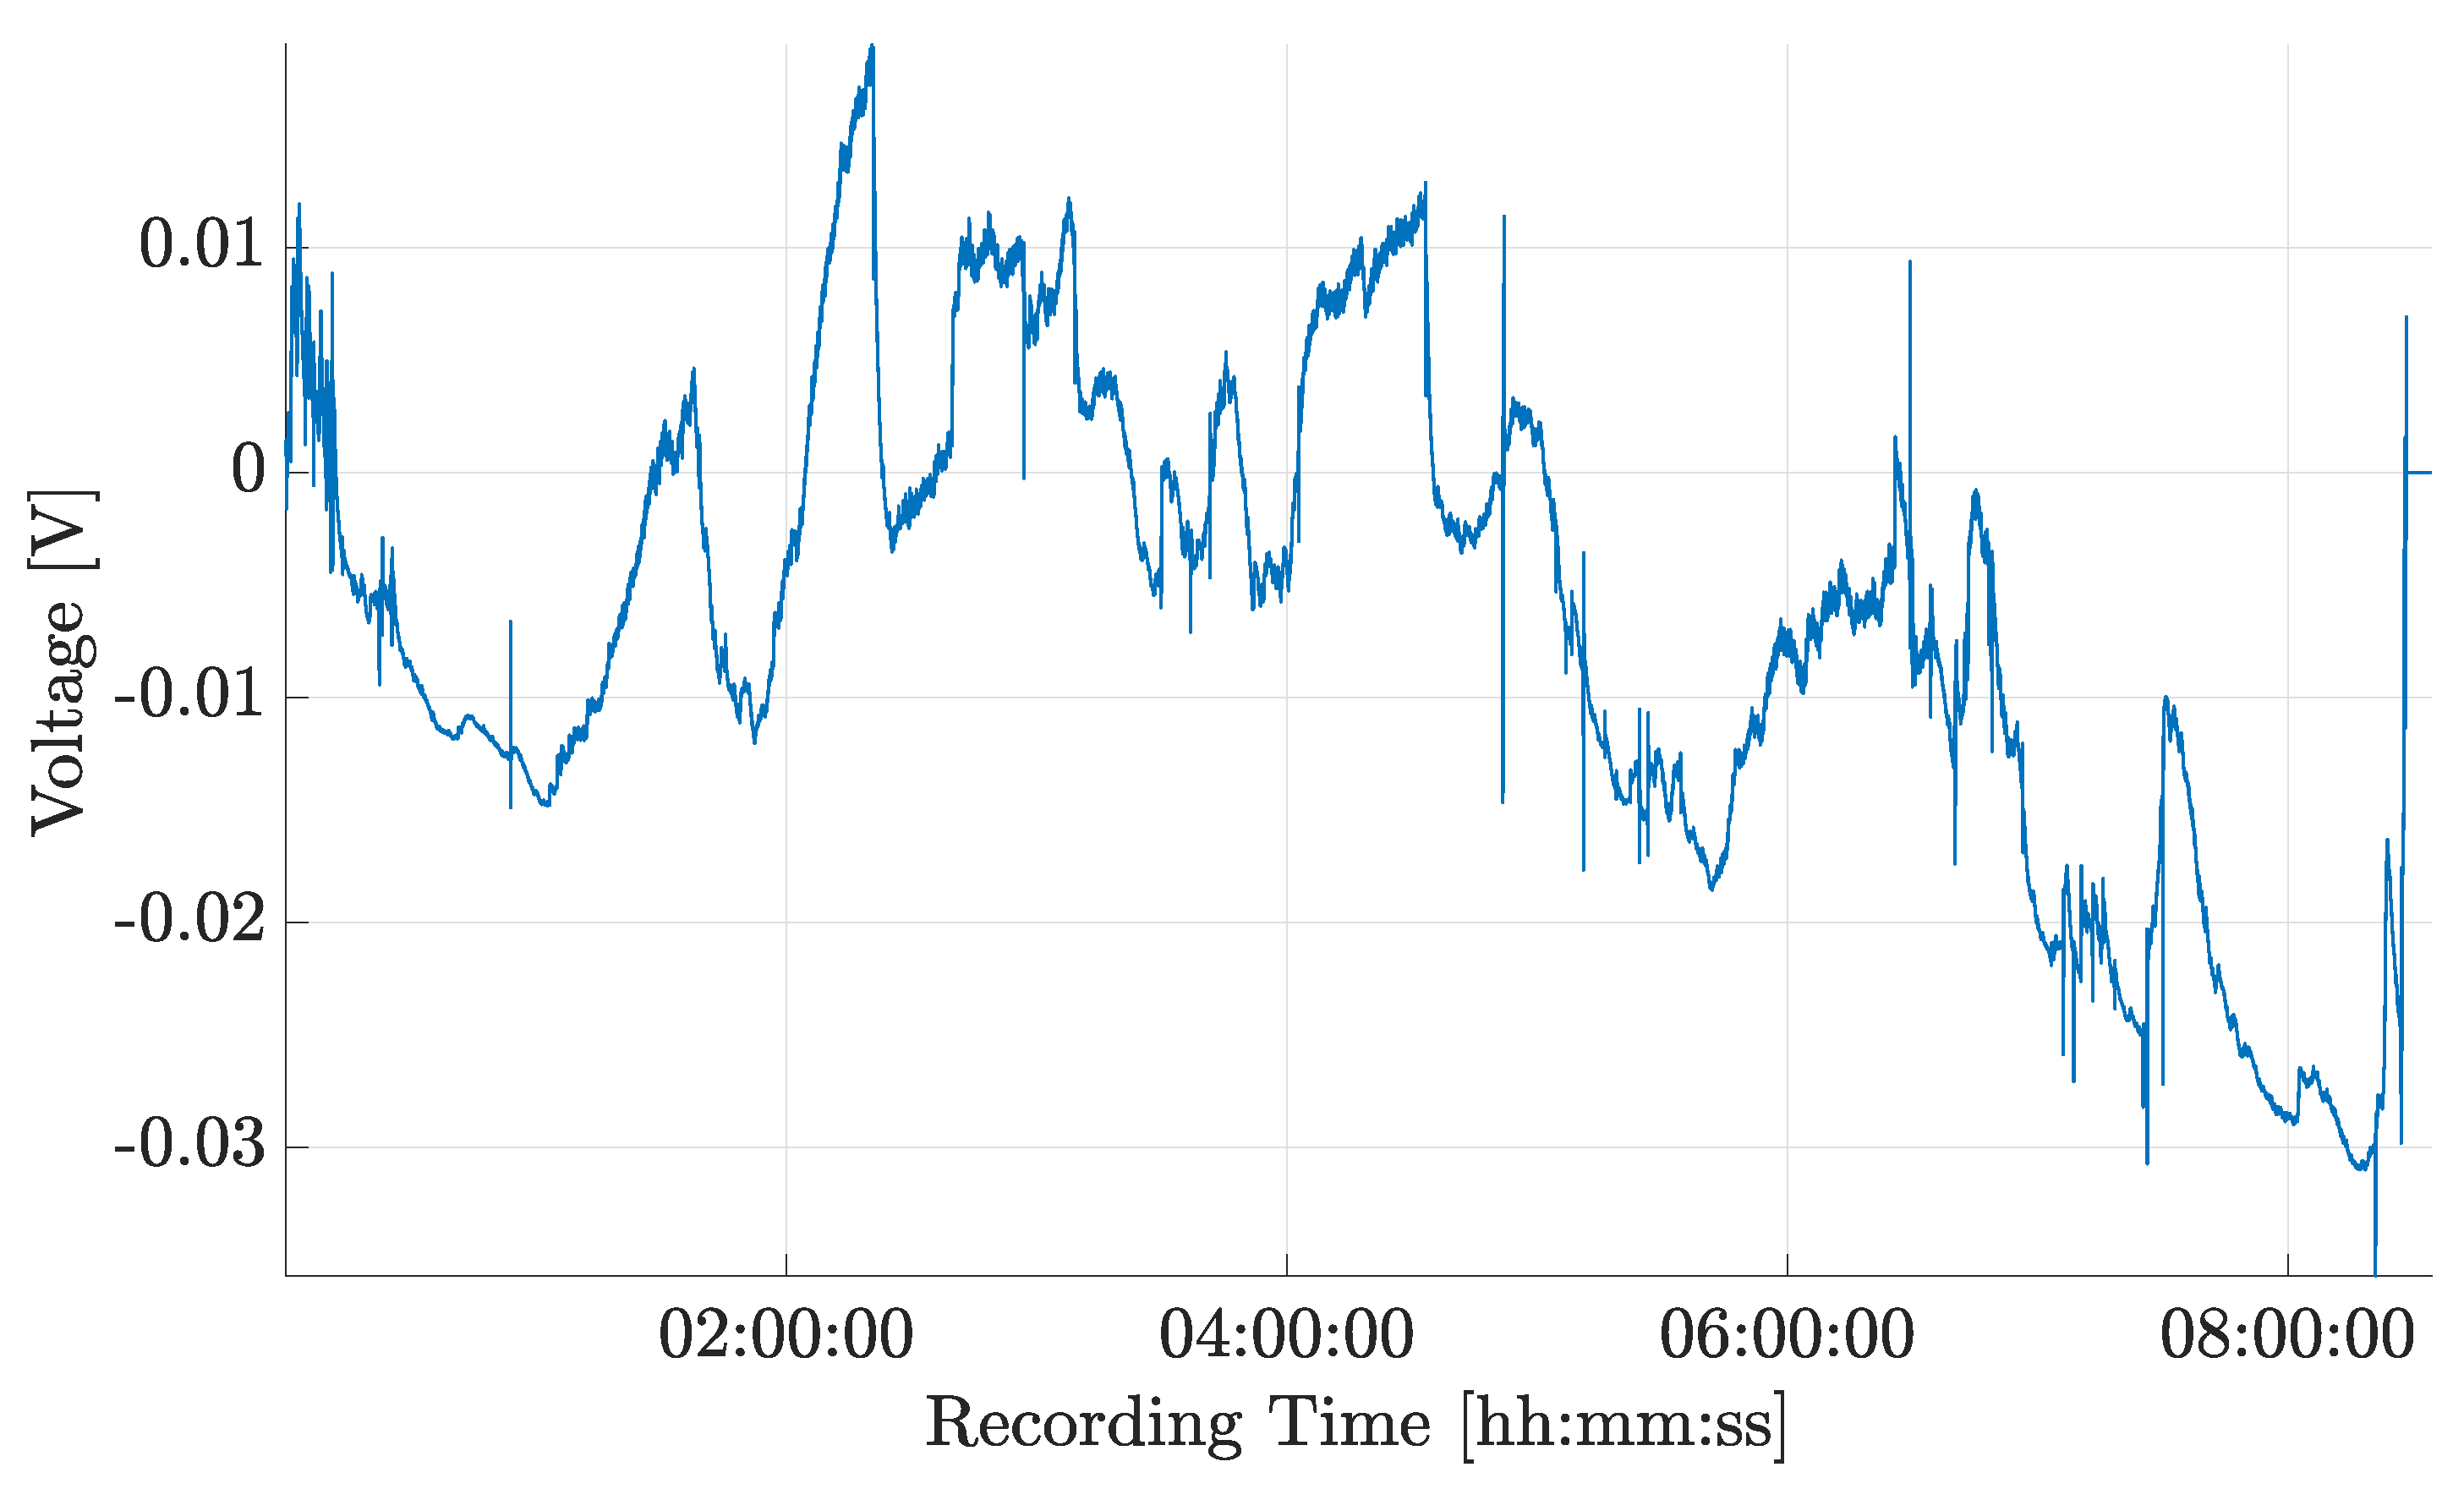
2.1. Data Collection

We used data collected in two different research studies. One dataset consists of 20 scored polysomnography (PSG) recordings from a study carried out in Iceland in 2005 [5]; it contains *.ebm files. The other dataset consists of 30 scored PSG recordings that were made by the Sleep Revolution Project [30] team in 2021–2022. The recordings were exported from Noxturnal software (noxmedical.com) as *.edf files [31]. A representative EDA signal is shown in Figure 1.
EDA manual scoring was performed using either Somnologica software (Somnologica Science 3.3.1; Flaga Inc., Reykjavik, Iceland) for the 2005 recordings or Noxturnal software (Nox Medical, Reykjavik, Iceland) for the 2021–2022 recordings. The sleep technologists applied a high-pass filter with cut-off frequency f h , c u t o f f = 0.3 Hz and a low-pass filter with cut-off frequency f l , c u t o f f = 10 Hz. After filtering the signal, they used the following definition: an EDA event is a change in skin potential > 50 μV and of duration > 1.5 s [5]. Sleep technologists categorised sleep stages using the recommended scoring rules [32,33]. For the automatic signal analysis, segments labelled “awake” were removed.
The data collected in 2005 are described in [5]. Recordings from the Sleep Revolution Project are of persons with either diagnosed or suspected OSA. The average apnoea–hypopnoea index (AHI) is 14.6, the standard deviation is 14.7, and values range from 0.9 to 57.3. Both studies received the approval of the National Bioethics Committee and the Data Protection Authority of Iceland (Sleep Revolution VSN-070). Informed consent was obtained by participants prior to data collection.

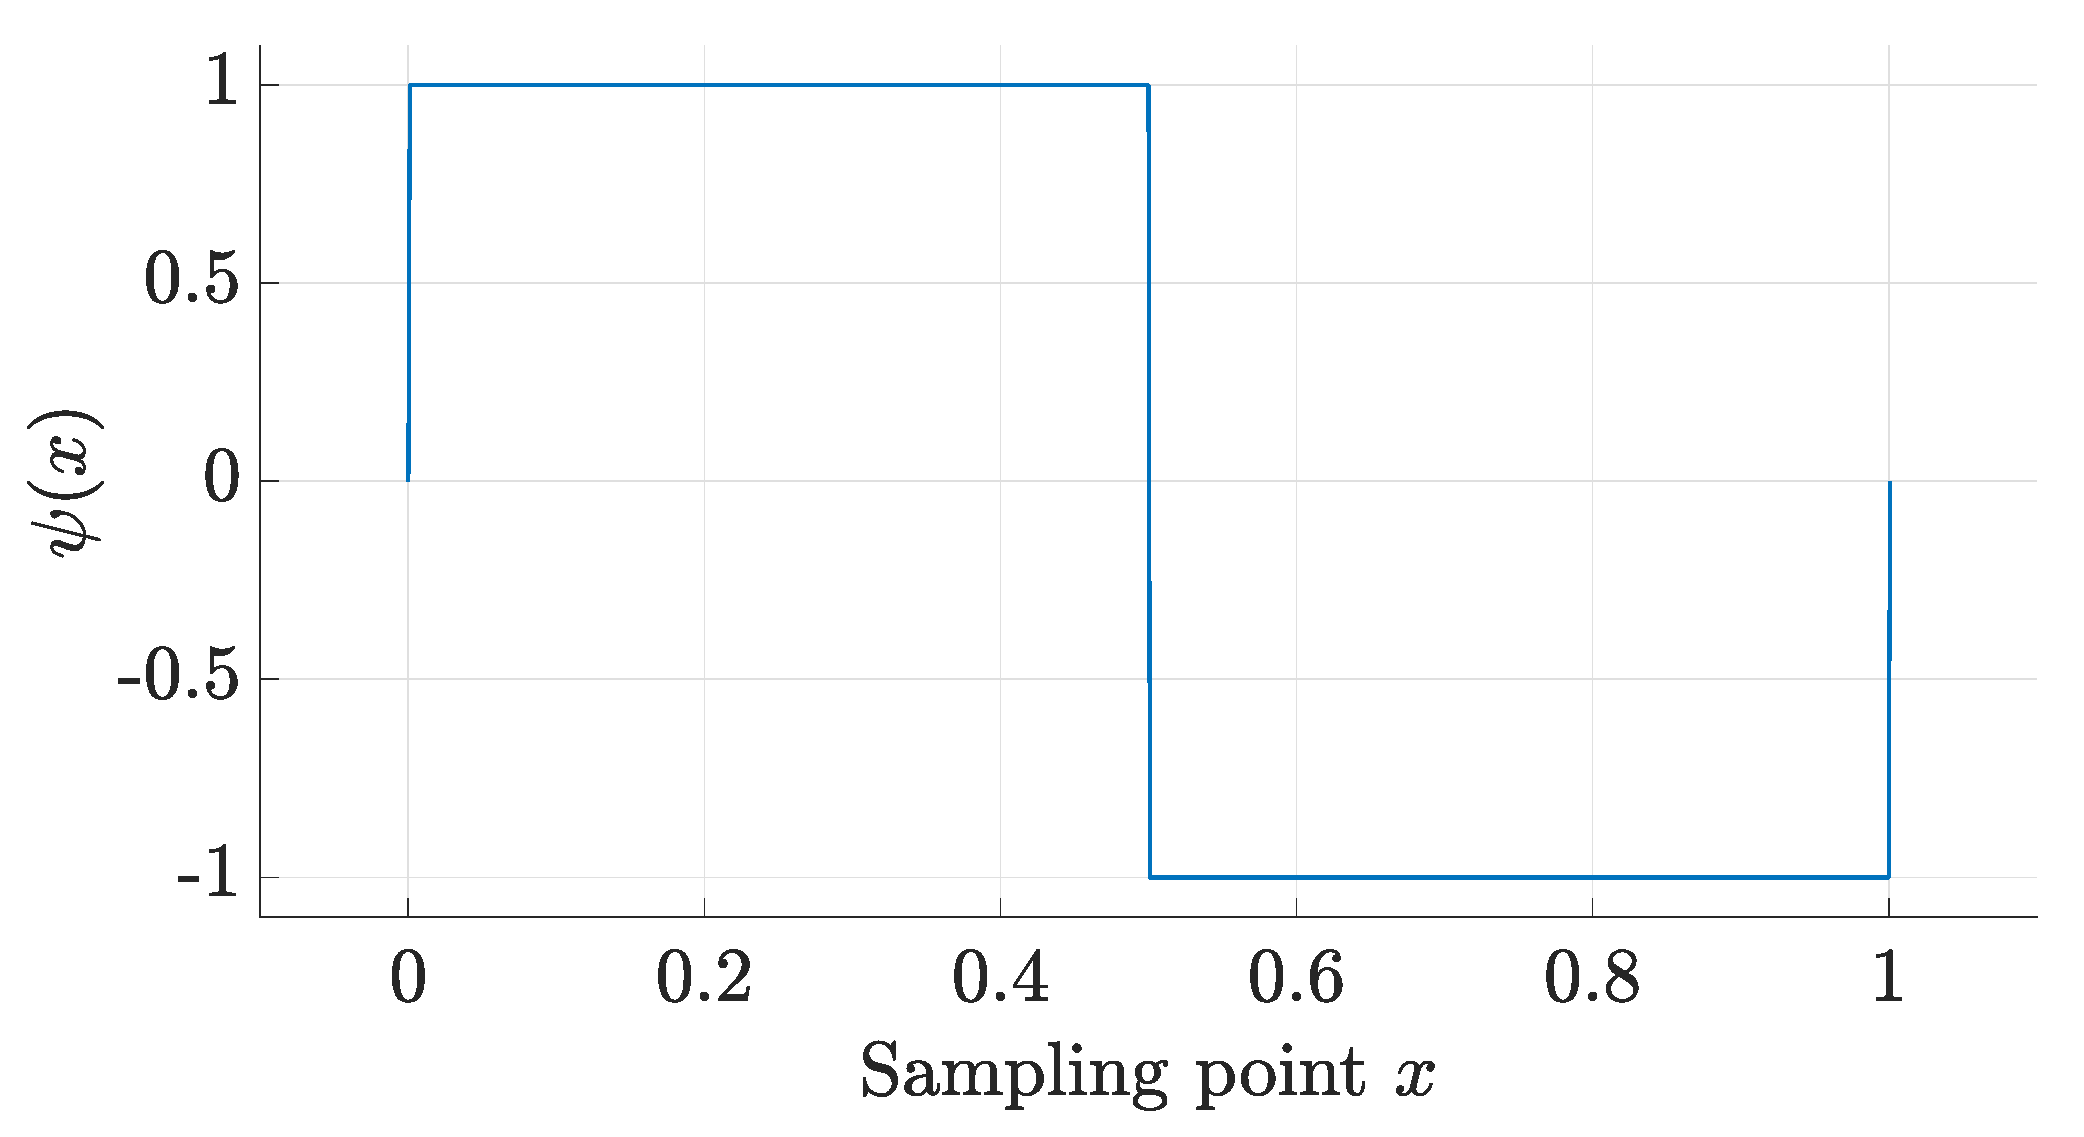
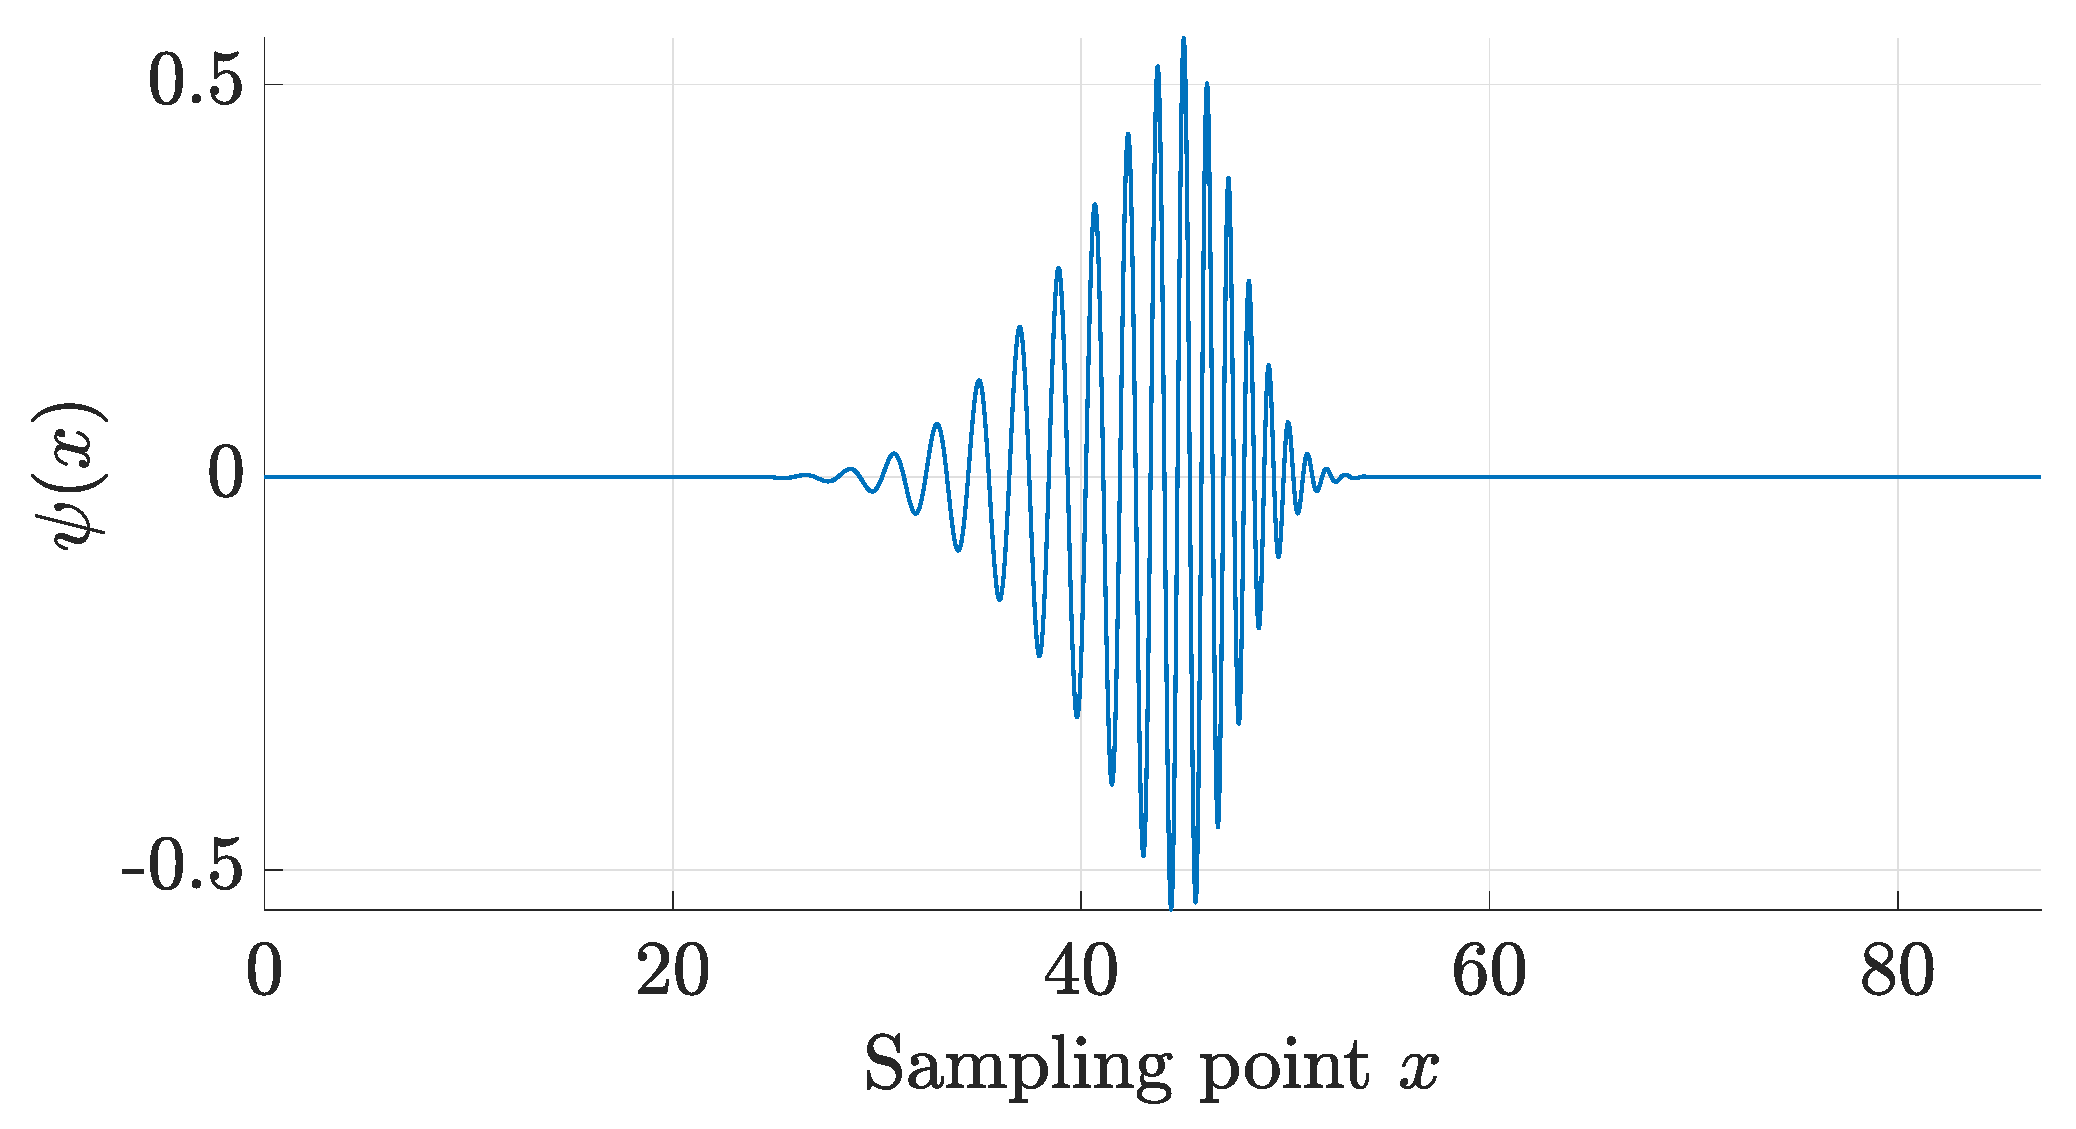
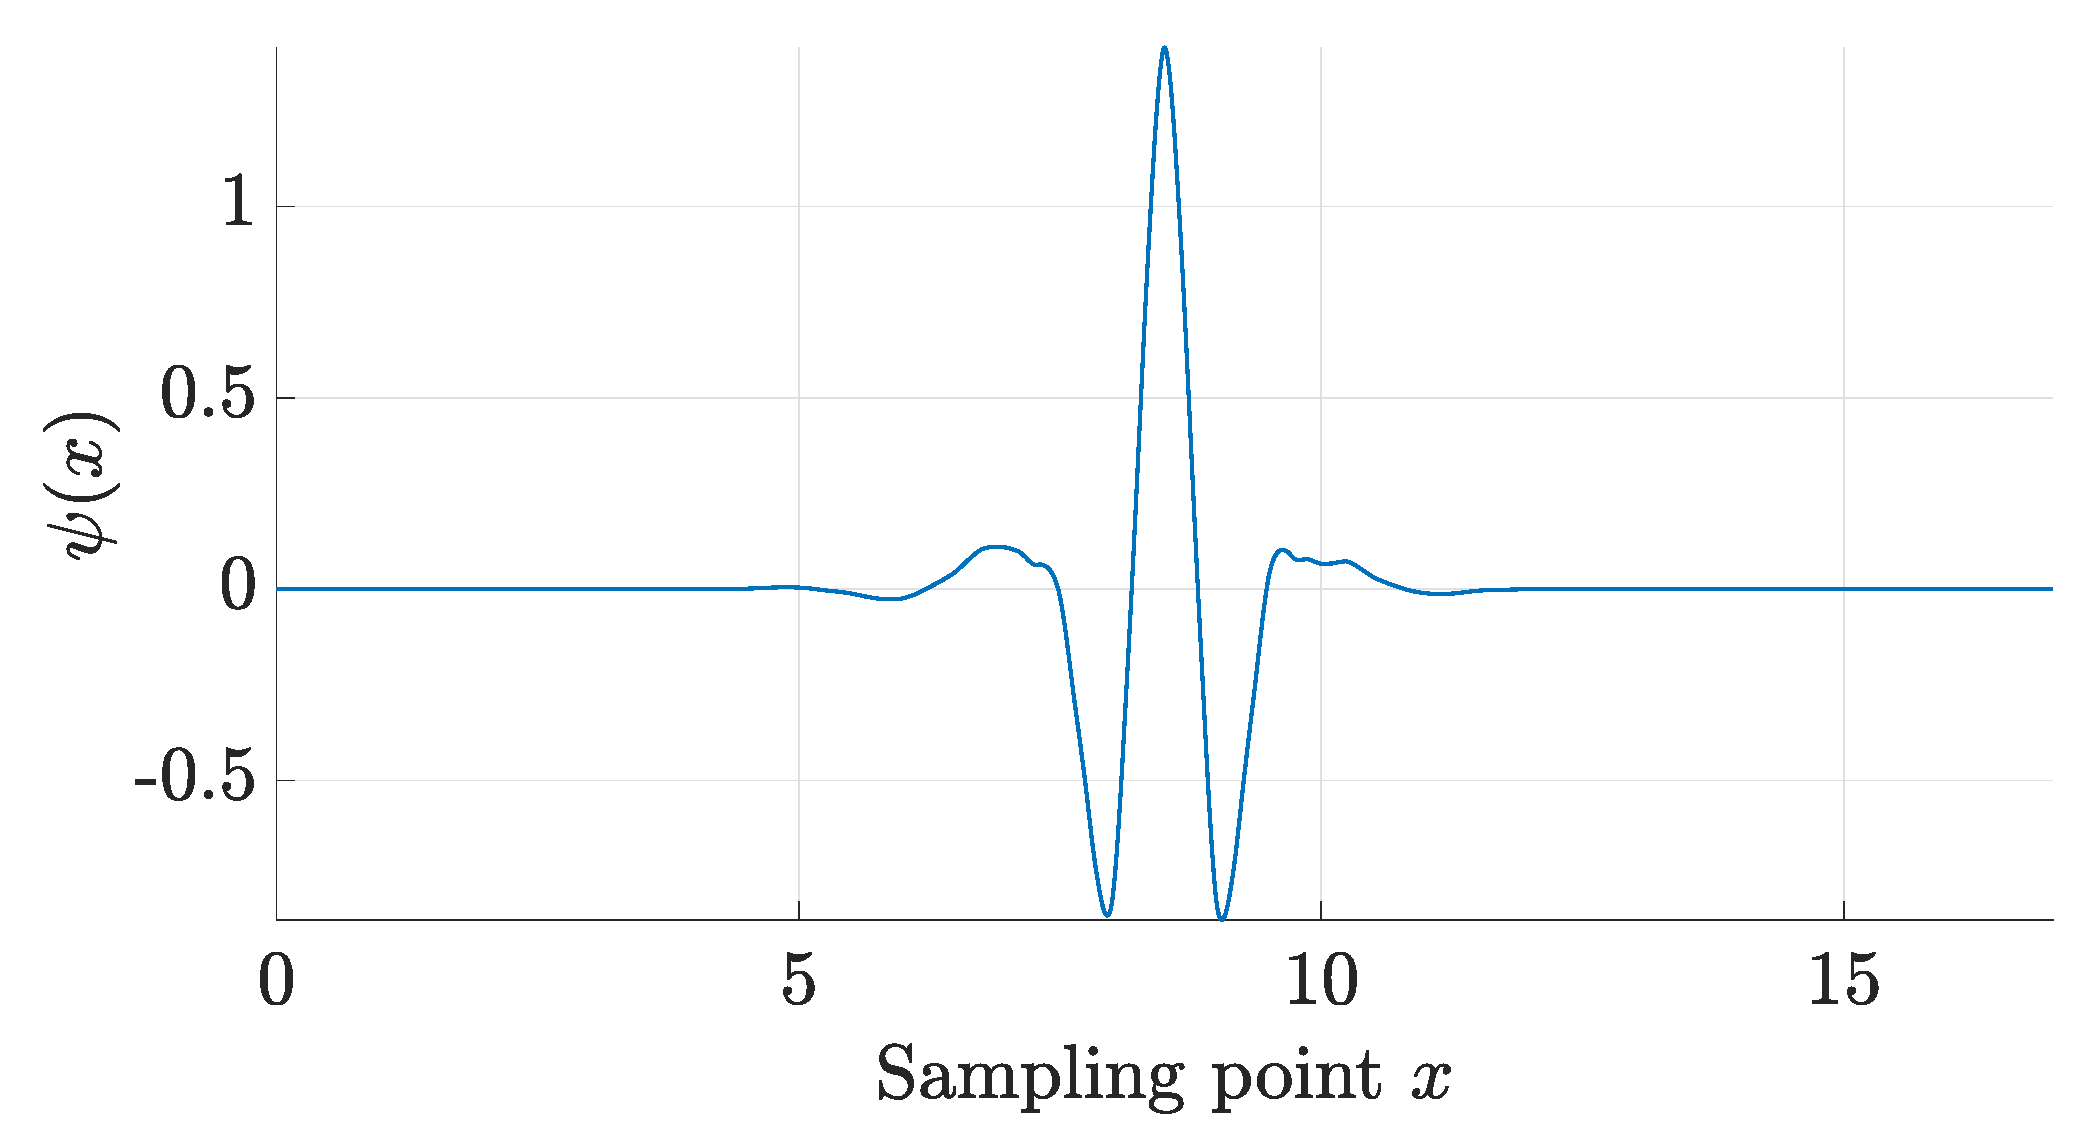
2.2. Wavelet Transforms

In the literature, WTs have been applied to various biophysical signals, such as electrocardiogram and electromyography signals [34,35]. Recently, WTs have been used for pre-processing EDA signals, particularly for artefact detection [24,36]. By properly choosing the mother wavelet, we can distinguish those parts of the signal that resemble the shape of measurement noise or of motion artefacts in order to exclude them.
In this work, we use the discrete wavelet transform (DWT) and the stationary wavelet transform (SWT), which is a continuous transform. In the following, we provide a brief description of the WT; a detailed introduction to wavelets can be found in [37]. The WT is similar to the fast FT (FFT) or discrete FT in the sense that they are all linear operations. While the basis functions of FFT are sines and cosines, WTs allow for the use of more complex basis functions [38]. The other main difference between the FFT and the DWT is that wavelets are localised in space. The sine and cosine functions used in the FT are not. Moreover, when using FFT coefficients to reconstruct a signal, sharp changes in the original signal may cause the appearance of ringing artefacts in the reconstruction, which can be confused with actual artefacts. A popular mother wavelet used to limit the effect of sharp changes due to measurement noise is the haar function [27], which is shown in Figure 2.
In this work, we employ the SWT for the identification of motion artefacts in the data. This choice was motivated by the time-invariant nature of these artefacts, as well as their lack of susceptibility to causing undesirable ringing artefacts. As candidate mother wavelets, we use the functions db44 and coif3; see Figure 3 and Figure 4, respectively. Both wavelet functions are frequently used in biomedical applications. Moreover, the coif3 wavelet resemblance the characteristic shape of motion artefacts [36,39].
After choosing the candidate mother functions, the choice of decomposition level (DL) is most critical. We use the DL with minimum entropy as recommended in [40]. Additionally, the entropy of a signal is related to the number of coefficients needed to properly describe the signal [40]. Therefore, choosing the DL with the lowest entropy allows minimising the number of coefficients needed to represent the signal. In this work, we considered Shannon entropy as a measure. It is defined by
E s h = i y i 2 l n ( y i 2 ) ,
where y is the signal [40]. For different DL, the Shannon entropy of the signal shown in Figure 1 is given in Table 1, where the entropy values for d b 44 and c o i f 3 are similar. Importantly, we obtain similar results for all other EDA signals in the datasets (not shown). Thus, DL 1, which has the lowest entropy, seems to be the most appropriate for artefact detection. Since coif3 resemblances the characteristic shape of motion artefacts, we use it for artefact detection, that is, we exploit the similarity between this mother wavelet and motion artefacts. Note that the haar function was used to smooth the signal.

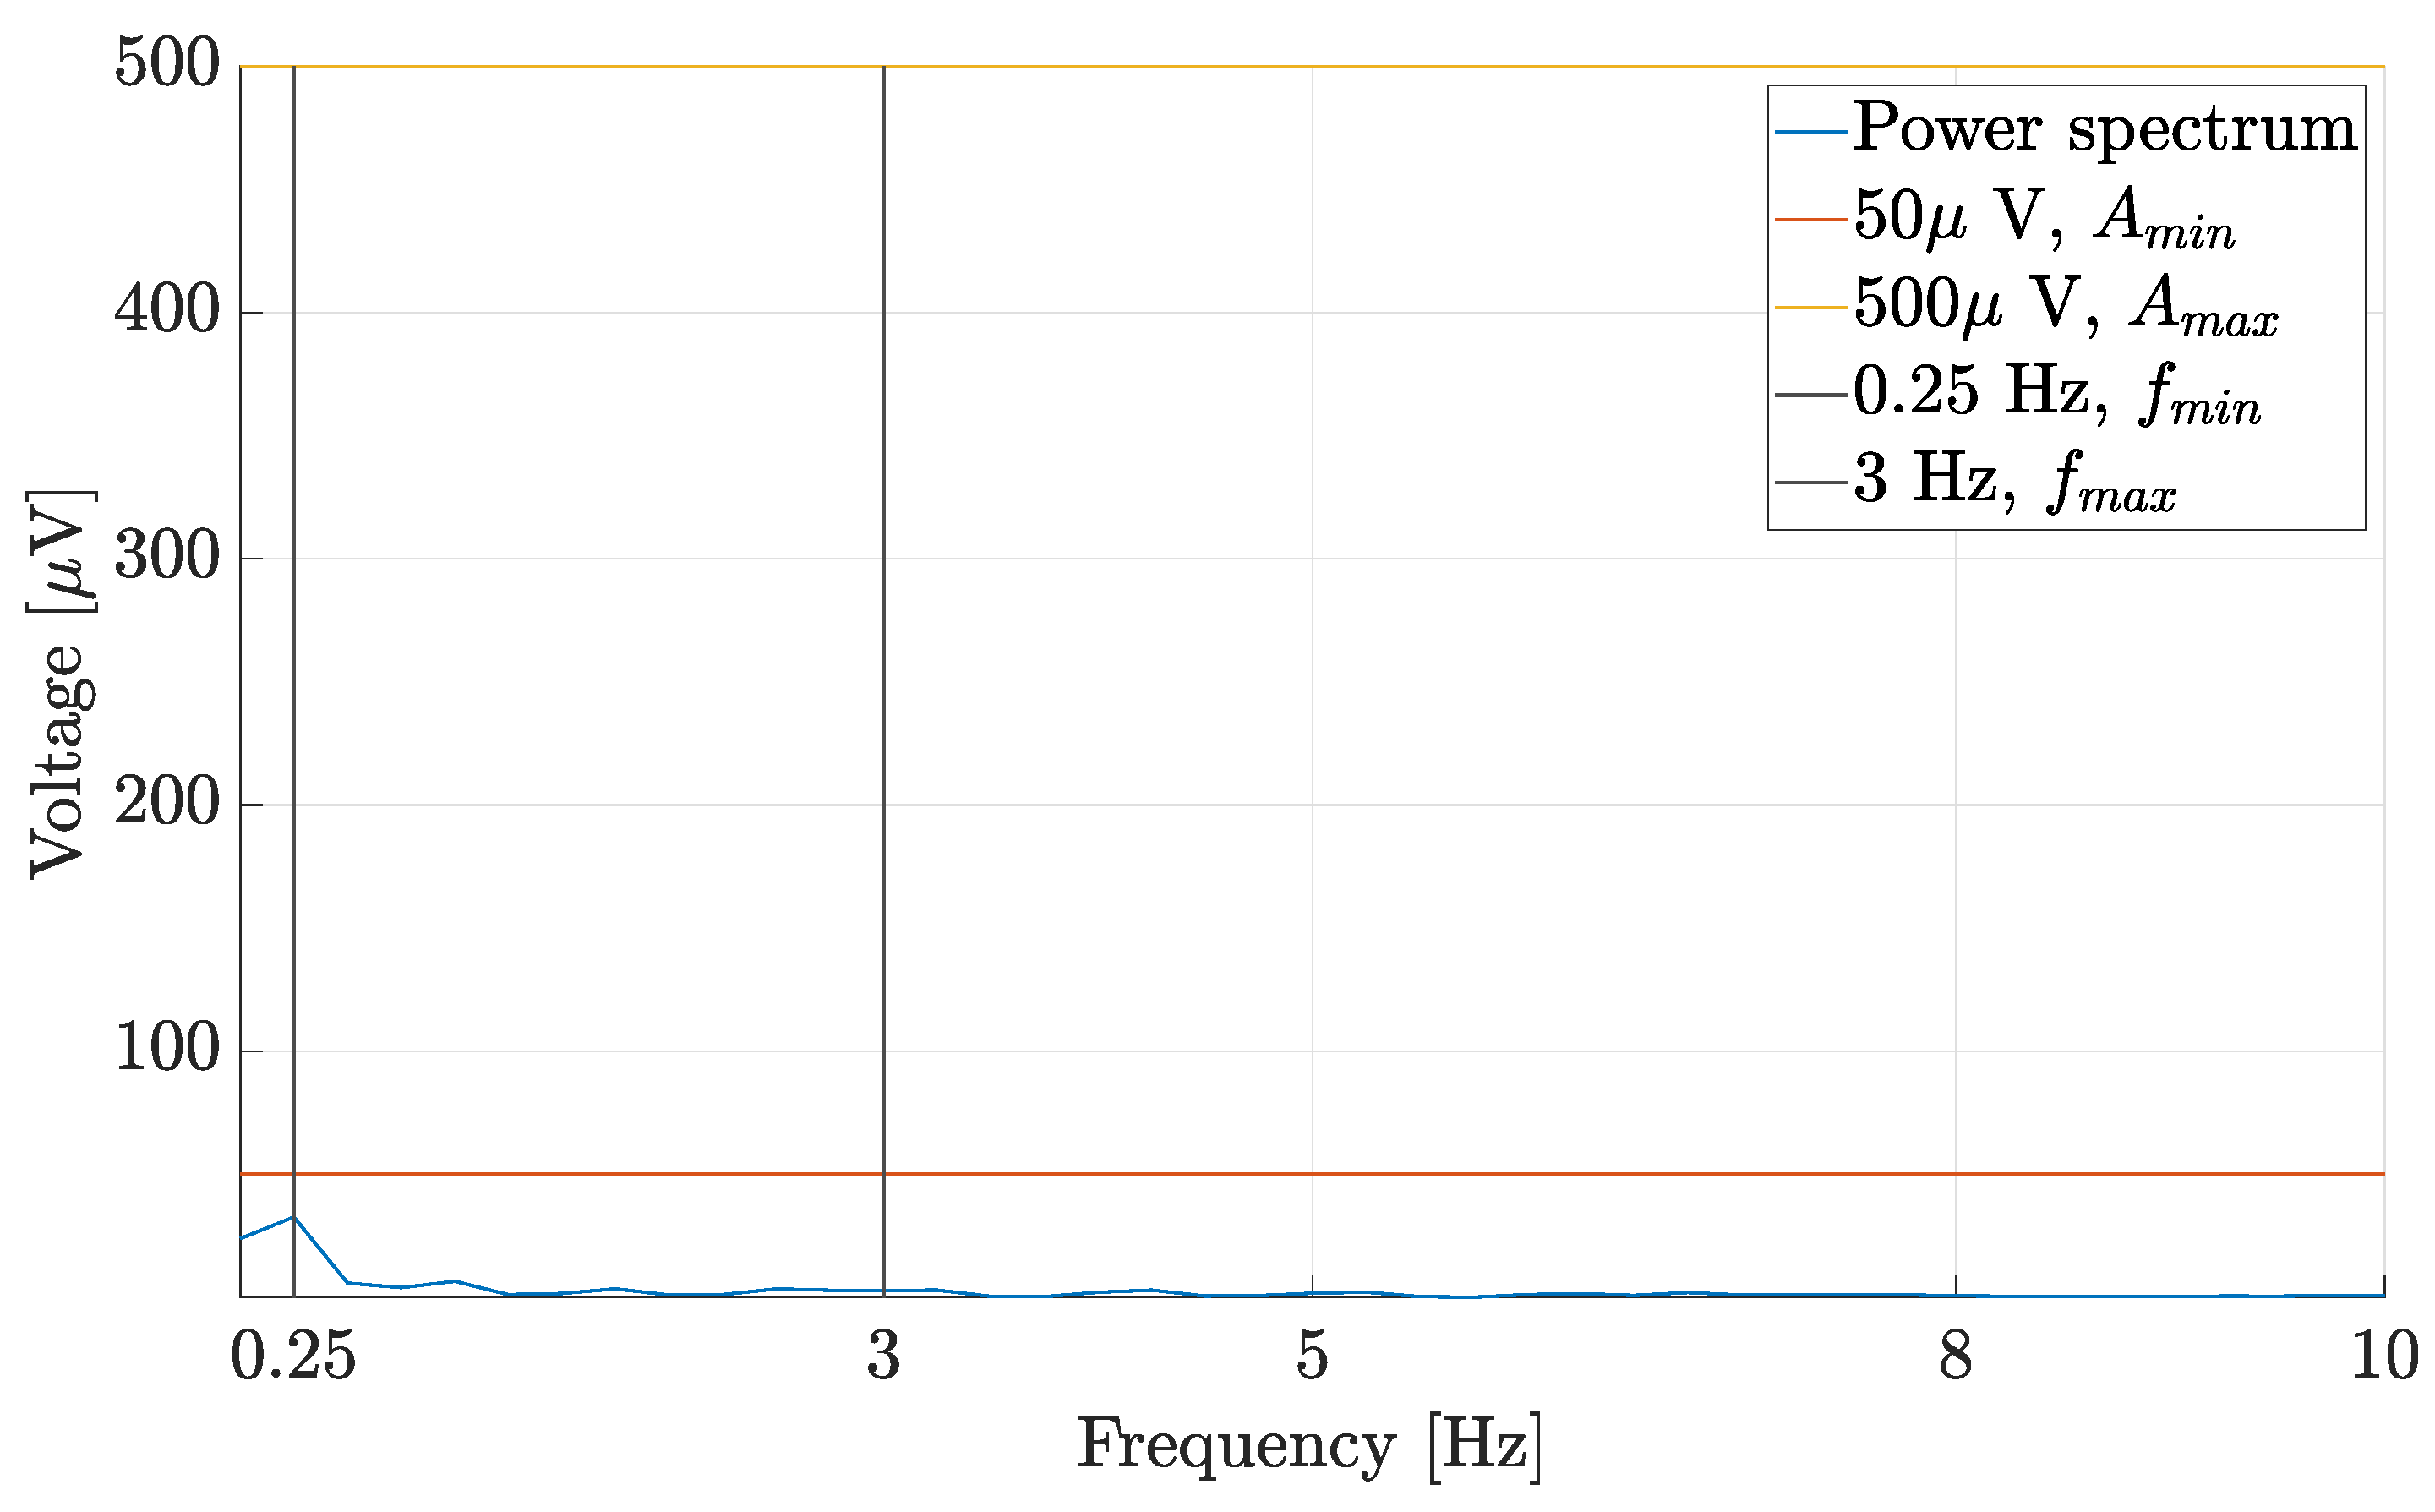
2.3. Events Frequency Range

As mentioned previously, EDA signals can be recorded either exosomatically or endosomatically. Most devices and wearables, such as the Empatica E4 watch and the WatchPATTM, record EDA exosomatically. The recorded signal is simpler, because it does not distinguish between monophasic, biphasic, and triphasic oscillations. However, these three different types of oscillations have different physiological meanings. Since endosomatic recording distinguishes between them [41], it is more valuable from an information theoretical point of view. The EDA signals considered in this work were recorded endosomatically. The procedure is described in the paper by Arnardóttir and colleagues [5].
For an EDA sleep signal oscillation to be considered an EDA event, it must have a certain duration. In the literature, different values are given for this duration. Edelberg suggests 1.2 s to 4 s [42], while Venables and Christie suggest 1 s to 3 s [43]. We use these values to define the following EDA oscillation frequency range of interest:
f s , m i n = 1 max ( 3 s , 4 s ) = 0.25 Hz , f s , m a x = 1 min ( 1.2 s , 1 s ) = 3 Hz .
This means that we consider triphasic oscillations that last for around 1 s and monophasic oscillations that last for around 4 s. We assume that significant signal fluctuations of higher frequencies are either motion artefacts, recording errors, or non-relevant EDA events.

2.4. Algorithm

The algorithm was developed using MATLAB [44]. The respective flow diagram is shown in Figure 5, while a brief description of the different parts is given in the following.
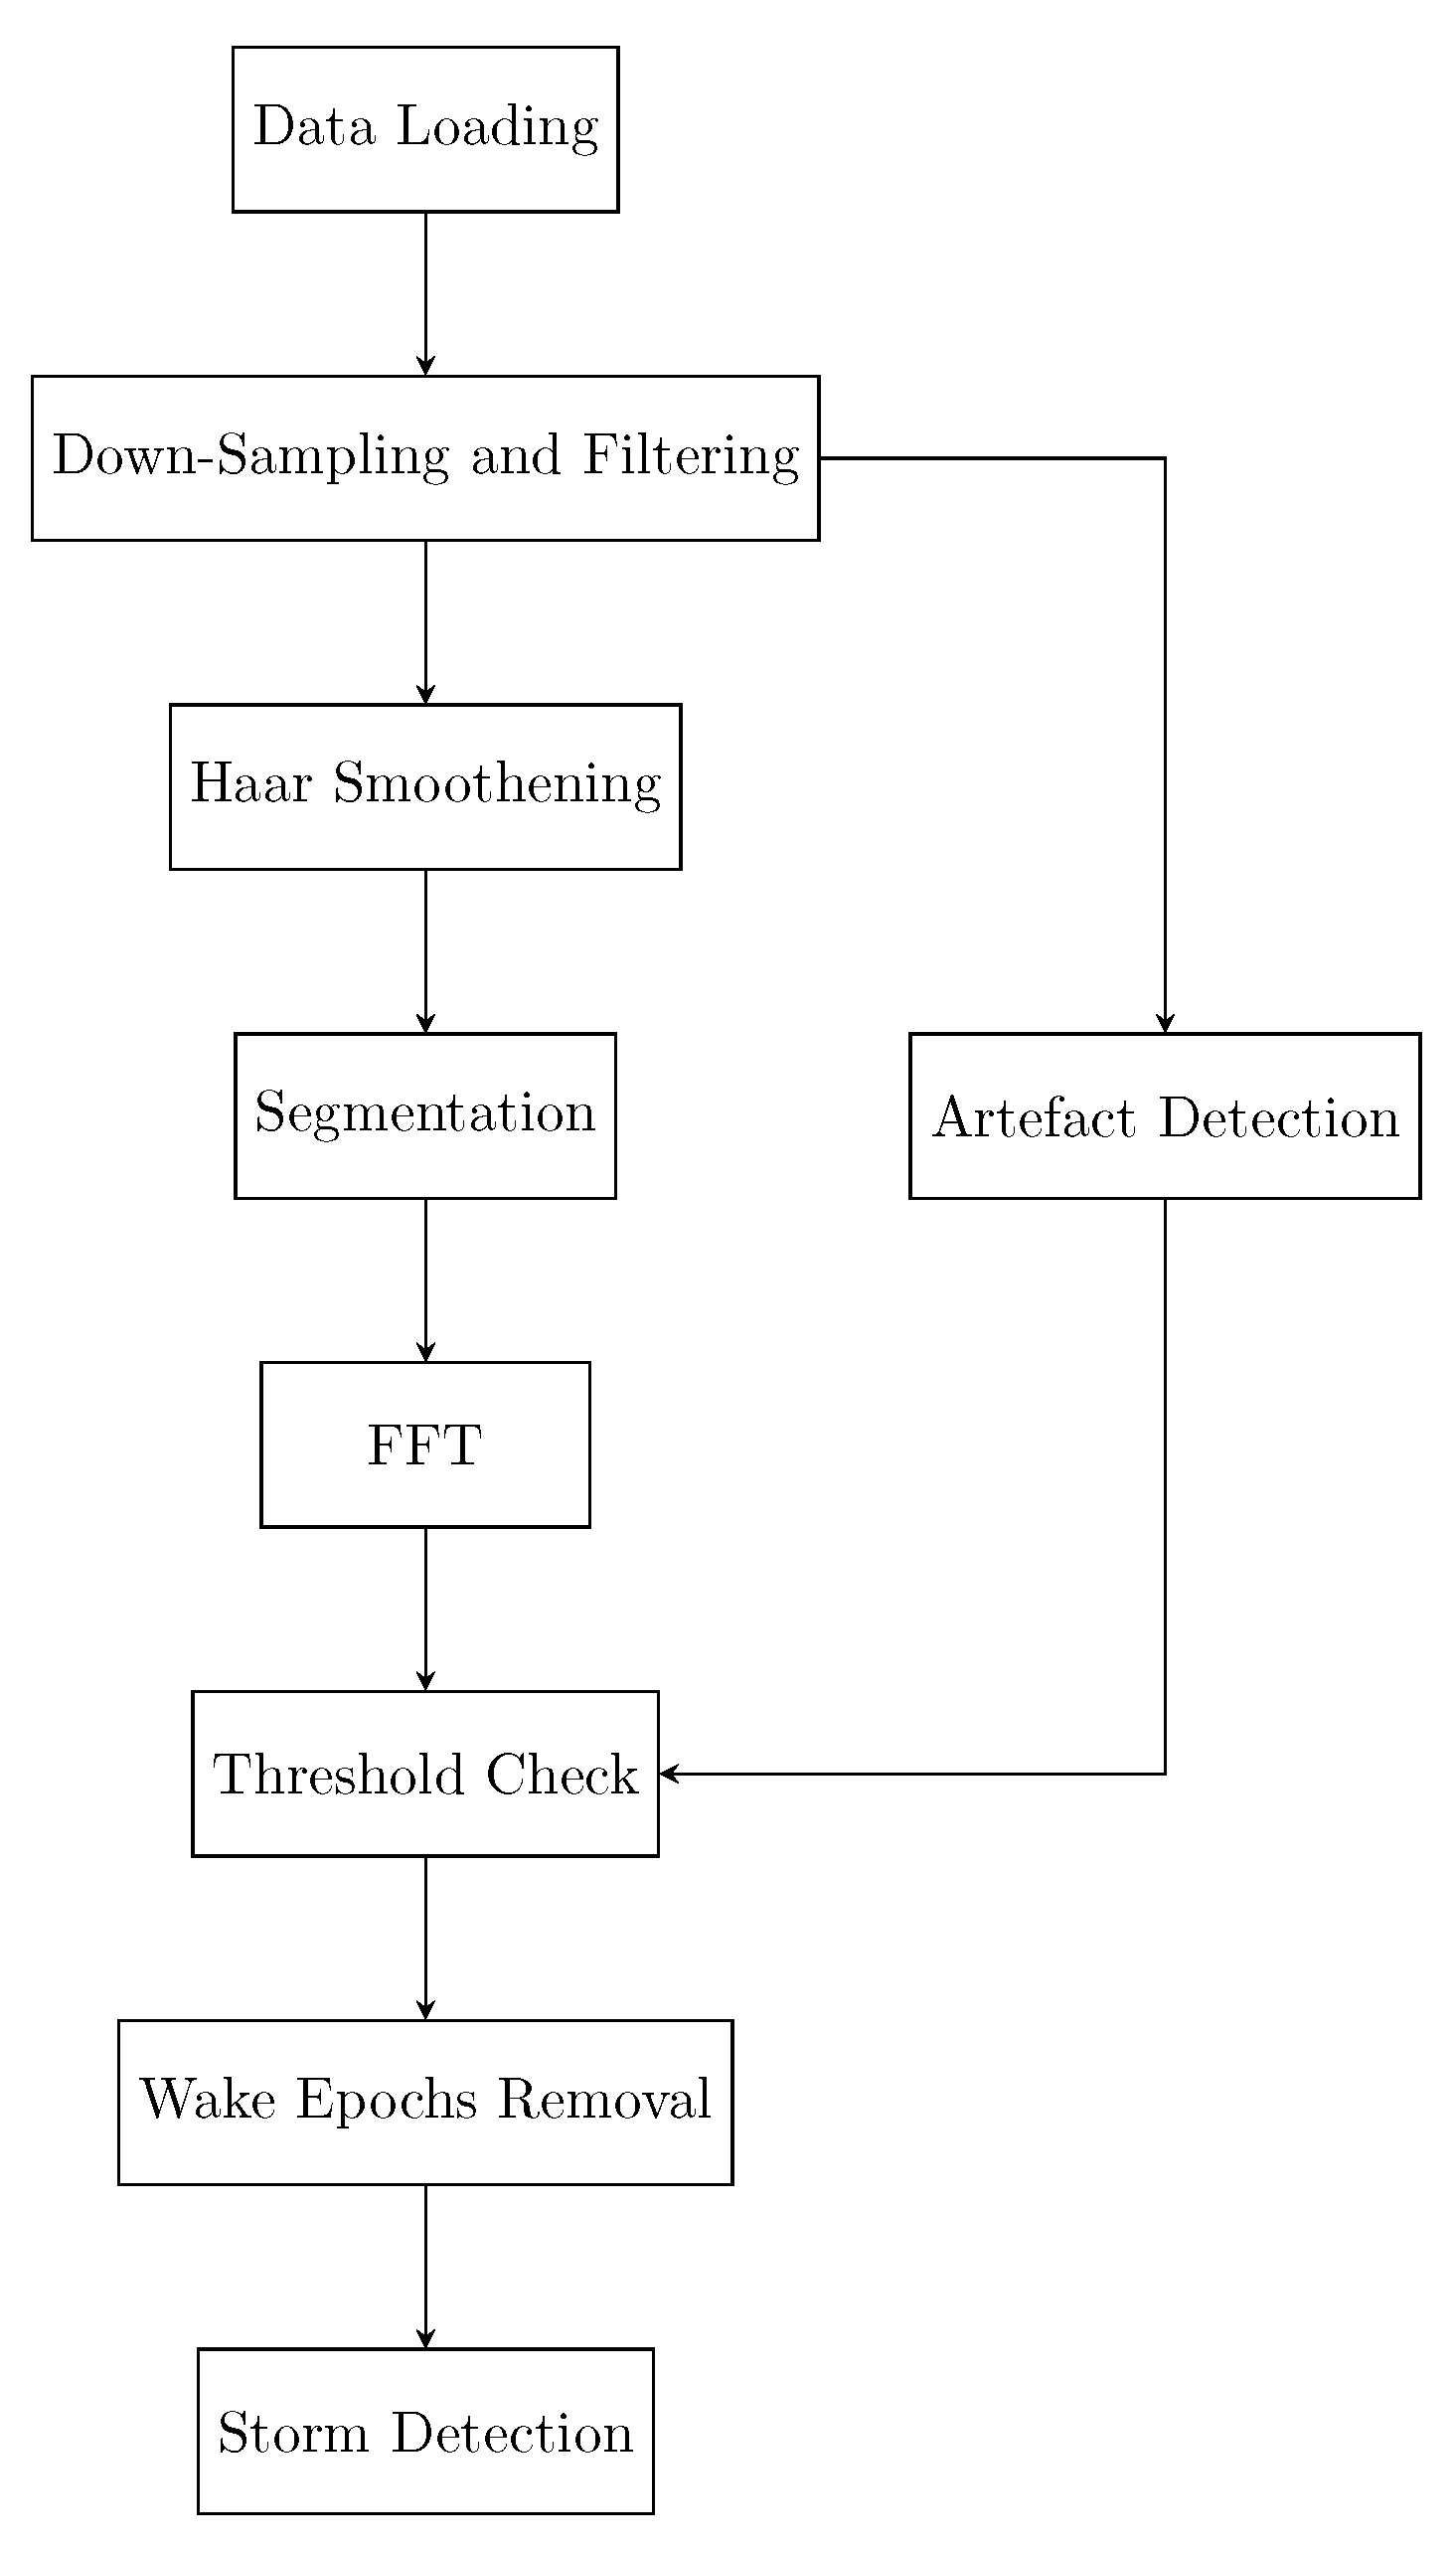
  • Data loading. First, files containing the EDA signal, the manually scored events, and sleep stages are loaded. After loading, signal pre-processing is performed.
  • Signal pre-processing. WTs are used to smooth the original signal, before down-sampling the signal and applying a band-pass filter. A haar discrete WT (DWT) is applied to the filtered signal, detail coefficients are hard thresholded, and an inverse DWT is applied to obtain a smoothed signal.
  • Artefact detection. Motion artefacts are detected using WTs on the non-smoothened signal. Parts of the EDA signal that strongly resemble a specific wavelet are considered artefacts.
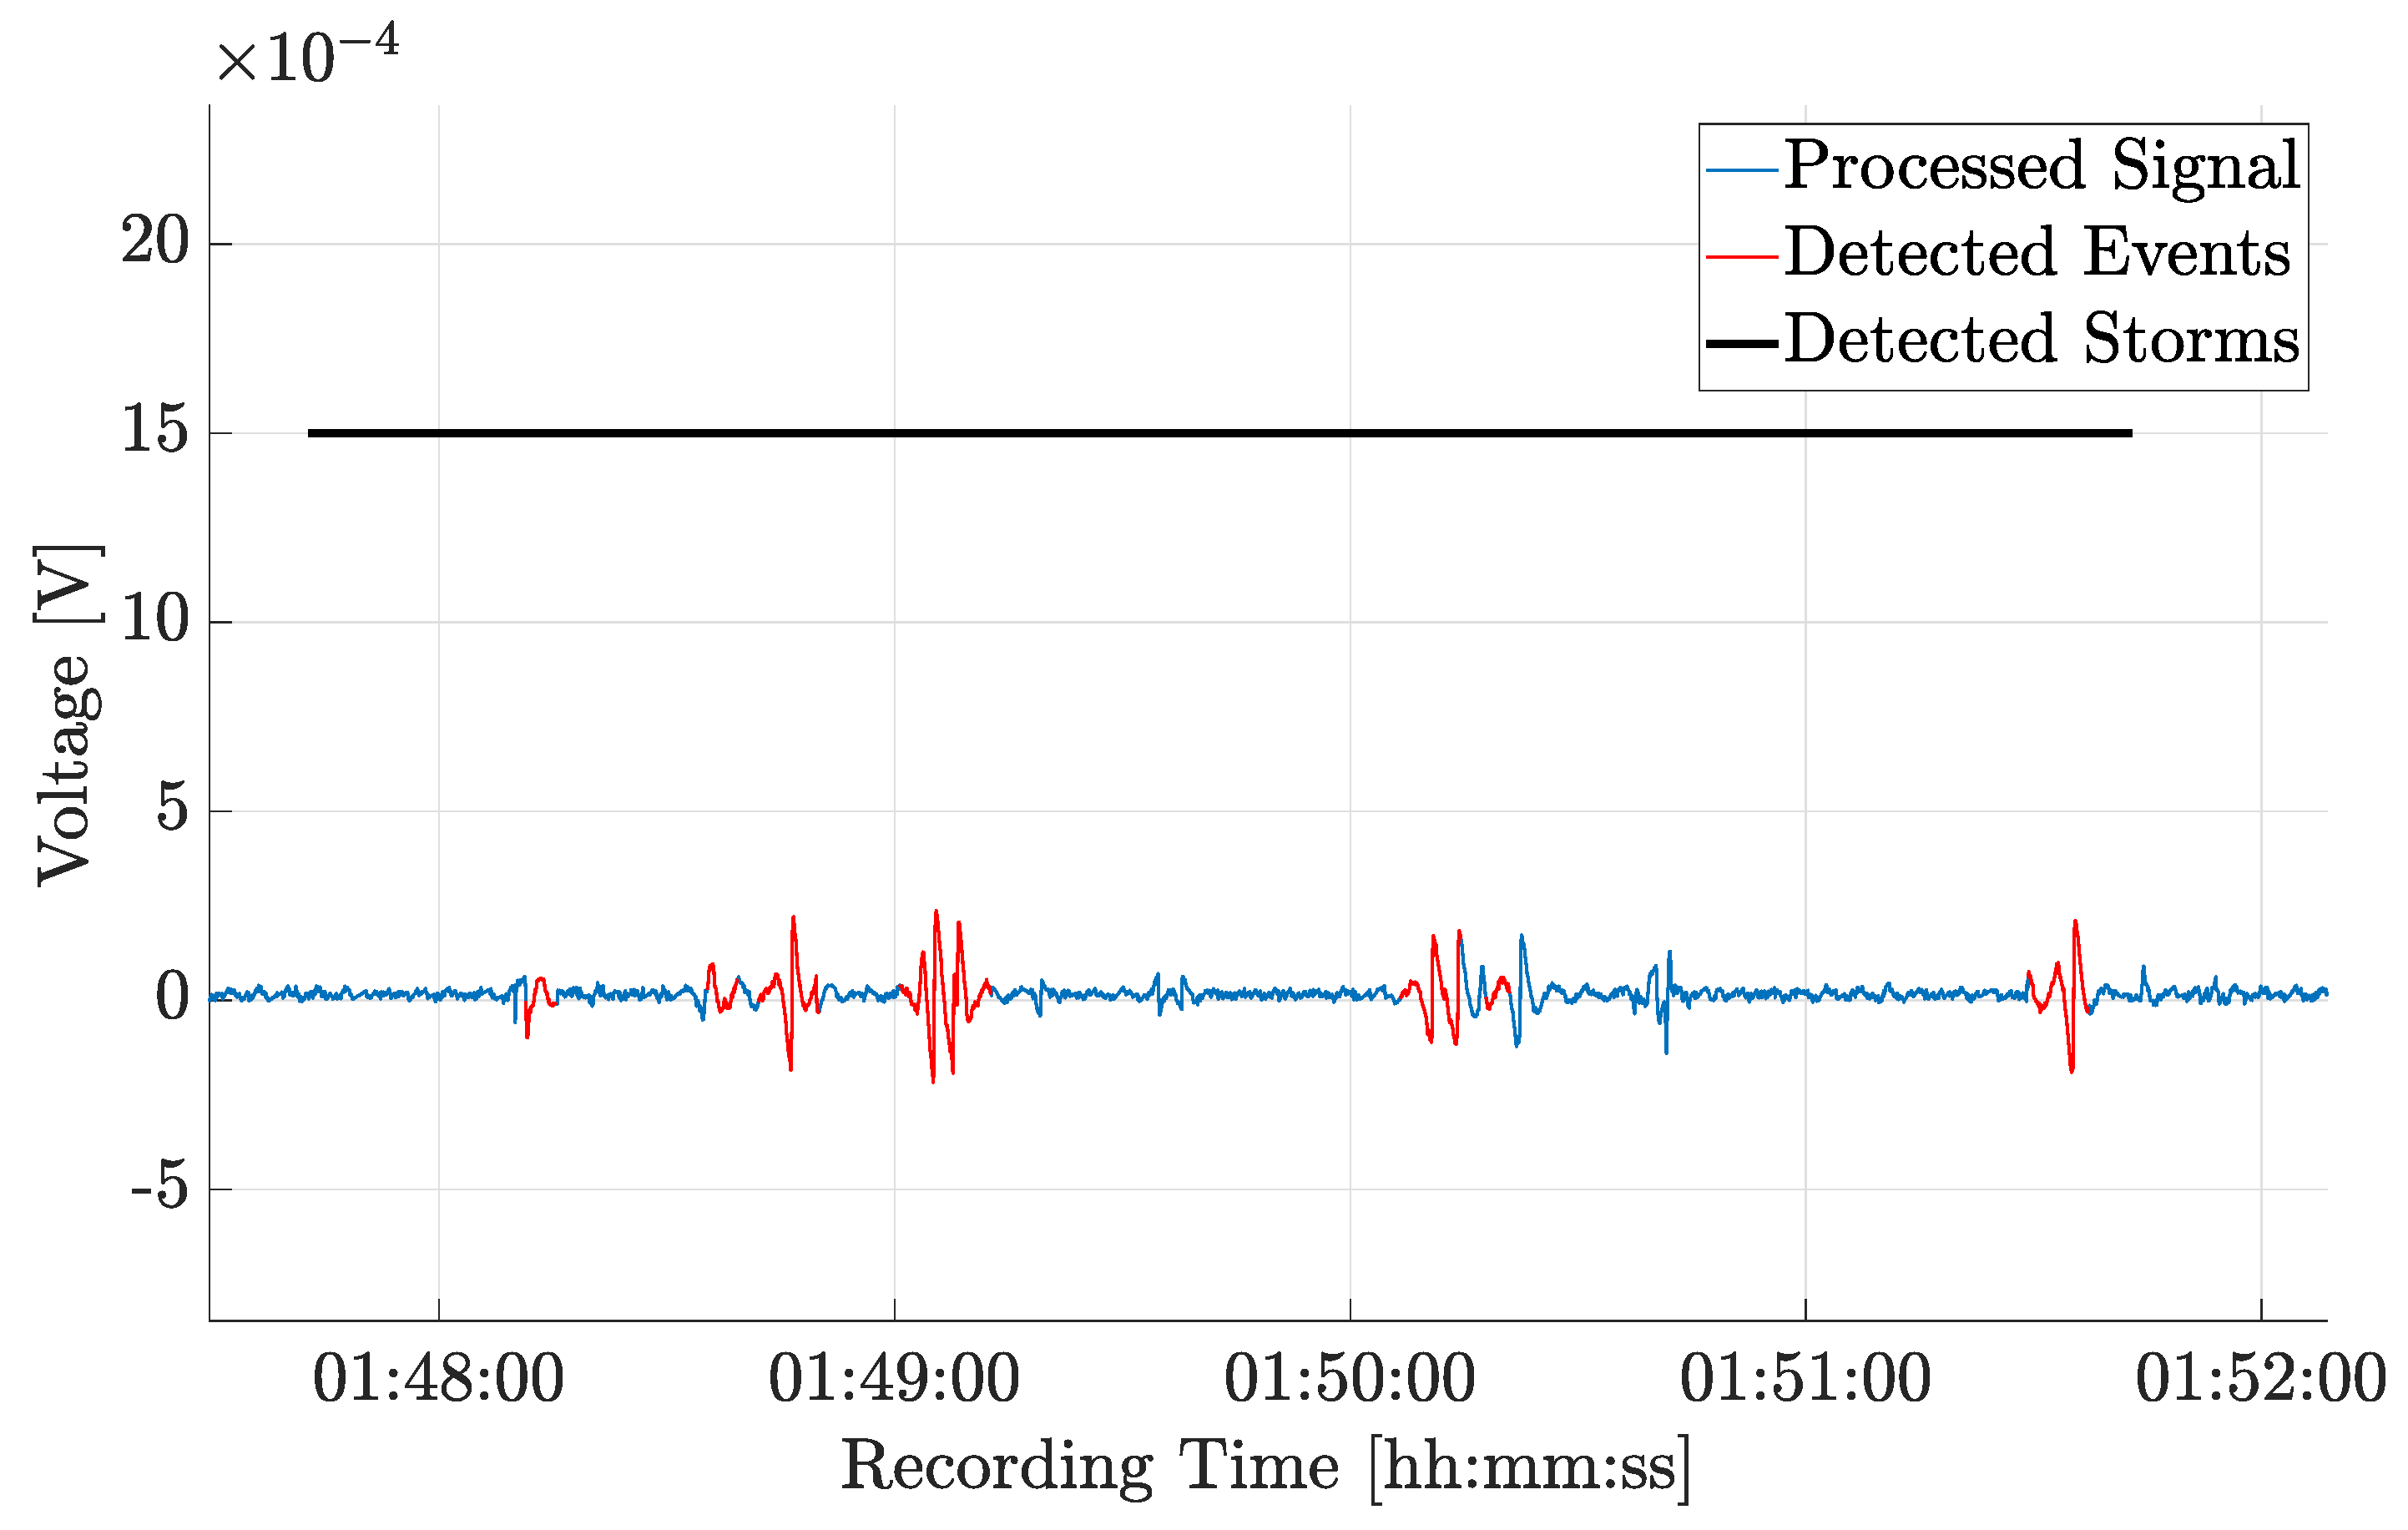
  • Event detection. The pre-processed signal is segmented into non-overlapping time windows. Then, the FFT is applied to each segment and thresholds are used in the time domain as well as frequency domain to detect EDA events. Respective parts of the signal are stored in an array.
  • Artefact removal. Signal segments that are considered artefacts are removed from the above array.
  • Wake epoch removal. Signal segments marked as waking periods are also removed.
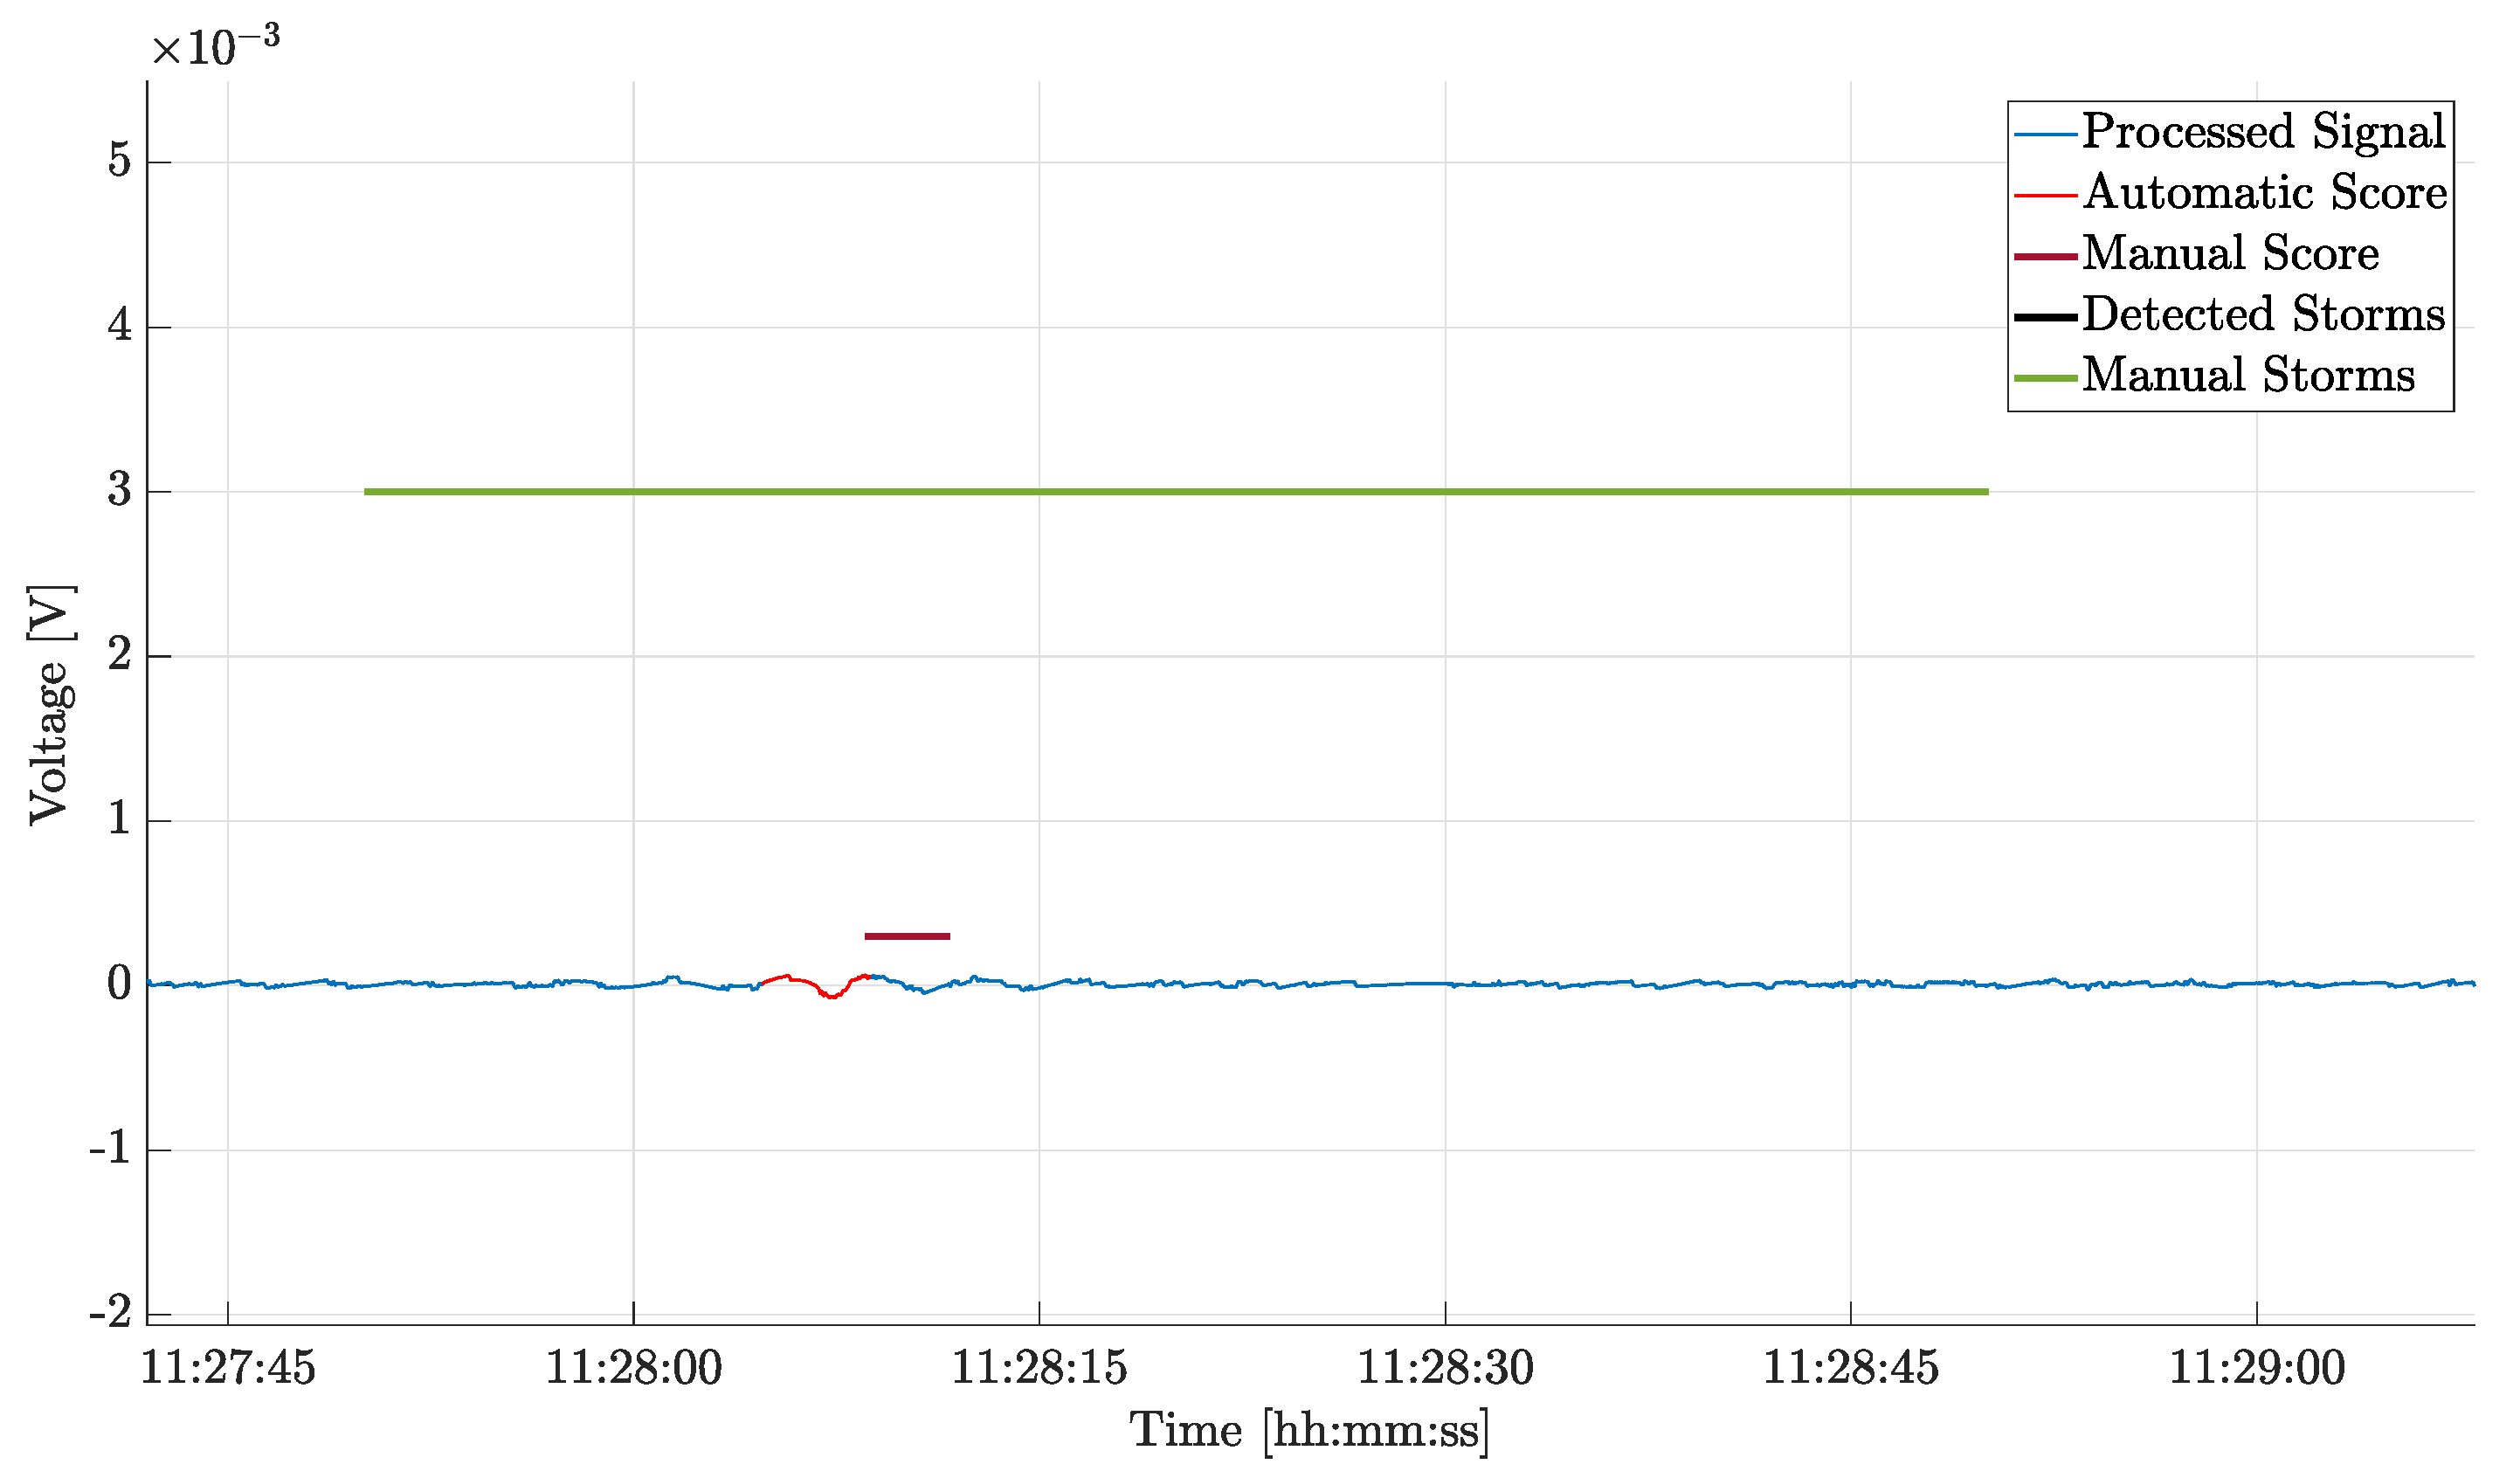
  • Storm detection. Finally, EDA storms are detected using their respective definitions.

2.5. Re-Sampling

The EDA signals from the two different studies are sampled at different frequencies. The sampling frequency in the 2005 study was 10 Hz, while the one in the study that was performed as part of the Sleep Revolution Project was 200 Hz. To reduce computational time, the latter signals are down-sampled to 35 Hz using the MATLAB® function resample. The Nyquist–Shannon theorem states that it is possible to reconstruct oscillations of 3 Hz with a sampling frequency as low as 6 Hz. However, such low sampling frequencies cannot distinguish between the phasic and tonic components and, therefore, lead to a significant loss of information [45]. Because of this, we down-sample the signals from 200 Hz to 35 Hz. Note that while a higher sampling frequency guarantees more accurate readings, there are no phenomena of interest at frequencies > 35 Hz.

2.6. Signal Pre-Processing

As mentioned in the introduction, event detection is performed by evaluating the results of applying the FFT to 4 s segments. To avoid causing ringing, during the pre-processing phase, we use the DWT with the haar function as the mother function. After computing DWT approximate coefficients and detail coefficients, the latter ones are hard thresholded by factor t, where
t = σ · 2 · l n ( n ) ,
σ is the standard deviation of the detail coefficients, and n is the length of the signal [46]. After hard thresholding, an inverse DWT is applied and the signal reconstructed.
We then apply a bandpass filter, with a range [0.25 Hz–10 Hz], to reduce the contribution of noise as well as of signal drift. Furthermore, we set the filter upper frequency limit to 10 Hz to be more consistent with the data collected in the 2005 study. Bandpass filtering concludes the pre-processing phase.

2.7. Artefact Detection

Applying WT to a segment of the signal that has a shape similar to the one of the chosen mother wavelet will lead to coefficients with a larger magnitude. Therefore, for artefact detection, we used coif3 as the mother function, since it resembles typical motion artefacts [36]. After computing the SWT coefficients, they are thresholded and non-zero signal segments are marked as artefacts. Signal segments with significant high-frequency contributions—that is, for frequencies > 3 Hz—are considered to be artefacts and are labelled accordingly. An example of an artefact is shown in Figure 6.
An example of an artefact detected in the frequency domain is shown in Figure 7. The power spectrum has high-frequency contributions that are larger than the threshold. Consequently, this specific 4 s segment is marked as being an artefact. Note that we also consider the 10 s of signal preceding and the 10 s of signal succeeding an artefact as being an artefact. The reason behind this is that, often, the onset of artefact oscillations as well as their end are marked by weak oscillations that could be erroneously considered events.

2.8. EDA Event Detection

As mentioned previously, EDA events have frequencies in the range of 0.25 Hz to 3 Hz. Within this frequency range, we only consider EDA oscillations whose amplitudes are between 50 μV and 500 μV. For event detection in the frequency domain, we segment the signal and transform individual signal segments using the FFT. To obtain the segments, the signal is sliced into non-overlapping time windows of constant duration T = 4 s. This allows us to detect events with a frequency as low as 0.25 Hz.
Then, we multiply the FT coefficients by 2/N, where N is the number of coefficients, and compute their absolute value. If any of these values lies between 50 μV and 500 μV then the segment is marked as an event; see Figure 8 and Figure 9. In Figure 8, the displayed signal segment has oscillations of frequencies between 0.25 Hz and 3 Hz whose amplitudes are significant. Hence, the algorithm labels this segment as an EDA event. In Figure 9, the power spectrum in the frequency range between 0.25 Hz and 3 Hz does not show oscillations of relevant amplitudes. Hence, this segment is not labelled as an EDA event.

2.9. EDA Storm Detection

Detection of EDA storms is important for using the EDA signal to assess key aspects of sleep health such as the presence of disordered breathing, one of which is OSA [17]. Our algorithm labels a one-minute window, that contains two or more EDA events, as an EDA storm. An example of an EDA storm is shown in Figure 10.

2.10. Performance Indices

We use three indices to quantify algorithm performances, which we explain in the following. We compute them for both EDA events and EDA storm detection. For this evaluation, we use manual scoring. Note that EDA storms were not scored during the manual EDA scoring process. For this reason, we devised a pseudo-manual EDA storm scoring by considering a one-minute window, that contains two or more EDA events, being an EDA storm, just as before in the automatic scoring.

2.10.1. Precision

Precision P is the ratio between the number of true positives and the number of predicted positives. In this work, the number of true positives is the number of EDA events (storms) detected by the algorithm that overlap with manually scored EDA events (storms). We denote this number by n o v e r l a p , e , ( n o v e r l a p , s t ) and the number of manually scored EDA events (storms) by n m a n u a l , e ( n m a n u a l , s t ). The number of predicted positives is the number of automatically detected EDA events (storms). We denote this number by n d e t e c t e d , e ( n d e t e c t e d , s t ).
P = n o v e r l a p n d e t e c t e d .

2.10.2. Recall

Recall R is the ratio between the number of true positives and the number of actual positives, which is the number of manually scored EDA events (storms) in this work.
R = n o v e r l a p n m a n u a l .

2.10.3. F 1 -Score

The F 1 score is the harmonic mean of precision and recall.
F 1 = 2 · P R P + R .

3. Results

Algorithm Performance

The algorithm’s performances are summarised in Table 2 and Table 3. Table 2 shows the performance when the algorithm is used to score the recordings from the 2005 study. Table 3 shows the performance when the algorithm is used to score the collected recordings within the Sleep Revolution Project.
To assess whether there is a statistically significant difference in performance when the scoring algorithm is applied to either dataset, we perform a two-sample t-tests, where we compare a set of indices from one study to the respective set from the other study. The results are shown in Table 4. We discuss them in the following section.

4. Discussion

The p-values in Table 4 show that the differences in Precision and F 1 performance of the automatic scoring algorithm, when applied to either one of the two datasets, are not statistically significant. This suggests that our algorithm is robust to differing sampling frequencies and sleep technologists, who score the EDA signals. When applying the algorithm to the EDA recordings from the two different studies and evaluating its performance, we obtain F 1 scores with an average of 68.9% and of 71.4% for EDA events and of 51.5% and 56.6% for EDA storms. The low agreement for EDA storm detection and, to a lesser extent, the moderate agreement for EDA event detection are partially misleading. The low average of F 1 s t o r m scores stems from the definition of F 1 scores and, thus, is caused by having some low P s t o r m values while the R s t o r m average is similar to the R e v e n t average. The consistency between the two recall performances further confirms that the relatively low average value for F 1 s t o r m scores is exclusively caused by the existence of some low P s t o r m value. They arise because EDA storm automatic and manual scoring is different.
One issue is the absence of a definition in the literature for the maximum length of an EDA event. Because of this, a manual scorer might label as one EDA event what the automatic scoring algorithm presented in this paper labels as multiple EDA events. Also, since manual scorers do not score EDA storms but rather consider them a long-lasting EDA event, we consider a long-lasting manually scored EDA event to be an EDA storm. This differs from how the algorithm scores EDA storm, as it rather follows what the literature considers an EDA storm. We graphically represent this in Figure 11. The figure shows another issue in EDA event detection. While the manual and the automatic scores identify the EDA events, the associated performance indices are low because of misalignment in the onset of the detected EDA events.
In the literature, agreement between different sleep technologists when scoring sleep stages is categorised using the intraclass correlation coefficient, as outlined by Kuna et al. [47]: poor agreement for 0–0.2; fair agreement for 0.3–0.4, moderate agreement for 0.5–0.6, strong agreement for 0.7–0.8, and almost perfect agreement for >0.8. Based on these ranges and using the F 1 score as the relevant performance measure, our algorithm achieves strong agreement for EDA event detection and moderate agreement for EDA storm detection when applied to the dataset from the Sleep Revolution Project. For the 2005 dataset, the agreement for EDA event detection is moderate; however, the value is almost in the strong agreement range. The agreement for EDA storm detection remains moderate. Notably, we believe that the performance measures presented in Table 2 and Table 3 are rather conservative ones. In [17], we show that there is a strong correlation between EDA events and EDA storms detected by our algorithm and sleep stages or the presence of OSA. It might be possible to increase accuracy in such applications might be obtained by combining the EDA-based classifier with ML models trained on different signals. For example, one could consider the electroencephalography (EEG) signal or the electromyography signal [48,49]. Finally, combining predictions made using either the EDA signal or the EEG signal might yield new insight into the connections of the different regulatory processes occurring in the brain during sleep [50].

5. Conclusions

We presented an algorithm that automatically scores EDA events and EDA storms. To our knowledge, a scoring algorithm for EDA recordings obtained by the endosomatic method has not been developed previously. Including EDA in sleep studies is not the norm because of its relative novelty in sleep research and because scoring it is tedious and has not been properly standardised. We believe that the tool presented in this work provides valuable means for inclusion by allowing for more accurate and faster manual scorings. After its employment, sleep technologists can import automatic scoring into the scoring software and briefly check whether wrongly detected EDA events need to be removed. The next step is to make the algorithm clearly highlight areas of no interest and grey zones in the signal, where there is significant activity that might qualify as an event and needs the attention of an expert technologist.
Moreover, due to its nature, the endosomatic method is much more suitable to be included in wearables, as it does require externally applying a voltage. Indeed, a few commercial devices already measure EDA. However, due to its complex nature, the signal has not been used for assessing sleep, yet. We believe that our work is the first stepping stone in this direction.
ML models are the current state-of-the-art computational methods for sleep research. However, research on selecting training variables that effectively reflect physiological phenomena during sleep is scarce, particularly, in the area of EDA. Given the difficulty of and ambiguity in scoring endosomatic EDA sleep signals, the training dataset might not be sufficiently correct to guarantee a correct learning process. For this reason, we abstained from using ML and rather obtained the measures used in this work from the literature.
Feature engineering is a pivotal step in optimising ML models. It has been shown that simpler and more interpretable ML models outperform complex models when accompanied by ad hoc feature engineering. Our algorithm detects EDA events and EDA storms, phenomena known to be associated with physiological processes during sleep, which can be used for feature engineering in the future.
Our algorithm has been already successfully used to detect OSA. Thus, it opens the possibility of not only detecting but also monitoring the progression of OSA without invasive measurements. Moreover, we believe that better integrating EDA in sleep research will allow us to gain more physiological insight, for instance, by means of network physiology, which investigates the interactions between different physiological systems. Although sleep studies record many different physiological signals, network physiology has been rather neglected. Investigating changes in the topology of the physiological network when EDA events and EDA storms occur will help to better characterise the processes underlying thermoregulation and understand its interaction with other physiological systems.
Thus, in the future, we believe that automatic scoring algorithms, such as the one presented in this work, will much aid the work of manual scorers, ultimately taking over this tedious task. Their use will also allow for more thorough standardisation of scoring and, thus, better interpretability of scoring results from different studies. Finally, they will also be used to optimise ML algorithms for better determining sleep stages and disease severity, while allowing for a better understanding of underlying physiological processes by facilitating the analysis of the correlation between different physiological signals relevant to sleep. We therefore see the work presented in this paper as a first stepping stone in this direction.

Author Contributions

Conceptualisation, J.P., E.A., S.L.N.A.H. and E.S.A.; methodology, J.P., E.A. and S.L.N.A.H.; validation, J.P. and S.L.N.A.H.; software, J.P., E.A. and S.L.N.A.H.; formal analysis, J.P., E.A. and S.L.N.A.H.; investigation, J.P., E.A., S.L.N.A.H. and E.S.A.; data curation, J.P. and T.S.; writing—original draft preparation, J.P. and S.L.N.A.H.; writing—review and editing, E.A. and E.S.A.; visualization, J.P., E.A. and S.L.N.A.H.; supervision, E.A. and E.S.A.; project administration, E.A. and E.S.A.; funding acquisition, E.S.A. All authors have read and agreed to the published version of the manuscript.

Funding

The study was carried out within the Sleep Revolution project. This project has received funding from the European Union’s Horizon 2020 research and innovation program under grant agreement no. 965417.

Institutional Review Board Statement

Both studies received the approval of the National Bioethics Committee and the Data Protection Authority of Iceland (Sleep Revolution VSN-070), with informed consent obtained by participants prior to data collection.

Informed Consent Statement

Informed consent was obtained by participants prior to data collection.

Data Availability Statement

The datasets used for this study are not publicly available due to General Data Protection Regulation (GDPR) reasons.

Acknowledgments

The authors would like to thank the editor and the anonymous reviewers for their valuable comments, which substantially improved this manuscript.

Conflicts of Interest

E.S.A. declares lecture honoraria from Nox Medical, ResMed, Jazz Pharmaceuticals, Linde Healthcare, Alcoa–Fjardaral, Wink Sleep, Apnimed, and Vistor. She is also a member of the Philips Sleep Medicine and Innovation Medical Advisory Board. All other authors declare no conflict of interest relevant to this study.

References

  1. Borbély, A.A.; Daan, S.; Wirz-Justice, A.; Deboer, T. The two-process model of sleep regulation: A reappraisal. J. Sleep Res. 2016, 25, 131–143. [Google Scholar] [CrossRef] [PubMed]
  2. Schmidt, M.H. The energy allocation function of sleep: A unifying theory of sleep, torpor, and continuous wakefulness. Neurosci. Biobehav. Rev. 2014, 47, 122–153. [Google Scholar] [CrossRef] [PubMed]
  3. Parmeggiani, P.L. Thermoregulation and sleep. Front. Biosci. 2003, 8, 1054. [Google Scholar] [CrossRef] [PubMed]
  4. Idiaquez, J.; Casar, J.C.; Arnardottir, E.S.; August, E.; Santin, J.; Iturriaga, R. Hyperhidrosis in sleep disorders—A narrative review of mechanisms and clinical significance. J. Sleep Res. 2022, 32, e13660. [Google Scholar] [CrossRef] [PubMed]
  5. Arnardottir, E.S.; Thorleifsdottir, B.; Svanborg, E.; Olafsson, I.; Gislason, T. Sleep-related sweating in obstructive sleep apnoea: Association with sleep stages and blood pressure. J. Sleep Res. 2010, 19, 122–130. [Google Scholar] [CrossRef] [PubMed]
  6. Jordan, A.S.; McSharry, D.G.; Malhotra, A. Adult obstructive sleep apnoea. Lancet 2014, 383, 736–747. [Google Scholar] [CrossRef] [PubMed]
  7. Boucsein, W.; Fowles, D.C.; Grimnes, S.; Ben-Shakhar, G.; Roth, W.T.; Dawson, M.E.; Filion, D.L. Publication recommendations for electrodermal measurements. Psychophysiology 2012, 49, 1017–1034. [Google Scholar] [CrossRef]
  8. Affanni, A.; Chiorboli, G. Design and characterization of a real-time, wearable, endosomatic electrodermal system. Measurement 2015, 75, 111–121. [Google Scholar] [CrossRef]
  9. Tronstad, C.; Amini, M.; Bach, D.R.; Ørjan, G. Martinsen. Current trends and opportunities in the methodology of electrodermal activity measurement. Physiol. Meas. 2022, 43, 02TR01. [Google Scholar] [CrossRef]
  10. Posada-Quintero, H.F.; Chon, K.H. Innovations in electrodermal activity data collection and signal processing: A systematic review. Sensors 2020, 20, 479. [Google Scholar] [CrossRef]
  11. Lascio, E.D.; Gashi, S.; Santini, S. Unobtrusive Assessment of Students’ Emotional Engagement during Lectures Using Electrodermal Activity Sensors. In Proceedings of the ACM on Interactive, Mobile, Wearable and Ubiquitous Technologies; Association for Computing Machinery: New York, NY, USA, 2018; Volume 2, pp. 1–21. [Google Scholar] [CrossRef]
  12. Poh, M.Z.; Loddenkemper, T.; Swenson, N.C.; Goyal, S.; Madsen, J.R.; Picard, R.W. Continuous monitoring of electrodermal activity during epileptic seizures using a wearable sensor. In Proceedings of the 2010 Annual International Conference of the IEEE Engineering in Medicine and Biology, Buenos Aires, Argentina, 31 August–4 September 2010; pp. 4415–4418. [Google Scholar] [CrossRef]
  13. Zontone, P.; Affanni, A.; Bernardini, R.; Piras, A.; Rinaldo, R. Stress Detection Through Electrodermal Activity (EDA) and Electrocardiogram (ECG) Analysis in Car Drivers. In Proceedings of the 2019 27th European Signal Processing Conference (EUSIPCO), A Coruna, Spain, 2–6 September 2019; pp. 1–5. [Google Scholar] [CrossRef]
  14. Jacobsen, F.A.; Hafli, E.W.; Tronstad, C.; Ørjan, G. Martinsen. Classification of emotions based on electrodermal activity and transfer learning - A pilot study. J. Electr. Bioimpedance 2021, 12, 178–183. [Google Scholar] [CrossRef] [PubMed]
  15. Anusha, A.S.; Preejith, S.P.; Akl, T.J.; Sivaprakasam, M. Electrodermal activity based autonomic sleep staging using wrist wearable. Biomed. Signal Process. Control 2022, 75, 103562. [Google Scholar] [CrossRef]
  16. Gashi, S.; Alecci, L.; Di, E.; Debus, M.E.; Gasparini, F.; Santini, S. The Role of Model Personalization for Sleep Stage and Sleep Quality Recognition Using Wearables. IEEE Pervasive Comput. 2022, 21, 69–77. [Google Scholar] [CrossRef]
  17. Piccini, J.; August, E.; Óskarsdóttir, M.; Arnardóttir, E.S. Using the electrodermal activity signal and machine learning for diagnosing sleep. Front. Sleep 2023, 2, 1127697. [Google Scholar] [CrossRef]
  18. Lajos, L.E. The relation between electrodermal activity in sleep, negative affect, and stress in patients referred for nocturnal polysomnography. Diss. Abstr. Int. Sect. B Sci. Eng. 2004, 65, 2633. [Google Scholar]
  19. Sano, A.; Picard, R.W. Toward a taxonomy of autonomic sleep patterns with electrodermal activity. In Proceedings of the Annual International Conference of the IEEE Engineering in Medicine and Biology Society, EMBS, Boston, MA, USA, 30 August–3 September 2011; pp. 777–780. [Google Scholar] [CrossRef]
  20. Boucsein, W. Electrodermal Activity; Springer: New York, NY, USA, 2012. [Google Scholar] [CrossRef]
  21. Arnardottir, E.S.; Janson, C.; Bjornsdottir, E.; Benediktsdottir, B.; Juliusson, S.; Kuna, S.T.; Pack, A.I.; Gislason, T. Nocturnal sweating—A common symptom of obstructive sleep apnoea: The Icelandic sleep apnoea cohort. BMJ Open 2013, 3, e002795. [Google Scholar] [CrossRef]
  22. Burch, N. Data processing of psychophysiological recordings. In Proceedings of the Symposium on the Analysis of Central Nervous System Data Using Computer Methods, Washington, DC, USA, 29–30 October 1964; pp. 165–180. [Google Scholar]
  23. Sano, A.; Picard, R.W.; Stickgold, R. Quantitative analysis of wrist electrodermal activity during sleep. Int. J. Psychophysiol. 2014, 94, 382–389. [Google Scholar] [CrossRef]
  24. Taylor, S.; Jaques, N.; Chen, W.; Fedor, S.; Sano, A.; Picard, R. Automatic identification of artifacts in electrodermal activity data. In Proceedings of the Annual International Conference of the IEEE Engineering in Medicine and Biology Society, EMBS, Milan, Italy, 25–29 August 2015; pp. 1934–1937. [Google Scholar] [CrossRef]
  25. Bach, D.R.; Friston, K.J.; Dolan, R.J. An improved algorithm for model-based analysis of evoked skin conductance responses. Biol. Psychol. 2013, 94, 490–497. [Google Scholar] [CrossRef]
  26. Greco, A.; Valenza, G.; Lanata, A.; Scilingo, E.P.; Citi, L. cvxEDA: A Convex Optimization Approach to Electrodermal Activity Processing. IEEE Trans. Biomed. Eng. 2016, 63, 797–804. [Google Scholar] [CrossRef]
  27. Hossain, M.B.; Posada-Quintero, H.F.; Kong, Y.; McNaboe, R.; Chon, K.H. Automatic motion artifact detection in electrodermal activity data using machine learning. Biomed. Signal Process. Control 2022, 74, 103483. [Google Scholar] [CrossRef]
  28. Daubechius, I. Ten Lectures of Wavelets; Sosiety for Industrial and Applied Mathematics Analysis: Philadelphia, PA, USA, 1992; pp. 1544–1576. [Google Scholar]
  29. Rao, R.; Chapa, J. Algorithms for designing wavelets to match a specified signal. IEEE Trans. Signal Process. 2000, 48, 3395–3406. [Google Scholar] [CrossRef]
  30. Arnardottir, E.S.; Islind, A.S.; Óskarsdóttir, M.; Ólafsdóttir, K.A.; August, E.; Jónasdóttir, L.; Hrubos-Strøm, H.; Saavedra, J.M.; Grote, L.; Hedner, J.; et al. The Sleep Revolution project: The concept and objectives. J. Sleep Res. 2022, 31, e13630. [Google Scholar] [CrossRef] [PubMed]
  31. Kemp, B.; Värri, A.; Rosa, A.C.; Nielsen, K.D.; Gade, J. A simple format for exchange of digitized polygraphic recordings. Electroencephalogr. Clin. Neurophysiol. 1992, 82, 391–393. [Google Scholar] [CrossRef] [PubMed]
  32. Kales, A.; Rechtschaffen, A. A Manual of Standardized Terminology, Techniques and Scoring System for Sleep Stages of Human Subjects; NIH Publication; U. S. National Institute of Neurological Diseases and Blindness, Neurological Information Network: Bethesda, MD, USA, 1968.
  33. Berry, R.; Quan, S.; Abreu, A. The AASM Manual for the Scoring of Sleep and Associated Events: Rules, Terminology and Technical Specifications, Version 2.6; AASM: Darien, IL, USA, 2020. [Google Scholar]
  34. Madan, P.; Singh, V.; Singh, D.P.; Diwakar, M.; Kishor, A. Denoising of ECG signals using weighted stationary wavelet total variation. Biomed. Signal Process. Control 2022, 73, 103478. [Google Scholar] [CrossRef]
  35. Tuncer, T.; Dogan, S.; Subasi, A. Surface EMG signal classification using ternary pattern and discrete wavelet transform based feature extraction for hand movement recognition. Biomed. Signal Process. Control 2020, 58, 101872. [Google Scholar] [CrossRef]
  36. Chen, W.; Jaques, N.; Taylor, S.; Sano, A.; Fedor, S.; Picard, R.W. Wavelet-based motion artifact removal for electrodermal activity. In Proceedings of the Annual International Conference of the IEEE Engineering in Medicine and Biology Society, EMBS, Milan, Italy, 25–29 August 2015; pp. 6223–6226. [Google Scholar] [CrossRef]
  37. Chui, C.K.; Heil, C. An Introduction to Wavelets. Comput. Phys. 1992, 6, 697. [Google Scholar] [CrossRef]
  38. Graps, A. An Introduction to Wavelets. IEEE Comput. Sci. Eng. 1995, 2, 50–61. [Google Scholar] [CrossRef]
  39. Rafiee, J.; Rafiee, M.A.; Prause, N.; Schoen, M.P. Wavelet basis functions in biomedical signal processing. Expert Syst. Appl. 2011, 38, 6190–6201. [Google Scholar] [CrossRef]
  40. Kaplun, D.; Voznesenskiy, A.; Romanov, S.; Nepomuceno, E.; Butusov, D. Optimal estimation of wavelet decomposition level for a matching pursuit algorithm. Entropy 2019, 21, 843. [Google Scholar] [CrossRef]
  41. Vetrugno, R.; Liguori, R.; Cortelli, P.; Montagna, P. Sympathetic skin response. Clin. Auton. Res. 2003, 13, 256–270. [Google Scholar] [CrossRef]
  42. Edelberg, R. Electrodermal Mechanisms: A Critique of the Two-Effector Hypothesis and a Proposed Replacement. In Progress in Electrodermal Research; Roy, J.C., Boucsein, W., Fowles, D.C., Gruzelier, J.H., Eds.; Springer: Boston, MA, USA, 1993; pp. 7–29. [Google Scholar] [CrossRef]
  43. Martin, I.; Venables, P. Techniques in Psychophysiology; John Wiley & Sons, Inc.: Hoboken, NJ, USA, 1980. [Google Scholar]
  44. The MathWorks Inc. MATLAB, version 9.12.0.1884302 (R2022a); The MathWorks Inc.: Natick, MA, USA, 2022. [Google Scholar]
  45. Braithwaite, J.; Watson, D.; Robert, J.; Mickey, R. A Guide for Analysing Electrodermal Activity (EDA) & Skin Conductance Responses (SCRs) for Psychological Experiments; Technical Report; University of Birmingham: Birmingham, UK, 2013. [Google Scholar]
  46. Coifman, R.R.; Donoho, D.L. Translation-Invariant De-Noising; Springer: New York, NY, USA, 1995; pp. 125–150. [Google Scholar] [CrossRef]
  47. Kuna, S.T.; Benca, R.; Kushida, C.A.; Walsh, J.; Younes, M.; Staley, B.; Hanlon, A.; Pack, A.I.; Pien, G.W.; Malhotra, A. Agreement in computer-assisted manual scoring of polysomnograms across sleep centers. Sleep 2013, 36, 583–589. [Google Scholar] [CrossRef] [PubMed]
  48. Safont, G.; Salazar, A.; Vergara, L. Vector score alpha integration for classifier late fusion. Pattern Recognit. Lett. 2020, 136, 48–55. [Google Scholar] [CrossRef]
  49. Soriano, A.; Vergara, L.; Ahmed, B.; Salazar, A. Fusion of Scores in a Detection Context Based on Alpha Integration. Neural Comput. 2015, 27, 1983–2010. [Google Scholar] [CrossRef] [PubMed]
  50. Guthrie, R.S.; Ciliberti, D.; Mankin, E.A.; Poe, G.R. Recurrent Hippocampo-neocortical sleep-state divergence in humans. Proc. Natl. Acad. Sci. USA 2022, 119, e2123427119. [Google Scholar] [CrossRef]
Figure 1. A sample raw EDA signal from a single night PSG recording is shown.
Signals 04 00048 g001
Figure 2. The figure shows that haar function. We use it to limit the effect of sharp changes due to measurement noise.
Signals 04 00048 g002
Figure 3. The db44 function.
Signals 04 00048 g003
Figure 4. The coif3 function.
Signals 04 00048 g004
Figure 5. Flow diagram of the algorithm developed in this work. After applying a band-pass filter, the signal is processed in two different ways in parallel. One branch is for EDA event detection, while the other one is for motion artefact detection. The outputs of the two branches are then merged and artefacts removed. The final steps consist of removing periods of wakefulness and EDA storm detection.
Signals 04 00048 g005
Figure 6. Example of an artefact. The signal exhibits a sudden voltage drop followed by high-frequency oscillations.
Signals 04 00048 g006
Figure 7. Example of an artefact’s power spectrum. The high-frequency contribution exceeds the threshold. Thus, the segment is labelled an artefact.
Signals 04 00048 g007
Figure 8. An EDA event is detected: the power spectrum of frequencies between 0.25 Hz and 3 Hz exceeds the EDA event threshold.
Signals 04 00048 g008
Figure 9. An EDA event is not detected: the power spectrum does not exceed the EDA event threshold.
Signals 04 00048 g009
Figure 10. An example of an EDA storm.
Signals 04 00048 g010
Figure 11. Difference between manual and automatic scoring.
Signals 04 00048 g011
Table 1. Shannon entropy for different mother functions and decomposition levels for the signal shown in Figure 1, measured in bits.
Mother FunctionDL 1DL 2DL 3DL 4
db440.00590.02280.08150.3572
coif30.00600.02190.07890.3599
Table 2. The performance of the algorithm scoring EDA signals from the 2005 study.
IndexAverageMedianMinimumMaximumStandard Deviation
P e v e n t 73.7%77.4%11.1%100%19.5%
R e v e n t 66.1%67.4%8.9%95.3%22.4%
F 1 e v e n t 68.9%68.9%9.9%100%20.5%
P s t o r m 50.3%47.6%0.0%100%26.6%
R s t o r m 62.6%65.4%18.8%100%18.2%
F 1 s t o r m 51.5%53.6%0.0%82.4%20.2%
Table 3. The performance of the algorithm scoring EDA signals recorded by the Sleep Revolution Project team.
IndexAverageMedianMinimumMaximumStandard Deviation
P e v e n t 68.9%76.5%16.7%91.8%19.7%
R e v e n t 77.8%79.8%16.7%96.1%14.7%
F 1 e v e n t 71.4%78.0%16.7%89.7%15.6%
P s t o r m 49.8%49.5%0.0%97.2%26.0%
R s t o r m 75.9%78.9%0.0%100%20.7%
F 1 s t o r m 56.6%57.6%0.0%95.6%22.1%
Table 4. The p-values of two-sample t-tests are shown, where we compare a set of indices from one study to the respective set from the other study.
P event R event F 1 event P storm R storm F 1 storm
0.39370.03000.61670.94580.02370.5012
Disclaimer/Publisher’s Note: The statements, opinions and data contained in all publications are solely those of the individual author(s) and contributor(s) and not of MDPI and/or the editor(s). MDPI and/or the editor(s) disclaim responsibility for any injury to people or property resulting from any ideas, methods, instructions or products referred to in the content.

