Article

Machine Noise—Experimental Study of the Local Environmental Correction for the Emission Sound Pressure Level

by
Fabian Heisterkamp
Federeral Institute for Occupational Safety and Health (BAuA), 44149 Dortmund, Germany
Acoustics 2024, 6(1), 177-203; https://doi.org/10.3390/acoustics6010010
Submission received: 7 December 2023 / Revised: 30 January 2024 / Accepted: 2 February 2024 / Published: 8 February 2024
(This article belongs to the Special Issue Machinery Noise: Emission, Modelling and Control)

Abstract

:
Determining reliable noise emission values for machinery is key to successfully implement the Sell and Buy Quiet concept. ISO 11202 is a basic noise emission standard to determine the emission sound pressure level of machines outside of special acoustic test rooms (in situ measurements) and enables machinery manufacturers to determine the noise emission data of their products within their own premises. However, a recent amendment to this standard was made on the basis of an unsatisfactory amount of experimental data. Therefore, this paper systematically examines the validity and accuracy of the amended part of the method. It answers the question, whether the amendment represents an improvement of the existing method. Measurements on a model machine with two configurations allow for an extensive investigation of the effects of the amendment. To that end, the emission sound pressure levels at eight positions near the machine are determined in three different acoustic environments. One finds that the amendment leads to an overestimation of the local environmental correction for the L p A , which, in turn, could lead to an underestimation of the determined emission sound pressure level.

1. Introduction

Noise emission values, such as the emission sound pressure level or the sound power level, are key to the successful application of the Sell and Buy Quiet concept [1]. This concept is supposed to reduce occupational noise exposure from machinery and, ultimately, the occurrence of occupational noise-induced hearing loss. However, noise emission values need to be reliable in order to enable employers to select the comparatively quietest machines fulfilling all operational process requirements. Hence, machinery manufacturers shall determine these values with sufficient accuracy and reproducibility.
This, in turn, represents a challenge for many machinery manufacturers, especially small and medium sized enterprises (SMEs), as they do not have access to hemi-anechoic chambers or reverberation rooms within their facilities. If measurements are performed by a third party, e.g., a test house, this can be too costly if the sold quantity of a certain type of machine is low or if in the worst case all machines are custom-made.
However, there are standards that allow for the in situ determination of the emission sound pressure level (ISO 11202 [2], ISO 11204 [3] and ISO 11205 [4]) as well as the sound power level (see ISO 3740 [5] as a guide to applicable standards). They either apply corrections or are based on measuring the sound intensity. The corrections needed for the determination of the A-weighted emission sound pressure level L p A from in situ sound pressure level measurements are the background noise correction K 1 A and the local environmental correction K 3 A . K 3 A corrects for the increase of the sound pressure level at the workstation due to sound reflections in the room. In contrast to the environmental correction K 2 A for the sound power level, K 3 A takes into account the directivity of the noise emission of the machine, e.g., towards the workstation or in the opposite direction.
Here, ISO 11202 is the standard with the lowest demands regarding the acoustic environment and the measurement efforts, while still allowing for measurements of accuracy grade 2 under certain conditions. Thus, ISO 11202 might be regarded as the best standard for SMEs to determine the emission sound pressure levels of their machines.
Basic noise emission standards are the result of research as well as discussions in the responsible ISO (International Organization for Standardization) Working Group (WG): ISO Technical Committee 43 Acoustics Subcommittee 1: Noise WG 28: Basic machinery noise emission standards. Focusing on ISO 11202, as it is the subject of this article, research has already been conducted on the first version of this standard (ISO 11202:1995 [6,7]). Within the frame of a European project, H. G. Jonasson concluded that ISO 11202:1995 had a bias, which led to an overestimation of the determined emission sound pressure level [8]. Another research project [9] independently came to similar conclusions. Here, measurements in rooms with an environmental correction K 2 A > 2   dB led to a systematic overestimation of more than 5.0 dB (omnidirectional sound radiation of the source) or 8.2 dB (directional sound radiation of the source) in more than 30% of all cases.
Further research on the matter was published in a German research report whose title translates to “Investigation of the quantities influencing the determination of the emission sound pressure levels of machinery” [10]. Using sound prediction calculations, the following conclusions regarding the then-current version ISO 11202:1995 [6] were reached. In the case of a machine where the workstation is screened from the main sources of noise emission, the method was unsuited to determine the emission sound pressure level, as errors could become as large as 10 dB (again an overestimation of the L p A ). Even when the workstation was not screened from the main source of noise emission, the method only worked well as long as the source was concentrated in an area that was small compared to its distance from the workstation [10] (pp. 34–35). A revision of ISO 11202:1995 was recommended in view of the results from the sound prediction calculations.
In a subsequent research report from the year 2004, W. Probst made proposals to improve ISO 11202 [11] (pp. 78–81). First, the method from ISO 11202:1995 should be restricted to machines where the main sources of noise emission are not screened from the workstation and where the machine or the part of the machine dominating the noise emission is smaller than its distance to the workstation. Furthermore, a new method should become a part of ISO 11202. The proposal was based on the same method as the one used in ISO 11204:1995, except that one of the input parameters—the apparent directivity index—should be determined only approximately. These proposals were investigated and improved in the course of another research project, conducted by the ISO project leader responsible for the revision of ISO 11201, ISO 11202 and ISO 11204—W. Probst [12].
Note that more research was conducted on the matter of the local environmental correction K 3 A [13,14,15], but it was not focused on ISO 11202 and was partly conducted about 30 years ago. Standards in general and ISO standards in particular should represent the state of the art. Following the last revision of ISO 11202 in 2010 and the research conducted to support this revision (see above), no new research has been conducted for more than five years, and new research would be in order to ensure that ISO 11202 still represents the state of the art.
H. G. Jonasson conducted a small study with the aim of improving ISO 11202 [16]. He concluded that the standard could be improved as described below and that this would also improve the accuracy of the method. As a result of his study, ISO 11202 has recently been amended [17].
The changes made by the amendment mainly affect the local environmental correction K 3 for machines with a localized and well-defined sound-radiating area on the machine surface. This area needs to be small compared to its distance to the workstation and has to have a direct line of sight to the workstation, for which K 3 has to be determined. The changes—namely, the reduction of the minimum distance of workstations from the sound-radiating area from 1 m to 0.5 m and the calculation of the arithmetic mean d of the shortest distance d 1 and the longest distance d 2 for the distance from the workstation instead of only using the shortest distance, formerly also denoted d—not only increase the range of situations where the method can be applied, but affect the accuracy, too.
A clear effect of using the arithmetic mean instead of the shortest typical distance to determine K 3 A is that it yields an environmental correction that is larger than or equal to that determined according to the non-amended version of ISO 11202. On the one hand, this increases the risk of overestimating the effect of the environment and, thus, of obtaining an emission sound pressure level that is lower than the “true” free-field value, as K 3 A increases with increasing d (see Equation (1)). On the other hand, this change might improve the accuracy in certain situations.
Measurements to directly compare the results obtained according to ISO 11202:2010 [2] and according to the amended standard ISO 11202:2010/Amd 1:2020 [17] were performed in 1/3-octave bands and evaluated in the applicable range of the standards from 100 Hz to 10 kHz.
Being able to predict the accuracy or, alternatively, to properly estimate the measurement uncertainty is as important as determining an accurate emission sound pressure level. To that end, the approach to assigning the accuracy grade based on the maximum value of K 3 A is compared to the achieved accuracy. Here, the value K 3 A , max is calculated from the maximum distance d 2 between the dominantly sound-radiating area and the workstation.
Section 2 describes the model machine and the acoustic environments used to investigate the effects of the amendment. This is followed by the presentation of the results and their discussion in Section 3. Section 4 concludes the paper by discussing the implications of the results.

2. Materials and Methods

To evaluate the effect of the amendment, measurements on a model machine with two different configurations were conducted in a hemi-anechoic chamber (reference measurements) and two different rooms (different shapes, heights and sizes), i.e., non-ideal acoustic environments. The acoustic properties of the rooms were determined. The achieved accuracy grade (see Section 3.1) of the determined emission sound pressure level was compared to the deviation of the determined emission sound pressure levels from the “true” emission sound pressure levels measured in BAuA’s hemi-anechoic chamber. Here, BAuA (German abbrevation for Bundesanstalt für Arbeitsschutz und Arbeitsmedizin) refers to the Federal Institute for Occupational Safety and Health.
A model machine was used to simulate a real machine, while at the same time providing a stable and reproducible sound source. It had the following dimensions: 1.74   m × 1.12   m × 1.67   m ( length × width × height ). It simulated a real machine of medium dimensions, e.g., a processing machine (see also Ref. [12]). It was built using aluminium profiles and damped metal plates. In the bottom part of the model machine, three reference sound sources (RSSs), each having a sound power level of about 93 dB(A), ensured a sufficient noise emission.
A reference sound source (RSS) is a very stable sound source, which meets the requirements of ISO 6926:2016/Amd 1:2020 [18,19]. Reference sound sources were developed to determine the sound power level of other sound sources [20] and are used to determine the environmental correction K 2 A for the sound power level [21]. Aerodynamic reference sound sources are seen as candidates for transfer standards, once a reference normal for sound power has been established [22]. For this research, aerodynamic reference sound sources from Brüel & Kjaer (Type 4204) were used.
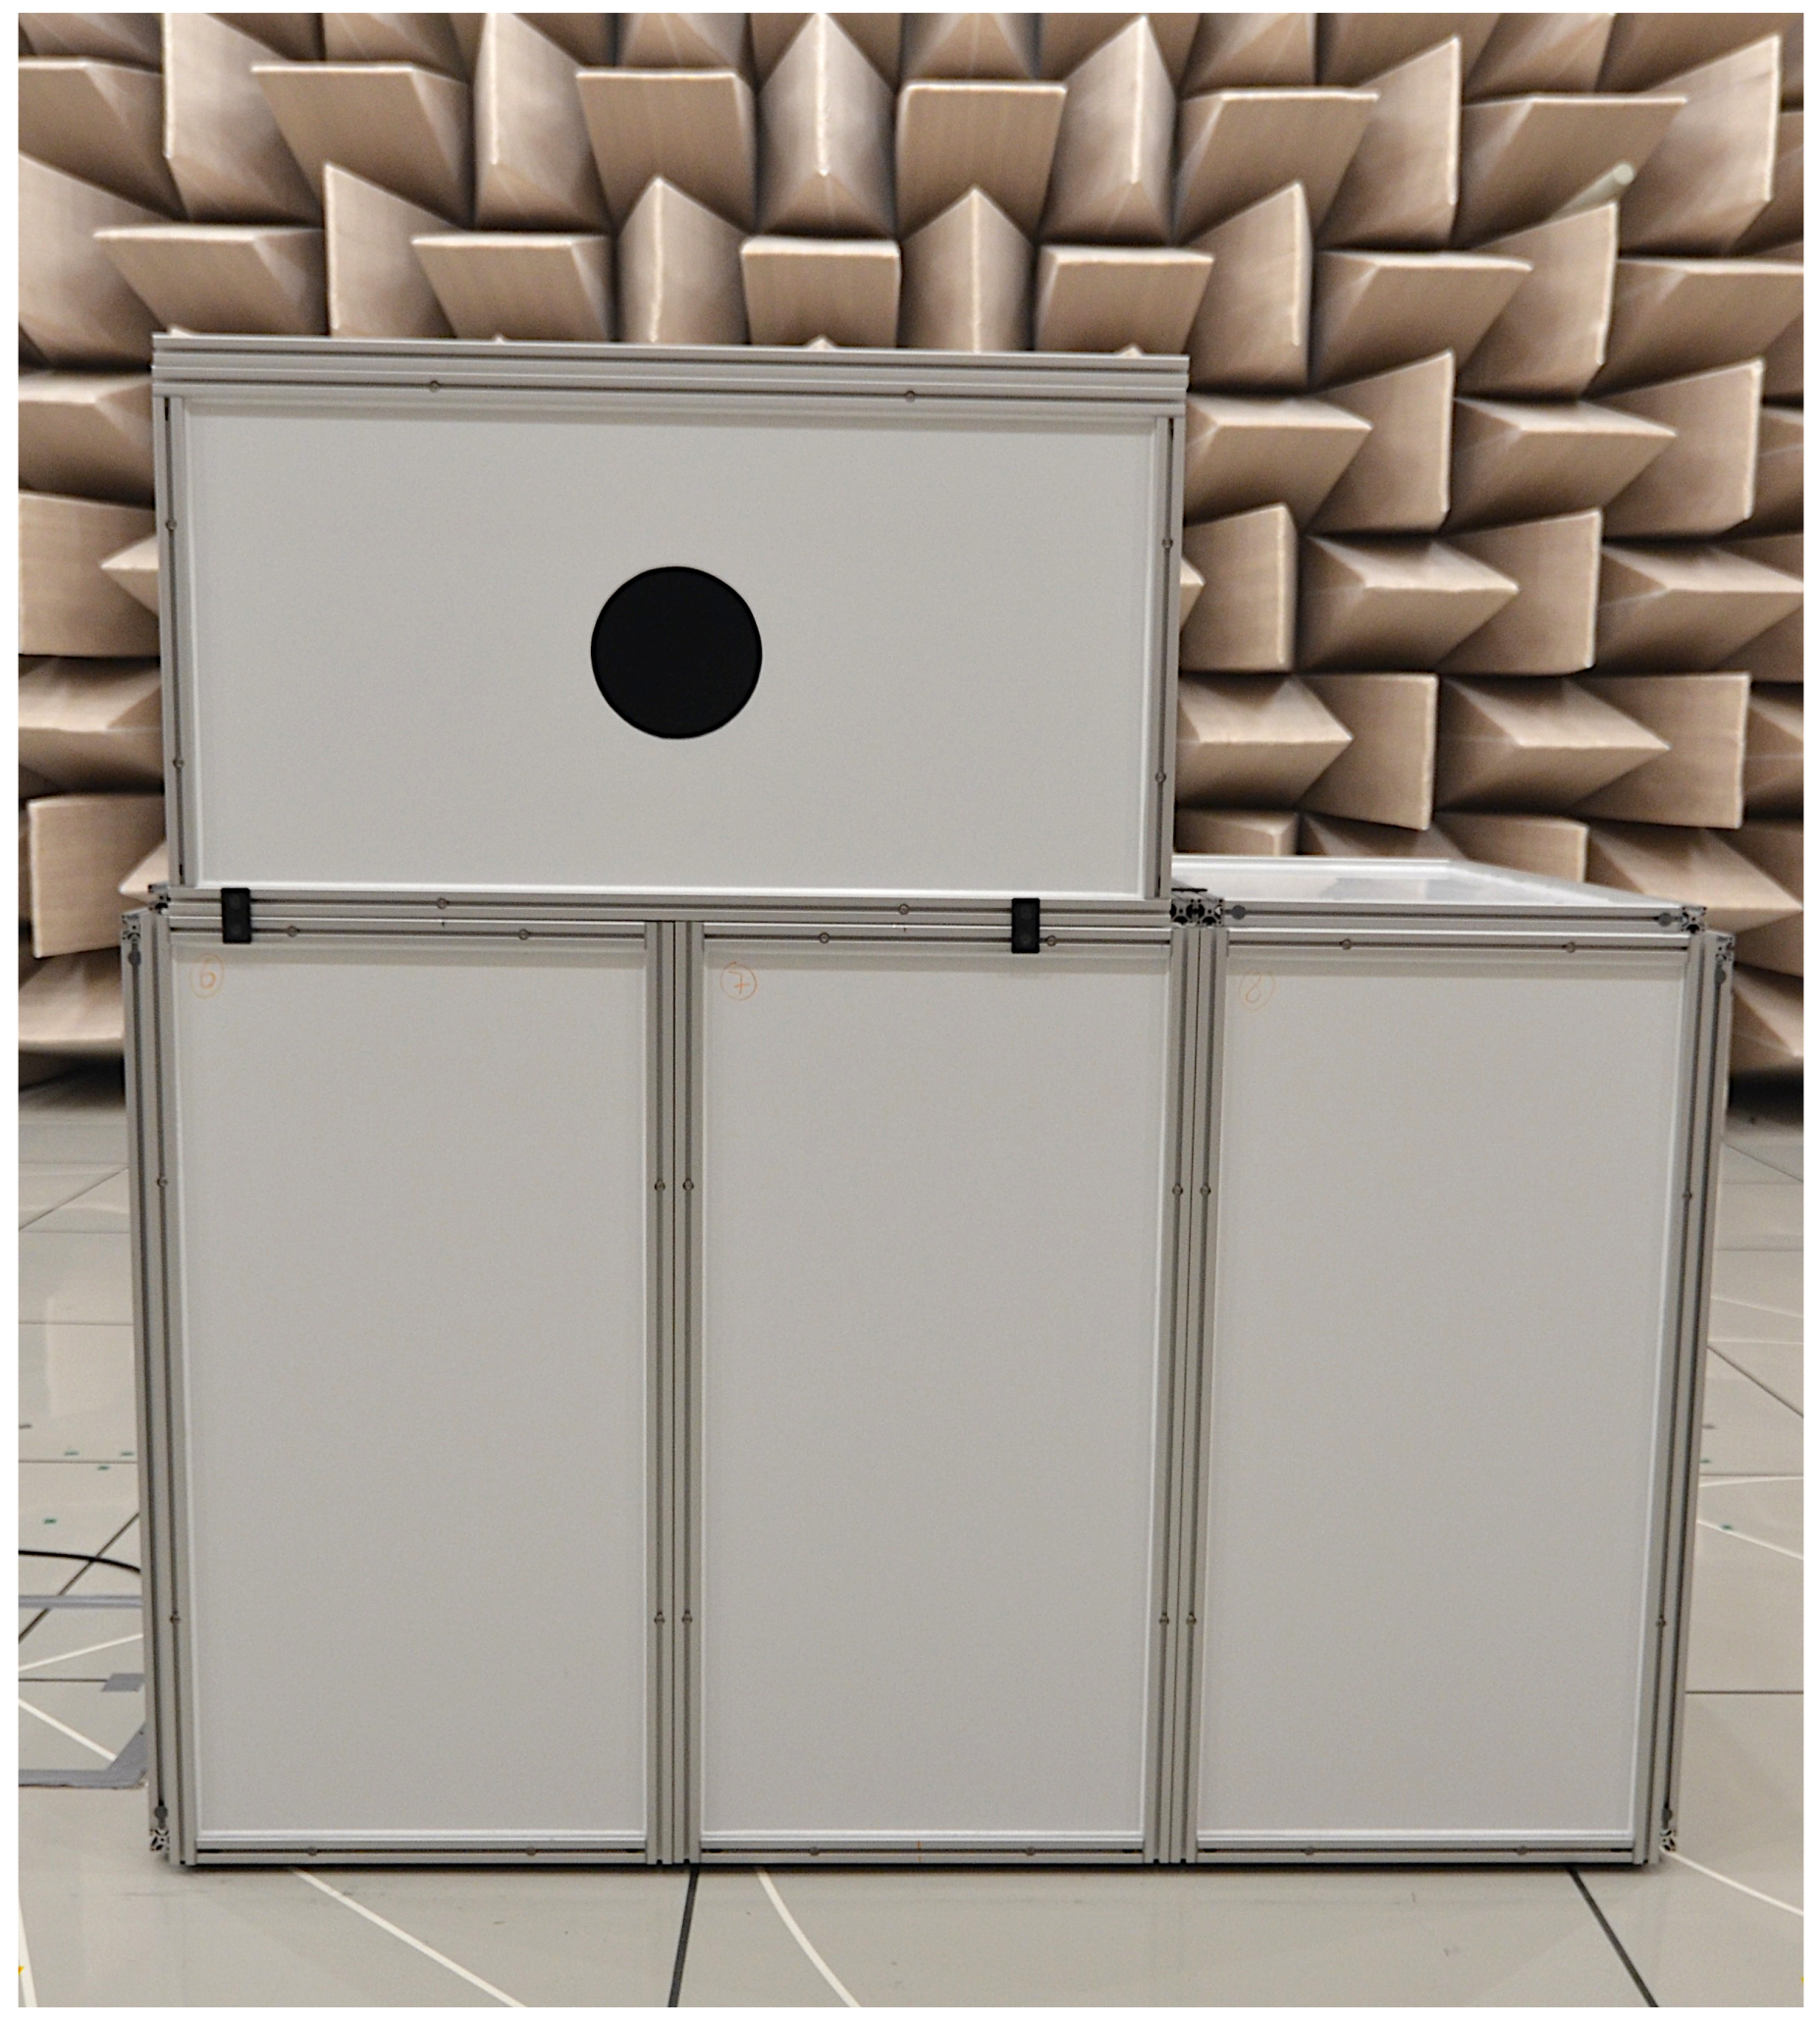
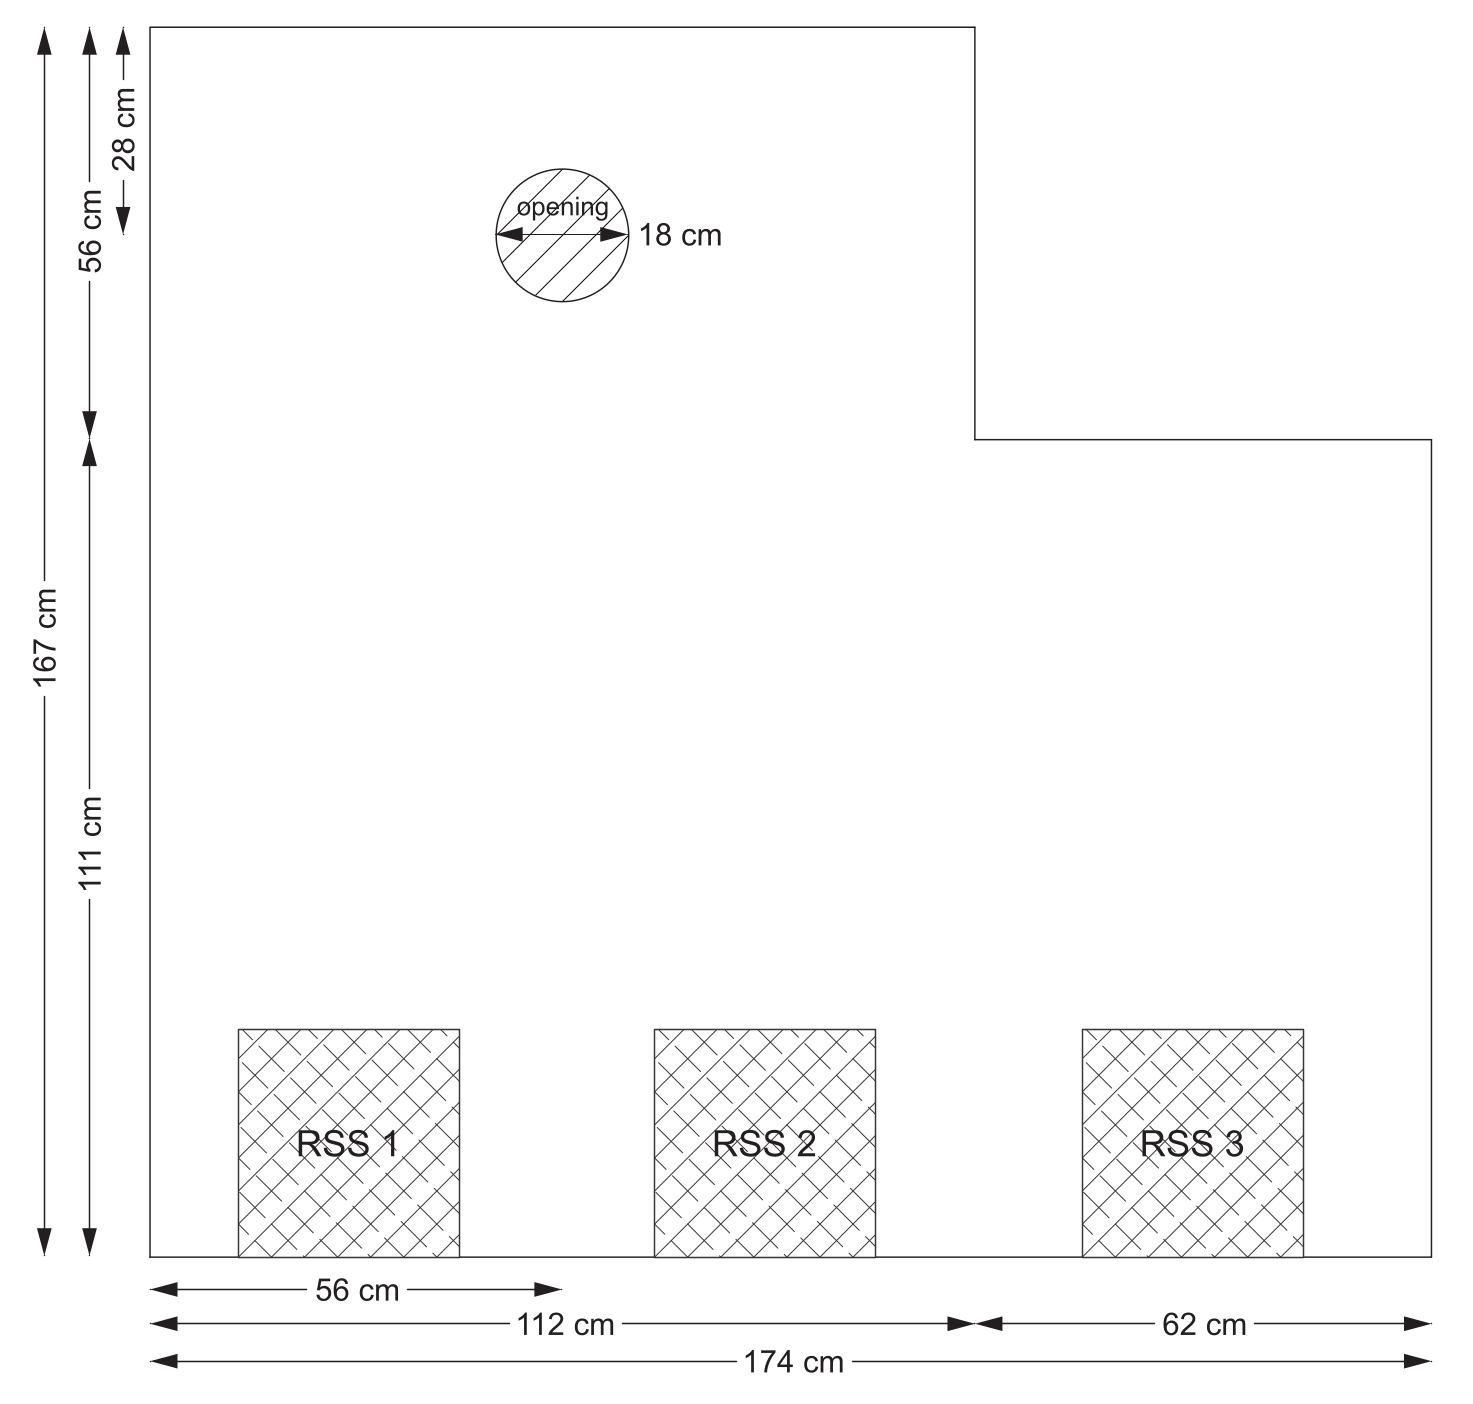
Figure 1 shows the model machine in configuration I with a circular opening in the hemi-anechoic chamber. Clearly, the opening represented a localized, well-defined and dominantly sound-radiating area (see the drawing (Figure A1) in Appendix A for the dimensions). 
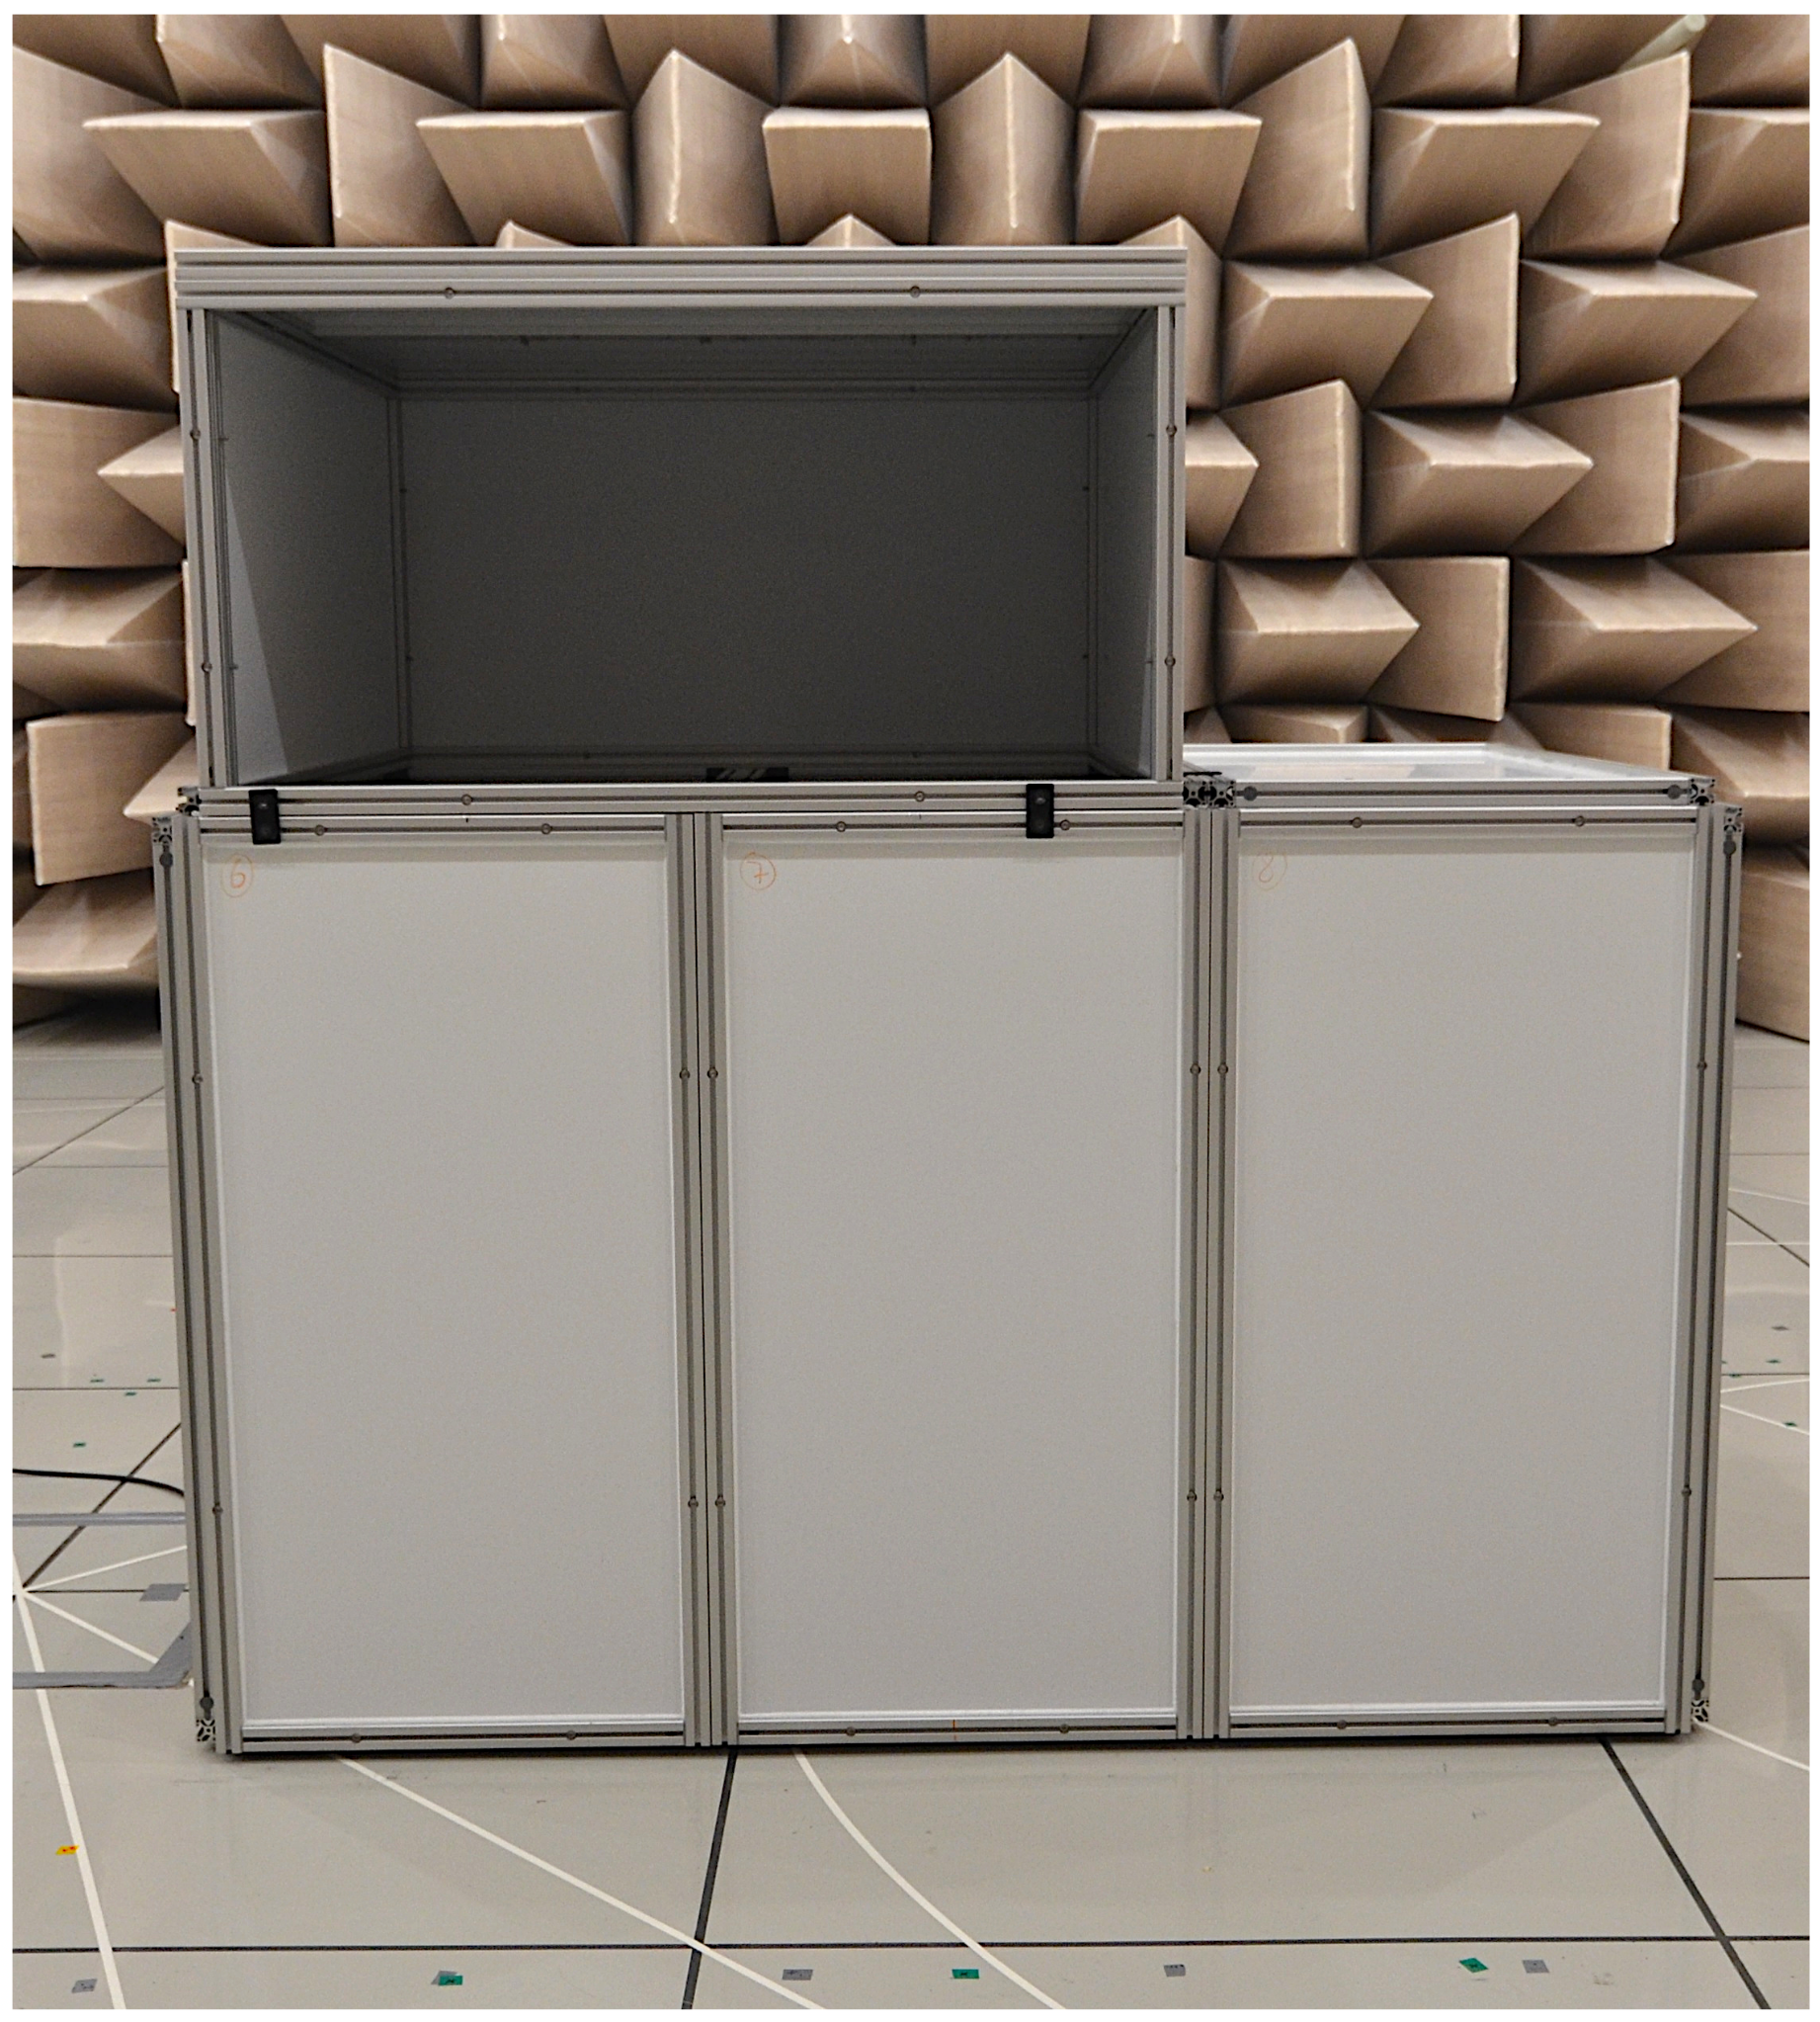
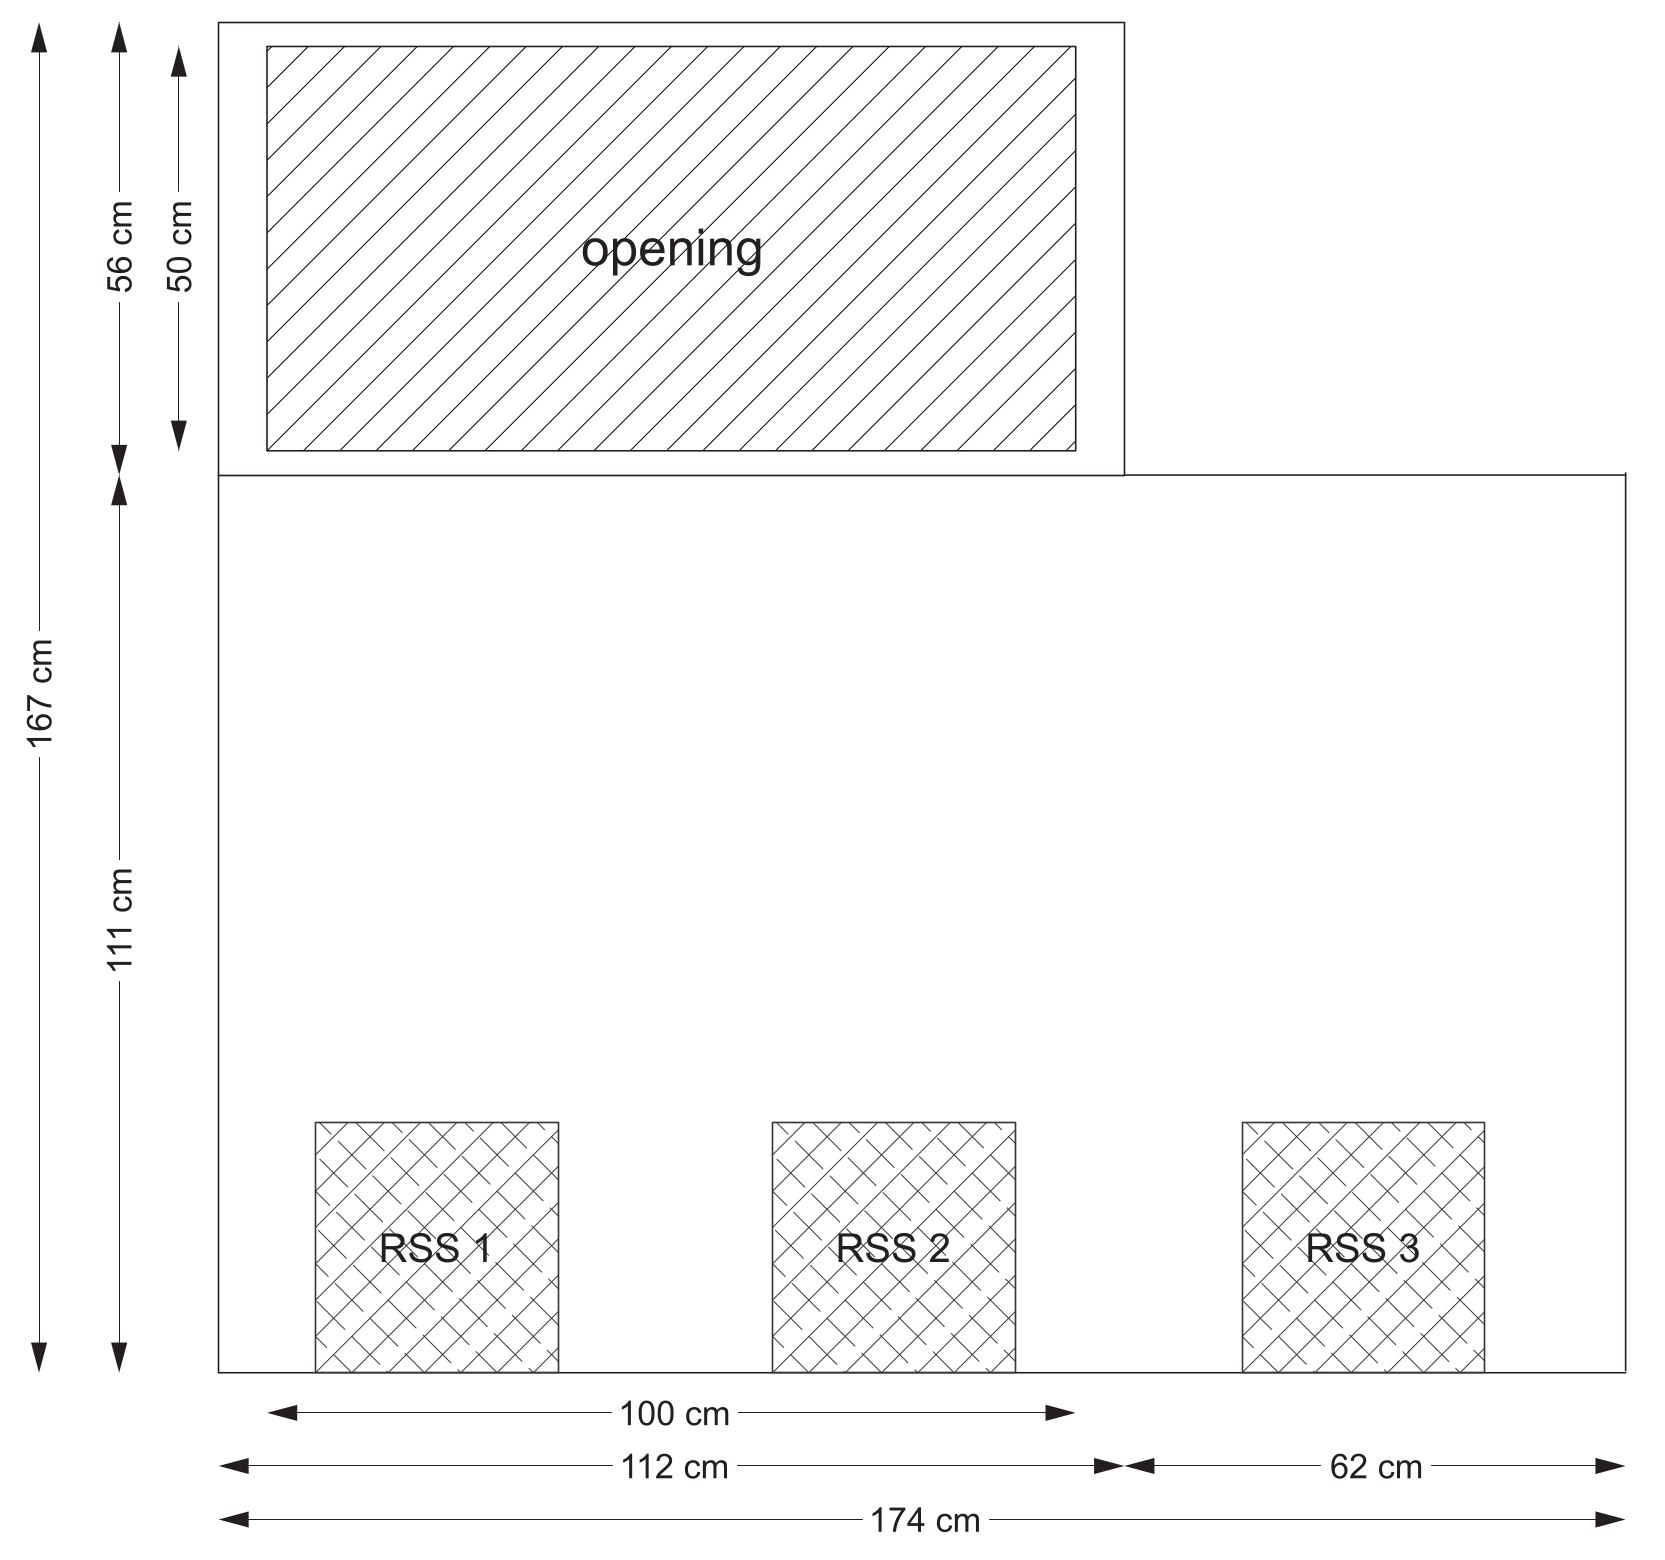
Figure 2 shows a photo of the model machine in configuration II, which had a larger opening on the same side of the machine. This opening still represented a dominantly sound-radiating area (see the drawing (Figure A2) in Appendix A for the dimensions).
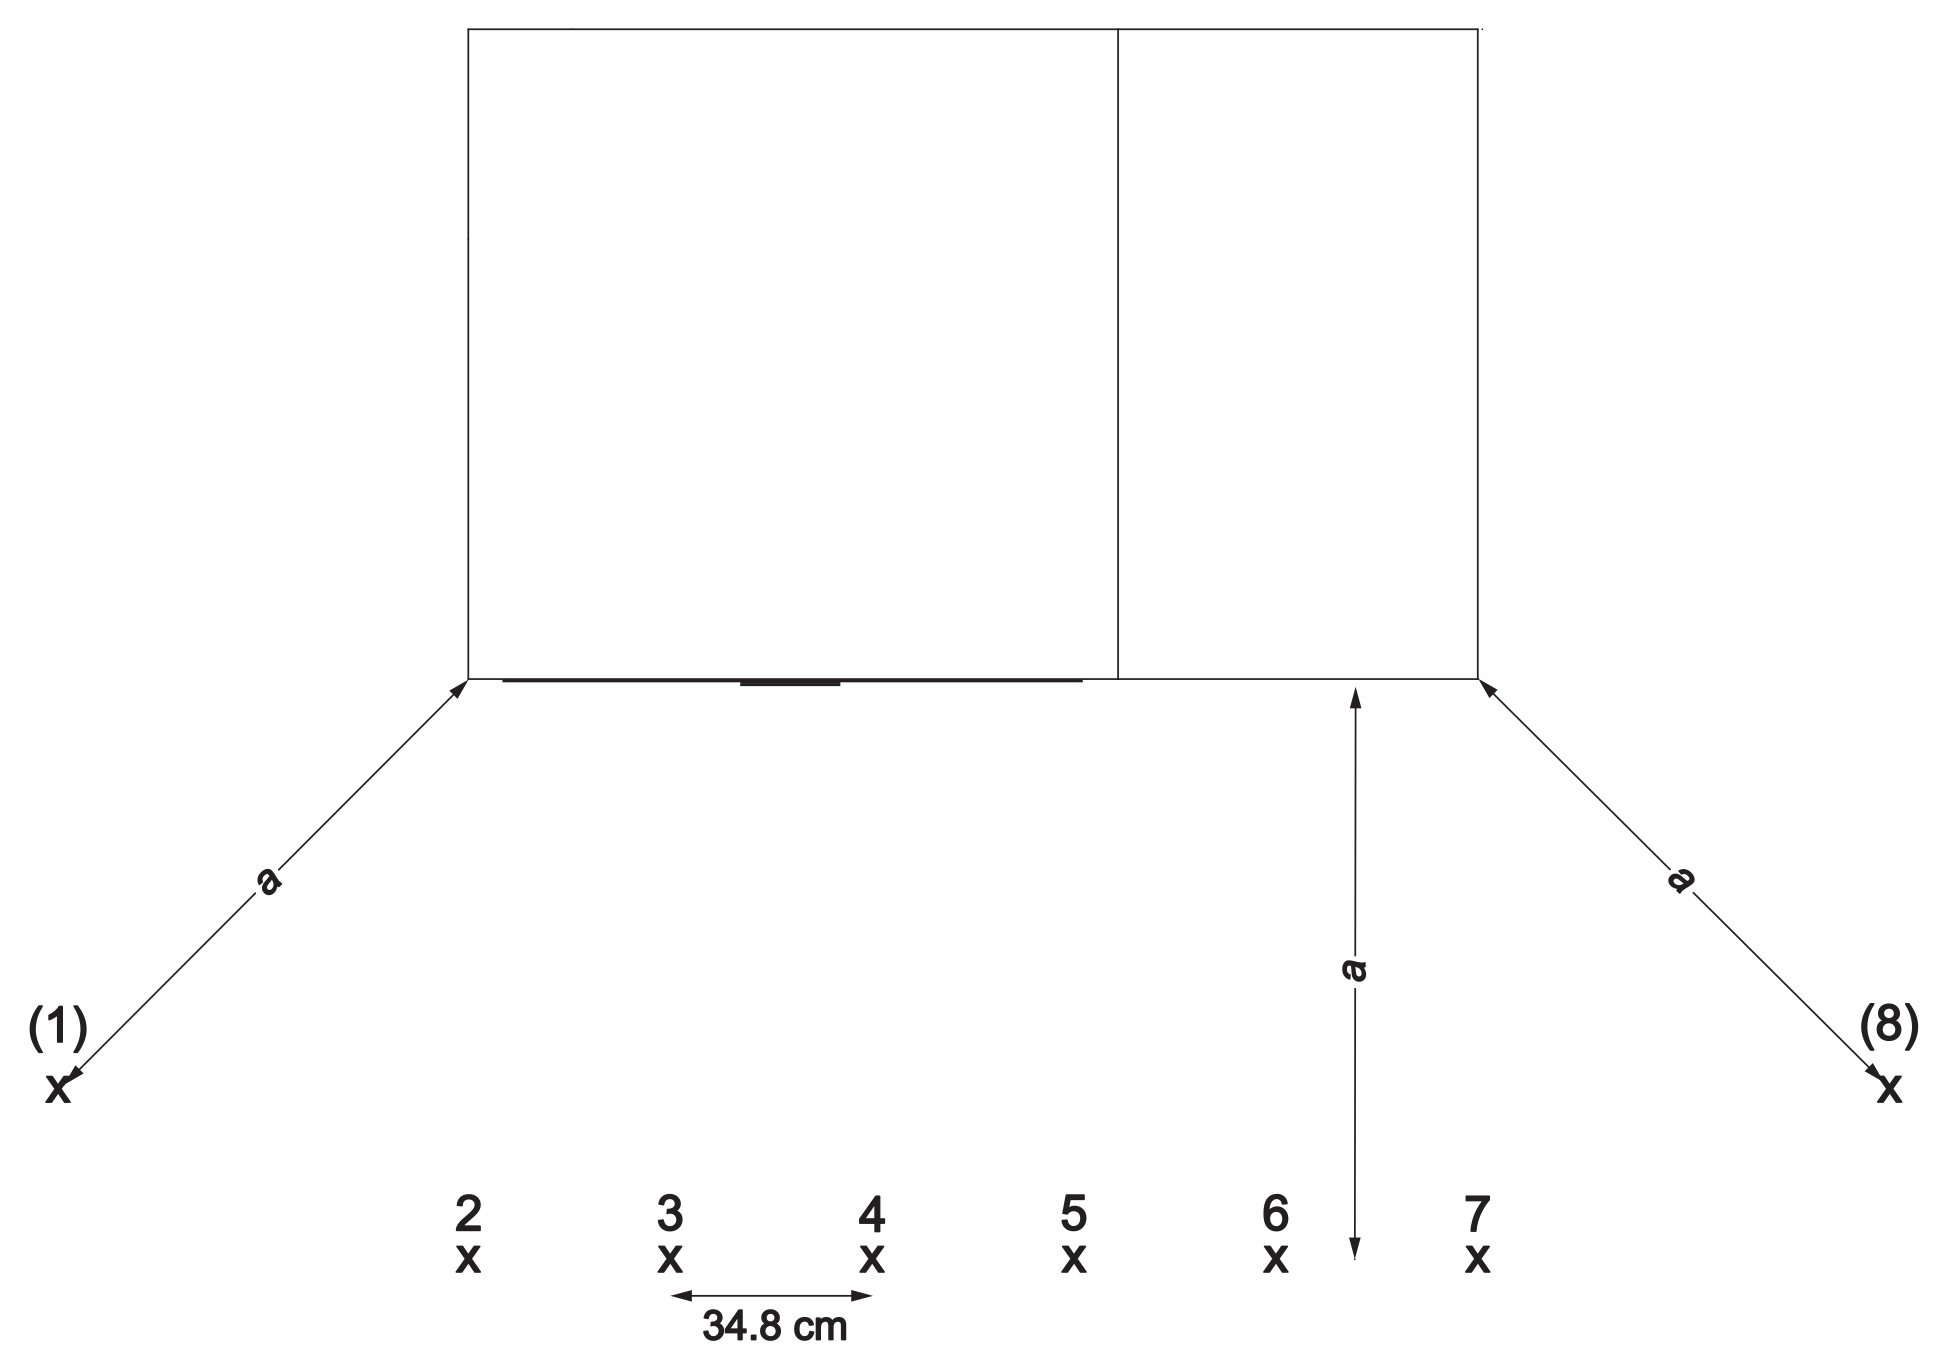
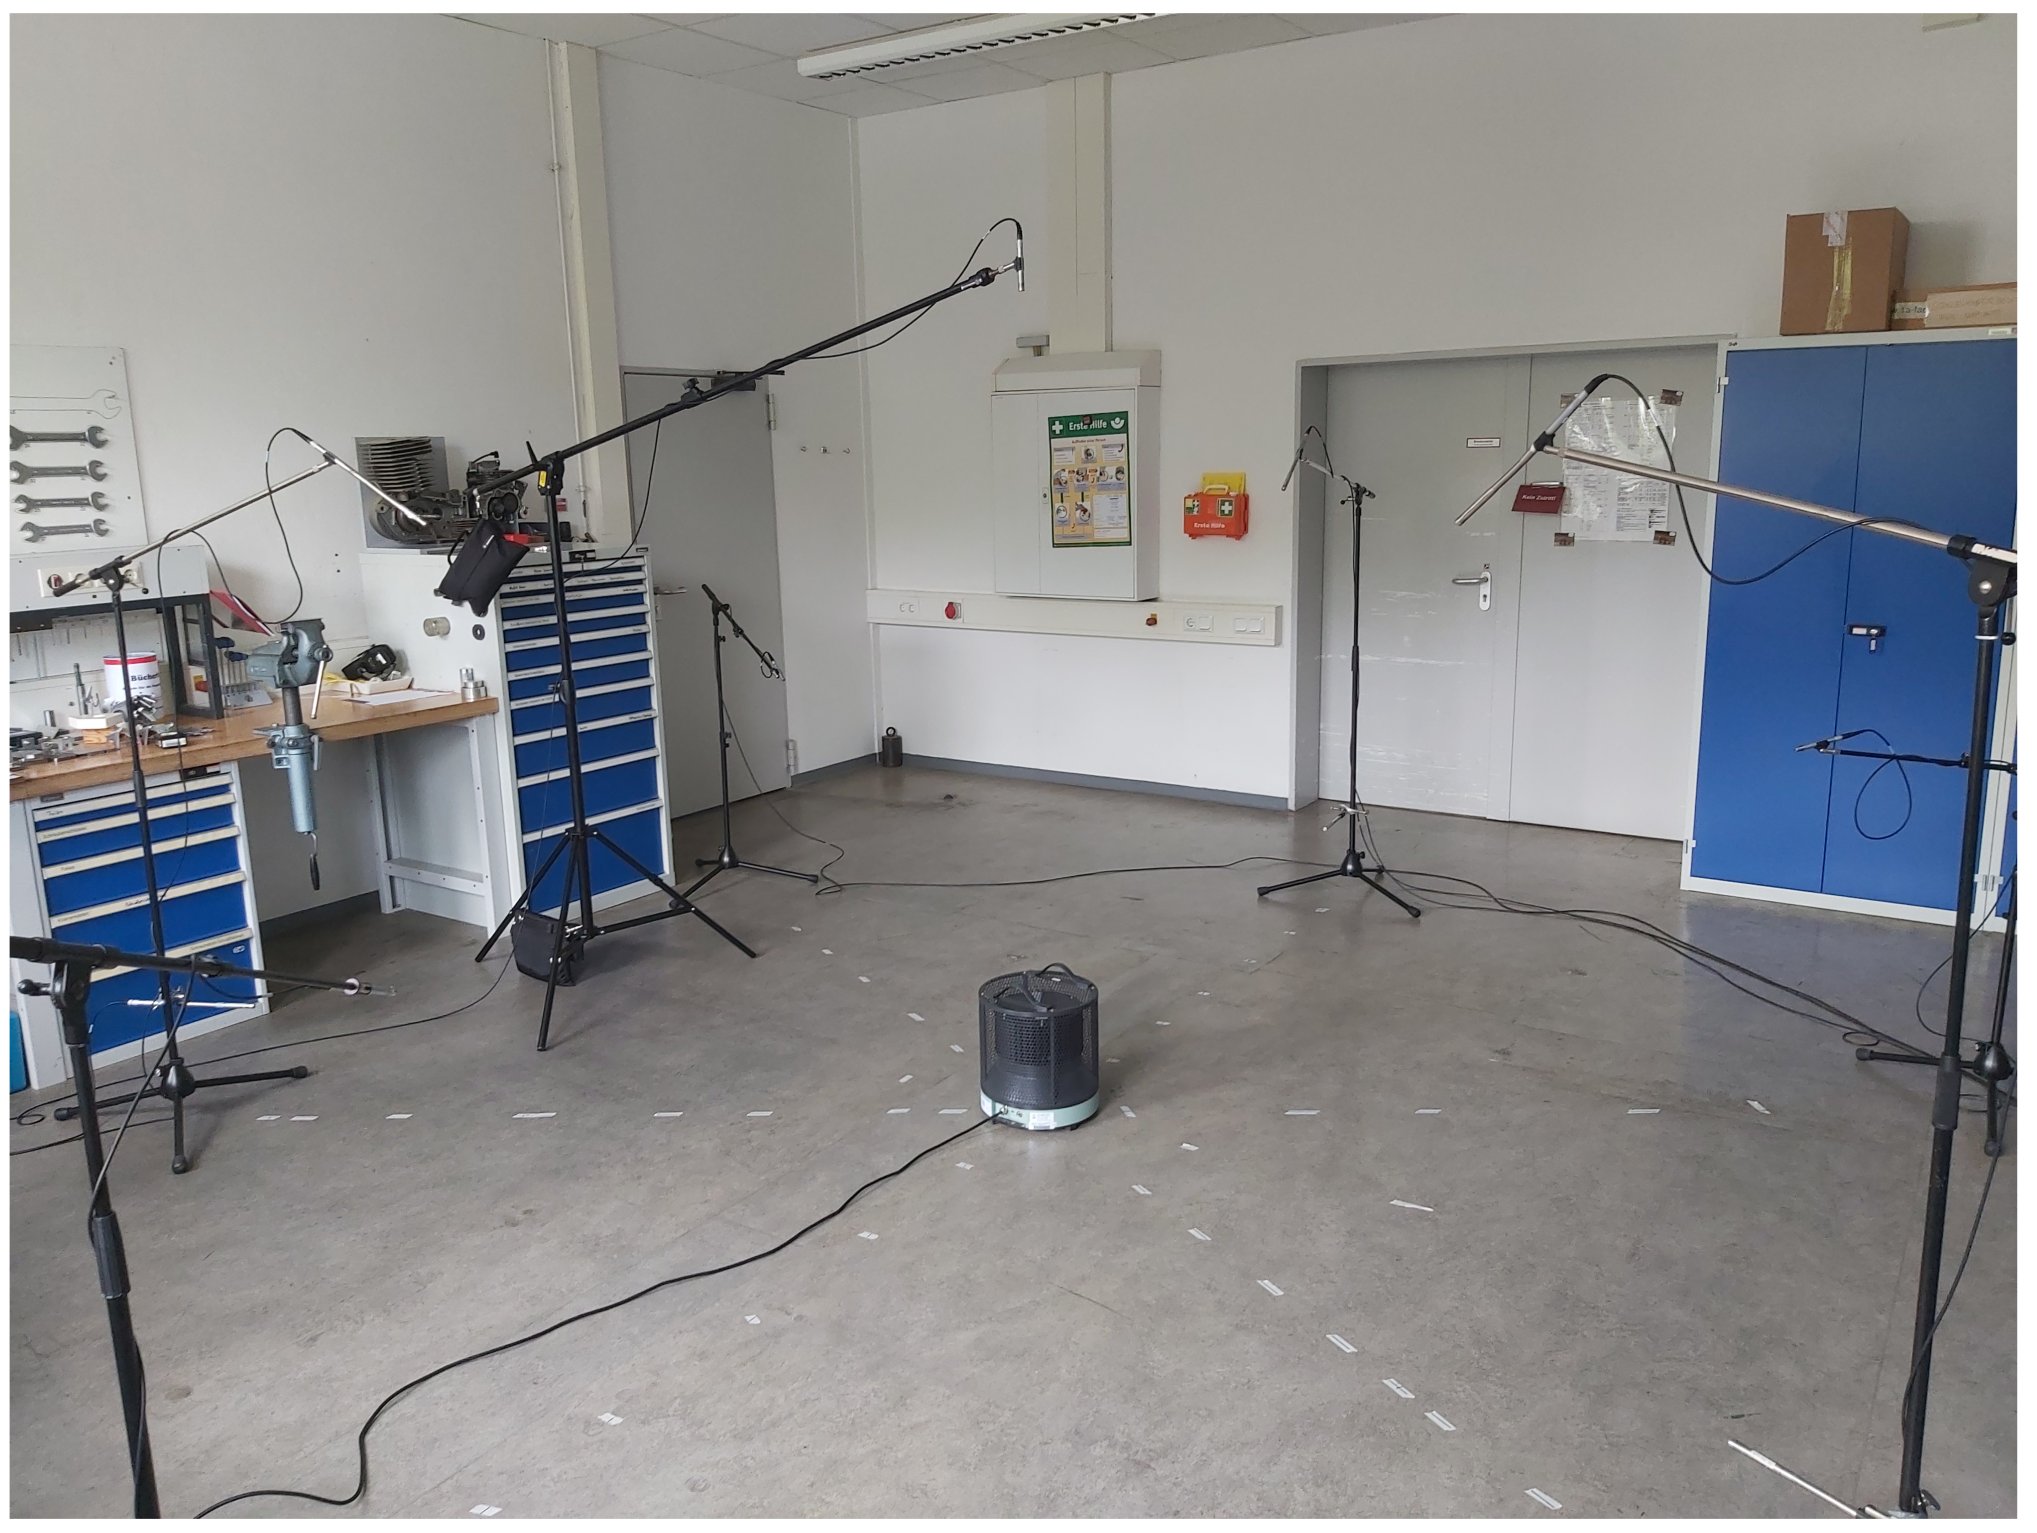
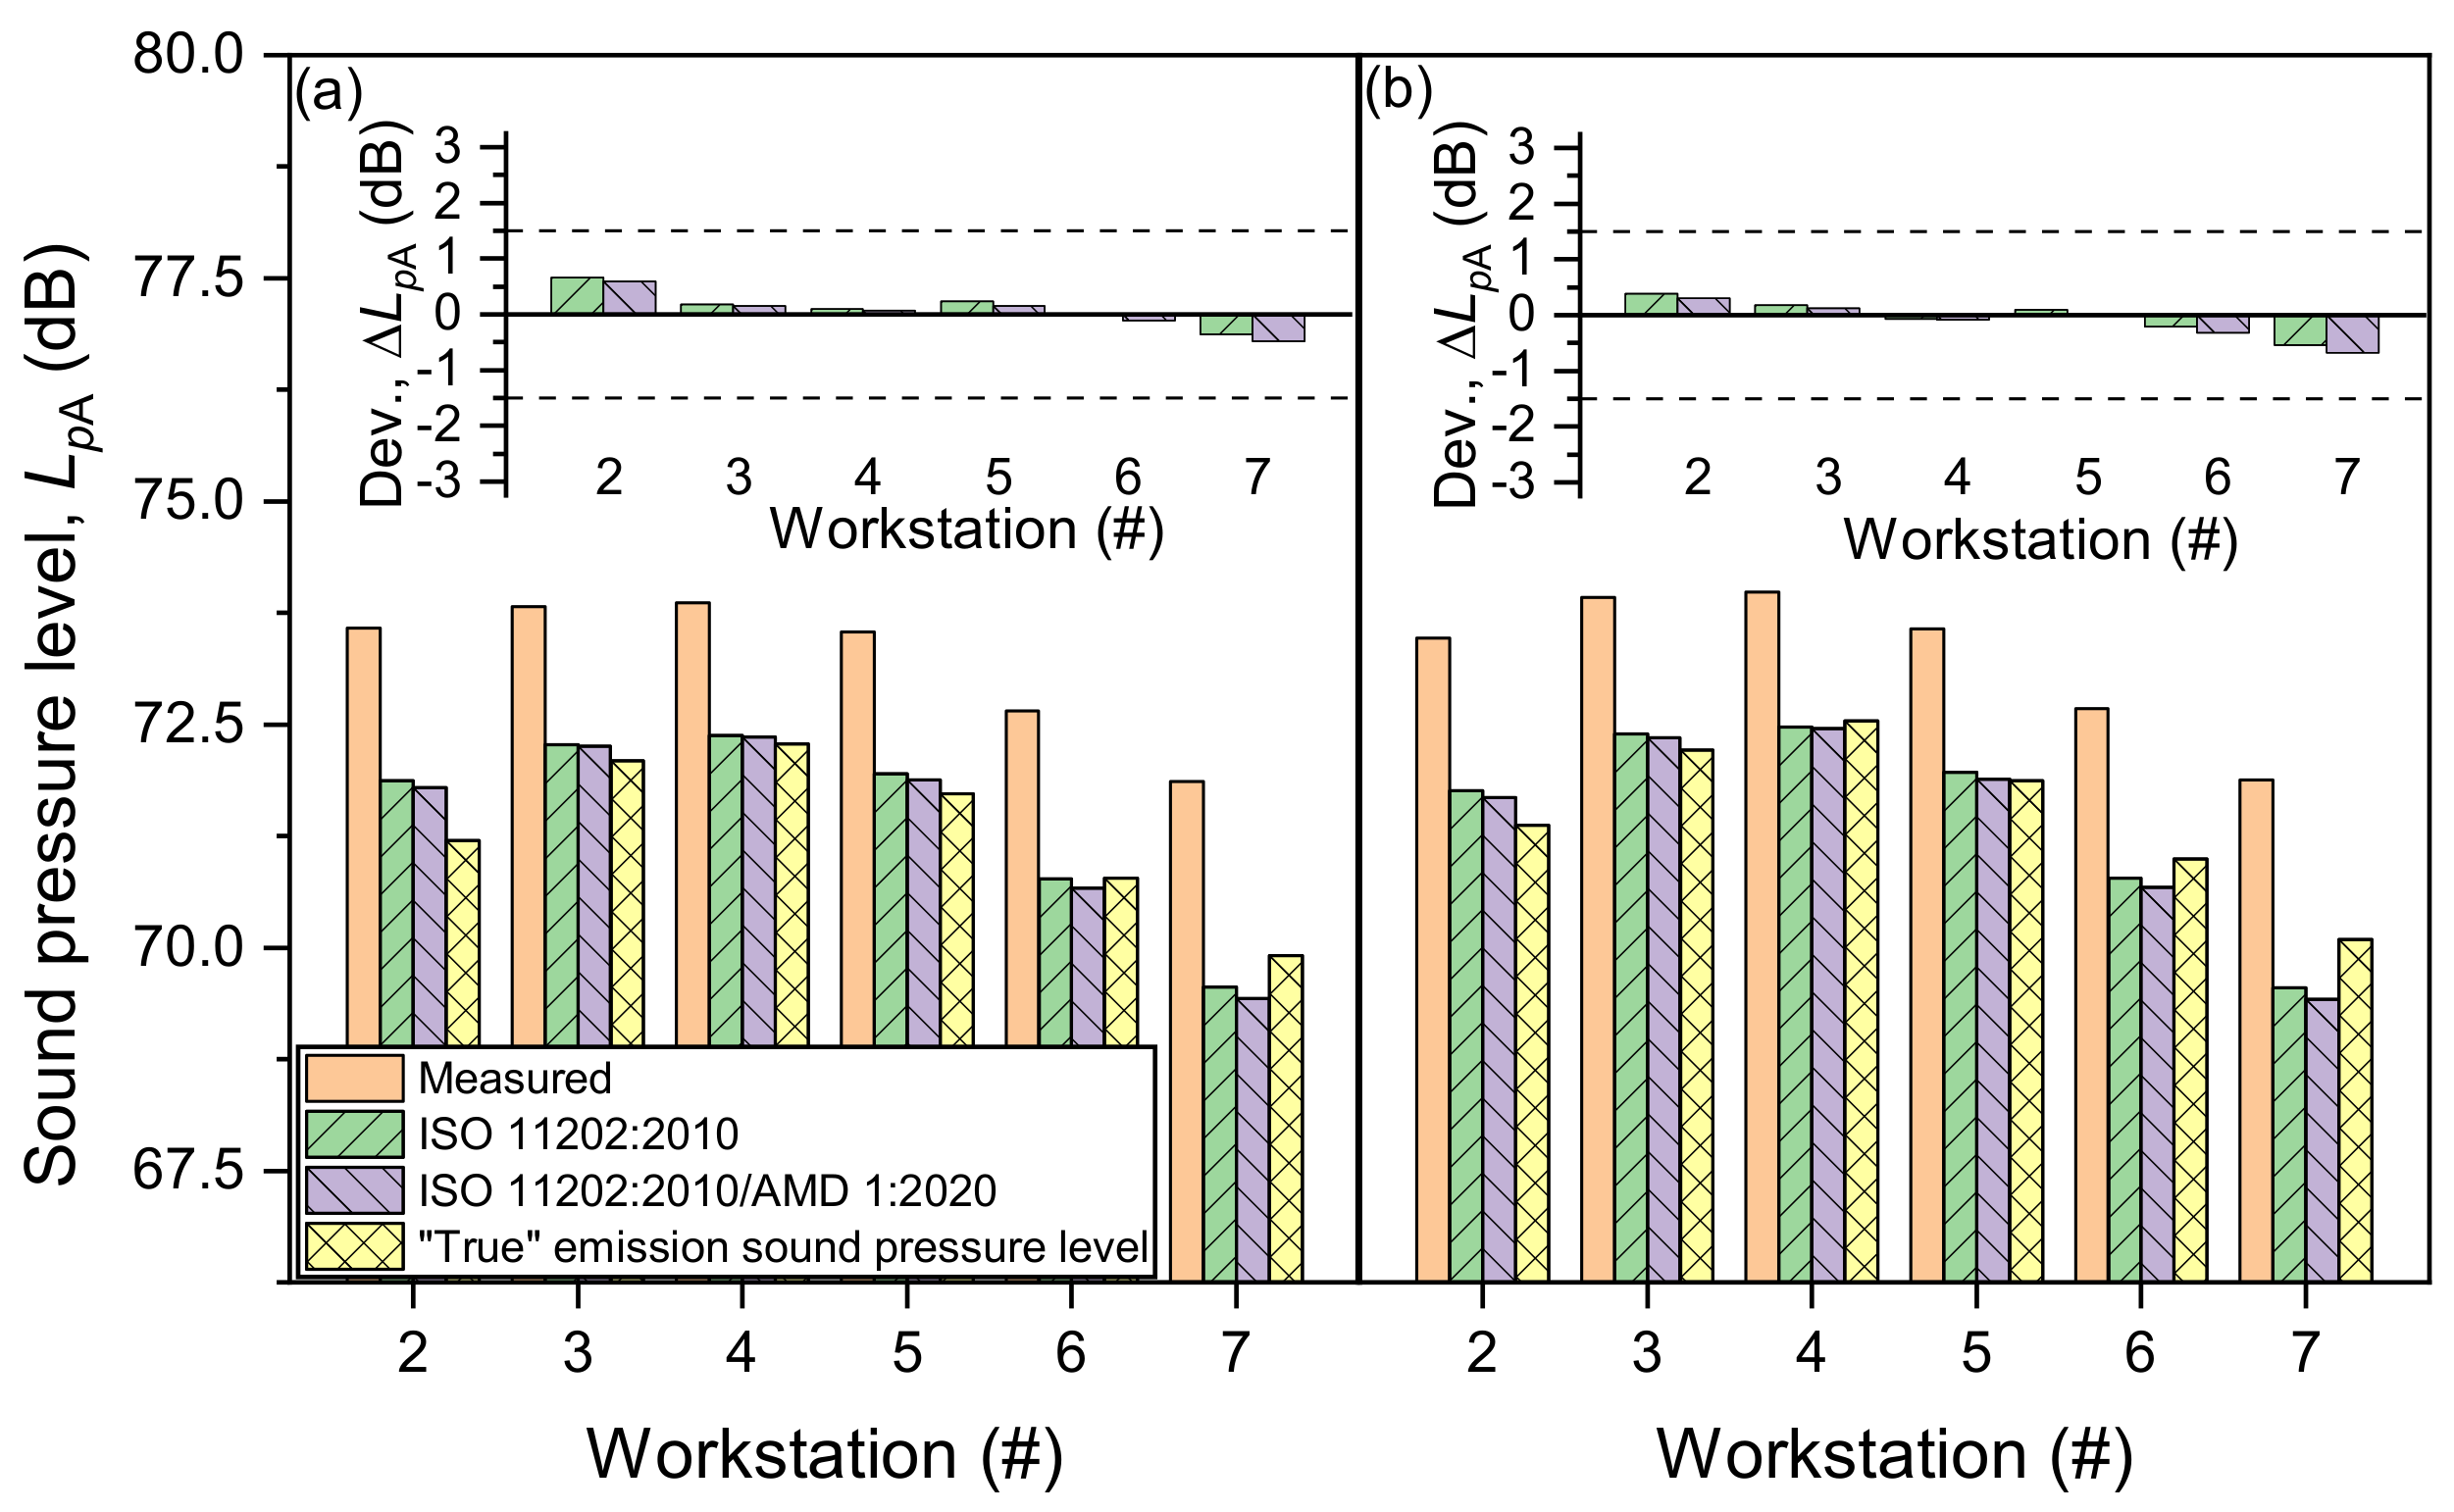
To obtain more data, eight workstations, instead of only one, were assigned to the model machine. 
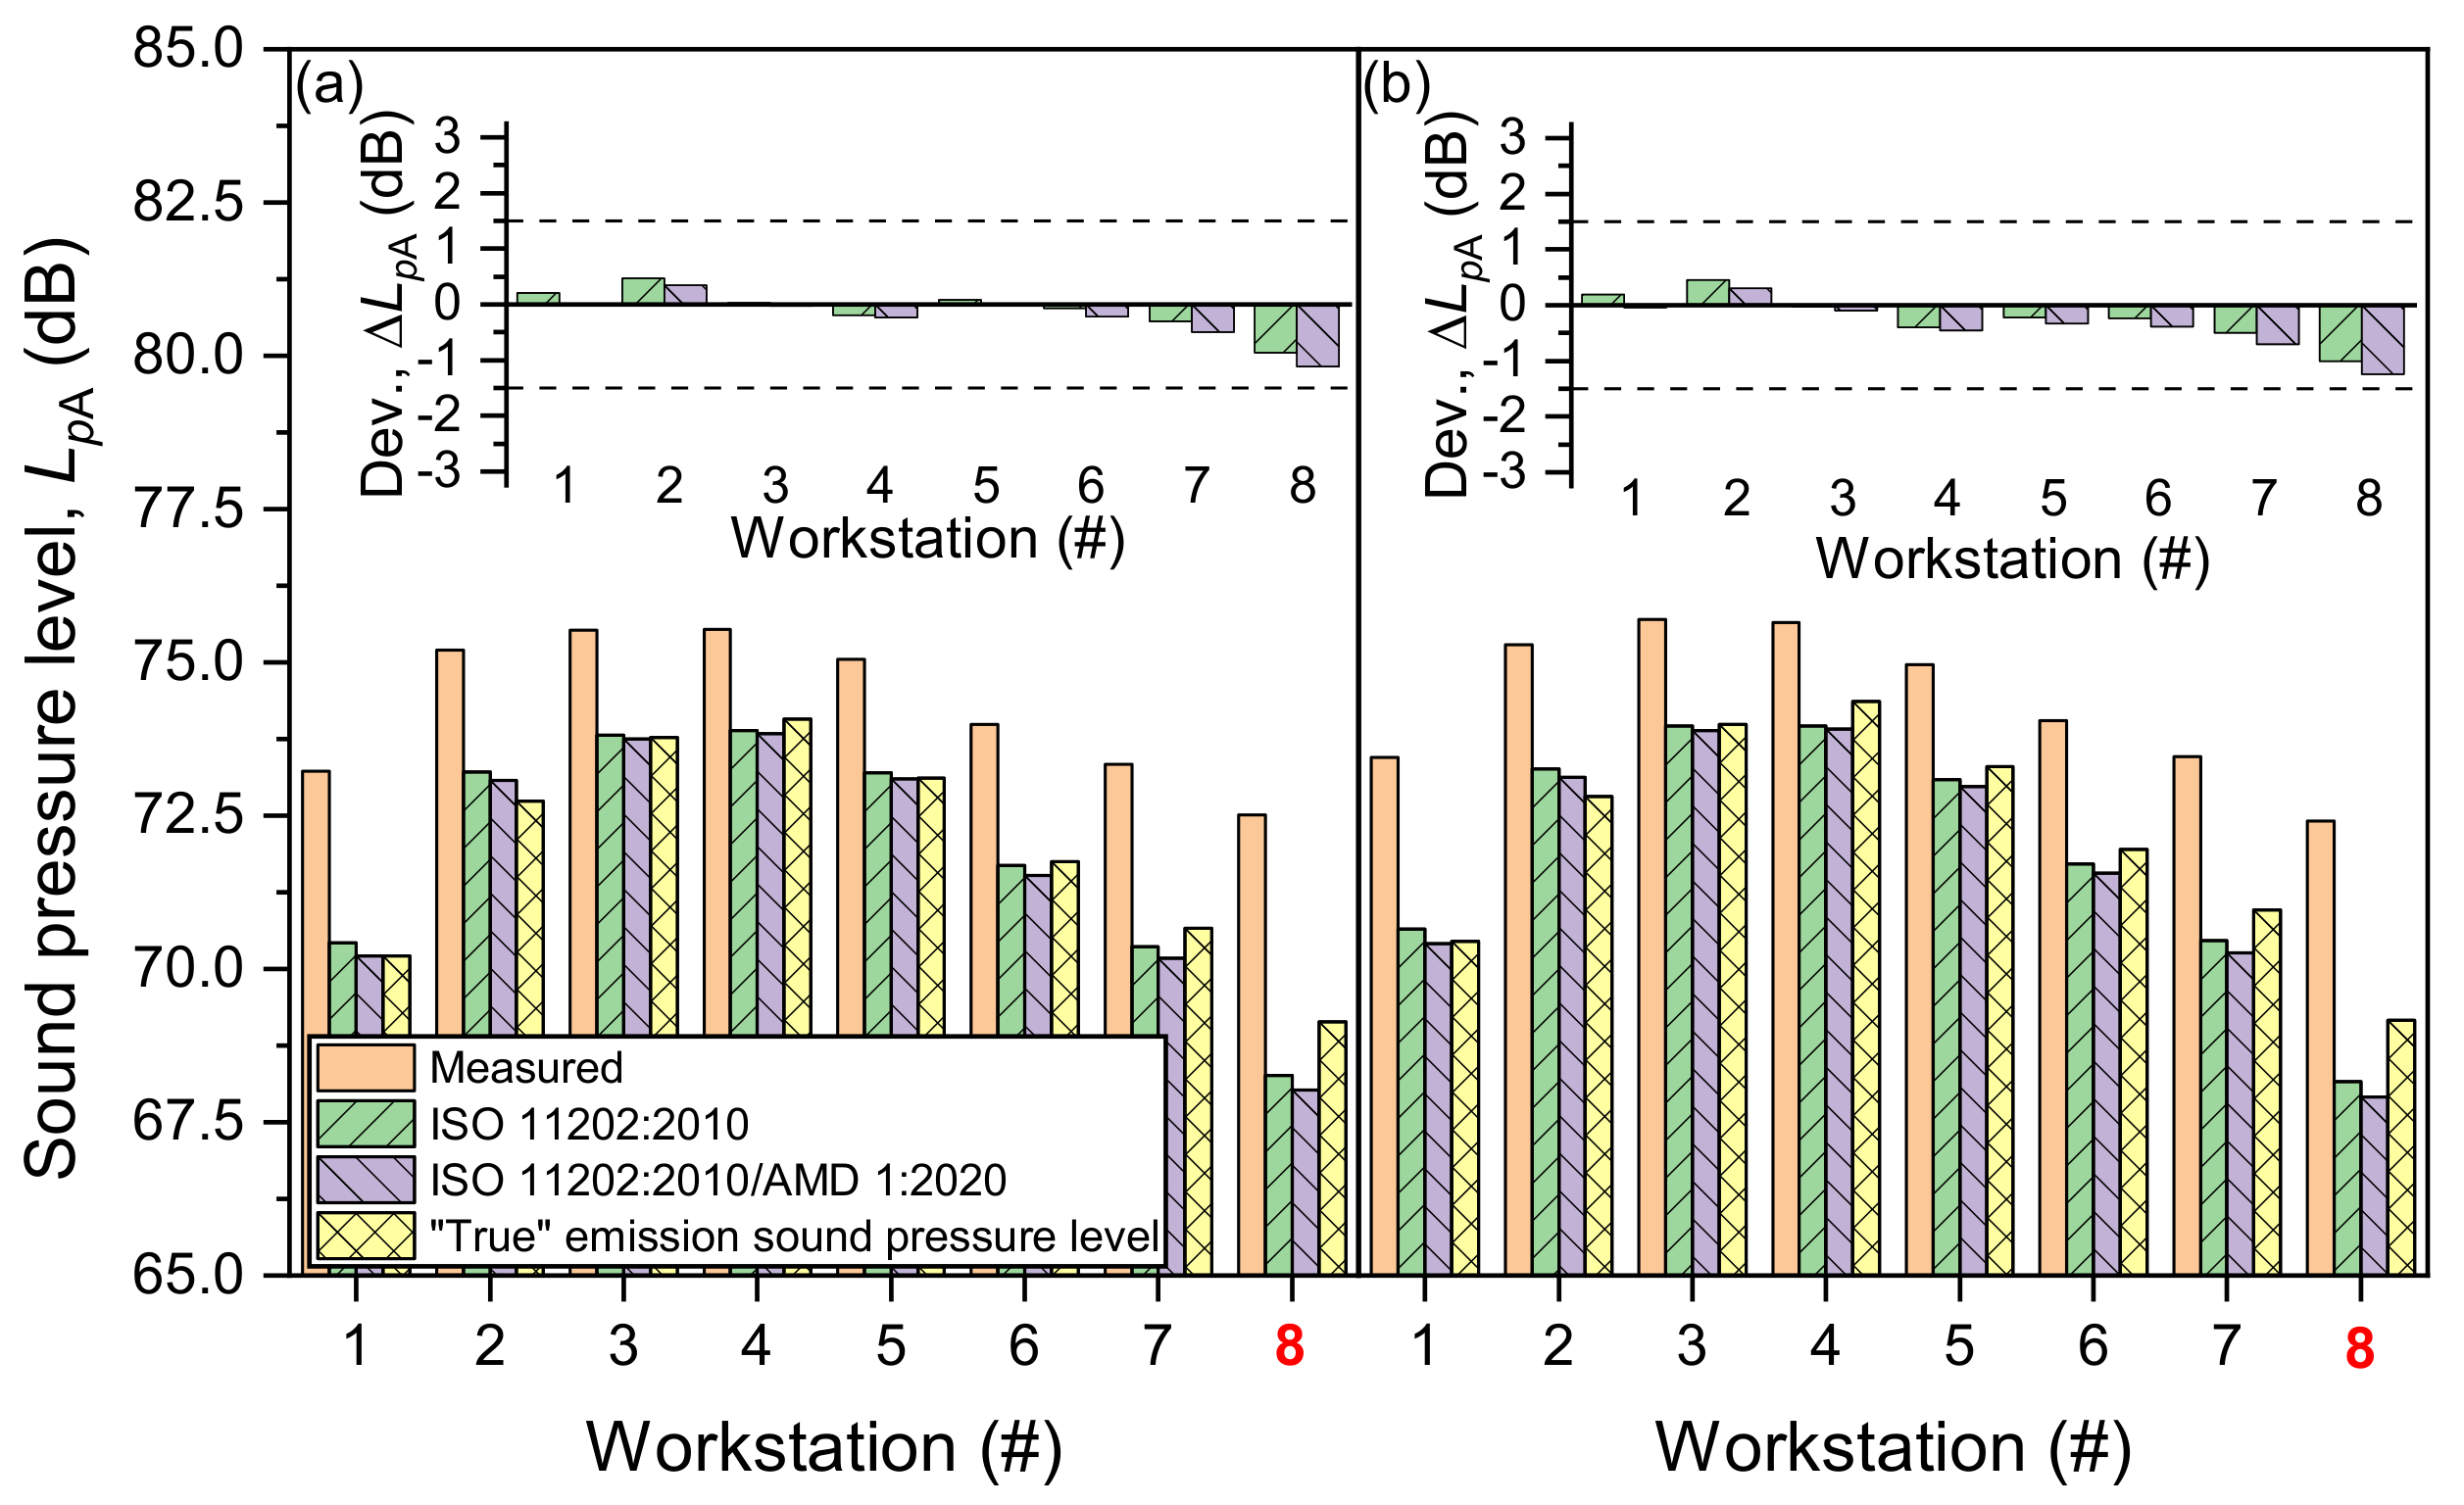
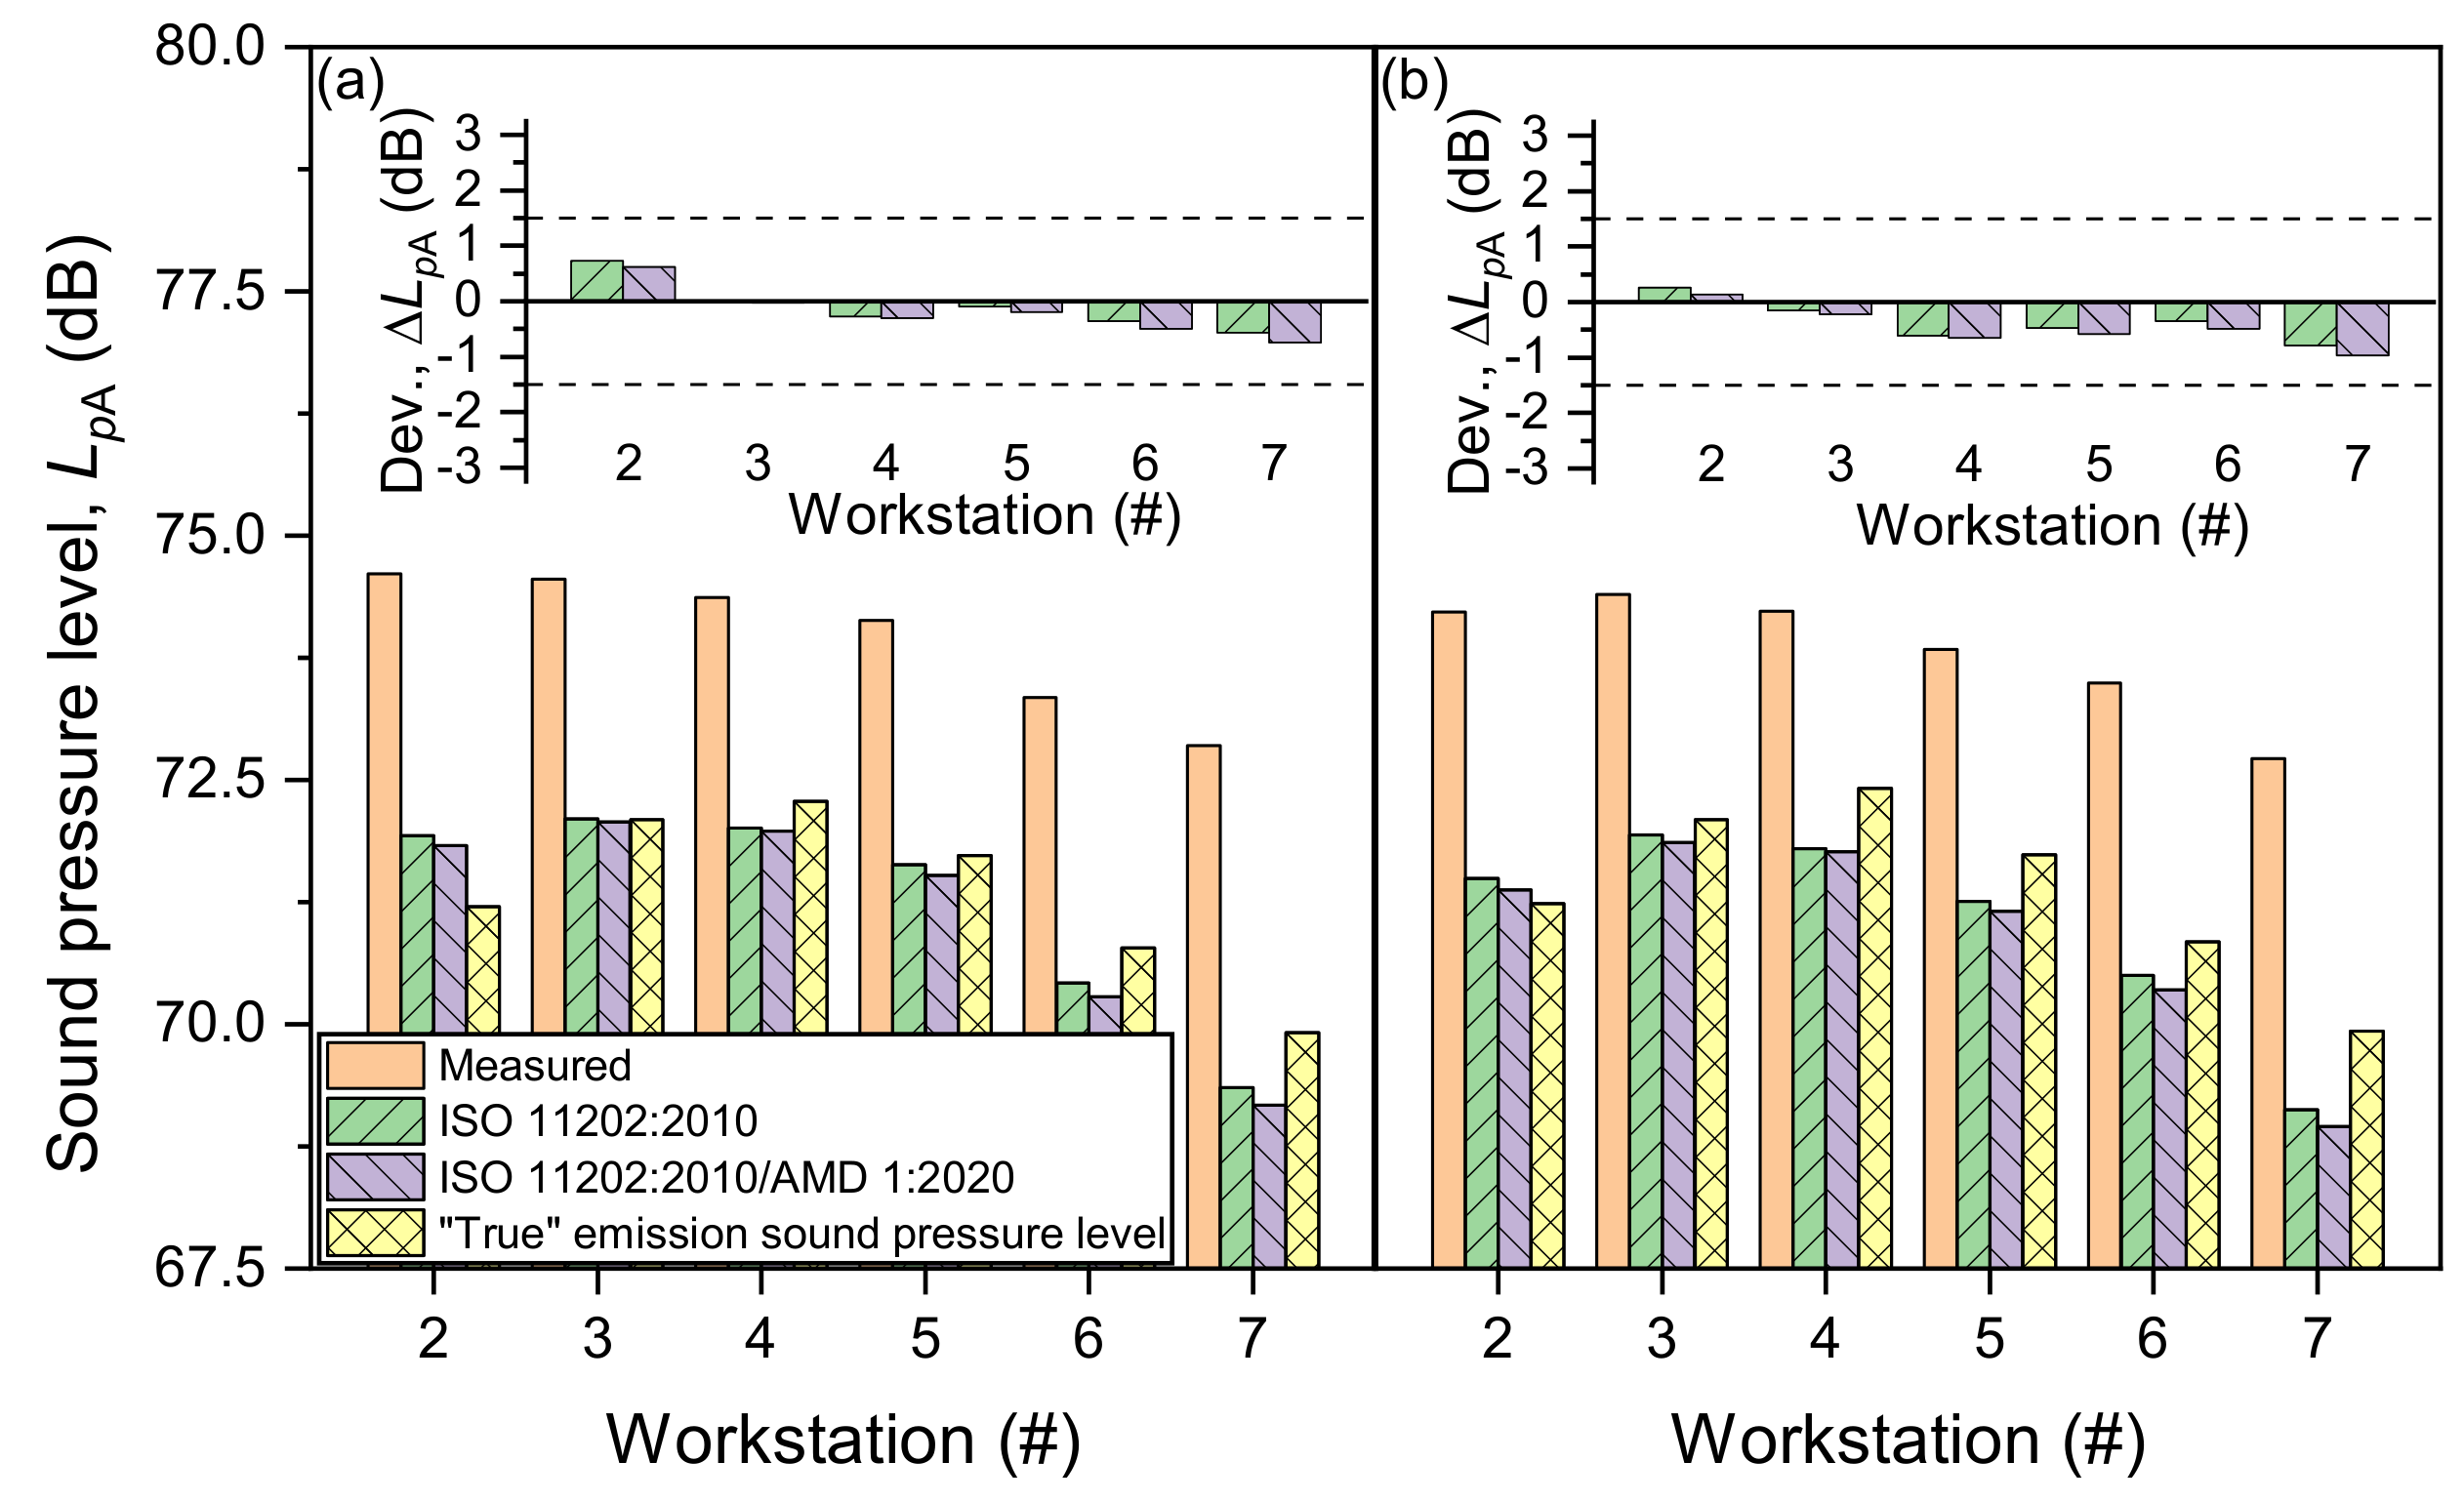
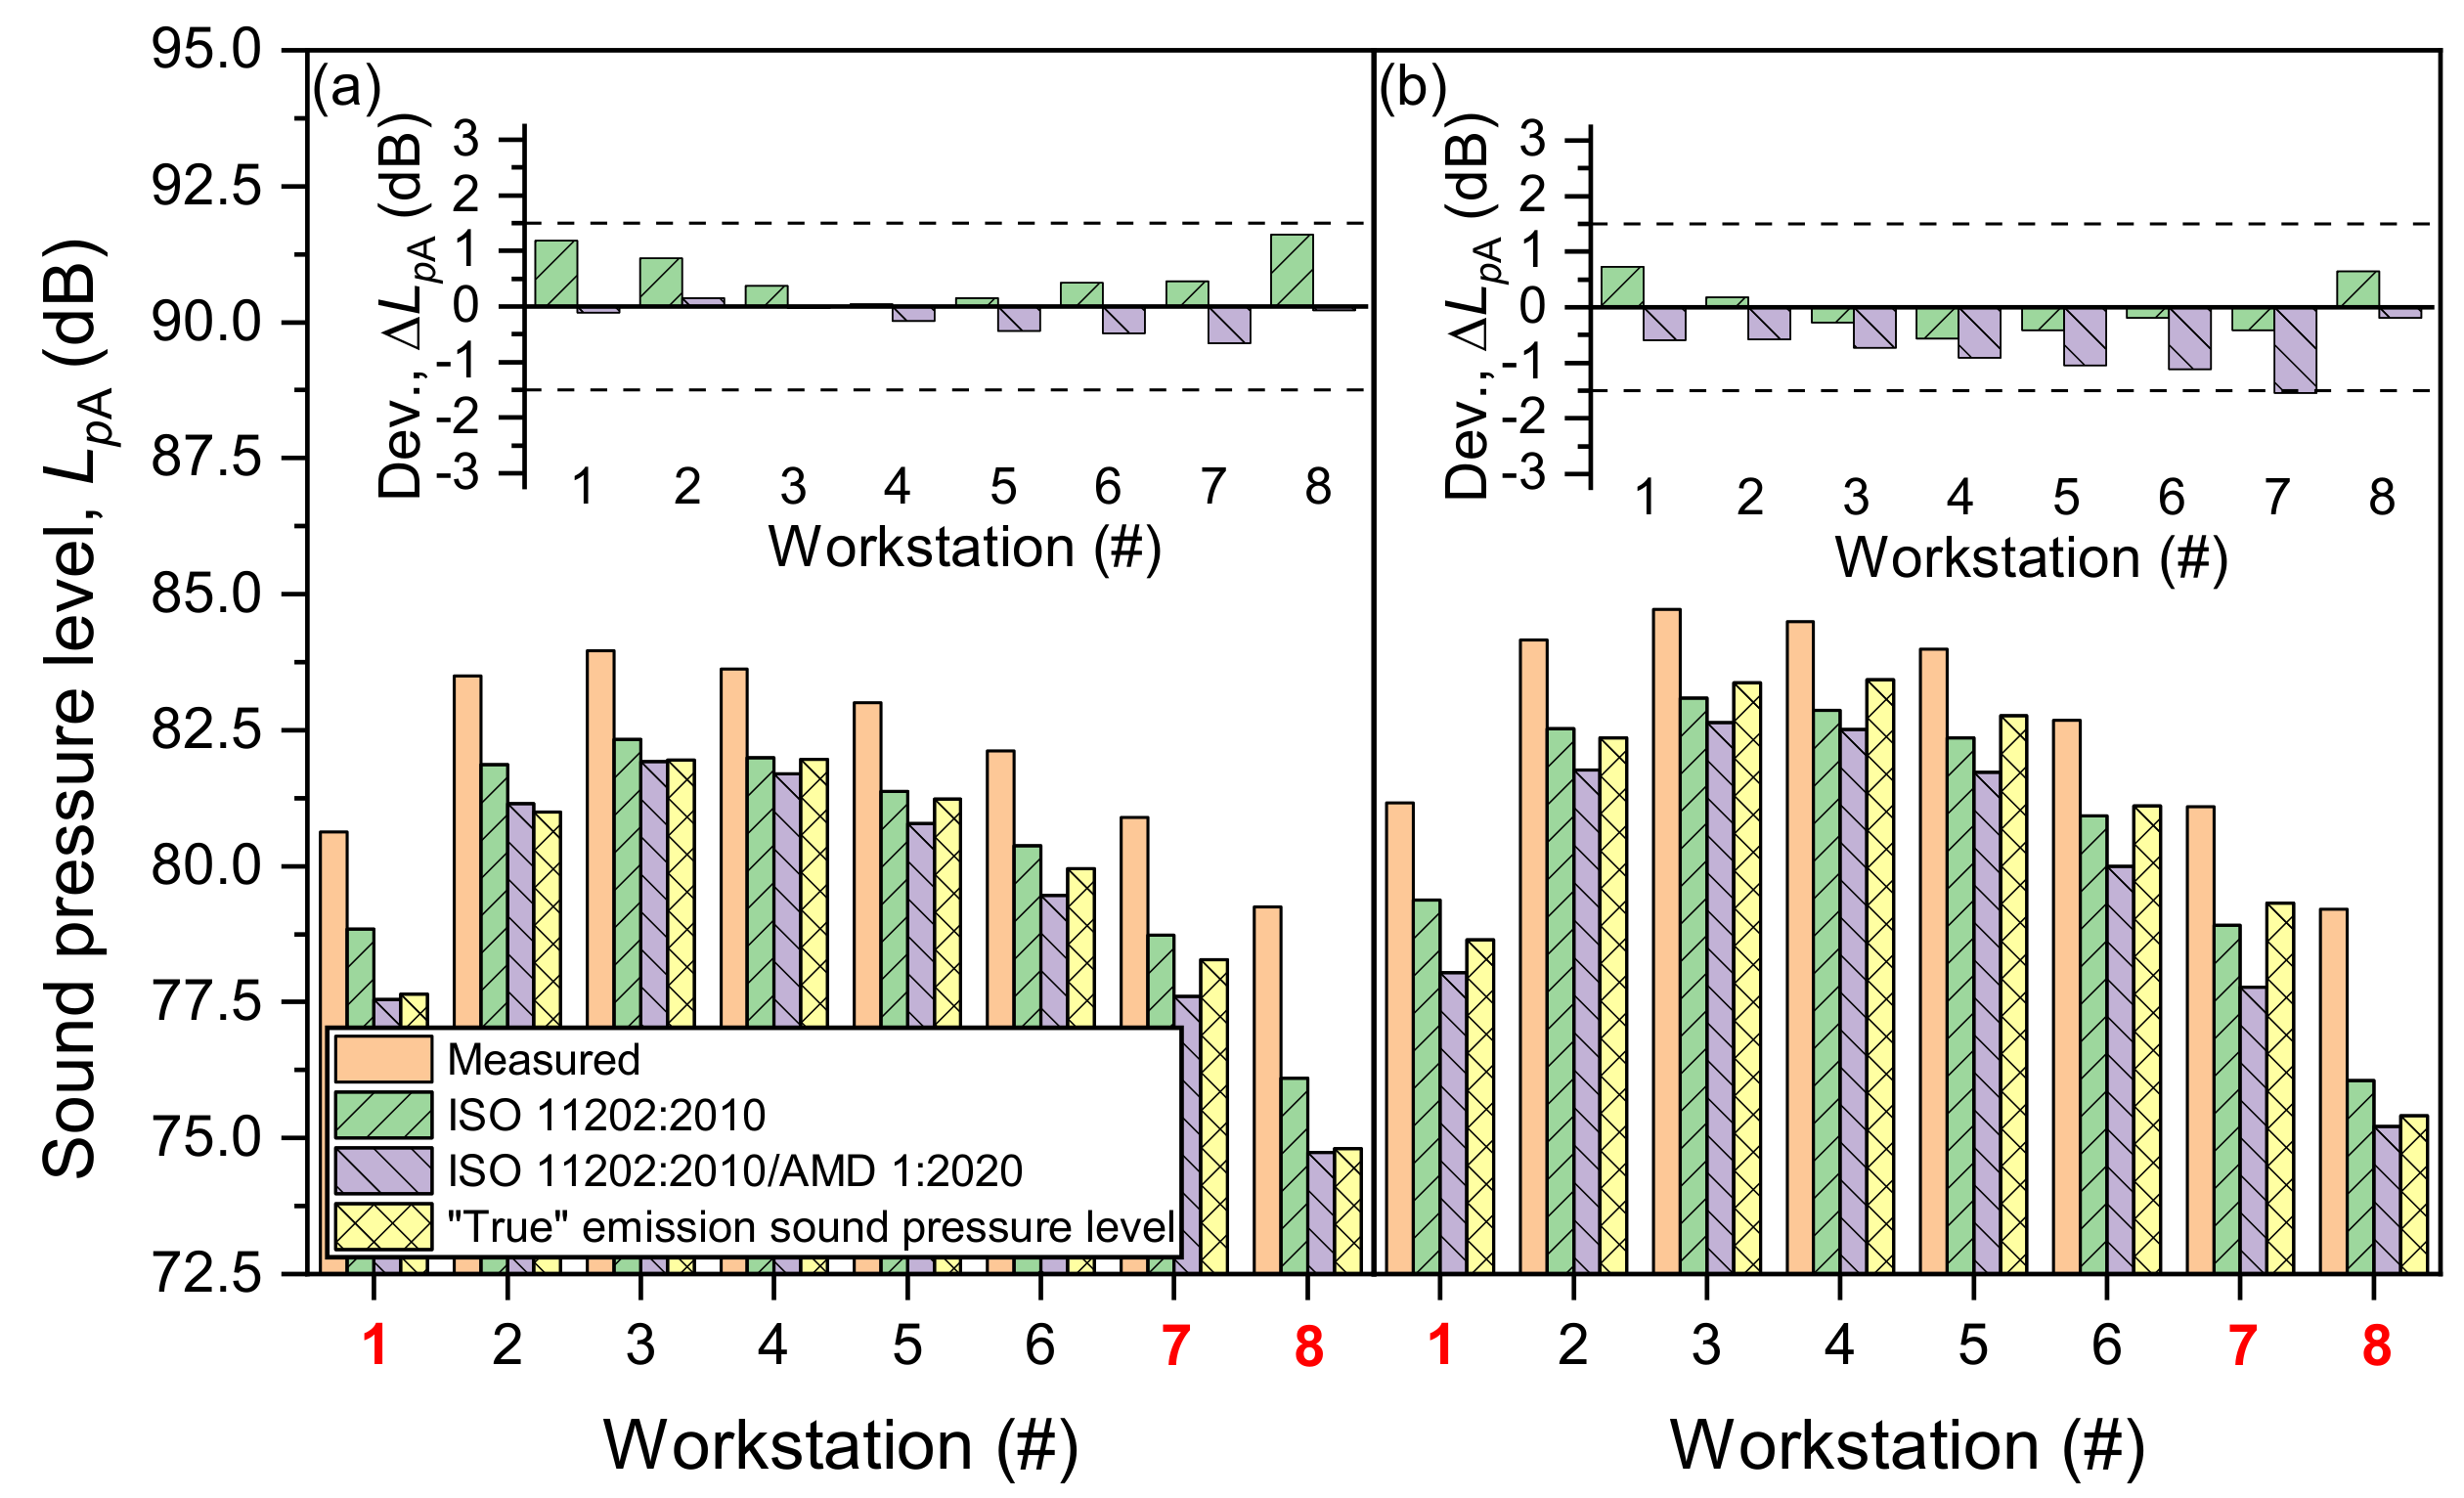
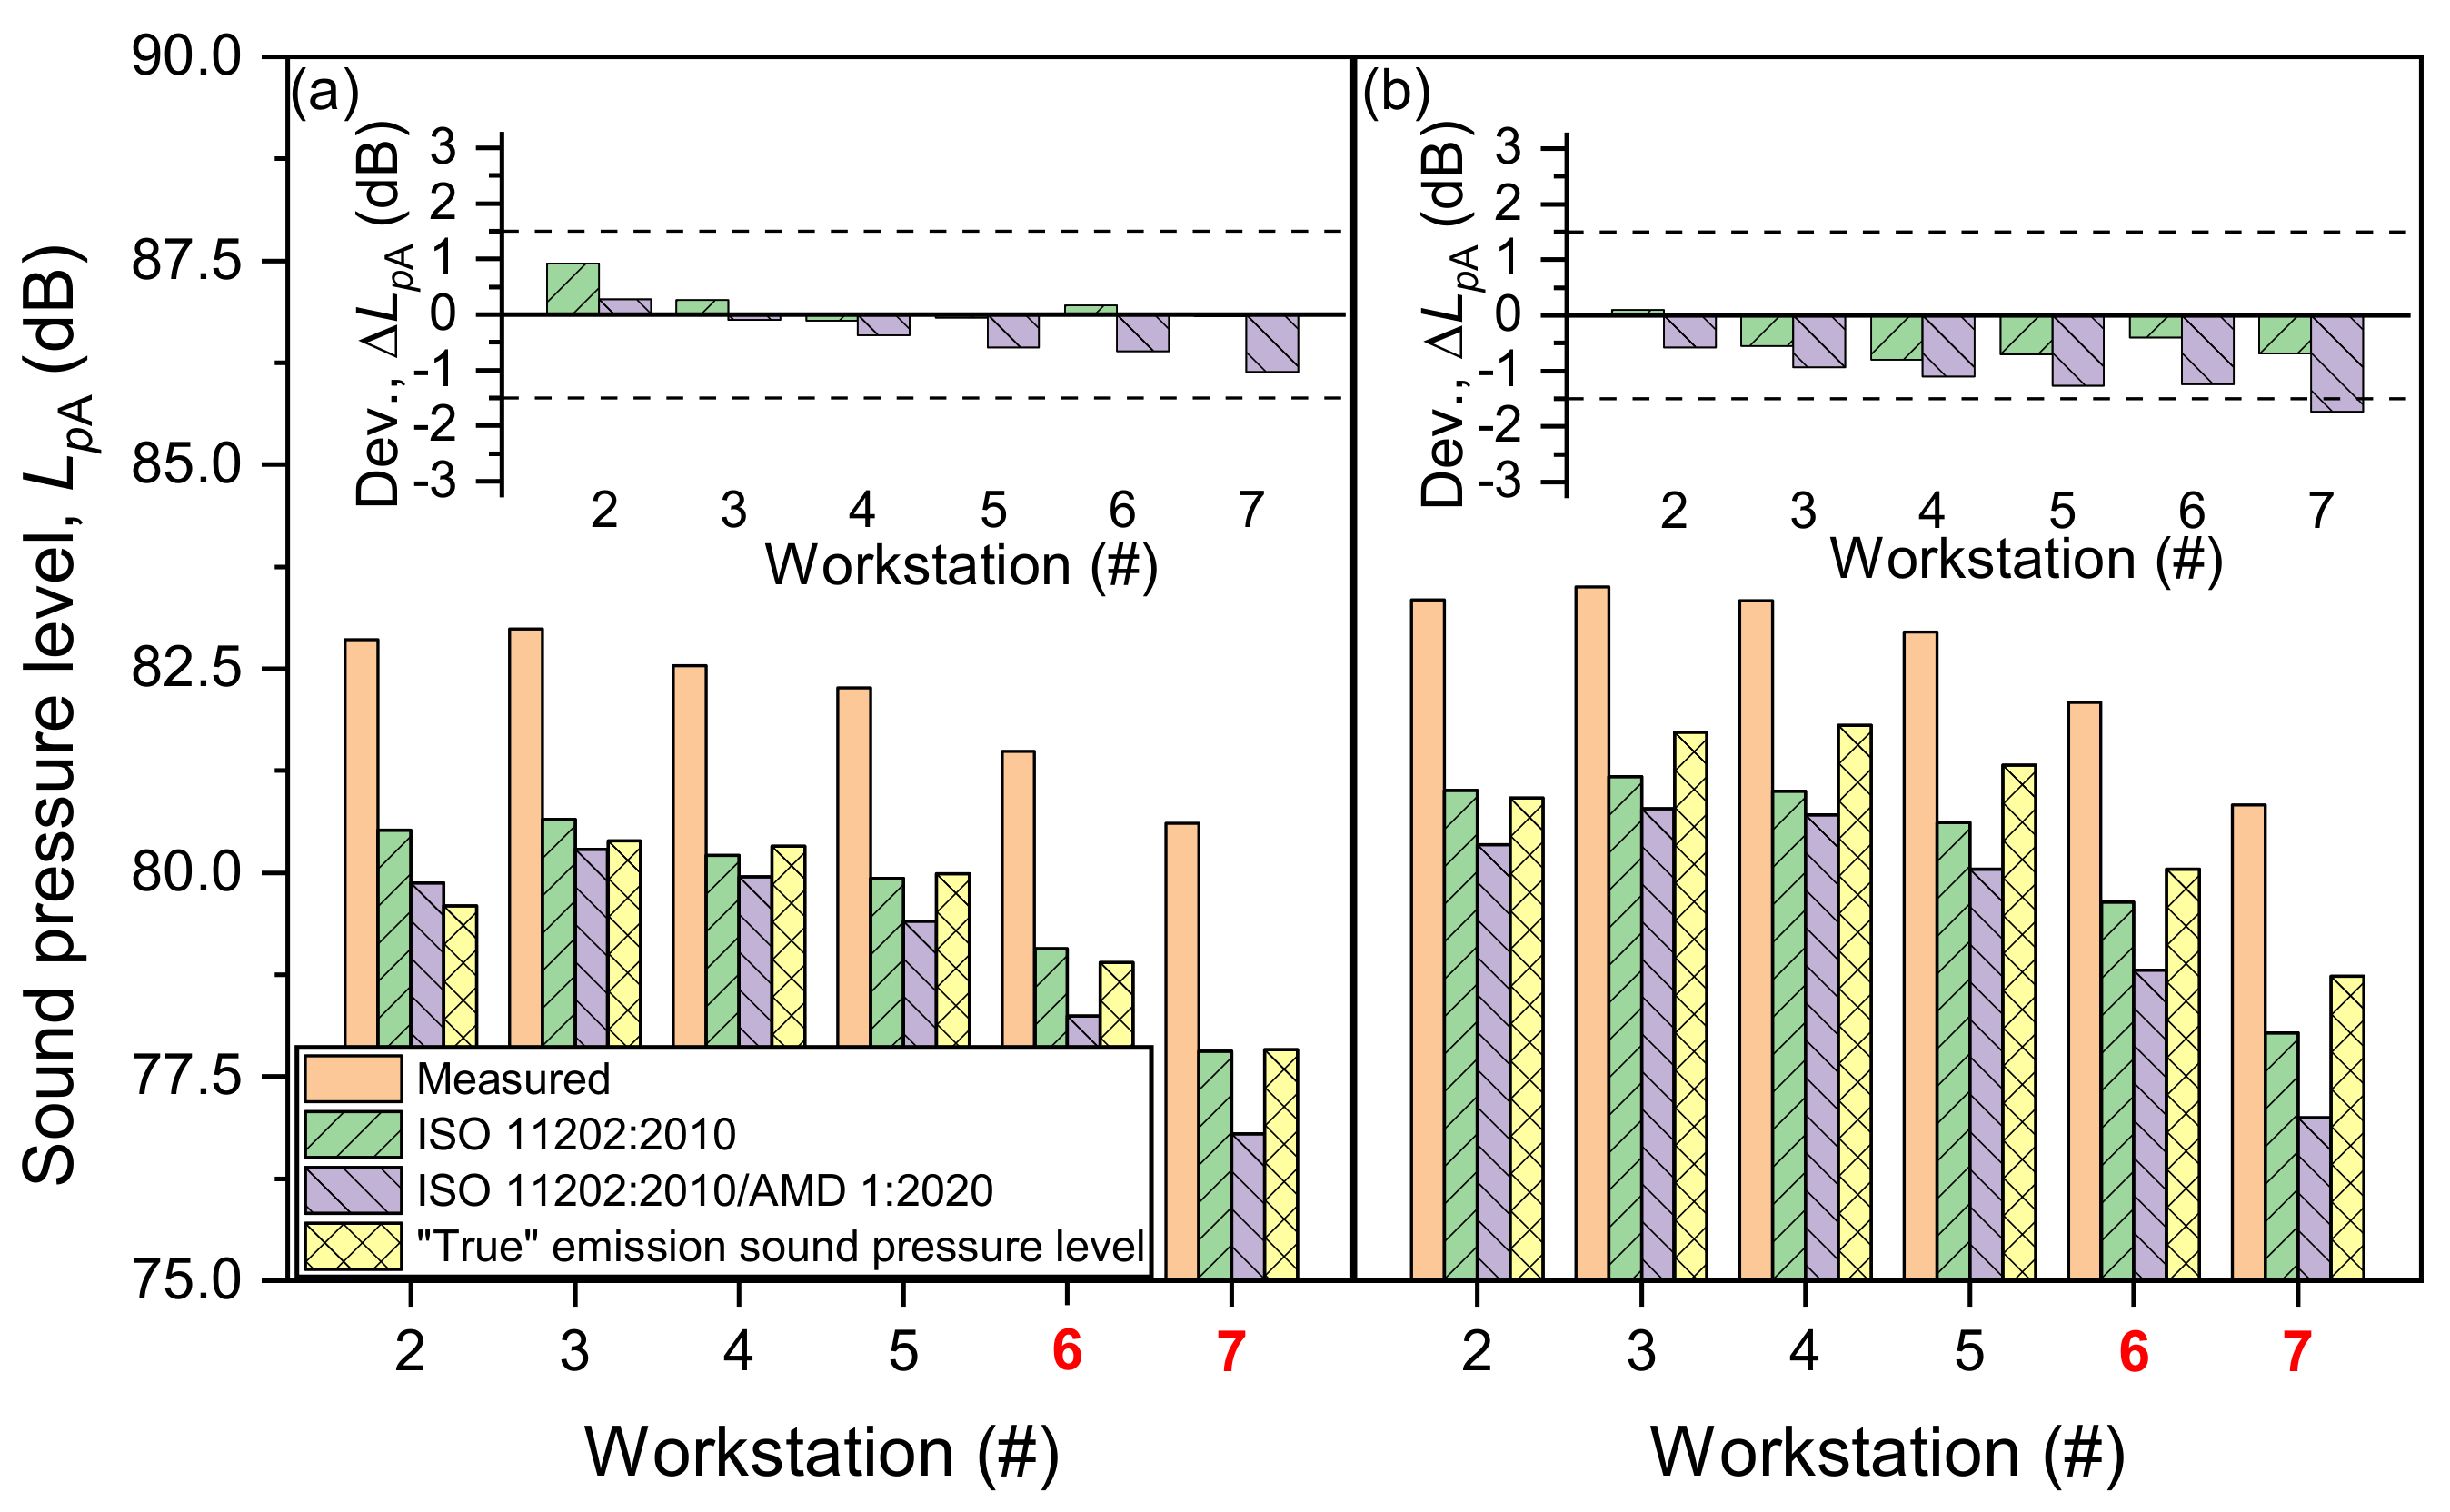
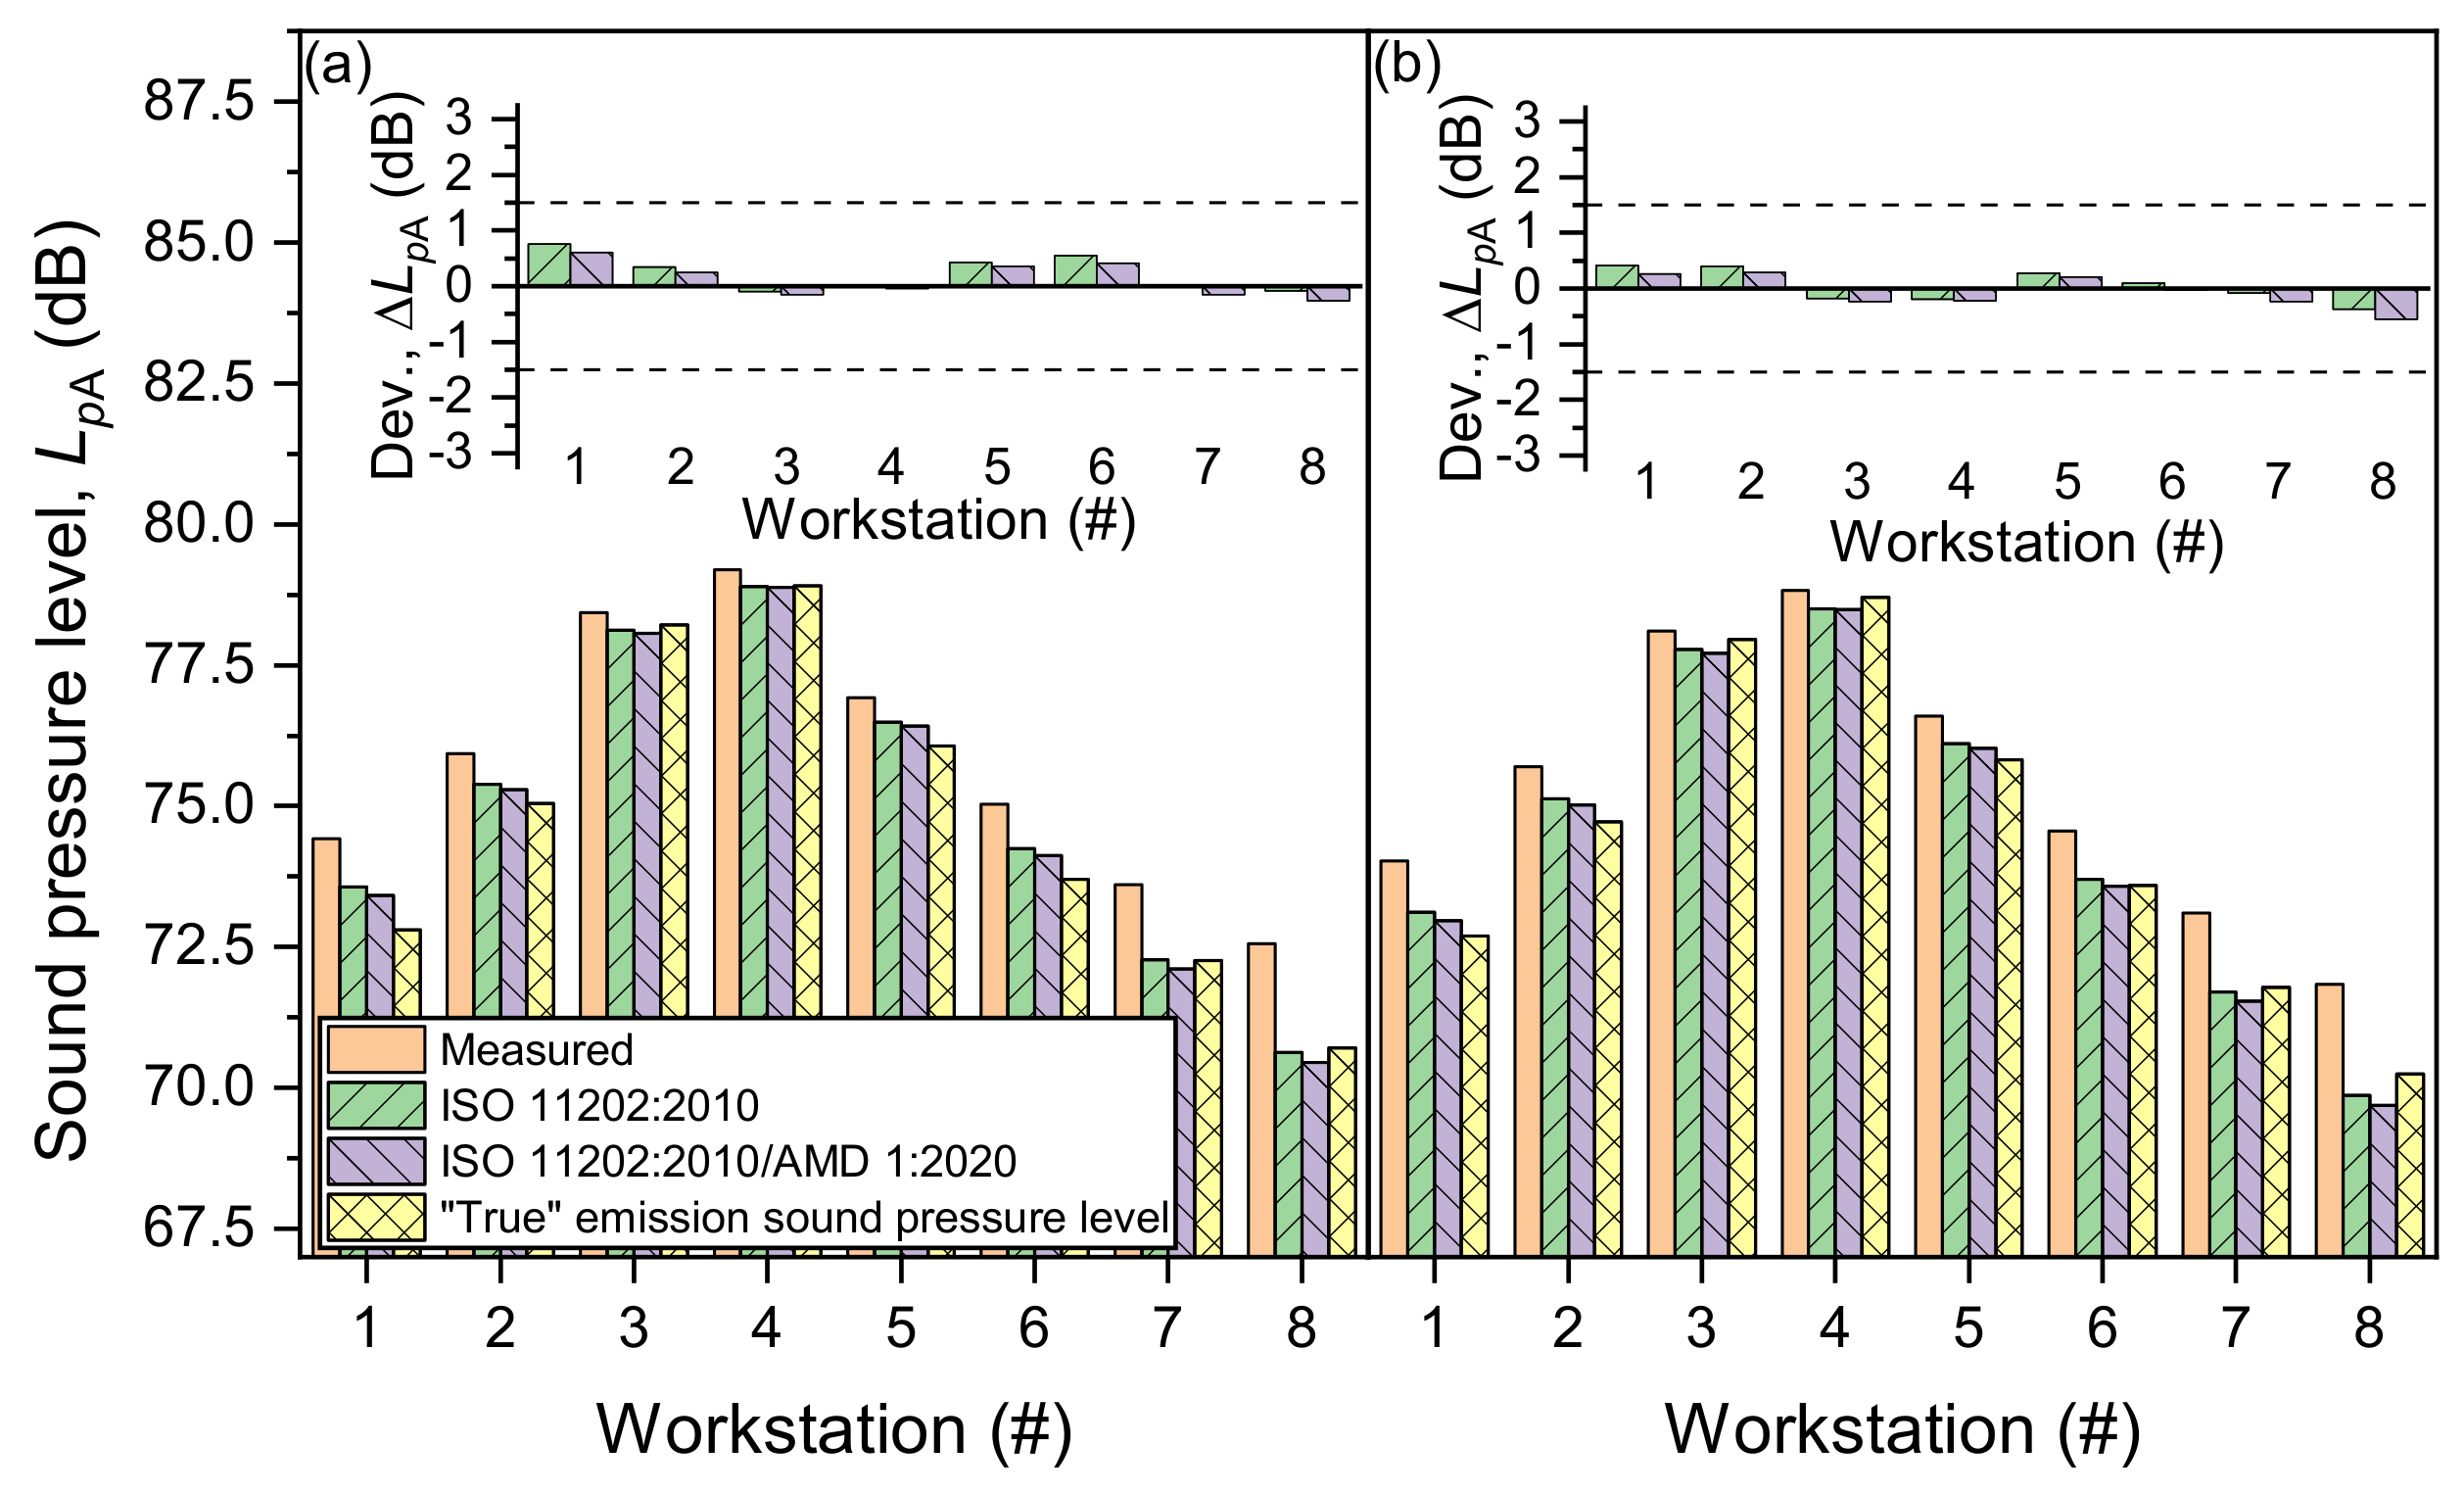
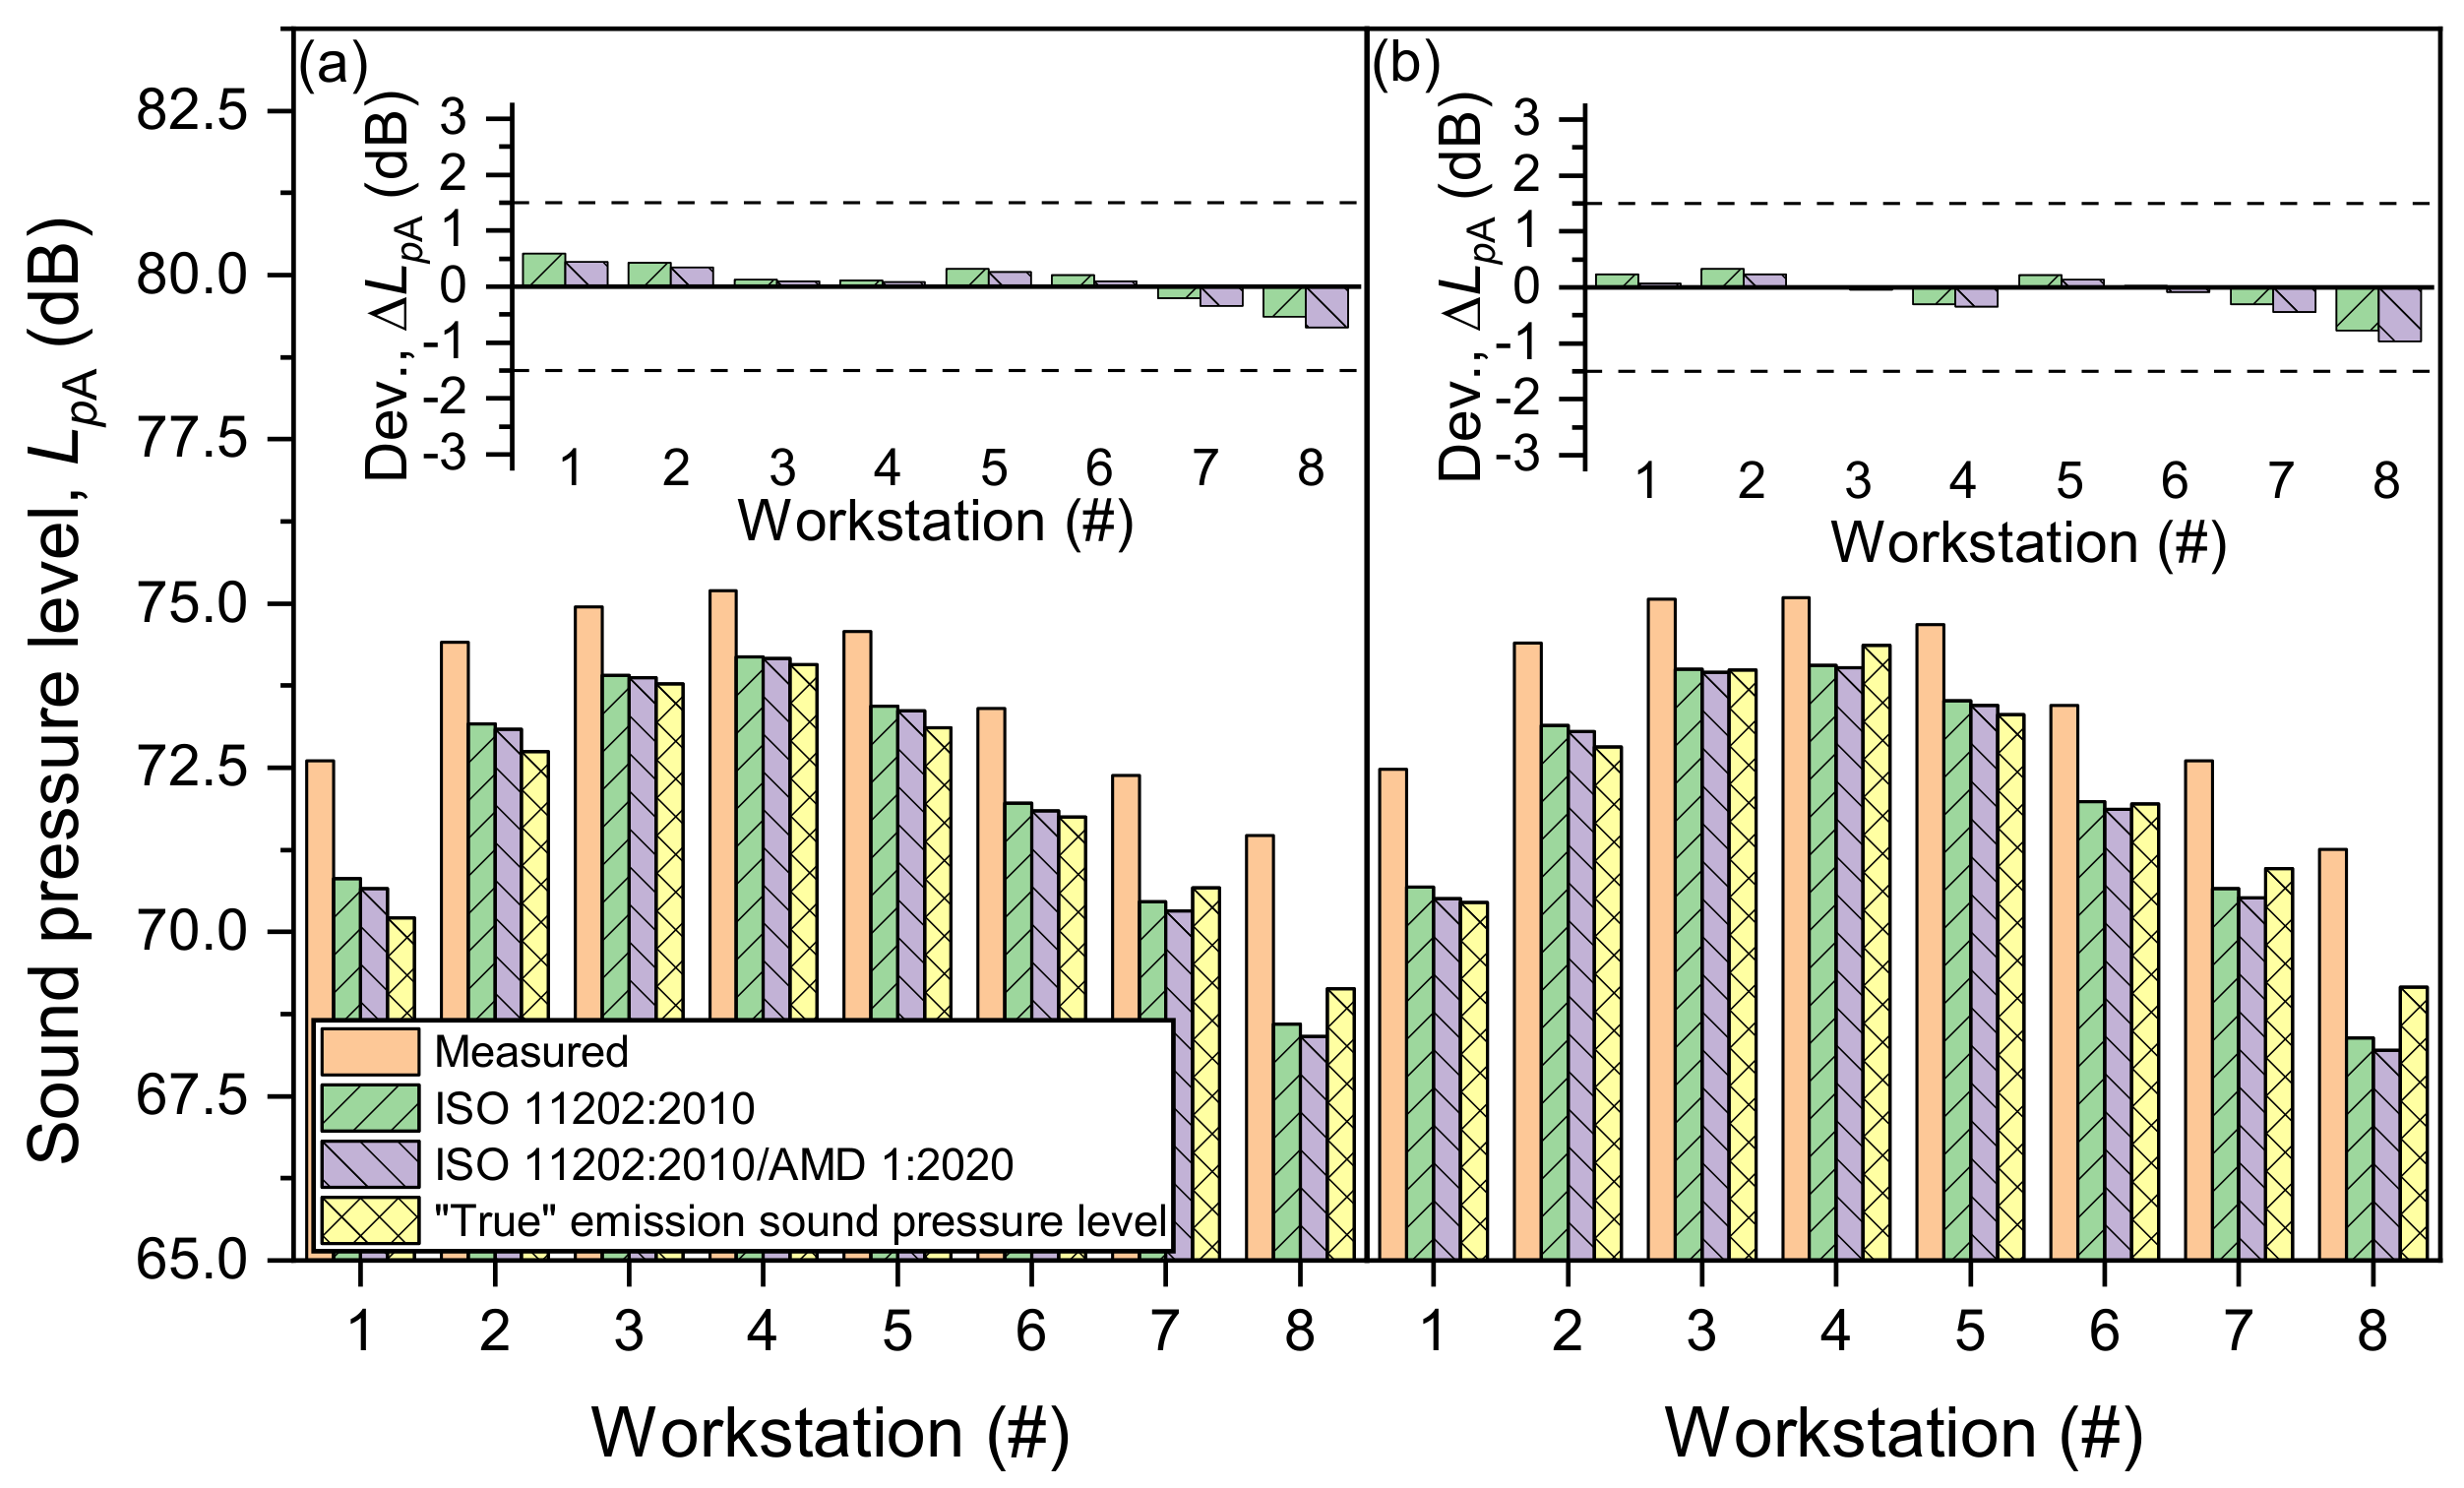
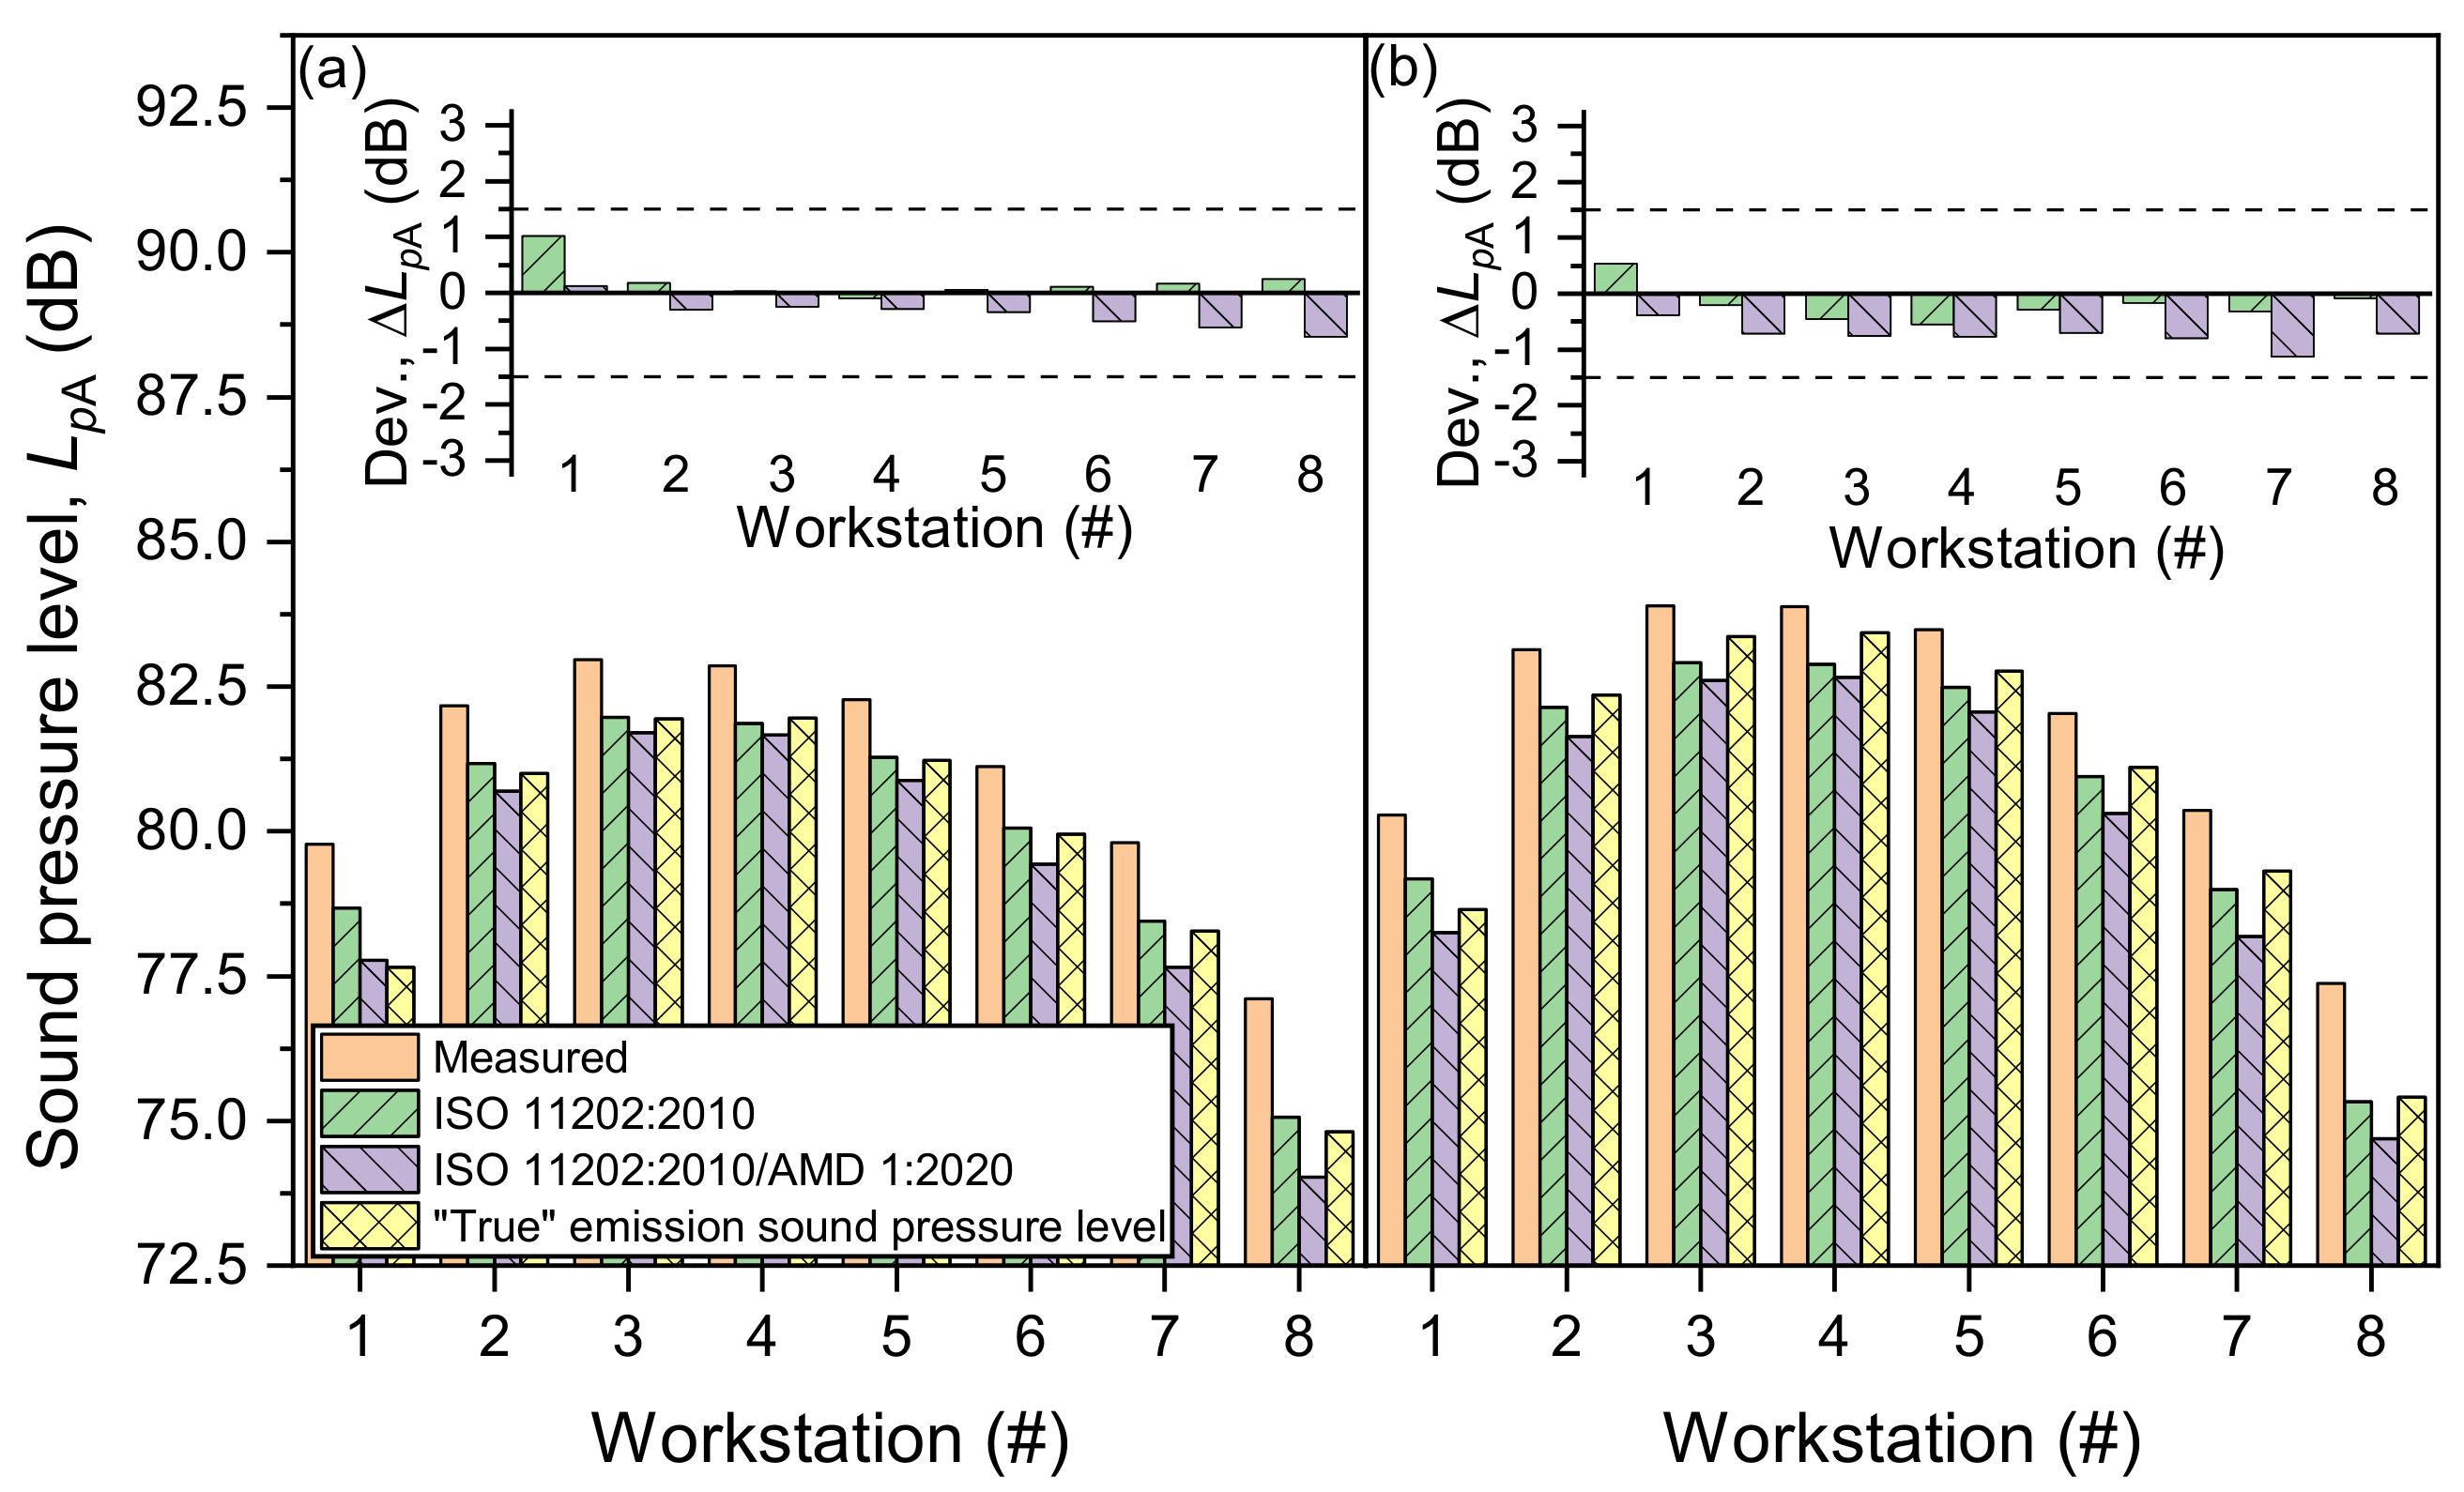
Figure 3 shows a sketch of the measurement positions in front of the dominantly sound-radiating areas of the model machine. Note that at each assigned workstation, except for positions 1 and 8, measurements were performed at three different distances, i.e., 0.5 m, 1 m and 1.25 m from the surface of the machine. All measurements were performed at two different heights of 1.26 m (sitting operator) and 1.55 m (standing operator).
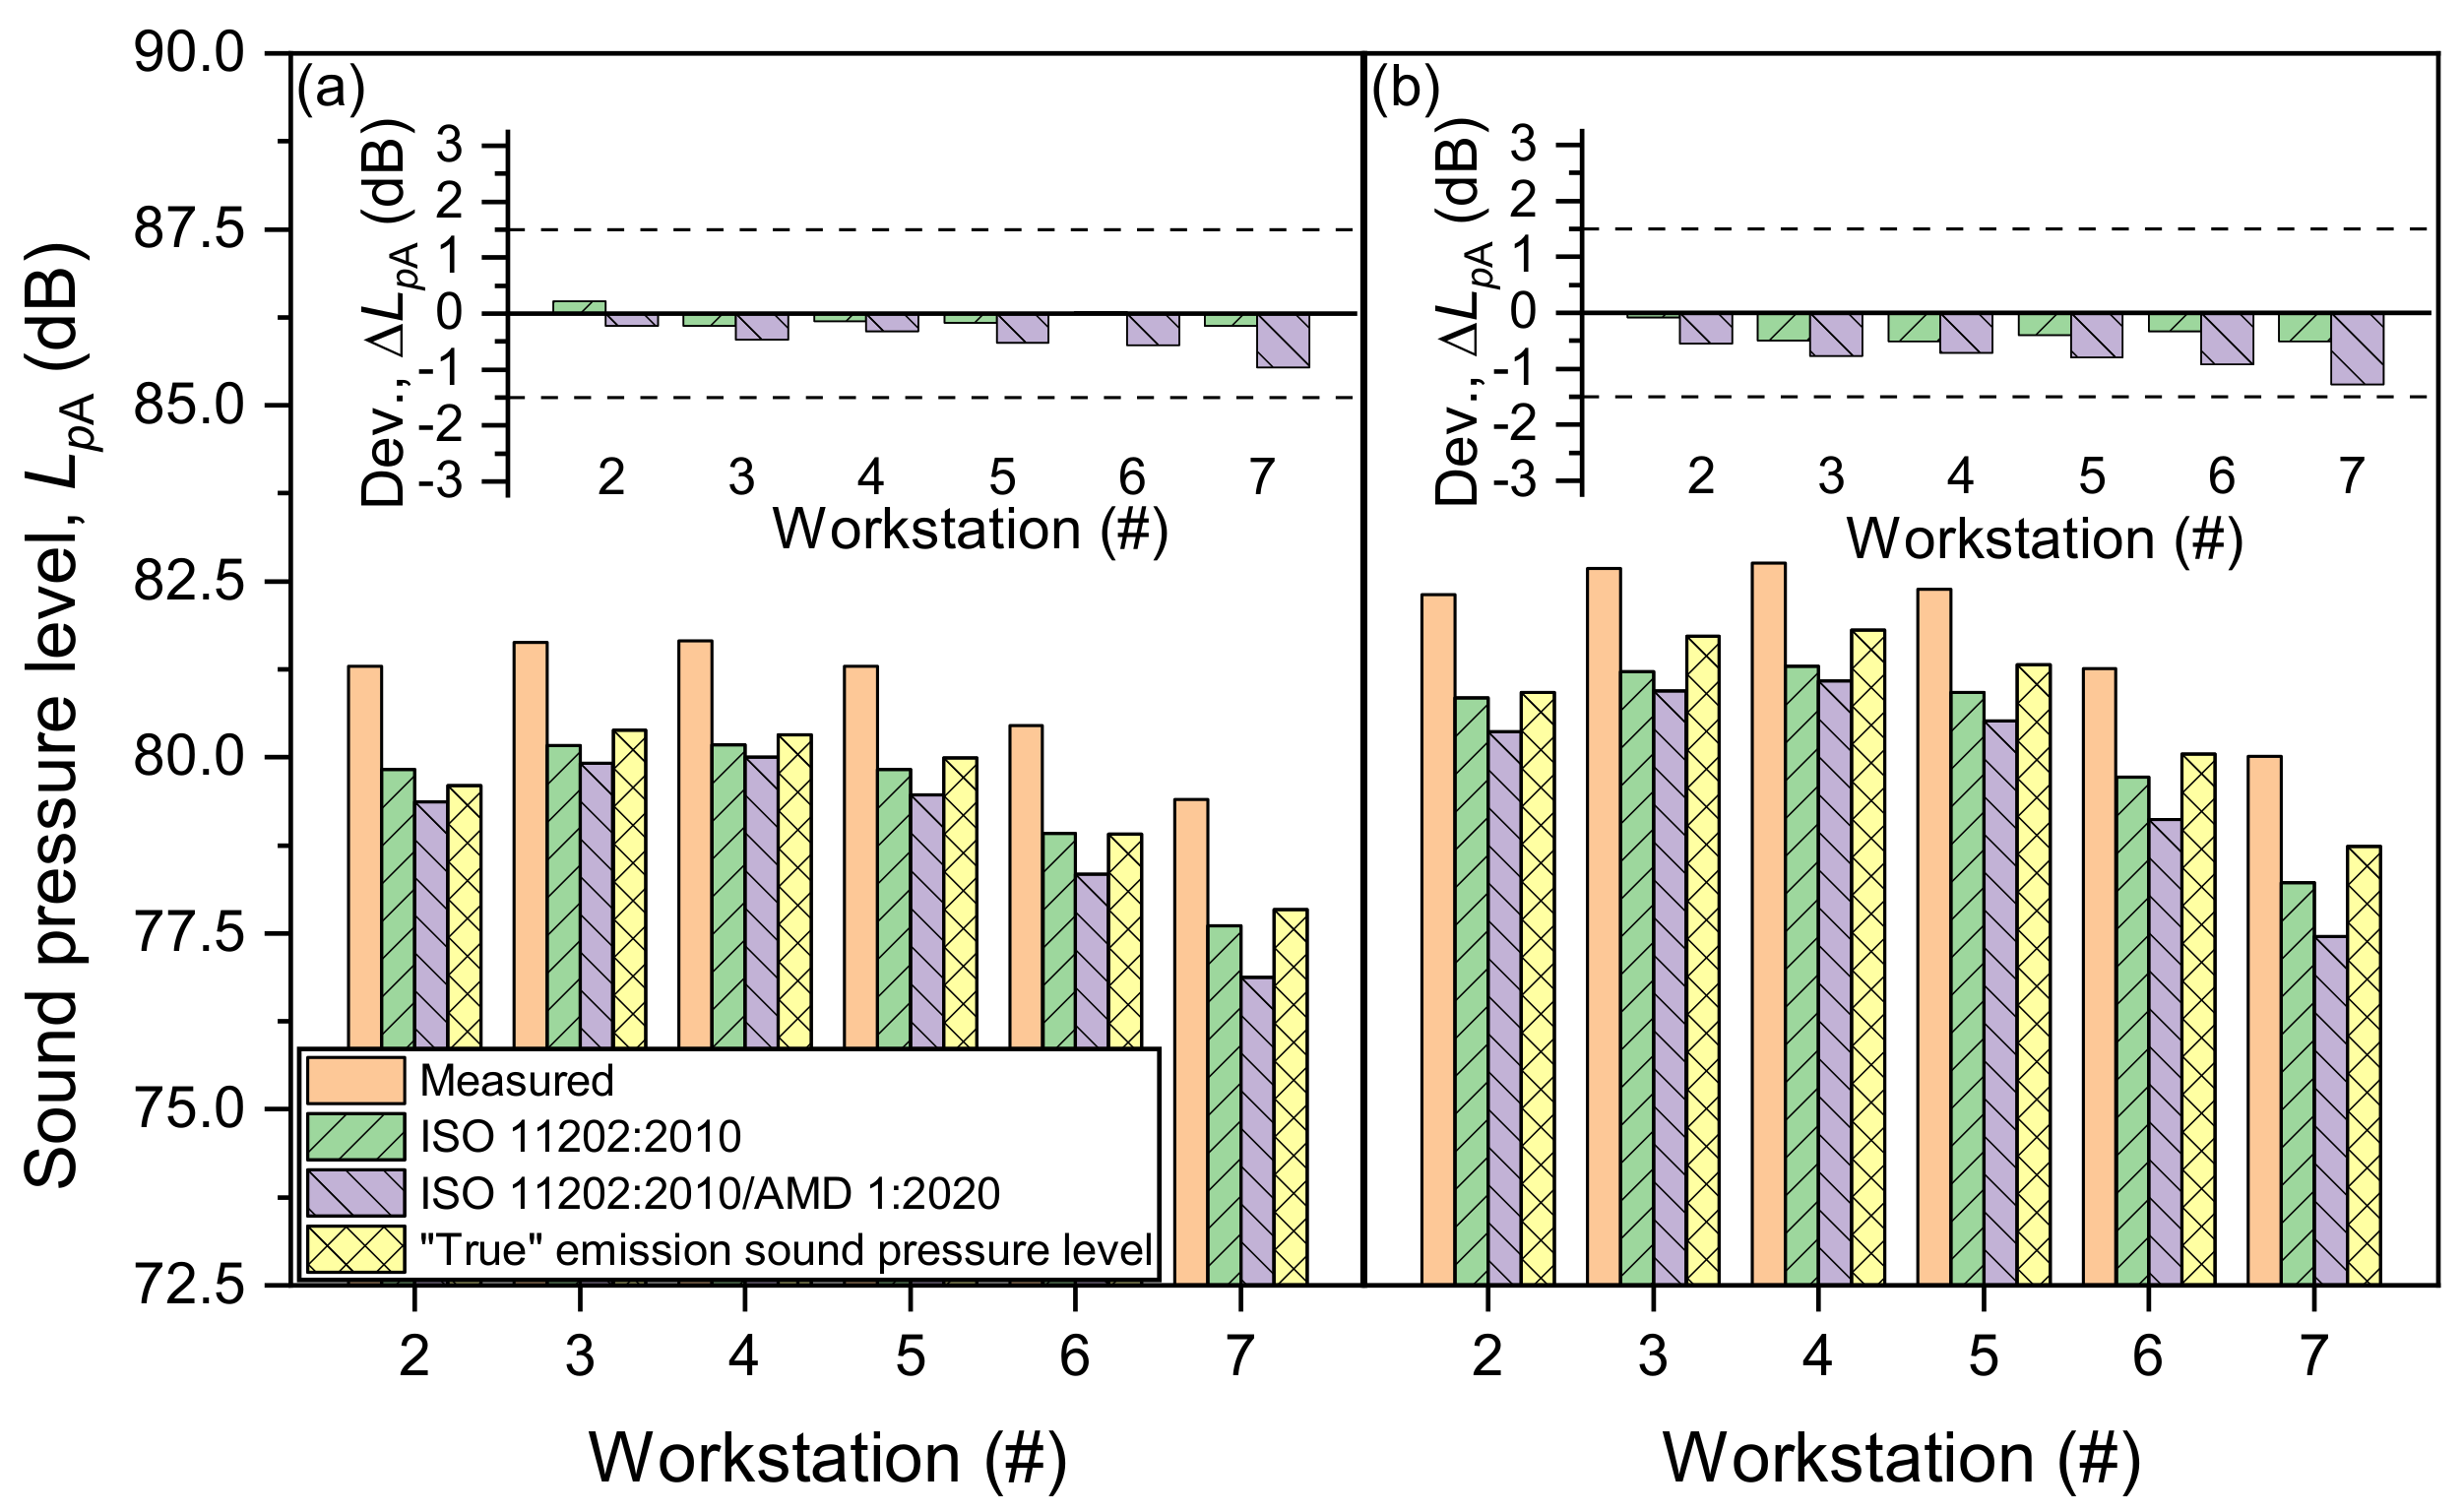
Table 1 and Table 2 show the minimum and maximum distance from the dominantly sound-radiating area to the workstations for the two different configurations, two different heights and three different distances of the measurement positions from the surface of the machine.
Using the distances from Table 1 and Table 2, the local environmental correction K 3 , A was calculated using the following equation:
K 3 , A = 10 lg 1 + 8 π d 2 A   dB .
Here, A is the equivalent absorption area of the room and d is the typical distance between the dominantly sound-radiating area of the machine and the workstation. However, the way the typical distance d is defined/determined differs between ISO 11202:2010 [2] and ISO 11202:2010/Amd 1:2020 [17]. In the former, it is the typical distance from the work station to the closest major sound source of the machine under test or, in the case of extended sound-radiating areas, the shortest possible line of sight between the dominantly sound-radiating area and the work station, while in the latter, it is defined as the arithmetic mean between two distances:
d = d 2 + d 1 2 .
Here,
  • d 1 is the shortest distance from the sound-radiating surface of the machine under test to the work station;
  • d 2 is the longest distance from the sound-radiating surface of the machine under test to the work station.
Furthermore, the minimum of this distance d was reduced from 1 m to 0.5 m by the amendment. Thus, it is now allowed to use the method closer to the machine. However, one restriction regarding the typical distance remained unchanged. The dimension of the major sound source, i.e., the dominantly sound-radiating area on the machine surface or the typical dimension of a small machine, has to be smaller than its distance to the workstation. Here, the new definition of d as the arithmetic mean between the shortest and longest distance makes this restriction less strict.
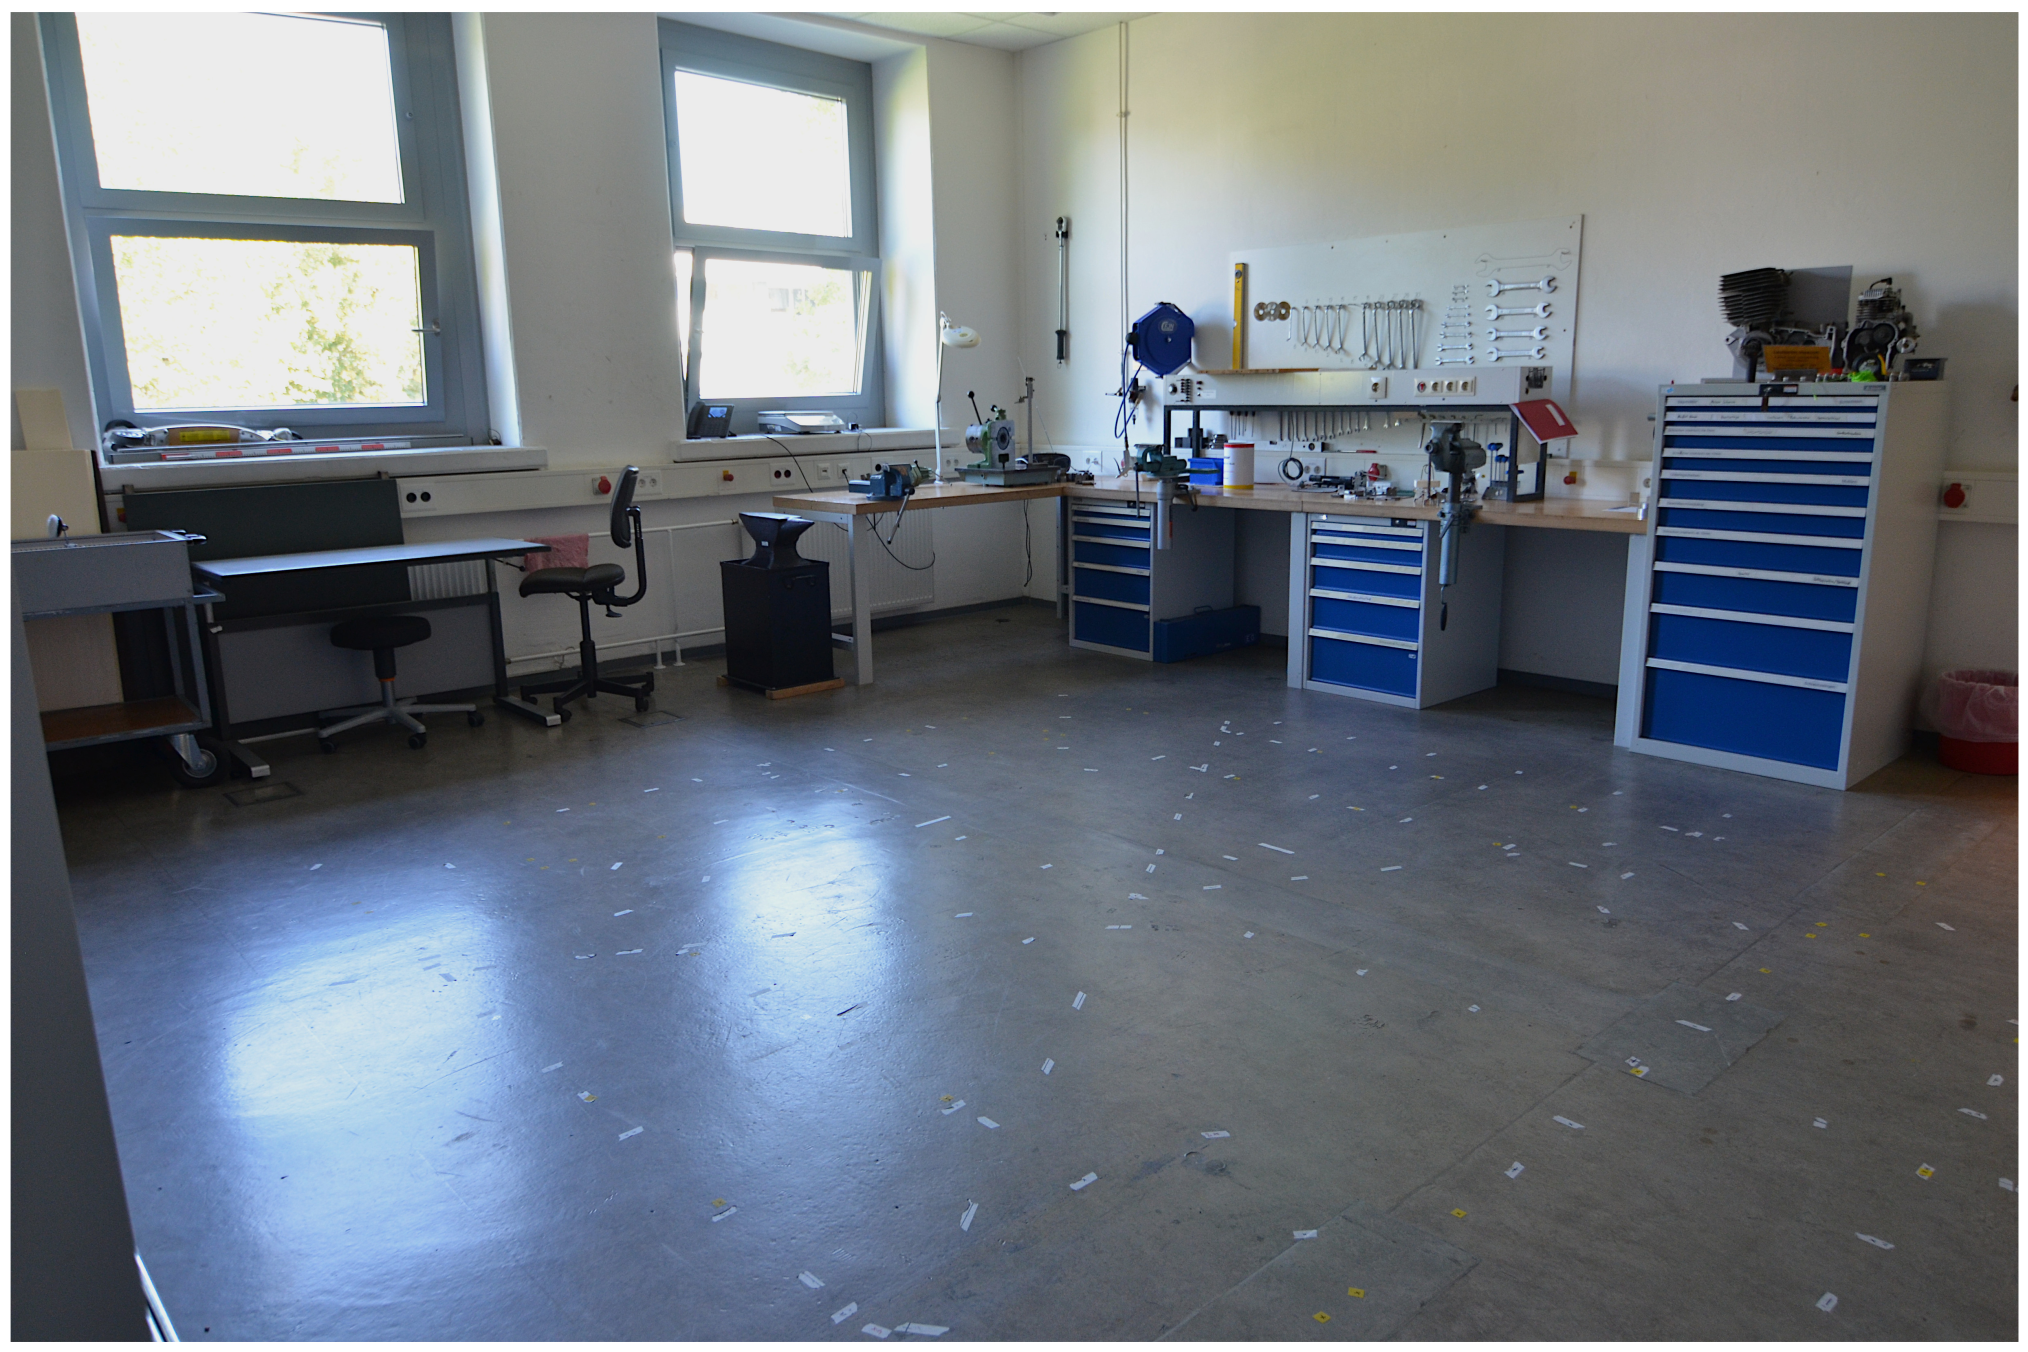
Figure 4 and 
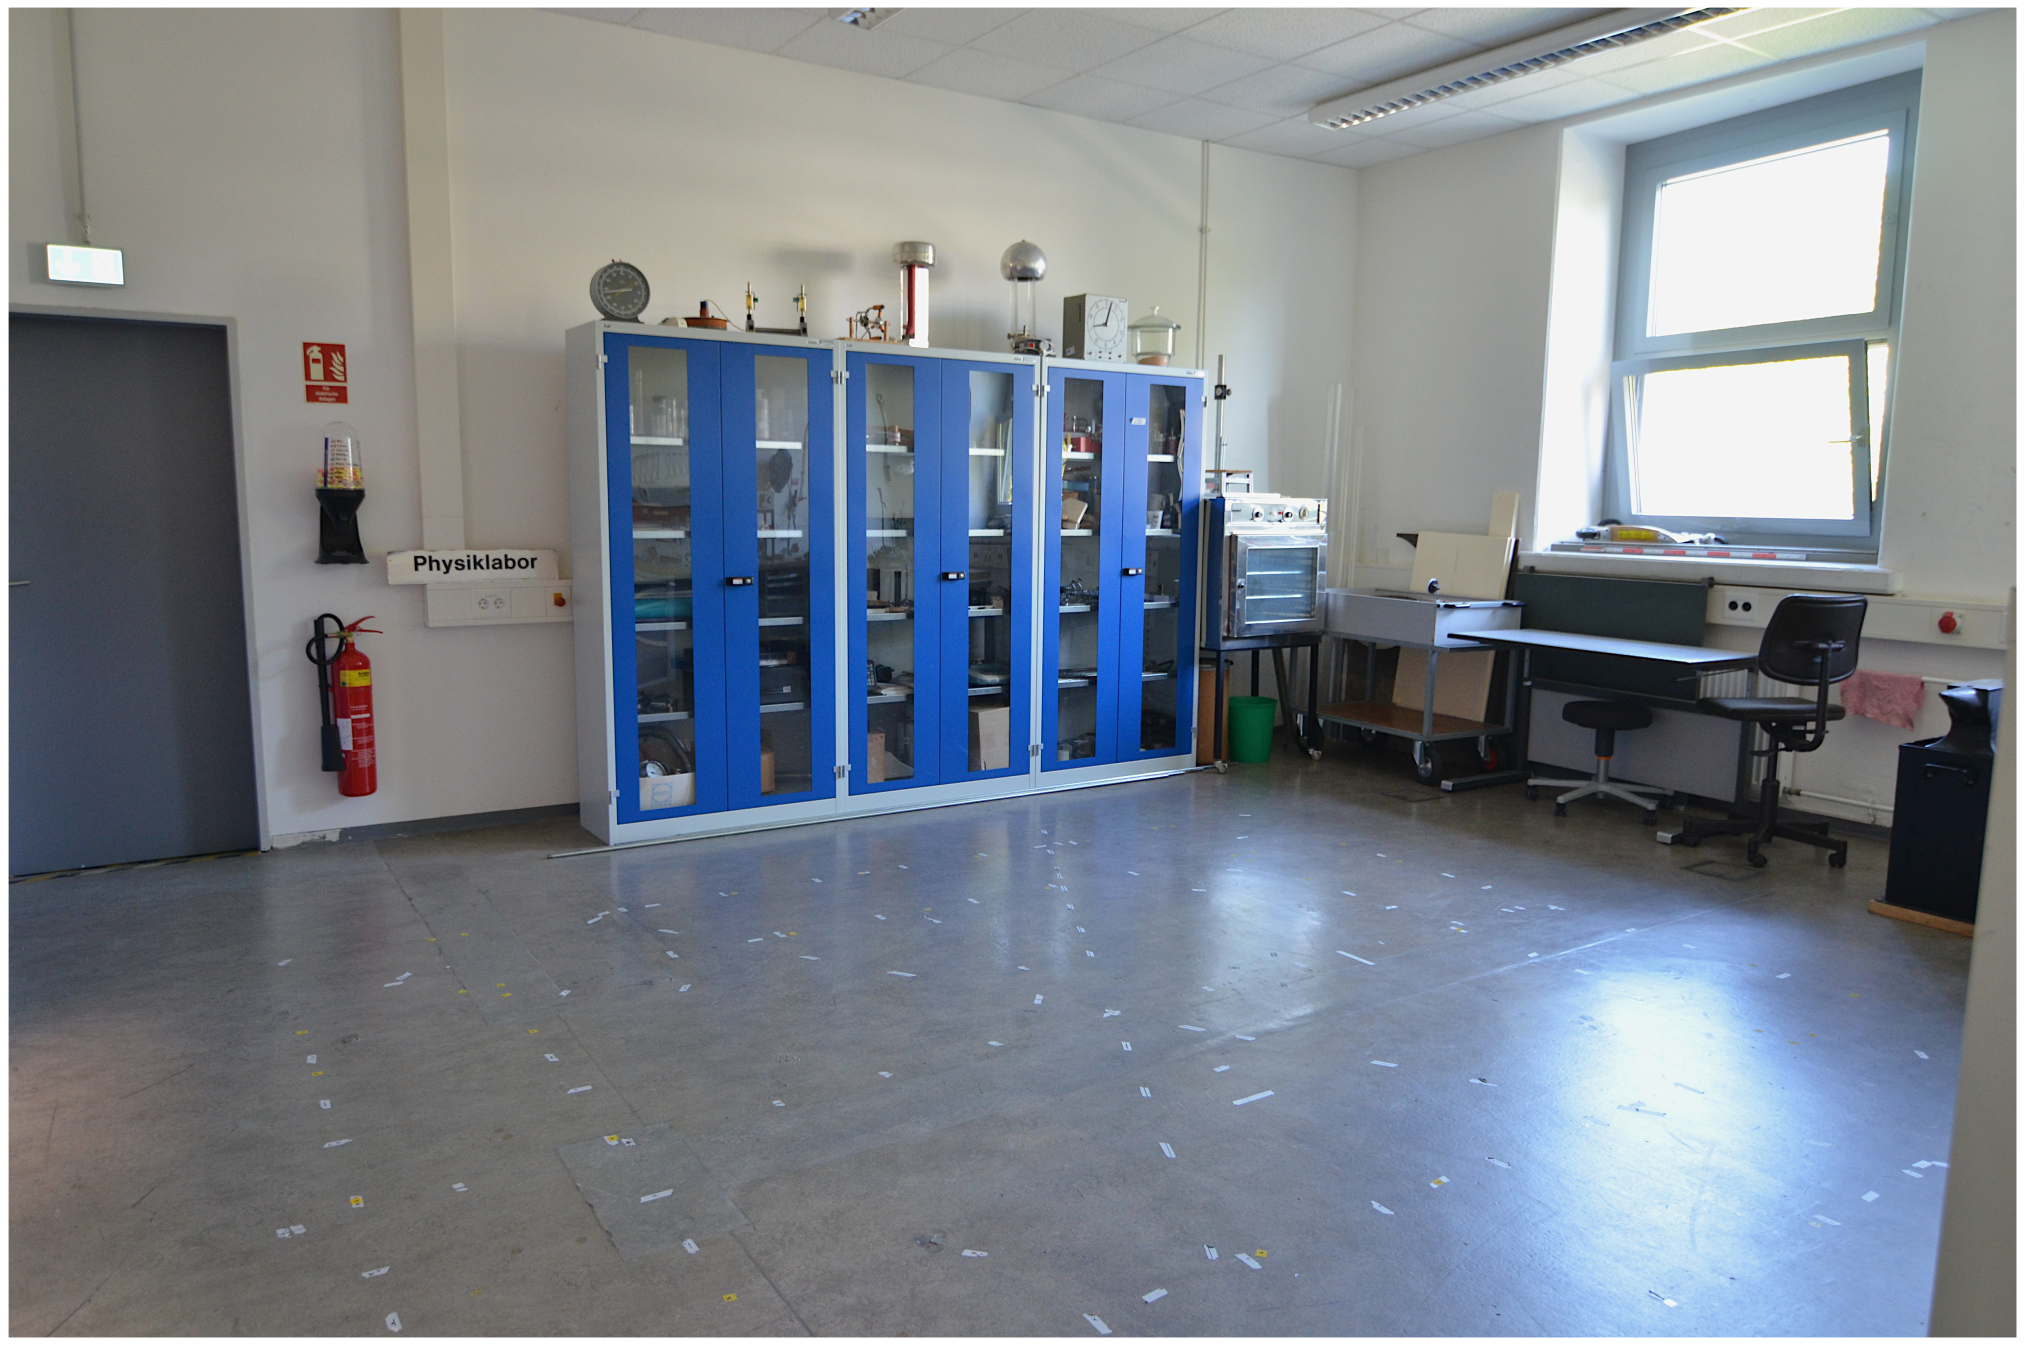
Figure 5 show photos of the workroom, which was one of the environments that were used to test the effects of the changes to the method by the amendment. Note that all the windows and doors were closed. The room had a length of 7.20 m, a width of 6.10 m and a height of 3.25 m. It had an acoustic ceiling to reduce its reverberation time.
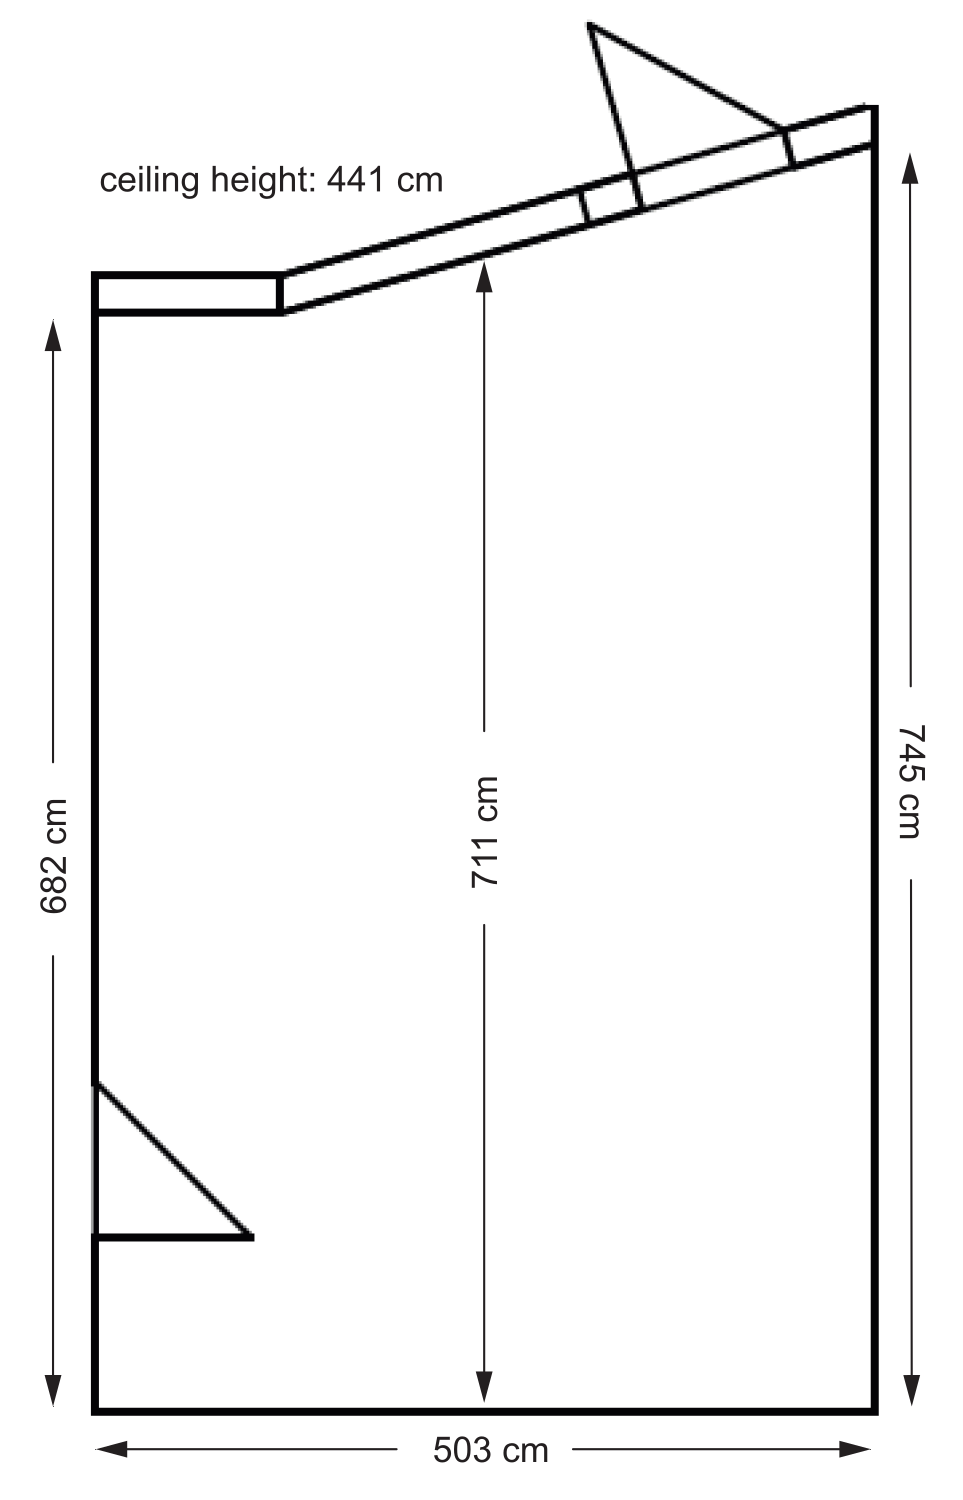
Figure 6 and 
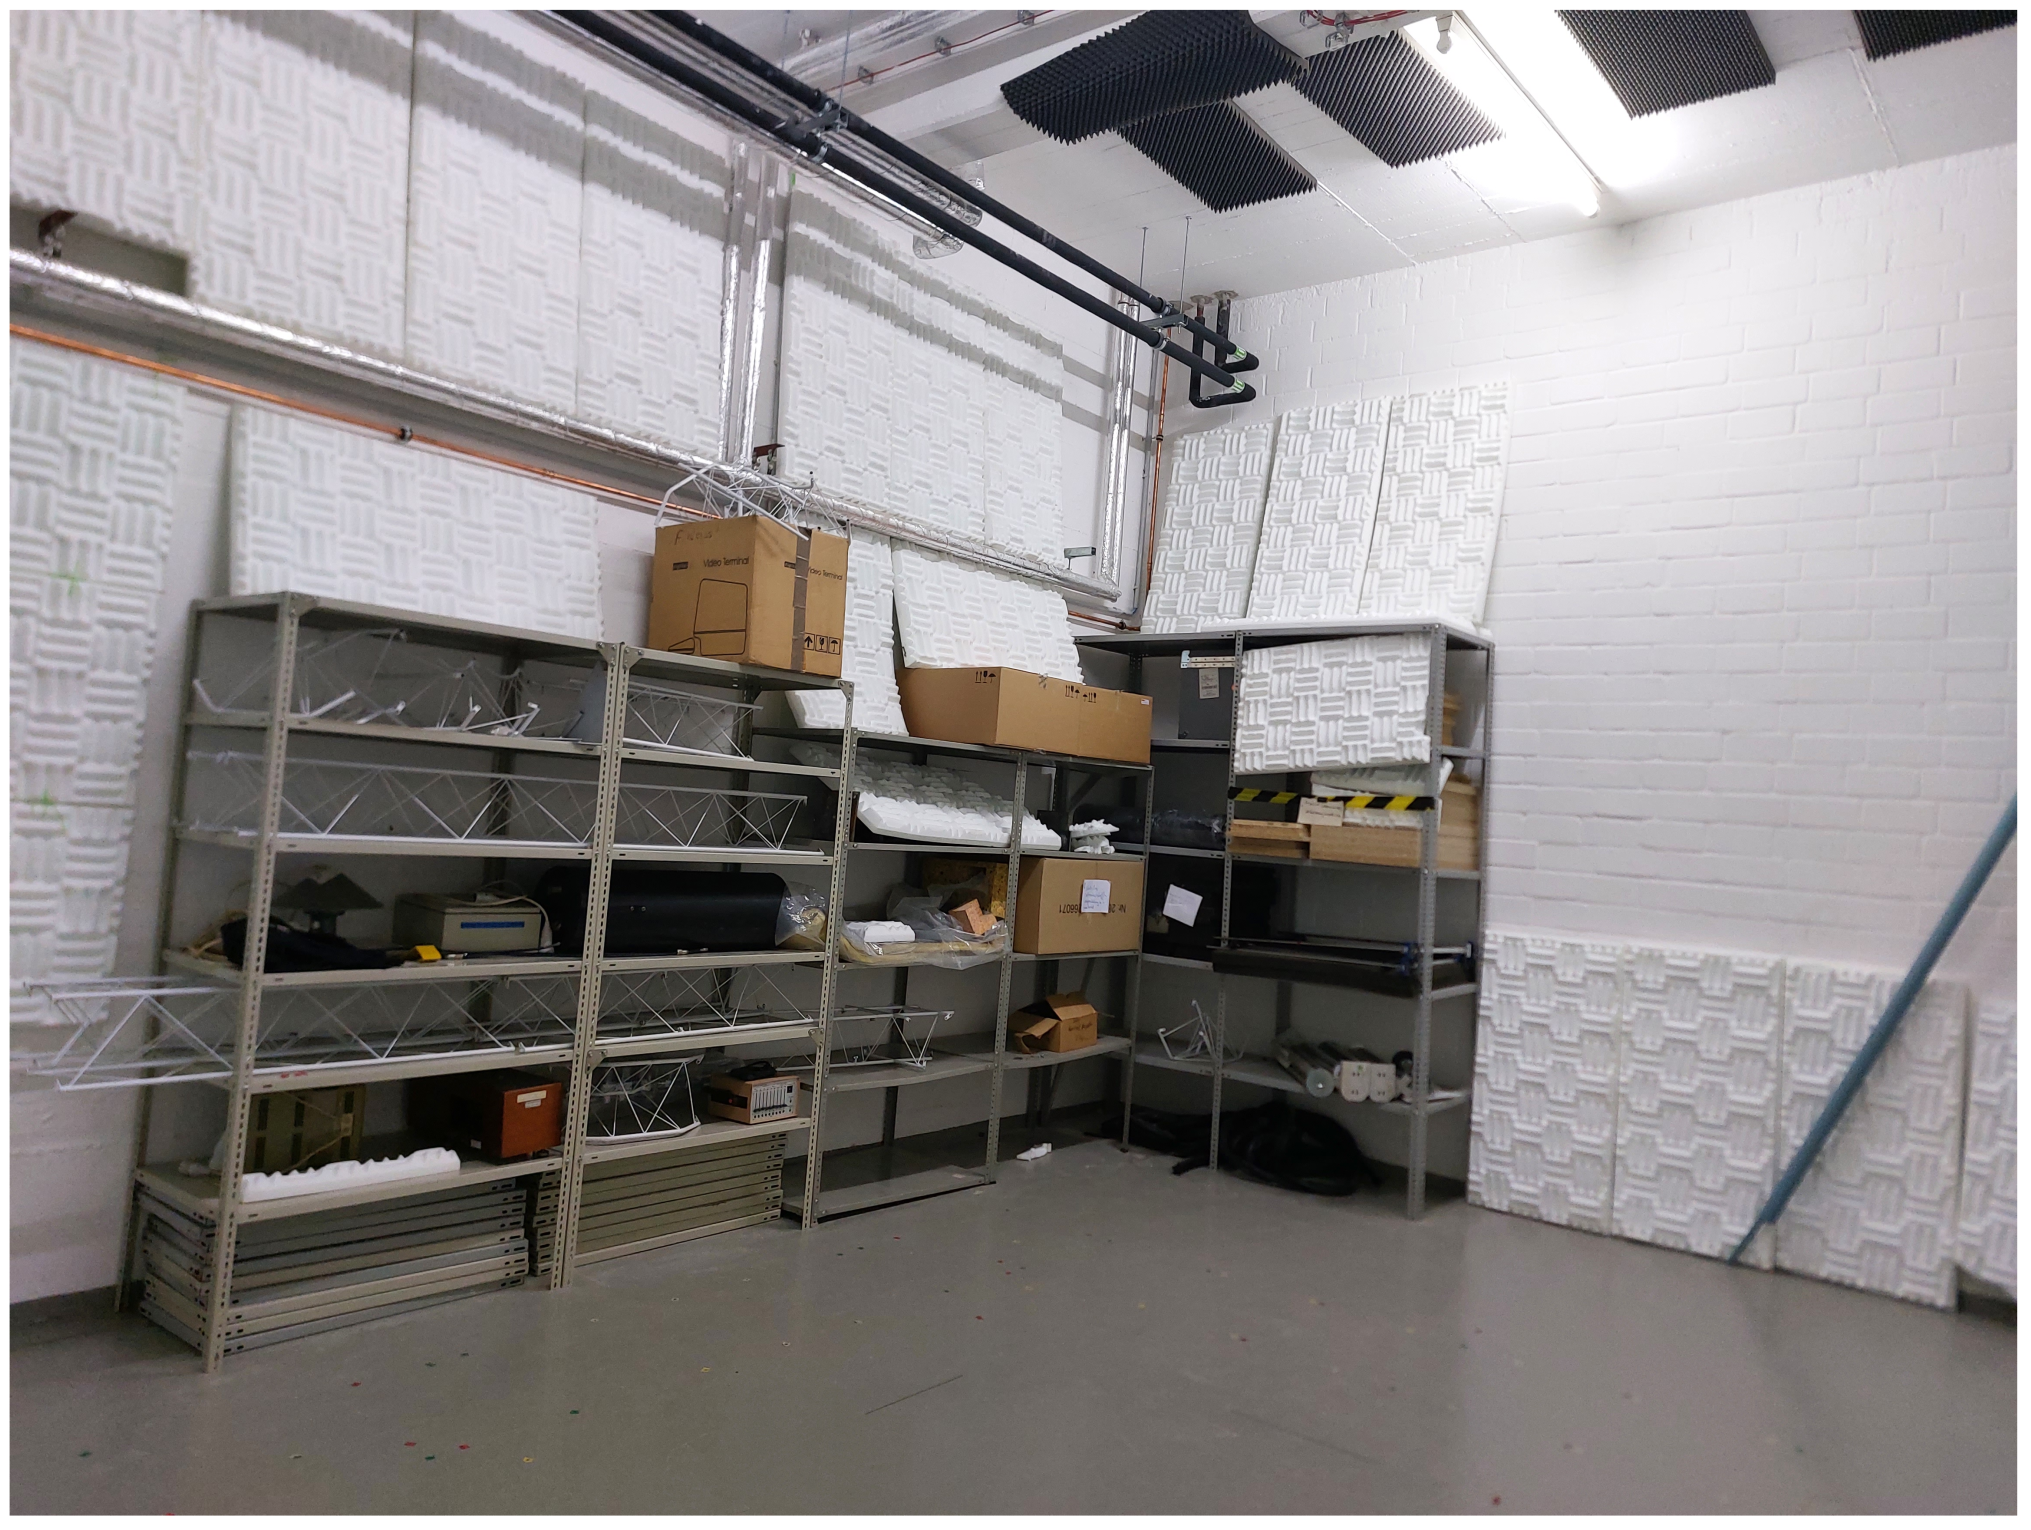
Figure 7 show photos of the former reverberation room that was used as the second environment to investigate the accuracy of the amended and the non-amended standard. It had an “average” length of about 7.1 m, a width of 5.04 m and a height of 4.38 m. The shorter side had a length of 6.82 m and the longer side of 7.45 m, so the shape of the room was not rectangular (see Figure A3 in the Appendix A). It was no longer used as a reverberation room. Before mounting the absorbers, the room had a reverberation time of 1.6 s, which reduced to 0.52 s due to the absorbers.
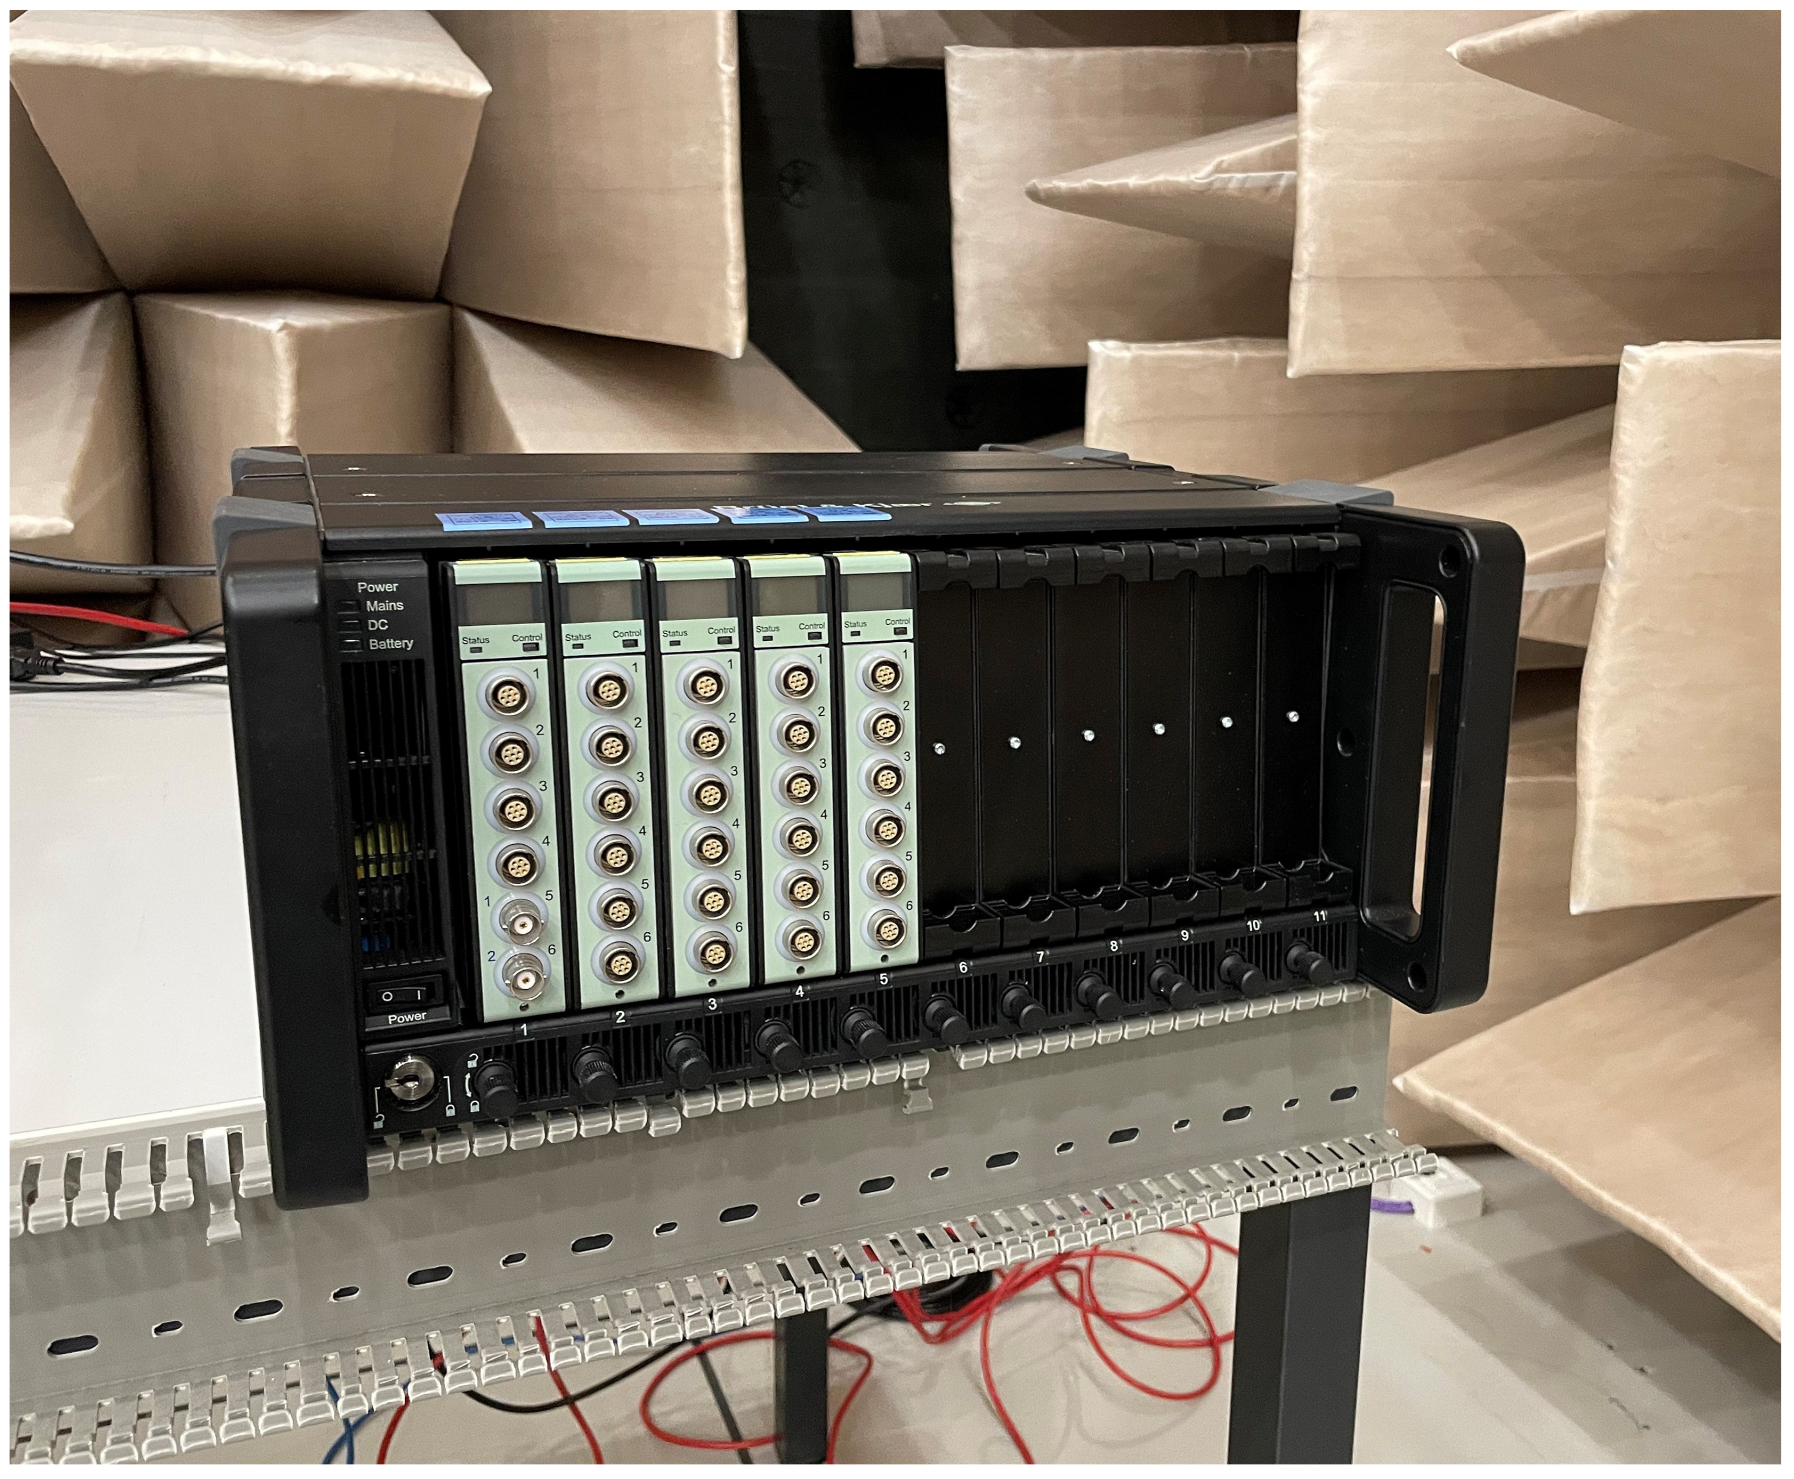
All the measurements were performed using a Brüel & Kjaer PULSE measurement system (Type 3660-D) with 28 channels (see Figure A4), which is calibrated by an accredited external laboratory every two years. Inside the Type 3660-D measurement system there were five LAN-XI Data Acquisition Modules: one input/output module Type 3160 (4 Lemo input channels (frequency range up to 51.2 kHz), 2 generator output channels) and four input modules Type 3050 (6 Lemo input channels (frequency range up to 51.2 kHz)). The sound pressure levels were measured using 8 Brüel & Kjaer Type 4190 1/2-inch free-field microphones (IEC 61672 class 1, Sensitivity: 50 mV/Pa, Frequency: 6.3 Hz–20 kHz, Dynamic Range: 14.6–146 dB), each connected to a Brüel & Kjaer Type 2669C pre-amplifier. The microphone calibration (field calibration) was conducted with a Brüel & Kjaer Type 4231 calibrator, which is yearly calibrated by an accredited external laboratory. The environmental conditions, i.e., static pressure, air temperature and relative humidity, were measured using an Ahlborn ALMEMO 2590-4AS and recorded for each measurement.
The measurements were conducted using the following procedure: at the beginning of a measurement series, the microphones were calibrated and then their position was checked and adjusted. A measurement series consisted of 3 measurements with an averaging time of 120 s. After each measurement the model machine was switched off and then switched back on for the next measurement. The three sound pressure level measurements of a measurement series were averaged arithmetically and then corrected metrologically, using the following equation [2] (Cl. 6.5):
L p A , 0 = L p A 20 lg p a p a , 0 dB + 20 lg Θ Θ 0 dB .
Here, L p A is the arithmetically averaged, A-weighted sound pressure level of a measurement series, L p A , 0 is the A-weighted sound pressure level normalized for reference metrological conditions, Θ is the air temperature during the measurement in Kelvin, Θ 0 = 296   K is the air temperature at reference metrological conditions, p a is the ambient pressure during the measurement in Pascal and p a , 0 = 1.01325 × 10 5   Pa is the ambient pressure at reference metrological conditions. Note that according to ISO 11202:2010 [2], no correction is required at altitudes ≤500 m above sea level and in the temperature range from −20 °C to 40 °C. All the measurements were conducted at an altitude of about 80 m above sea level and the temperature was well within the specified range. However, the correction was applied to increase the accuracy for the purpose of a research article.
After the end of each measurement series the system was checked by applying the calibrator to each microphone and checking the sound pressure level.
Five measurement series were performed for each combination of the distance of the measurement positions from the surface of the machine, the height of the measurement positions and the configuration of the model machine. The arithmetic mean of the five measurement results was calculated for each microphone position. In addition to the measurements in the two rooms, reference measurements were performed in BAuA’s hemi-anechoic chamber.
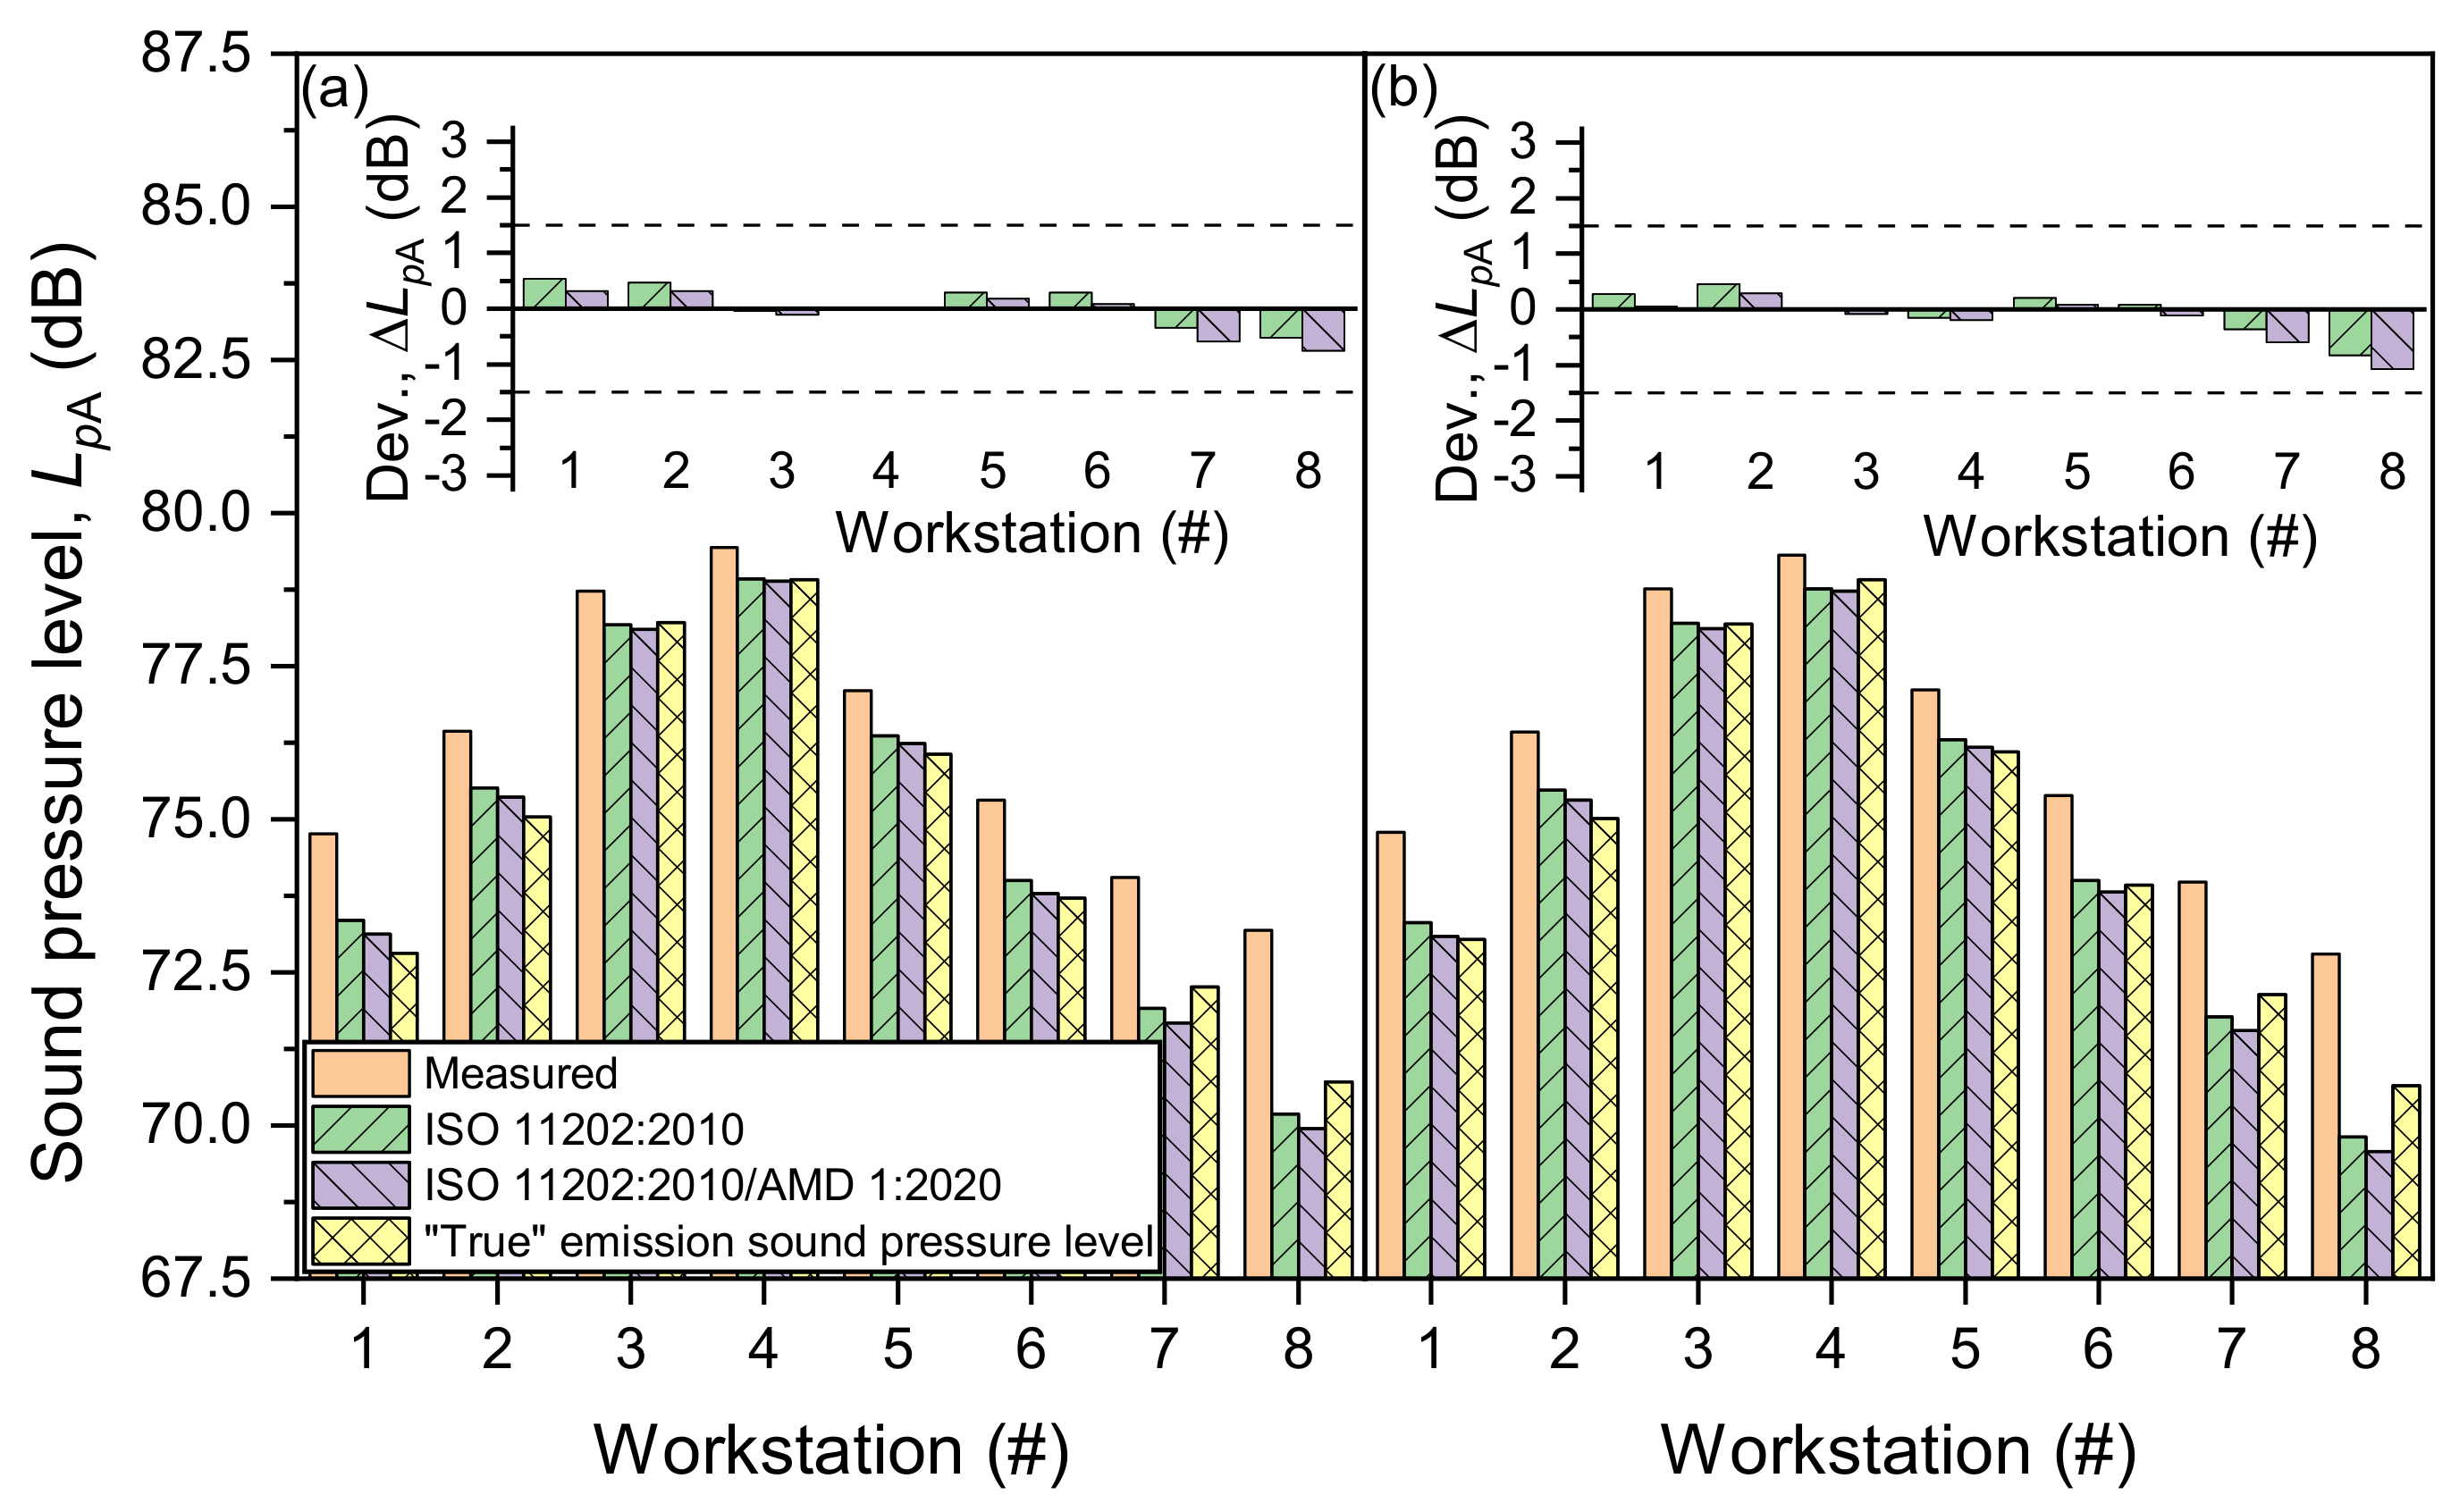
3. Results and Discussion

3.1. Accuracy Grade and Measurement Uncertainty

The accuracy grade can be determined by calculating the maximal local environmental correction K 3 A , max [2]:
K 3 A , max = 10 lg 1 + 8 π d max 2 A   dB ,
where d max is the maximum distance between the sound-radiating area and the workstation and, thus, equal to d 2 (also see Equation (2)).
If K 3 A , max is smaller than 4 dB, then the result is of accuracy grade 2. If it exceeds 4 dB, then the result is of accuracy grade 3. Note that the accuracy grade is directly connected to the standard deviation of reproducibility of the measurement method.
According to Table 1 in ISO 11202:2010 [2], accuracy grade 2 corresponds to σ R 0 = 1.5   dB and accuracy grade 3 to σ R 0 = 3.0   dB , respectively. Thus, the deviation Δ L p between the “true” emission sound pressure levels of the workstations determined in the hemi-anechoic chamber and the emission sound pressure levels determined in situ, e.g., in the workroom studied in this paper, should not exceed the value of the standard deviation of reproducibility for the determined accuracy grade.
The measurement uncertainty is connected to the accuracy grade via the standard deviation of reproducibility. The total standard deviation σ tot is given by [2] (Equation (13)):
σ tot = σ R 0 2 + σ omc 2 .
Here, σ omc is the standard deviation of the operating and mounting conditions. According to the example for a stable sound source ( σ omc = 0.5   dB ) in Table C.1 in ISO 11202:2010, the total standard deviation is σ tot = 1.6   dB for accuracy grade 2 and σ tot = 3.0   dB for accuracy grade 3. Considering the fact that the model machine is essentially a reference sound source with a modified emission/directivity, it can be considered as a stable source and, hence, the same considerations regarding the total standard deviation apply.
Note that Table C.1 in ISO 11202:2010 [2] was not changed by the amendment ISO 11202:2010/Amd 1:2020 [17]. Thus, the considerations regarding the uncertainty apply to both the L p A determined using ISO 11202:2010 and the L p A determined using the amended standard. The expanded uncertainty U is given by the following equation:
U = k · σ tot .
Setting the confidence level to 95% and assuming a normal distribution of the measured values results in a coverage factor k = 2 . Here, the confidence interval is from L p A U to L p A + U . Thus, the expanded uncertainty is U = 3.2   dB for accuracy grade 2 and U = 6.0   dB for accuracy grade 3 (refer to the last column of Table A1, Table A2, Table A3, Table A4, Table A5, Table A6, Table A7, Table A8, Table A9 and Table A10 for the accuracy grade). Note that for the purpose of a noise emission declaration one usually assumes a one-sided normal distribution, where the coverage factor reduces to k = 1.6 .

3.2. Equivalent Absorption Area of the Rooms

The first step towards determining the local environmental correction in a given room/acoustic environment is to determine the equivalent absorption area, A, which is one of the two input parameters in Equation (1). According to Cl. A.1.2 of ISO 11202 [2]—this remained unchanged by the amendment—this input parameter shall be determined using the approximate method, where it is determined by assigning an average absorption coefficient, α , for the whole room, using Table A.1 in ISO 3744:2010 [21] or Table A.1 in ISO 3746:2010 [23] and multiplying it by the total area of the boundary surfaces of the room S V , in m 2 :
A = α · S V .
This method yielded results that showed a great dependence on the person carrying out the assessment of the room (see Table 3). Especially, the use of a single mean sound-absorption coefficient for all boundary surfaces of the test room (walls, ceiling and floor) is assumed to be the cause of the large discrepancies between the results.
Only sufficient experience with room acoustics can prevent that one guesses/determines a much too low or too high equivalent absorption area. These considerations are based on the results, shown in Table 3.
The following equation, e.g., see Equation (A.2) in ISO 3744:2010 [21], allows one to calculate the resulting “global” environmental correction, K 2 A , for the sound power level for a given measurement surface:
K 2 A = 10 lg 1 + 4 S A   dB .
Here, the environmental correction is calculated for two different (reference) measurement surfaces: one for workstations at a distance a = 0.5   m ( S = 26.9   m 2 ) from the surface of the machine, and one for workstations at a = 1   m ( S = 48.3   m 2 ).
Table 3 shows the results of these calculations in detail. The results of test engineers 1 and 2 for the calculation of the “global” environmental correction K 2 A for the sound power level indicate that the workroom did not meet the requirements of [2] and its amendment. Cl. 6.2 in ISO 11202:2010 limits the application of the standard to K 2 A 7   dB , while K 2 A shall be determined according to ISO 3744 [21] or ISO 3746 [23]. This allows for the use of several different methods, which can yield different results: for example, see Arendt et al. [24].
One of the methods in ISO 3744 to determine K 2 A is the direct method (see Ref. [21] Cl. A.3.4). Figure 8 shows the setup, with a hemispherical measurement surface (radius 2 m) and a reference sound source. This setup was used to determine the equivalent absorption area of the room, using the direct method.
The following equation (see Equation (A.5) in ISO 3744:2010 [21]) was used to determine the equivalent absorption area of the workroom for A-weighted quantities:
A = 4 S ( S / S 0 ) · 10 0.1 · ( L p A , in   situ ¯ L W A , RSS ) 1 .
Here, S is the surface area of the measurement surface (2 m hemisphere), L p A , in   situ ¯ is the average A-weighted sound pressure level on the measurement surface in the workroom and L W A , RSS is the A-weighted sound power level of the RSS, which was determined in BAuA’s hemi-anechoic chamber using the same setup/measurement surface. L p A , in   situ ¯ is the energy average of all measurement positions on the measurement surface, where the sound pressure level at each measurement position was time-averaged over 120 s.
Table 4 shows the results using the direct method for the two different acoustic environments: the workroom and the former reverberation room. The workroom had an equivalent absorption area of A = 55.2   m 2 and the former reverberation room of A = 97.7   m 2 . Thus, the local environmental corrections K 3 A were larger in the workroom (see Equation (1)).
The second quantity for determining the local environmental correction K 3 A according to Equation (1) is the parameter d for the distance from the workstation. Table 1 and Table 2 show the measured results for the distances d 1 and d 2 of the workstations from the sound-radiating area according to the definitions in the amendment [2]. When calculating the environmental correction according to the non-amended standard [2], the parameter d is simply the shortest distance between the sound-radiating area and the workstation ( d = d 1 ). In contrast to this, d is the arithmetic mean of d 1 and d 2 (see Equation (2)) according to the amendment [17].

3.3. Sound Pressure Levels Determined in the Workroom

Table A1, Table A2, Table A3, Table A4 and Table A5, as well as Figure 9, Figure 10, Figure 11, Figure 12 and Figure 13, show comparisons of the reference emission sound pressure levels determined in a hemi-anechoic chamber and the emission sound pressure levels obtained according to [2] and its amendment [17] in the workroom. Note that these results were determined from A-weighted quantities only, but the difference between a calculation from frequency band data and the absorption area for each frequency band was less than 0.1 dB. In the legend of the figures, “Measured” refers to the time-averaged A-weighted sound pressure level measured in the workroom (averaging time 120 s), where no correction for the influence of the environment ( K 3 , A ) was subtracted.
However, it is important to note that the obtained emission sound pressure levels depend not only on the distance, but also on the determined equivalent absorption area A of the room (see the different methods above). All the results were based on the equivalent absorption area A that was determined according to the direct method (ISO 3744:2010 [21] Cl. A.3.4; also, see Table 4).
Figure 9 shows the results for the distance a = 0.5   m of the workstations from the surface of the machine, which was in configuration I (circular opening). Clearly, the circular opening (diameter: 0.18 m) represented a dominantly sound-radiating area that was small compared to its distance to the workstations—even for workstations 3 and 4 that were located directly in front of the opening.
The observed deviations Δ L p A , 1 and Δ L p A , 2 were significantly smaller than the standard deviation of reproducibility σ R 0 = 1.5   dB for accuracy grade 2. These results support the reduction of the minimum distance between the sound-radiating area and the workstation from 1 m to 0.5 m that is the result of the amendment [17]. Due to the small dimension of the opening, the results according to the amended [17] and the non-amended standard [2] differ only slightly.
Figure 10 shows the results for a distance of a = 1   m of the workstations from the surface of the model machine in configuration I (circular opening). Again, both the amended and non-amended standard yielded similar results.
However, the deviations between the “true” and the determined sound pressure level increased compared to a distance of a = 0.5   m . Here, the maximum deviations between the “true” and the determined L p A were slightly larger when using the amended standard [17]. The numbers of the workstations (eight at both heights) with accuracy grade 3 (see Equation (4)) are marked in red in Figure 10.
Figure 11 shows the results for the model machine in configuration I and a distance a = 1.25   m of the workstations from the surface of the machine. Here, the deviations Δ L p A were slightly larger than at a distance a = 1   m .
Figure 12 shows the results for the model machine in configuration II and a distance a = 1   m of the workstations from the surface of the machine. At this distance, the typical dimension of the sound-radiating area was not small compared to its distance to the workstation for most workstations (diagonal of the opening: 1.12 m). However, both the non-amended [2] and the amended standard [17] yielded results that were within the standard deviation of reproducibility of the accuracy grade determined according to Equation (4). The numbers of the workstations (1, 7 and 8 at both heights 1.26 m and 1.55 m) with accuracy grade 3, which corresponded to a standard deviation of reproducibility σ R 0 = 3.0   dB , are marked in red in Figure 12.
Note that at a height of 1.55 m all emission sound pressure levels determined using the amended standard [17] were lower than the “true” emission sound pressure levels measured in the hemi-anechoic chamber.
Figure 13 shows the results for the model machine in configuration II and a distance a = 1.25   m of the workstations from the surface of the machine. Thus, here the distance is larger than the typical dimension of the sound-radiating area. Nevertheless, the deviations Δ L p A are larger than at a distance a = 1   m . Regarding the workstations at a height of 1.55 m, both the amended [17] and the non-amended standard [2] yielded results that were systematically too low compared to the “true” emission sound pressure levels determined in the hemi-anechoic chamber. Both standards yielded results that were within the accuracy grade determined using Equation (4). However, the results obtained with amended standard [17] showed a larger deviation.
To compare both methods quantitatively, Δ L p A , 1 and Δ L p A , 2 for all measurement positions needed to be characterized. To that end, the arithmetic mean and the root mean square deviation (RMSD) were determined. The RMSD was determined using the following equation:
RMSD = i = 1 N Δ L p A , i 2 N .
Table 5 shows the mean deviation and the RMSD for both the non-amended standard [2] and amended standard [17] for different distances of the workstations from the surface of the machine and the two different configurations of the model machine.
Although for the model machine in configuration I (circular opening) the differences between both “methods” were small due to the small extension of the sound-radiating area, the deviations, averaged over all eight (or seven for a = 1.25   m ) workstations were systematically larger for the amended standard [17]. For the model machine in configuration II (open frame), the same trend can be observed. Here, the differences between ISO 11202:2010 [2] and ISO 11202:2010/Amd 1:2020 [17] were even larger.

3.4. Sound Pressure Levels Determined in the Former Reverberation Room

Table A6, Table A7, Table A8, Table A9 and Table A10, as well as Figure 14, Figure 15, Figure 16, Figure 17 and Figure 18, show comparisons of the reference emission sound pressure levels determined in a hemi-anechoic chamber and the emission sound pressure levels obtained according to [2] and its amendment [17] in the former reverberation room. The results shown here have been determined from a calculation from A-weighted quantities only. This way, the deviations Δ L p A , 1 and Δ L p A , 2 are up to 0.8   dB larger compared to a calculation from the frequency band data and the absorption area for each frequency band. However, this calculation is out of the scope of ISO 11202 and the determined absorption areas for certain frequency bands exceeded the surface area of the reverberation room. In the legend of Figure 14, Figure 15, Figure 16, Figure 17 and Figure 18, “Measured” refers to the time-averaged A-weighted sound pressure level measured in the former reverberation room (averaging time 120 s), where no correction for the influence of the environment ( K 3 , A ) was subtracted.
Figure 14 shows the results for a distance a = 0.5   m of the workstations from the surface of the machine, which is in configuration I (circular opening), in the former reverberation room. The results are very similar to those in the workroom (see Figure 9). All deviations (see the insets in Figure 14a,b) between the “true” emission sound pressure levels measured in the hemi-anechoic chamber and those determined in the former reverberation room were well within the standard deviation of reproducibility for accuracy grade 2. Thus, they were not too large and the determined emission sound pressure levels were sufficiently accurate. However, in this acoustic environment and for this distance of the workstations from the machine the deviations were slightly larger for the non-amended standard (also see Table 6).
Figure 15 shows the results for a distance a = 1   m of the workstations from the surface of the machine, which is in configuration I (circular opening), in the former reverberation room. The results are very similar to those obtained in the workroom.
Figure 16 shows the results for a distance a = 1.25   m of the workstations from the surface of the machine, which is in configuration I (circular opening), in the former reverberation room. The results are very similar to those obtained in the workroom.
Figure 17 shows the results for the model machine in configuration II and a distance a = 1   m of the workstations from the surface of the machine. Due to the larger equivalent absorption area of the former reverberation room ( A = 97.7   m 2 vs. A = 55.2   m 2 in the workroom) accuracy grade 2 could be achieved at all workstations. At both heights (1.26 m and 1.55 m) a clear tendency of ISO 11202:2010/Amd 1:2020 [17] to overestimate the local environmental correction K 3 A can be observed. All but one of the determined L p A were smaller than the “true” emission sound pressure levels measured in the hemi-anechoic chamber.
Figure 18 shows the results for the model machine in configuration II and a distance a = 1.25   m of the workstations from the surface of the machine. The trend observed in Figure 17 is confirmed. Here, even all the L p A determined using the amended standard were lower than the “true” emission sound pressure levels measured in the hemi-anechoic chamber.
Table 6 shows the mean deviation, the RMSD and the maximum deviation for both the non-amended standard [2] and amended standard [17] for different distances a of the workstations from the surface of the machine and the two different configurations of the model machine. In all cases, except for the model machine in configuration I (circular opening) and a distance of a = 0.5   m of the workstations from the surface of the machine, the deviations (mean deviation Δ L p A ¯ , RMSD and maximum deviation Δ L p A , max ) were larger for the L p A determined according to ISO 11202:2010/Amd 1:2020 [17]. Note that, nonetheless, all the deviations were compatible with accuracy grade 2.

4. Conclusions

The results presented in this paper indicate that the definition of the typical distance of the workstation from the sound-radiating area as the arithmetic mean of the shortest and the longest distance (see Equation (1)) decreases the accuracy of the method in some cases. These results suggest that the justification for the amendment may have been based on an insufficient amount of data and that more thorough investigations, ideally conducted by different, independent researchers should have been conducted. The study in Ref. [16] was based on a model machine consisting of three RSSs on a table or a single RSS only. In some cases, the tendency of the amended method to overestimate the local environmental correction K 3 A can decrease the accuracy of the determined emission sound pressure levels and has the potential to lead to an underestimation of the noise hazard originating from a machine. The largest deviation of an L p A determined according to the amended standard was 1.7 dB below the “true” L p A measured in the hemi-anechoic chamber.
However, reducing the minimum value for the typical distance d from 1 m to 0.5 m can be seen as an improvement, at least judging from the data presented here. Note that although the observed deviations (see Table 5 and Table 6) were larger for the amended standard in some cases, they were still within the standard deviation of reproducibility σ R 0 of the corresponding accuracy grade (see Equation (4)). Thus, it is not necessary to revise ISO 11202 soon. However, the results of this study should be taken into account during the next revision and, more importantly, should serve as motivation to conduct a round-robin test or, at least, further studies.
In summary, it has been shown that the amendment is not necessarily an improvement compared to the non-amended standard. On the positive side, it extends the scope of the method for machines where the workstation is close to the dominantly sound-radiating area. On the negative side, the change of the definition of the typical distance d of the workstation from the dominantly sound-radiating area of the machine can increase deviation between the “true” emission sound pressure level and the determined sound pressure level. From an Occupational Safety and Health point of view, the tendency to overestimate the local environmental correction K 3 A is problematic because, as a result, the noise hazard of a machine may be underestimated. On the other hand, machine manufacturers prefer to avoid declaring an L p A that is higher than the true emission sound pressure level of the machine. Thus, underestimating K 3 A should also be avoided. In any case, the determined K 3 A must be accurate enough to allow for a verification of the declared L p A using ISO 4871 [25].

Funding

This research received no external funding.

Data Availability Statement

The original contributions presented in the study are included in the article, further inquiries can be directed to the corresponding author.

Acknowledgments

I thank Anke Berger and Sven Sommer for performing the measurements. I thank Anke Berger for creating the drawings. I thank Georg Brockt, Jan Grenzebach and Erik Romanus for fruitful discussions.

Conflicts of Interest

The author declares no conflicts of interest.

Appendix A

Appendix A.1. Drawings of the Model Machine

Figure A1. Drawing of the model machine in configuration I seen from the side. The drawing features the dimensions of the model machine. The circular opening is 139 cm above the ground.
Acoustics 06 00010 g0a1
Figure A2. Drawing of the model machine in configuration II seen from the side. The opening is realized by mounting a frame without a metal plate.
Acoustics 06 00010 g0a2

Appendix A.2. The Former Reverberation Room

Figure A3. Sketch of the former reverberation room.
Acoustics 06 00010 g0a3

Appendix A.3. The Measurement System

Figure A4. Photo of the Brüel & Kjaer measurement system used for the measurements.
Acoustics 06 00010 g0a4

Appendix A.4. Measurement Data for the Workroom

Table A1. Measured sound pressure level and determined emission sound pressure level of the model machine in configuration I (circular opening) at a distance of 0.5 m and heights of 1.26 m and 1.55 m in the workroom (see Figure 4 and Figure 5). The equivalent absorption area was determined using an RSS and the direct method (see Table 4).
Pos. #“True” L p A   ( dB ) Meas. L p A   ( dB ) Corr. K 3 A , 1   ( dB ) Corr. K 3 A , 2   ( dB ) Det. L p A , 1   ( dB ) Det. L p A , 2   ( dB ) Dev. Δ L p A , 1   ( dB ) Dev. Δ L p A , 2   ( dB ) Acc. grad
 Height, h = 1.26   m
172.874.81.41.673.473.10.50.32
275.076.40.91.175.575.40.50.32
378.278.70.50.678.278.10.0−0.12
478.979.40.50.578.978.90.00.02
576.177.10.70.976.476.20.30.22
673.775.31.31.574.073.80.30.12
772.374.02.12.471.971.7−0.3−0.62
870.773.23.03.270.270.0−0.5−0.82
 Height, h = 1.55   m
173.174.81.51.773.373.10.30.12
275.076.40.91.175.575.30.50.32
378.278.80.60.778.278.10.0−0.12
478.979.30.50.678.878.7−0.1−0.22
576.177.10.80.976.376.20.20.12
673.975.41.41.674.073.80.1−0.12
772.274.02.22.471.871.6−0.4−0.62
870.772.83.03.269.969.6−0.8−1.12
Table A2. Measured sound pressure level and determined emission sound pressure level of the model machine in configuration I (circular opening) at a distance of 1 m and heights of 1.26 m and 1.55 m in the workroom (see Figure 4 and Figure 5). The equivalent absorption area was determined using an RSS and the direct method (see Table 4).
Pos. #“True” L p A   ( dB ) Meas. L p A   ( dB ) Corr. K 3 A , 1   ( dB ) Corr. K 3 A , 2   ( dB ) Det. L p A , 1   ( dB ) Det. L p A , 2   ( dB ) Dev. Δ L p A , 1   ( dB ) Dev. Δ L p A , 2   ( dB ) Acc. grad
 Height, h = 1.26   m
170.273.22.83.070.470.20.20.02
272.775.22.02.173.273.10.50.32
373.875.51.71.873.873.80.00.02
474.175.51.71.773.973.8−0.2−0.22
573.175.11.81.973.273.10.10.02
671.874.02.32.571.771.5−0.1−0.22
770.773.33.03.270.470.2−0.3−0.52
869.172.54.24.568.368.0−0.9−1.13
 Height, h = 1.55   m
170.473.42.83.070.670.40.20.02
272.875.32.02.273.373.10.40.32
374.075.71.71.874.073.90.0−0.12
474.475.61.71.774.073.9−0.4−0.52
573.375.01.92.073.173.0−0.2−0.32
671.974.02.32.571.771.6−0.2−0.42
771.073.53.03.270.570.3−0.5−0.72
869.272.44.24.568.267.9−1.0−1.23
Table A3. Measured sound pressure level and determined emission sound pressure level of the model machine in configuration I (circular opening) at a distance of 1.25 m and heights of 1.26 m and 1.55 m in the workroom (see Figure 4 and Figure 5). The equivalent absorption area was determined using an RSS and the direct method (see Table 4).
Pos. #“True” L p A   ( dB ) Meas. L p A   ( dB ) Corr. K 3 A , 1   ( dB ) Corr. K 3 A , 2   ( dB ) Det. L p A , 1   ( dB ) Det. L p A , 2   ( dB ) Dev. Δ L p A , 1   ( dB ) Dev. Δ L p A , 2   ( dB ) Acc. grad
 Height, h = 1.26   m
271.274.62.72.871.971.80.70.62
372.174.62.42.572.172.10.00.02
472.374.42.42.472.072.0−0.3−0.32
571.774.12.52.671.671.5−0.1−0.22
670.873.32.93.170.470.3−0.4−0.53
769.972.83.53.769.369.2−0.6−0.73
 Height, h = 1.55   m
271.474.32.72.871.671.50.30.12
372.274.52.42.572.172.0−0.2−0.22
472.574.32.42.471.971.9−0.6−0.62
571.973.92.52.671.471.3−0.5−0.62
671.073.62.93.170.770.5−0.3−0.53
770.172.83.53.769.369.1−0.8−1.03
Table A4. Measured sound pressure level and determined emission sound pressure level of the model machine in configuration II (open frame) at a distance of 1 m and heights of 1.26 m and 1.55 m in the workroom (see Figure 4 and Figure 5). The equivalent absorption area was determined using an RSS and the direct method (see Table 4).
Pos. #“True” L p A   ( dB ) Meas. L p A   ( dB ) Corr. K 3 A , 1   ( dB ) Corr. K 3 A , 2   ( dB ) Det. L p A , 1   ( dB ) Det. L p A , 2   ( dB ) Dev. Δ L p A , 1   ( dB ) Dev. Δ L p A , 2   ( dB ) Acc. grad
 Height, h = 1.26   m
177.780.61.83.178.877.51.2−0.13
281.083.51.62.381.981.10.90.22
381.984.01.62.082.381.90.40.02
482.083.61.61.982.081.70.0−0.32
581.283.01.62.281.480.80.2−0.42
680.082.11.72.780.479.50.4−0.52
778.380.92.23.378.777.60.5−0.73
874.879.33.14.576.174.71.3−0.13
 Height, h = 1.55   m
178.681.21.83.179.478.00.7−0.63
282.484.21.62.482.581.80.2−0.62
383.484.71.62.183.182.6−0.3−0.72
483.484.51.62.082.982.5−0.6−0.92
582.884.01.62.382.481.7−0.4−1.02
681.182.71.82.780.980.0−0.2−1.12
779.381.12.23.378.977.8−0.4−1.53
875.479.23.14.076.175.20.6−0.23
Table A5. Measured sound pressure level and determined emission sound pressure level of the model machine in configuration II (open frame) at a distance of 1.25 m and heights of 1.26 m and 1.55 m in the workroom (see Figure 4 and Figure 5). The equivalent absorption area was determined using an RSS and the direct method (see Table 4).
Pos. #“True” L p A   ( dB ) Meas. L p A   ( dB ) Corr. K 3 A , 1   ( dB ) Corr. K 3 A , 2   ( dB ) Det. L p A , 1   ( dB ) Det. L p A , 2   ( dB ) Dev. Δ L p A , 1   ( dB ) Dev. Δ L p A , 2   ( dB ) Acc. grad
 Height, h = 1.26   m
279.682.92.33.080.579.90.90.32
380.483.02.32.780.780.30.3−0.12
480.382.52.32.680.279.9−0.1−0.42
580.082.32.32.979.979.4−0.1−0.62
678.981.52.43.279.178.20.2−0.73
777.880.62.83.877.876.80.0−1.03
 Height, h = 1.55   m
280.983.32.33.081.080.30.1−0.62
381.783.52.32.781.280.8−0.5−0.92
481.883.32.32.681.080.7−0.8−1.12
581.382.92.32.980.680.0−0.7−1.32
680.082.12.43.379.678.8−0.4−1.23
778.780.82.83.878.077.0−0.7−1.73

Appendix A.5. Measurement Data for the Former Reverberation Room

Table A6. Measured sound pressure level and determined emission sound pressure level of the model machine in configuration I (circular opening) at a distance of 0.5 m and heights of 1.26 m and 1.55 m in the former reverberation room (see Figure 6 and Figure 7). The equivalent absorption area was determined using an RSS and the direct method (see Table 4).
Pos. #“True” L p A   ( dB ) Meas. L p A   ( dB ) Corr. K 3 A , 1   ( dB ) Corr. K 3 A , 2   ( dB ) Det. L p A , 1   ( dB ) Det. L p A , 2   ( dB ) Dev. Δ L p A , 1   ( dB ) Dev. Δ L p A , 2   ( dB ) Acc. grad
 Height, h = 1.26   m
172.874.40.91.073.673.40.80.62
275.075.90.50.675.475.30.30.32
378.278.40.30.478.178.1−0.1−0.12
478.979.20.30.378.978.90.00.02
576.176.90.40.576.576.40.40.42
673.775.00.80.974.374.10.50.42
773.673.61.31.572.372.10.0−0.22
872.672.61.92.170.670.5−0.1−0.32
 Height, h = 1.55   m
173.174.40.91.073.573.30.40.32
275.076.00.60.775.475.30.40.32
378.278.40.30.478.078.0−0.2−0.22
478.979.10.30.378.778.7−0.2−0.22
576.176.90.50.676.476.30.30.22
673.974.90.81.074.073.90.10.02
772.273.51.41.572.171.9−0.1−0.22
870.772.21.92.170.370.1−0.4−0.62
Table A7. Measured sound pressure level and determined emission sound pressure level of the model machine in configuration I (circular opening) at a distance of 1 m and heights of 1.26 m and 1.55 m in the former reverberation room (see Figure 6 and Figure 7). The equivalent absorption area was determined using an RSS and the direct method (see Table 4).
Pos. #“True” L p A   ( dB ) Meas. L p A   ( dB ) Corr. K 3 A , 1   ( dB ) Corr. K 3 A , 2   ( dB ) Det. L p A , 1   ( dB ) Det. L p A , 2   ( dB ) Dev. Δ L p A , 1   ( dB ) Dev. Δ L p A , 2   ( dB ) Acc. grad
 Height, h = 1.26   m
170.272.61.82.070.870.70.60.42
272.774.41.21.373.273.10.40.32
373.875.01.01.173.973.90.10.12
474.175.21.01.074.274.20.10.12
573.174.61.11.273.473.40.30.32
671.873.41.41.672.071.80.20.12
770.772.41.92.170.570.3−0.2−0.32
869.171.52.93.168.668.4−0.5−0.72
 Height, h = 1.55   m
170.472.51.82.070.770.50.20.12
272.874.41.31.373.173.00.30.22
374.075.11.11.174.074.00.00.02
474.475.11.01.174.174.0−0.3−0.32
573.374.71.21.273.573.40.20.12
671.973.41.51.672.071.90.0−0.12
771.072.61.92.170.770.5−0.3−0.42
869.271.32.93.168.468.2−0.8−1.02
Table A8. Measured sound pressure level and determined emission sound pressure level of the model machine in configuration I (circular opening) at a distance of 1.25 m and heights of 1.26 m and 1.55 m in the former reverberation room (see Figure 6 and Figure 7). The equivalent absorption area was determined using an RSS and the direct method (see Table 4).
Pos. #“True” L p A   ( dB ) Meas. L p A   ( dB ) Corr. K 3 A , 1   ( dB ) Corr. K 3 A , 2   ( dB ) Det. L p A , 1   ( dB ) Det. L p A , 2   ( dB ) Dev. Δ L p A , 1   ( dB ) Dev. Δ L p A , 2   ( dB ) Acc. grad
 Height, h = 1.26   m
271.273.61.71.871.971.80.70.62
372.173.81.51.672.372.30.20.22
472.373.91.51.572.472.40.10.12
571.773.51.61.772.071.90.20.22
670.872.61.92.070.870.70.0−0.12
769.971.92.32.469.669.4−0.4−0.52
 Height, h = 1.55   m
271.473.51.71.871.871.70.40.32
372.273.91.51.672.472.30.20.12
472.574.01.51.572.572.5−0.1−0.12
571.973.61.61.772.071.90.10.02
671.072.71.92.070.870.7−0.2−0.32
770.171.92.32.569.669.4−0.5−0.72
Table A9. Measured sound pressure level and determined emission sound pressure level of the model machine in configuration II (open frame) at a distance of 1 m and heights of 1.26 m and 1.55 m in the former reverberation room (see Figure 6 and Figure 7). The equivalent absorption area was determined using an RSS and the direct method (see Table 4).
Pos. #“True” L p A   ( dB ) Meas. L p A   ( dB ) Corr. K 3 A , 1   ( dB ) Corr. K 3 A , 2   ( dB ) Det. L p A , 1   ( dB ) Det. L p A , 2   ( dB ) Dev. Δ L p A , 1   ( dB ) Dev. Δ L p A , 2   ( dB ) Acc. grad
 Height, h = 1.26   m
177. 779.81.12.078.777.81.00.12
281.082.21.01.581.280.70.2−0.32
381.983.01.01.382.081.70.0−0.22
482.082.91.01.281.981.7−0.1−0.32
581.282.31.01.481.380.90.1−0.32
680.081.11.11.780.179.40.1−0.52
778.379.81.32.178.577.70.2−0.62
874.877.12.03.175.174.00.3−0.83
 Height, h = 1.55   m
178.680.31.12.079.278.30.5−0.42
282.483.11.01.582.181.6−0.2−0.72
383.483.91.01.382.982.6−0.5−0.82
483.483.91.01.282.982.7−0.5−0.82
582.883.51.01.482.582.1−0.3−0.72
681.182.01.11.780.980.3−0.2−0.82
779.380.41.42.279.078.2−0.3−1.12
875.477.42.02.775.374.7−0.1−0.72
Table A10. Measured sound pressure level and determined emission sound pressure level of the model machine in configuration II (open frame) at a distance of 1.25 m and heights of 1.26 m and 1.55 m in the former reverberation room (see Figure 6 and Figure 7). The equivalent absorption area was determined using an RSS and the direct method (see Table 4).
Pos. #“True” L p A   ( dB ) Meas. L p A   ( dB ) Corr. K 3 A , 1   ( dB ) Corr. K 3 A , 2   ( dB ) Det. L p A , 1   ( dB ) Det. L p A , 2   ( dB ) Dev. Δ L p A , 1   ( dB ) Dev. Δ L p A , 2   ( dB ) Acc. grad
 Height, h = 1.26   m
279.681.31.51.979.879.40.2−0.22
380.481.61.51.780.279.9−0.2−0.52
480.381.61.51.680.280.0−0.1−0.32
580.081.31.51.879.879.5−0.2−0.52
678.980.51.52.178.978.30.0−0.62
777.879.41.82.577.676.9−0.2−1.02
 Height, h = 1.55   m
280.982.31.51.980.880.4−0.1−0.62
381.782.71.51.781.280.9−0.5−0.82
481.882.81.51.781.381.1−0.5−0.72
581.382.41.51.980.980.5−0.4−0.82
680.081.31.52.179.779.1−0.3−0.92
778.780.01.82.678.277.5−0.5−1.32

References

  1. Heisterkamp, F.; Bengtsson Ryberg, J.; Jacques, J.; Verdaasdonk, A. Sell and Buy Quiet - the extended concept to reduce noise (at work and at home). In Proceedings of the INTER-NOISE and NOISE-CON Congress and Conference Proceedings, Washington, DC, USA, 1–5 August 2021; Volume 263, pp. 2011–2019. [Google Scholar] [CrossRef]
  2. ISO 11202:2010; Acoustics—Noise Emitted by Machinery and Equipment—Determination of Emission Sound Pressure Levels at a Work Station and at Other Specified Positions Applying Approximate Environmental Corrections. International Organization for Standardization: Geneva, Switzerland, 2010.
  3. ISO 11204:2010; Acoustics—Noise Emitted by Machinery and Equipment—Determination of Emission Sound pressure Levels at a Work Station and at Other Specified Positions Applying Accurate Environmental Corrections. International Organization for Standardization: Geneva, Switzerland, 2010.
  4. ISO 11205:2003; Acoustics—Noise Emitted by Machinery and Equipment—Engineering Method for the Determination of Emission Sound Pressure Levels in Situ at the Work Station and at Other Specified Positions Using Sound Intensity. International Organization for Standardization: Geneva, Switzerland, 2003.
  5. ISO 3740:2019; Acoustics—Determination of Sound Power Levels of Noise Sources—Guidelines for the Use of Basic Standards. International Organization for Standardization: Geneva, Switzerland, 2019.
  6. ISO 11202:1995; Acoustics Noise—Emitted by Machinery and Equipment—Measurement of Emission Sound Pressure Levels at a Work Station and at Other Specified Positions. International Organization for Standardization: Geneva, Switzerland, 1995.
  7. Andresen, G.; Jonasson, H.G. Determination of emission sound pressure levels in situ—A comparison between different methods. In Proceedings of the INTER-NOISE and NOISE-CON Congress and Conference Proceedings, Christchurch, New Zealand, 16–18 November 1998; Volume 1998, pp. 63–66. [Google Scholar]
  8. Jonasson, H.G. Determination of Emission Sound Pressure Level and Sound Power Level In Situ—Project SMT-C 96-2051; Number SP Report 1999:18; SP Swedish National Testing and Research Institute: Boras, Sweden, 1999. [Google Scholar]
  9. Probst, W. Checking of Sound Emission Values; Number Fb 851; Bundesanstalt für Arbeitsschutz und Arbeitsmedizin: Dortmund/Berlin/Dresden, Germany, 1999. [Google Scholar]
  10. Probst, W. Untersuchung der Einflussgrößen auf die Ermittlung der Emissionsschalldruckpegel von Maschinen [Investigation of the Quantities Influencing the Determination of the Emission Sound Pressure Levels of Machinery]; Number Fb 968; Bundesanstalt für Arbeitsschutz und Arbeitsmedizin: Dortmund/Berlin/Dresden, Germany, 2002. [Google Scholar]
  11. Probst, W. Improvements in the Determination of the Emission Sound Pressure Level of Machines; Number Fb 1034; Bundesanstalt für Arbeitsschutz und Arbeitsmedizin: Dortmund/Berlin/Dresden, Germany, 2004. [Google Scholar]
  12. Probst, W. Genauigkeit bei der Messung des Emissions-Schalldruckpegels von Maschinen; Number F 1970; Bundesanstalt für Arbeitsschutz und Arbeitsmedizin: Dortmund/Berlin/Dresden, Germany, 2008. [Google Scholar]
  13. Probst, W.; Sehrndt, G.A.; Lazarus, H. The local environmental correction for emission sound pressure level measurements in different room-source configurations. In Proceedings of the INTER-NOISE and NOISE-CON Congress and Conference Proceedings, Toronto, ON, Canada, 20–22 July 1992; Volume 1992, pp. 723–726. [Google Scholar]
  14. Lang, W.W. Progress in the development of international standards for determining sound power levels and emission sound pressure levels of noise sources. In Proceedings of the INTER-NOISE and NOISE-CON Congress and Conference Proceedings, Williamsburg, VA, USA, 2–5 May 1993; Volume 1993, pp. 319–322. [Google Scholar]
  15. Sehrndt, G.A. Accuracy of emission sound pressure levels. In Proceedings of the INTER-NOISE and NOISE-CON Congress and Conference Proceedings, Williamsburg, VA, USA, 2–5 May 1993; Volume 1993, pp. 367–372. [Google Scholar]
  16. Jonasson, H.G. Emission sound pressure level and local environmental correction. In Proceedings of the Baltic Nordic Acoustic Meeting (BNAM), Stockholm, Sweden, 20–22 June 2016. [Google Scholar]
  17. ISO 11202:2010/Amd 1:2020; Acoustics—Noise Emitted by Machinery and Equipment—Determination of Emission Sound Pressure Levels at a Work Station and at Other Specified Positions Applying Approximate Environmental Corrections—Amendment 1. International Organization for Standardization: Geneva, Switzerland, 2020.
  18. ISO 6926:2016; Acoustics—Requirements for the Performance and Calibration of Reference Sound Sources Used for the Determination of Sound Power Level. International Organization for Standardization: Geneva, Switzerland, 2016.
  19. ISO 6926:2016/Amd 1:2020; Acoustics—Requirements for the Performance and Calibration of Reference Sound Sources Used for the Determination of Sound Power Level—-Amendment 1. International Organization for Standardization: Geneva, Switzerland, 2020.
  20. Francois, P. Characteristics and calibration of reference sound sources. Noise Control Eng. J. 1977, 9, 6–15. [Google Scholar] [CrossRef]
  21. ISO 3744:2010; Acoustics—Determination of Sound Power Levels and Sound Energy Levels of Noise Sources Using Sound Pressure—Engineering Methods for an Essentially Free Field over a Reflecting Plane. International Organization for Standardization: Geneva, Switzerland, 2010.
  22. Brezas, S.; Wittstock, V. Study on the Properties of Aerodynamic Reference Sound Sources. Acta Acust. United Acust. 2019, 105, 960–969. [Google Scholar] [CrossRef]
  23. ISO 3746:2010; Acoustics—Determination of Sound Power Levels and Sound Energy Levels of Noise Sources Using Sound Pressure—Survey Method Using an Enveloping Measurement Surface over a Reflecting Plane. International Organization for Standardization: Geneva, Switzerland, 2010.
  24. Arendt, I. Reasons justifying a revision of the existing sound power measurement standards. In Proceedings of the INTER-NOISE and NOISE-CON Congress and Conference Proceedings, Hamburg, Germany, 21–24 August 2016; Volume 253, pp. 1967–1976. [Google Scholar]
  25. ISO 4871:1996; Acoustics—Declaration and Verification of Noise Emission Values of Machinery and Equipment. International Organization for Standardization: Geneva, Switzerland, 1996.
Figure 1. Photo of the model machine in the hemi-anechoic chamber in configuration I.
Acoustics 06 00010 g001
Figure 2. Photo of the model machine in the hemi-anechoic chamber in configuration II.
Acoustics 06 00010 g002
Figure 3. Sketch illustrating the measurement positions in relation to the model machine and its dominantly radiating areas (thicker line: open frame; short, even thicker line: circular opening). The measurements were performed at the following distances a from the surface of the machine: 0.5 m, 1.0 m and 1.25 m. The measurements were obtained at two heights of the measurement positions: 1.26 m and 1.55 m.
Acoustics 06 00010 g003
Figure 4. Photo illustrating the workroom that was used to test the effect of the changes in the amendment (view from the left corner).
Acoustics 06 00010 g004
Figure 5. Photo illustrating the workroom that was used to test the effect of the changes in the amendment (view from the right corner).
Acoustics 06 00010 g005
Figure 6. Former reverberation room with additional absorption at the walls and the ceiling (view in the direction of the door).
Acoustics 06 00010 g006
Figure 7. Former reverberation room with additional absorption at the walls and the ceiling (view from the door).
Acoustics 06 00010 g007
Figure 8. Photo of the workroom with the setup for the direct method to determine the equivalent absorption area.
Acoustics 06 00010 g008
Figure 9. Measured sound pressure level and determined emission sound pressure level of the model machine in configuration I (circular opening) at a distance of 0.5 m and heights of 1.26 m in (a) and 1.55 m in (b) in the workroom (see Table A1). “True” emission sound pressure level denotes the reference emission sound pressure level determined in BAuA’s hemi-anechoic chamber. The equivalent absorption area was determined using an RSS and the direct method (see Table 4).
Acoustics 06 00010 g009
Figure 10. Measured sound pressure level and determined emission sound pressure level of the model machine in configuration I (circular opening) at a distance of 1.0 m and heights of 1.26 m in (a) and 1.55 m in (b) in the workroom (see Table A2). “True” emission sound pressure level denotes the reference emission sound pressure level determined in BAuA’s hemi-anechoic chamber. The equivalent absorption area was determined using an RSS and the direct method (see Table 4). Red and bold numbers for workstations denote accuracy grade 3.
Acoustics 06 00010 g010
Figure 11. Measured sound pressure level and determined emission sound pressure level of the model machine in configuration I (circular opening) at a distance of 1.25 m and heights of 1.26 m in (a) and 1.55 m in (b) in the workroom (see Table A3). “True” emission sound pressure level denotes the reference emission sound pressure level determined in BAuA’s hemi-anechoic chamber. The equivalent absorption area was determined using an RSS and the direct method (see Table 4).
Acoustics 06 00010 g011
Figure 12. Measured sound pressure level and determined emission sound pressure level of the model machine in configuration II (open frame) at a distance of 1.0 m and heights of 1.26 m in (a) and 1.55 m in (b) in the workroom (see Table A4). “True” emission sound pressure level denotes the reference emission sound pressure level determined in BAuA’s hemi-anechoic chamber. The equivalent absorption area was determined using an RSS and the direct method (see Table 4). Red and bold numbers for workstations denote accuracy grade 3.
Acoustics 06 00010 g012
Figure 13. Measured sound pressure level and determined emission sound pressure level of the model machine in configuration II (open frame) at a distance of 1.25 m and heights of 1.26 m in (a) and 1.55 m in (b) in the workroom (see Table A5). “True” emission sound pressure level denotes the reference emission sound pressure level determined in BAuA’s hemi-anechoic chamber. The equivalent absorption area was determined using an RSS and the direct method (see Table 4). Red and bold numbers for workstations denote accuracy grade 3.
Acoustics 06 00010 g013
Figure 14. Measured sound pressure level and determined emission sound pressure level of the model machine in configuration I (circular opening) at a distance of 0.5 m and heights of 1.26 m in (a) and 1.55 m in (b) in the former reverberation room (see Table A6). “True” emission sound pressure level denotes the reference emission sound pressure level determined in BAuA’s hemi-anechoic chamber. The equivalent absorption area was determined using an RSS and the direct method (see Table 4).
Acoustics 06 00010 g014
Figure 15. Measured sound pressure level and determined emission sound pressure level of the model machine in configuration I (circular opening) at a distance of 1 m and heights of 1.26 m in (a) and 1.55 m in (b) in the former reverberation room (see Table A7). “True” emission sound pressure level denotes the reference emission sound pressure level determined in BAuA’s hemi-anechoic chamber. The equivalent absorption area was determined using an RSS and the direct method (see Table 4).
Acoustics 06 00010 g015
Figure 16. Measured sound pressure level and determined emission sound pressure level of the model machine in configuration I (circular opening) at a distance of 1.25 m and heights of 1.26 m in (a) and 1.55 m in (b) in the former reverberation room (see Table A8). “True” emission sound pressure level denotes the reference emission sound pressure level determined in BAuA’s hemi-anechoic chamber. The equivalent absorption area was determined using an RSS and the direct method (see Table 4).
Acoustics 06 00010 g016
Figure 17. Measured sound pressure level and determined emission sound pressure level of the model machine in configuration II (open frame) at a distance of 1 m and heights of 1.26 m in (a) and 1.55 m in (b) in the former reverberation room (see Table A9). “True” emission sound pressure level denotes the reference emission sound pressure level determined in BAuA’s hemi-anechoic chamber. The equivalent absorption area was determined using an RSS and the direct method (see Table 4).
Acoustics 06 00010 g017
Figure 18. Measured sound pressure level and determined emission sound pressure level of the model machine in configuration II (open frame) at a distance of 1.25 m and heights of 1.26 m in (a) and 1.55 m in (b) in the former reverberation room (see Table A10). “True” emission sound pressure level denotes the reference emission sound pressure level determined in BAuA’s hemi-anechoic chamber. The equivalent absorption area was determined using an RSS and the direct method (see Table 4).
Acoustics 06 00010 g018
Table 1. Distances of the work stations/measurement positions from the circular opening for different distances a of the measurement positions from the surface of the machine.
Pos. #Dist. fr. SurfaceDist. fr. SurfaceDist. fr. Surface
a = 0.5   m a = 1.0   m a = 1.25   m
d 1 ( m ) d 2 ( m ) d 1 ( m ) d 2 ( m ) d 1 ( m ) d 2 ( m )
Height, h = 1.26   m
10.921.091.411.56--
20.720.851.131.221.371.44
30.540.621.031.071.291.31
40.520.561.011.041.261.28
50.640.751.081.151.311.38
60.881.041.241.351.451.55
71.181.351.471.61.651.77
81.481.641.912.08--
Height, h = 1.55   m
10.941.111.411.57--
20.730.871.141.241.371.45
30.550.651.041.091.281.33
40.540.581.021.061.271.29
50.670.781.091.171.321.39
60.911.051.251.361.461.56
71.21.361.481.621.661.78
81.471.641.912.08--
Table 2. Distances of the work stations/measurement positions from the open frame for different distances a of the measurement positions from the surface of the machine.
Pos. #Dist. fr. SurfaceDist. fr. SurfaceDist. fr. Surface
a = 0.5   m a = 1.0   m a = 1.25   m
d 1 ( m ) d 2 ( m ) d 1 ( m ) d 2 ( m ) d 1 ( m ) d 2 ( m )
Height, h = 1.26   m
10.561.511.061.96--
20.511.2411.511.251.69
30.50.9511.291.251.5
40.50.8511.221.251.43
50.51.1311.421.251.61
60.591.441.041.681.281.84
70.821.751.191.961.412.1
81.062.061.532.48--
Height, h = 1.55   m
10.561.551.061.98--
20.51.2711.541.251.71
30.50.9911.321.251.52
40.50.911.251.251.45
50.51.0911.451.251.64
60.61.471.051.71.291.86
70.831.791.21.981.412.12
81.052.081.532.11--
Table 3. Equivalent absorption area of the workroom determined by three different test engineers with varying experience regarding room acoustics and acoustics in general. The most experienced engineer was test engineer 3. The results of test engineers 1 and 2 falsely indicated, at least compared to the results of the direct method, that the workroom was not suitable for determining the emission sound pressure level using ISO 11202. The corresponding environmental corrections for the sound power level K 2 A exceeded the limit of 7 dB even for a reference measurement surface with a measurement distance of 0.5 m.
 Test Eng. 1Test Eng. 2Test Eng. 3Arithmetic Mean
Mean sound absorp. coef. α ( 1 ) 0.150.150.300.20
Boundary surface, S V ( m 2 ) 174.0173.0174.3173.8
Resulting K 2 A ( dB ) (distance 0.5 m)7.17.14.96.4
Resulting K 2 A ( dB ) (distance 1 m)9.29.36.78.4
Equiv. absorption area, A ( m 2 ) 26.125.952.334.8
Table 4. Equivalent absorption area of the workroom and the former reverberation room using the direct method (see Equation (9)). Note that K 2 A determined according to ISO 3744:2010 [21] is not unambiguously “defined”. There are different methods to determine this quantity that can yield different results [24]. Nevertheless, both rooms—the workroom and the former reverberation room—were below the limit of K 2 A > 7   dB (where ISO 11202 cannot be used) for all methods that were used to determine this quantity. For the workroom, this was the case for the direct method (see Equation (9)), the estimation method with the result of test engineer 3 (see Equation (7)) and the absolute comparison test.
 WorkroomFormer Reverberation Room
Measurement surface, S ( m 2 ) 25.125.1
Average sound pressure level on the meas. surface, L p A ( in situ ) ( dB ) 81.1781.08
Sound power level of the RSS, L W A , RSS ( dB ) 90.6790.67
Resulting equiv. absorption area, A ( m 2 ) 55.297.7
Resulting K 2 A ( dB ) (distance 0.5 m)4.73.2
Resulting K 2 A ( dB ) (distance 1 m)6.54.7
“Direct” K 2 A ( dB ) (absolute comparison test)4.53.1
Table 5. Mean deviations, RMSD and maximum deviations observed when applying both the non-amended and the amended version of ISO 11202 in the workroom.
Distance a ( m ) Δ L p a , 1 ¯ ( dB ) Δ L p a , 2 ¯ ( dB ) RMSD   1 ( dB ) RMSD   2 ( dB ) Δ L p a , 1 , max ( dB ) Δ L p a , 2 , max ( dB )
Model machine in configuration I (circular opening)
0.5−0.03−0.140.370.42−0.8−1.1
1−0.15−0.300.430.52−1.0−1.2
1.25−0.22−0.320.450.52−0.8−1.0
1.0 & 1.25−0.18−0.310.440.52−1.0−1.2
All−0.11−0.250.420.49−1.0−1.2
Model machine in configuration II (open frame)
10.28−0.540.600.621.3−0.9
1.25−0.16−0.780.580.810.9−1.7
1.0 & 1.250.09−0.640.590.571.3−1.7
Table 6. Mean deviations, RMSD and maximum deviations observed when applying both the non-amended and the amended version of ISO 11202 in the former reverberation room.
Distance a ( m ) Δ L p a , 1 ¯ ( dB ) Δ L p a , 2 ¯ ( dB ) RMSD   1 ( dB ) RMSD   2 ( dB ) Δ L p a , 1 , max ¯ ( dB ) Δ L p a , 2 , max ¯ ( dB )
 Model machine in configuration I (circular opening)
0.50.140.030.340.310.80.6
10.03−0.070.360.39−0.8−1.0
1.250.05−0.020.320.330.7−0.7
1.0 & 1.250.04−0.050.340.36−0.8−1.0
All0.08−0.020.340.34−0.8−1.0
 Model machine in configuration II (open frame)
10.01−0.560.370.631.0−1.1
1.25−0.24−0.680.320.73−0.5−1.3
1.0 & 1.25−0.09−0.610.350.681.0−1.3
Disclaimer/Publisher’s Note: The statements, opinions and data contained in all publications are solely those of the individual author(s) and contributor(s) and not of MDPI and/or the editor(s). MDPI and/or the editor(s) disclaim responsibility for any injury to people or property resulting from any ideas, methods, instructions or products referred to in the content.

