Article

Matched Filter for Acoustic Emission Monitoring in Noisy Environments: Application to Wire Break Detection

1
Institut für Informationsverarbeitung, Leibniz Universitaet Hannover, 30167 Hannover, Germany
2
Institut für Massivbau, Technische Universitaet Dresden, 01219 Dresden, Germany
3
MKP GmbH, 30163 Hannover, Germany
*
Author to whom correspondence should be addressed.
Acoustics 2024, 6(1), 204-218; https://doi.org/10.3390/acoustics6010011
Submission received: 24 January 2024 / Revised: 9 February 2024 / Accepted: 16 February 2024 / Published: 20 February 2024

Abstract

:
Regular inspections of important civil infrastructures are mandatory to ensure structural safety and reliability. Until today, these inspections are primarily conducted manually, which has several deficiencies. In context of prestressed concrete structures, steel tendons can be susceptible to stress corrosion cracking, which may result in breakage of individual wires that is visually not observable. Recent research therefore suggests Acoustic Emission Monitoring for wire break detection in prestressed concrete structures. However, in noisy environments, such as wind turbines, conventional acoustic emission detection based on user-defined amplitude thresholds may not be suitable. Thus, we propose the use of matched filters for acoustic emission detection in noisy environments and apply the proposed method to the task of wire break detection in post-tensioned wind turbine towers. Based on manually conducted wire breaks and rebound hammer tests on a large-scale test frame, we employ a brute-force search for the most suitable query signal of a wire break event and a rebound hammer impact, respectively. Then, we evaluate the signal detection performance on more than 500 other wire break signals and approximately one week of continuous acoustic emission recordings in an operating wind turbine. For a signal-to-noise ratio of 0 dB, the matched filter approach shows an improvement in AUC by up to 0.78 for both, the wire break and the rebound hammer query signal, compared to state-of-the-art amplitude-based detection. Even for the unscaled wire break measurements originally recorded at the 12 m large laboratory test frame, the improvement in AUC still lies between 0.01 and 0.25 depending on the wind turbine noise recordings considered for evaluation. Matched filters may therefore be a promising alternative to amplitude-based detection algorithms and deserve particular consideration with regard to Acoustic Emission Monitoring, especially in noisy environments or when sparse senor networks are required.

1. Introduction

Nowadays, regular inspections of civil infrastructures are primarily conducted manually. Manual inspections of poorly accessible large infrastructures, such as offshore wind turbines, are time-consuming, hazardous, costy and often lead to undesired downtimes of the operating infrastructure. Furthermore, these manual inspections are often limited to visual examinations as part of a preventive maintenance strategy, so that minor damages remain unnoticed during inspection-free time periods. If those minor damages further grow in the meantime, the cost of repair increases dramatically, having a negative impact on the levelized cost of energy [1]. Therefore, with the rise and broad availability of cost-effective compute resources and storage media, the interest in automated structural health monitoring (SHM) solutions gained increasing interest. With regard to prestressed concrete structures, one specific problem is the breakage of individual wires in steel tendons due, for example, stress corrosion cracking [2,3,4]. Since this kind of damage is visually not observable, researchers investigated non-visual techniques originating from the field of non-destructive testing. First investigations on the applicability of time domain reflectometry, a method widely applied to fault detection and localization in, for example, telecommunication cables, are presented in [5,6]. Besides, numerous studies evaluated another electromagnetic technique referred to as magnetic flux leakage (MFL) to detect broken wires [7,8]. Even though, MFL is physically well-founded and especially sensitive to minor reduction in cross-sectional area of steel structures, its application to prestressed steel tendons in large civil infrastructures, such as wind turbines, is challenging due to the local magnetic field and hence the need to move the permanent magnet along the length axis of each single tendon, which is usually limited to external steel tendons. Due to these limitations, other research groups proposed the use of acoustic emission testing (AET), a passive non-destructive testing method that utilizes piezoelectric sensors to detect highly energetic structure-borne sound waves emitted during the fracture process of the steel wires. Some pioneer work of AET for wire break detection in prestressed concrete structures dates back to the late 90’s and early 2000’s [9]. In the following years, an extensive research project, that involved the installation of an acoustic emission measurement system on a real prestressed concrete bridge in Switzerland, lead to further insights regarding this application of AET [10,11]. More recently, different research groups pick up those findings and continue research in that field by collecting and analyzing even more experimental data. In [12], a detailed analysis of a comprehensive database of wire breaks manually conducted on different construction types of bridge girders is given. The authors conclude that for a reliable differentiation between wire break signals and background noise caused by the environment, the distance between individual acoustic emission sensors should not exceed approximately six meters. Similar sensor distances were also reported for a tunnel infrastructure in [13] and are supported by the findings regarding the geometric damping of high frequency acoustic emissions in [14]. However, the majority of studies related to wire break detection focuses on bridge infrastructures built in the second half of the twentieth century, when knowledge regarding corrosion effects on steel tendons was limited. But the increasing demand for renewable energies and the importance of wind energy in that sector also led to more economic constructions of wind turbine towers. So-called hybrid towers are one of these alternative construction types, which allow for the erection of wind turbine towers with large hub heights even in regions, where transportation capabilities are limited [15]. Nowadays, these constructions are of comparatively young age but as the lifespan progresses, breakage of single wires within the tendons may also become a security hazard for this type of infrastructure. A very first investigation on the geometric damping of acoustic emissions in external tendons with regard to applications in wind energy turbines was conducted in [16]. However, this study as well as most of the other aforementioned articles mainly focus on the characteristics of wire break signals and their damping behaviour to provide guidance regarding sensor distances that allow for a reliable detection of wire breaks by ensuring comparatively good signal-to-noise ratios. In more noisy environments, this may lead to dense sensor networks that are either not economic or not applicable due to geometric constraints. In a hybrid wind energy tower, for example, the installation of only a few sensors at the base and the tower head may be desired since mounting several sensors in low distances on each single tendon would result in dozens of sensors and hence make acoustic emission monitoring economically inefficient. In this work, we therefore propose the use of matched filters for acoustic emission monitoring of large civil infrastructures. We apply the proposed method to the specific task of wire break detection in post-tensioned steel tendons of wind turbine towers and evaluate the approach on more than 500 wire break signals and approximately one week of continuous acoustic emission recordings during the operation of a real wind turbine. The remainder of this article is structured as follows. In Section 2, we first describe the conducted wire break experiments on a large-scale laboratory test frame as well as the acoustic emission measurements in the operating wind turbine. Next, we give a brief introduction into matched filters and describe our approach with regard to the task of wire break detection in more detail. Finally, we close this section with a quick overview of an amplitude-based detection procedure and relevant metrics used for evaluation. In Section 3, we show some experimental results and corresponding findings followed by a detailed evaluation of the matched filter approach and its comparison with the previously introduced amplitude-based detection. The results are discussed and future research directions are highlighted in Section 4 and Section 5, respectively.

2. Materials and Methods

In the following Section 2.1, we first describe the acoustic emission measurements collected from laboratory experiments and an approximately 140-meter tall hybrid tower of an operating wind turbine. Section 2.2 continues with a detailed description of the proposed matched filter approach for wire break detection followed by a brief introduction of the basic amplitude-based detection, which is commonly implemented in commercially available AE systems. In Section 2.3, we close with an overview of some relevant metrics and data augmentation techniques used for evaluation.

2.1. Datasets

In this section, we describe the datasets of (i) long-term recordings within the concrete tower of an operating wind turbine (Section 2.1.1), (ii) manually conducted wire breaks in external post-tensioned steel tendons (Section 2.1.2) and (iii) rebound hammer impacts as a lightweight alternative to generate wire break-like AE signals (Section 2.1.3). All datasets are later utilized to evaluate the matched filter technique for acoustic emission detection in noisy environments.

2.1.1. Long-Term AE Monitoring in an Operating Wind Turbine

As part of a research project, we had access to a hybrid tower of an operating wind turbine with a hub height of approximately 142 m, in which we installed an AE measurement system with eight sensors. Four sensors (Model: Vallen VS30-SIC, Wolfratshausen, Germany) were installed on the transition piece at the top of the concrete part of the hybrid tower construction and another four sensors at the footing of the tower. Figure 1 depicts a cross-sectional view of the transition piece on the left and the footing on the right along with the positions of sensors that are later used for evaluation. In contrast to the laboratory experiments, described in the following sections, we here continuously recorded the environmental noise for a period of about one week. For all subsequent analyses and evaluations, we assume that no damage occured in the operating wind turbine within this period.

2.1.2. Wire Break Events in Post-Tensioned Steel Tendons

To investigate acoustic emissions due to wire breaks in post-tensioned steel tendons, a large-scale test frame with four post-tensioned steel tendons, each consisting of 30 single wires with a diameter of seven millimeters was built. The design of the anchor beams of the test frame and the selection of the steel tendons is based on a typical hybrid tower construction of wind energy turbines built by Max Bögl Wind AG. Figure 2 shows a technical drawing of the test frame together with some experimental details, such as sensor layout and wire break locations. Each tendon of the test frame was initially post-tensioned with approximately 700 kN. In total, 24 AE sensors were installed to capture AE signals resulting from the wire break experiments. As can be seen from Figure 2, the AE sensors were distributed on the anchor beams and the specific steel tendon under test. For economic reasons, the sensors on the anchor beams are of primary interest for the task of acoustic emission-based wire break detection and hence are in the focus of this study. These sensor positions remain unchanged throughout the experimental procedure on all four tendons. To account for the effect of the acoustic wave’s travel path between sensor and source, i.e., wire break location, the location for the manually conducted wire breaks was varied for each tendon. In each tendon, all 30 single wires were manually cutted using a small angle grinder. By carefully cutting each single wire separately and stopping the cutting process as soon as the cross-sectional area of the wire was significantly reduced, we were able to provoke numerous sudden wire breaks without any noise from the angle grinder. In total, we manually conducted 120 wire breaks in four steel tendons. For comparative reasons with the measurements from the tower structure of the real wind turbine (Section 2.1.1), we restrict the analysis to all wire break signals captured with sensors that are installed on the anchor beams and show a main sensitivity in the lower ultrasonic frequency range up to 80 kHz (Sensor Model: Vallen VS30-SIC). After eliminating saturated AE signals, we finally obtain a database of 294 wire break signals for the anchor beam representing a footing replica of a real wind turbine tower and 235 wire break signals for the anchor beam, whose design is a transition piece replica of a hybrid tower construction.

2.1.3. Rebound Hammer Impacts on Post-Tensioned Steel Tendons

In addition to those previously described wire break recordings, we also collected some AE signals due to rebound hammer impacts throughout our experiments. Those additional experiments are primarily motivated by [14] and related work in the field of acoustic emission-based wire break detection in steel tendons. Here, the authors observed some similarities between AE signals caused by rebound hammer impacts and those related to real wire break events. In this work, impulsive AE signals caused by rebound hammer impacts on Tendon T2, before the first wire break, are analyzed. Details regarding the location of the impact hammer tests are depicted in Figure 2. In total, 119 and 120 rebound hammer impact signals recorded on the transition piece and the footing replica, respectively, were examined.

2.2. Methodology

In the following, we now give a brief overview of matched filters and describe our approach to select a query signal for wire break detection based on the databases obtained from the laboratory experiments (Section 2.1.2 and Section 2.1.3). Afterwards, we briefly review the amplitude-based detection algorithm as it is implemented in most commercially available AE systems and used for comparison.

2.2.1. Matched Filter for Acoustic Emission Monitoring

Matched filters, whose fundamentals were layed in the mid of the twentieth century [17], already have a long history in digital signal processing and consequently have numerous applications in various disciplines, such as radar, digital communication and even biomedical signal processing [18]. Generally speaking, matched filters can be understood as a special technique for pattern recognition in one-dimensional signals. For two-dimensional data, such as images, a closely related method is referred to as template matching, a terminology, which, from our point of view, emphasizes even better the intent of this approach. Theoretically, the design of a matched filter requires specific knowledge about the signal whose occurrences shall be detected. Assuming the query signal Q n , that one is looking for, is known and the underlying noise W n is white, i.e., the autocorrelation of noise is the dirac delta distribution and its mean is zero, the optimal filter, which maximizes the signal-to-noise ratio (SNR), is known to have an impulse response h n Q that is the time-reversed version of the query signal Q n . Formally, this filter’s impulse response can be expressed by Equation (1) [19], where T denotes the number of samples of the query signal, i.e., its duration. Figure 3 depicts the effect of a matched filter on the signal-to-noise ratio in the previously described ideal case, where the detection of a known signal in white gaussian noise is desired.
h n Q = Q T n for n { 0 , 1 , , T }
Now, let Q n represent acoustic emission measurements caused by manual breakage of single wires of steel tendons (Section 2.1.2) or the impact of a rebound hammer (Section 2.1.3) and W n represent long-term AE measurements in an operating wind turbine (Section 2.1.1). In order to detect the presence of signals similar or equal to the query signal Q n within the data stream of noisy measurements W n , the cross correlation can be evaluated instead of convolving h n Q with W n . However, in contrast to other applications of matched filters, acoustic emission (AE) monitoring scenarios usually do not fulfill the aforementioned theoretical requirements. The query signal, for example, is not known beforehand since it is influenced by the characteristics of the source signal and the location-dependent transfer function of the structure under test, i.e., the wave’s travel path. Nonetheless, given a comprehensive database of rebound hammer impacts D r h recorded on the structure under test itself or some experimental wire break events D w b , recorded on a laboratory test structure similar to the one considered for permanent deployment of the AE system, we suggest that a suitable query signal can be found in the databases of either wire breaks D w b or rebound hammer impacts D r h . In the following, those aforementioned databases are assumed to be represented as matrices, in which rows represent the different AE signals and columns hold the measured amplitudes at discrete time intervals Δ t . For the rest of this section, we will not further distinguish D r h and D w b and universally write D , when either one of them is meant. Empowered by constant improvement in compute power during the last two decades, we conduct a brute-force search to find a suitable query signal Q n from our databases of AE signals D collected in the laboratory experiments and peak normalized for further processing. Each row of D represent one candidate for the query signal Q n . Assuming that our design of the test frame is comparable to the construction of the real wind tower as intended throughout the design process and that the structure-borne sound paths can be considered to fullfil the properties of a linear system, each of the wire break signals of D w b can be superimposed with an arbitrary, but representative noise segment W n to generate a database of wire breaks in a realistic environment D w b ¯ . Next, we cross-correlate any candidate query signal q i , · from D with any noise-contaminated wire break signal w k , · from D w b ¯ and save the absolute maximum of that new signal in a matrix element C i , k according to Equation (2), where S is a scale factor and x simply denotes the number of samples of any signal x. To finally obtain the best-suited query signal Q n from the set of candidates, we then calculate the first 10-quantile for each row ( C i , · ) 0.1 and apply the arg max -function on the resulting vector p k (Equations (3)–(5)).
C i , k max 0 m M 2 1 S n = 0 D i , · 1 D i , n · D ¯ w b k , n m + N 1 with N = max ( D i , · , D ¯ w b k , · ) , M = ( D i , · + D ¯ w b k , · ) i { 0 , 1 , 2 , , D · , 0 1 } , k { 0 , 1 , 2 , , D w b · , 0 1 }
p k ( C k , · ) 0.1 k { 0 , 1 , 2 , , C · , 0 1 }
j arg max 0 k p p k
Q n D j , n n { 0 , 1 , 2 , , D j , · 1 }

2.2.2. Amplitude-Based Detection

As a reference method, we implemented a simple amplitude-based detection, which is the state-of-the-art method for acoustic emission detection in most commercially available AE systems, like the AMSY-6 from Vallen Systeme GmbH that we used for our experiments [20]. This simple method utilizes user-defined amplitude thresholds and detects any AE event that crosses that amplitude threshold at least once. Additionally, some secondary parameters such as the so-called hit lockout time (HLT) and hit definition time (HDT) need to be set [21]. However, these parameters are primarily used to avoid detections of early reflections of AE events and to separate several AE hits that occur within a short time period. Figure 4 depicts the aforementioned parameters on a time-amplitude diagram of an exemplary AE event.

2.3. Evaluation

To evaluate our proposed matched filter approach for acoustic emission detection in noisy environments, we make use of the well-known receiver operating characteristic (ROC), which plots the rate of false positive and true positive detections against each other. The area under this curve, often abbreviated as AUC, is a quantitative measure of performance for binary classification or detection tasks. To obtain a suitable number of discrete points for the ROC curve, we extract the maxima of the cross-correlations between the previously determined query signal Q n and all other noise contaminated wire break signals D w b ¯ , which are stored in the j-th row of the matrix C (see also Section 2.2.1). Then, we calculate the empirical p-quantiles of those cross-correlation maxima for all p { 0.0 , 0.05 , 0.10 , , 1.0 } and use each of these values as a detection threshold for processing the datastream obtained from cross-correlating the query signal Q n with the operational recordings from Section 2.1.1. For comparison with the state-of-the-art amplitude-based detection, we similarly estimate the p-quantiles of the amplitude thresholds from the original database of wire break signals D w b and process the raw operational recordings with these amplitude thresholds. Finally, we obtain equidistant discrete points on the ROC curve for each method and can estimate AUC by numerical integration using trapezoidal rule. Since the large-scale experimental test frame and the resulting distances between sensor and AE source, i.e., wire break event, are still small compared to the heights of a real wind turbine tower, we also investigated different signal-to-noise ratios by scaling each wire break signal from the database D w b to the noise power of a segment of operational recordings W n . Let P W and P i D denote the power of the noise segment and the i-th wire break signal of the previously introduced database D w b , respectively. Then, a scaled version of this database D w b k d B can be obtained by Equation (8), where k d B is the desired signal-to-noise ratio in decibel. Figure 5 shows an example of a wire break signal embedded in environmental noise recorded during the operation of a wind turbine for different signal-to-noise ratios.
P W = 1 N n = 0 N 1 W n 2
P i D = 1 N n = 0 N 1 D w b i , n 2 D w b i , n k d B 10 M M k d B / 10 · P W P i D · D w b i , n i { 0 , 1 , , D w b · , 0 1 } ,
n { 0 , 1 , , D w b i , · 1 }

3. Results

To further motivate the use of matched filters for the detection of signals of specific signal sources in acoustic emission monitoring of large civil infrastructures, we first provide some analysis results of the laboratory wire break experiments and the AE measurements recorded in the operating wind turbine. Here, we focus on the geometric damping of the signal’s amplitude to show that for an economic network with an affordable number of AE senors on large infrastructures, the detection of signals in the presence of noise is indeed a fundamental challenge. In subsequent subsections, results of the earlier introduced matched filter approach are presented and compared with a simple state-of-the-art amplitude-based detection of AE signals described in Section 2.2.2.

3.1. Attenuation of Wire Break Signals & Environmental Noise Level

Based on the laboratory experiments, we analyzed the attenuation of the signal’s amplitude for specific sensor and source positions. From Figure 6, a significant decrease in the signal’s amplitude with respect to the distance between sensor and acoustic source location can be observed for a sensor mounted on the transition piece replica of the test frame. For the footing replica, such an obvious decrease in amplitude with increasing distance to the signal’s source is not observed. However, the measured maximum amplitudes of the wire break signals are generally lower compared to the amplitudes measured at the transition piece replica. A possible explanation for the lower amplitudes at the footing replica might be the more complex path of the structure-borne sound waves, which need to travel from the tendon in the anchor rods that are fastened at the anchor beam’s side opposite to the acoustic emission sensors. In contrast to the anchorage at the transition piece replica, the waves also need to travel back through the massive concrete beam to reach the AE sensors. Another aspect might be the different surface material, on which the AE sensors are mounted. On the transition piece replica, there is one 50 mm thick steel plate that covers the anchor positions of all four tendons and possibly shows better acoustic properties than the uncovered, raw concrete beams at the footing replica. In this work, we consciously considered only sensors on the anchor beams, since these sensor positions are the only ones that are generally able to monitor multiple tendons simultaneously and are therefore the means of choice with regard to a permanent monitoring of a wind turbine tower. A separate sensor on each tendon would result in an AE monitoring system with numerous sensors and would therefore be economically unfeasible. Since the number of sensors is limited and does not allow a meaningful regression analysis that can be used to extrapolate to distances, i.e., signal path lengths, of a real wind turbine tower, we only provide some statistical results on the damping behaviour for Sensor Acoustics 06 00011 i001
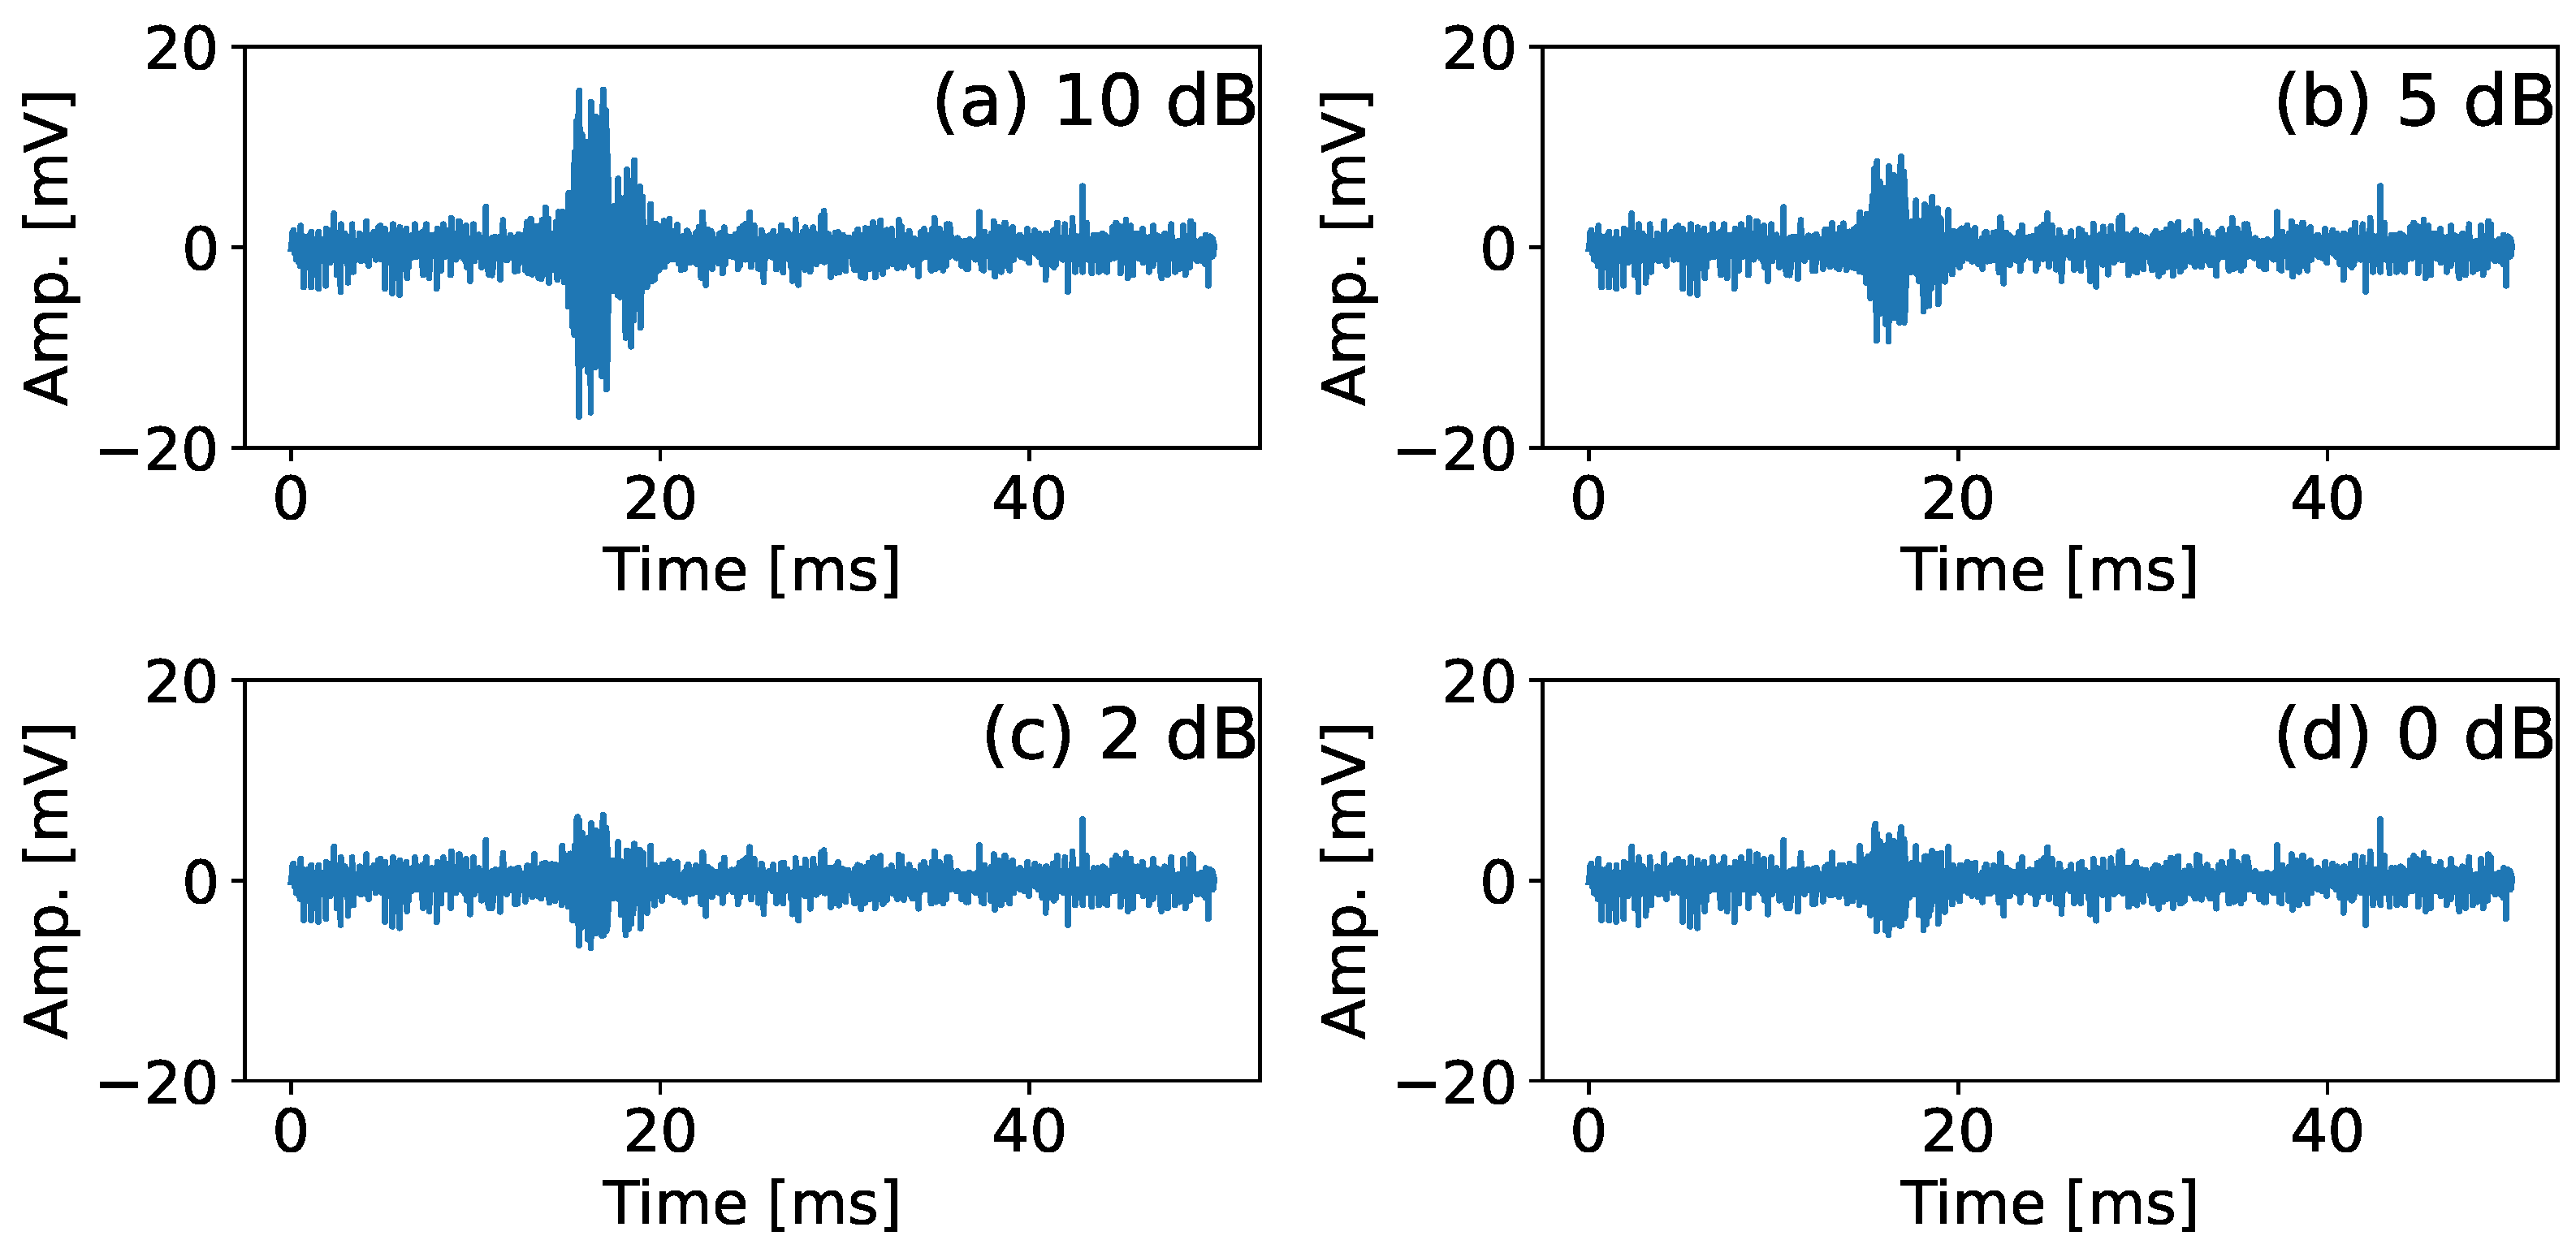
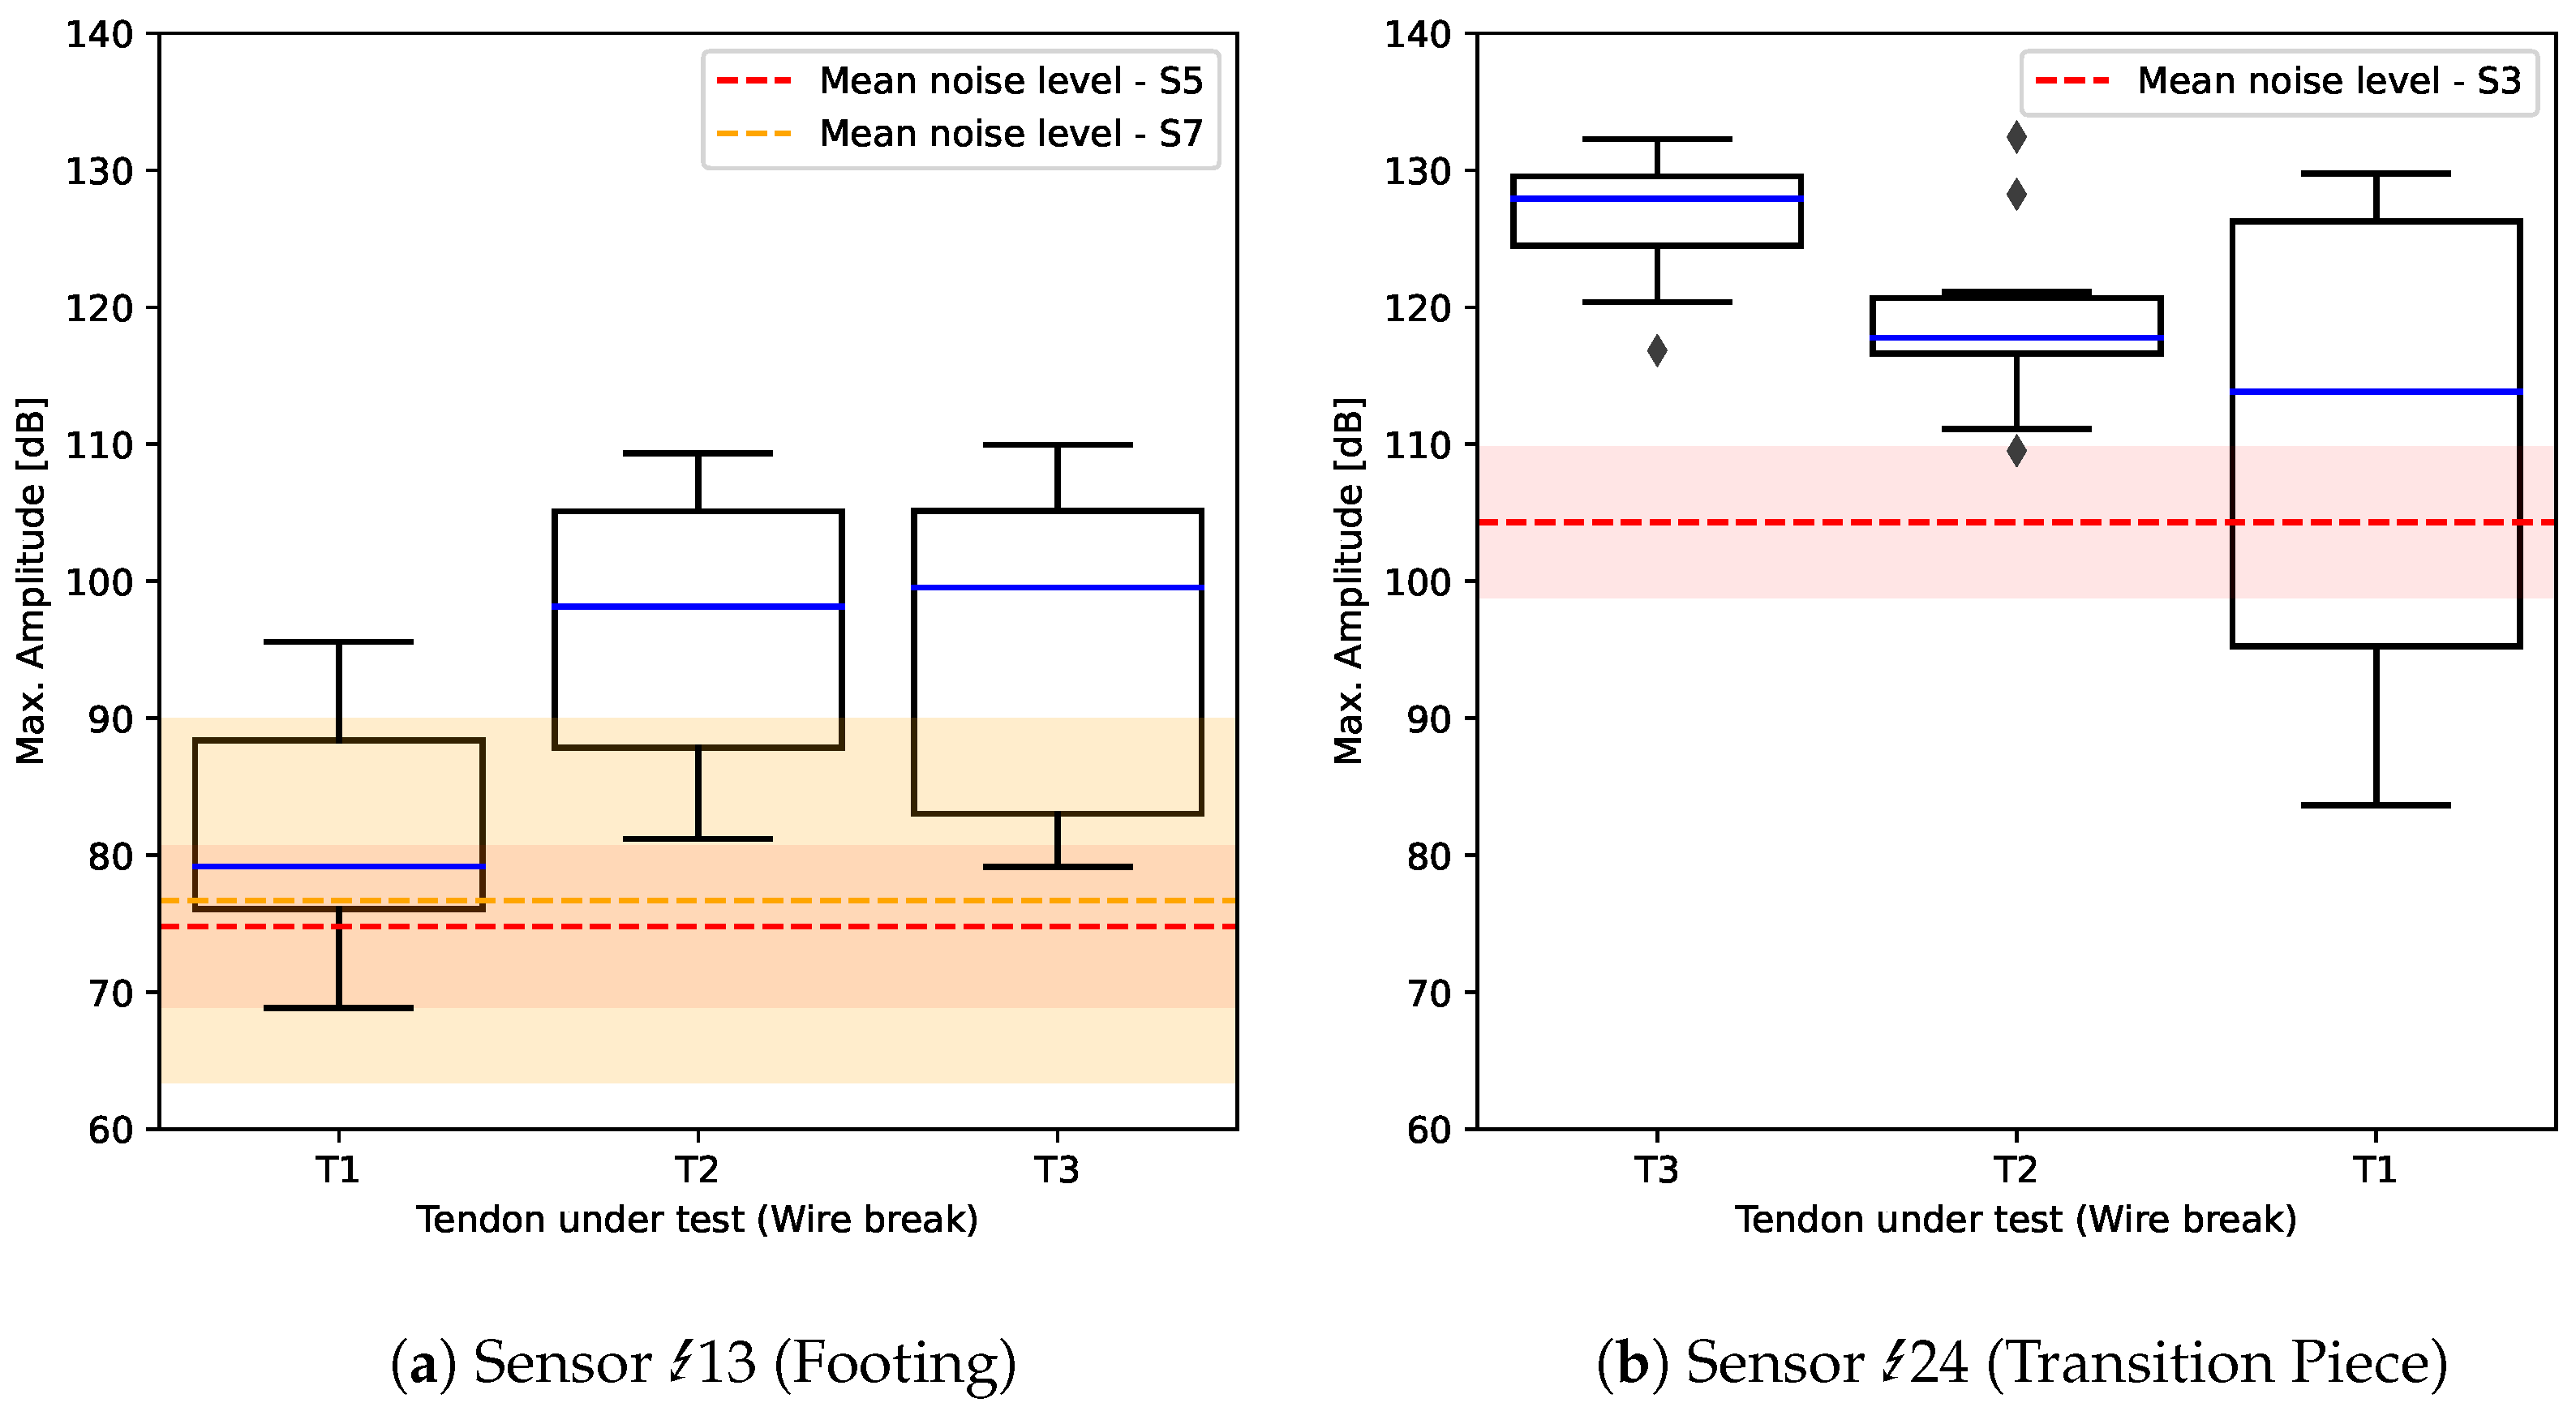
24 installed on the transition piece replica (see Table 1). Even though we also observe an increase in amplitude for single wire break events here, an average decrease in the signal’s amplitude of approximately seven to eight dB is estimated for both, the wire break signals originating from the experiments on Tendon T3 and T2 as well as Tendon T2 and T1. Considering the observed background noise in the operating wind turbine summarized in Table 2, wire breaks occuring on the free span length of external tendons may indeed result in acoustic emission signals with a low SNR for sensors mounted on the footing or the transition piece of a wind turbine tower. Hence, the investigation of alternatives to conventional amplitude-based detection is of specific interest for acoustic emission monitoring applications on large civil infrastructures.

3.2. Evaluation of Matched Filter for Wire Break Detection

In this section, we provide first results for the matched filter approach. The query signals that we used here are specific wire break or rebound hammer signals D i , · taken from the database obtained from the laboratory experiments and selected as described in Section 2.2.1. In real application scenarios, however, wire break signals from laboratory experiments might not be available to guide the selection process for the most suitable query signal. Therefore, we also modified the selection procedure by replacing the arg max -function in Equation (4) with the arg min -function to evaluate the performance of the approach in terms of a badly chosen query signal. In case of the rebound hammer query signal, this allows us to account for scenarios, where no wire break signals are available for the selection process, but suitable query signals due to rebound hammer impacts can be acquired directly on the structure under test during the installation of the AE monitoring system. The selected query signals using arg max - (best) and arg min -function (worst) are depicted in Figure 7.
Even though we conducted those wire break experiments on a comparatively large test frame, laboratory experiments are somehow always limited to represent real structures or a part of it in a certain scale. Due to the observed damping behaviour even for these relatively short distances, we therefore scaled the dataset of wire breaks from the laboratory experiments according to Equation (8) and evaluated our matched filter for all these different signal-to-noise ratios. For completeness, the results of the unscaled version of wire breaks are provided as well. Figure 8 exemplary shows the ROC curves determined using one week of operational recordings from sensor Acoustics 06 00011 i002
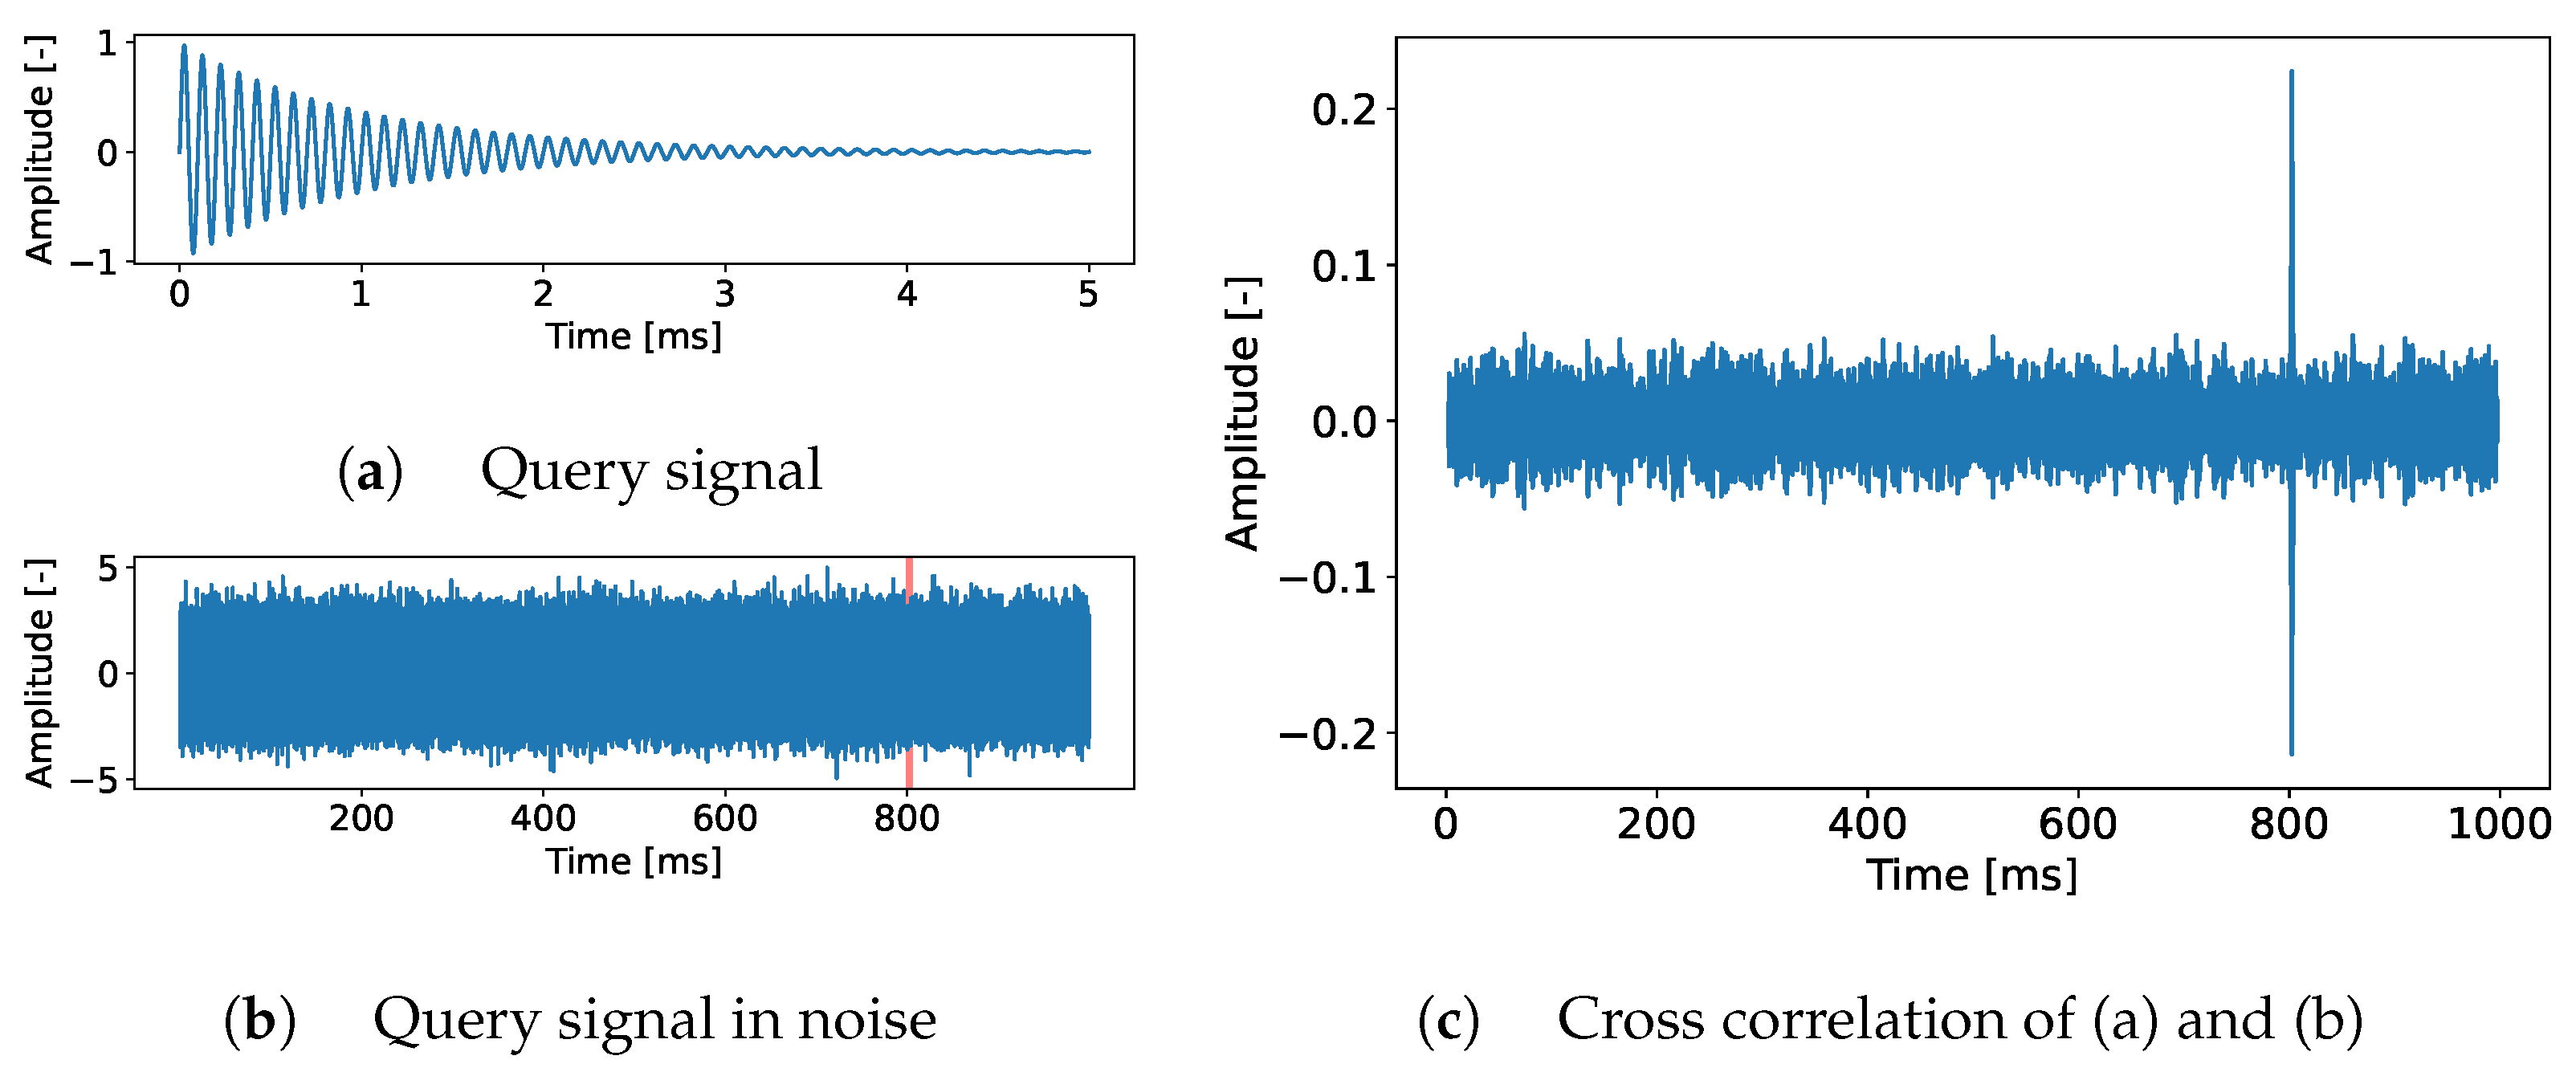
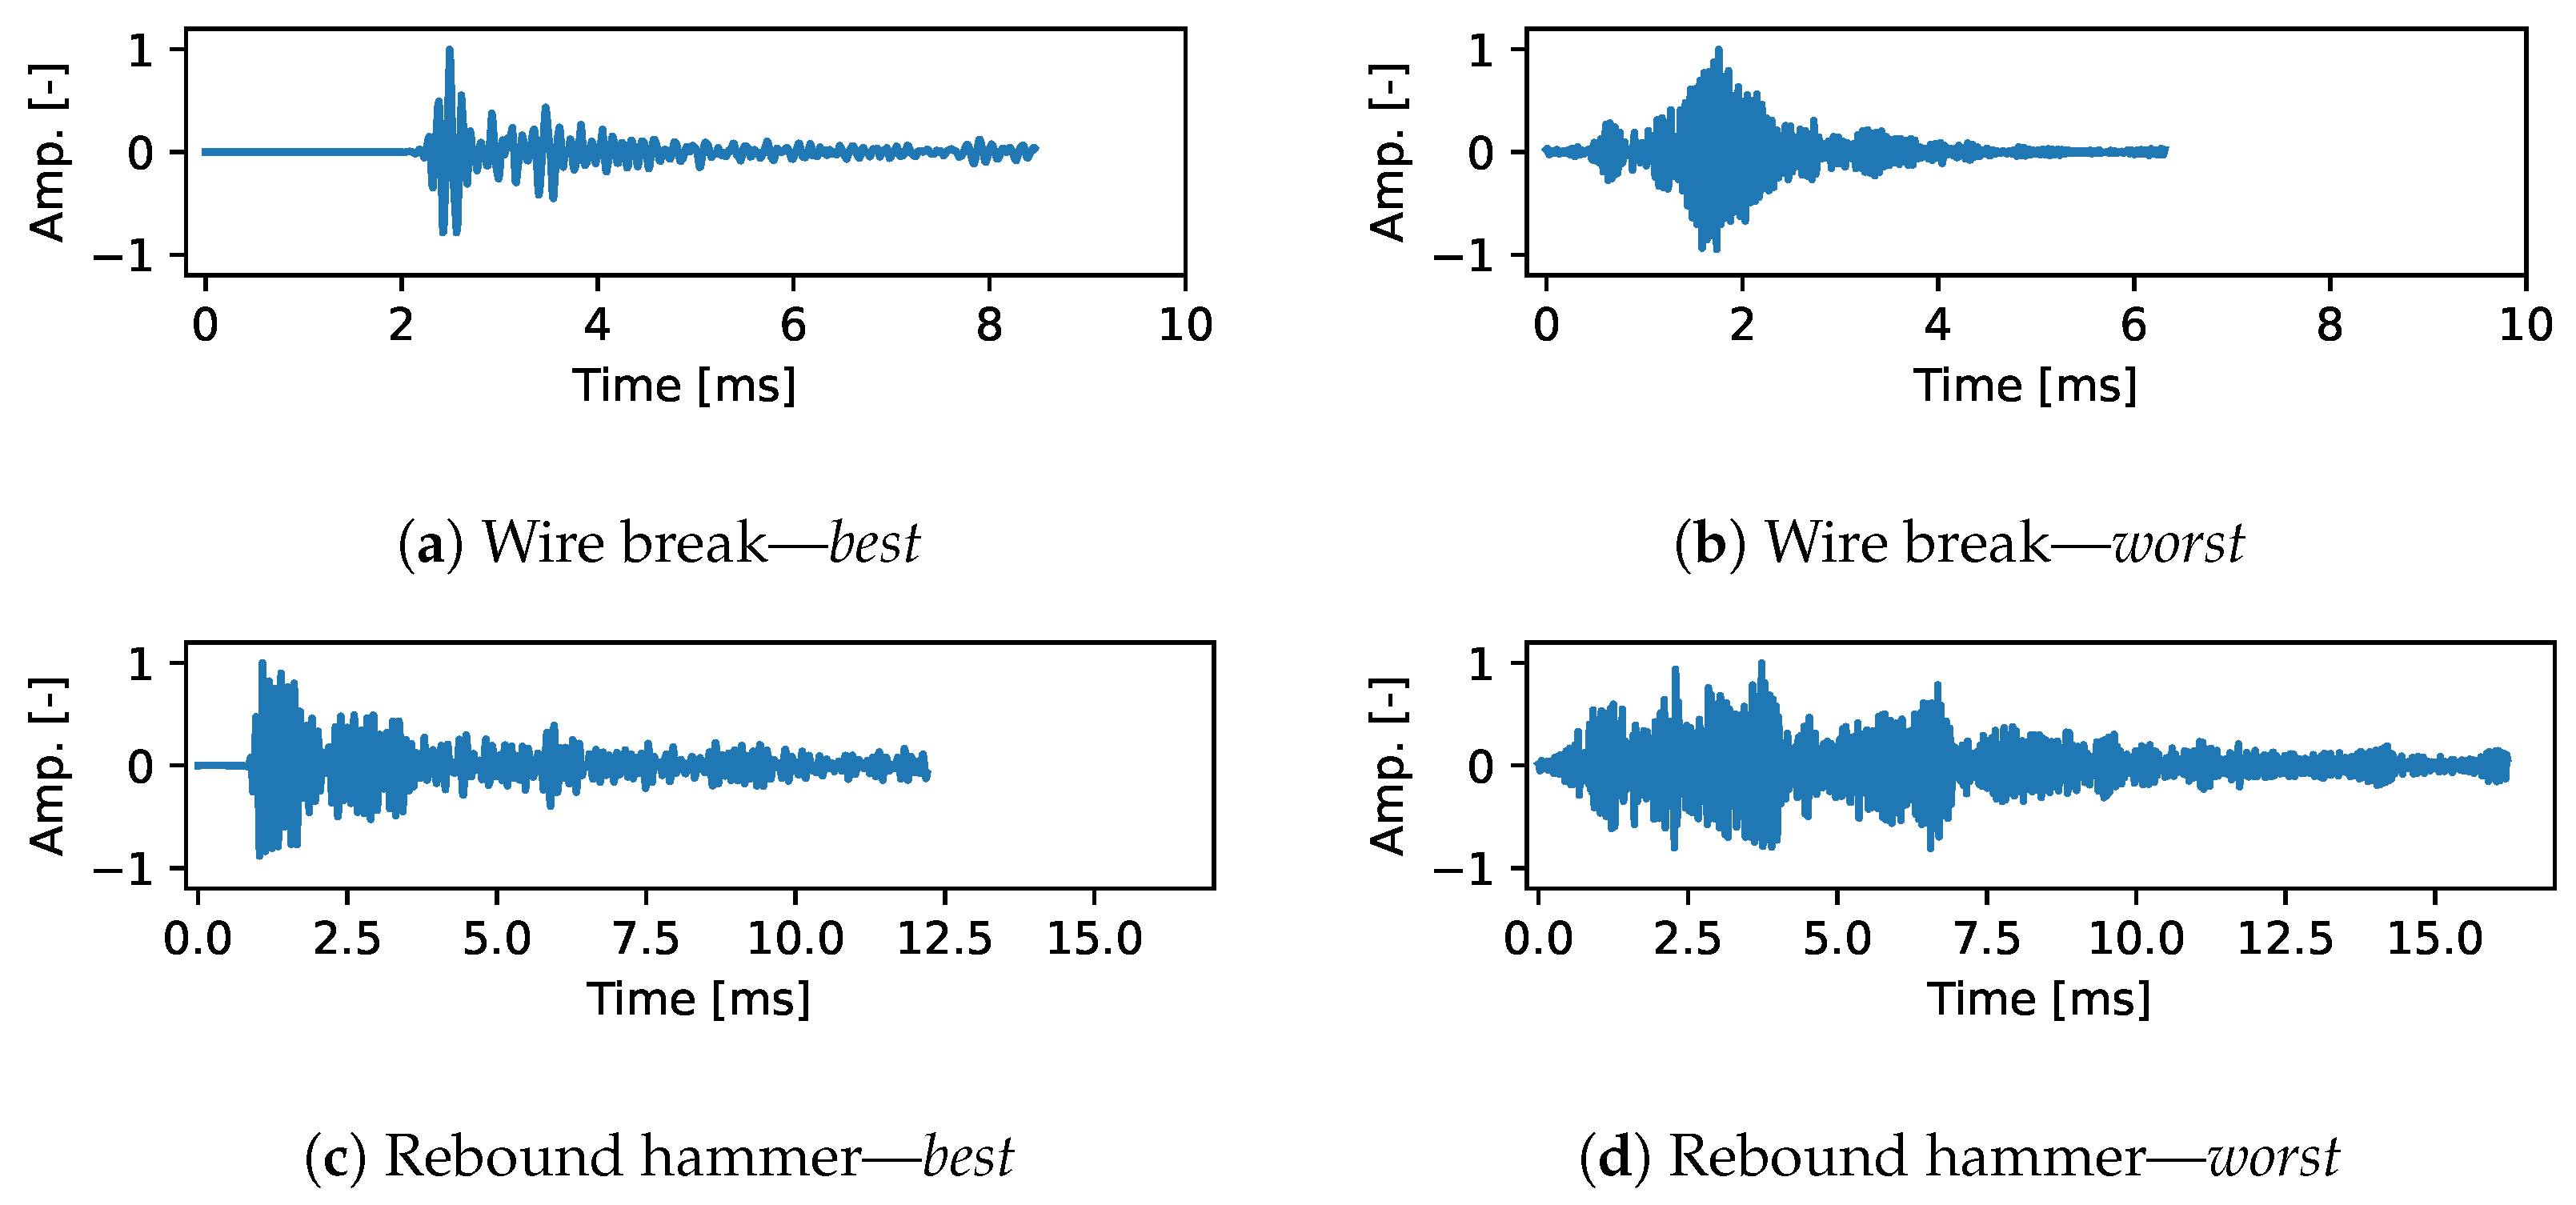
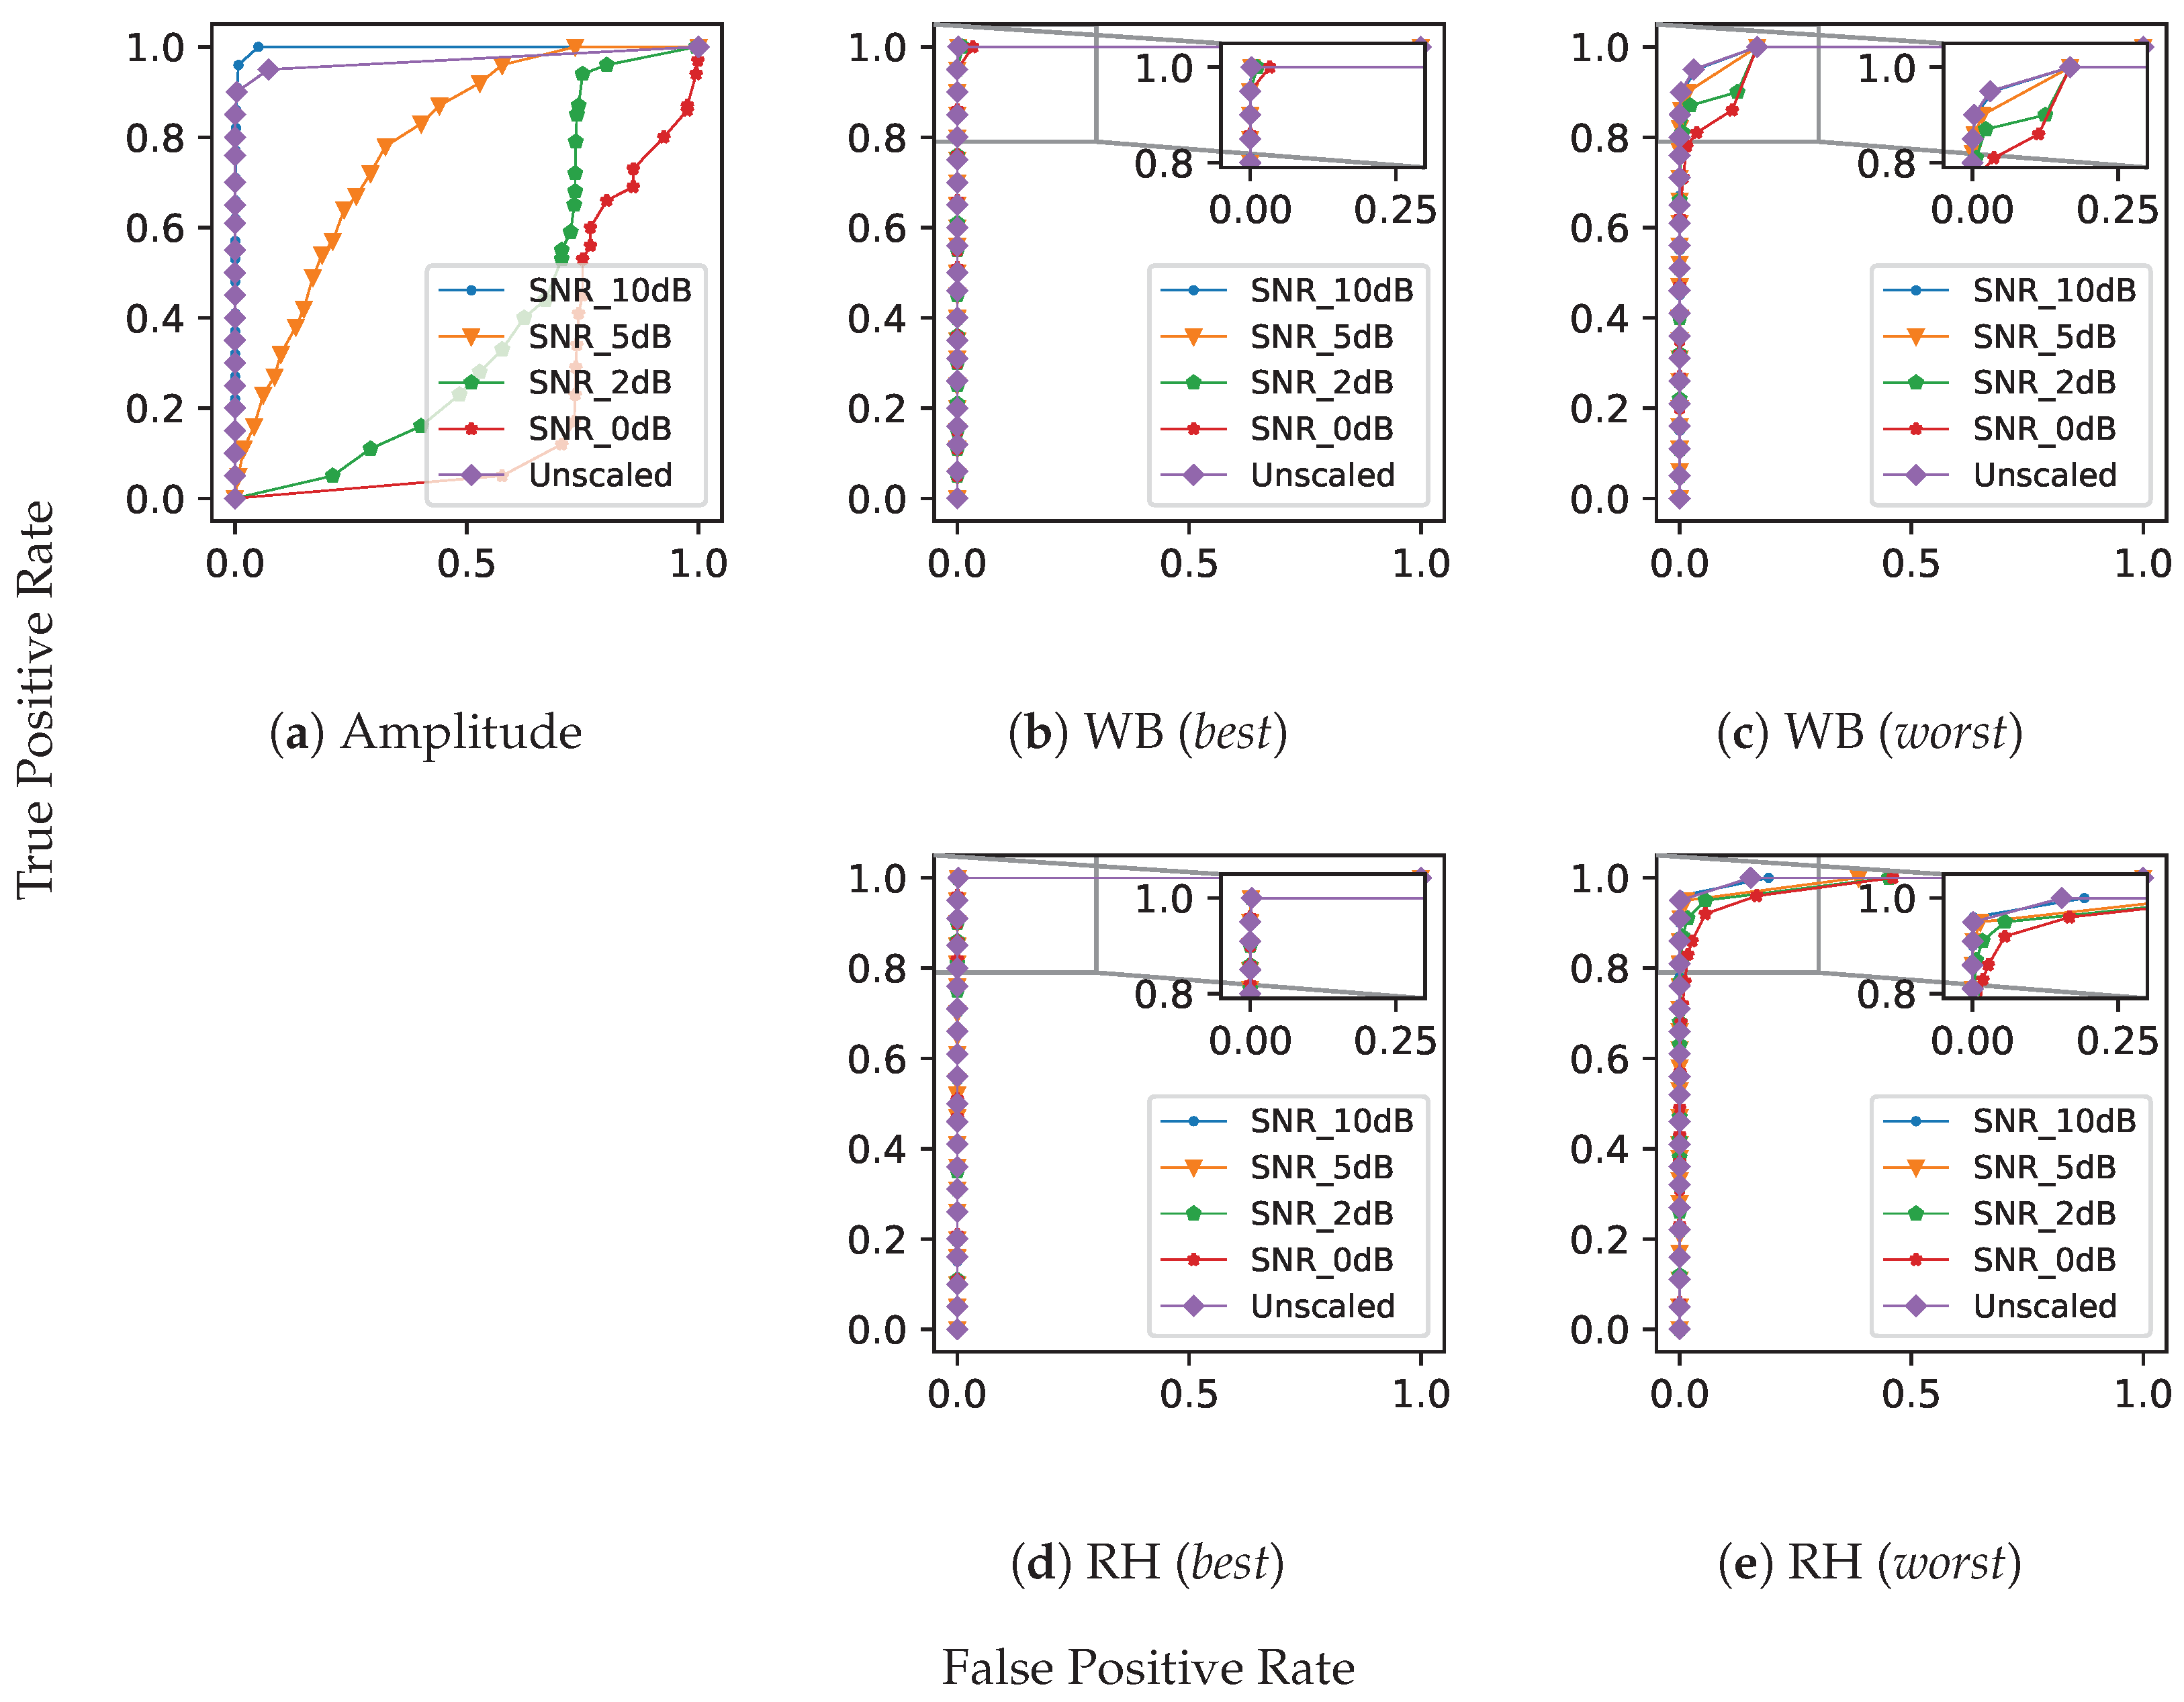
5 installed in the wind turbine tower and the wire break signals recorded at the footing replica of the laboratory test frame. The different subfigures depict the results for the different query signals shown in Figure 7 and selected as described previously.
For the best suited query signal, the matched filter shows even for very high true positive rates around 0.95 and low signal-to-noise ratios of 0 dB just a very few false positive detections below five false alarms per day. However, in the worst scenarios, i.e., when no optimization of the query signal is performed, false alarms can be triggered up to 30 times a minute. Hence, the selection of a suitable query signal based on a database of wire break signals is a crucial step and particular important for the performance of the matched filter approach.

3.3. Comparison with Amplitude-Based Detection

As previously mentioned, we also implemented an amplitude-based detection as it can be often found in modern commercially available AE measurement systems. Similarly to the evaluations of the matched filters, we also investigated different SNRs for this detector by scaling the wire break signals before extracting the maximum amplitudes. The ROC curves for this detector evaluated on one week of AE measurements from sensor Acoustics 06 00011 i0025 installed at the operating wind turbine and the wire break signals recorded at the footing replica during the laboratory experiments are also presented in Figure 8. For a more detailed comparison of the different detection techniques, the AUC values for both, the matched filter approach and the amplitude-based detection are presented in Table 3. The last column of these tables show the increase in AUC between the matched filter approach and the amplitude-based detection.
As expected, the matched filter approach shows its strength especially for low signal-to-noise ratios meaning its application is particularly useful when weak damage signals due to attenuation effects or very noisy environments are expected. While there is a remarkable increase in AUC between 0.27 and 0.78 for signal-to-noise ratios of 2 dB and lower, we even observed a not negligible gain in performance of about 0.01 to 0.25 for the superposition of unscaled wire break signals from the laboratory experiments and the original measurements collected at the operating wind turbine. The small drop in terms of AUC with increasing SNR, which always lie below 0.06, further underlines the robustness of the matched filter approach under varying SNR compared to the detection based on user-defined amplitude thresholds. Besides, the differences in AUC for the amplitude-based detection under higher SNR across different sensor measurements from the operating wind turbine should be noted, particularly for sensors Acoustics 06 00011 i0023, Acoustics 06 00011 i0025 and sensor Acoustics 06 00011 i0027. These significant differences can be attributed to single amplitude spikes within the raw measurements of sensor Acoustics 06 00011 i0027, which causes high false positive rates using amplitude-based detection. The matched filter approach, however, seems to handle these kind of anomalies comparatively good, showing only a slight decrease in the AUC scores.

4. Discussion

In many applications of acoustic emissions within the field of non-destructive testing and structural health monitoring, the analysis of acoustic emissions can usually be condsidered as a two-stage approach. First, the raw recordings of structure-borne sound acquired by the acoustic emission sensors need to be preprocessed in a way that background noise is filtered out and only acoustic emissions that might be of further interest are extracted and saved to a database for further analysis. Often, this extraction of suspicious acoustic emissions is done during the acquisition process by setting a user-defined amplitude threshold that lies above the level of background noise. Due to the high sampling rates especially in ultrasonic acoustic emissions which is the most prevalent form of acoustic emission testing, this extraction during the acquisition phase is of specific interest to keep the amount of data manageable and reduce costs for storage devices. In typical application scenarios of AET, the analysis of previously extracted short acoustic emission signals is then carried out in a subsequent step. Depending on the problem at hand, different analysis strategies can be considered ranging from cumulative AE energy analysis as it is often done in the field of materials research [22] to a more detailed analysis of specific signals as it is necessary, for example, in wire break recognition. In the latter application scenario, the second step involves a classification of different acoustic emission signals recorded during the acquisition phase. This classification step can be carried out in many different ways using parameter-based as well as signal-based analyses as described in [23] in conjunction with a rule-based system or data-driven algorithms previously trained on dedicated datasets [24]. This two-stage approach of (i) AE signal extraction and subsequent (ii) classification might work well under laboratory conditions or in environments where the energy of the overall background noise can be implied to be lower than the AE signal’s energy. However, it has its limitations especially in monitoring applications of civil infrastructures, where the influence of environmental and operational conditions may result in varying, often higher background noise. Additionally, those applications often demands for a low number of sensors so that even signal sources that are expected to have a high energy release might result in weak signals due to geometric damping. In these cases, when the signals tend to be buried in noise, the separation of the two steps (i) extraction and (ii) classification might not be feasible or at least requires more sophisticated signal processing techniques to work well. For a specific problem at hand, the combination of extraction and classification in a single algorithm is, however, not really disadvantageous as long as the detection of the desired signals is reliable enough for the specific use case. Therefore, we here introduced the use of matched filters for damage detection in structure-borne sound recordings, which are one particular method that allows the combination of processing raw structure-borne sound recordings and classifying the acoustic emissions. Due to their theoretical properties with regard to enhancement of signal-to-noise ratios, matched filters allow for a more reliable detection in noisy environments, such as wind turbines, and therefore deserve serious consideration in monitoring applications where sparse sensor networks, i.e., larger distances between single acoustic emission sensors are desired. Our results show that the matched filter approach for AE signal detection is quite robust showing significantly higher AUC scores for a wide range of signal-to-noise ratios compared to the amplitude-based detection. Due to the comparatively low number of false positive alarms even for high true positive rates above 90%, the matched filter approach may therefore even circumvent subsequent classification steps commonly applied to postprocess the database of AE detections from the preliminary detection step. However, a downside of the matched filter approach is the availability and selection of a suitable query signal which generally requires experimental measurements that are in close agreement with the signals that are expected to appear in the applied monitoring phase. In Section 3.2, we showed that the selection of a suitable query signal is of particular importance for the matched filter approach. However, wire break signals from a similar structure are usually not available in real applications and, hence, cannot be used to select a suitable query signal. Therefore, future research should address the question how to guide the selection process, when wire break signals from a similar structure are not available. The acquisition of suitable candidate query signals, however, is shown to be not an issue, since signals from non-destructive rebound hammer impacts show comparable results to actual wire break query signals. Such impact tests can be recorded during the installation of any monitoring system. With regard to safety critical applications, it should be further noted that an immediate more in-depth analysis of any detected signal by a human expert (human-in-the-loop) might require further post processing steps like denoising [25,26], when the signal-to-noise ratio is low.

5. Conclusions

In this work, we addressed the issue of low signal-to-noise ratios in acoustic emission analysis, especially in acoustic emission monitoring. By looking at the specific problem of wire break detection in wind turbine towers, we illustrate the problem that could arise in monitoring applications of large civil infrastructures, when the environmental noise is not negligible and a sparse network of acoustic emission sensors is desired. In this context, we show that matched filters might be a suitable alternative to the commonly applied two-stage approach of AE signal extraction and subsequent classification. Compared to a simple amplitude-based detection, the matched filter approach shows an improvement in AUC up to 0.78 for the lowest SNR. As expected, the matched filter approach shows its strength and is particular useful, when weak acoustic emissions need to be found in comparatively noisy recordings. However, it should be noted that the application of matched filters requires the availability of a suitable query signal and is therefore limited to applications, where a database of reference signals, e.g. from laboratory experiments, is available. Further, this database must be in some way comparable to the AE signals that are expected to occur on the real structure that shall be monitored. This means that not only the source signal should be similar but also the structural design of the laboratory test specimen. For the specific task of wire break detection, however, we also investigated the use of rebound hammer impacts and found that this source mechanism may be also used to generate suitable query signals. Those kinds of experiments should be rather easy and inexpensive, even when conducted on the real structure that shall be monitored afterwards.

Author Contributions

Conceptualization, A.L.; methodology, A.L.; software, A.L.; data curation, A.L., R.X. and M.K.; writing—original draft preparation, A.L.; writing—review and editing, A.L., R.X. and M.K.; visualization, A.L, R.X. and M.K.; supervision, J.O. and S.M.; project administration, J.O. and S.M.; funding acquisition, A.L, M.K., J.O. and S.M. All authors have read and agreed to the published version of the manuscript.

Funding

This research was funded by German Federal Ministry for Economic Affairs and Climate Action under grant number 03EE2025B. The APC was funded.

Data Availability Statement

The original contributions presented in the study are included in the article, further inquiries can be directed to the corresponding author.

Conflicts of Interest

Author Max Kaeding was employed by the company MKP GmbH. The remaining authors declare that the research was conducted in the absence of any commercial or financial relationships that could be construed as a potential conflict of interest.

References

  1. Mishnaevsky, L., Jr.; Thomsen, K. Costs of repair of wind turbine blades: Influence of technology aspects. Wind Energy 2020, 23, 2247–2255. [Google Scholar] [CrossRef]
  2. Schacht, G.; Käding, M.; Bolle, G.; Marx, S. Konzepte für die Bewertung von Brücken mit Spannungsrisskorrosionsgefahr. Beton- und Stahlbetonbau 2019, 114, 85–94. [Google Scholar] [CrossRef]
  3. Nürnberger, U.; Beul, W. Untersuchungen an Verkehrsbauten aus Spannbeton zur Abschätzung des Gefährdungspotentials Infolge Spannungsrißkorrosion der Spannstähle. Teil 2-Untersuchungen der FMPA: Abschlußbericht zum BMV-Forschungsvorhaben FE 15.209 R91D (FMPA-Nr. 34-10566); Bundesanstalt für Materialforschung und-prüfung (BAM): Berlin, Germany, 1994. [Google Scholar]
  4. Scheerer, S.; Hampel, T.; Curbach, M. Überprüfung des Risikos der Spannungsrisskorrosion (SpRK) von Hennigsdorfer Spannstahl für den Produktionszeitraum bis 1993; Forschungsbericht; Institut für Massivbau und Otto-Mohr Laboratorium der TU Dresden: Dresden, Germany, 2012. [Google Scholar]
  5. Liu, W.; Hunsperger, R.; Folliard, K.; Chajes, M.; Barot, J.; Jhaveri, D.; Kunz, E. Detection and characterization of corrosion of bridge cables by time domain reflectometry. In Proceedings of the SPIE Conference on Nondestructive Evaluation Techniques for Aging Infrastructures and Manufacturing, Newport Beach, CA, USA, 3–5 March 1999; Volume 3587. [Google Scholar] [CrossRef]
  6. Furse, C.; Smith, P.; Diamond, M. Feasibility of Reflectometry for Nondestructive Evaluation of Prestressed Concrete Anchors. IEEE Sens. J. 2009, 9, 1322–1329. [Google Scholar] [CrossRef]
  7. Xu, F.; Jiang, Z.; Jiang, Q.; Wang, X.S. Damage Detection and Assessment of Broken Wires in Cables of a Bridge Based on Magnetic Flux Leakage. Exp. Tech. 2023, 47, 907–920. [Google Scholar] [CrossRef]
  8. Sun, L.; Wu, X.; Ouyang, Q.; Wang, J. A novel broken wire evaluation method for bridge cable magnetic flux leakage testing under lift-off uncertainty. J. Magn. Magn. Mater. 2023, 570, 170525. [Google Scholar] [CrossRef]
  9. Cullington, D.; MacNeil, D.; Paulson, P.; Elliott, J. Continuous acoustic monitoring of grouted post-tensioned concrete bridges. NDT & E Int. 2001, 34, 95–105. [Google Scholar] [CrossRef]
  10. Fricker, S.; Schechinger, B.; Vogel, T. Acoustic emission analysis as a monitoring method for prestressed concrete structures. In Proceedings of the 9th European Conference on NDT (ECNDT), Berlin, Germany, 25–29 September 2006. [Google Scholar]
  11. Fricker, S. Schallemissionsanalyse zur Erfassung von Spanndrahtbrüchen bei Stahlbetonbrücken. Ph.D. Thesis, ETH Zurich, Zurich, Switzerland, 2009. [Google Scholar] [CrossRef]
  12. Käding, M.; Schacht, G.; Marx, S. Acoustic Emission analysis of a comprehensive database of wire breaks in prestressed concrete girders. Eng. Struct. 2022, 270, 114846. [Google Scholar] [CrossRef]
  13. Sodeikat, C.; Groschup, R.; Knab, F.; Obermeier, P. Acoustic Emission in der Bauwerksüberwachung zur Feststellung von Spannstahlbrüchen. Beton- und Stahlbetonbau 2019, 114, 707–723. [Google Scholar] [CrossRef]
  14. Pirskawetz, S.M.; Schmidt, S. Detection of wire breaks in prestressed concrete bridges by Acoustic Emission analysis. Dev. Built Environ. 2023, 14, 100151. [Google Scholar] [CrossRef]
  15. Seidel, M. Experiences with two of the world’s largest wind turbine towers. In Proceedings of the 2003 EWEC European Wind Energy Conference and Exhibition, Madrid, Spain, 16–19 June 2003; pp. 16–19. [Google Scholar]
  16. Xu, R.; Käding, M.; Lange, A.; Ostermann, J.; Marx, S. Detection of impulsive signals on tendons for hybrid wind turbines using acoustic emission measurements. In Proceedings of the International Symposium on Non-Destructive Testing in Civil Engineering, Zurich, Switzerland, 16–18 August 2022. [Google Scholar]
  17. Turin, G.L. An introduction to matched filters. IRE Trans. Inf. Theory 1960, 6, 311–329. [Google Scholar] [CrossRef]
  18. Hamilton, P.; Tompkins, W. Adaptive matched filtering for QRS detection. In Proceedings of the Annual International Conference of the IEEE Engineering in Medicine and Biology Society, New Orleans, LA, USA, 4–7 November 1988; pp. 147–148. [Google Scholar] [CrossRef]
  19. Mertins, A. Signaltheorie; Springer Vieweg: Wiesbaden, Germany, 2013. [Google Scholar] [CrossRef]
  20. Vallen Systeme GmbH. Amsy-6 System Description. 2021. Available online: https://www.vallen.de/zdownload/pdf/AMSY-6_Description.pdf (accessed on 24 January 2024).
  21. Unnþórsson, R. Hit Detection and Determination in AE Bursts. In Acoustic Emission—Research and Applications; InTech Open: London, UK, 2013. [Google Scholar]
  22. Muralidhara, S.; Prasad, B.R.; Eskandari, H.; Karihaloo, B. Fracture process zone size and true fracture energy of concrete using acoustic emission. Constr. Build. Mater. 2010, 24, 479–486. [Google Scholar] [CrossRef]
  23. Ch, G.; Ochtsu, M. Acoustic Emission Testing. Basics for Research-Applications in Civil Engineering; Springer: Berlin/Heidelberg, Germany, 2008. [Google Scholar] [CrossRef]
  24. Lange, A.; Käding, M.; Hinrichs, R.; Ostermann, J.; Marx, S. Wire Break Detection in Bridge Tendons Using Low-Frequency Acoustic Emissions. In Proceedings of the European Workshop on Structural Health Monitoring, Stanford, CA, USA, 12–14 September 2023; pp. 1024–1033. [Google Scholar]
  25. Xie, J.; Colonna, J.G.; Zhang, J. Bioacoustic signal denoising: A review. Artif. Intell. Rev. 2021, 54, 3575–3597. [Google Scholar] [CrossRef]
  26. Vaseghi, S.V. Advanced Digital Signal Processing and Noise Reduction; John Wiley & Sons: Hoboken, NJ, USA, 2008. [Google Scholar] [CrossRef]
Figure 1. Layout of the transition piece (left) and the footing (right) of the hybrid wind turbine tower, in which the operational recordings were conducted.
Acoustics 06 00011 g001
Figure 2. Technical drawing of the large-scale test frame with four post-tensioned steel tendons (T1–T4). The design of both anchor beams is based on a hybrid wind turbine tower construction. The anchor beam with the covering steel plate is considered to be a transition piece replica, while the other side’s design is meant to be a footing replica of such a hybrid wind tower. Both, the locations of the manually conducted wire breaks for each tendon and the sensor positions are highlighted. The AE sensors Acoustics 06 00011 i001
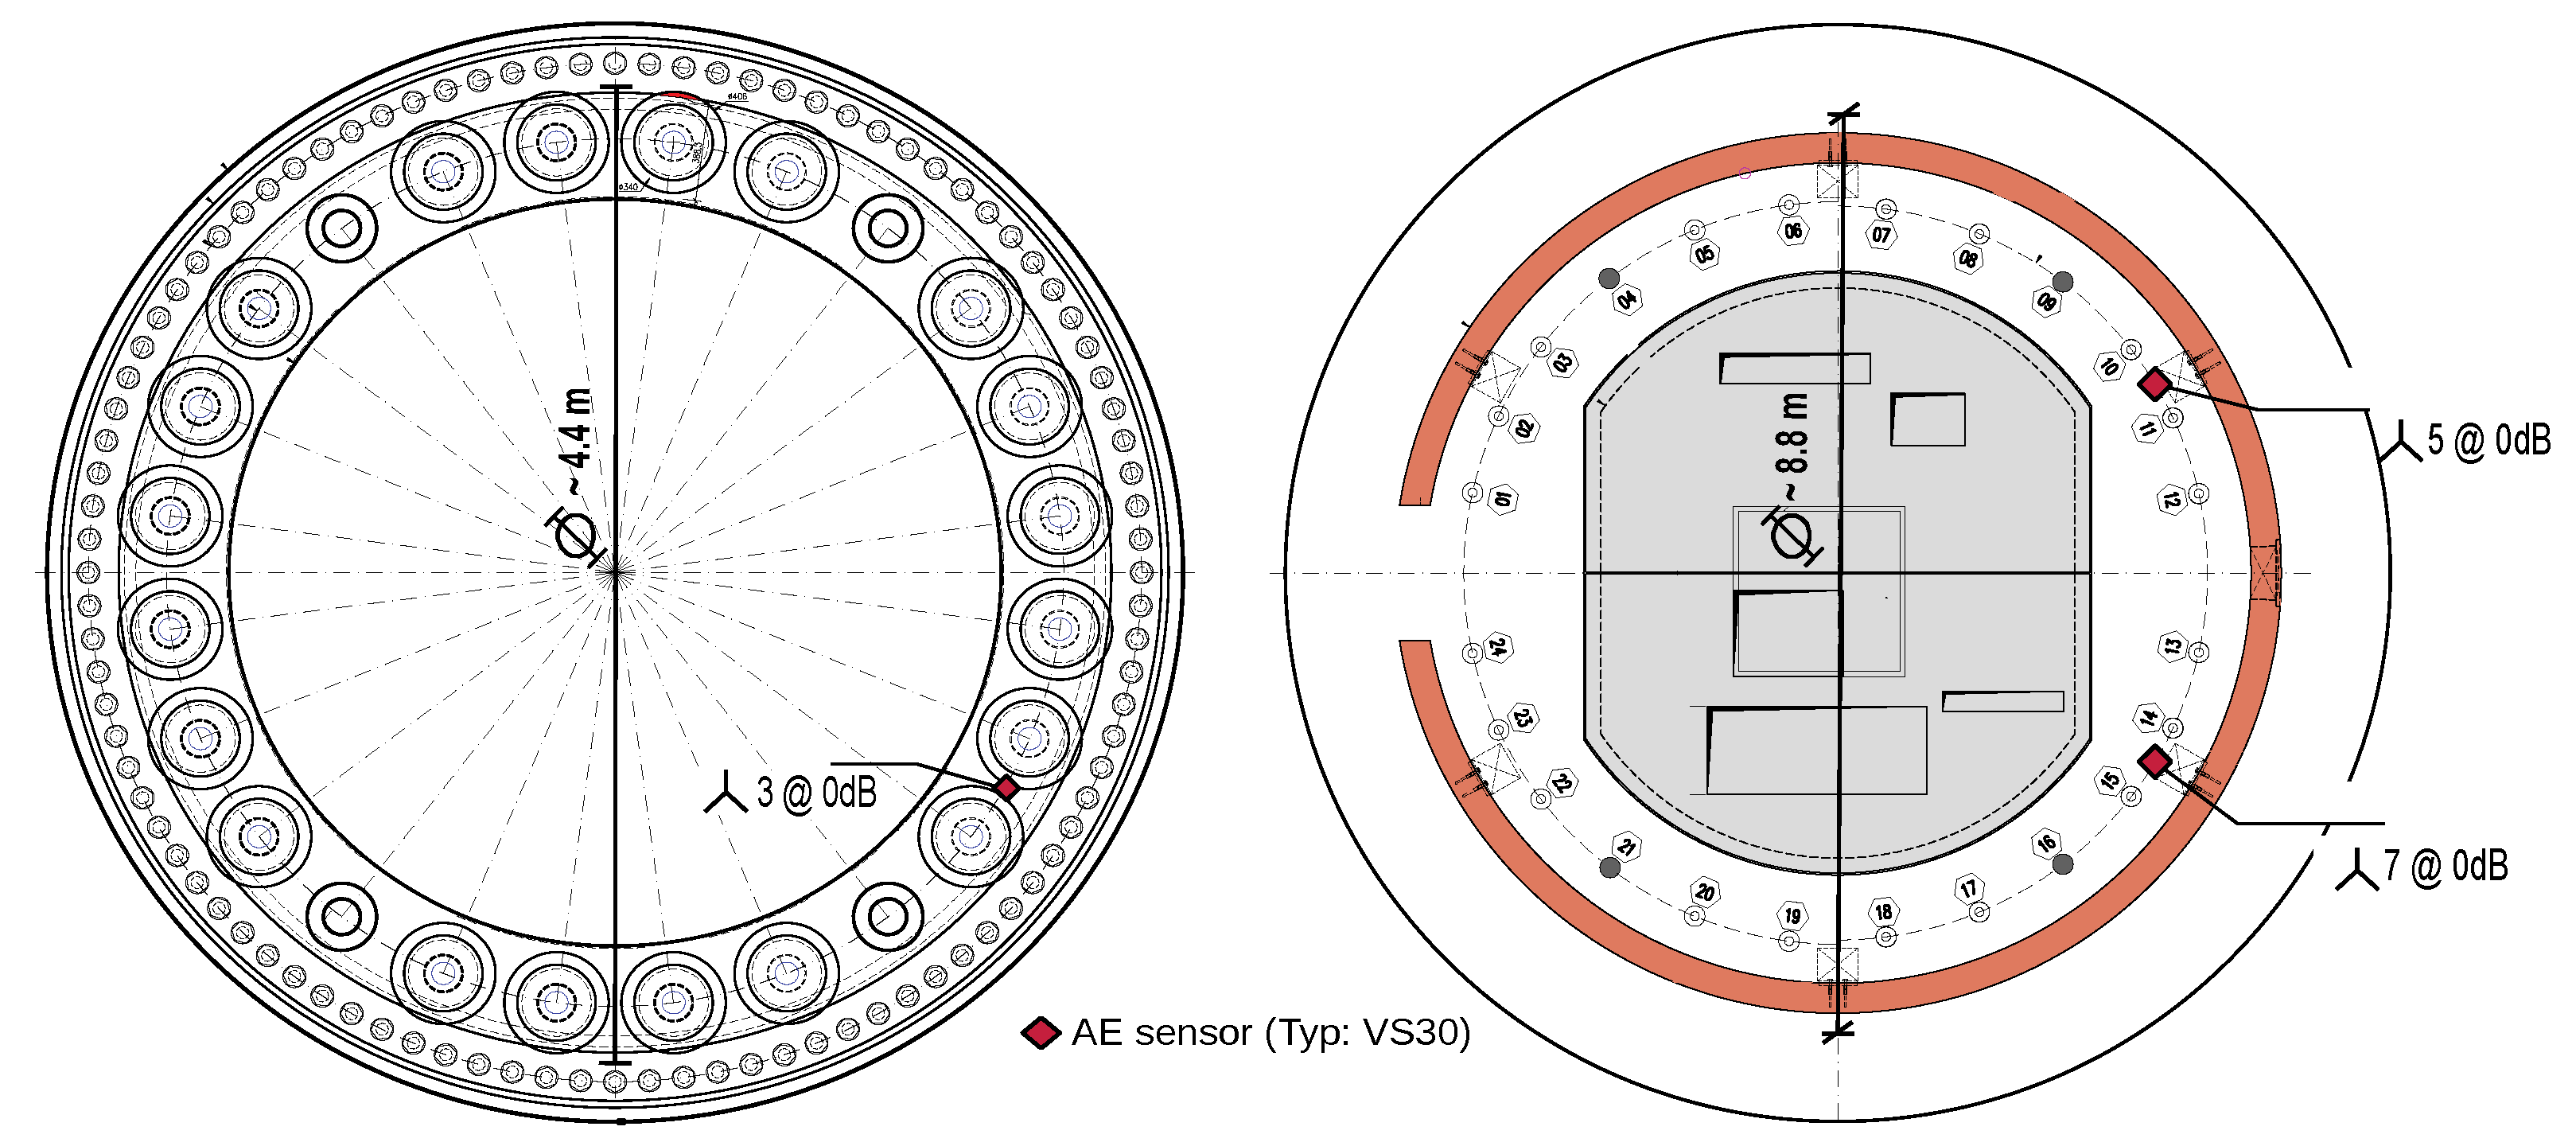
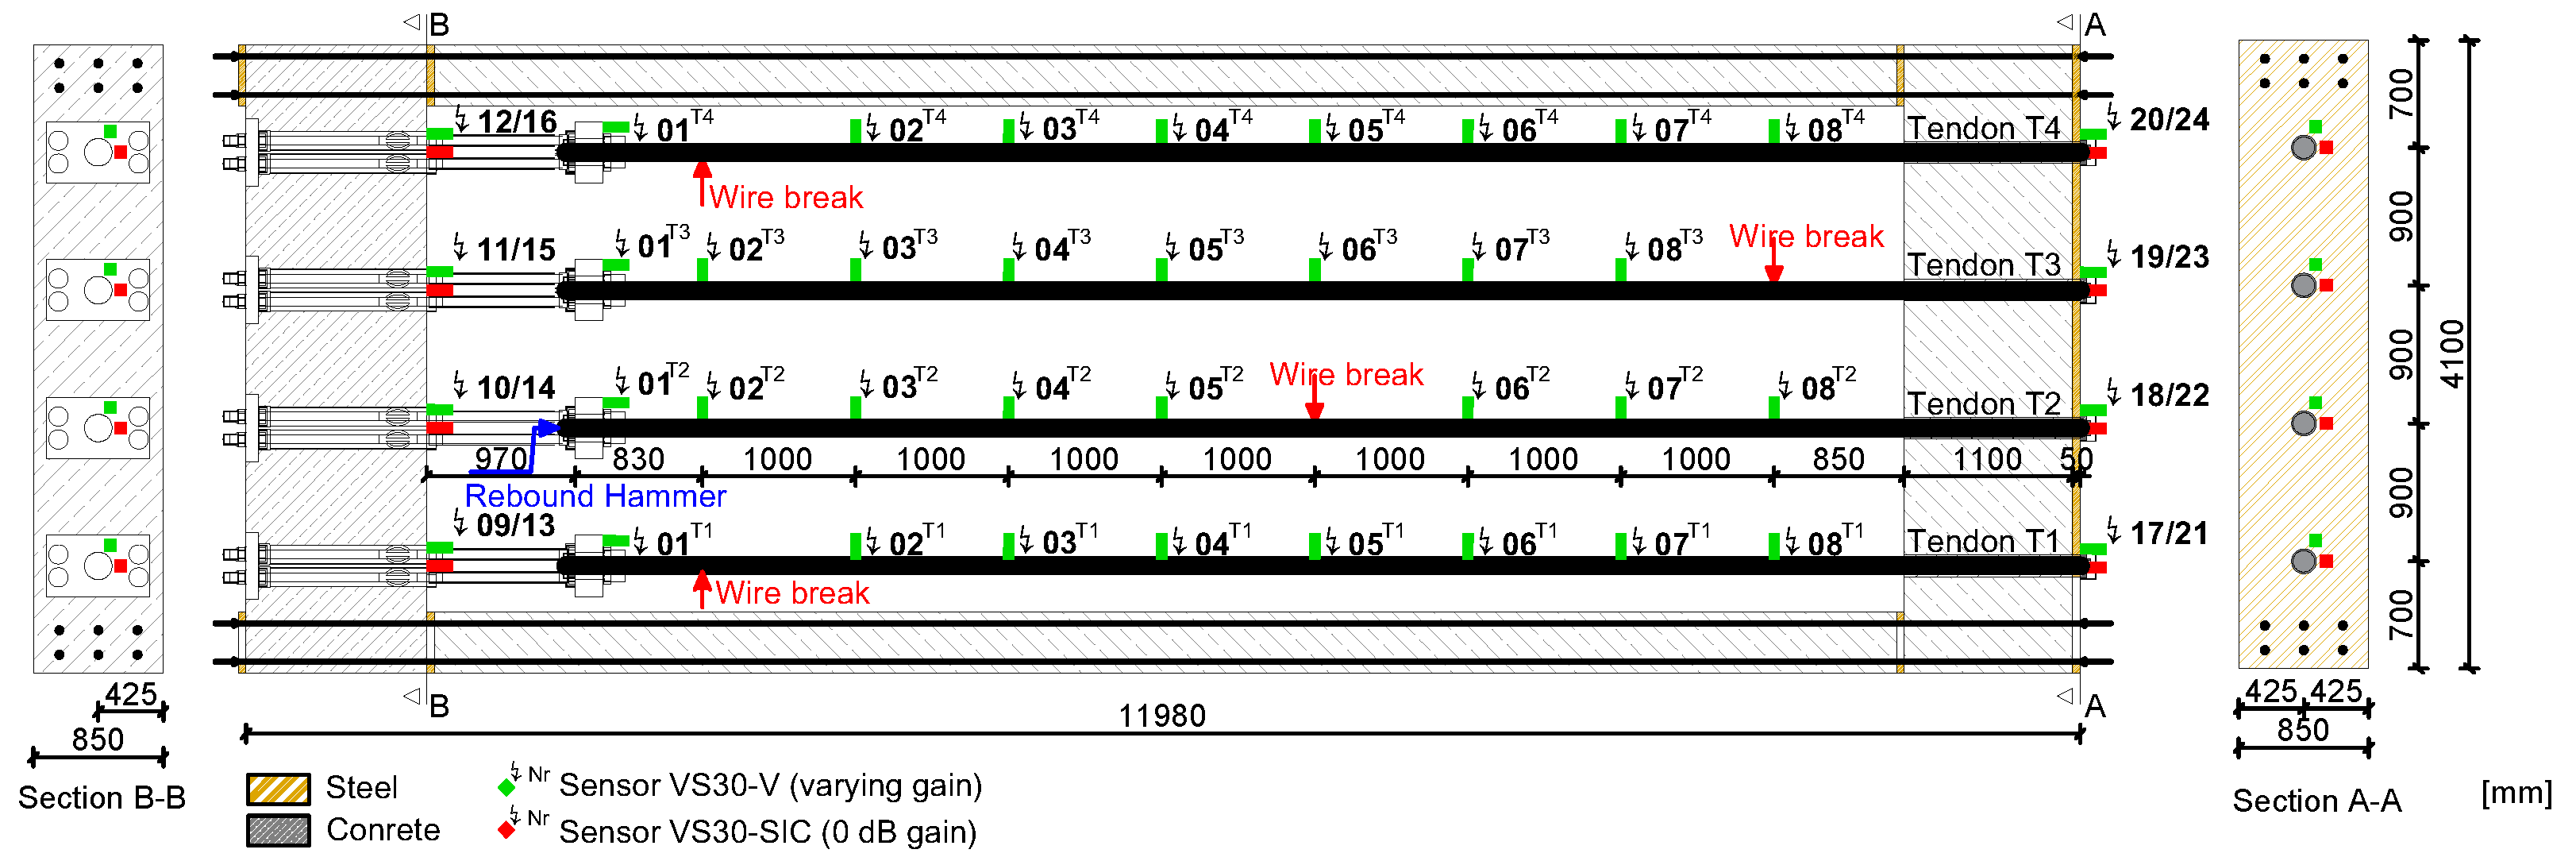
1–8 were mounted on the tendon under test itself, so that these positions changed throughout the experiments as indicated by the superscripts (T2–T4). All other sensor positions remained unchanged. In this work, the sensors without preamplification (in red) mounted at the footing and the transition piece replica are in the focus of research.
Acoustics 06 00011 g002
Figure 3. Toy example of a matched filter that detects a signal buried in noise. Subfigure (a) shows the query signal (an exponentially decaying sine wave with a frequency of f = 10 kHz), the signal in (b) is white noise drawn from a gaussian distribution N ( 0 , 1 ) with the query signal embedded at T = 800 ms (red shaded area). From (c), it becomes apparent how the cross correlation of (a,b) results in a signal with significantly higher SNR than signal (b), which allows for simpler detection.
Acoustics 06 00011 g003
Figure 4. An exemplary AE event with several parameters typically used to configure the acquisition process of commercial AE systems with user-defined amplitude thresholds T A E .
Acoustics 06 00011 g004
Figure 5. Example of a wire break signal from the laboratory experiments (Section 2.1.2) in an exemplary noise measurement recorded in the operating wind turbine (Section 2.1.1). The wire break signal is scaled to obtain the desired signal-to-noise ratios of (a) 10 dB, (b) 5 dB, (c) 2 dB and (d) 0 dB.
Acoustics 06 00011 g005
Figure 6. Distribution of max. amplitudes [dB] recorded on the outer most sensors on (a) the footing replica (sensor Acoustics 06 00011 i00113) and (b) the transition piece replica (sensor Acoustics 06 00011 i00124). The abscissa of the boxplots denotes, on which tendon the wire breaks were conducted. From left to right, the distance between wire break source and the anchor beam as well as the distance of the sensor to the anchor point of the tendon under test increases (see also Figure 2). The dotted lines and shaded areas indicate the mean noise amplitude and the 2 σ confidence interval (assuming normally distributed noise) from Table 2, respectively.
Acoustics 06 00011 g006
Figure 7. Selected query signals from (a,b) laboratory wire break experiments and (c,d) rebound hammer tests at the test rig using the arg max - (best) and the arg min -function (worst).
Acoustics 06 00011 g007
Figure 8. ROC curves for (a) amplitude-based detection and a (be) matched filter approach using four different query signals (from Figure 7) generated by wire break events (WB) and rebound hammer impact tests (RH). Linecolors and -styles indicate results for different signal-to-noise ratios. For a more detailed quantitative comparison of the results, we refer to Table 3.
Acoustics 06 00011 g008
Table 1. Amplitude attenuation for signals of sensor Acoustics 06 00011 i00124 during the laboratory experiments on Tendon T1–T3. μ and σ denote the arithmetic mean and the standard deviation, respectively.
TendonAmp. Attenuation [ dB AE ]
maxmin μ σ
T3 → T214.2−5.77.91.4
T2 → T137.1−12.77.64.4
T3 → T148.6−8.315.44.9
Table 2. Max. Amplitude evaluated for 1s-intervals of operational recordings over a period of one week. μ and σ denote the arithmetic mean and the standard deviation, respectively.
SensorAmplitude [ dB AE ]
maxmin μ σ
Acoustics 06 00011 i0023107.267.5104.32.7
Acoustics 06 00011 i002580.865.674.82.9
Acoustics 06 00011 i002793.565.376.76.6
Table 3. AUC scores for matched filter approach (MF) using different query signals (Table 3a–d) are compared with an amplitude-based detection (Amp) for different signal-to-noise ratios.
(a) Wire Break (Best)(b) Wire Break (Worst)
Operational Sensor 1Laboratory Sensors 2SNRAUC [-]↑ AUCOperational Sensor 1Laboratory Sensors 2SNRAUC [-]↑ AUC
MFAmpMFAmp
Acoustics 06 00011 i0023Acoustics 06 00011 i00113–Acoustics 06 00011 i00116Unscaled1.00000.98480.0152Acoustics 06 00011 i0023Acoustics 06 00011 i00113–Acoustics 06 00011 i00116Unscaled0.99430.98480.0095
SNR 10 dB1.00001.00000.0000SNR 10 dB0.99411.0000−0.0059
SNR 5 dB1.00000.96430.0357SNR 5 dB0.99530.96430.0310
SNR 2 dB1.00000.72020.2798SNR 2 dB0.99540.72020.2752
SNR 0 dB1.00000.45370.5463SNR 0 dB0.99500.45370.5413
Acoustics 06 00011 i0025Acoustics 06 00011 i00121–Acoustics 06 00011 i00124Unscaled0.99990.97120.0287Acoustics 06 00011 i0025Acoustics 06 00011 i00121–Acoustics 06 00011 i00124Unscaled0.99410.97120.0229
SNR 10 dB1.00000.99780.0022SNR 10 dB0.99380.9978−0.0040
SNR 5 dB0.99990.78500.2149SNR 5 dB0.99030.78500.2053
SNR 2 dB0.99970.39690.6028SNR 2 dB0.98200.39690.5851
SNR 0 dB0.99920.22060.7786SNR 0 dB0.97460.22060.7540
Acoustics 06 00011 i0027Acoustics 06 00011 i00121–Acoustics 06 00011 i00124Unscaled1.00000.75300.2470Acoustics 06 00011 i0027Acoustics 06 00011 i00121–Acoustics 06 00011 i00124Unscaled0.98640.75300.2334
SNR 10 dB1.00000.54530.4547SNR 10 dB0.98540.54530.4401
SNR 5 dB1.00000.45800.5420SNR 5 dB0.97830.45800.5203
SNR 2 dB0.99990.34880.6511SNR 2 dB0.95950.34880.6107
SNR 0 dB0.99930.23790.7614SNR 0 dB0.94200.23790.7041
(c) Rebound Hammer (Worst)(d) Rebound Hammer (Worst)
Operational Sensor 1Laboratory Sensors 2SNRAUC [-]↑ AUCOperational Sensor 1Laboratory Sensors 2SNRAUC [-]↑ AUC
MFAmpMFAmp
Acoustics 06 00011 i0023Acoustics 06 00011 i00113–Acoustics 06 00011 i00116Unscaled1.00000.98480.0152Acoustics 06 00011 i0023Acoustics 06 00011 i00113–Acoustics 06 00011 i00116Unscaled1.00000.98480.0152
SNR 10 dB1.00001.00000.0000SNR 10 dB1.00001.00000.0000
SNR 5 dB1.00000.96430.0357SNR 5 dB1.00000.96430.0357
SNR 2 dB1.00000.72020.2798SNR 2 dB1.00000.72020.2798
SNR 0 dB1.00000.45370.5463SNR 0 dB1.00000.45370.5463
Acoustics 06 00011 i0025Acoustics 06 00011 i00121–Acoustics 06 00011 i00124Unscaled0.99990.97120.0287Acoustics 06 00011 i0025Acoustics 06 00011 i00121–Acoustics 06 00011 i00124Unscaled0.99610.97120.0249
SNR 10 dB1.00000.99780.0022SNR 10 dB0.99610.9978−0.0017
SNR 5 dB1.00000.78500.2150SNR 5 dB0.98960.78500.2046
SNR 2 dB1.00000.39690.6031SNR 2 dB0.98490.39690.5880
SNR 0 dB0.99990.22060.7793SNR 0 dB0.97810.22060.7575
Acoustics 06 00011 i0027Acoustics 06 00011 i00121–Acoustics 06 00011 i00124Unscaled1.00000.75300.2470Acoustics 06 00011 i0027Acoustics 06 00011 i00121–Acoustics 06 00011 i00124Unscaled0.98970.75300.2367
SNR 10 dB1.00000.54530.4547SNR 10 dB0.99010.54530.4448
SNR 5 dB1.00000.45800.5420SNR 5 dB0.97850.45800.5205
SNR 2 dB1.00000.34880.6512SNR 2 dB0.96400.34880.6152
SNR 0 dB1.00000.23790.7621SNR 0 dB0.94040.23790.7025
1 see Section 2.1.1; ↑: improvement in AUC (MF vs. Amp); 2 see Section 2.1.2.
Disclaimer/Publisher’s Note: The statements, opinions and data contained in all publications are solely those of the individual author(s) and contributor(s) and not of MDPI and/or the editor(s). MDPI and/or the editor(s) disclaim responsibility for any injury to people or property resulting from any ideas, methods, instructions or products referred to in the content.

