Article

Design of Optimal Sound Absorbers Using Acoustic Diffusers for Multipurpose Auditoriums

by
Domingo Pardo-Quiles
1,
Ignacio Rodríguez-Rodríguez
2 and
José-Víctor Rodríguez
1,*
1
Departamento de Tecnologías de la Información y las Comunicaciones, Universidad Politécnica de Cartagena, Antiguo Cuartel de Antigones, Plaza del Hospital, 1, 30202 Cartagena, Spain
2
Departamento de Ingeniería de Comunicaciones, Universidad de Málaga, Av. de Cervantes, 2, 29071 Málaga, Spain
*
Author to whom correspondence should be addressed.
Acoustics 2024, 6(1), 219-239; https://doi.org/10.3390/acoustics6010012
Submission received: 29 November 2023 / Revised: 30 January 2024 / Accepted: 27 February 2024 / Published: 6 March 2024
(This article belongs to the Special Issue Building Materials and Acoustics)

Abstract

:
The main goal of this research was to design and study the best structure, location, and shape of acoustic diffusers to be fitted on the ceilings of multipurpose auditoriums. Their absorbing properties can enhance the acoustics when installed on high ceilings, and behind suspended reflecting panels, by mitigating or nullifying specular reflections that could overcome the panels and, thus, avoiding time delay gaps exceeding 30–40 ms compared with the direct sound. For this purpose, a typical medium-sized room, with inclined floors, a stage, and 20 rows of seats, was considered. The allocation and height of the considered diffusers were based on the Schroeder quadratic residue sequence, and they were modeled as rectangles, wedges, cylinders, and Y-shaped elements. A standardized speech source spectrum was analyzed for up to five different receiver locations. In this way, the attenuation parameter as a function of frequency was evaluated and compared between the candidate diffusers in order to identify the best absorber. The simulations were undertaken with a software tool previously validated by the authors called PARDOS, which incorporates an innovative formulation based on the uniform theory of diffraction (UTD) to analyze multiple diffractions and reflections of acoustic waves. The results show that the new Y-shaped diffusers proposed, tuned for the hearing frequency band from 250 Hz up to 10,000 Hz, attained the best acoustic performance in terms of absorption.

1. Introduction

Research on the acoustics of interiors has been the subject of scientists’ interest for a long time. Multiple acoustic phenomena and the impact of the room shape on the acoustics have been the focus of many researchers for years up to the present day [1,2,3,4]. Acoustic performance is usually analyzed from either a subjective perception of listeners when immersed in auditoria (e.g., reverberance, clarity, loudness, intimacy, warmth, etc.) or from a quantitative approach by measuring useful metrics linked to the impulse response such as the reverberation time (T30), early decay time (EDT), and definition (D50) parameters. Acoustic performance can also be studied by correlating both subjective assessments of sound quality with objective measurements of acoustical attributes to establish a mathematically predictable evaluation of a concert hall [5,6,7]. In all cases, the room geometry, the position of the sound source and receivers, the sound level of the source, background noise, absorption, etc., play key roles or contribute to the final values of these parameters.
Large auditoriums with fairly high ceilings may result in excessive delays between reflected and direct sound in the listener position, so suspended reflectors are frequently employed at a lower level to shorten such time delays and, quite the contrary, enhance the acoustics. The sound source should be closely and abundantly surrounded with large sound-reflective surfaces to supply additional reflected sound energy to every portion of the audience area, particularly to the remote seats. Such reflectors must be as low as possible so that the initial time-delay gap between the direct and first reflected sound is relatively short, possibly not exceeding 30 ms. From there, the transition zone between the human being’s ability to integrate delays and the perception of delayed sound as a discrete echo is gradual and linked to the echo level and the spectral properties of the signal itself, although from 80 to 100 ms, there seems to be no doubt about the echo discretion [8,9].
Unfortunately, massive deployment of large reflective panels is not always possible to avoid the adverse effect of these echoes, and it is necessary to supplement or replace them somewhere in the auditorium with absorbing materials or structures. Moreover, diffusers scatter the sound, breaking up the acoustic waves and redistributing them throughout the room, making the sound perception by the listeners less echoey and more natural. In contrast with diffusers, sound-absorbing panels are specifically designed with the main goal of absorbing sound waves by means of a material that is able to capture and dissipate sound energy and convert it into heat, but the drawback is that they are only intended to cancel out the sound.
Nowadays, the interest in the application of acoustic diffusers is growing and growing in architectural acoustics. Sound diffusion is a very important parameter in an overall assessment of the quality of an auditorium. This explains the increasingly frequent use of sound diffusers. Schroeder invented over 40 years ago the phase grating diffuser [10], comprising structures with a series of wells of different depths separated by thin fins for artificially creating a predictable sound diffuse reflection. Many studies and applications have been developed since Schroeder’s publication [11,12,13,14].
Schroeder diffusers have been widely adopted in indoor and outdoor facilities, and they have also shown substantial benefits in noise control or ultrasound imaging, among others [15,16,17]. Within these phase grating designs, there have been several standard models that are commonly used in the industry, with few variations since their invention. Traditional diffuser designs have relied on a few known optimal number sequences, such as QRD (quadratic residue) or PRD (primitive root sequence) diffusers. Nevertheless, the conventional Schroeder diffuser has a remarkable thickness of the magnitude of a wavelength, which seriously hampers its practical application for low-frequency sound. Researchers have tried to overcome this drawback in recent years with different approaches to both extend the frequency band and provide the required diffusion performance while keeping a constrained ‘reasonable’ physical dimension. In this sense, Cox defined optimized stepped and profiled diffusers (attaching thin fins onto the structures) [18], ternary and quadriphase sequence diffusers [19], or including cylinders in front of the diffusers [20] to outperform the uniformity diffusion of Schroeder structures within the desired frequency band. Other researchers [21,22,23,24,25,26] have faced the mentioned constraint from other perspectives (e.g., shape grammars and variations in surface acoustic impedance) to broaden the frequency band of the diffusers with the expected performance. However, the major drawback of the standard designs remains unsolved: the well depths become large for low design frequencies, and this implies thick and heavy panels for lower frequencies [27].
From practically the development of Schroeder diffusers, a notorious capacity to generate absorption in acoustic waves was observed in addition to their diffusion capacity [28]. Schroeder diffusers contain quarter-wave resonant structures, and, consequently, some absorption would be expected to occur at and around the resonant frequencies. The absorption reported by many researchers, however, greatly exceeds that which can be attributed to just quarter-wave resonance. The high absorption coefficient of diffusers operating on the principle of the phase change of reflected sound was first observed by Fujiwara [29,30]. Following the investigations of these authors, many others have deepened research into this capacity of the diffusers, presenting interesting results and opening lines of investigation for other structures [31,32,33,34,35,36,37].
The benefit obtained from the absorption and diffusion capacity of these structures has been applied not only in indoor applications, such as auditoriums [38,39,40] but also in other types of applications, such as their use attached on top of acoustic barriers [41] or the facades of avenues [42]. Therefore, it is well understood that any corrugated surface involving geometrical and material modifications (e.g., sonic crystals) [43,44] can break up reflected wavefronts and so generate scattering and absorption.
It has been reviewed that the usual designs for diffusers consider a series of wells, steps, and curved or even fractal constructions [45,46], where well-known mathematical equations can be applied. Acoustic metasurfaces or metamaterials, taking advantage of Schroeder structures or other similar ones, by adjusting the geometrical acoustics size and shape of structures, are currently at the forefront of research in this field due to the advantages derived from their use: they are capable of providing high absorption at low frequencies with really small dimensions [47,48,49,50,51,52,53,54,55,56] and suitable for sound attenuation control purposes over a specific pre-designed and tunable frequency band.
In this research, a new class of thin and small absorbers is proposed based on the concept of Schroeder diffusers and inspired by acoustic metasurfaces. The proposed specific shape, geometry, size, orientation, and arrangement of the lightweight structures give them their special properties for absorbing waves beyond a conventional material.
Diffusers such as Schroeder structures, with many diffraction points in their caps, cause some of a signal to be scattered and ‘trapped’ in the cavities between their elements, contributing to the absorption of the acoustic signal in certain directions.
A comparison of different geometric shapes placed according to the locations and wells of an N = 7 QRD diffuser was undertaken. To the best of the authors’ knowledge, there are no exhaustive studies on the absorbing capability of diffusers as a function of their shape and applying a spherical wave model. The proposed design offers a promising structure for many real-world architectural applications with requirements in the acoustics field. The structures could be easily prefabricated as panels that meet the desired shape and be replicated and bonded on the desired surfaces.
While there has been large-scale deployment of diffusers in spaces like multipurpose halls, the computational approach for the simulation of these large-scale deployments has been more limited. There are studies estimating the directivity and temporal responses to individual diffusers or small arrays of diffusers, but for larger room simulation models, simpler diffusion and scattering coefficients are usually used. Examples of time-domain analysis of sound diffusion can be found in [57,58]. It is also common to model diffusive surfaces by geometrical acoustics (GA)-based software (ODEON, CATT-Acoustic) [59], where the scattering coefficients are typically provided as input data. Regarding the above, the carrying out of better computational approaches to quantify large surfaces of diffusion is recommendable in order to obtain a rational assessment of the diffuser’s performance.

2. Materials and Methods

The primary goal of this work was the design of a modular diffuser, providing a good trade-off between high absorption and compact geometry, within an extended broadband. The optimization criteria were based on the comparison of the acoustic attenuation level from the source to the listener locations for all the diffuser ‘candidates’. The scattering response was also checked by means of the attenuation maps at frequency octave steps within the voice frequency band.
The method followed in the present work was articulated in four main basic points: the identification of a typical signal source; the definition of a simplified medium-sized auditorium model; the selection of the different diffusing structures that would be the object of the analysis; and the choice of a suitable analysis tool and method for the identification and categorization of the best diffusing structure among those analyzed. These aspects will be reviewed in the following sections.

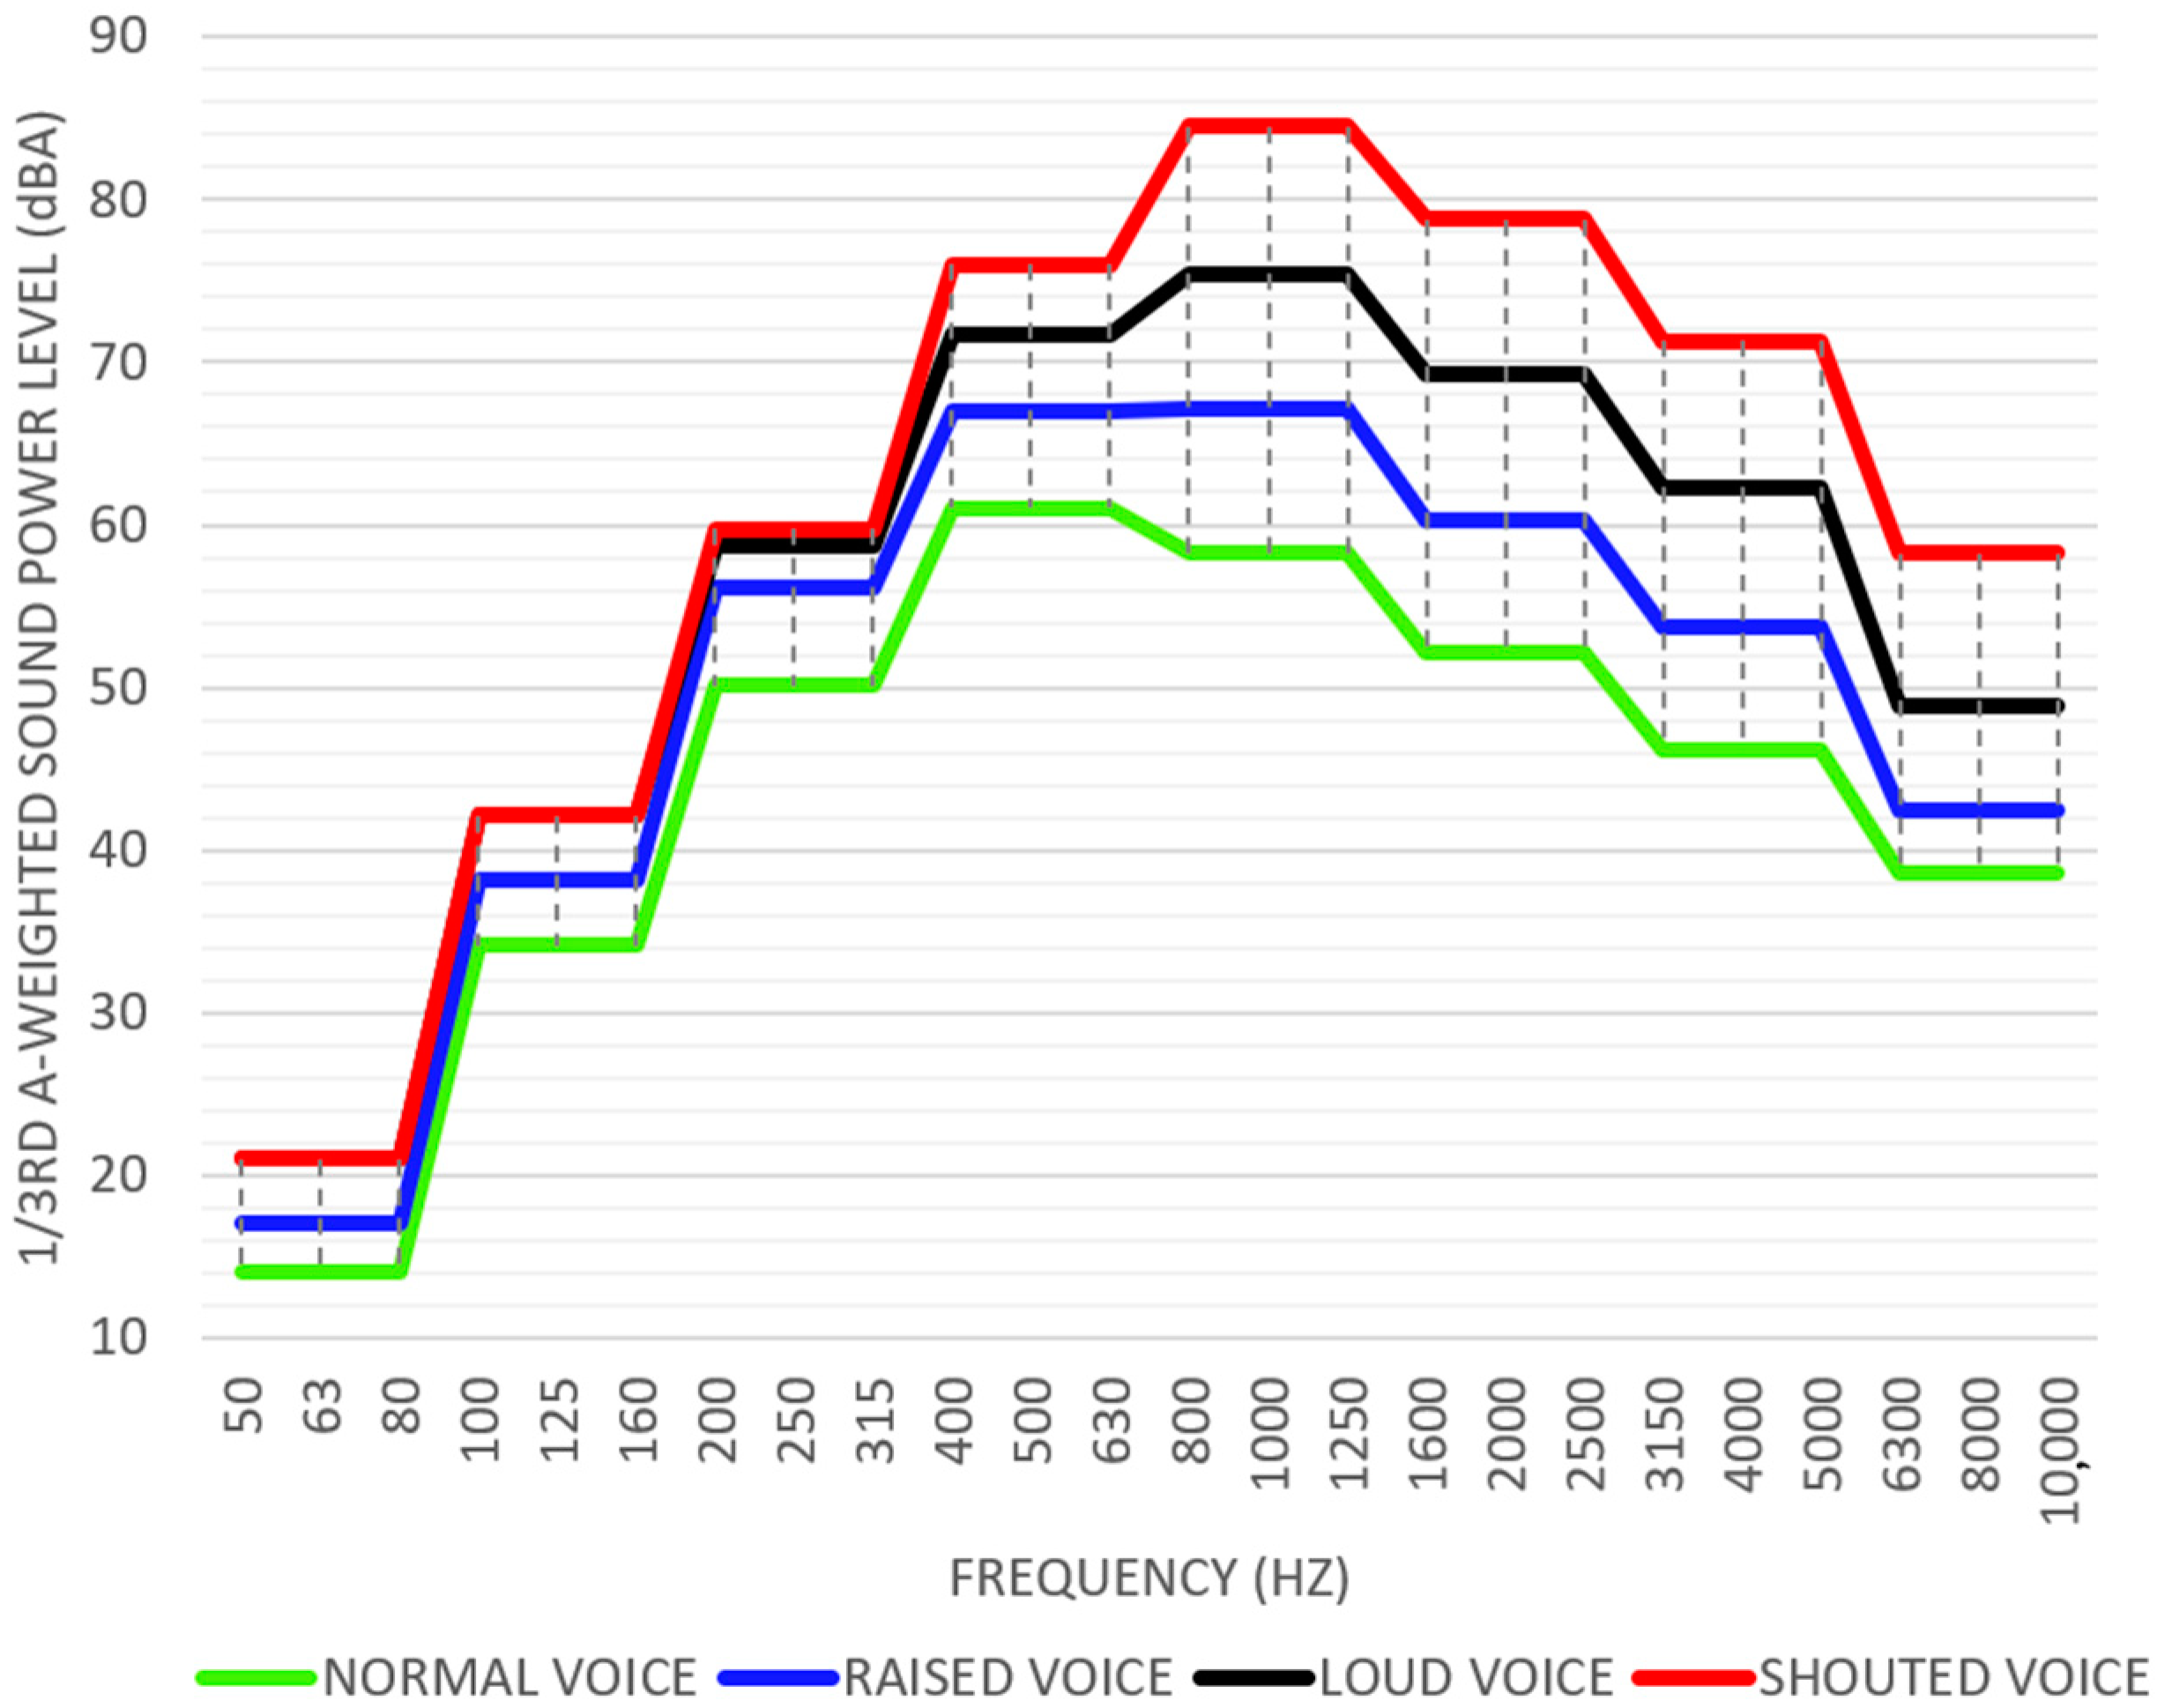
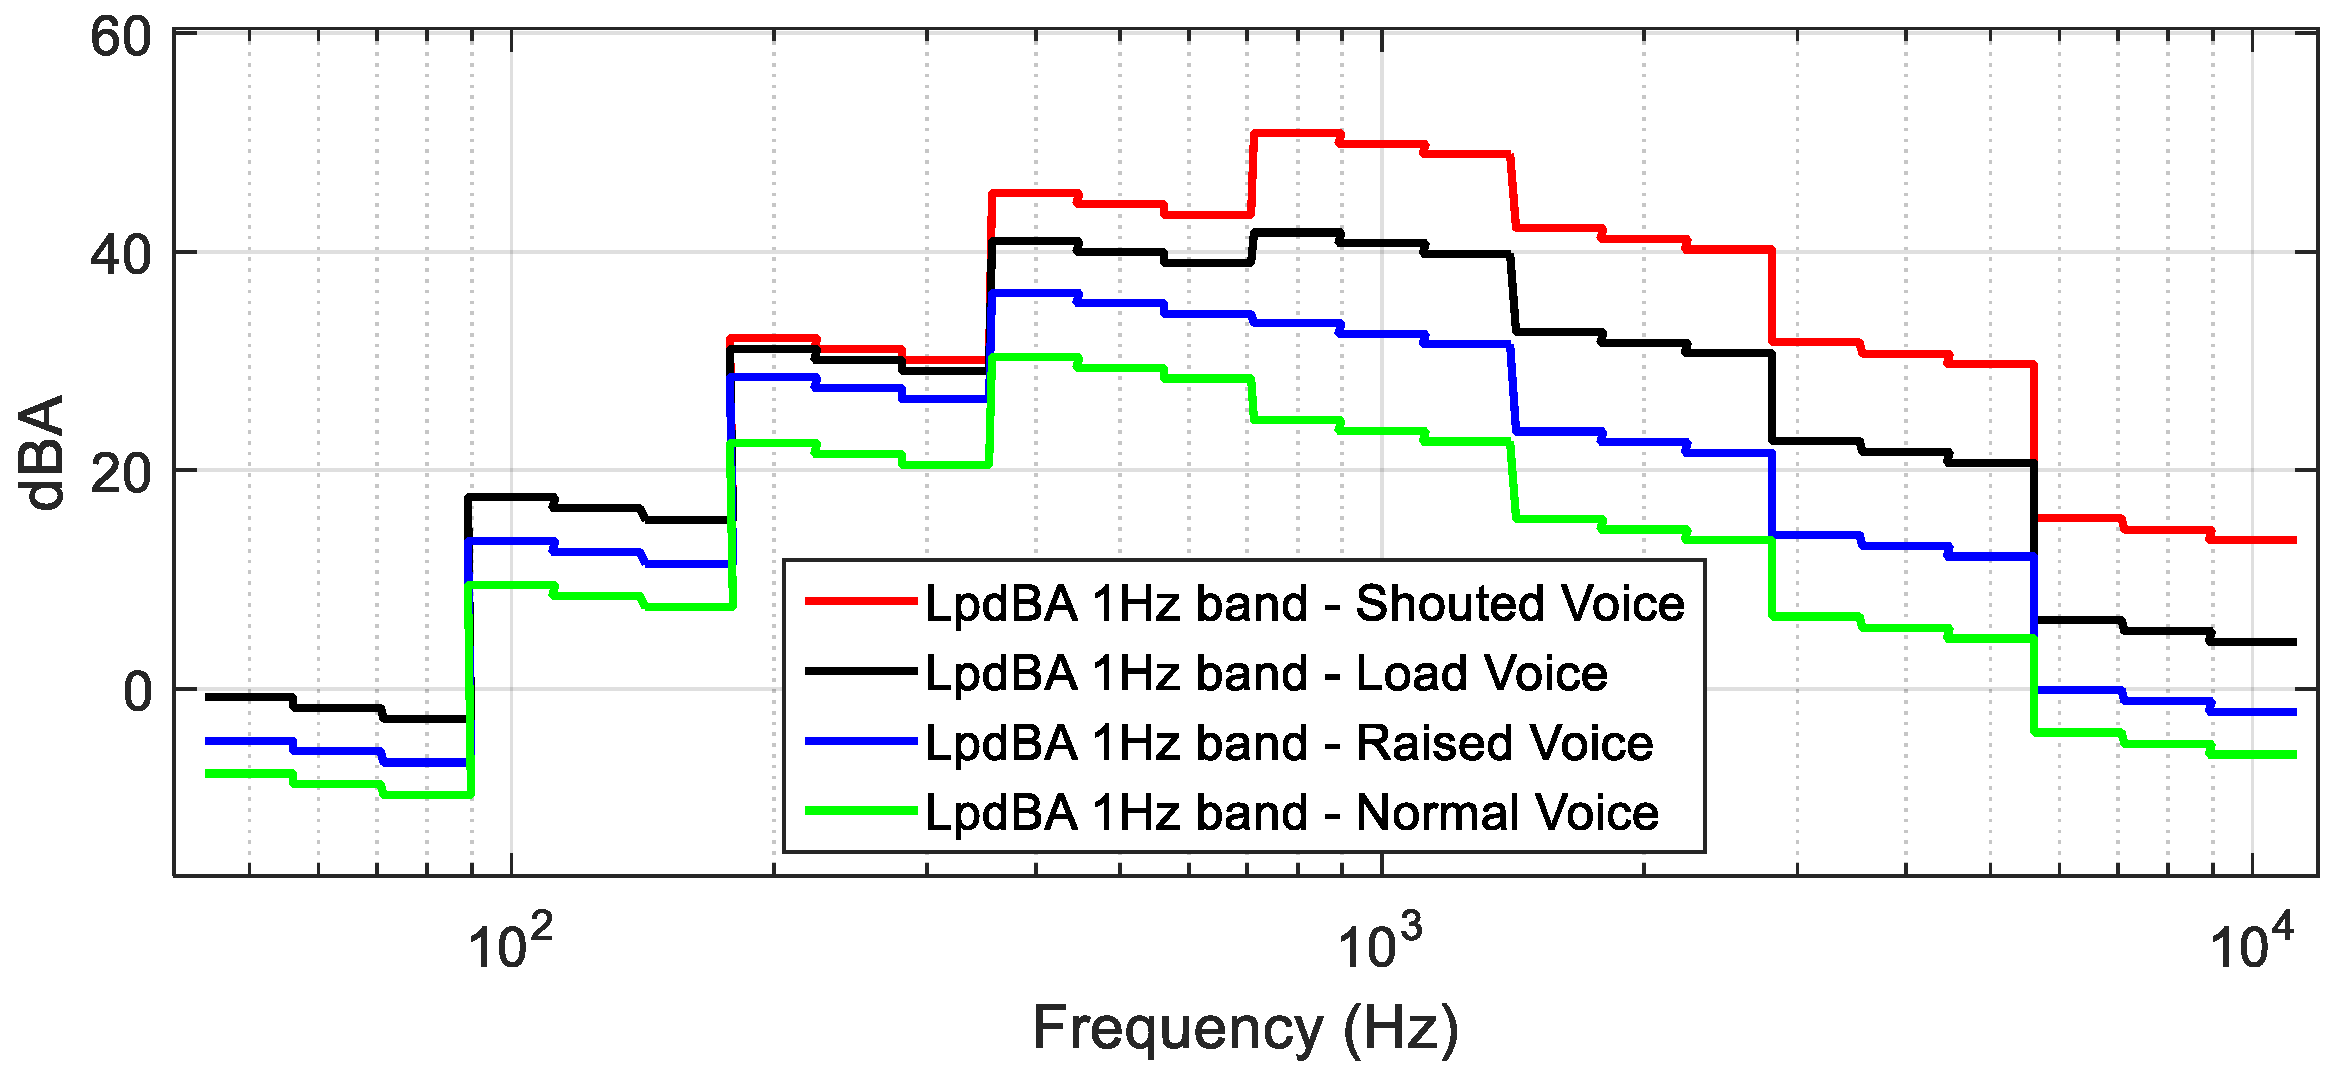
2.1. Source Spectrum

The speech spectrum considered for this work was derived from the spectrum recommended in the standard ANSI S3.5 1997 (R2007) American National Standard Methods for the Calculation of the Speech Intelligibility Index [60] and the previous one of 1997 [61], which were both derived from the compilation made by Pavlovic in 1987 [62]. The definition of a specific speech spectrum has been proposed in ANSI standards since 1969 through the speech spectrum recommended in the ANSI S3.5 1969 (R1986) American National Standard Methods for the Calculation of the Articulation Index [63], which, in turn, was based on the previous works of Dunn [64] and French [65]. At present, many researchers [66] have considered the mentioned speech spectrum for different purposes (e.g., speech transmission index calculations).
The spectrum considered for this work was characterized by octave bands depending on vocal effort (normal, raised, loud, and shouted voices) from 250 Hz up to 10,000 Hz. The power spectrum was normalized from the 1-octave band to the 1/3rd band and adjusted with the A-weighting curve. Figure 1 displays the four different 1/3rd octave frequency band A-weighted sound power levels of voices in the present research.
The following steps were then applied to the four sources displayed in Figure 1 in order to obtain the pressure signal levels with a frequency step of 1 Hz (spectrum level) starting from the A-weighted sound power levels to carry out the subsequent analysis.
The A-weighted power level Lw (dBA) was converted into the A-weighted sound pressure level Lp (dBA) at 1 m:
L p d B A = L w d B A 10 · log 10 Q 4 π r 2 ,
where r is the distance to the source, and Q is the directivity factor.
The distance r to the sound source for which the sound pressure levels were calculated was 1 m. Spherical propagation was also applied, for which Q must be equal to 1. Under these two statements, the sound pressure level (Lp) of a point source was 11 dB less than its sound power level (Lw) at any frequency.
The pressure level was normalized from one-third octave band spectra to a 1 Hz frequency resolution assuming a linear distribution. The sound pressure levels at the 1 Hz band resolution were obtained by normalizing each L p d B ( A )   value for all the center frequencies f 0 , i by their correspondent 1/3rd octave frequency band ( f i ) , as shown in (2)–(5):
f i = f 2 , i f 1 , i = 2 3 f 1 , i f 1 , i ,
f 0 , i = f 1 , i · f 2 , i ,
f i = 2 6 1 2 6 · f 0 , i 0.23156 · f 0 , i ,
L p d B A t x , 1 H z = L p d B A 10 · log 10 f i , f f 1 , i f 2 , i ,
where f1,i and f2,i are the lower and upper cut-off frequencies of the 1/3rd octave band f i , respectively. Therefore, the sound pressure level is properly kept as it is just distributed among each frequency band. Figure 2 shows the resulting transformation of the selected sources from Figure 1.

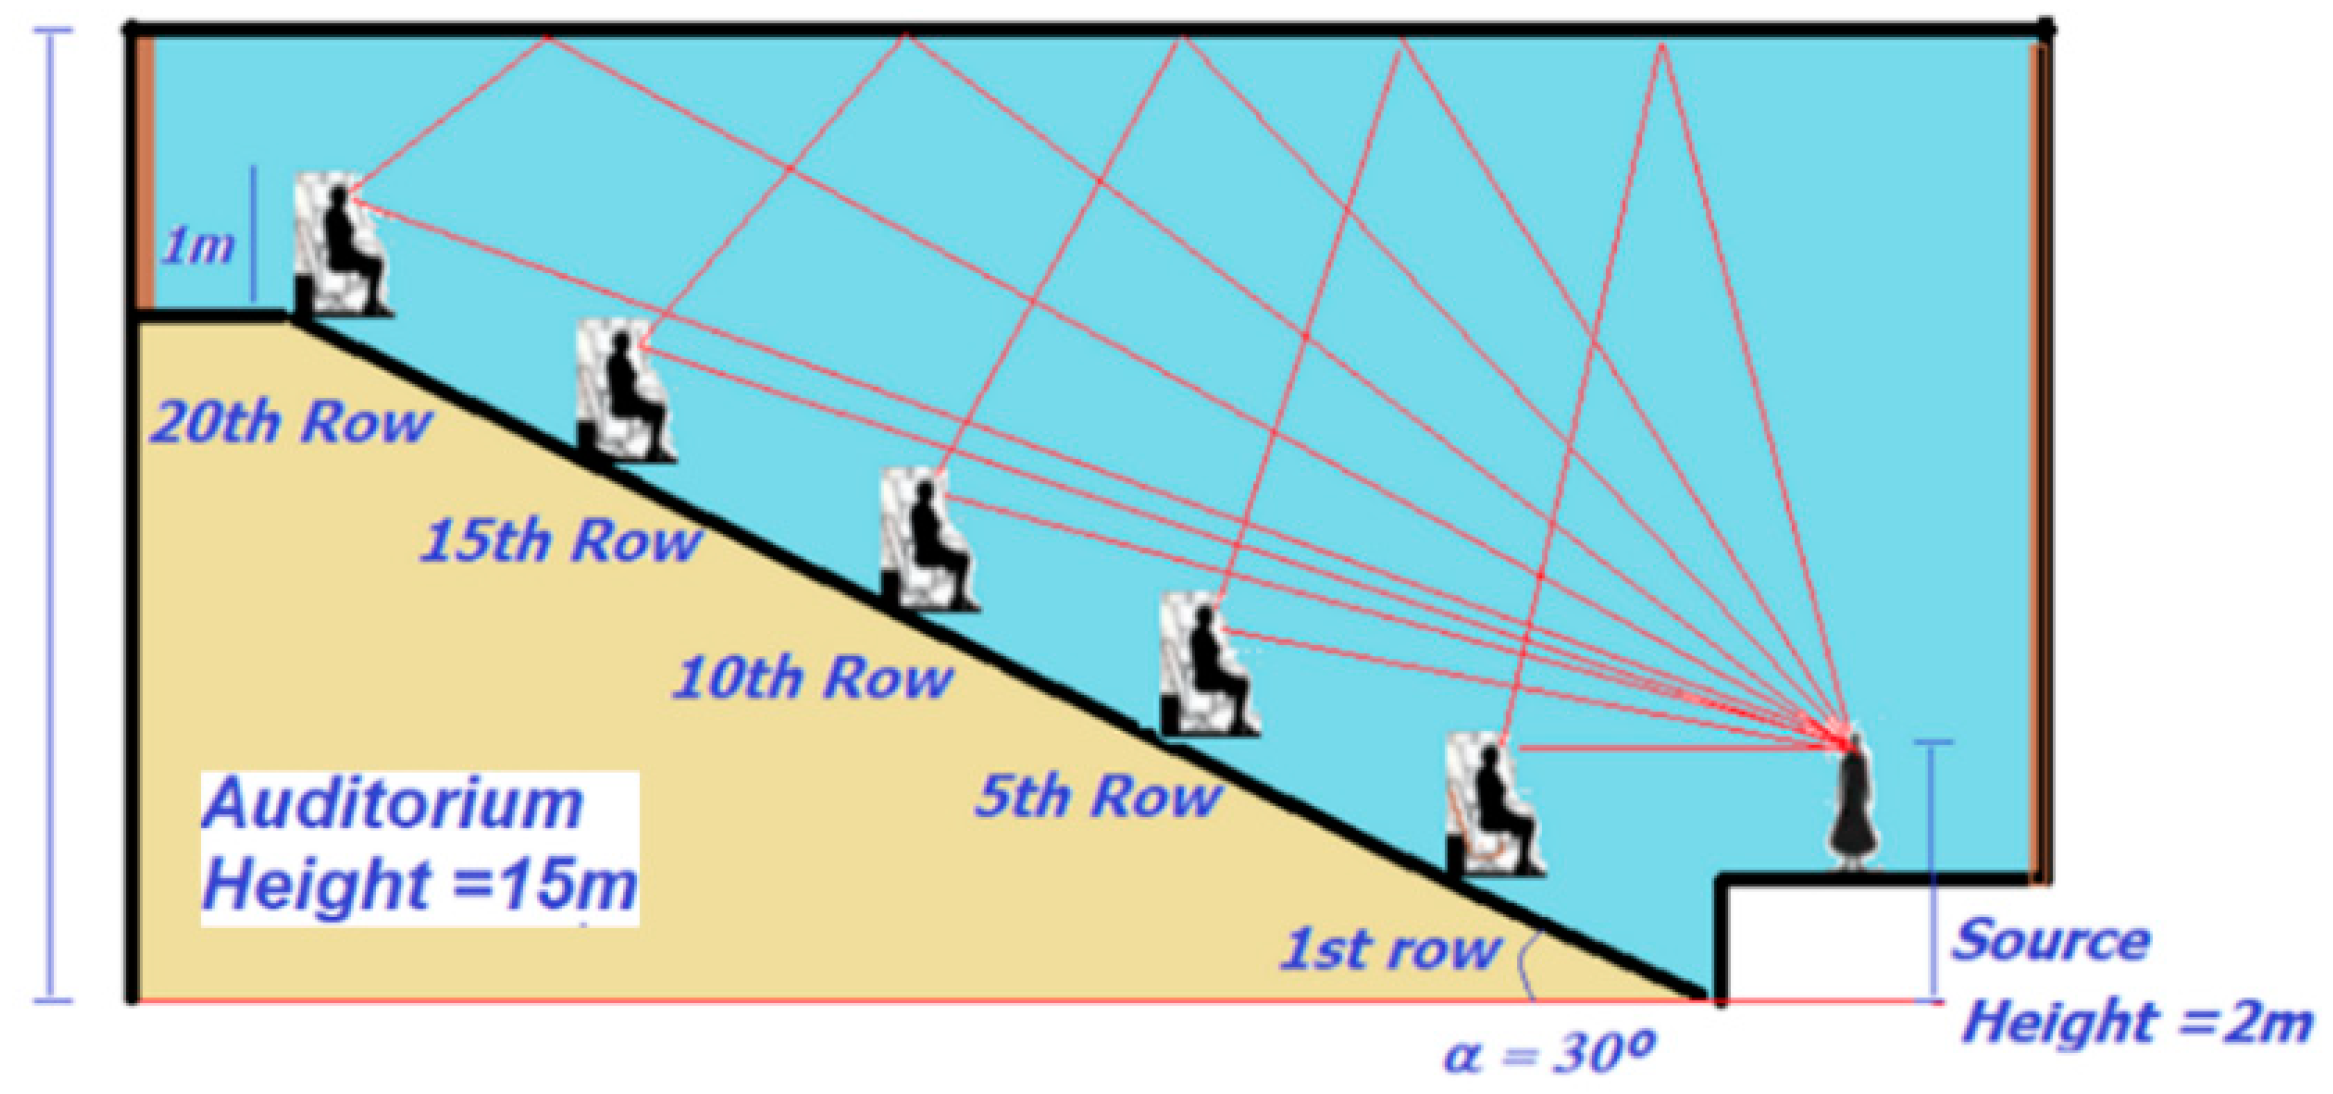
2.2. Auditorium Model
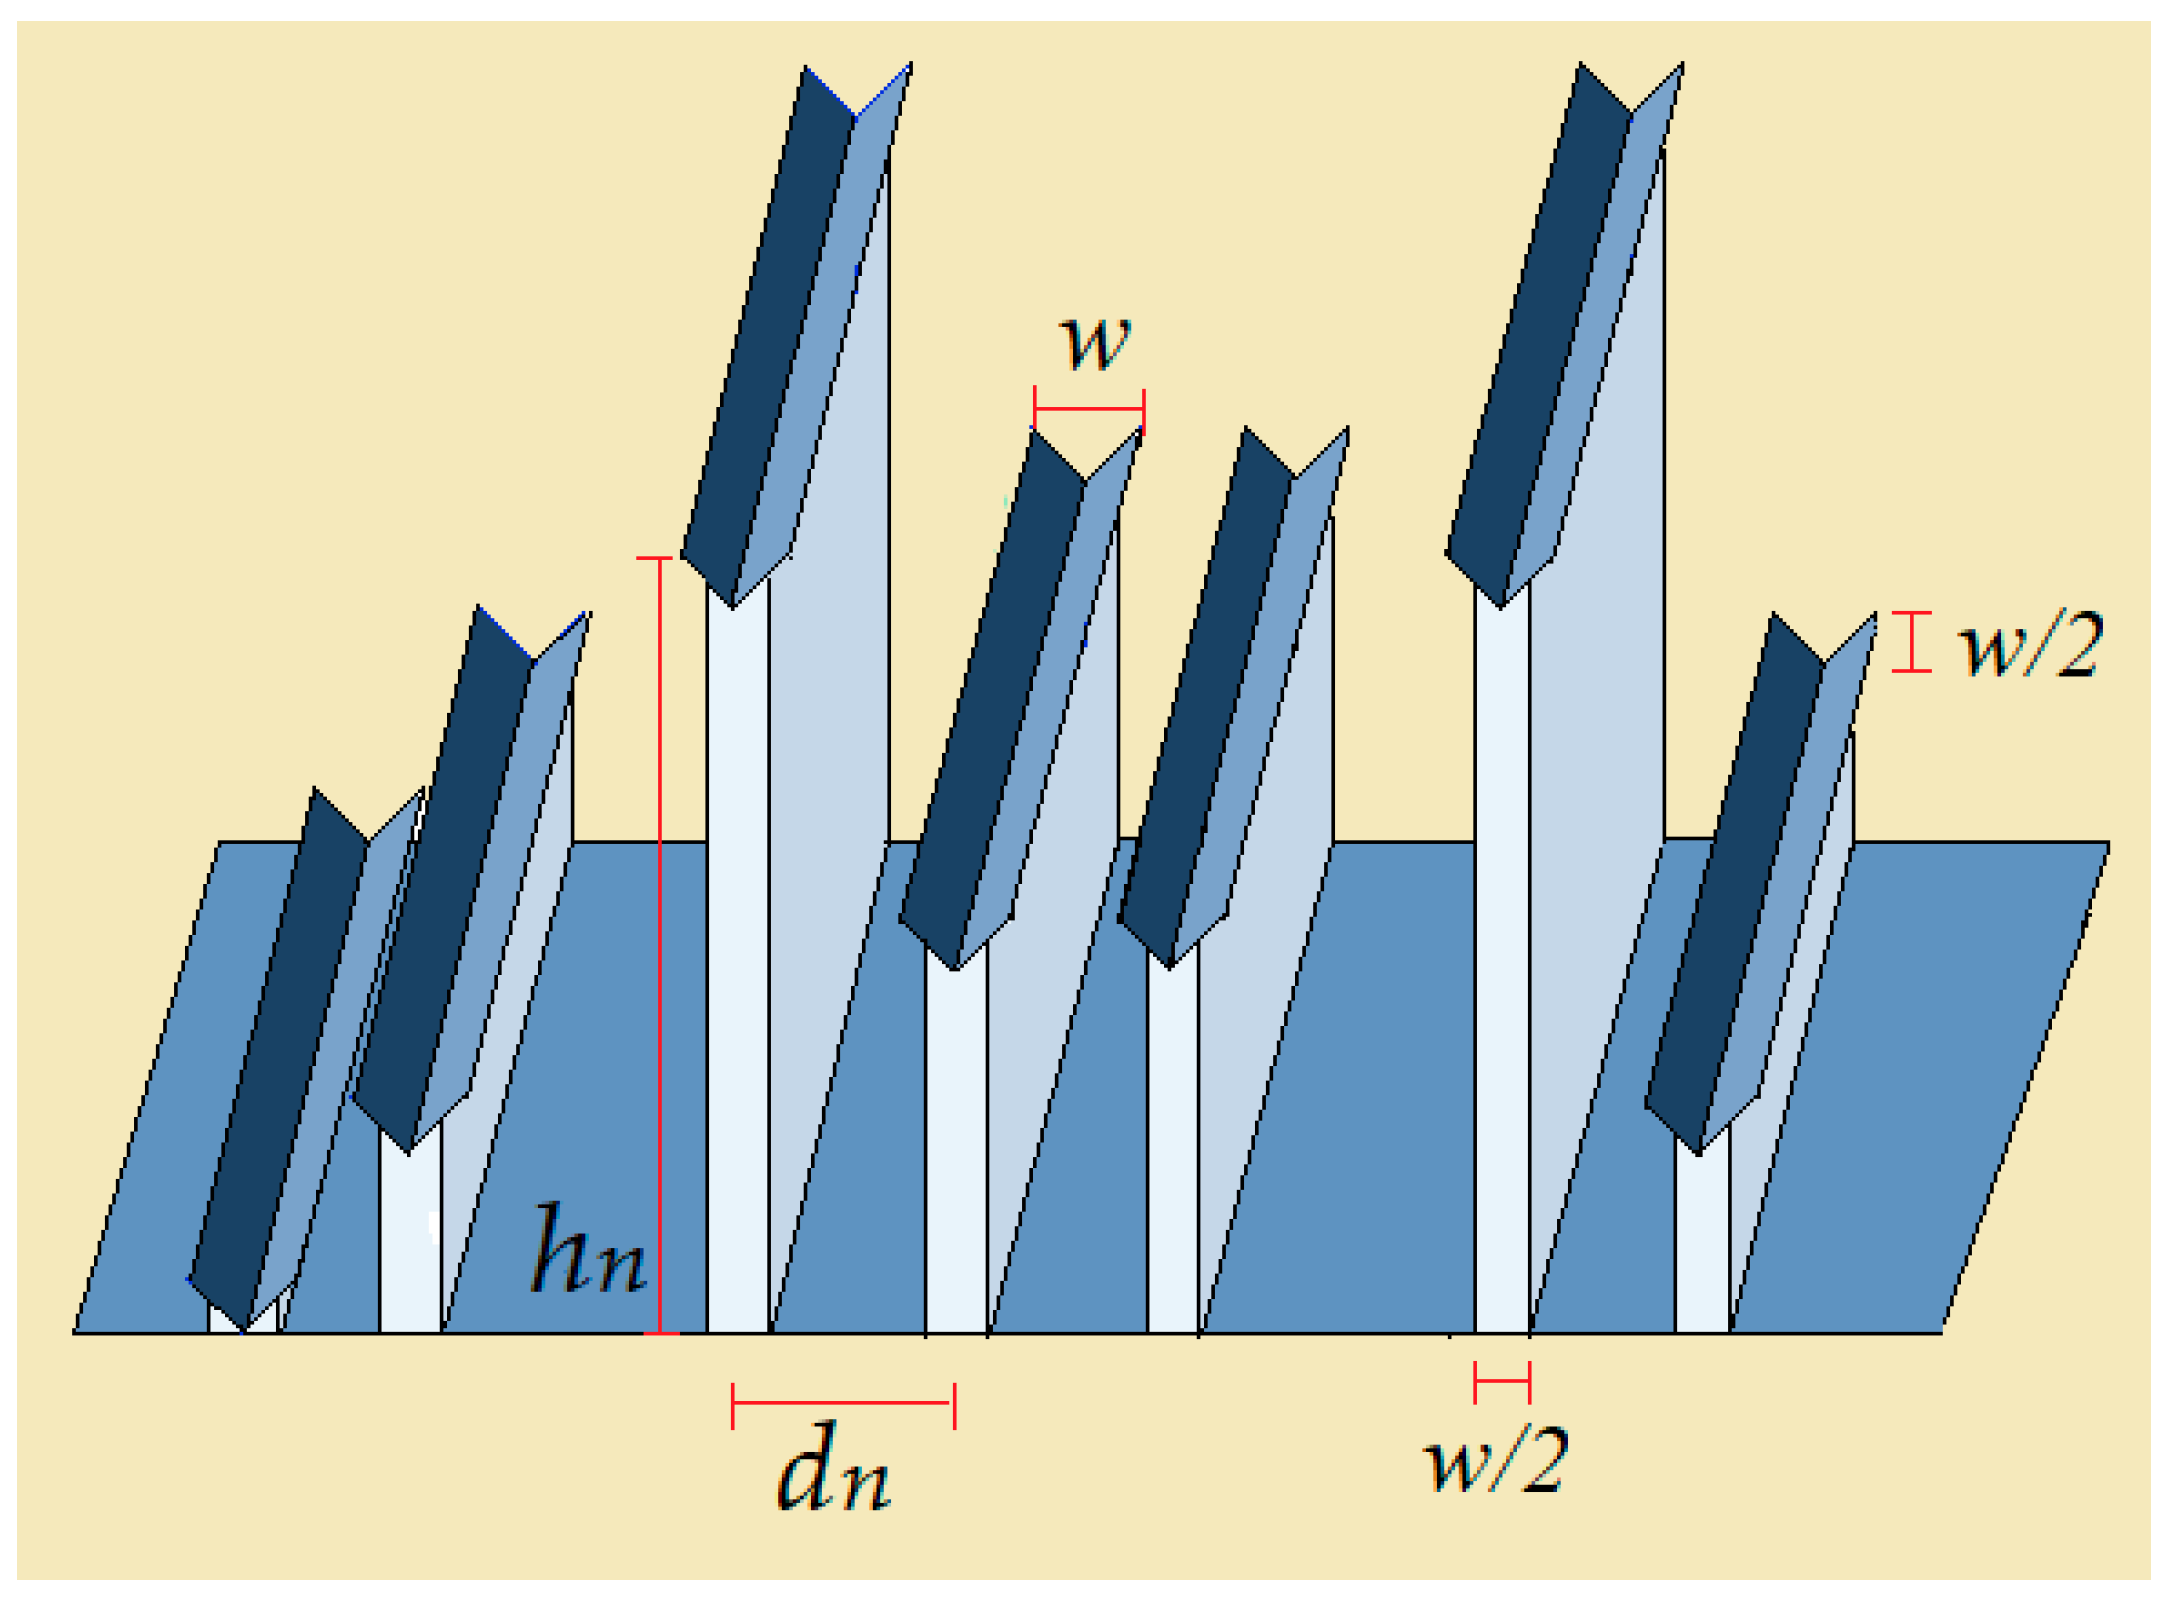
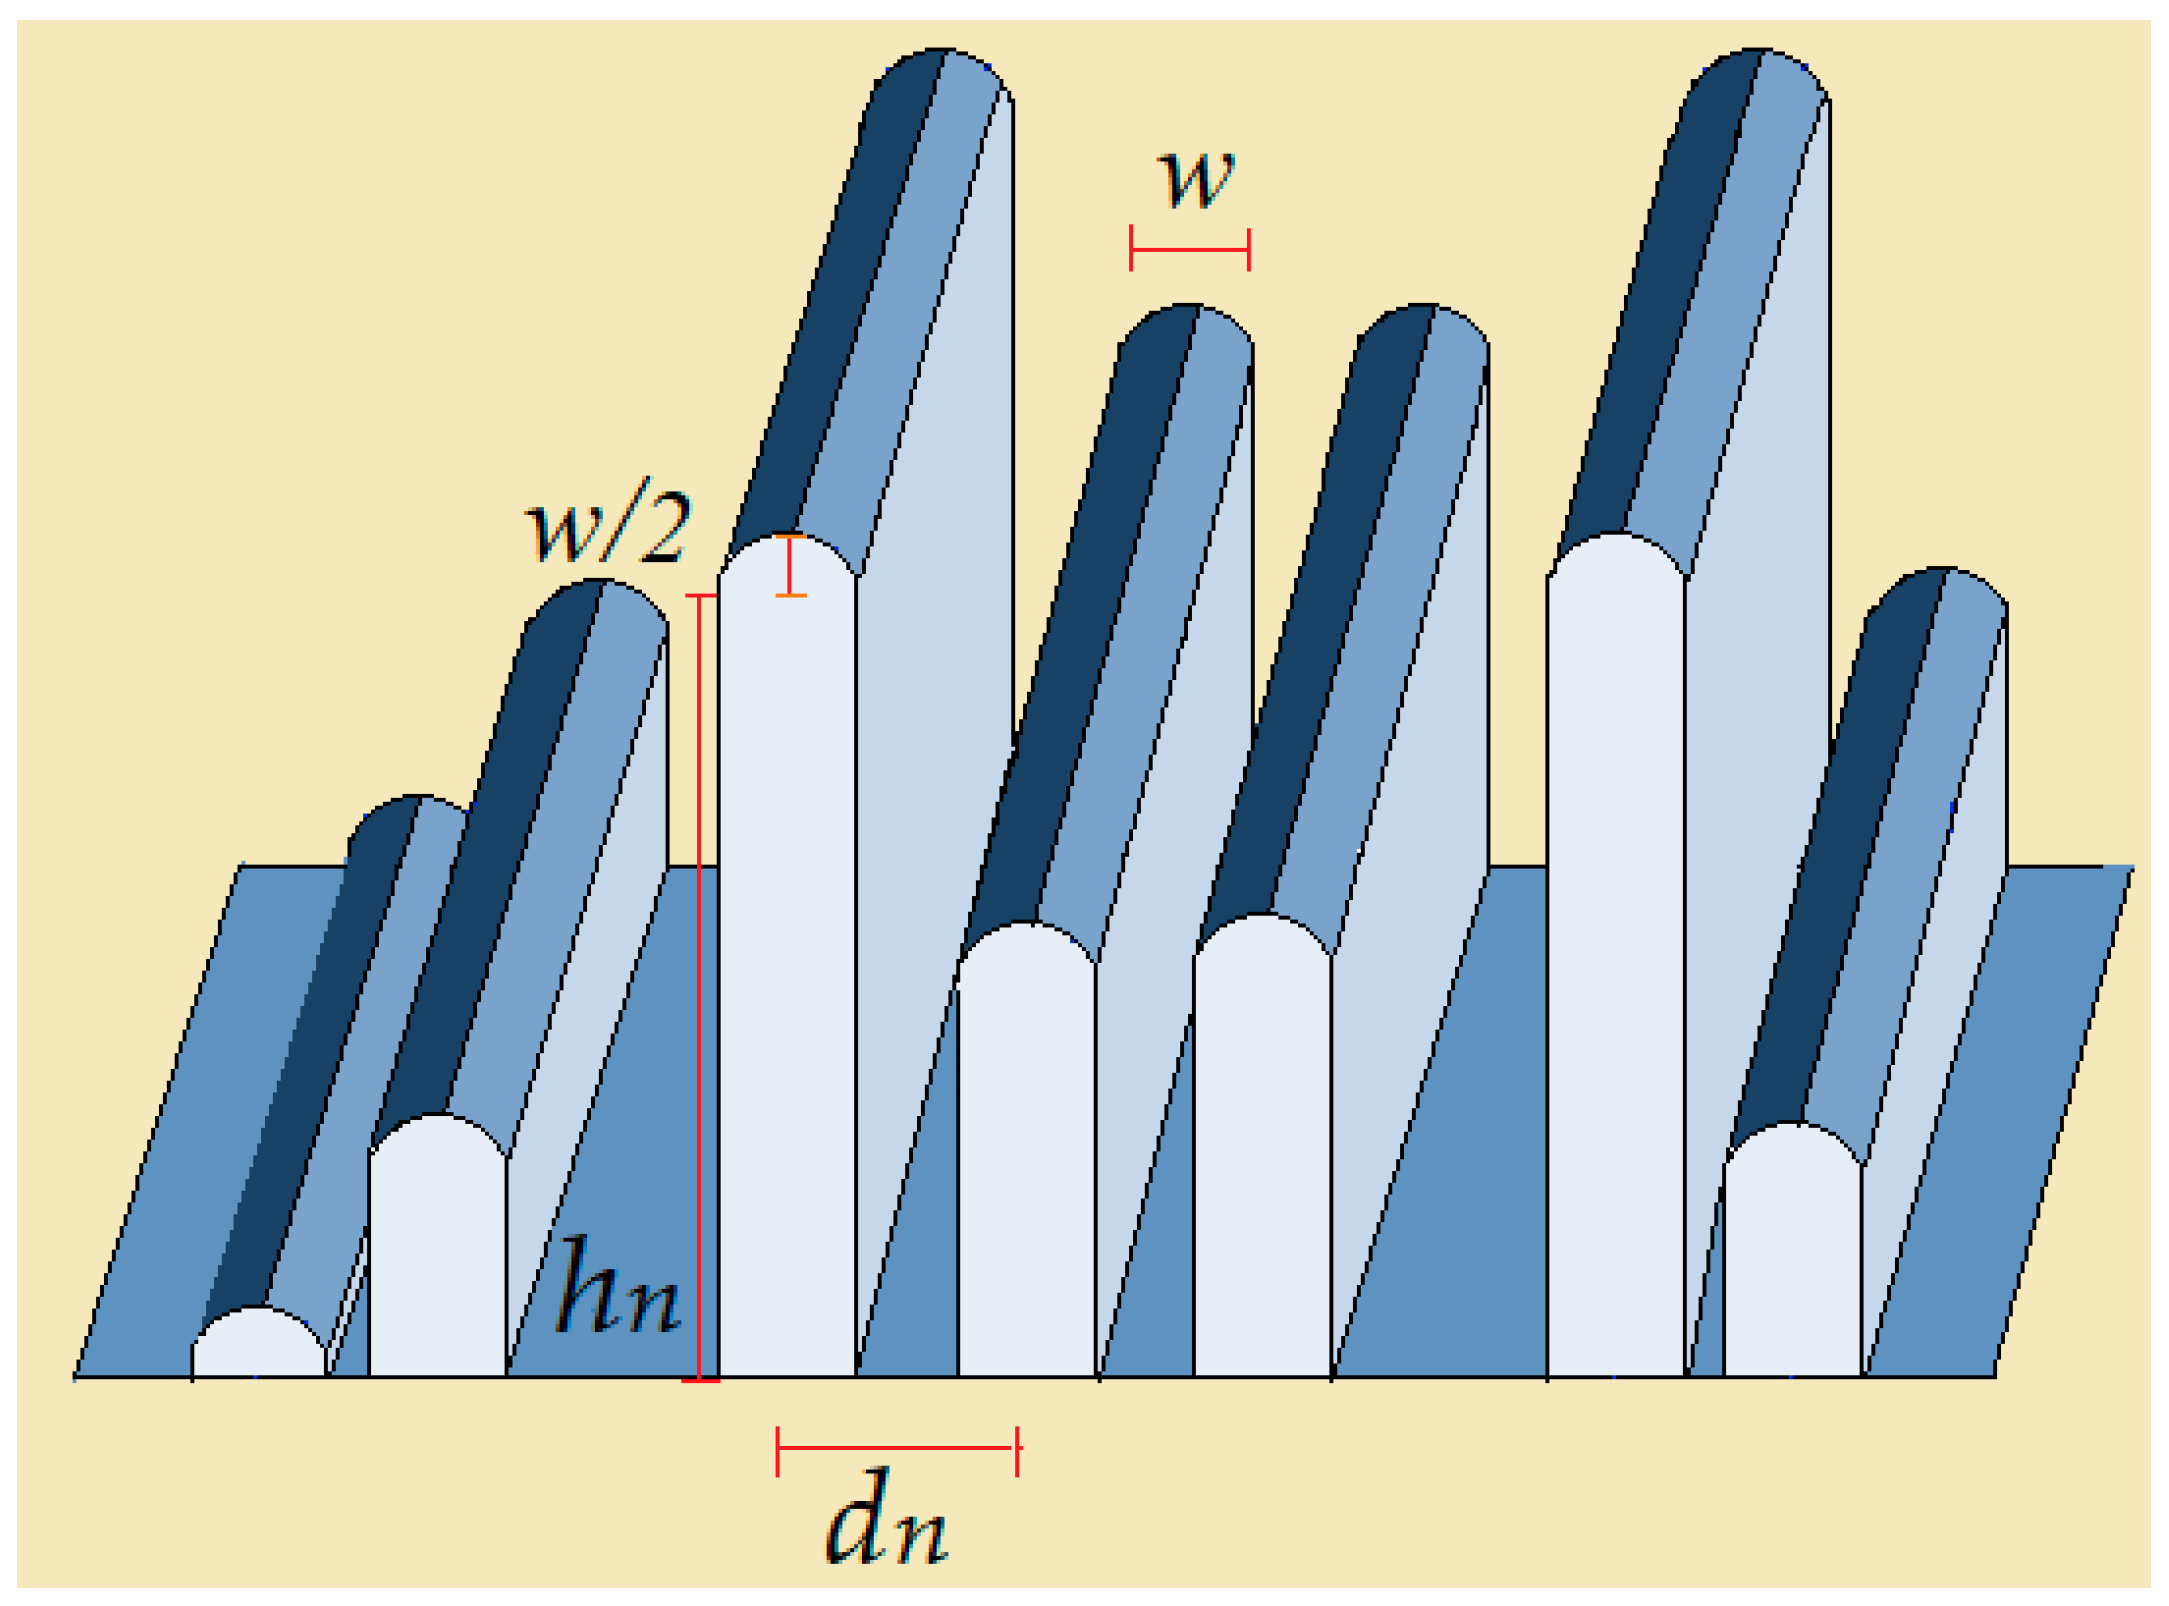
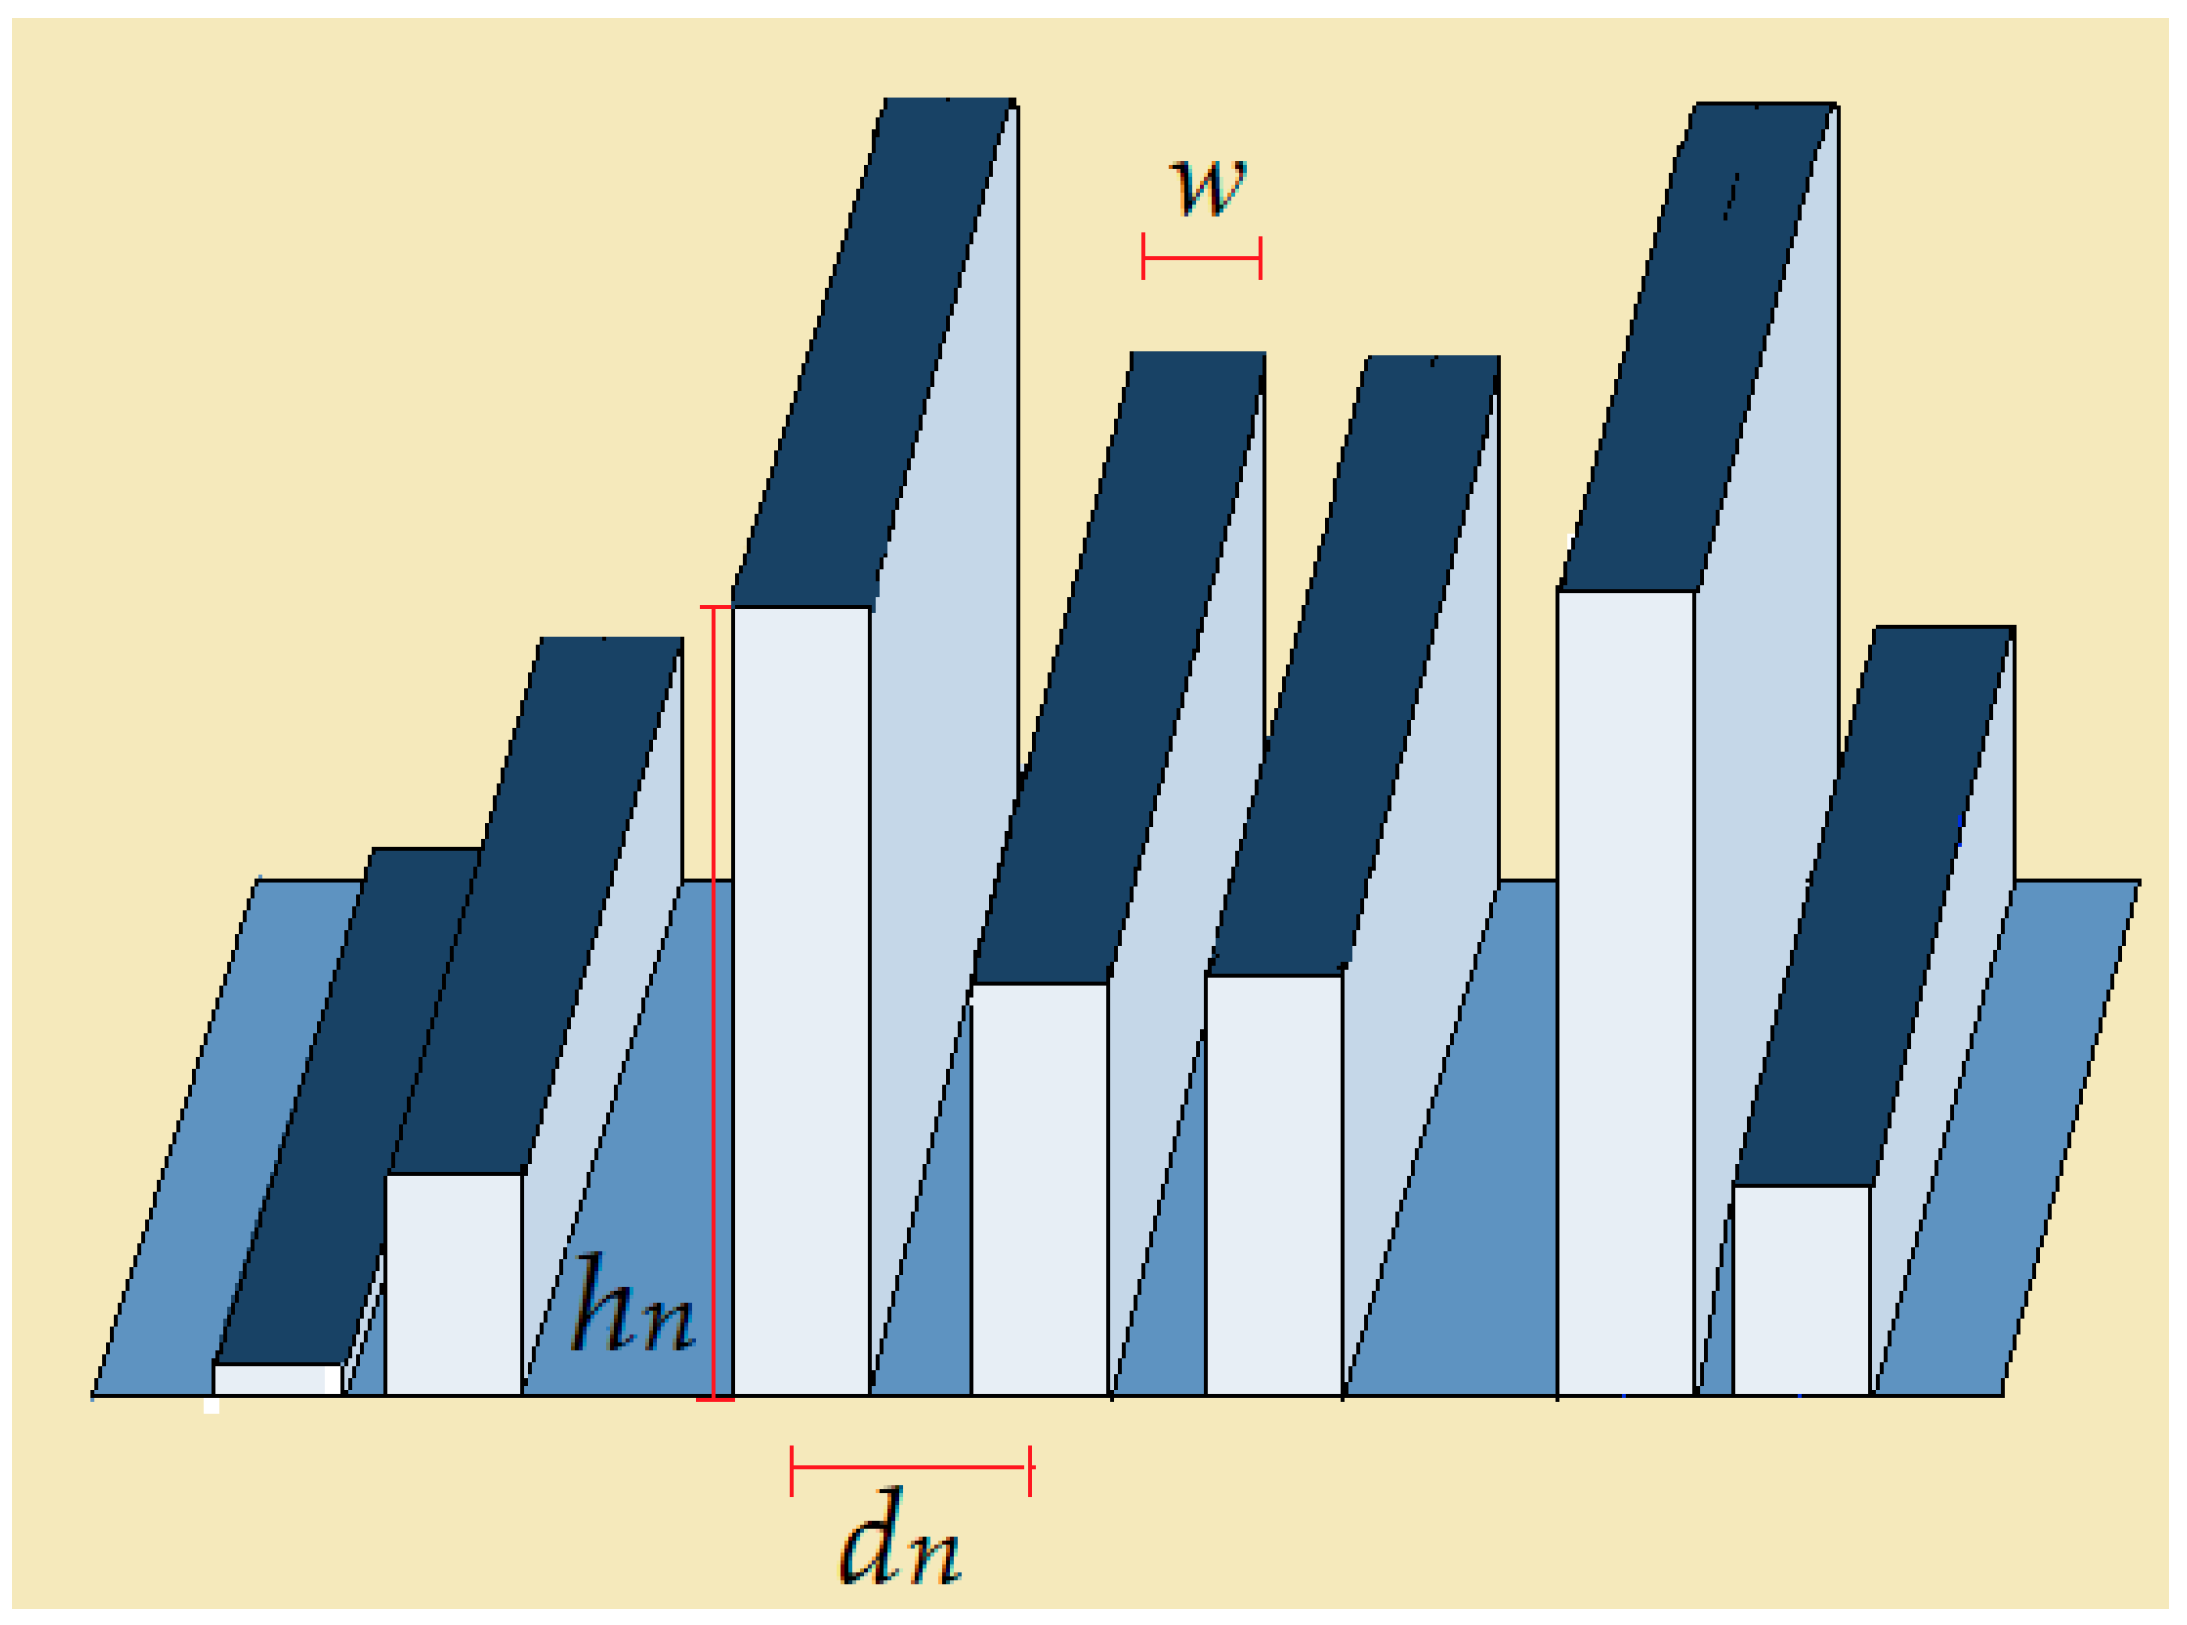
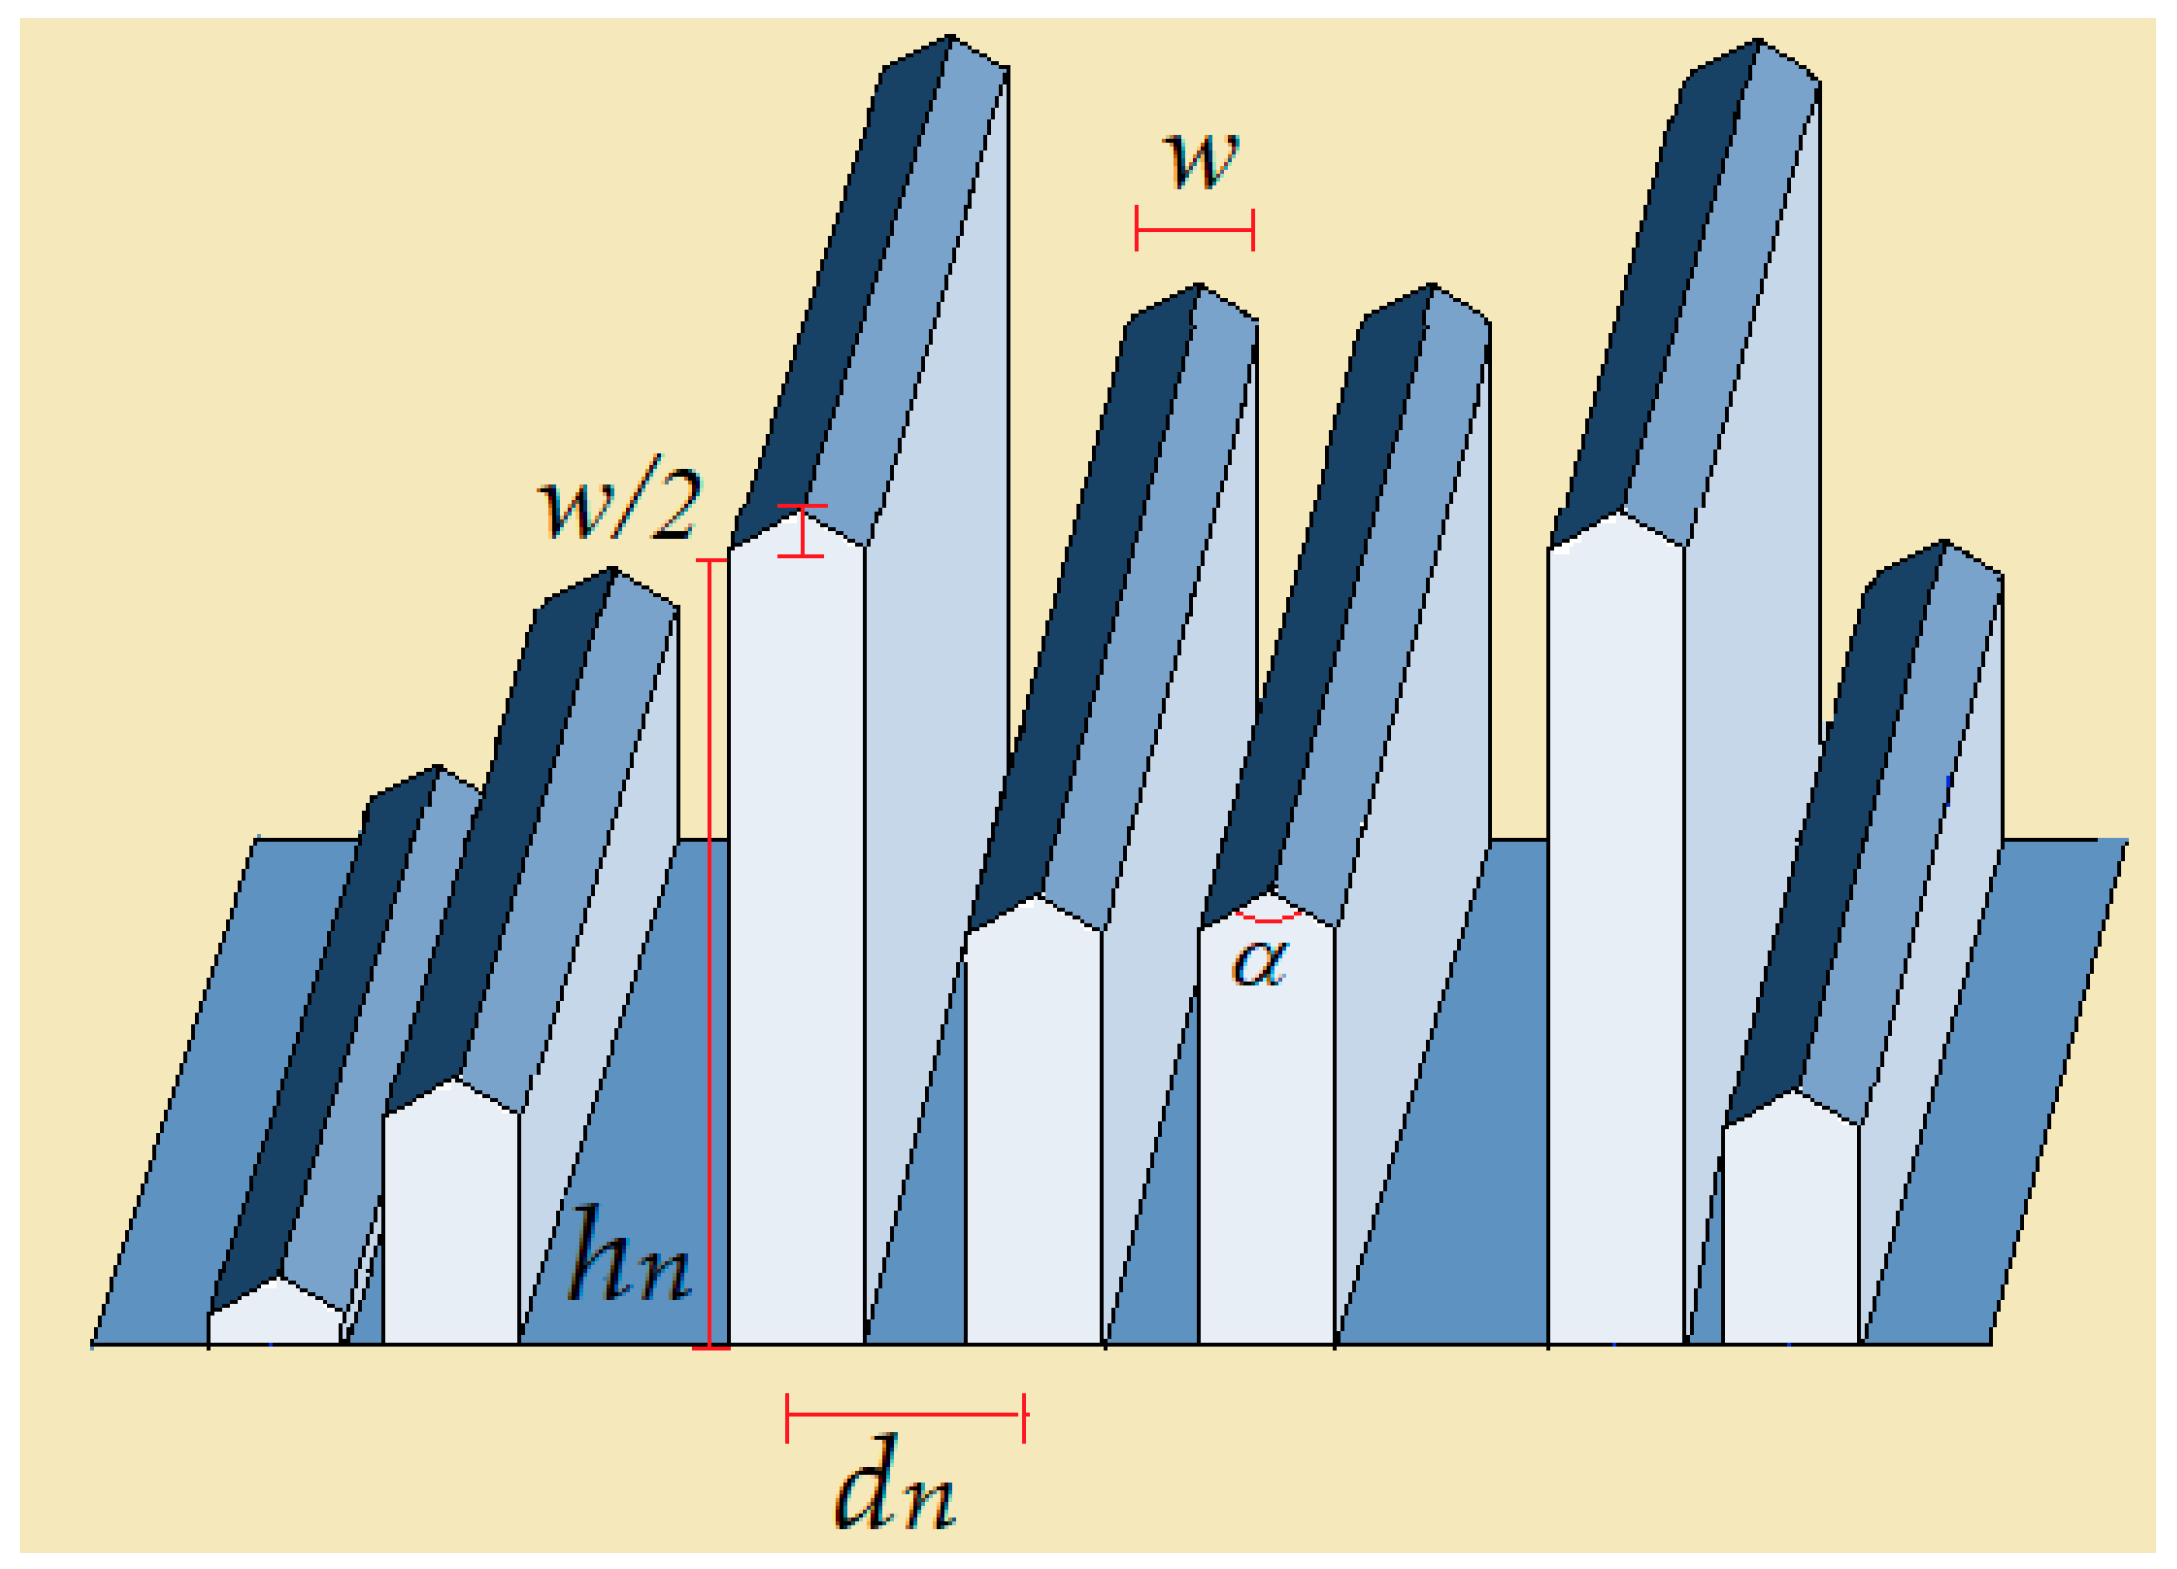
An auditorium model with an inclined floor of 30 degrees was considered, with a source over the stage at a 2.0 m absolute height, a maximum height of the ceiling of 15 m, and a spacing between the seat rows of 1.0 m. The received signal was monitored in five different seat rows, the 1st, 5th, 10th, 15th, and 20th, horizontally located at a distance of 1.73, 5.73, 10.73, 15.73, and 20.73 m from the source, respectively. The height of the receivers was fixed at 1 m from the floor.
Theoretically, in the absence of any reflecting panel, and assuming ceiling specular reflection, the differences in the delay time between the direct acoustic path and the first reflected acoustic path for the scenario presented in Figure 3 would be greater than the maximum recommended delay of 30 ms if listeners were to be closer than the 10th–11th rows from the source (Figure 4).
In view of the above, the use of absorbers to cancel reflections beyond the 15th row would not be necessary and not even recommended. In any case, and to test their effectiveness with different angles of incidence, this study was extended up to the 20th row. It should also be clarified that listeners closer to the source usually perceive the direct acoustic ray with far clearer intensity than the one reflected from the ceiling (in the absence of panels or absorbers). Such echoes arrive feebly due to their pronounced angles of reflection. It was, therefore, estimated that the critical area to be especially protected from excessively delayed echoes would be between the 5th and 15th rows.
For the analysis of the diffusers, the contribution of any other combined reflection and diffraction from the walls, seats, and floor apart from the direct path and reflected contribution from the ceiling was neglected (e.g., the panels, walls, and ground were perfectly absorbing). The simulations focused on the reflection and diffraction between the diffusers and the ceiling. The ceiling was assumed to be acoustically ‘rigid’, with a reflection factor close to 1 for the whole frequency band under analysis. Materials such as concrete or fiberglass typically exceed an acoustic impedance of 2 Mrayls for the studied frequency band [67]. Therefore, values of this magnitude were considered in the undertaken simulations. Both unoccupied closed seats and a populated auditorium were irrelevant for the purpose of this research, as they do not imply any consequence or loss of accuracy for these assumptions either.

2.3. Diffusers

Based on the QRD Schroeder phase grating designs, new variations of these diffusers were proposed using a one-dimensional set of seven (N = 7-ary sequence) equal elements built with the following geometries: Y-shapes, wedges, cylinders, or rectangles. By combining the width, depth, and location parameters of the diffusers, a wider frequency range could be covered.
Figure 5, Figure 6, Figure 7 and Figure 8 show the arrangement obtained keeping those parameters for all said structures.
dn is the separation between adjacent diffusers, hn is the height (or depth) for each one, and w is the maximum width or thickness of each diffuser.
The structure with Y elements (Figure 5) has a weaker structural appearance than in other cases (with a thickness of w/2); however, there is no problem in increasing the thickness of the walls of the Y elements below their ‘V’ head (diffracting cap) because their acoustic performance will be the same. The wall thickness can only affect the absorption of waves passing through the wall as well as the phase of waves trapped between the gaps of adjacent walls. These sound waves follow paths that either do not reach the receiver or arrive very weakly, so their contribution is negligible compared with the diffracted signals at the diffuser heads.
For the selection of the width of the structures, the maximum frequency was considered, in such a way that
λ m i n = c f m a x
w = λ m i n 2
Having selected the maximum frequency of design as 5000 Hz, the width was:
w = c 2 · f m a x 340 2 · 5000 = 0.034 m 0.03 m
For both the selection of each height and separation between structures, the Schroeder sequence was followed. Then,
h n = s n · λ 0 2 · N
λ 0 = c f d
s n = n 2 m o d N
Therefore, sn = {0,1,4,2,2,4,1} for N = 7, and fd is the minimum frequency of design, defined as 500 Hz. Therefore, λo = 341/500 = 0.682 m, and hn = {0, 0.05,0.2, 0.1, 0.1, 0.2, 0.05 m}.
In the same manner, the separations between the structures were not fixed, but they were obtained considering (12):
d n = s n + 1 · w 2
Therefore, dn = {0.015, 0.06, 0.03, 0.03, 0.06, 0.015} m.

2.4. Theoretical Method

The software tool selected for the simulation was developed for the authors and is called PARDOS [68], which is based on an innovative two-dimensional (2.5 D if we consider the reflection from the floor or ceiling) formulation based on the UTD (uniform theory of diffraction) [69] to analyze multiple diffractions/reflections of acoustic waves. Appendix A describes the basics of the physical model developed in this software tool.

3. Results and Discussion

A comparison was made of the estimated attenuation level of the sound pressure spectrum of the different diffusers along the whole frequency band (from 10 Hz to 10 kHz).
Acoustic attenuation is defined as the calculation of the energy loss of sound propagation through an acoustic transmission medium from the source to the listener. In the absence of any reflection or diffraction between the source and the receiver, only free-space propagation attenuation would occur, which would depend primarily on the distance and, to a lesser extent, on the absorption phenomena in the medium.
The analysis was undertaken for up to five different seat rows (the 1st, 5th, 10th, 15th, and 20th) and five structures: rectangles, cylinders, edges, wedges, and Y-shapes (Figure 9, Figure 10, Figure 11, Figure 12, Figure 13, Figure 14 and Figure 15). Simulations were carried out in the absence of any reflecting panel, which allowed us to shorten the time delay gaps, and without any other signal contributions besides those from the ceiling and absorber structures. Just the reflection and diffraction between the single diffuser elements and ceiling were considered besides the direct path. The overall parameters selected for all the simulations are summarized in Table 1:
The specific resistance, reactance, and density of any element integrated into the structures of the absorbers were the same for all of them and were that of rigid materials considered perfectly reflective. In other words, the absorption mechanism was not attributed to the nature of the material itself but to the reflection and diffraction processes that exist due to its geometry.
In the following figures, the sound attenuation level for the different structures and five rows of seats are presented in the whole frequency band. The plots for the seats of rows 1 and 5 are split into two sub-bands, and only the envelope of the evolution of the losses for all figures is shown. All this pursues the aim of endowing the plots with the maximum definition.
Together with the attenuation of each diffuser, the free-space attenuation of sound from the source to the listener, in the absence of obstacles, is overlaid. Perfect absorption by the diffusers would perfectly match the free-space propagation curve.
It is verified how the fluctuations in the propagation losses in the case of row 1 of seats were quite significant and similar in all the proposed structures.
The figures show that none of the diffusers proposed for the first row of seats achieved the intended purpose. They generated high scattering which, instead of producing acoustic absorption, caused the signal level to fluctuate rapidly and periodically as a function of the frequency above or below the received level of the free-space propagation (black trace line). These variations were caused by constructive or destructive signal interference in the receiver due to the phase-coherent summation of all acoustic contributions.
Because of the above, the use of said structures in the closest proximity to the stage seemed to be less effective, although better performance was still achieved by using the Y-shaped structures.
The substantial variation in the attenuation losses of certain structures (cylinders, edges, and wedges) for seat row 5 was also noticeable. Only rectangles and Y-shapes kept quite close to an ideal situation of perfect absorption; however, the Y-shaped structures kept showing the best performance in terms of acoustic attenuation.
The reason for this behavior could be explained by the large differences in the time delay between the direct ray and the replicas from the location of the diffusers for seat rows 1 and 5 (as shown in Figure 4). The existing delays between the direct ray and echoes that are not properly eliminated create signal fluctuations where listening becomes unpleasant and even unintelligible. In the case of the ‘Y’-shaped and rectangular structures, the absorption was most effective in row 5, where the fluctuation was significantly reduced by virtually eliminating the echoes from the ceiling.
In Figure 13, Figure 14 and Figure 15, the attenuation fluctuations for all structures are clearly less than those in closer rows of seats (first and fifth), especially for higher frequencies, where the attenuation curves converge progressively toward the losses in free space. The diffusers increased their performance as absorbents, and the Y-shaped structures remained the best compared with the rest. Given the graphs presented, we can conclude that the best results for all rows of seats correspond to the Y-shaped diffusers since they provided the most similar behavior to an ideal free-space environment that does not show attenuation fluctuation. It is also visible that at the lower frequencies, the discrepancy in the losses in free space was more evident for all the designed diffuser models, although the Y-shaped diffuser maintained excellent performance at low frequencies, except for row 1 (although it was also the best of all diffusers). The standard deviation between the attenuation in free space and each diffuser for each seat row in Table 2 endorses the findings seen in previous graphs.
According to Table 2, the lowest difference between the attenuation in free-space propagation (in the absence of any reflection or diffraction) and the sound attenuation caused by the auditorium with the ceiling and diffusers was caused by the Y-shaped one, with a standard deviation lower than any other and in all rows of seats. The QRD structures with rectangles also showed good behavior despite not being as good as the Y-shaped structures, providing the second-best performance. The worst case in terms of absorption capability was assigned to the edge-shaped diffusers. The absorbent performance of wedges (prisms or pyramids) was more moderate. This could be coherent with some research showing that the reflections from this surface can be specularly concentrated in a few major lobe directions or dispersed [70] but less effective for absorbent purposes. Once the Y-shaped diffuser was identified as the best absorber among those analyzed, an assessment of the SPL in the five rows of seats was undertaken. Only the shouted voice spectrum is shown in Figure 16, as the rest of the spectra (loud, raised, and normal) were symmetrically distributed below this one by a constant margin throughout the entire spectrum. As the Y-shaped diffusers were found to be the best performers, the analysis of the shouted voice spectrum for other structures was omitted.
The spectrum of “shouted” voices in the five selected rows of seats, with Y-shaped diffusers, is quite similar to that which would be obtained with a clear propagation in free space (i.e., perfect absorption). We must emphasize that Figure 16 shows an acoustically pessimistic situation for the listener, which was just intended to evaluate the absorbent capacity of the diffusers. Multiple diffracting and reflecting echoes received from panels, floor, walls, and other structural elements were not considered. All these acoustic contributions would make the SPL significantly higher and the difference between seat rows also clearly lower, which is an essential advantage of indoor scenarios compared with outdoor ones.
Table 3 shows the global SPL with just one structure of Y-shaped diffusers (Figure 5) located at the ceiling reflection point of the corresponding row compared with ideal free-space propagation (without a ceiling), where it is found that the levels at the listener positions are practically the same.
Acoustic attenuation maps were then simulated by positioning five equal structures of the identified best diffuser built with seven Y-shaped elements. The structures were optimally allocated on the ceiling to remove specular reflections from the transmitter up to the referred five-seat rows. The simulations are plotted at frequencies of 500 Hz, 1 kHz, 2 kHz, 4 kHz, 8 kHz, and 10 kHz in Figure 17, Figure 18, Figure 19, Figure 20, Figure 21 and Figure 22.
The attenuation maps of the auditoriums in the presence of only five diffusers built with seven Y-shaped elements allow us to visually verify that the propagation did not present significant variations in level, especially in the area destined for the seating stands. The attenuation maps clearly show the existence of narrow beams with homogeneous signal levels pointing toward the analyzed rows of seats (e.g., Figure 18). In these beams, the wavefronts generated by the reflection from the ceiling at any frequency were disrupted.
Only as a sample of what is indicated, the attenuation of acoustic pressure at 4 kHz considering specular reflection on the ceiling in the absence of diffusers is presented in Figure 23. The selection of 4 kHz was based on the fact that it is the octave frequency closest to the center of the analysis band.
The cumulative distribution functions (CDFs) of the absolute difference between sound attenuation with free-space propagation and that obtained with and without diffusers (only ceiling specular reflection) at several frequencies and for the whole ‘sounded’ points of the auditorium were also undertaken.
The CDF figures report similar results for all frequencies, showing better agreement (lower differences) with the five structures of the seven Y-shaped elements coupled on the ceiling than in the absence of them. Only the CDF at 4 kHz is depicted in Figure 24. A denser paneling of the ceiling with these structures would further increase the degree of absorption down to the rest of the seats in the stands, and the differences in the CDF representation would be even more conspicuous.

4. Conclusions

This work highlighted the importance of the use and correct location of absorbent structures in auditoriums, or multipurpose rooms mainly intended for speech events, to mitigate echoes or spectrum equalization perceived as a nuisance. These absorbing structures attached to the ceiling can be key to avoiding high-delay reflections in the listener location by acoustic rays slipping away from the reflective panels.
The goal of these absorbent elements is, therefore, not to ‘kill’ the sound but to improve the sensation for the listener by eliminating late reflections out of the echo delay region of 0–30 ms, where reflected components arriving from any direction are gathered by the ear, and the resulting sound seems louder.
New designs of diffuser structures based on Schroeder sequences were created and studied to evaluate the best one among them in terms of absorption. It was verified by means of the selection of standardized speech spectra, a simplified room model, and the PARDOS simulation tool that the new structures proposed with seven Y-shaped elements were the best ones. This statement was based on the comparison of the spectral attenuation of all the structures and the ideal expected attenuation in free space in five different rows of seats. This was also corroborated by the comparison of the statistical deviations between the attenuation in free space and that achieved with the diffuser structures, or by checking the good fit existing in the SPL “shouted” speech spectrum with the free propagation curves in the selected seats at the reception, or by reviewing the attenuation maps at different frequencies and their CDFs.
It was found that none of the proposed diffuser structures appeared to be very effective in reducing late reflections in rows of seats close to the source (row 1). In these cases, the use of traditional absorbing panels would be more appropriate.
This shape of the diffuser with ‘Y’ elements is suitable not only for ceilings but also for walls that can be touched by human hands or other objects.
The authors intend to focus their future research on expanding and validating the present work by considering similar structures formed by Y-shaped elements, changing the angle of their flanks, increasing the sequence of Schroeder elements, or using fractal arrangements.
The authors will devote another line of research to developing methods to increase the acoustic absorption capacity of design structures by filling them with acoustic foam, mineral wool, or fabrics.
Given the size, shape, and symmetry of the proposed shapes, we believe that their practical implementation is workable and scalable.

Author Contributions

Conceptualization, D.P.-Q.; methodology, D.P.-Q.; software, D.P.-Q.; validation, D.P.-Q.; formal analysis, D.P.-Q.; investigation, D.P.-Q. and J.-V.R.; resources, D.P.-Q., J.-V.R. and I.R.-R.; data curation, D.P.-Q., J.-V.R. and I.R.-R.; writing—original draft preparation, D.P.-Q.; writing—review and editing, D.P.-Q., J.-V.R. and I.R.-R.; visualization, D.P.-Q., J.-V.R. and I.R.-R.; supervision, D.P.-Q., J.-V.R. and I.R.-R.; project administration, D.P.-Q.; funding acquisition, D.P.-Q. All authors have read and agreed to the published version of the manuscript.

Funding

This research received no external funding.

Data Availability Statement

The original contributions presented in the study are included in the article material, further inquiries can be directed to the corresponding authors.

Conflicts of Interest

The authors declare no conflicts of interest.

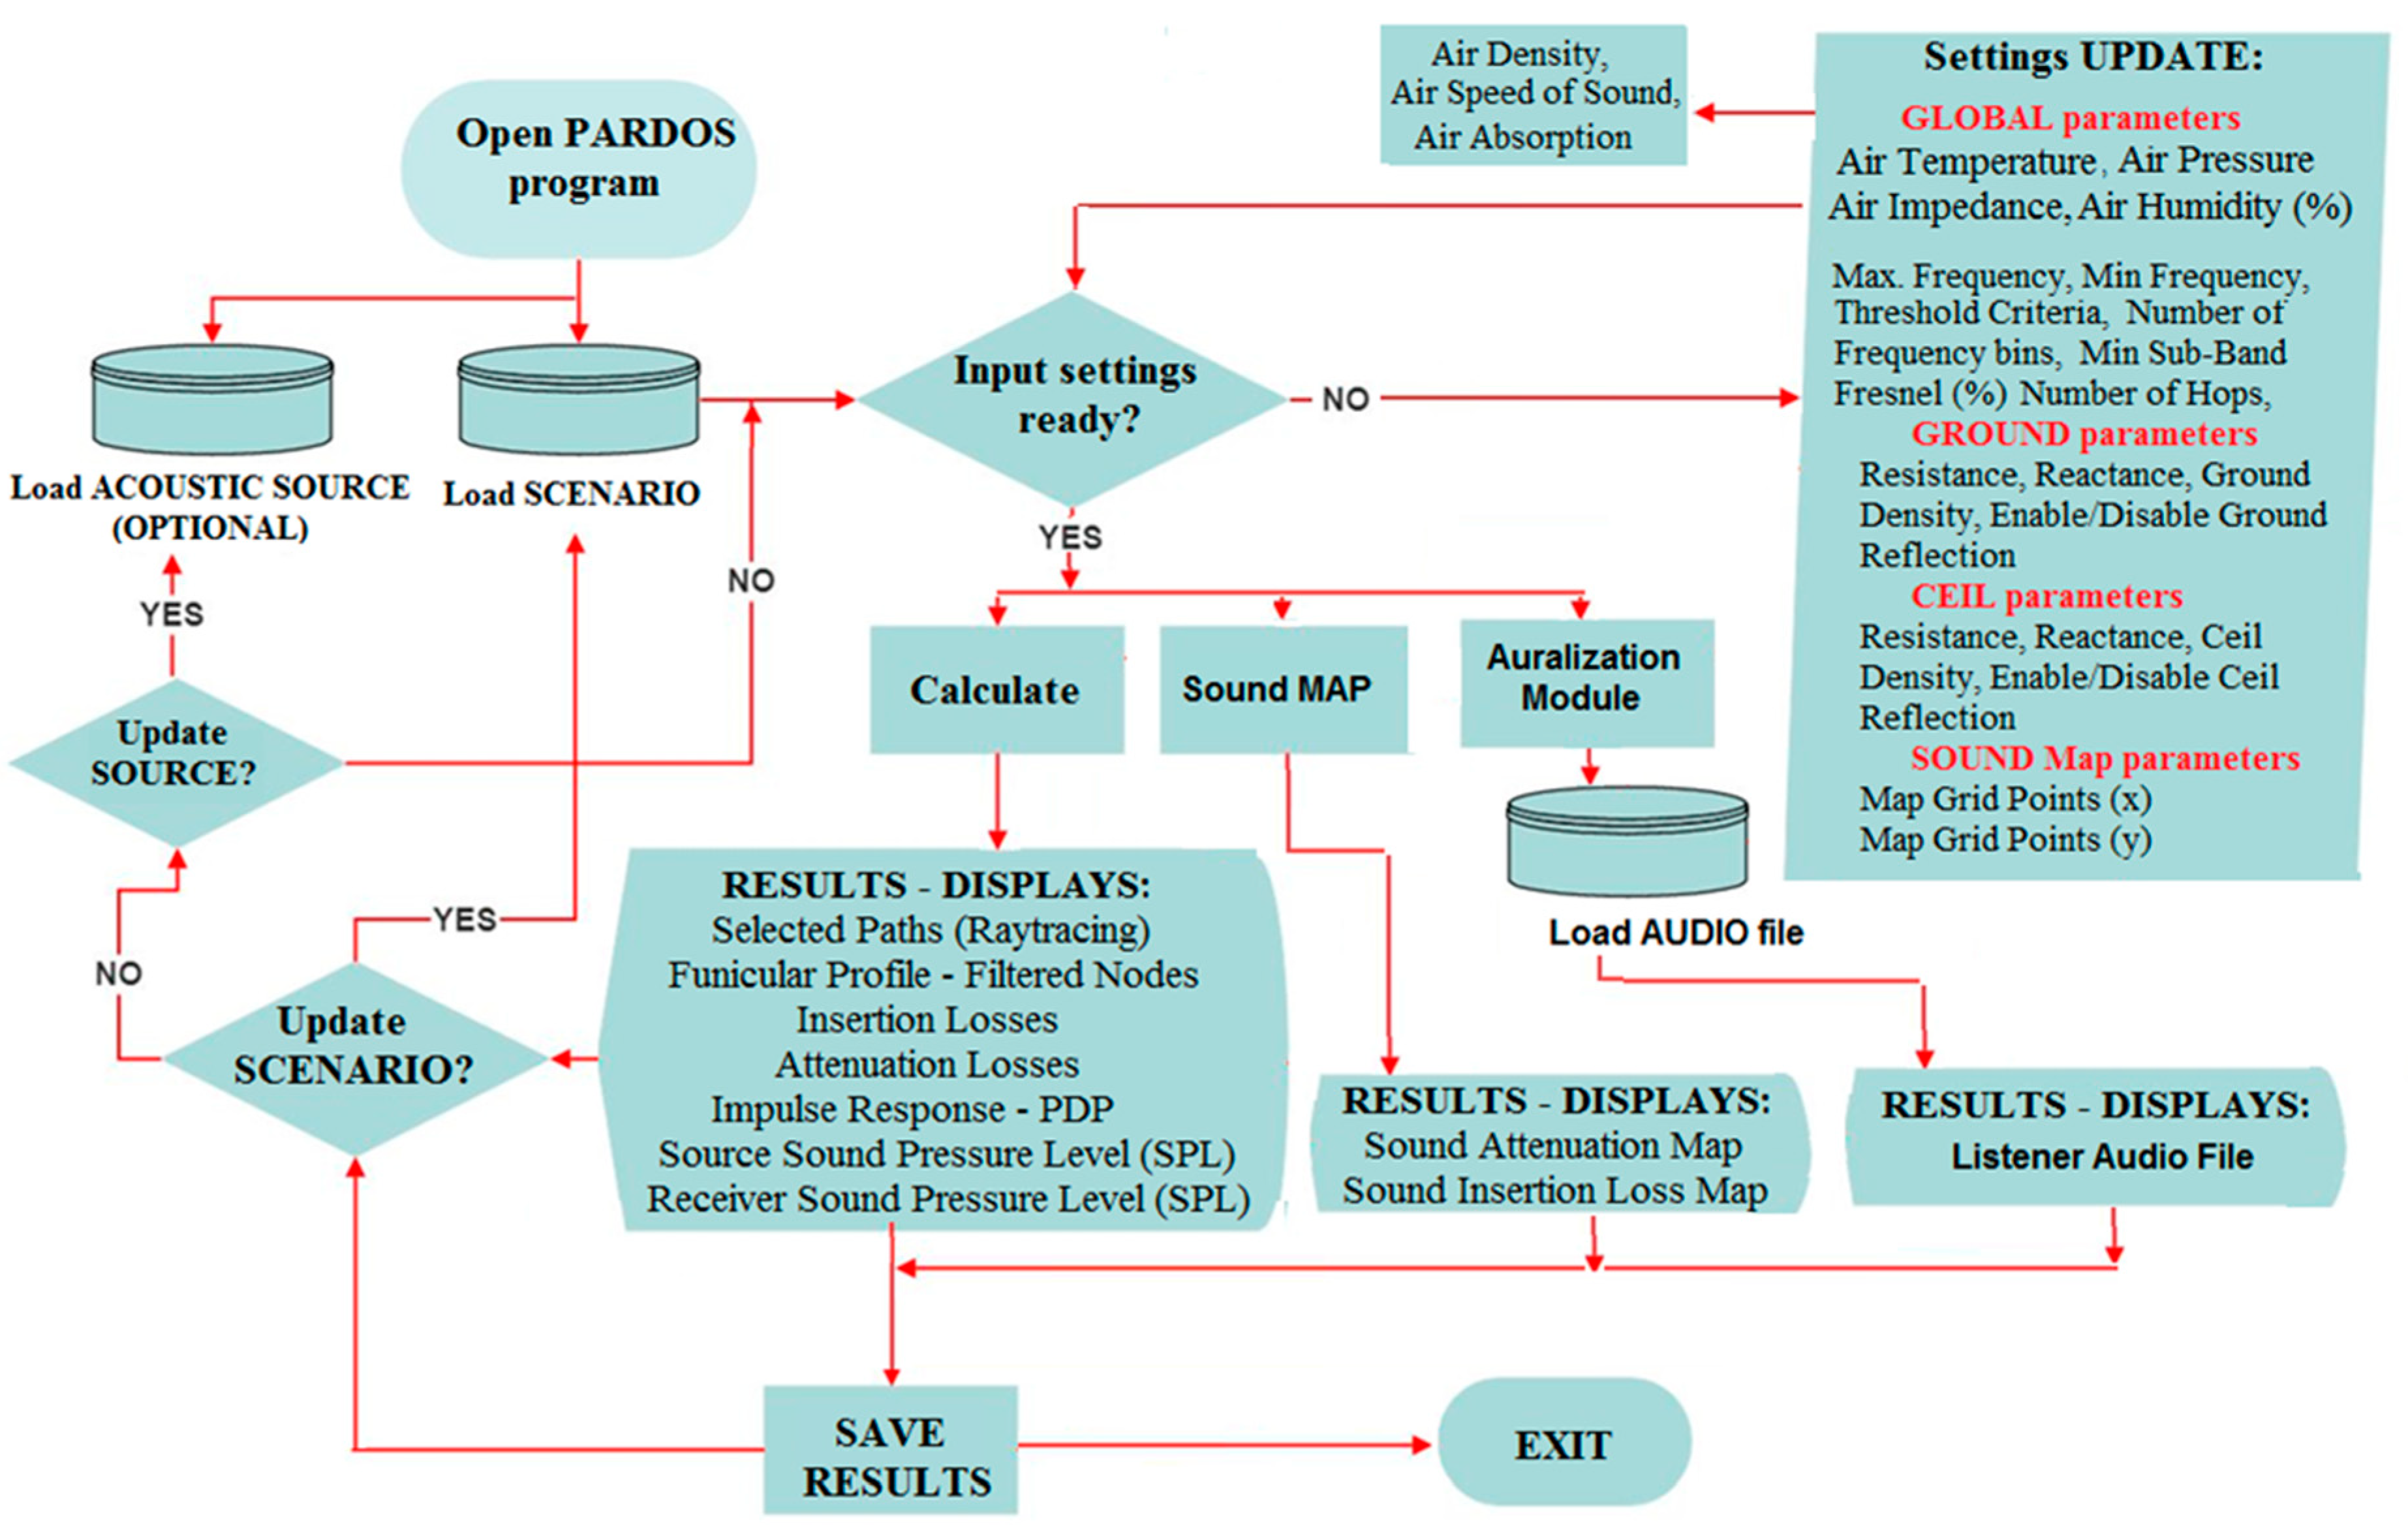
Appendix A. Physical Model of PARDOS Software Tool

The total diffracted and reflected complex pressure field transmitted from a source S at any frequency to the receiver R is the summation of the overall rays impinging on R and coming from all the possible paths:
ϕ t R x = i = 1 n ϕ p a t h   i S , R ,
where Φ path i(S, R) is the complex received field from S to R following the path i.
Each path followed by the sound waves is composed of sections linked by nodes (understood as any relevant reflection or diffraction point between the source and the receiver), which the PARDOS tool can extract and filter from the architectural elements of the environment. This method is built on the foundations of graph theory, Fresnel ellipsoids, and funicular polygons so that consideration is only given to those obstacles (nodes) and paths in any environment that really contribute to the global signal at the receiver.
The phase is considered for every signal in every path relying on the UTD theory and combining the diffraction phenomenon with ray representation. A loop runs each frequency of the whole band to derive the total sound pressure field for the full set of paths at a specific frequency. The complex field at the receiver for all frequencies and all paths is calculated using the following expression:
ϕ p a t h   i = ϕ 0 s T · e j k s T · n = 1 N 2 D n R n · s T j = 1 N 1 s j · γ · e α s T
where
  • ϕ 0 represents the SPL from the source;
  • s T = j = 1 N s j , with s j representing the slant distances for the links of paths chosen between each node’s geometrical centers;
  • N represents the number of nodes for every path;
  • k represents the wavenumber;
  • D n represents the diffraction coefficient and R n the reflection coefficient, where the application is dependent on the form of incidence on either the obstacle or ground;
  • γ represents the obstacle coefficient factor;
  • α is the air-absorbent coefficient in Np/m. In turn, this parameter depends on the following input variables, which are related to the source’s frequency emission (f) and the physical properties of the air: static pressure (Ps), Celsius temperature (T), and percentage relative humidity (H).
According to the UTD, the pressure diffraction coefficient for knife edges and wedges can be defined as:
D v , k , L , s 1 , s 2 , θ 2 , θ 1 = e i π 4 2 v 2 π k · t a n 1 π + θ 2 θ 1 2 v · F k L a + θ 2 θ 1 , v + t a n 1 π θ 2 θ 1 2 v · F k L a θ 2 θ 1 , v + R n · t a n 1 π + θ 2 + θ 1 2 v · F k L a + θ 2 + θ 1 , v   + R 0 · t a n 1 π θ 2 + θ 1 2 v · F k L a θ 2 + θ 1 , v   ,
with R 0 and R n representing the reflecting coefficients for adjacent/opposite obstacle faces seen by the incident wave, and F[x] represents the “transition function”, which can be defined as a Fresnel integral [69].
The authors have further explained, demonstrated, compared, and validated such a method and formulation in [41,68,71].
This makes it possible to predict sound attenuation quickly, accurately, and efficiently, something that is difficult to achieve using alternative techniques that require more time, e.g., the boundary element method (BEM). This method allows managing a substantial number of obstacles (including adjacent ones of the same height) in a sufficiently short time and high-frequency resolution. Obstacles such as cylinders, rectangles, wedges, or knife edges, as well as many other polygonal deflecting obstacles, e.g., T- or Y-shaped barriers or trapezoids, can be easily modeled. PARDOS assumes spherical propagation, provides for surface impedances on both obstacles and the floor, and allows adjusting the environment parameters and ensuing air absorption.
The flowchart in Figure A1 indicates the step-by-step process to obtain the available results with PARDOS.
Figure A1. PARDOS flow diagram.
Acoustics 06 00012 g0a1

References

  1. Hui, A.; Kursell, J.; Jackson, M.W. (Eds.) Music, Sound and the Laboratory from 1750 to 1980 (Osiris); University of Chicago Press: Chicago, IL, USA, 2013; Volume 1. [Google Scholar]
  2. Gouk, P. Music, Science and Natural Magic in Seventeenth-Century England; Yale University Press: New Haven, CT, USA, 1999. [Google Scholar]
  3. Hui, A. The Psychophysical Ear: Musical Experiments, Experimental Sounds, 1840–1910; The MIT Press: Cambridge, MA, USA, 2012. [Google Scholar]
  4. Thompson, E. The Soundscape of Modernity: Architectural Acoustics and the Culture of Listening in America, 1900–1933; The MIT Press: Cambridge, MA, USA, 2002. [Google Scholar]
  5. D’Orazio, D.; Silingardi, V.; De Cesaris, S.; Garai, M. Musician-oriented stage measurements in Italian historical theatres. J. Temporal Des. Arch. Environ. 2015, 12, 76–82. [Google Scholar]
  6. Topa, M.D.; Toma, N.; Kirei, B.S.; Sărăcuţ, I.; Farina, A. Experimental Acoustic Evaluation of an Auditorium. Adv. Acoust. Vib. 2012, 2012, 868247. [Google Scholar] [CrossRef]
  7. Long, M. Architectural Acoustics; Elsevier Academic Press: Amsterdam, The Netherlands, 2014; pp. 666–682. [Google Scholar]
  8. Rossing, T.D. Springer Handbook of Acoustics; Springer: Berlin/Heidelberg, Germany, 2014; pp. 306–323. [Google Scholar] [CrossRef]
  9. Everest, F.A.; Pohlmann, K.C. Master Handbook of Acoustics, 5th, ed.; McGraw-Hill: New York, NY, USA, 2009; Volume 5. [Google Scholar] [CrossRef]
  10. Schroeder, M.R. Diffuse sound reflection by maximum-length sequences. J. Acoust. Soc. Am. 1975, 65, 958–963. [Google Scholar] [CrossRef]
  11. Schroeder, M.R. Toward better acoustics for concert halls. Phys. Today 1980, 33, 24. [Google Scholar] [CrossRef]
  12. D’Antonio, P.; Cox, T. Two decades of sound diffuser design and development—Part 1: Applications and design. J. Audio Eng. Soc. 1998, 46, 955–976. [Google Scholar]
  13. Cox, T.J.; D’Antonio, P. Thirty years since “diffuse sound reflection by maximum length sequences”: Where are we now? J. Acoust. Soc. Am. 2005, 118, 2016. [Google Scholar] [CrossRef]
  14. Cox, T.J. Acoustic diffusers: The good, the bad and the ugly. In Proceedings of the Institute of Acoustics, Reproduced Sound 20th Conference, Oxford, UK, 9 September 2004. [Google Scholar]
  15. Mahmoud, F.; Kablief, Z.; Mohammadreza, M.; Mahdieh, N. Using the Schroeder diffuser to improve parallel noise barriers’ performance. Noise Control Eng. J. 2014, 62, 210–217. [Google Scholar] [CrossRef]
  16. Buret, M.; Iu, K.K.; Lam, Y.W.; Leung, C. Application of quadratic residue diffusers to transportation noise control. In Proceedings of the 37th International Congress and Exposition on Noise Control Engineering, Paper no. 0164, Shanghai, China, 26–29 October 2008. [Google Scholar]
  17. Huang, J.; Dupont, P.; Undurti, A.; Triedman, J.; Cleveland, R. Producing diffuse ultrasound reflections from medical instruments using a quadratic residue diffuser. Ultrasound Med. Biol. 2006, 32, 721–727. [Google Scholar] [CrossRef] [PubMed]
  18. Cox, T.J. The optimization of profiled diffusers. J. Acoust. Soc. Am. 1995, 97, 2928–2936. [Google Scholar] [CrossRef]
  19. Cox, T.J.; Angus, J.A.S.; D’Antonio, P. Ternary and quadriphase sequence diffusers. J. Acoust. Soc. Am. 2006, 119, 310–319. [Google Scholar] [CrossRef]
  20. Cox, T.J.; Hughes, R.J.; Angus JA, S.; Pogson, M.A.; Whittaker, D.M.; Gehring, G.A. Acoustics Research Centre, University of Salford, Salford Diffusive benefits of cylinders in front of a Schroeder diffuser. J. Acoust. Soc. Am. 2010, 128, 3. [Google Scholar]
  21. Szeląg, A.; Rubacha, J.; Pilch, A.; Majchrzak, A.; Kamisinski, T. Reflective panels with Schroeder diffusers—A measure to broaden the effective frequency range of sound reflection from overhead stage canopies. Appl. Acoust. 2020, 157. [Google Scholar] [CrossRef]
  22. Tomaz, R. A Way to innovate Schroeder Type Diffusers. In Proceedings of the ACUSTICA 2004, 4th Iberoamerican Acoustics Congress, Guimaraes, Portugal, September 2004; p. 156 /p.1. [Google Scholar]
  23. Bolejko, R.; Pruchnicki, P. Sound Diffusers Based on Number Theory with Random Variations of Surface Acoustic Impedance. In Proceedings of the 104th Convention of the Audio Engineering Society, Amsterdam, The Netherlands, 16–19 May 1998; p. 4711. [Google Scholar]
  24. Perry, T. Acoustic Diffuser Design by Optimization: I. Literature Review. Bachelor’s Thesis, University of Victoria, Victoria, BC, Canada, 2011. [Google Scholar]
  25. Dessi-Olive, J.; Hsu, T. Generating acoustic diffuser arrays with shape grammars. In Proceedings of the Sim AUD 2019, Atlanta, GA, USA, 7–9 April 2019. [Google Scholar]
  26. Pilch, A. Optimized diffusers for shoe-box shaped performance halls. Appl. Acoust. 2021, 178, 108019. [Google Scholar] [CrossRef]
  27. Jiménez, N.; Cox, T.J.; Romero-García, V.; Groby, J.P. Metadiffusers: Deep-subwavelength sound diffusers. Sci. Rep. 2017, 7, 5389. [Google Scholar] [CrossRef] [PubMed]
  28. Commins, D.E.; Auletta, N.; Suner, B. Diffusion and absorption of quadratic residue diffusers. Proc. IOA 1988, 10, 223–232. [Google Scholar]
  29. Fujiwara, K.; Miyajima, T. Absorption characteristics of a practically constructed Schroeder diffusers of quadratic residue type. Appl. Acoust. 1992, 35, 149–152. [Google Scholar] [CrossRef]
  30. Fujiwara, K. A study on the sound absorption of a quadratic-residue type diffuser. Acustica 1992, 81, 370–378. [Google Scholar]
  31. Cox, T.J.; D’Antonio, P. Absorption by surface diffusers. In Proceedings of the Proc. IOA Conference Auditorium Acoustics, London, UK, 19–21 July 2002. [Google Scholar]
  32. Cox, T.J.; D’Antonio, P. Acoustic phase gratings for reduced specular reflection. Appl. Acoust. 2000, 60, 167–186. [Google Scholar] [CrossRef]
  33. Wu, T.; Cox, T.J.; Lam, Y.W. From a profiled diffuser to an optimized absorber. J. Acoust. Soc. Am. 2000, 108, 643–650. [Google Scholar] [CrossRef]
  34. Cox, T.J.; D’Antonio, P. Acoustic Absorbers and Diffusers, 2nd, ed.; Taylor & Francis: Abingdon, UK, 2009. [Google Scholar]
  35. Belyaev, I.V.; Golubev, A.Y.; Zverev, A.Y.; Makashov, S.Y.; Palchikovskiy, V.V.; Sobolev, A.F.; Chernykh, V.V. Experimental Investigation of Sound Absorption of Acoustic Wedges for Anechoic Chambers. Akust. Zhurnal 2015, 61, 636–644. [Google Scholar]
  36. Wu, T.; Cox, T.J.; Lam, Y.W. A profiled structure with improved low frequency absorption. J. Acoust. Soc. Am. 2001, 110, 3064–3070. [Google Scholar] [CrossRef]
  37. Wu, T. Profiled Absorbers: Theory, Measurement and Design. Ph.D. Thesis, University of Salfordm, Salford, UK, 2003. [Google Scholar]
  38. Kamisiński, T.; Pilch, A.; Rubacha, J. Large format acoustic structures in the concert halls. In Proceedings of the EuroRegio 2016, Porto, Portugal, 13–15 June 2016. [Google Scholar]
  39. Czerwinski, A.; Dziechciowski, Z. Evaluation of Acoustical Properties of an Auditorium after a Modernisation Program. Acoust. Biomed. Eng. 2014, 4A, 125. [Google Scholar] [CrossRef]
  40. Pangau, C.M.F. Measurement of Acoustic Performance of an Auditorium. J. Phys. Conf. Ser. 2018, 1075, 012042. [Google Scholar] [CrossRef]
  41. Pardo-Quiles, D.; Rodríguez, J.-V.; Molina-García-Pardo, J.-M.; Juan-Llácer, L. Traffic Noise Mitigation Using Single and Double Barrier Caps of Different Shapes for an Extended Frequency Range. Appl. Sci. 2020, 10, 5746. [Google Scholar] [CrossRef]
  42. Kim, Y.H.; Kim, J.H.; Jeon, J.Y. Scale model investigations of diffuser application strategies for acoustical design of performance venues. Acta Acust. United Acust. 2011, 97, 791–799. [Google Scholar] [CrossRef]
  43. Pilch, A.; Kamisiński, T. The Effect of Geometrical and Material Modification of Sound Diffusers on Their Acoustic Parameters. Arch. Acoust. 2011, 36, 955–966. [Google Scholar] [CrossRef]
  44. Redondo, J.; Sánchez-Pérez, J.V.; Blasco, X.; Herrero, J.M.; Vorländer, M. Optimized sound diffusers based on sonic crystals using a multiobjective evolutionary algorithm. J. Acoust. Soc. Am. 2016, 139, 2807–2814. [Google Scholar] [CrossRef] [PubMed]
  45. Cox, T.J.; D’Antonio, P. Fractal Sound Diffusers. In Proceedings of the 103rd Convention of the Audio Engineering Society, New York, NY, USA, 26–29 September 1997; p. 4578. [Google Scholar]
  46. D’Antonio, P.; Konnert, J. The QRD Diffractal: A New One- or Two-Dimensional Fractal Sound Diffusor. J. Audio Eng. Soc. 1992, 40, 117–129. [Google Scholar]
  47. Li, Y.; Jiang, X.; Li, R.; Liang, B.; Zou, X.; Yin, L.; Cheng, J. Experimental realization of full control of reflected waves with subwavelength acoustic metasurfaces. Phys. Rev. Appl. 2014, 2, 064002. [Google Scholar] [CrossRef]
  48. Cummer, S.A.; Christensen, J.; Alù, A. Controlling sound with acoustic metamaterials. Nat. Rev. Mater. 2016, 1, 16001. [Google Scholar] [CrossRef]
  49. Ma, G.; Sheng, P. Acoustic metamaterials: From local resonances to broad horizons. Sci. Adv. 2016, 2, e1501595. [Google Scholar] [CrossRef] [PubMed]
  50. Popa, B.-I.; Cummer, S.A. Non-reciprocal and highly nonlinear active acoustic metamaterials. Nat. Commun. 2014, 5, 3398. [Google Scholar] [CrossRef] [PubMed]
  51. Mei, J.; Ma, G.; Yang, M.; Yang, Z.; Wen, W.; Sheng, P. Dark acoustic metamaterials as super absorbers for low-frequency sound. Nat. Commun. 2012, 3, 756. [Google Scholar] [CrossRef] [PubMed]
  52. Jiménez, N.; Huang, W.; Romero-García, V.; Pagneux, V.; Groby, J.-P. Ultra-thin metamaterial for perfect and quasi-omnidirectional sound absorption. Appl. Phys. Lett. 2016, 109, 121902. [Google Scholar] [CrossRef]
  53. Zhu, Y.; Fan, X.; Liang, B.; Cheng, J.; Jing, Y. Ultrathin acoustic metasurface-based Schroeder diffuser. Phys. Rev. X 2017, 7, 021034. [Google Scholar] [CrossRef]
  54. Kumar, S.; Lee, H.P. The Present and Future Role of Acoustic Metamaterials for Architectural and Urban Noise Mitigations. Acoustics 2019, 1, 590–607. [Google Scholar] [CrossRef]
  55. Lee, D.; Nguyen, D.M.; Rho, J. Acoustic wave science realized by metamaterials. Nano Converg. 2017, 4, 3. [Google Scholar] [CrossRef]
  56. Assouar, B.; Liang, B.; Wu, Y.; Li, Y.; Cheng, J.-C.; Jing, Y. Acoustic metasurfaces. Nat. Rev. Mater. 2018, 1, 460–472. [Google Scholar] [CrossRef]
  57. Redondo, J.; Pico, R.; Roig, B. Time domain simulation of sound diffusers using finite-difference schemes. Acta Acust. United Acust. 2007, 93, 611–622. [Google Scholar]
  58. Cox, T.J.; Dalenback, B.-I.L.; Antonio, P.D.; Embrechts, J.J.; Jeon, J.Y.; Mommertz, E.; Vorlander, M. A tutorial on scattering and diffusion coefficients for room acoustics surfaces. Acta Acust. United Acust. 2006, 92, 1–15. [Google Scholar]
  59. Shtrepi, L.; Astolfi, A.; Puglisi, G.E.; Masoero, M.C. Effects of the Distance from a Diffusive Surface on the Objective and Perceptual Evaluation of the Sound Field in a Small Simulated Variable-Acoustics Hall. Appl. Sci. 2017, 7, 224. [Google Scholar] [CrossRef]
  60. ANSI S3.5 (R2007); American National Standard Methods for the Calculation of the Speech Intelligibility Index. American National Standards Institute: New York, NY, USA, 2007.
  61. ANSI 3.5-1997; American National Standard—Methods for Calculation of the Speech Intelligibility Index. American National Standards Institute: New York, NY, USA, 1997.
  62. Pavlovic, C.V. Derivation of primary parameters and procedures for use in speech intelligibility predictions. J. Acoust. Soc. Am. 1987, 82, 413–422. [Google Scholar] [CrossRef]
  63. ANSI S3.5, 1969; Methods for the Calculation of the Articulation Index. American National Standards Institute: New York, NY, USA, 1986.
  64. Dunn, H.K.; White, S.D. Statistical measurements on conversational speech. J. Acoust. Soc. Am. 1940, 11, 278–288. [Google Scholar] [CrossRef]
  65. French, N.R.; Steinberg, J.C. Factors governing the intelligibility of speech of sounds. J. Acoust. Soc. Am. 1947, 19, 90–119. [Google Scholar] [CrossRef]
  66. Moralesa, M.; Leembruggen, G.; Dance, S.; Shield, B.M. A revised speech spectrum for STI calculations. Appl. Acoust. 2018, 132, 33–42. [Google Scholar] [CrossRef]
  67. Sun, R. Characterization of the Acoustic Properties of Cementitious. Materials. Thesis, Loughborough University, London, UK, 2017. [Google Scholar]
  68. Pardo-Quiles, D.; Rodríguez, J.-V.; Rodríguez-Rodríguez, I. PARDOS: An Educational Software Tool for the Analysis of Sound Propagation. IEEE Access 2020, 8, 194933–194949. [Google Scholar] [CrossRef]
  69. Kouyoumjian, R.G.; Pathak, P.H. A uniform geometrical theory of diffraction for an edge in a perfectly conducting surface. Proc. IEEE 1974, 62, 1448–1461. [Google Scholar] [CrossRef]
  70. Cox, T.J.; D’Antonio, P. Acoustic Absorbers and Diffusers: Theory, Design and Application; Spon Press: London, UK; Spon Press: New York, NY, USA, 2006; ISBN 0415296498. [Google Scholar]
  71. Pardo-Quiles, D.; Rodríguez, J.-V. A Fast UTD-based Method for the Analysis of Multiple Acoustic Diffractions over a Series of Obstacles with Arbitrary Modeling, Height and Spacing. Symmetry 2020, 12, 654. [Google Scholar] [CrossRef]
Figure 1. One-third A-weighted sound power level (Lw) speech spectrum for 4 vocal efforts: normal, raised, loud, and shouted.
Acoustics 06 00012 g001
Figure 2. L p d B ( A ) sound pressure level (1 Hz resolution) speech spectrum for 4 vocal efforts: normal, raised, loud, and shouted.
Acoustics 06 00012 g002
Figure 3. Auditorium model with an elevated seating stand with a 30° inclined floor. Direct and reflected sound paths from the ceiling (red lines) are present in the absence of diffusers and reflected panels.
Acoustics 06 00012 g003
Figure 4. Time delay gap (ms) between direct (line of sight—LOS) and reflected paths as a function of seat row.
Acoustics 06 00012 g004
Figure 5. Diffuser arranged with 7 Y-shaped elements. The whole aperture between flanges of each “Y” is 90°.
Acoustics 06 00012 g005
Figure 6. Diffuser arranged with 7 cylinder-shaped elements. Radii equal to w/2.
Acoustics 06 00012 g006
Figure 7. Diffuser arranged with 7 rectangle-shaped elements (equivalent to N = 7 QRD).
Acoustics 06 00012 g007
Figure 8. Diffuser arranged with 7 wedge-shaped elements with a 100° aperture (α).
Acoustics 06 00012 g008
Figure 9. Acoustic attenuation in seats of row 1. Frequency band span from 0 to 5 kHz.
Acoustics 06 00012 g009
Figure 10. Acoustic attenuation in seats of row 1. Frequency band span from 5 kHz to 10 kHz.
Acoustics 06 00012 g010
Figure 11. Acoustic attenuation in seats of row 5. Frequency band span from 0 to 5 kHz.
Acoustics 06 00012 g011
Figure 12. Acoustic attenuation in seats of row 5. Frequency band span from 5 kHz to 10 kHz.
Acoustics 06 00012 g012
Figure 13. Acoustic attenuation in seats of row 10. Frequency band span from 0 kHz to 10 kHz.
Acoustics 06 00012 g013
Figure 14. Acoustic attenuation in seats of row 15. Frequency band span from 0 kHz to 10 kHz.
Acoustics 06 00012 g014
Figure 15. Acoustic attenuation in seats of row 20. Frequency band span from 0 kHz to 10 kHz.
Acoustics 06 00012 g015
Figure 16. SPL for shouted voice in free space and Y-shaped diffusers in 1st, 5th, 10th, 15th, and 20th rows.
Acoustics 06 00012 g016
Figure 17. Sound attenuation map at 500 Hz. The position of the acoustic source is indicated by a red dot.
Acoustics 06 00012 g017
Figure 18. Sound attenuation map at 1000 Hz. The edges of the narrow acoustic beams with uniform signal levels are highlighted with dashed blue lines. The position of the acoustic source is indicated by a red dot.
Acoustics 06 00012 g018
Figure 19. Sound attenuation map at 2000 Hz. The position of the acoustic source is indicated by a red dot.
Acoustics 06 00012 g019
Figure 20. Sound attenuation map at 4000 Hz. The position of the acoustic source is represented by a red dot.
Acoustics 06 00012 g020
Figure 21. Sound attenuation map at 8000 Hz. The position of the acoustic source is indicated by a red dot.
Acoustics 06 00012 g021
Figure 22. Sound attenuation map at 10,000 Hz. The position of the acoustic source is indicated by a red dot.
Acoustics 06 00012 g022
Figure 23. Sound attenuation map at 4000 Hz without diffusers. The position of the acoustic source is indicated by a red dot.
Acoustics 06 00012 g023
Figure 24. CDF of sound pressure attenuation absolute difference between free-space propagation and attenuation in the presence (red) and absence (blue) of diffusers at 4000 Hz.
Acoustics 06 00012 g024
Table 1. Parameters for the diffuser’s simulation.
ParameterValue
Air temperature (°C)20
Air pressure (Pa)101,325
Air characteristic impedance (Rayl)413
Air humidity (%)50
Speed of sound (m/s)344
Maximum frequency (Hz)10,000
Minimum frequency (Hz)10
Number of frequency bins1500
Maximum number of hops (between source and receiver)10
Ceiling specific resistance (Rayl)1 × 10⁶
Ceiling specific reactance (Rayl)0
Ceiling density (kg/m3)2000
Table 2. Standard deviations of the differences between free-space attenuation obtained by diffusers.
RowRectanglesCylindersEdgesWedgesY-Shaped
11.892.142.132.021.79
50.896.056.075.560.13
102.572.833.152.810.39
151.020.790.861.130.48
201.481.031.221.620.70
Table 3. Global SPL (dBA) for ‘shouted’ voice.
Row 1Row 5Row 10Row 15Row 20
Free space75.2064.1458.4355.0052.55
Y-shaped75.4364.1458.4855.1152.67
Disclaimer/Publisher’s Note: The statements, opinions and data contained in all publications are solely those of the individual author(s) and contributor(s) and not of MDPI and/or the editor(s). MDPI and/or the editor(s) disclaim responsibility for any injury to people or property resulting from any ideas, methods, instructions or products referred to in the content.

