1. Introduction
The noise problem caused by the interaction between the turbulent boundary layer (TBL) pulsating pressure and aircraft side plates is one of the most representative problems in vibro-acoustics [
1,
2]. Many efforts carried out on the problem of TBL-induced structural noise can be summarized in three aspects. One is wavenumber frequency spectrum models quantifying the TBL excitations. Some famous semi-empirical formulations, such as Corcos [
3], Efimtsov [
4], Williams [
5] and Chase [
6,
7], have been obtained by fitting a large amount of experimental data and statistical turbulence theory. The other one is about how to predict the vibration and radiated noise of a plate caused by TBL excitations. Graham [
8,
9] proposed a model to predict the TBL-induced noise for aircraft side and trim plates, in which the modal excitation terms are expressed analytically, and the advantages of different wavenumber frequency spectrum models induced by TBL are discussed. Liu et al. [
10] predicted the TBL-induced noise of a stiffened plate using the receptance method. It was found that the stiffeners perpendicular to the direction of incoming flow have an obvious effect on the radiated noise. Rocha and Palumbo [
11] investigated the sensitivity of sound power radiated by aircraft plates to TBL parameters, and discussed the findings by Liu [
12] that ring stiffeners may increase TBL induced noise radiation significantly. Liu [
13] further compared TBL-induced vibrations with the in-flight measured data of P180, where a simplified double integral for the calculation of the modal excitation term is provided. The third aspect is the passive methods for the control of the radiated noise. It has been reported that passive damping is always effective in controlling the vibration and noise caused by TBL. However, the reduction in vibration level is more significant in comparison with the radiated noise level, which implies that the radiation efficiency of the plate increases with increasing damping treatment. Kou et al. [
14] described formulas to include the influence of structural damping on the radiation efficiency of finite and infinite plates. Thus, the phenomenon that the radiation efficiency of a plate increases with the increase in the damping treatment is explained. Kou et al. [
15] also concluded that the modal averaged radiation efficiency increases significantly with the increase in the convection velocity below the hydrodynamic coincidence frequency, and the damping effect is more significant with the increase in the flow velocity.
In addition to passive methods, active methods have great potential for the control of TBL-induced plate noise. Among them, the control strategy based on distributed velocity feedback has received much attention for acoustically or TBL-induced noise [
16,
17]. The simulation results given by Elliott et al. [
18] and Jayachandran et al. [
19] show that the distributed velocity feedback is unconditionally stable in a large gain coefficient range, which is a relatively robust control method. However, the force driver needs some large mass to generate the reaction force, and when a large force is required in the low frequency range, the force driver will be relatively large and heavy. In practice, it is more convenient to use piezoelectric patch actuators integrated with plates. Gardonio et al. [
20,
21,
22] used piezoelectric patch actuators and acceleration sensors to analyze in detail the control effect of distributed velocity feedback control and the existence of optimal gain coefficient from theoretical and experimental perspectives. These works further show that the distributed velocity feedback control is easy to implement and the control effect is approximately optimal. Since it is usually not convenient to obtain the physical information of the structure, it is difficult to obtain the optimal gain coefficient. To solve this problem, Cao et al. [
23,
24] proposed the concept of the virtual absorption energy of piezoelectric sheets, which uses the maximum virtual absorption energy to obtain the best gain coefficient and is easier to measure compared to kinetic energy or acoustic radiation power. Distributed velocity feedback control is not only applicable to diffused sound field excitation but also to random excitation and TBL excitation. Rohlfing et al. [
25] specified the mesh density of finite cells on the plate and investigated the effectiveness of negative feedback control of uniform and light sandwich panels under random excitation and TBL excitation. The control effects of a series of ideal speed negative feedback control circuits on a homogeneous plate and a lightweight sandwich plate are compared. Alouf et al. [
26] developed a new active control mechanism for aircraft cabin windows using an active structural acoustic control strategy that provides a significant improvement in acoustic attenuation performance at low frequencies. The effects of voltage, actuator position and number on the sound transmission characteristics were analyzed. Yuan et al. [
27] investigated the dispersive velocity feedback control of thin plates under TBL excitation based on the newer TBL semi-empirical model, and the results showed that the pre-stress effect and hydrodynamic overlap have a large effect on plate vibration, which has an important influence on the plate vibration acoustic performance and the selection of the number of control channels. Ma et al. [
28] investigated the dispersive velocity feedback control of a ribbed plate using inertial actuators and discussed the effect of feedback gain and number of actuators on control performance, further demonstrating the existence of an optimal gain for dispersive velocity feedback control.
Typical aircraft plates generally exhibit unidirectional curvature. A typical case is that when an aircraft plate is excited by TBL, the direction of air velocity is perpendicular to the curved direction of the plate. The sound radiation properties of curved and flat plates can be significantly different. As pointed out in reference [
10], the curvature results in the convergence of resonance frequencies of the plate led by the interaction of bending forces and membrane tensions in the shell. The convergence not only increases the modal density of the curved plate around the ring frequency but also increases the sound radiation efficiency of these modes by shifting them to a relatively higher frequency. Although the active control of flat plates can be found in many works in the literature, there are few studies on the acoustic characteristics of active control of curved plates under TBL excitations. Graham [
8] studied the induced noise of aircraft wall panels under TBL excitation, elucidating that the presence of panel membrane tension causes a shift in the lowest resonant frequency to high frequencies. Nourzad et al. [
29] used inertial actuators to control the vibration and radiation of doubly-curved plates and analyzed the effect of curvature on the vibration response of doubly curved plates. In this paper, the control effect of a curved thin plate under TBL excitations is numerically investigated. Sixteen active control units are scattered on the plate, and each active control unit includes a piezoelectric actuator, an acceleration sensor, and a feedback actuator. The kinetic energy and radiated sound power of the plate are discussed in detail for different curved plate thicknesses, bending curvatures, and active control unit distribution.
2. Mathematical Model and Theoretical Calculation
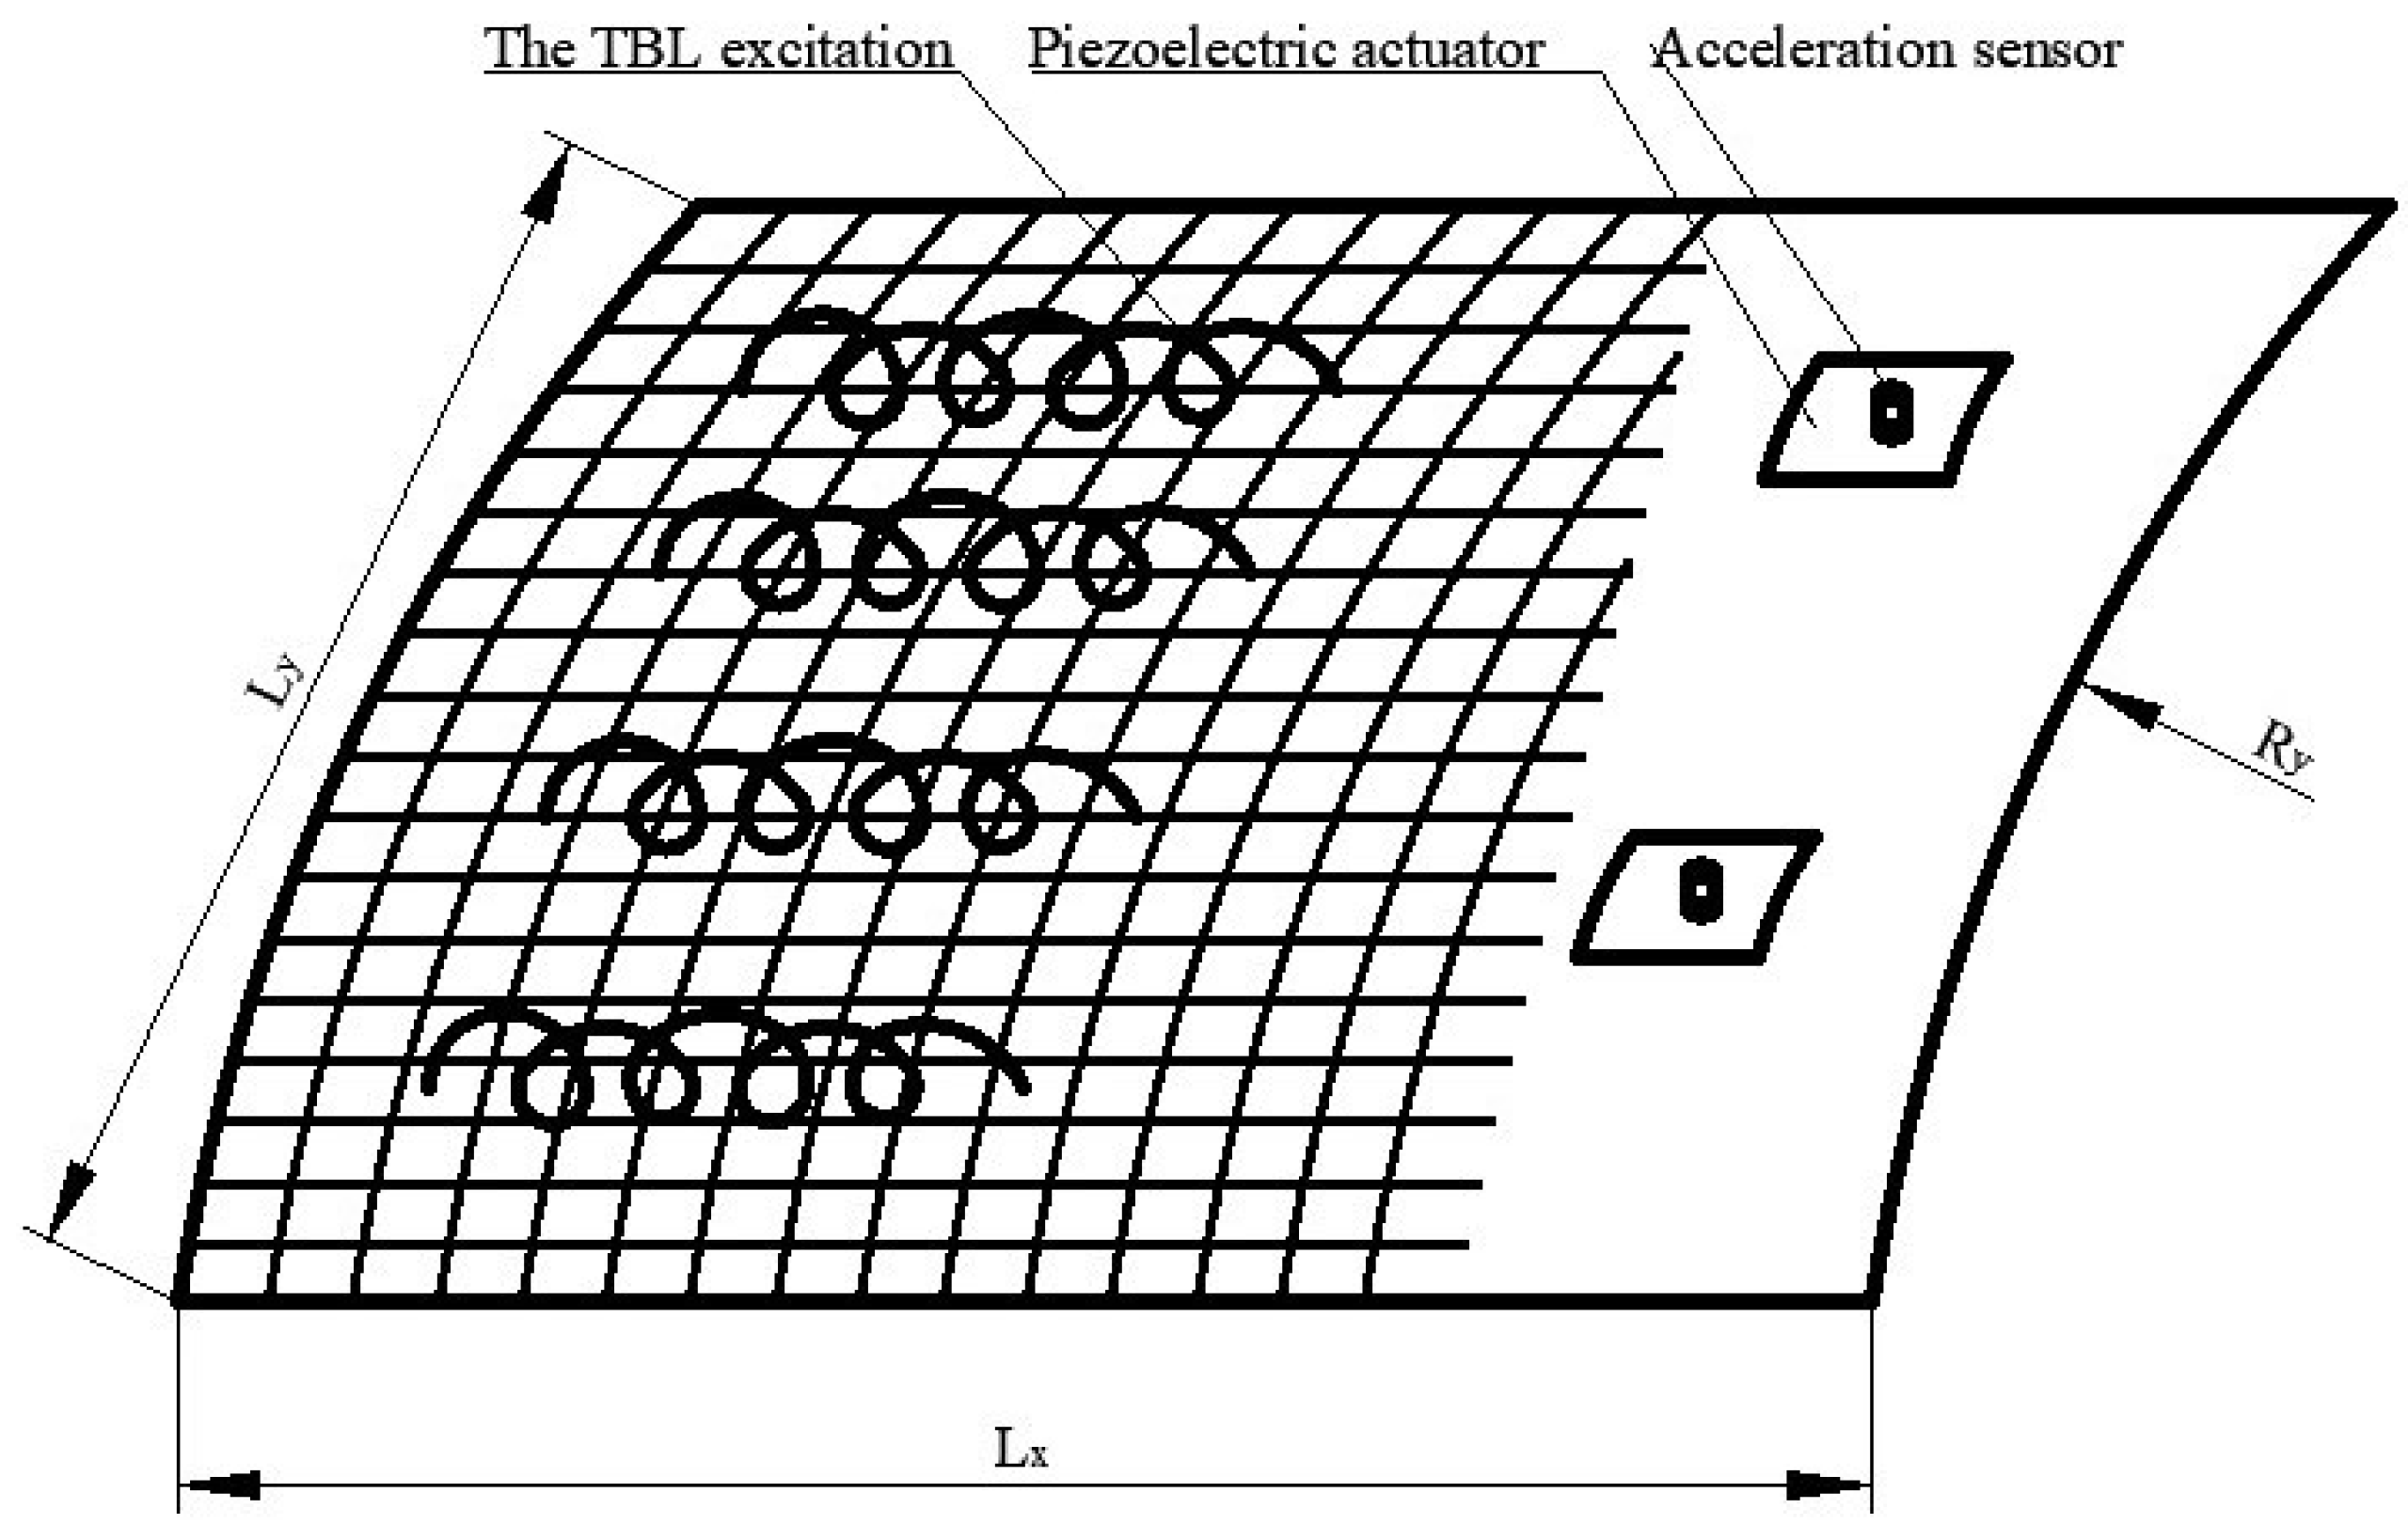
The decentralized velocity feedback control of a simply supported plate through active control units is illustrated in
Figure 1, where the plate can be flat and curved, with an air medium on either side of the plate and random TBL excitations on one side of the plate. Sixteen active control units are uniformly distributed on the rectangular plate. The element-based model divides the plate into a series of small rectangular elements, the dimensions of which are
,
, where
and
are the length and width of the plate, respectively, and M and N are the highest number of calculated modes. The mass density of air is
, and the speed of sound is
. The perturbations acting on the plate are assumed to be harmonics. For the sake of brevity, the time-harmonic term is omitted from the plural form of velocity and force, so
and
are replaced by
and
f, respectively.
The modal summation method is used to solve the acoustic and vibration response of a simply supported rectangular thin plate under turbulent boundary layer excitation. The cross-power spectral density function of the velocity response of the plate at any two points
and
is defined by [
13]
where
is the angular frequency,
is the mutual power spectral density function of the TBL excitation at two points
and
,
is the frequency response function,
is the excitation point, and
is the response point, which can give by the form of modal summation as given below:
where (
m,
n) is the number of modes in the horizontal and vertical directions. The characteristic function
is orthogonal and satisfies the same boundary conditions as the plate. For the rectangular simply supported plate, the characteristic function is expressed as
the modal displacement
is given by Equation (
4)
where
is the surface density of the plate,
A is the area of the plate and
is the loss factor.
For the plate, the
th mode resonance frequency is
for a curved plate, and the
th mode resonance frequency is [
30]
where
is the stiffness of the plate,
E is the Young’s modulus,
is the density of the plate, and
is the bending curvature of the plate in the
y-axis direction.
For calculating the response and radiation of decentralized velocity feedback control plates, element-based models are more commonly used [
25]. It can be considered that each small rectangular unit on the plate has the same transverse vibration velocity, which is equal to the transverse vibration velocity of its center point
, and the transverse vibration velocity picked up by the velocity sensor is
. The above two variables can be written in vector form
where
R is the total number of small units divided on the plate, and
S is the number of active control units. The force of the TBL at the center point of each small element on the plate as well as the force of each control point can be expressed as a vector
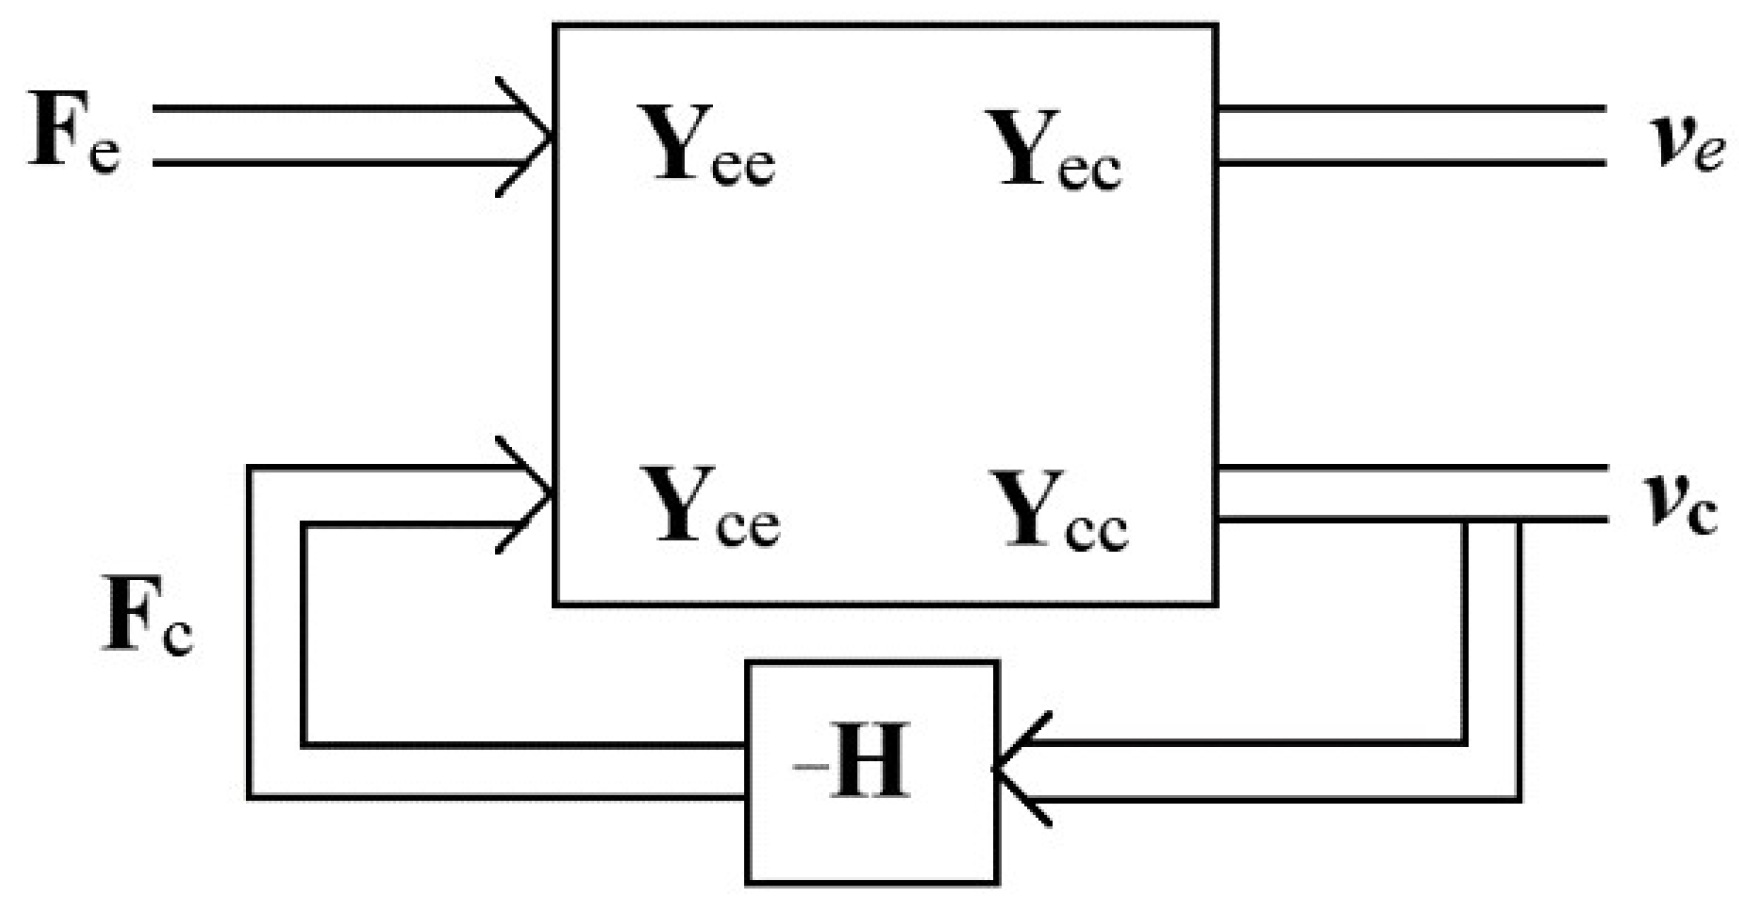
The closed-loop velocity feedback block diagram is shown in
Figure 2. Assuming that the system is linear, the response of the TBL excitation plate can be linearly superimposed with that of the active control unit excitation plate. Therefore, the transverse vibration velocity of the center point and control point of each small unit on the plate can be expressed as
where
is the velocity/force mobility matrix of the center point of the small element excited by TBL;
is the velocity mobility matrix of TBL excitation to the control point. Both have the same form
where
is the velocity/moment mobility matrix of the center point of the small element excited by the piezoelectric plate;
is the velocity mobility matrix of the piezoelectric sheet excited to the control point. Both have the same form
where
is the position of the piezoelectric chip.
and
are the length and width of each small element respectively, and the size of the piezoelectric sheet is
.
When the feedback control unit acts, the speed of the control point is controlled, so the feedback control force is
where
h is the gain coefficient.
Bringing Equation (
13) into Equation (
10), the velocity at the control point after feedback control is obtained as
the control force in Equation (
13) can be written as
substituting it into Equation (
9), the transverse vibration velocity of the center point of the small unit on the rear plate can be obtained as follows:
where
is the velocity mobility matrix of the center point of the small unit on the plate after the control is applied, expressed as
The response of the TBL excitation plate based on the model proposed by Corcos [
3] has been widely used to describe TBL excitation. According to the Corcos model, the cross-power spectral density of the surface pressure excited by TBL along the x-axis is
where
is the convective velocity of TBL, where
,
is the flow velocity of air. The values of parameters and in the equation are determined from experimental data and are dimensionless numbers. Here,
and
given by Finnveedn [
31] are used. The
is the lateral distance between the center point of the ith cell and the center point of the jth cell, and the
is the longitudinal distance between the center point of the ith cell and the center point of the jth cell.
The element-based model solves for the power spectral density of the vibration velocity as
where
is the area of each small cell.
The kinetic energy power spectral density of the plate can be expressed as
where
is the mass of each small element,
is the velocity mobility matrix of the center point of the small element on the plate after the control is applied as mentioned above,
represents the trace of the matrix, and
is the power spectral density matrix of each small element under TBL excitation, which is given by Equation (
21):
the
is the area of each small unit, and the
is the high-power spectral density of the pulsating pressure in the turbulent boundary layer.
The radiated sound power is given by Equation (
22):
the
is the radiation coefficient matrix [
32], and the specific form is as follows:
the
is the number of waves in the air, but on the diagonal of the radiation matrix, because of
, the terms on the diagonal of the radiation matrix are meaningless. L’Hopital’s rule can be used to solve it, namely
.
3. Model Validation and Response and Radiation of Plates
To validate the model, an aluminum plate with the same parameters and excitations as in reference [
22] is considered. The length of the plate is 0.278 m, the width is 0.247 m, the thickness is 1.6 mm and the flow velocity is 225
. The physical property parameters of aluminum plate are shown in
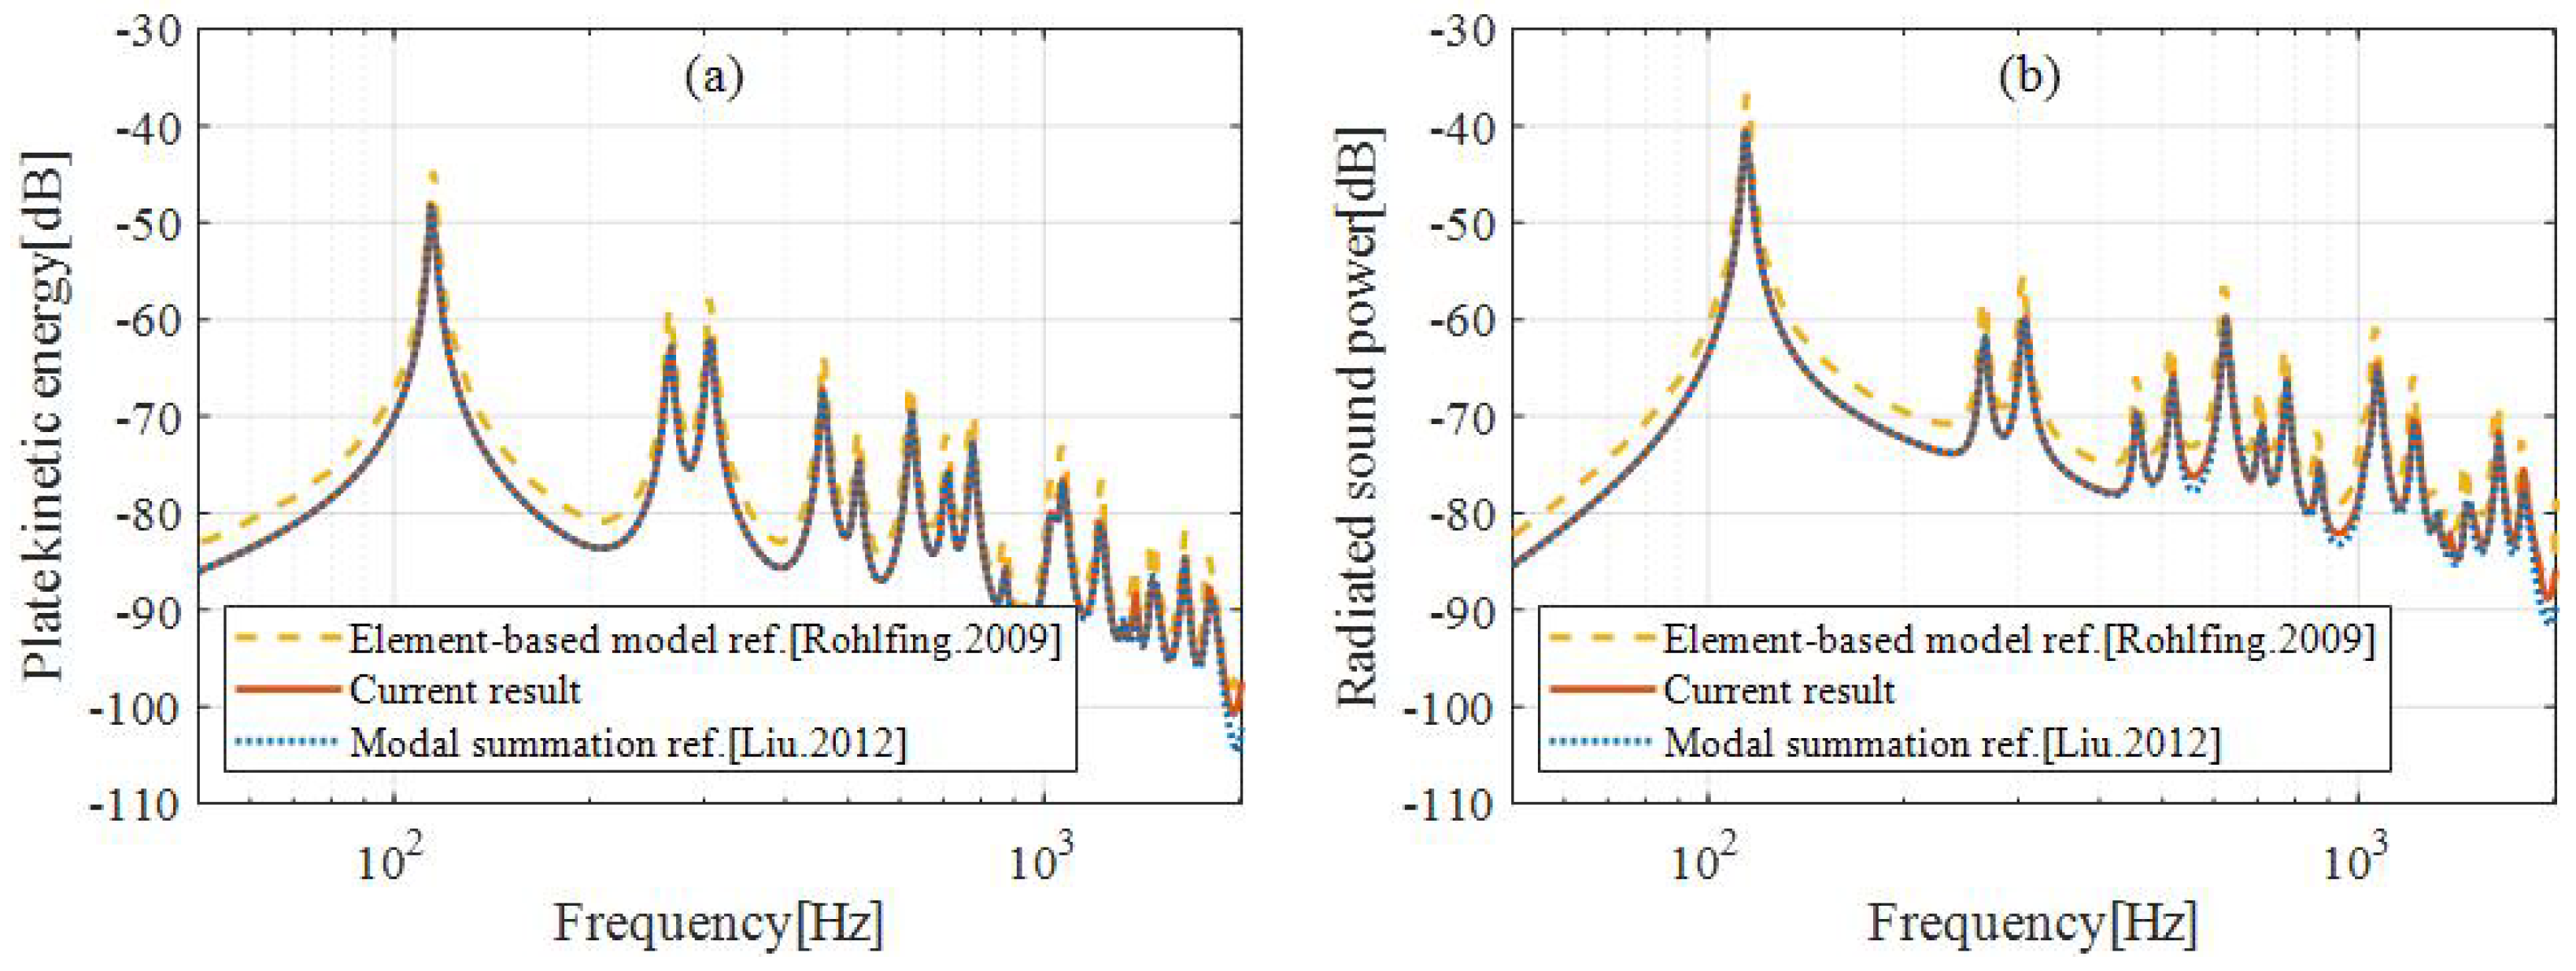
Table 1. The kinetic energy and radiated sound power of the plate due to TBL excitations are calculated and shown in
Figure 3, where a comparison with the modal summation method is provided. In the frequency range calculated, the results based on the element model in this paper are only slightly lower than those of Gardonio [
25], and in very good alignment with that of the modal summation method [
13]. This is due to the fact that the self-power spectral density of the TBL pulsation pressure is ignored in the calculations. These results verify the correctness of the current model.
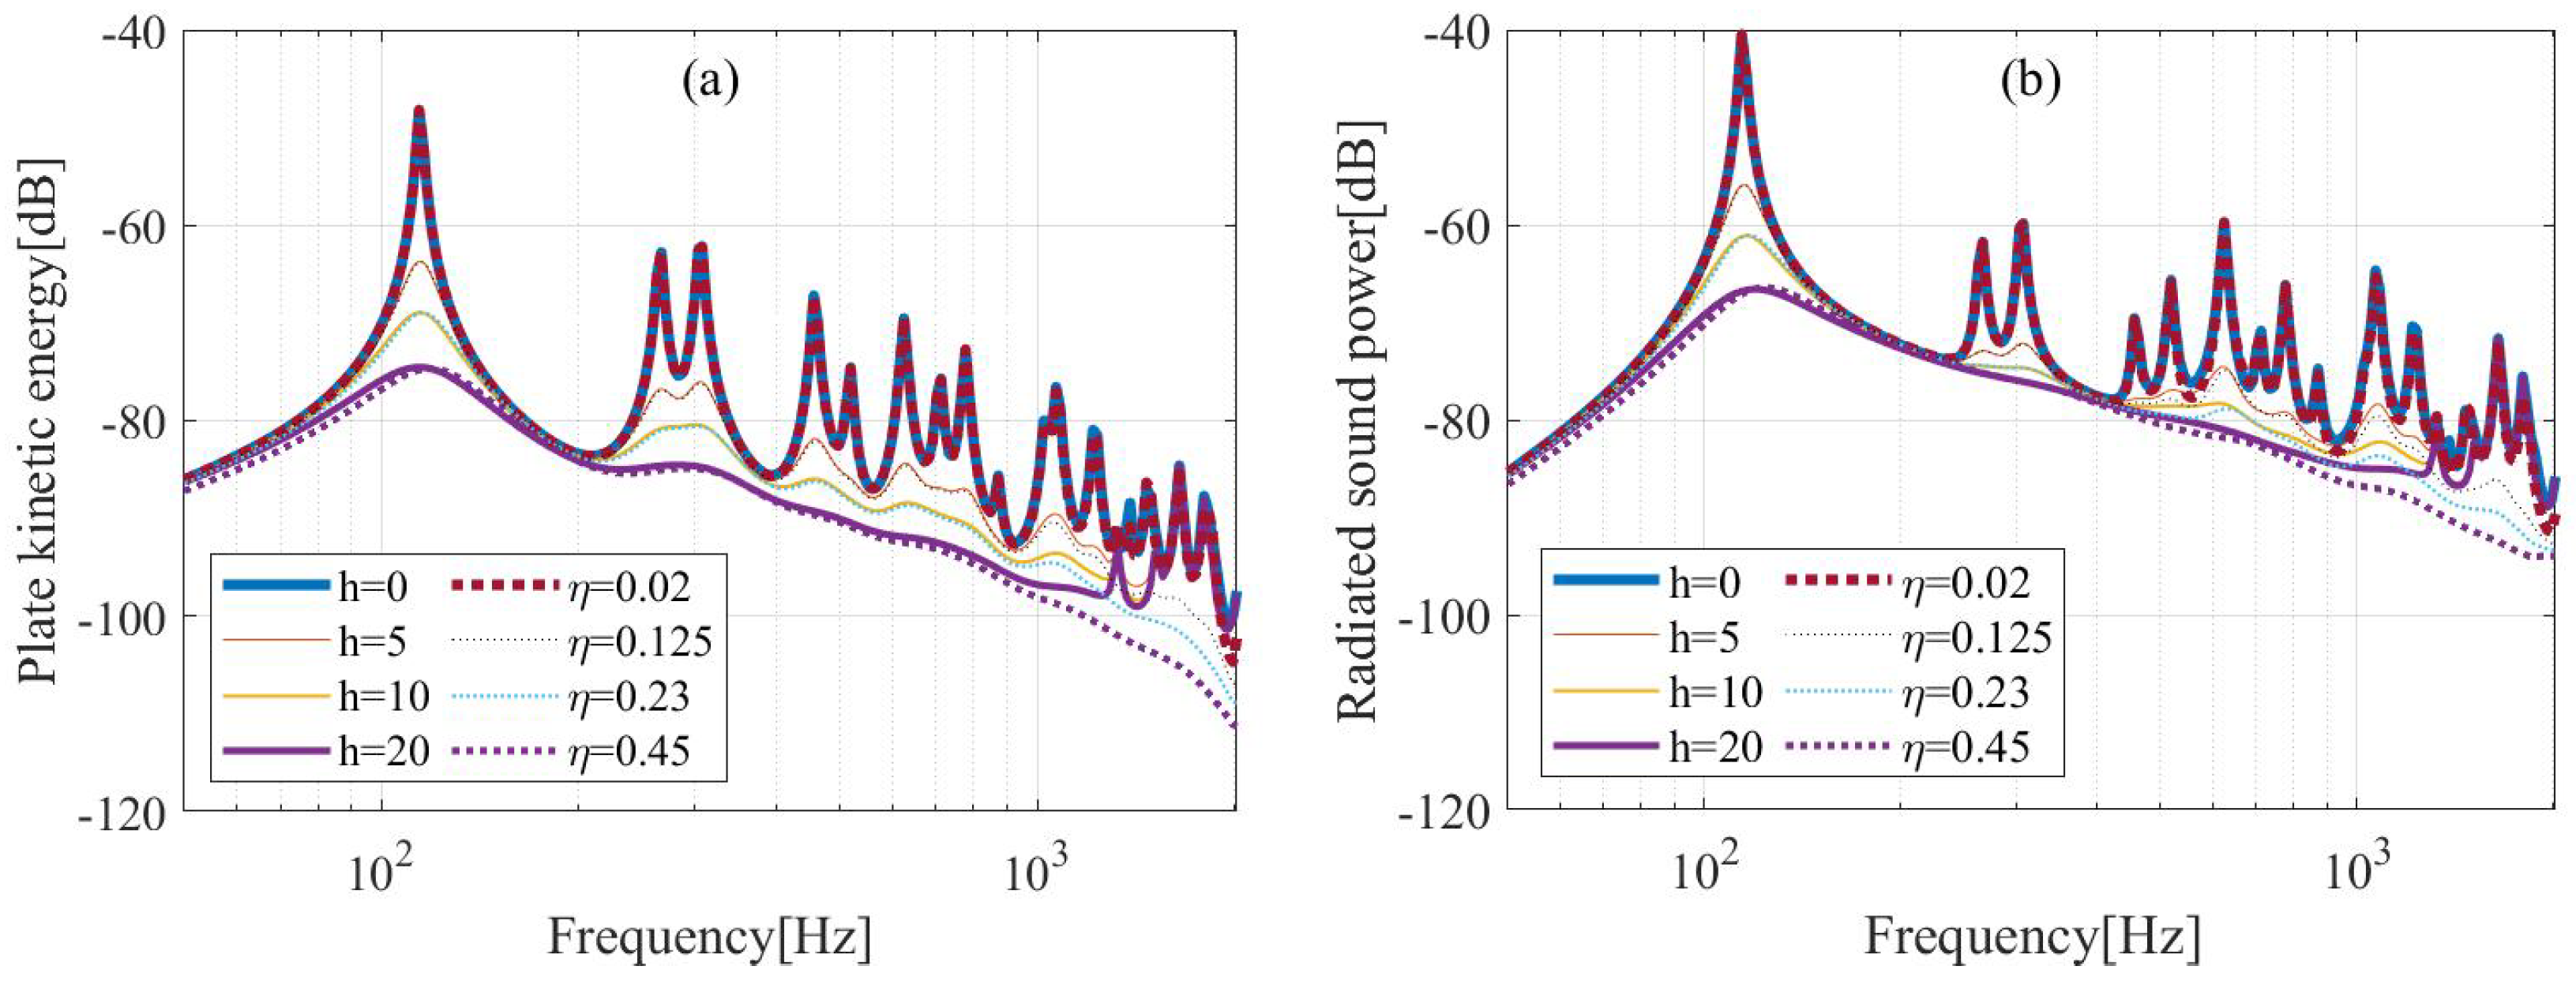
When 16 active control units are uniformly distributed on the plate, the kinetic energy and radiated sound power of the plate reduce obviously with the increase in gain coefficient, as shown in
Figure 4. In
Figure 4, a comparison of different gain coefficients and different passive damping is also provided to show the equivalent damping mechanism of the velocity feedback control. In the frequency range of 50−1000 Hz, the control effects at gain coefficients of 5, 10 and 20 agree very well with the effects at loss factors of 12.5%, 23% and 45%, respectively. This reveals that the velocity feedback control can be regarded as a form of active damping, and the plate is heavily damped after the control.
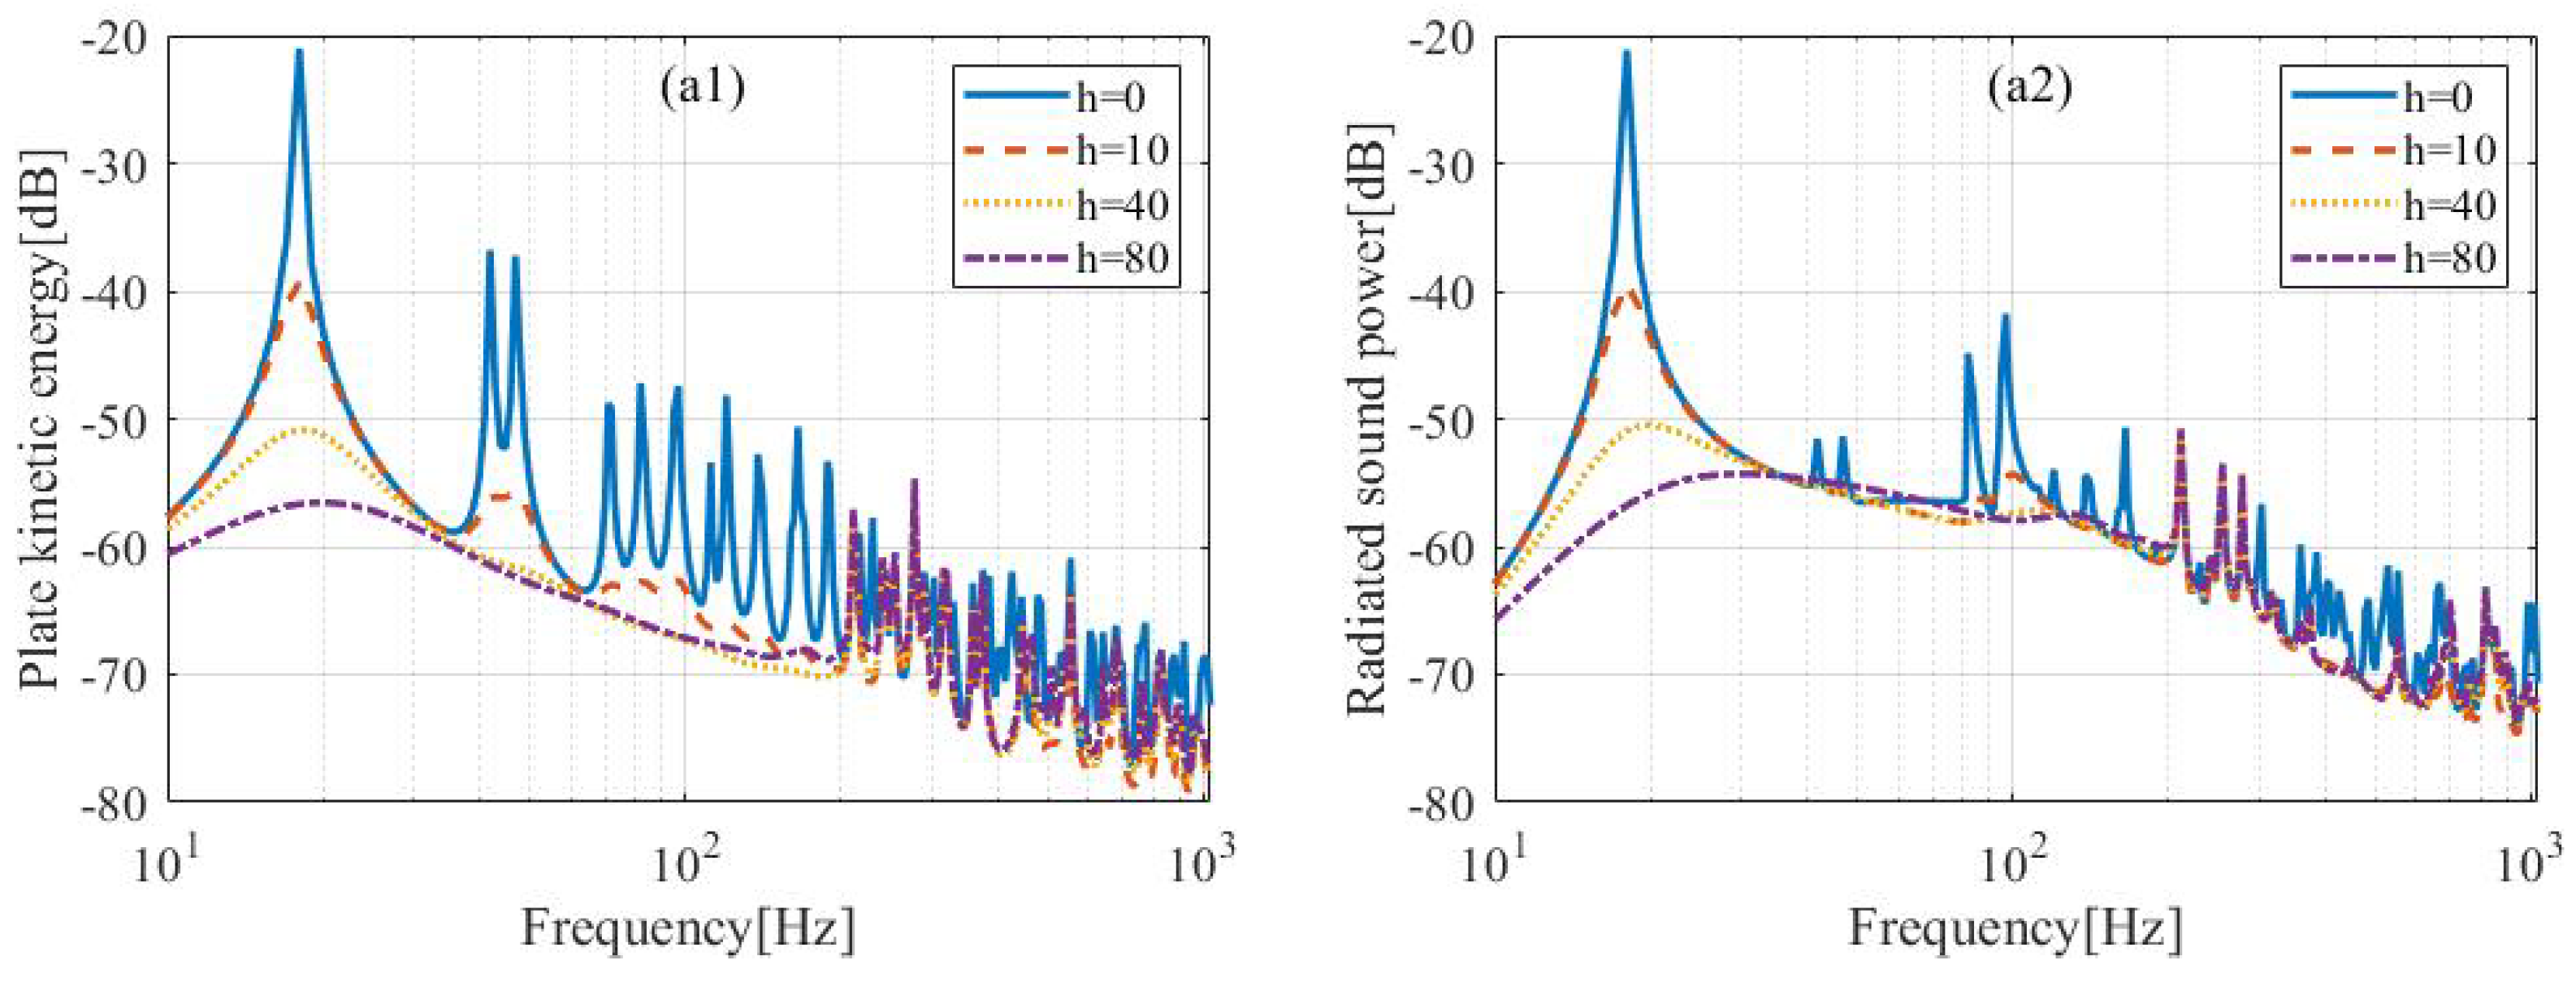
Next, an aluminum plate is considered, in which the length of the plate is 0.55 m, the width is 0.5 m, the thickness is 1 mm, and the loss factor is assumed as 0.01. To illustrate the influence of excitation position, the placements of two types of active control units are considered, as shown in
Figure 5. The squares in
Figure 5 represent the positions of active control units when the 4 rows and 4 columns are uniformly distributed, and the corresponding response and sound radiation of the plate are shown in
Figure 6(a1,a2). The circles mark the excitation positions slightly off from the squares to avoid the influence of the nodal lines of modes, and the results are shown in
Figure 6(b1,b2). Below 200 Hz, the kinetic energy and radiated acoustic power of the plate are well controlled when the excitation positions are different. As the frequency increases, the control effect of uniformly distributed active control units becomes less effective. The poorly controlled resonant frequencies in
Figure 6(a1,a2) correspond to the plate modes (5, :), respectively. The active control unit positions correspond exactly to the nodal lines of these high order modes, making the control of these modes ineffective. When the excitation positions are slightly deviated from the modal node line, the control effect in the higher frequencies is significantly improved, as shown in
Figure 6(b1,b2).
4. Response and Sound Radiation of Curved Plates
In comparison with that of a flat plate, it is well known that a curved plate will result in significant influence on the radiated sound around its ring frequency. Therefore, the effect of curvature on velocity feedback control results is of interest. In this section, several curved plates with different curvatures and thicknesses are considered, as shown in
Table 2. The 16 active control units are evenly arranged in 4 rows and 4 columns on the plate. The control results with different gain coefficients are illustrated in
Figure 7,
Figure 8 and
Figure 9.
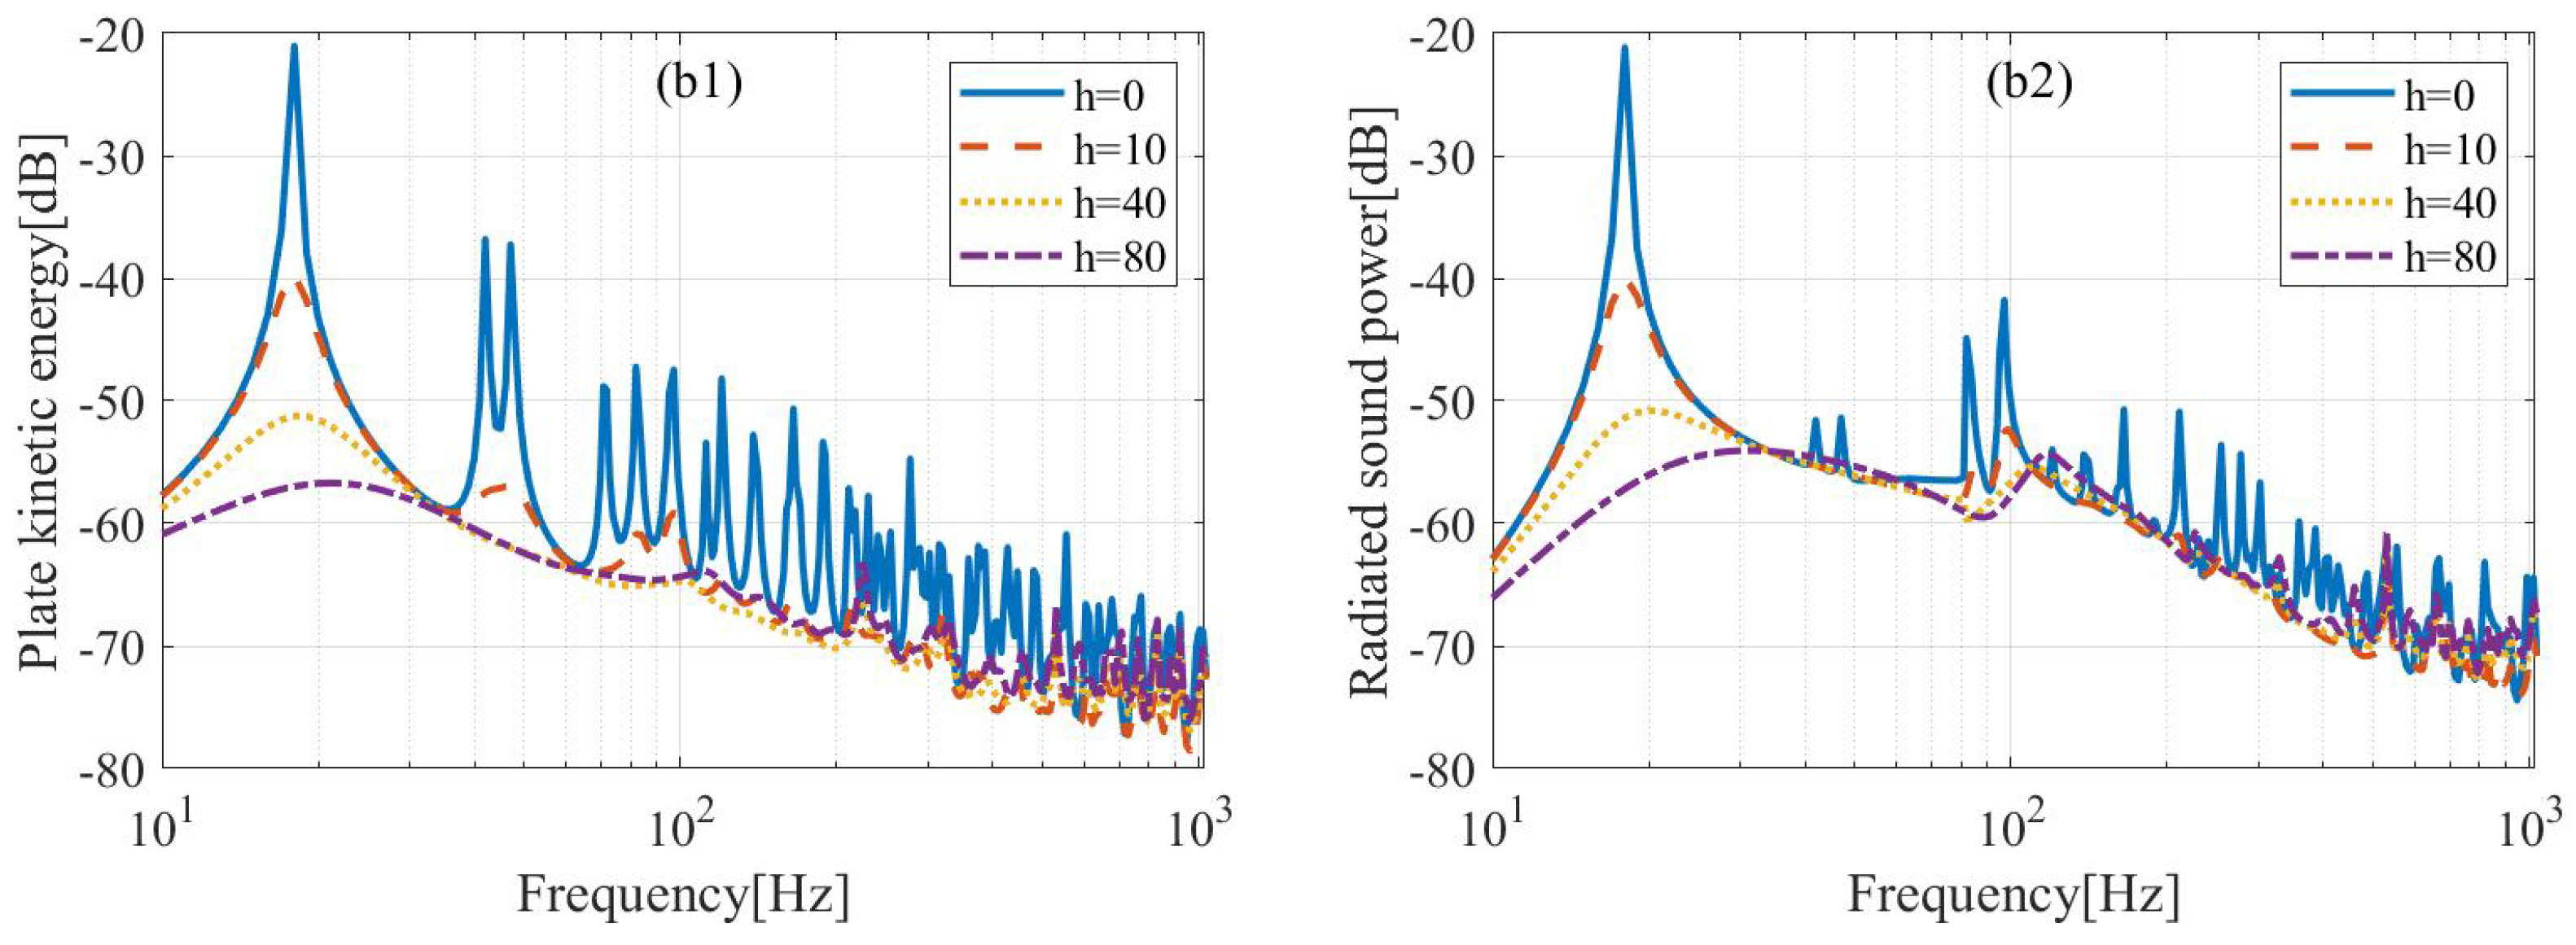
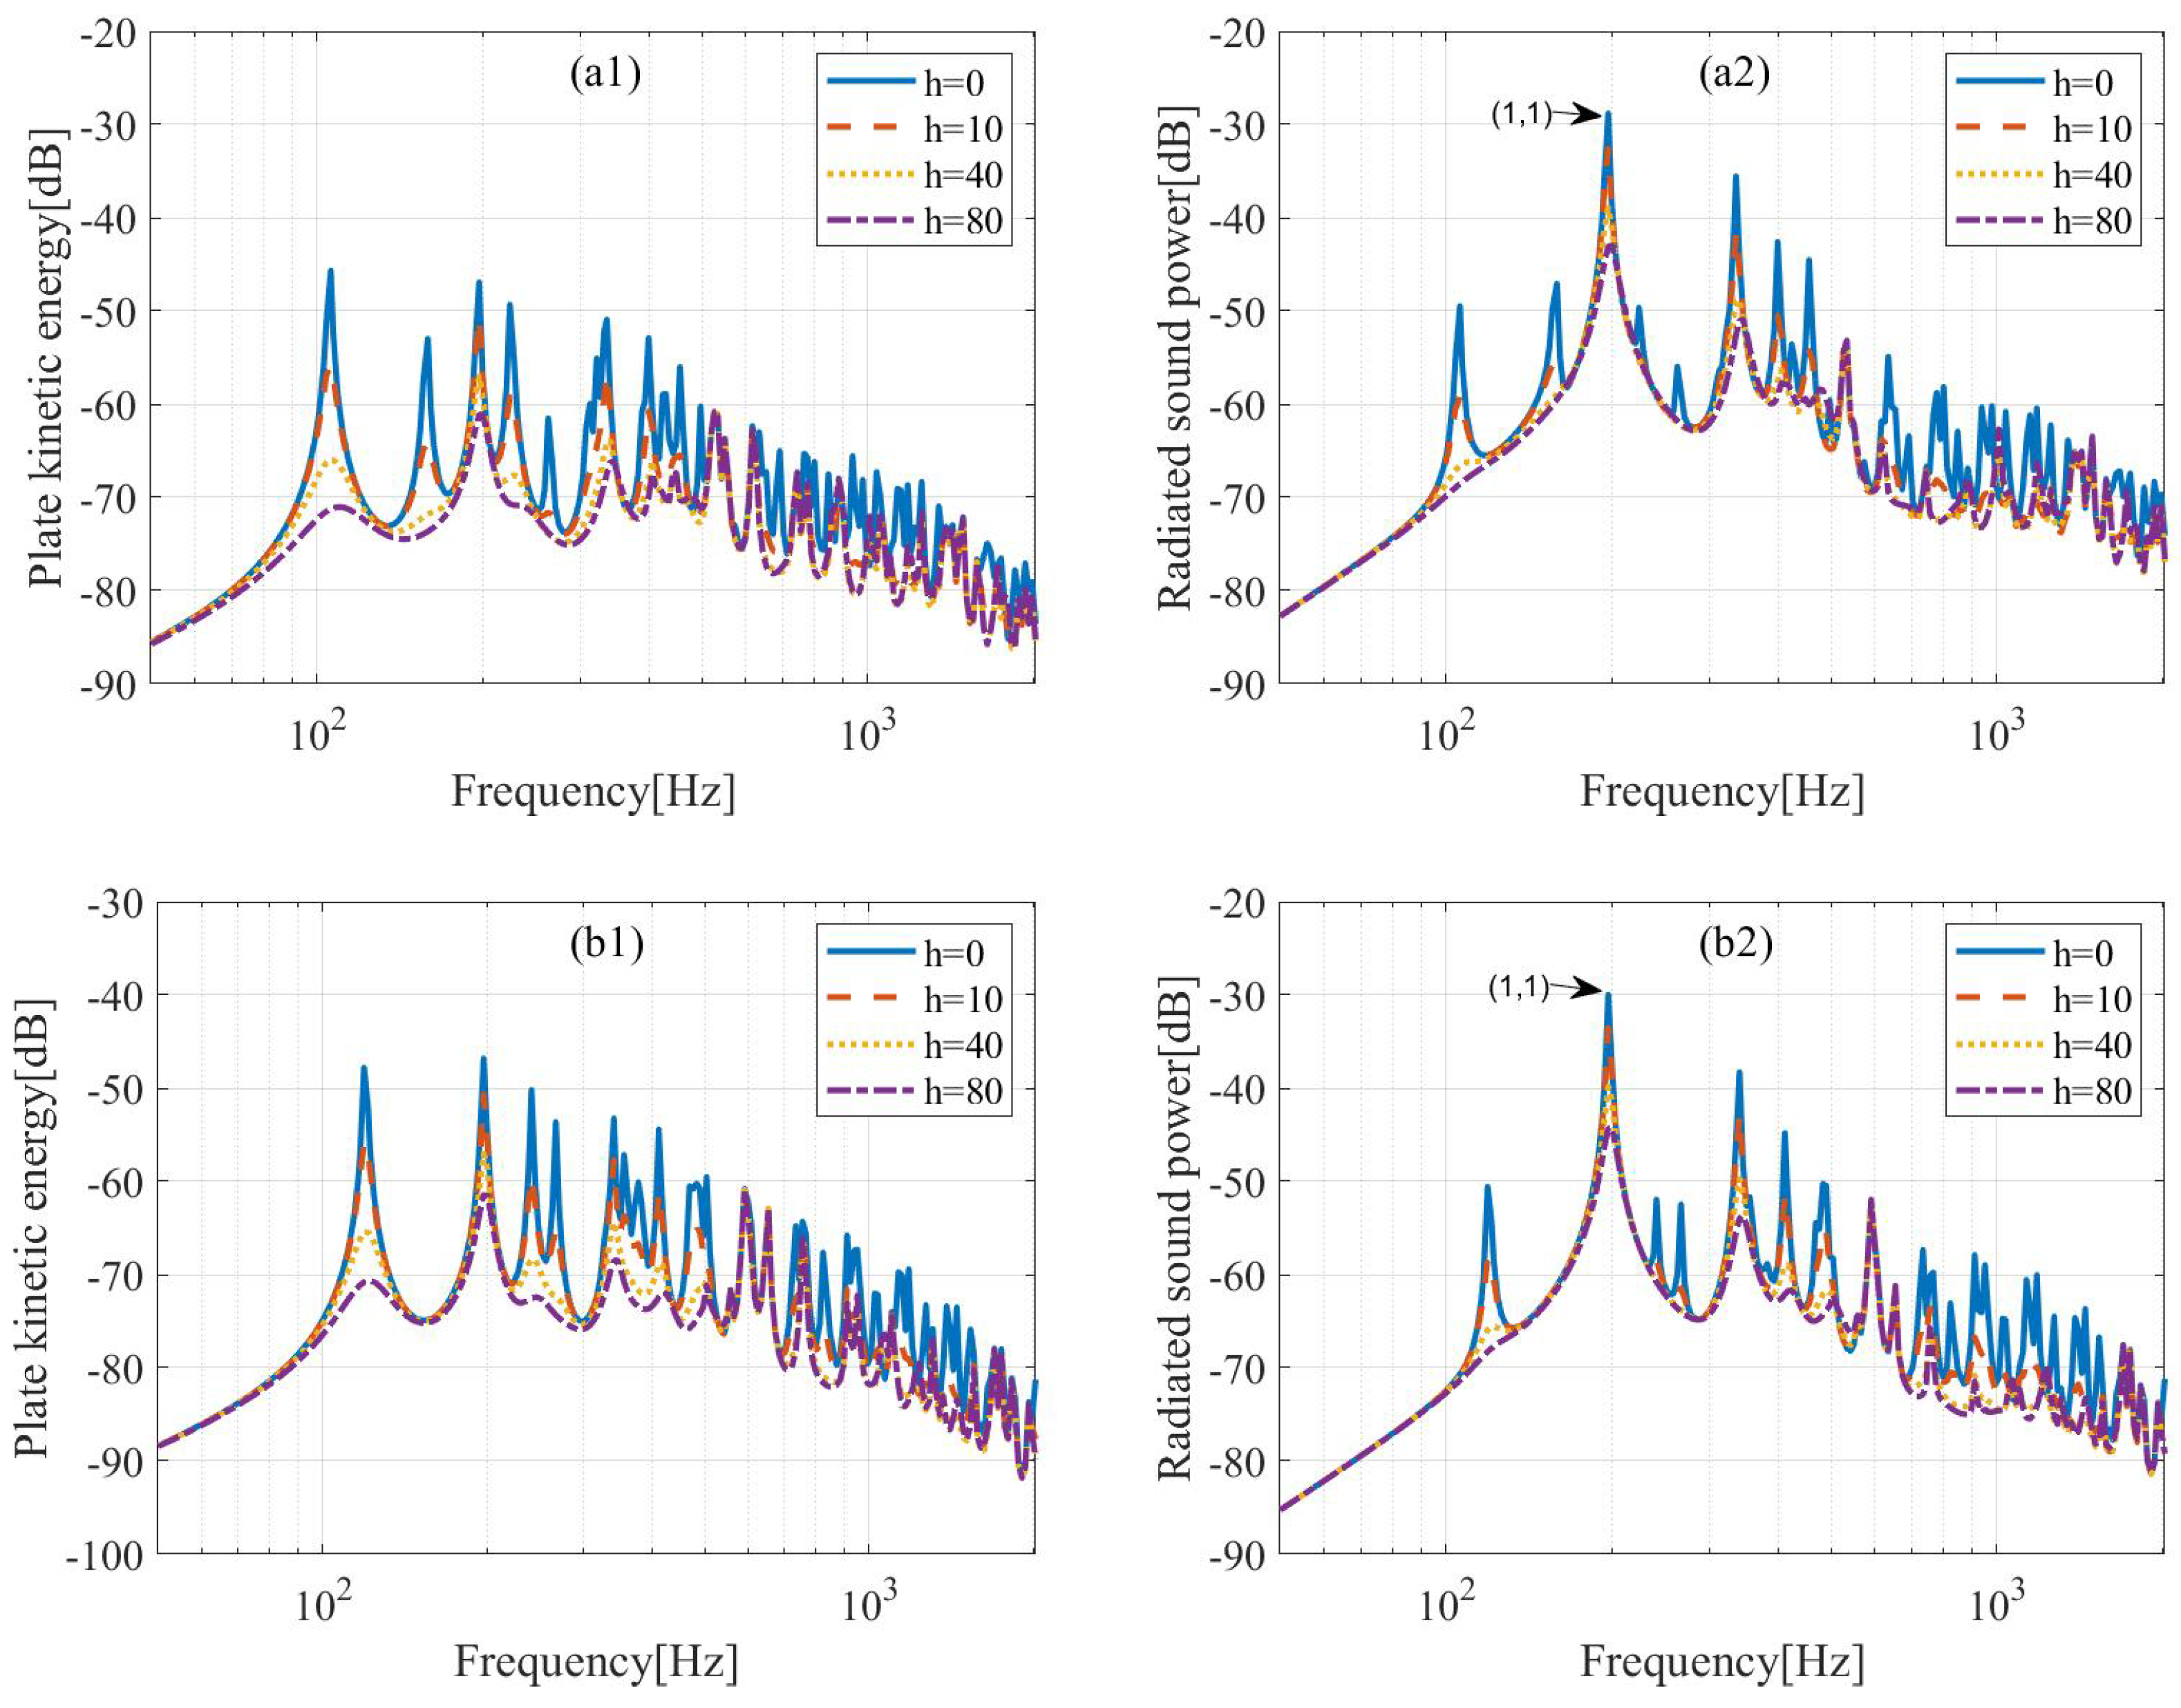
Compared with the flat plate in
Figure 6, the vibration and radiated sound of the curved plate are significantly different, as shown in
Figure 7(a1,a2). When the active control is not applied, it is evident that the presence of curvature reduces the plate response at low frequencies, but the radiated sound power near the ring frequency increases significantly. In particular, due to the curvature, the mode (1,1) moves to the higher frequency and dominates the sound radiation. Similar to the plate, distributed speed feedback is better for control below 200 Hz. However, the control is no longer effective when the frequency is above 200 Hz. Especially for the mode (1,1), the radiated sound power does not decrease significantly with the increase in the gain coefficient. Even if the active control unit deviates slightly from the uniform distribution to avoid the influence of the modal nodal line elements, the control effect in the (1,1) mode is not satisfactory, as shown in
Figure 7(b2).
If the radius of curvature is increased, as shown in
Figure 8 for the curved plate C2 and C3, the mode (1,1) is shifted toward lower frequencies, while the effect of control is improved. When the radius of curvature is 1 m, the sound power of the mode (1,1) can reduce by about 6 dB after control, and when the radius of curvature is 3 m, it can reach 13 dB. These results imply that the control effect is related to the radius of curvature. When the radius of curvature is large, then a curved plate is close to a flat plate, while when the radius of curvature is small, the control is not very effective for lower-order dominated modes.
In addition, the results for curved plates with different thicknesses are shown in
Figure 9. When the radius of curvature is 2 m and the thickness is 1 mm, the control effect for the mode (1,1) can reach about 8 dB, and when the thickness is 1.6 mm and 2 mm, the sound power of the mode (1,1) can reduce 9 dB and 14 dB, respectively. These imply that the control effect is also sensitive to the thickness of the curved plate.
To further explain the above control effect on the curved plate, the characteristic frequency of the curved plate described in Equation (
6) can be rewritten as
the first term in the second bracket is the stiffness corresponding to the bending forces, and the second term is the stiffness corresponding to the membrane tensions, i.e.,
Therefore, the equivalent total stiffness of the curved plate is
and now, the ratio between the second term and the first term in Equation (
26) is defined as the
The
indicates the control effect of the active control units at mode (1,1) and is defined as
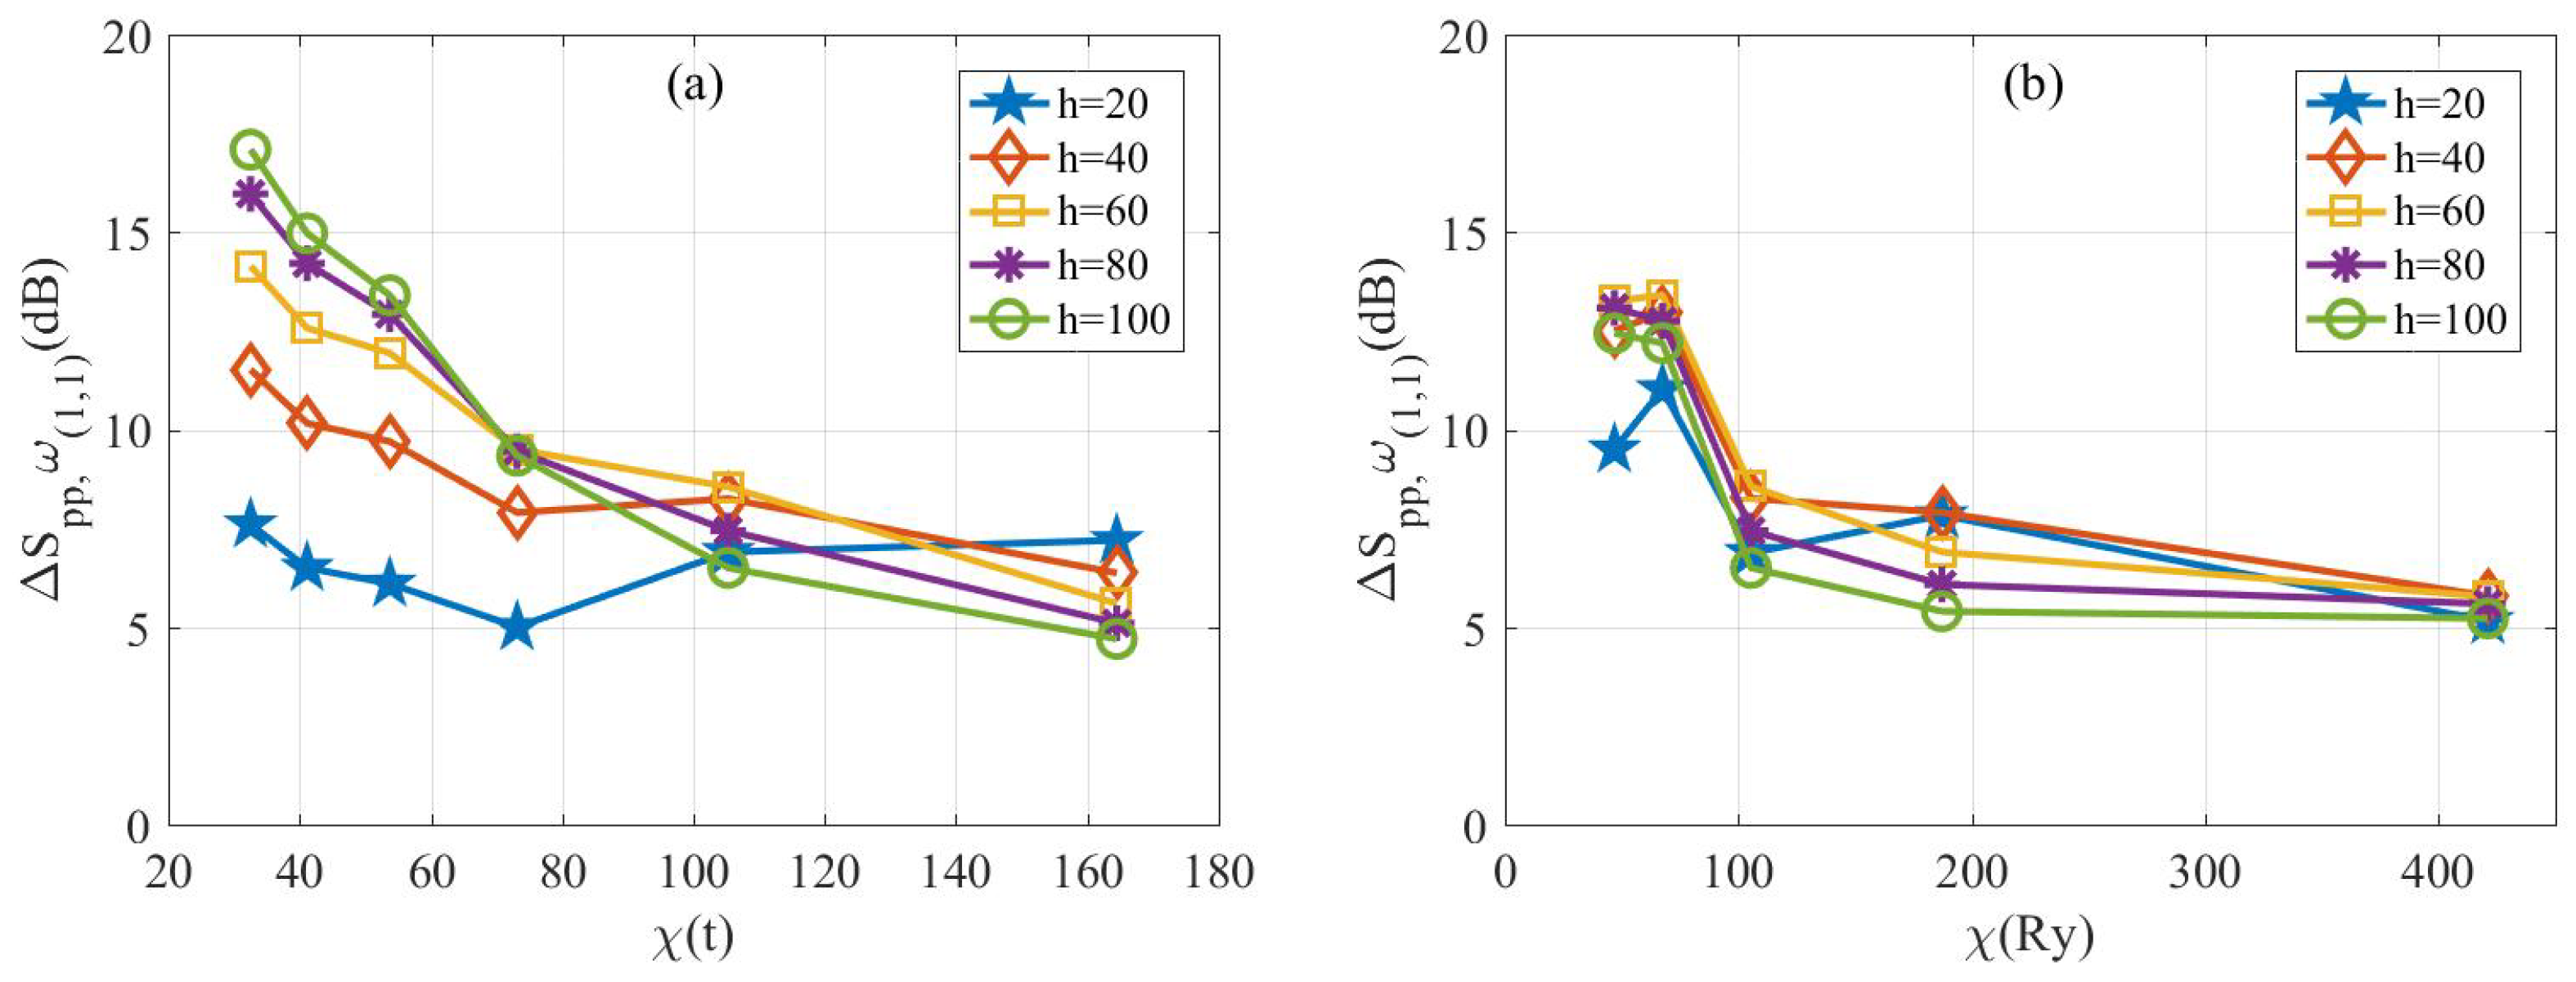
The existence of the membrane tension of a curved plate not only increases the radiated sound power of mode (1,1) significantly but also weakens the control effect. To describe this phenomenon, the variation of the control effect with
and the gain coefficients
h for the mode (1,1) is shown in
Figure 10. In
Figure 10a, the variation of
is caused by the change in thickness, while in
Figure 10b, the variation of
is caused by the change in radius of the curvature. It can be concluded that the overall trend in control effectiveness decreases as the ratio
increases. When
is less than 70, the control is effective and mostly greater than 10 dB. When
is larger than 70, the control is less effective, and when it is greater than 100, the control effect can be less than 5 dB. These results indicate that the control effect is sensitive to the ratio of stiffness related to the membrane tensions to stiffness related to the bending forces.
Table 3 shows the
values of the first 12 modes when the thickness is 1 mm, 1.6 mm and 2 mm, respectively. It can be seen that the
values at modes (1,1) and (2,1) are significantly greater than those of the other modes, and this is caused by the stiffness related to the membrane tensions and expressed in Equation (
24).
Table 3 also shows that the
values decrease as the thickness of the curved plate increases. The value decreases from 105.28 to 26.32 when the thickness increases from 1 mm to 2 mm. According to
Figure 9(a2), the larger the value of
, the less effective the active control is. When
is 105.28, the control of the gain factor from 60 to 120 becomes progressively worse, which explains why the curved plate in
Figure 7(a2) does not control well at higher gain coefficients. It can be seen that the existence of curvature makes the plate in the bending cross-section of the membrane stress, the membrane stress along the direction of plate bending uniformly distributed, increasing the stiffness of the bending plate in the low-frequency region, and the lower the frequency, the more significant the increase in stiffness caused by the membrane stress at the resonance frequency.
The above study shows that the magnitude of
has a large effect on the control effect of the active control unit of the curved plate. The modes corresponding to larger values of
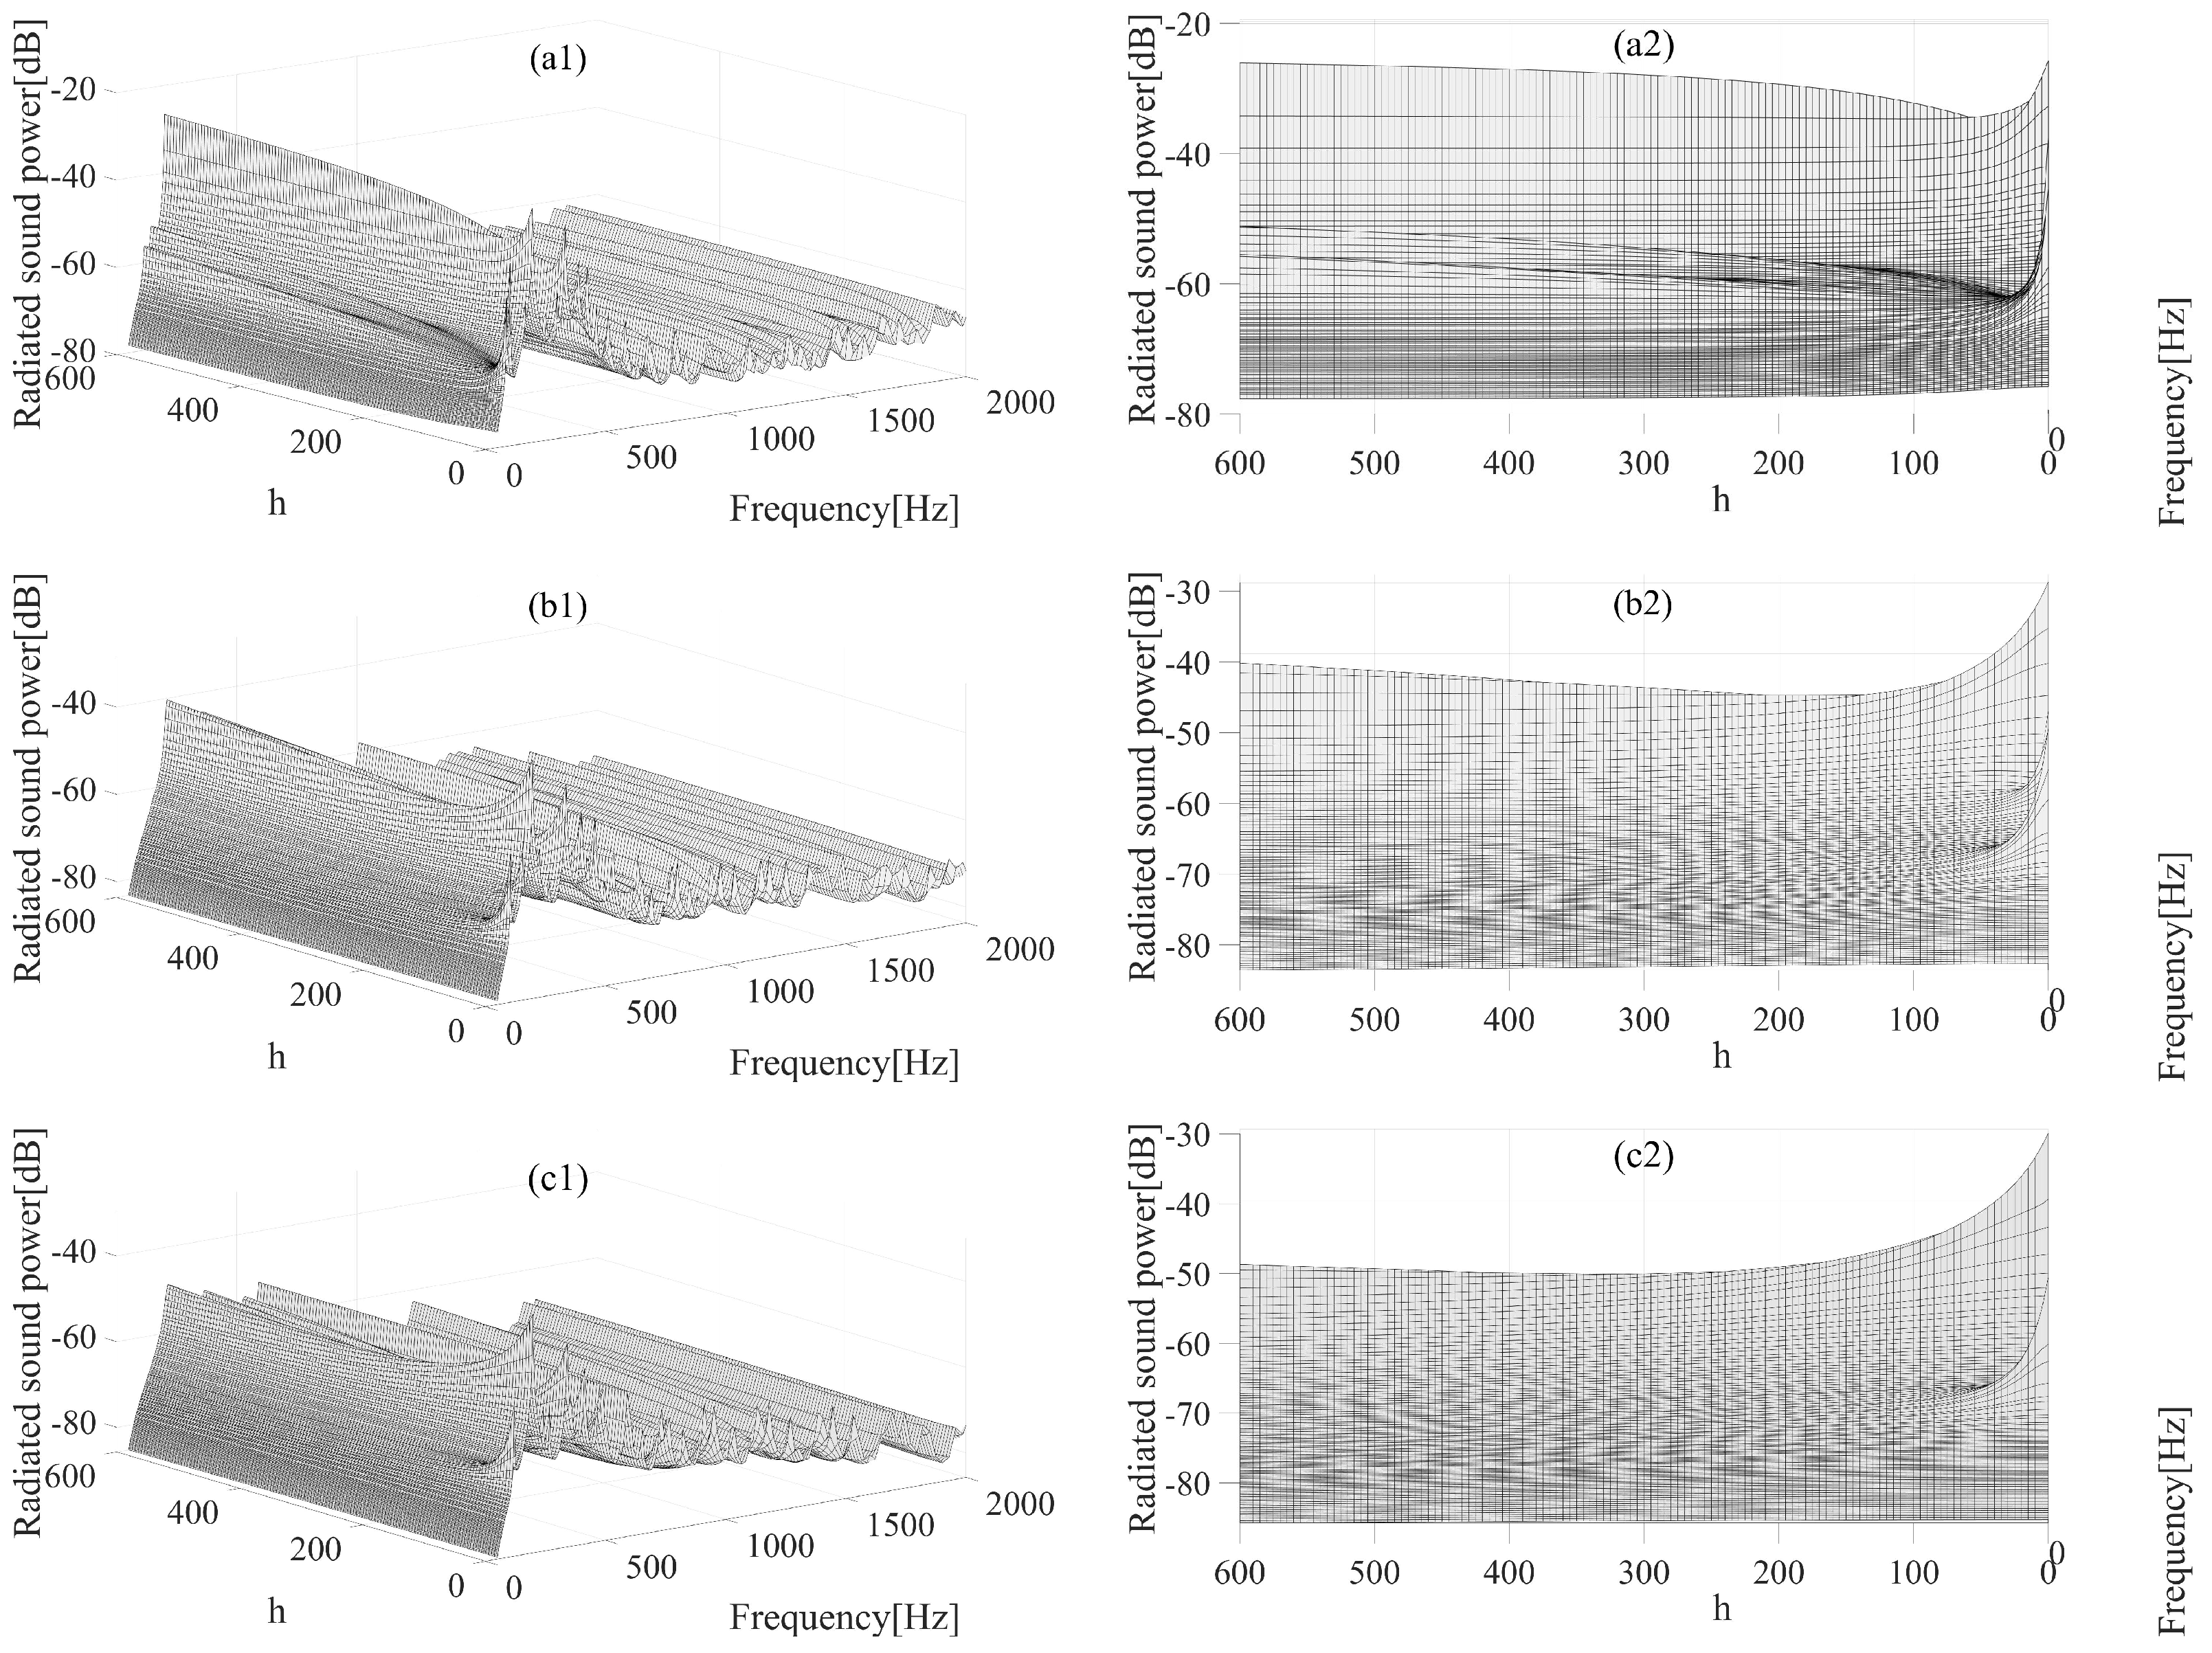
are more sensitive to changes in the gain coefficient and an optimal gain exists. To illustrate the optimal gain for controlling the sound power of the curved plate,
Figure 11 shows a three-dimensional plot of the control effect versus frequency and gain coefficient. The left figure shows a three-dimensional view of the radiated sound power of the curved plate, and the right figure is the left view of the three-dimensional view showing the radiated sound power of the (1,1) mode. The radiated sound power of the curved plates shows a trend of decreasing and then increasing with the increase in the gain coefficient. For the mode (1,1), the curved plate with the 1 mm thickness has the best control effect at a gain of 58, and the maximum sound reduction is about 9 dB. The thickness of the 1.6 mm curved plate reaches its best at a gain of 140 and has about 16 dB sound reduction, and the curved plate with 2 mm thickness at the gain of 315 achieves its biggest sound reduction about 20 dB. The above results show that as the thickness of the curved plate increases, the corresponding optimal gain increases, and the control effect of the active control unit at the optimal gain is significantly improved.
5. Conclusions
The control effects of distributed velocity feedback on flat and curved plates under TBL excitation are investigated. For the flat plate, the results show that the mechanism of distributed velocity feedback is equivalent to passive damping. The effective control frequency band can be significantly improved when the actuators deviate slightly from the uniform distribution.
For the curved plate, even if the active control units deviate slightly from the uniform distribution, the control effect is not significantly improved at higher radiation (1,1) modes. The curvature and thickness of the curved plate have a large effect on the active control effect of the (1,1) mode, increasing the radius of curvature from 1 m to 3 m increases the control effect of the active control units from 6 dB to 13 dB, and increasing the thickness from 1 mm to 2 mm increases the control effect of the active control units from 7 dB to 14 dB. The changes in curvature and thickness have a significant effect on the ratio of the stiffness associated with membrane tensions to the stiffness associated with bending forces, and the control effect is sensitive to the magnitude of . When is less than 70, the control effect is mostly greater than 10 dB, when is greater than 70, the control effect is poor, and when is greater than 100, the control effect may be less than 5 dB. In the (1,1) mode, the value of decays as the thickness of the curved plate increases, while the optimal gain coefficient increases and the control of the radiated sound power is improved. The optimal gain coefficient for a 1 mm thick curved plate is 58 with a control effect of approximately 9 dB; for a 1.6 mm thick curved plate, the optimum gain coefficient is 140 with a control effect of approximately 16 dB; and for a 2 mm thick curved plate, the optimal gain coefficient is 315 with a control effect of approximately 20 dB.
The element-based model enumerates the effects of different curvatures and thicknesses on the decentralized feedback control of curved plates, which is useful to guide the design of wall plates for a passenger aircraft cruising at high speed.


