
An Assessment of Persistent Acoustic Monitoring of a Nuclear Reactor during Full Power Generation
 , , ,
, , ,
Abstract
:1. Introduction
2. Materials and Methods
3. Results and Discussion
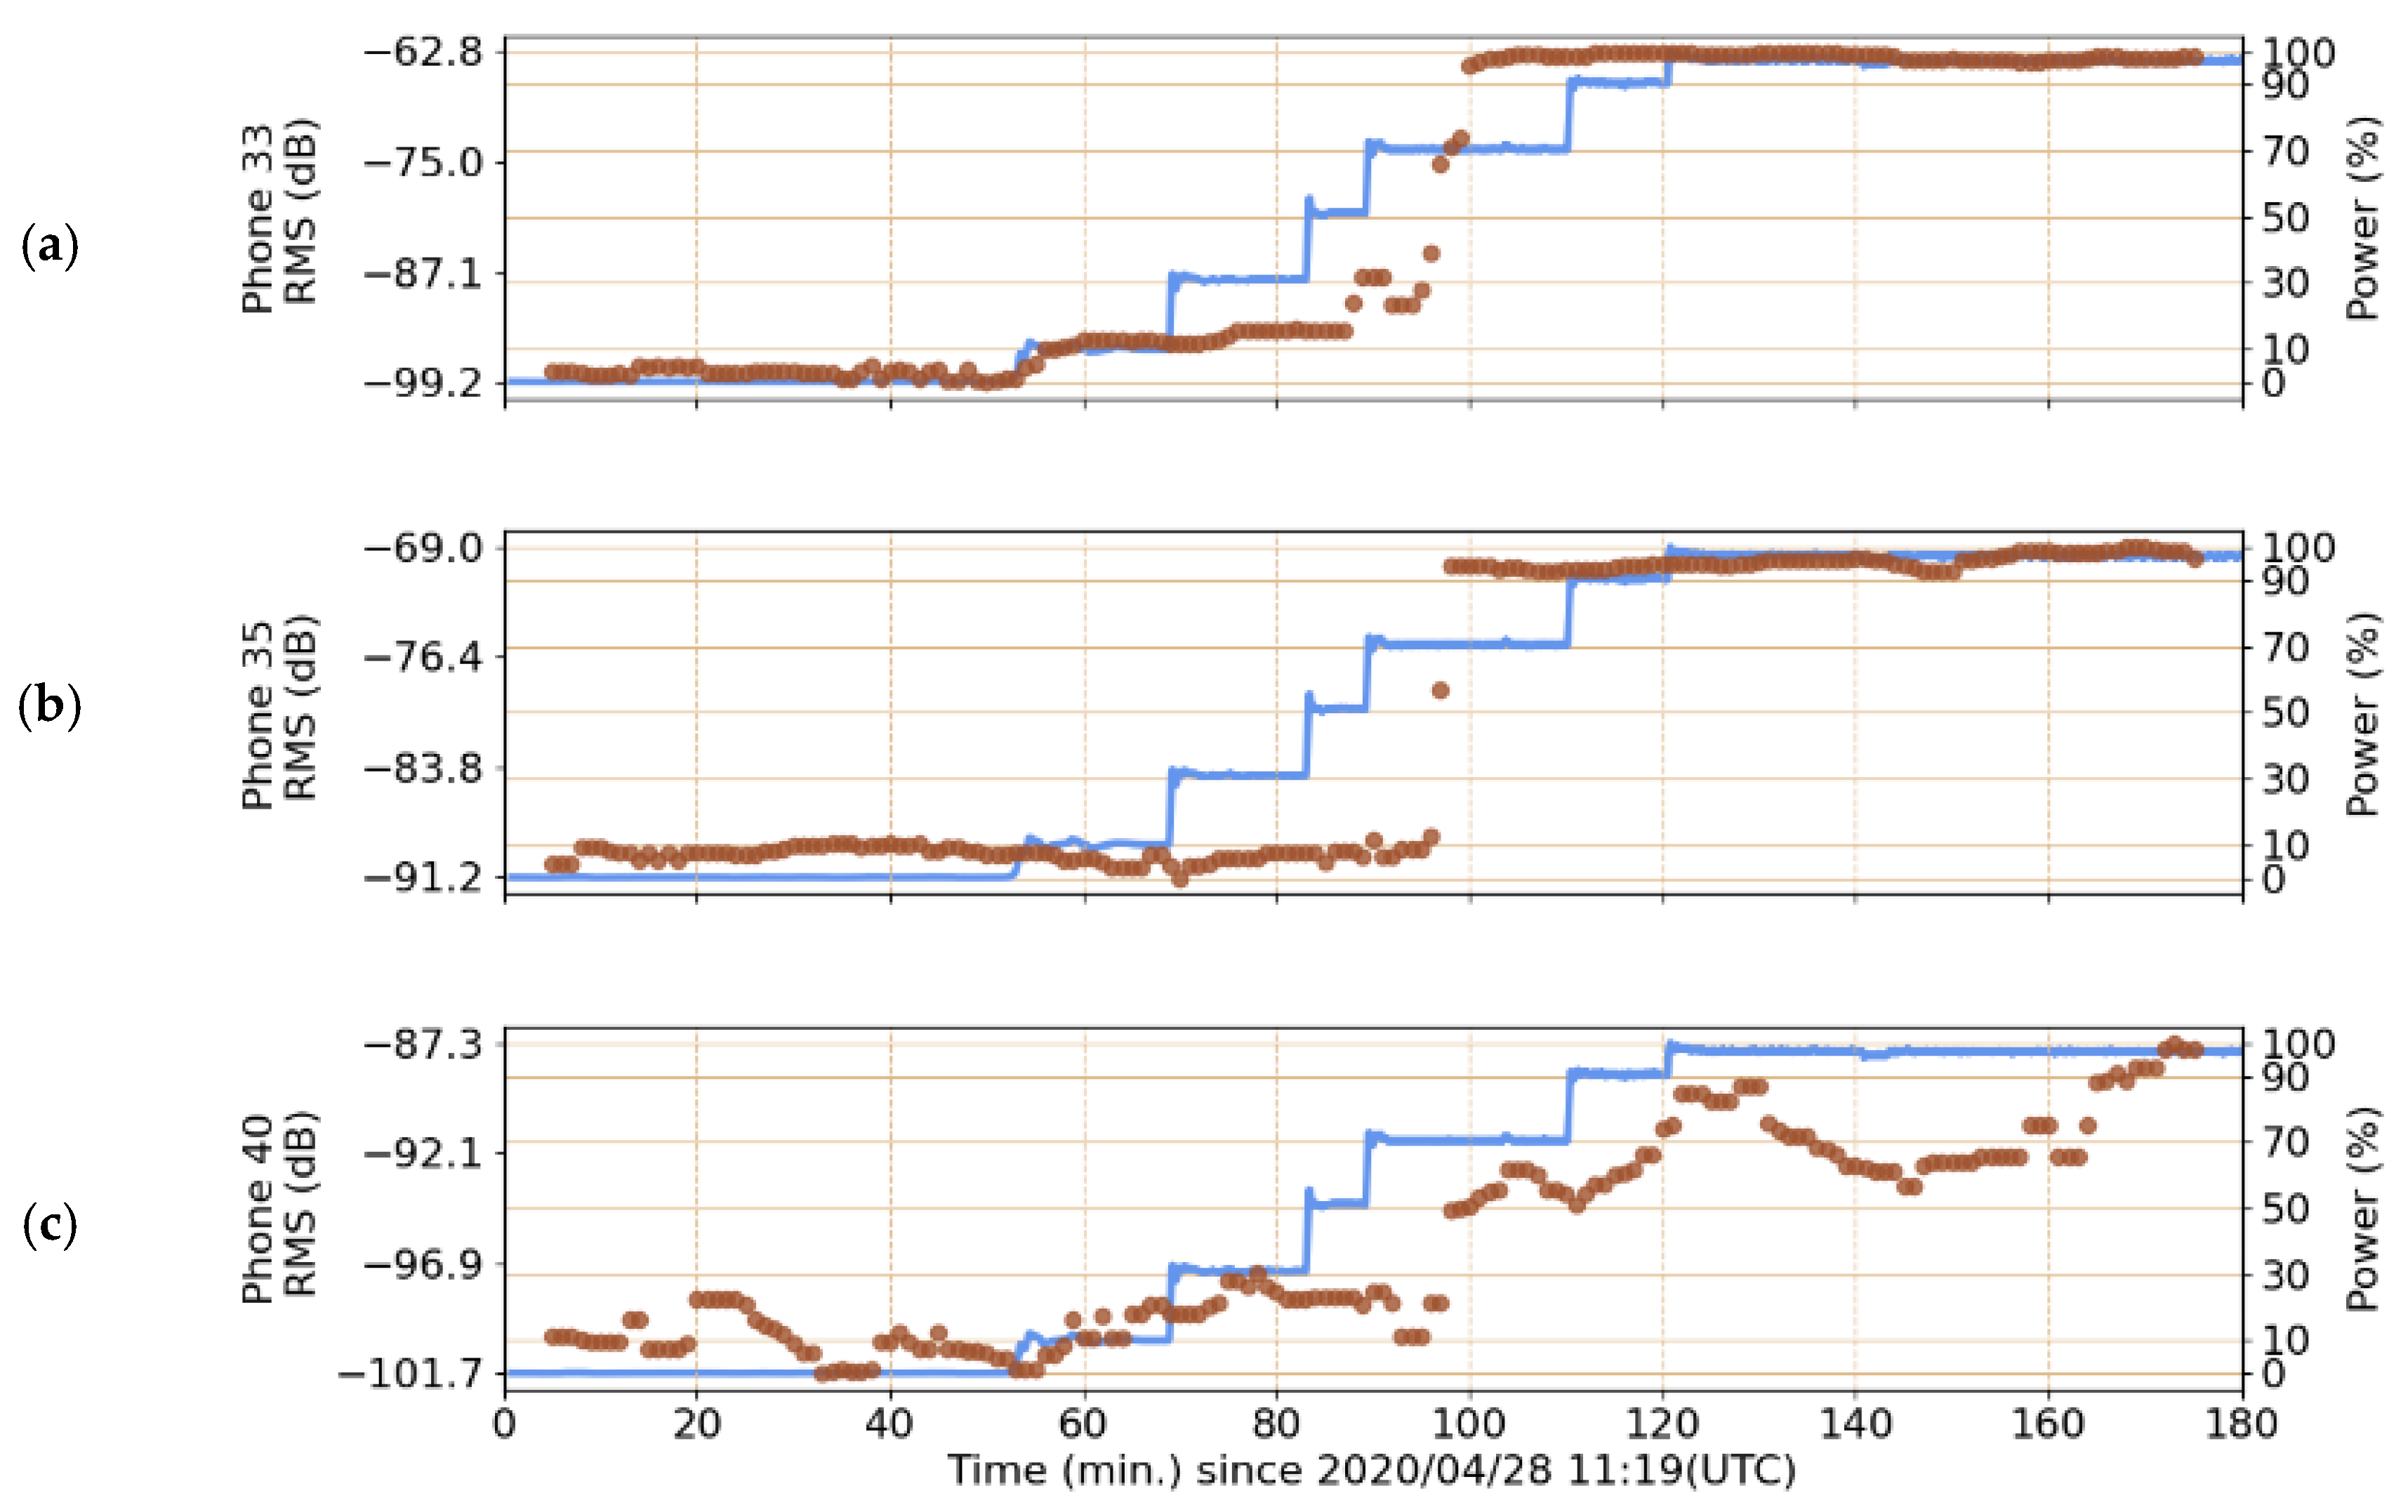
3.1. HFIR Cycle 487
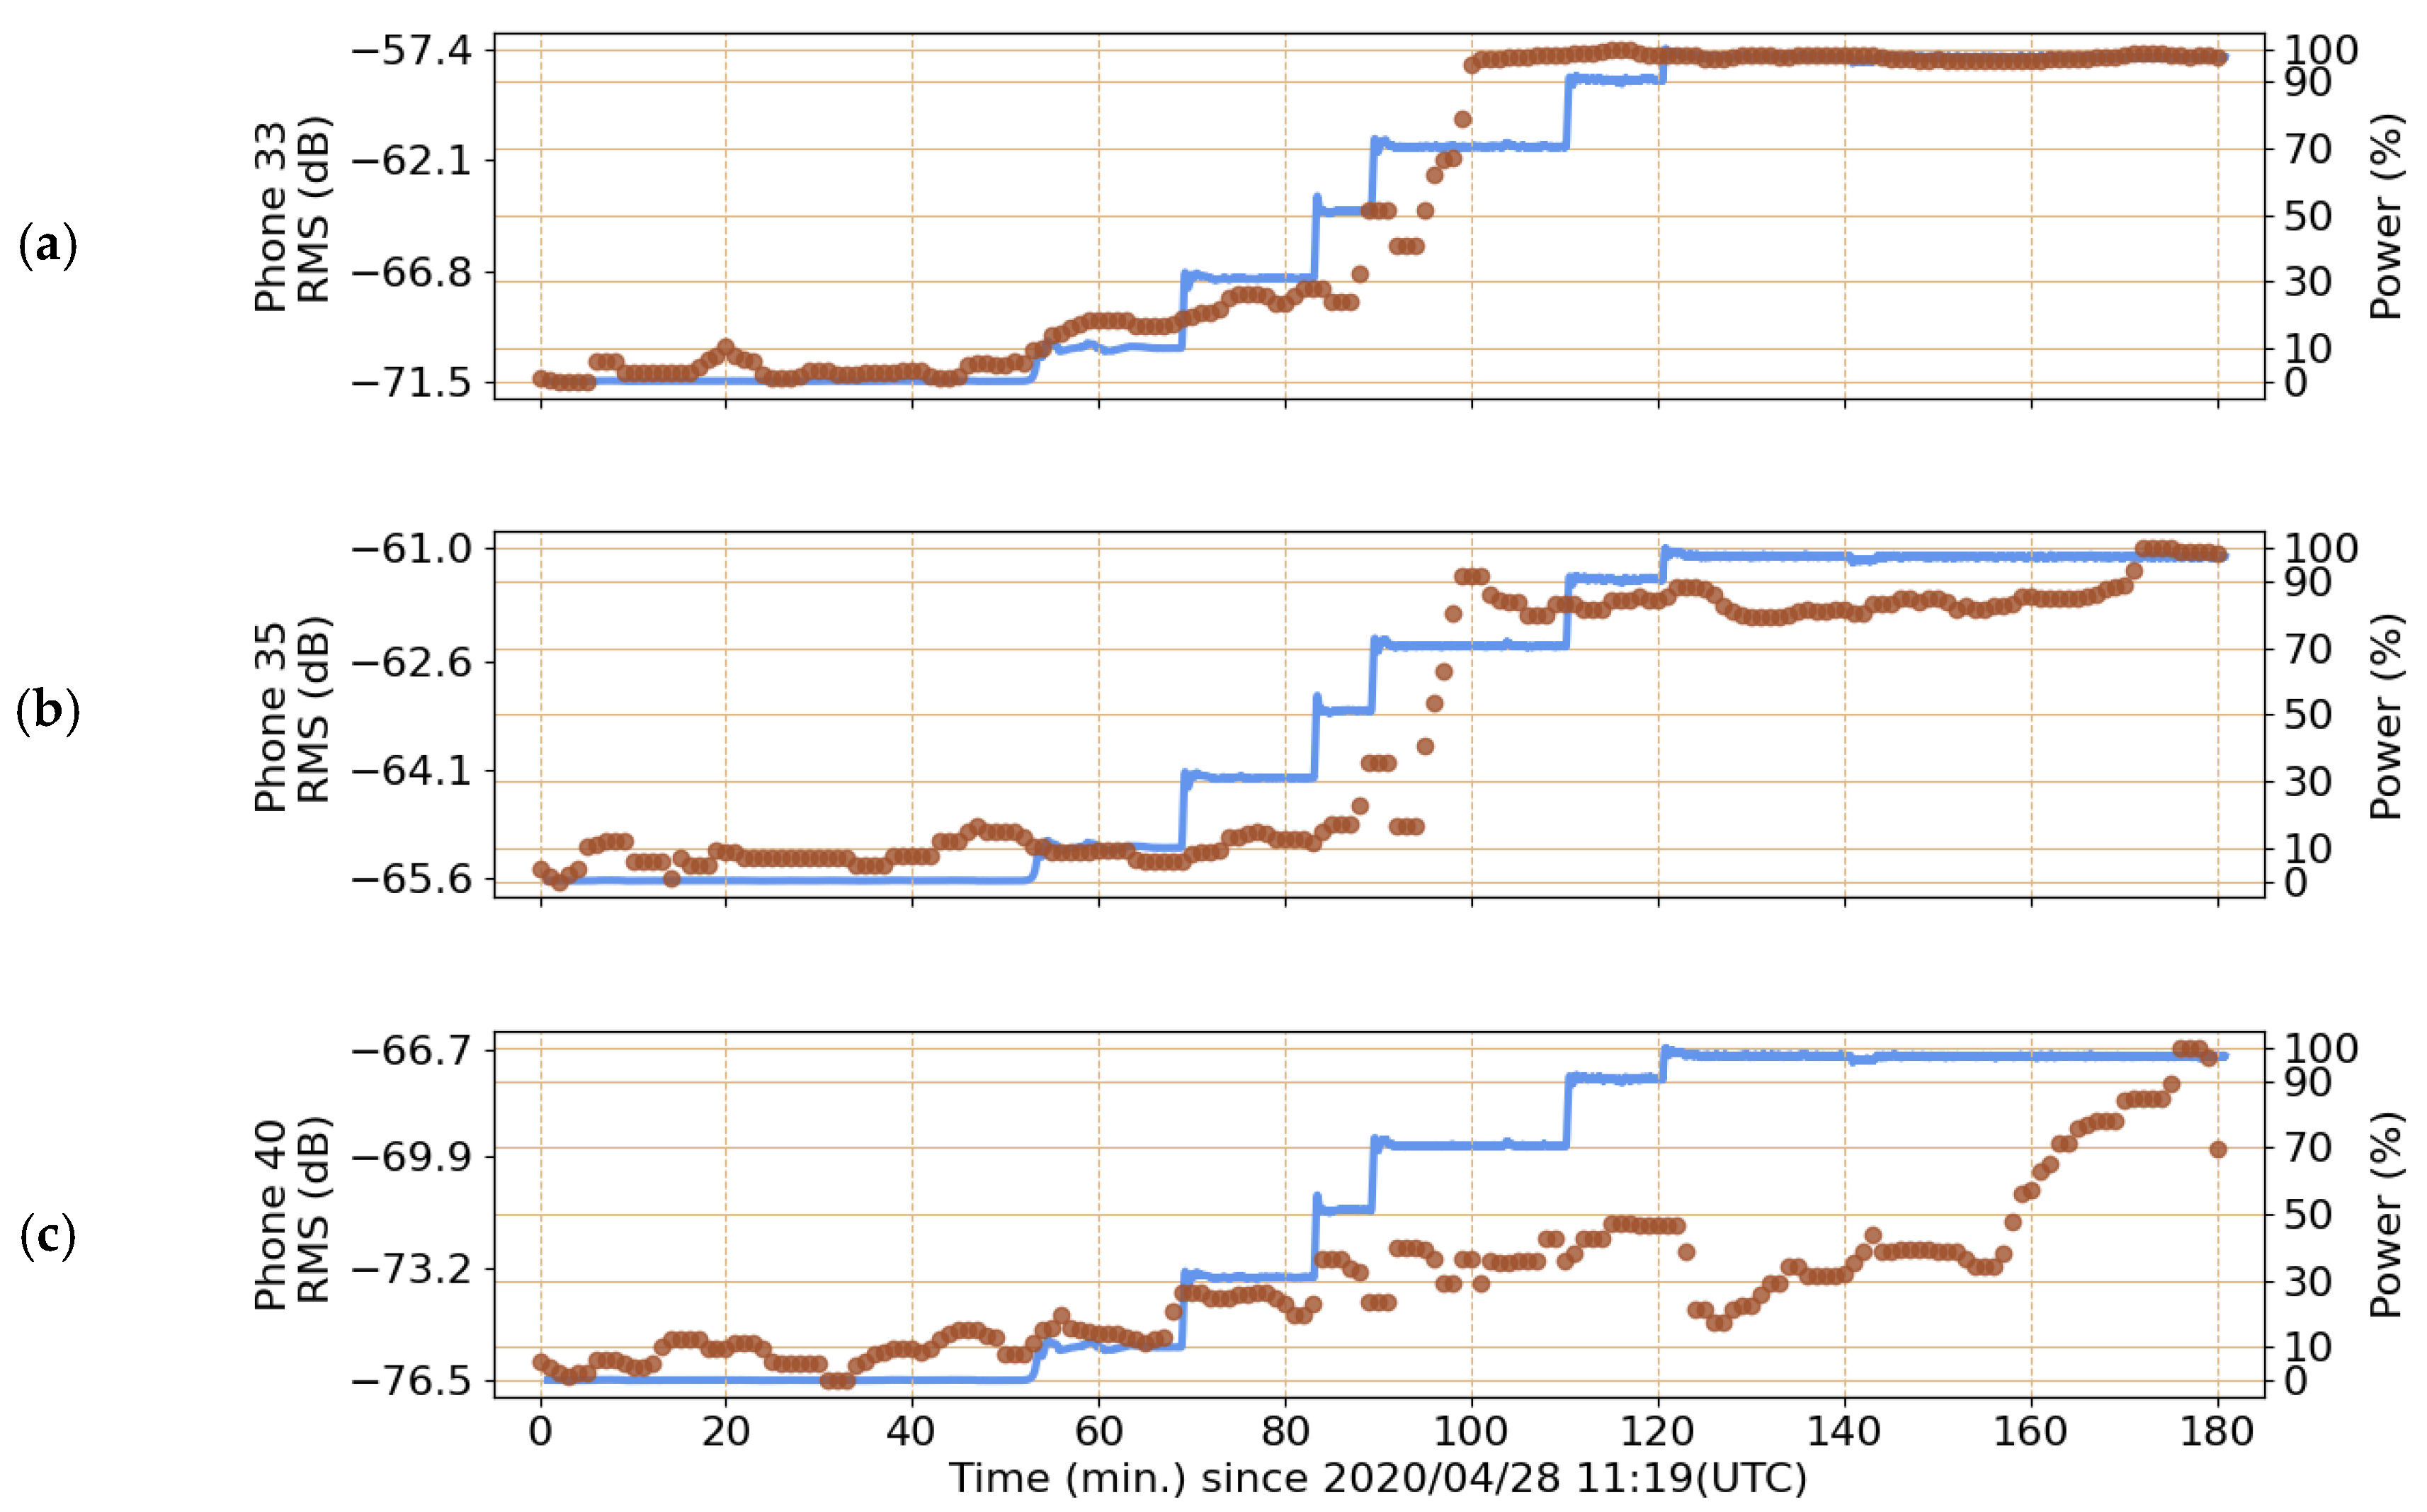
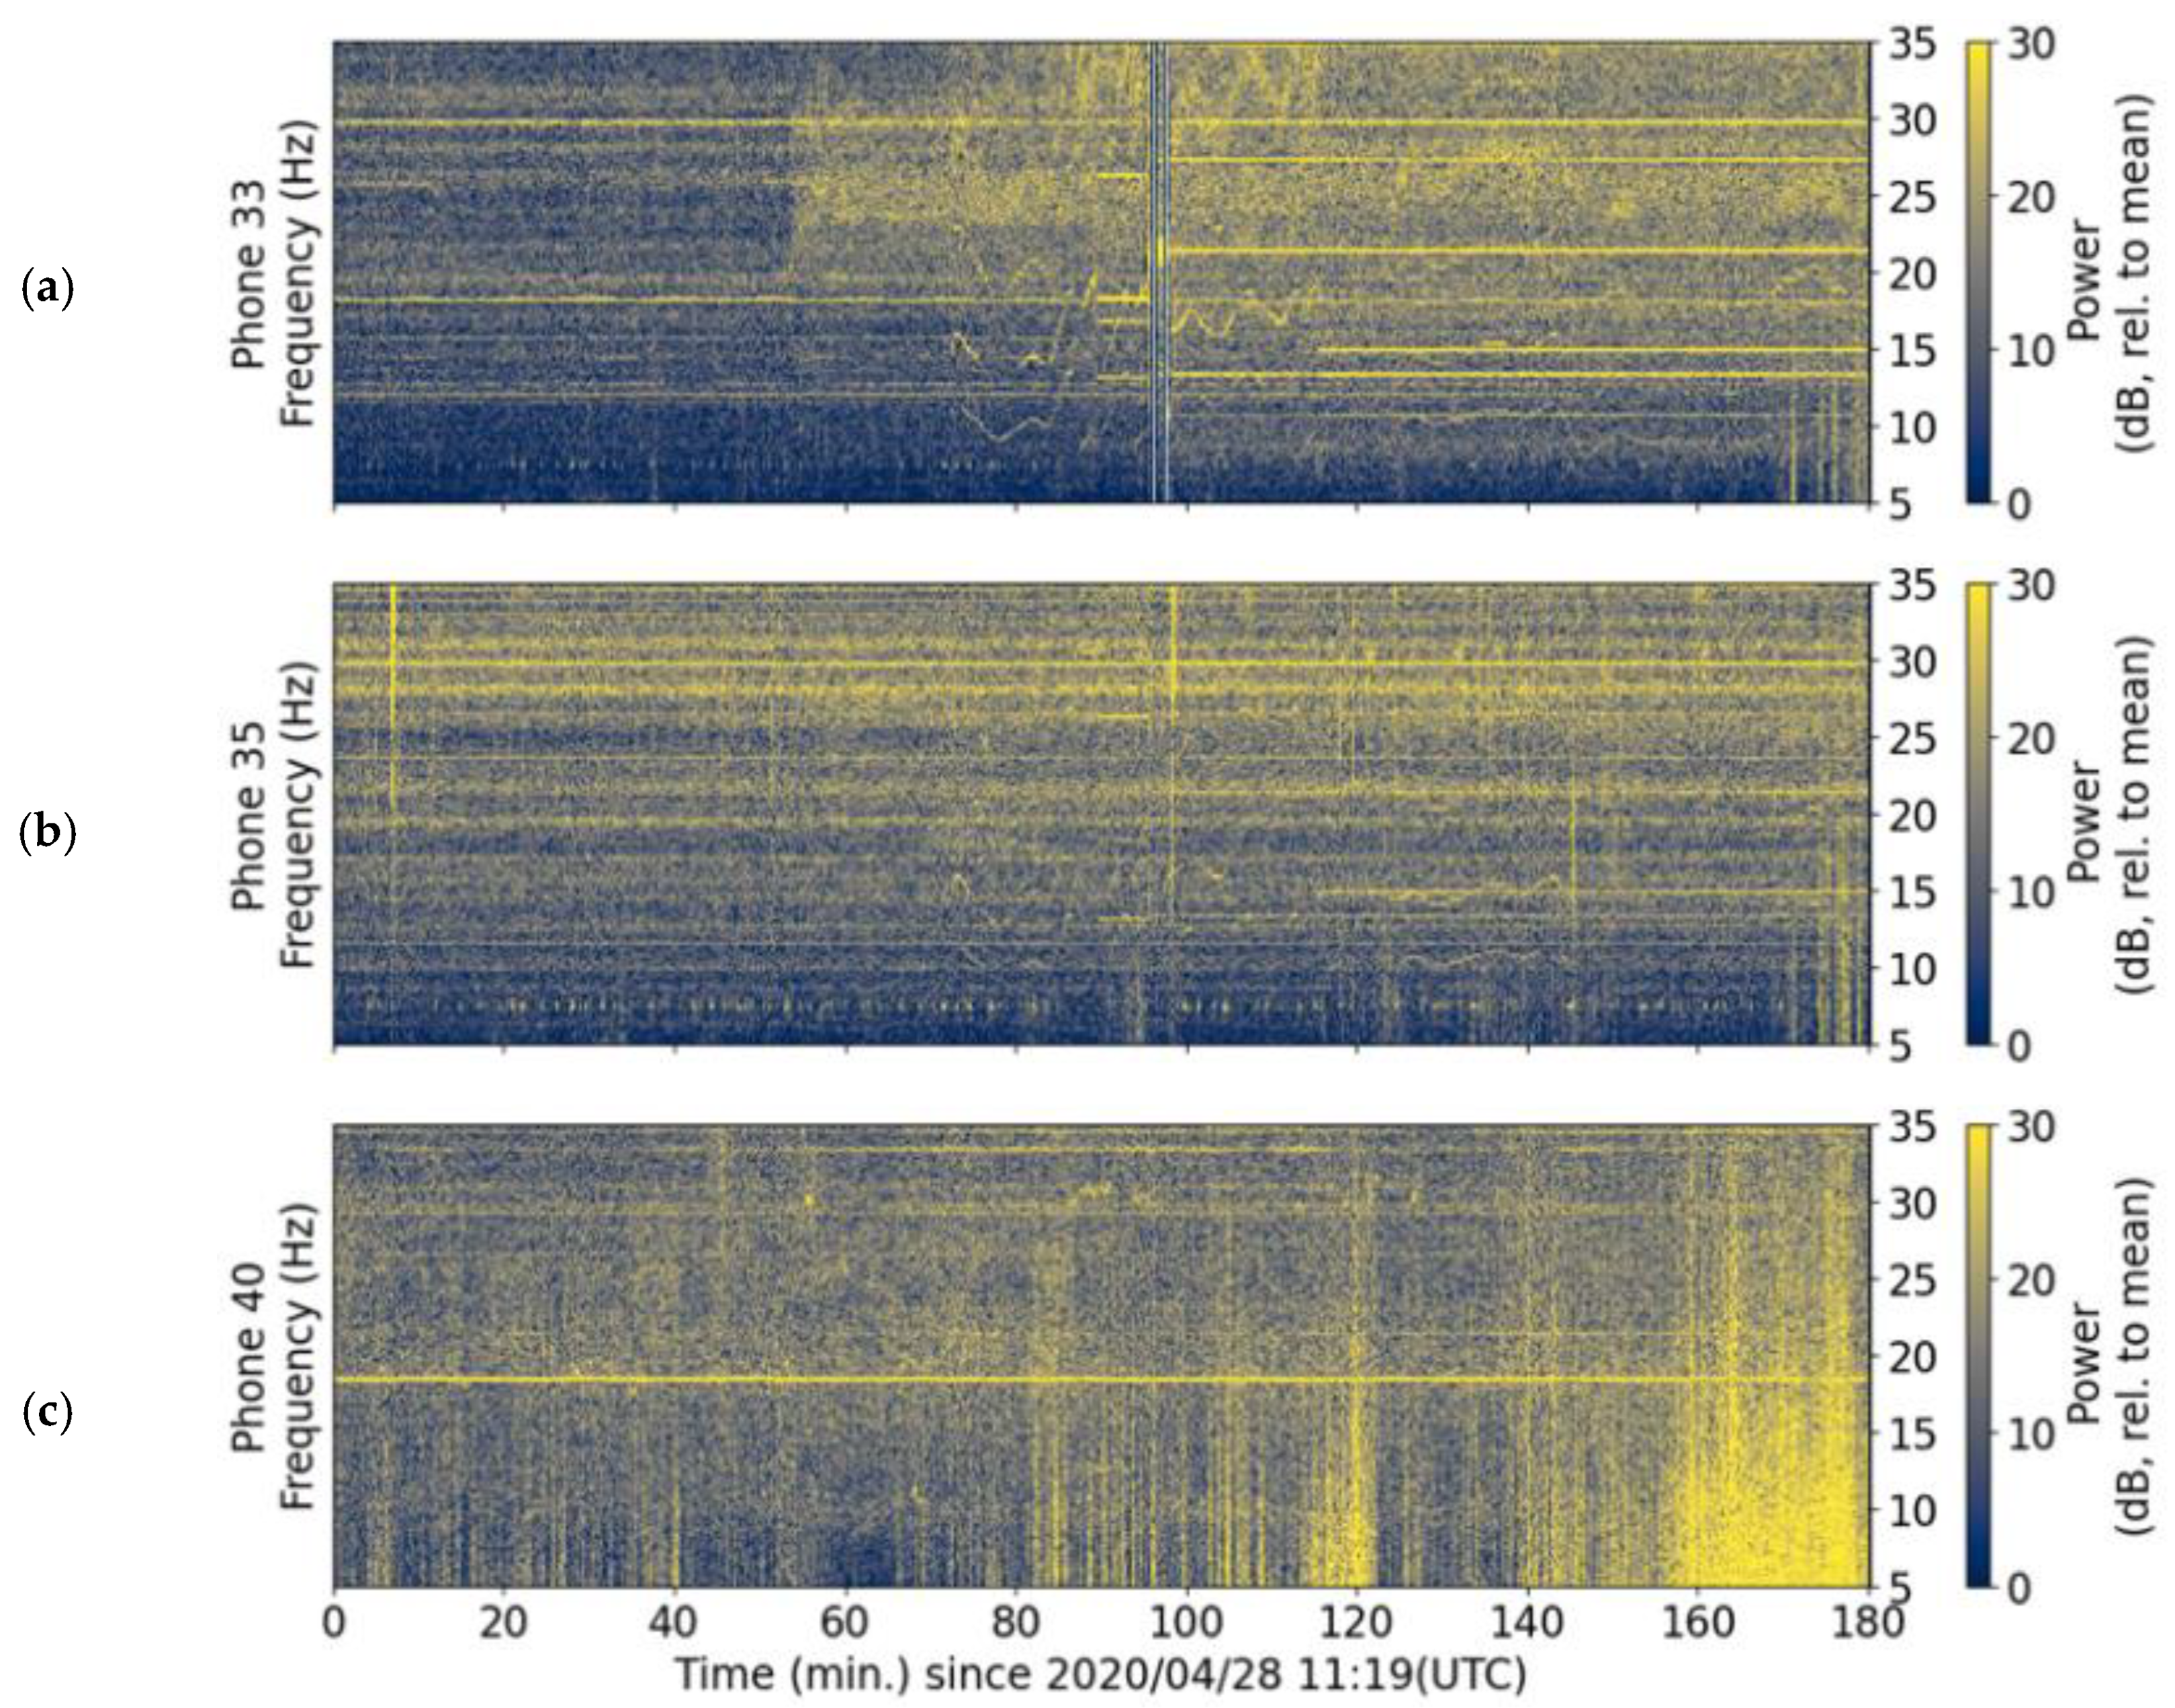
3.1.1. Cycle 487 Start-Up
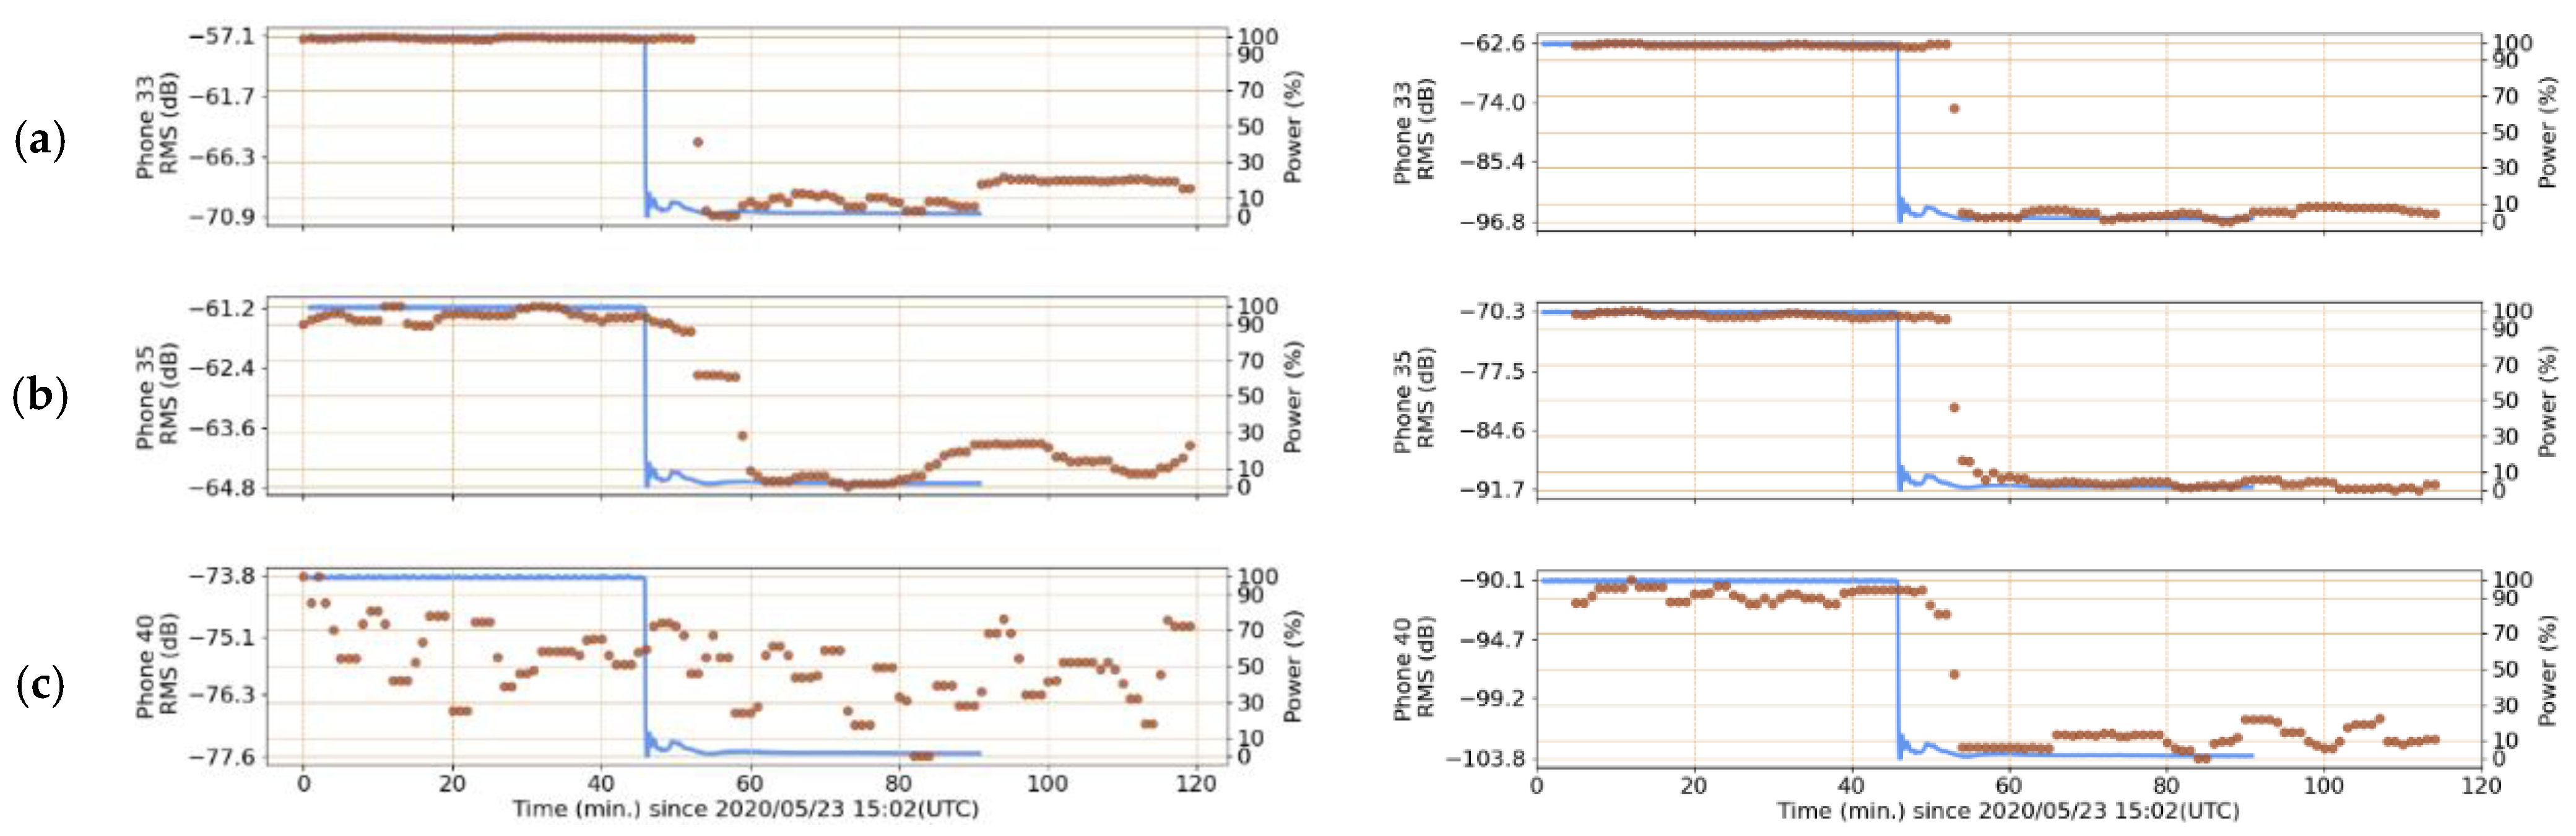
3.1.2. Cycle 487 Shutdown
3.2. HFIR Cycle 488-B
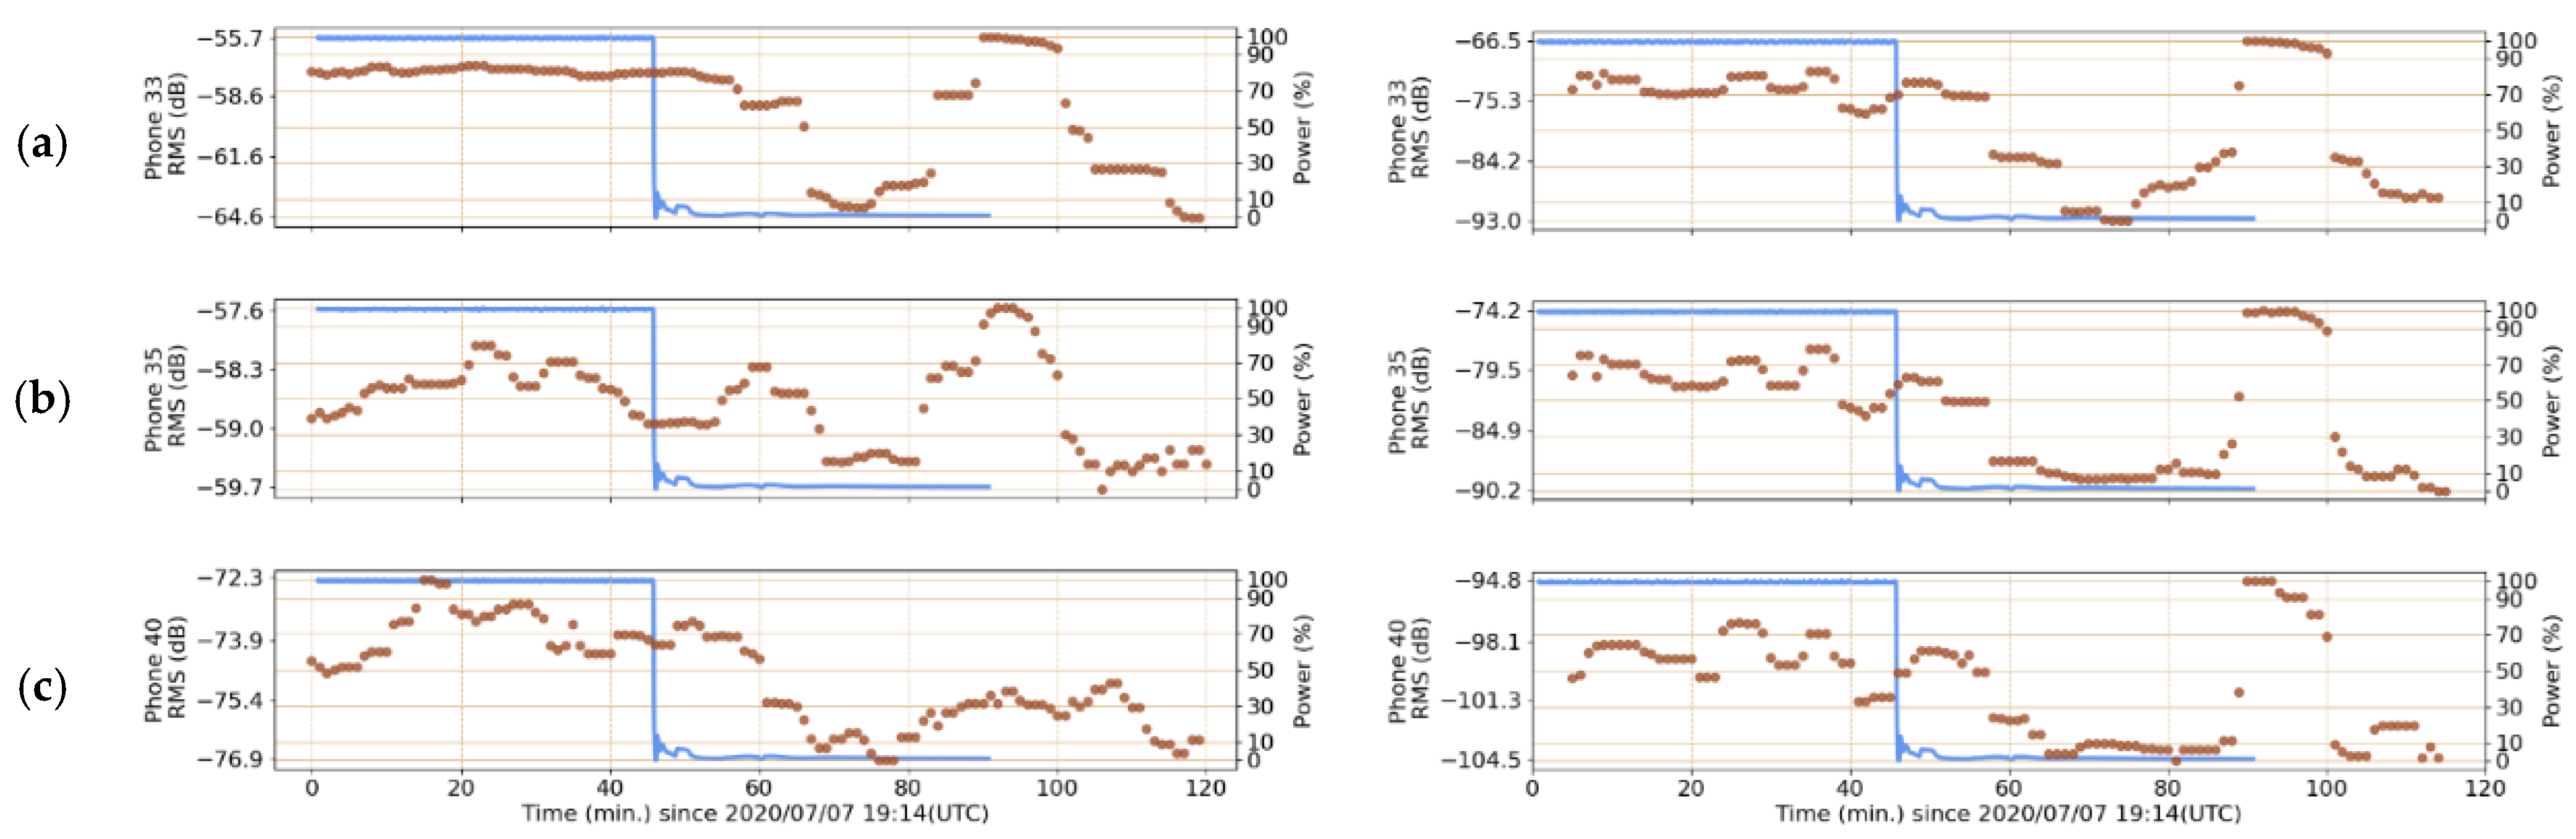
Cycle 488-B Shutdown
3.3. HFIR Cycle 489
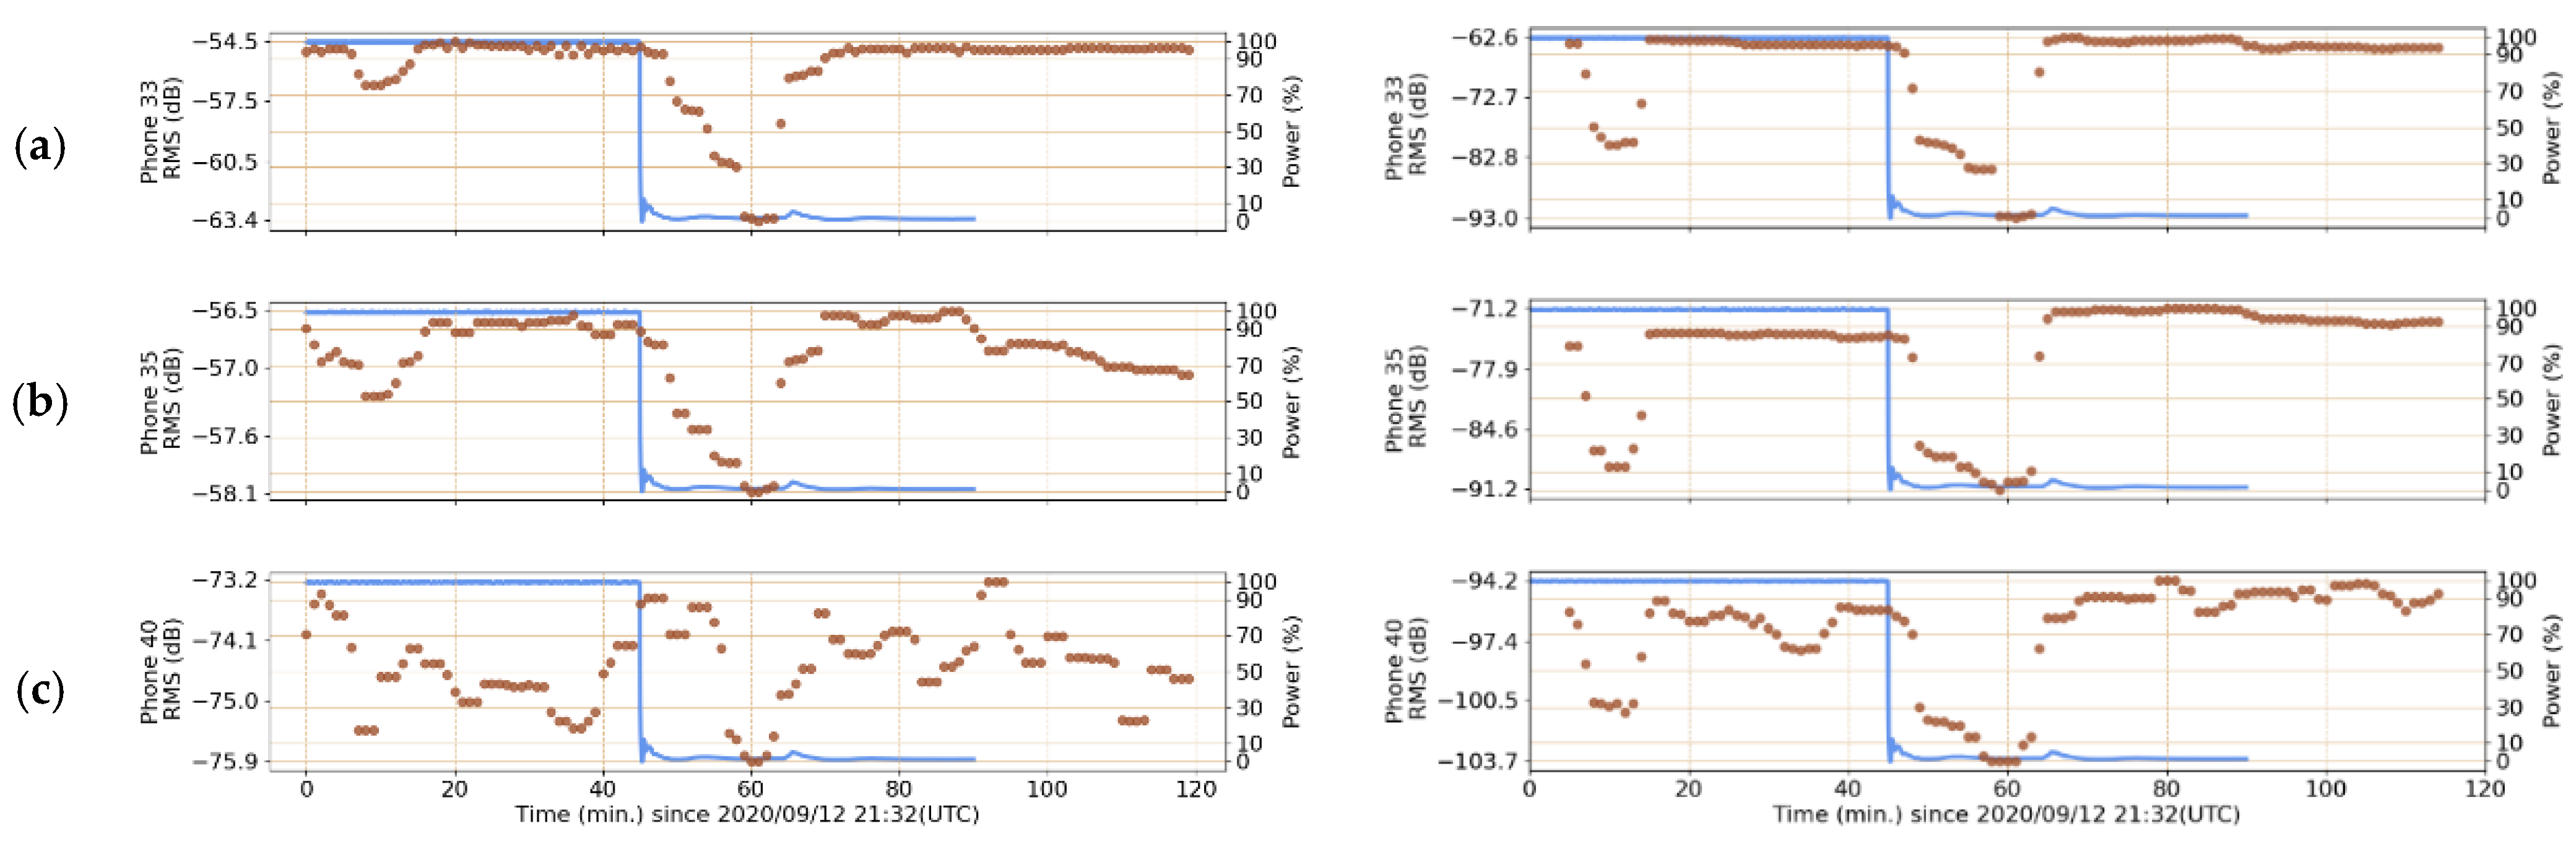
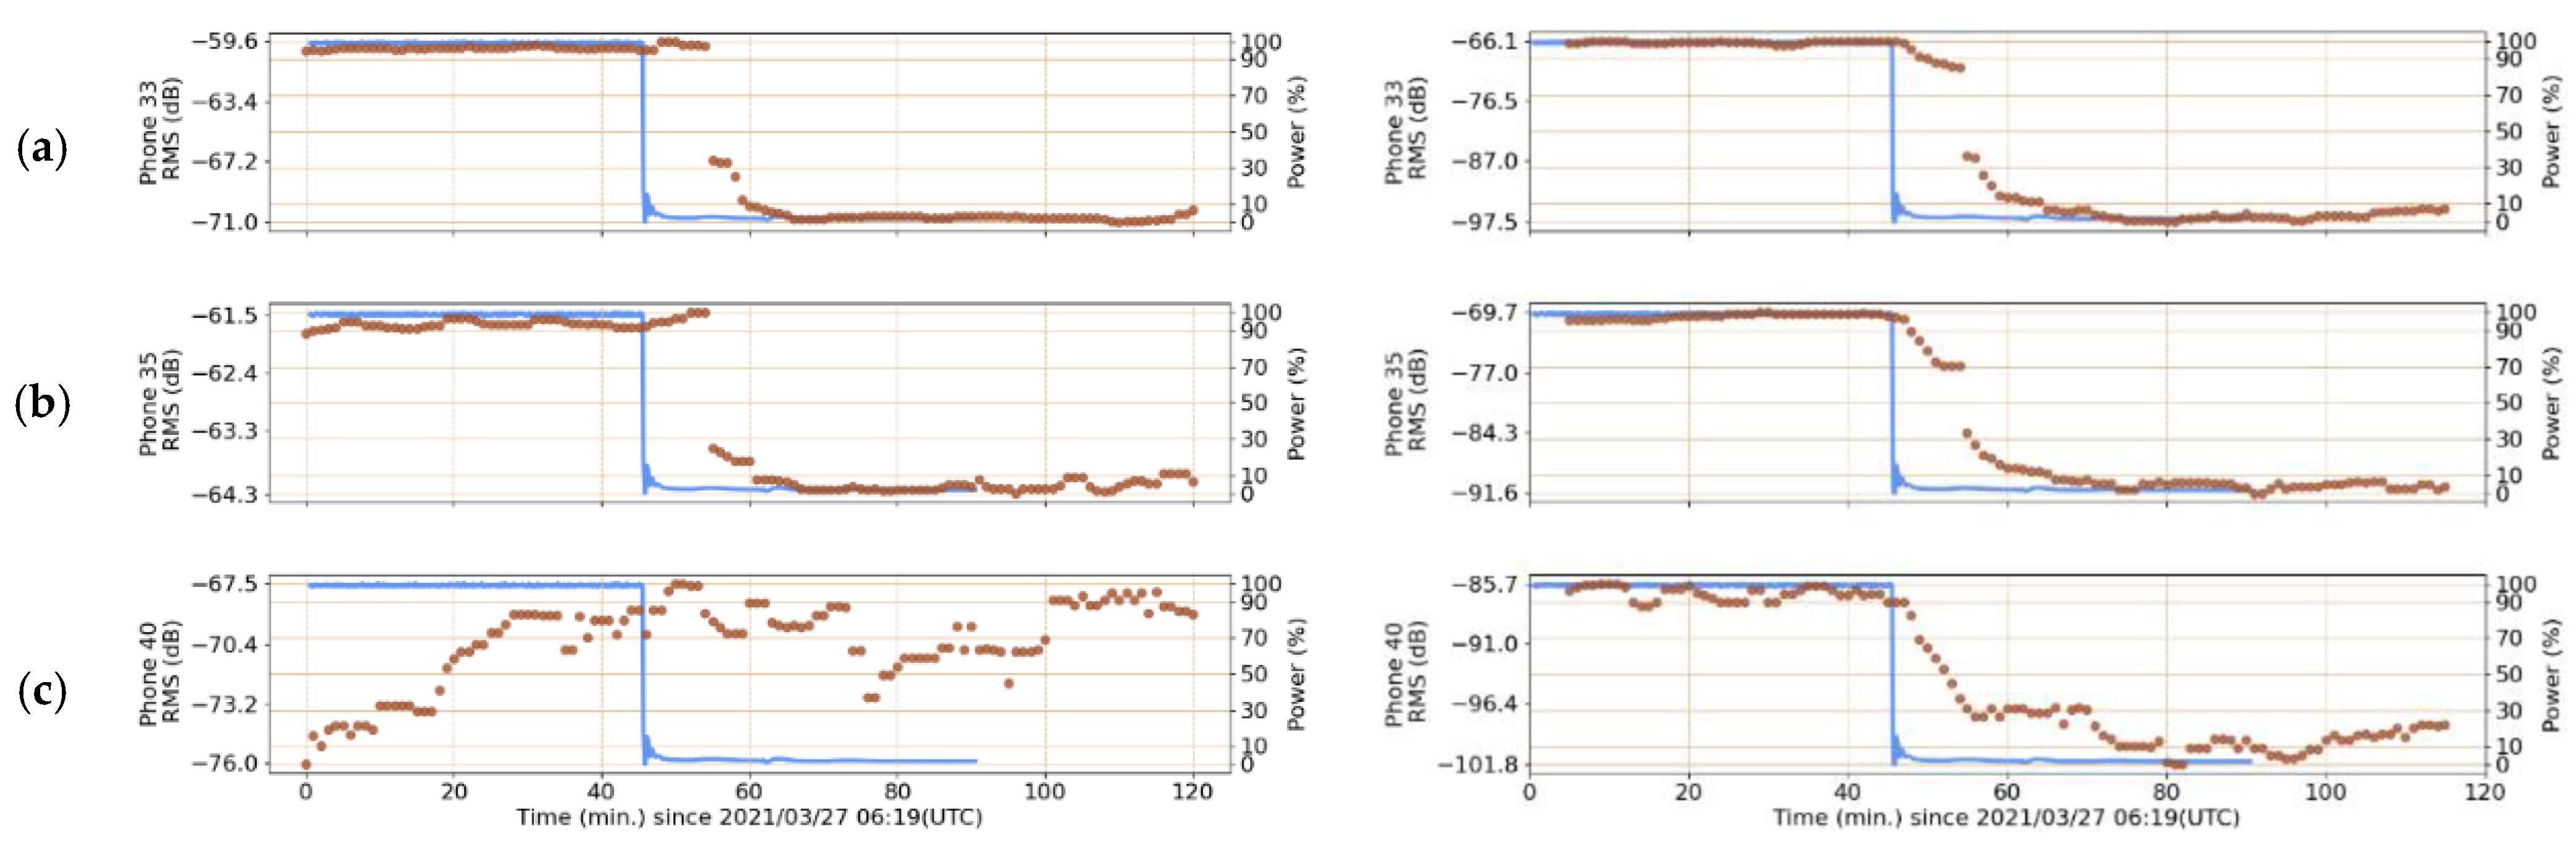
Cycle 489 Shutdown
3.4. HFIR Cycle 490
Cycle 490 Shutdown
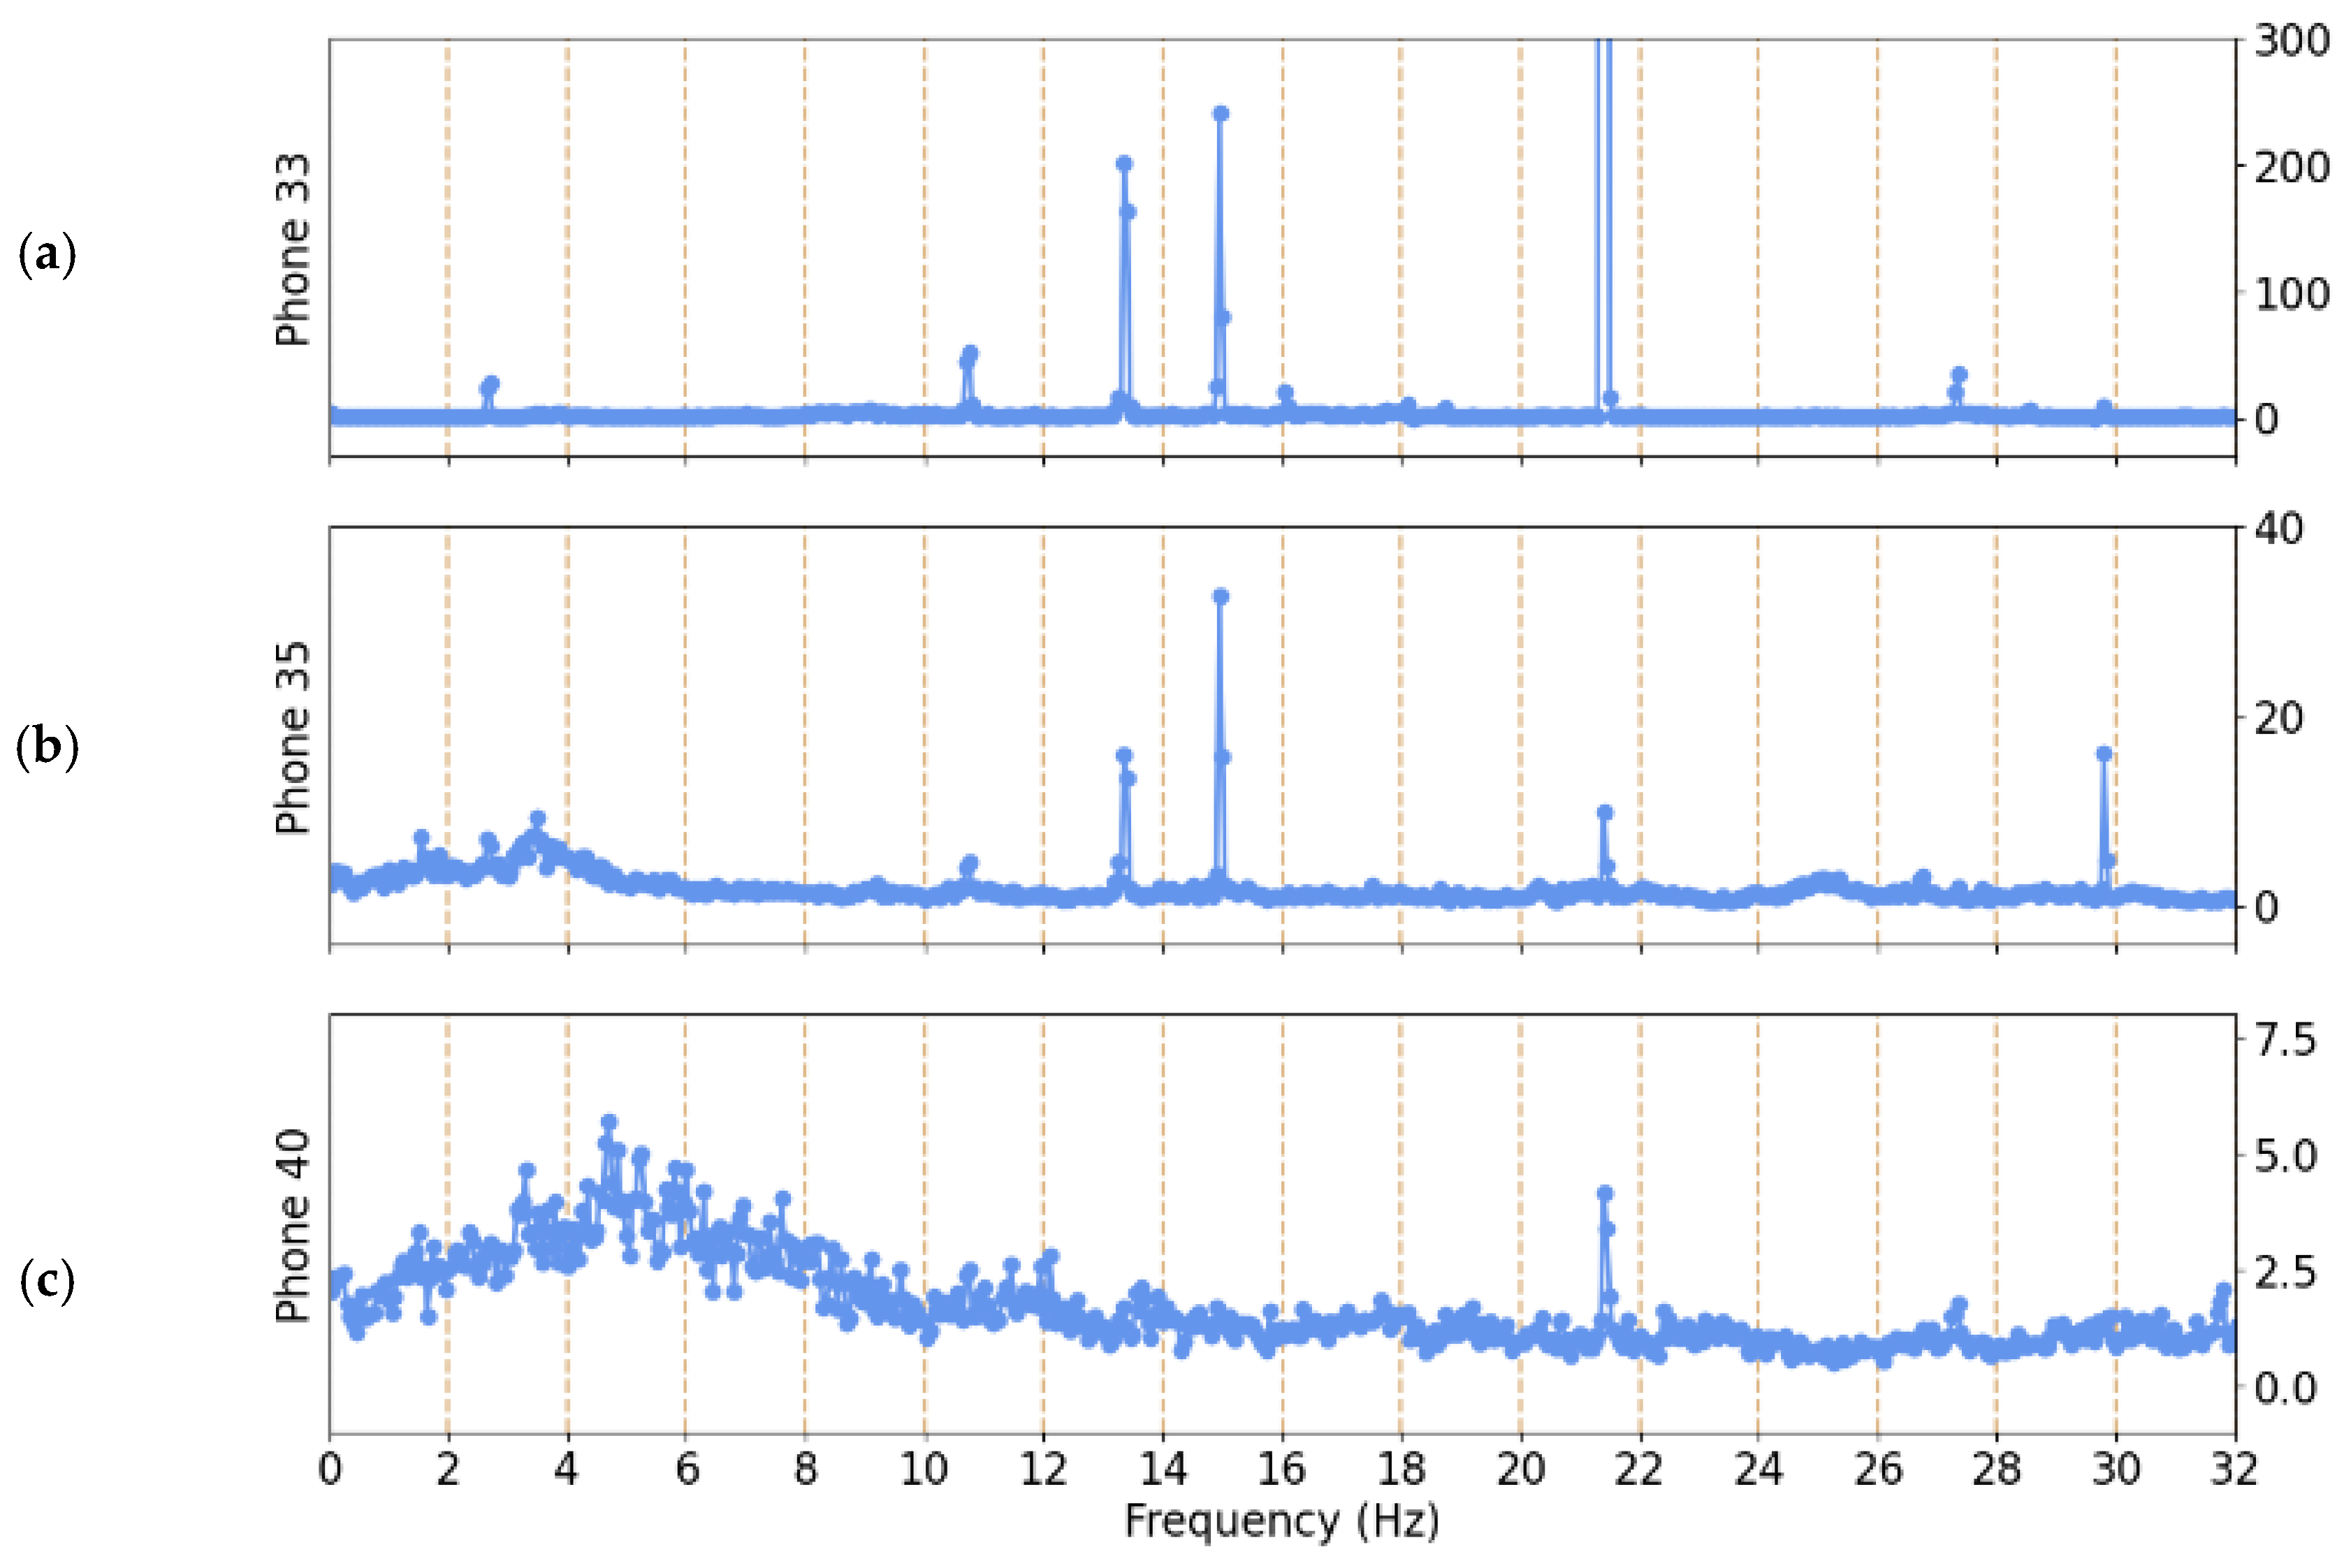
3.5. Observation of Additional Frequencies Related to Fan Operations
4. Conclusions
Supplementary Materials
Author Contributions
Funding
Data Availability Statement
Acknowledgments
Conflicts of Interest
References
- Stromkov, A.; Didenkulov, I.N.; Karlik, Y.S.; Petropavlovsk-Kamchatski, P. Acoustic detection of tsunamis in the open sea. In Proceedings of the Petropavlovsk-Kamchatsky Tsunami Workshop, Petropavlovsk-Kamchatsky, Russia, 10–15 September 2002; pp. 55–62. [Google Scholar]
- Bedard, A.J. Detection of avalanches using atmospheric infrasound. In Proceedings of the 57th Annual Meeting of the Western Snow Conference, Fort Collins, CO, USA, 18 April 1989; pp. 52–59. [Google Scholar]
- Bedard, J.A.J.; Bloemker, R. Detection of space debris and meteor impacts using atmospheric infrasound. Small Spacecr. Space Environ. Instrum. Technol. 1997, 3116, 177–192. [Google Scholar] [CrossRef]
- Bedard, A.J.; Georges, T.M. Atmospheric Infrasound. Phys. Today 2000, 53, 32–37. [Google Scholar] [CrossRef]
- Le Pichon, A.; Herry, P.; Mialle, P.; Vergoz, J.; Brachet, N.; Garcés, M.; Drob, D.; Ceranna, L. Infrasound associated with 2004–2005 large Sumatra earthquakes and tsunami. Geophys. Res. Lett. 2005, 32, e2005GL023893. [Google Scholar] [CrossRef]
- Garces, M.; Caron, P.; Hetzer, C.; Le Pichon, A.; Bass, H.; Drob, D.; Bhattacharyya, J. Deep infrasound radiated by the Sumatra earthquake and tsunami. Eos. Trans. Am. Geophys. Union 2005, 86, 317. [Google Scholar] [CrossRef]
- Allstadt, K.E.; Matoza, R.S.; Lockhart, A.B.; Moran, S.C.; Caplan-Auerbach, J.; Haney, M.M.; Thelen, W.A.; Malone, S.D. Seismic and acoustic signatures of surficial mass movements at volcanoes. J. Volcanol. Geotherm. Res. 2018, 364, 76–106. [Google Scholar] [CrossRef] [Green Version]
- De Angelis, S.; Diaz-Moreno, A.; Zuccarello, L. Recent Developments and Applications of Acoustic Infrasound to Monitor Volcanic Emissions. Remote. Sens. 2019, 11, 1302. [Google Scholar] [CrossRef] [Green Version]
- Bedard, A.J. Low-Frequency Atmospheric Acoustic Energy Associated with Vortices Produced by Thunderstorms. Mon. Weather. Rev. 2005, 133, 241–263. [Google Scholar] [CrossRef] [Green Version]
- McKisic, J.M. Infrasound and the Infrasonic Monitoring of Atmospheric Nuclear Explosions: A Literature Review; U.S. Department of Energy Office of Non-Proliferation and National Security: Washington, DC, USA, 1997. Available online: https://apps.dtic.mil/sti/pdfs/ADA339249.pdf (accessed on 19 September 2022).
- CTBTO Preparatory Commission, n.d., “Infrasound Monitoring,” Webpage [Online]. Available online: https://www.ctbto.org/verification-regime/monitoring-technologies-how-they-work/infrasound-monitoring/ (accessed on 19 September 2022).
- Bowman, D.C.; Krishnamoorthy, S. Infrasound From a Buried Chemical Explosion Recorded on a Balloon in the Lower Stratosphere. Geophys. Res. Lett. 2021, 48, e2021GL094861. [Google Scholar] [CrossRef]
- Che, I.-Y.; Park, J.; Kim, I.; Kim, T.S.; Lee, H.-I. Infrasound signals from the underground nuclear explosions of North Korea. Geophys. J. Int. 2014, 198, 495–503. [Google Scholar] [CrossRef] [Green Version]
- Blom, P.; Marcillo, O.; Arrowsmith, S. Analysis and modeling of infrasound from a four-stage rocket launch. J. Acoust. Soc. Am. 2016, 139, 3134–3138. [Google Scholar] [CrossRef]
- Ishihara, Y.; Hiramatsu, Y.; Yamamoto, M.-Y.; Fujita, K. Infrasound/seismic observation of the Hayabusa reentry: Observations and preliminary results. Earth Planets Space 2012, 64, 655–660. [Google Scholar] [CrossRef] [Green Version]
- Evers, L.G.; Assink, J.; Smets, P. Infrasound from the 2009 and 2017 DPRK rocket launches. Geophys. J. Int. 2018, 213, 1785–1791. [Google Scholar] [CrossRef] [Green Version]
- Balachandran, N.K.; Donn, W.L. Characteristics of Infrasonic Signals from Rockets. Geophys. J. R. Astron. Soc. 1971, 26, 135–148. [Google Scholar] [CrossRef]
- Donn, W.L.; Balachandran, N.K.; Kaschak, G. Atmospheric infrasound radiated by bridges. J. Acoust. Soc. Am. 1974, 56, 1367–1370. [Google Scholar] [CrossRef]
- Whitlow, R.D.; Haskins, R.; McComas, S.L.; Crane, C.K.; Howard, I.L.; McKenna, M.H. Remote Bridge Monitoring Using Infrasound. J. Bridg. Eng. 2019, 24, 1–11. Available online: https://ascelibrary.org/doi/10.1061/%28ASCE%29BE.1943-5592.0001375%28ASCE%29BE.1943-5592.0001375 (accessed on 19 September 2022). [CrossRef]
- Hubbard, H.H.; Shepherd, K.P. Aeroacoustics of large wind turbines. J. Acoust. Soc. Am. 1991, 89, 2495–2508. [Google Scholar] [CrossRef]
- Bilski, B. Exposure to infrasonic noise in agriculture. Ann. Agric. Environ. Med. 2017, 24, 86–89. [Google Scholar] [CrossRef] [Green Version]
- Nowacki, G.; Mitraszewska, I.; Kamiński, T.; Wierzejski, A. Research of infrasound noise in heavy goods vehicles and busses. In Proceedings of the 8th International Conference on Reliability and Statistics in Transportation and Communication, Riga, Latvia, 15–18 October 2008; pp. 209–215. Available online: https://citeseerx.ist.psu.edu/viewdoc/download?doi=10.1.1.520.6326&rep=rep1&type=pdf (accessed on 19 September 2022).
- Kudźma, Z.; Stosiak, M. Reduction of infrasounds in machines with hydrostatic drive. Acta Bioeng. Biomech. 2013, 15, 51–64. Available online: https://actabio.pwr.edu.pl/Vol15No2/6.pdf (accessed on 19 September 2022). [PubMed]
- Liszka, L. Long-distance propagation of infrasound from artificial sources. J. Acoust. Soc. Am. 1974, 56, 1383–1388. [Google Scholar] [CrossRef]
- Le Pichon, A.; Blanc, E.; Hauchecorne, A. Infrasound Monitoring for Atmospheric Studies: Challenges in Middle Atmosphere Dynamics and Societal Benefits; Springer: Cham, Switzerland, 2019. [Google Scholar]
- Flynn, G.S.; Parikh, N.; Egid, K.A.; Casleton, E. Predicting Power Levels of a Nuclear Reactor by Combining Multiple Modalities; LA-UR-19-26714; Los Alamos National Laboratory: Los Alamos, NM, USA, 2019.
- Chichester, D.L.; Garcés, M.A.; Watson, S.M.; Johnson, J.T.; Christe, A.J.; Cárdenas, E.S.; Asmar, K.A. Use of infrasound to monitor nuclear facilities. In Proceedings of the 59th Annual Meeting of the Institute of Nuclear Material Management (INMM 2018), Baltimore, MD, USA, 22–26 July 2018; Institute of Nuclear Materials Management, Curran Associates, Inc.: Red Hook, NY, USA; Volume 3, pp. 1912–1921. [Google Scholar]
- Chichester, D.L.; Garcés, M.A.; Watson, S.M.; Cárdenas, E.S.; Maceira, M.; Christe, A.J.; Holschuh, T.V. Initial assessment of infrasound signatures tied to nuclear facility operations. In Proceedings of the 60th Annual Meeting of the Institute of Nuclear Material Management (INMM 2019), Palm Desert, CA, USA, 14–18 July 2019; Volume 2, pp. 765–774. [Google Scholar]
- Cárdenas, E.S.; Garcés, M.A.; Krebs, J.F.; Watson, S.M.; Johnson, J.T.; Hix, J.D.; Chichester, D.L. Persistent Acoustic Sensing for Monitoring a Reactor Facility, in Institute of Nuclear Materials Management (INNM 2021), Virtual [Online]. 2021. Available online: https://resources.inmm.org/sites/default/files/2021-09/a296.pdf (accessed on 15 December 2022).
- Marcillo, O.E.; Maceira, M.; Chai, C.; Gammans, C.; Hunley, R.; Young, C. The Local Seismoacoustic Wavefield of a Research Nuclear Reactor and Its Response to Reactor Power Level. Seism. Res. Lett. 2020, 92, 378–387. [Google Scholar] [CrossRef]
- Chai, C.; Ramirez, C.; Maceira, M.; Marcillo, O. Monitoring Operational States of a Nuclear Reactor Using Seismoacoustic Signatures and Machine Learning. Seism. Res. Lett. 2022, 93, 1660–1672. [Google Scholar] [CrossRef]
- Chai, C.P.; Maceira, M.; Marcillo, O.E. Oak Ridge National Laboratory Seismo-Acoustic Characteristics of HFIR Cooling Tower Fans and Pumps, ORNL/TM-2021/2308, Oak Ridge National Laboratory, Oak Ridge, TN, USA [Online]. 2021. Available online: https://info.ornl.gov/sites/publications/Files/Pub169700.pdf (accessed on 19 September 2022).
- Eaton, S.W.; Cárdenas, E.S.; Hix, J.D.; Johnson, J.T.; Watson, S.M.; Chichester, D.L.; Garcés, M.A.; Magaña-Zook, S.A.; Maceira, M.; Marcillo, O.E.; et al. An algorithmic approach to predicting mechanical draft cooling tower fan speeds from infrasound signals. Appl. Acoust. 2022, 199, 10915. [Google Scholar] [CrossRef]
- Oak Ridge National Laboratory. High Flux Isotope Reactor (HFIR) User Guide: A Guide to In-Vessel Irradiations and Experiments, 2015, Oak Ridge National Laboratory, Oak Ridge, TN, USA [Online]. 2015. Available online: https://neutrons.ornl.gov/sites/default/files/High%20Flux%20Isotope%20Reactor%20User%20Guide%202.0.pdf (accessed on 19 September 2022).
- Rao, N.S.V.; Greulich, C.; Sen, S.; Dayman, K.J.; Hite, J.; Ray, W.; Hale, R.; Nicholson, A.D.; Johnson, J.; Hunley, R.D.; et al. Reactor power level estimation by fusing multi-modal sensor measurements. In Proceedings of the 2020 IEEE 23rd International Conference on Information Fusion (Fusion 2020), Rustenburg, South Africa, 6–9 July 2020; pp. 857–864. Available online: https://ieeexplore.ieee.org/stamp/stamp.jsp?tp=&arnumber=9190219 (accessed on 19 September 2022).
- Tsunekawa, S.; Kajikawa, Y.; Nohara, S.; Ariizumi, M.; Okada, A. Study on the perceptible level for infrasound. J. Sound Vib. 1987, 112, 15–22. [Google Scholar] [CrossRef]
- Broner, N. A Simple Criterion for Low Frequency Noise Emission Assessment. J. Low Freq. Noise Vib. Act. Control 2010, 29, 1–13. [Google Scholar] [CrossRef]
- Garcés, M.A.; Bowman, D.; Zeiler, C.; Christe, A.; Yoshiyama, T.; Williams, B.; Colet, M.; Takazawa, S.; Popenhagen, S. Skyfall: Signal Fusion from a Smartphone Falling from the Stratosphere. Signals 2022, 3, 209–234. [Google Scholar] [CrossRef]
- Welch, P.D. The use of fast Fourier transform for the estimation of power spectra: A method based on time averaging over short, modified periodograms. IEEE Trans. Audio Electroacoust. 1967, 15, 70–73. Available online: https://ieeexplore.ieee.org/stamp/stamp.jsp?tp=&arnumber=1161901 (accessed on 19 September 2022). [CrossRef] [Green Version]
- Salawu, O.S. Detection of structural damage through changes in frequency: A review. Eng. Struct. 1997, 19, 718–723. [Google Scholar] [CrossRef]


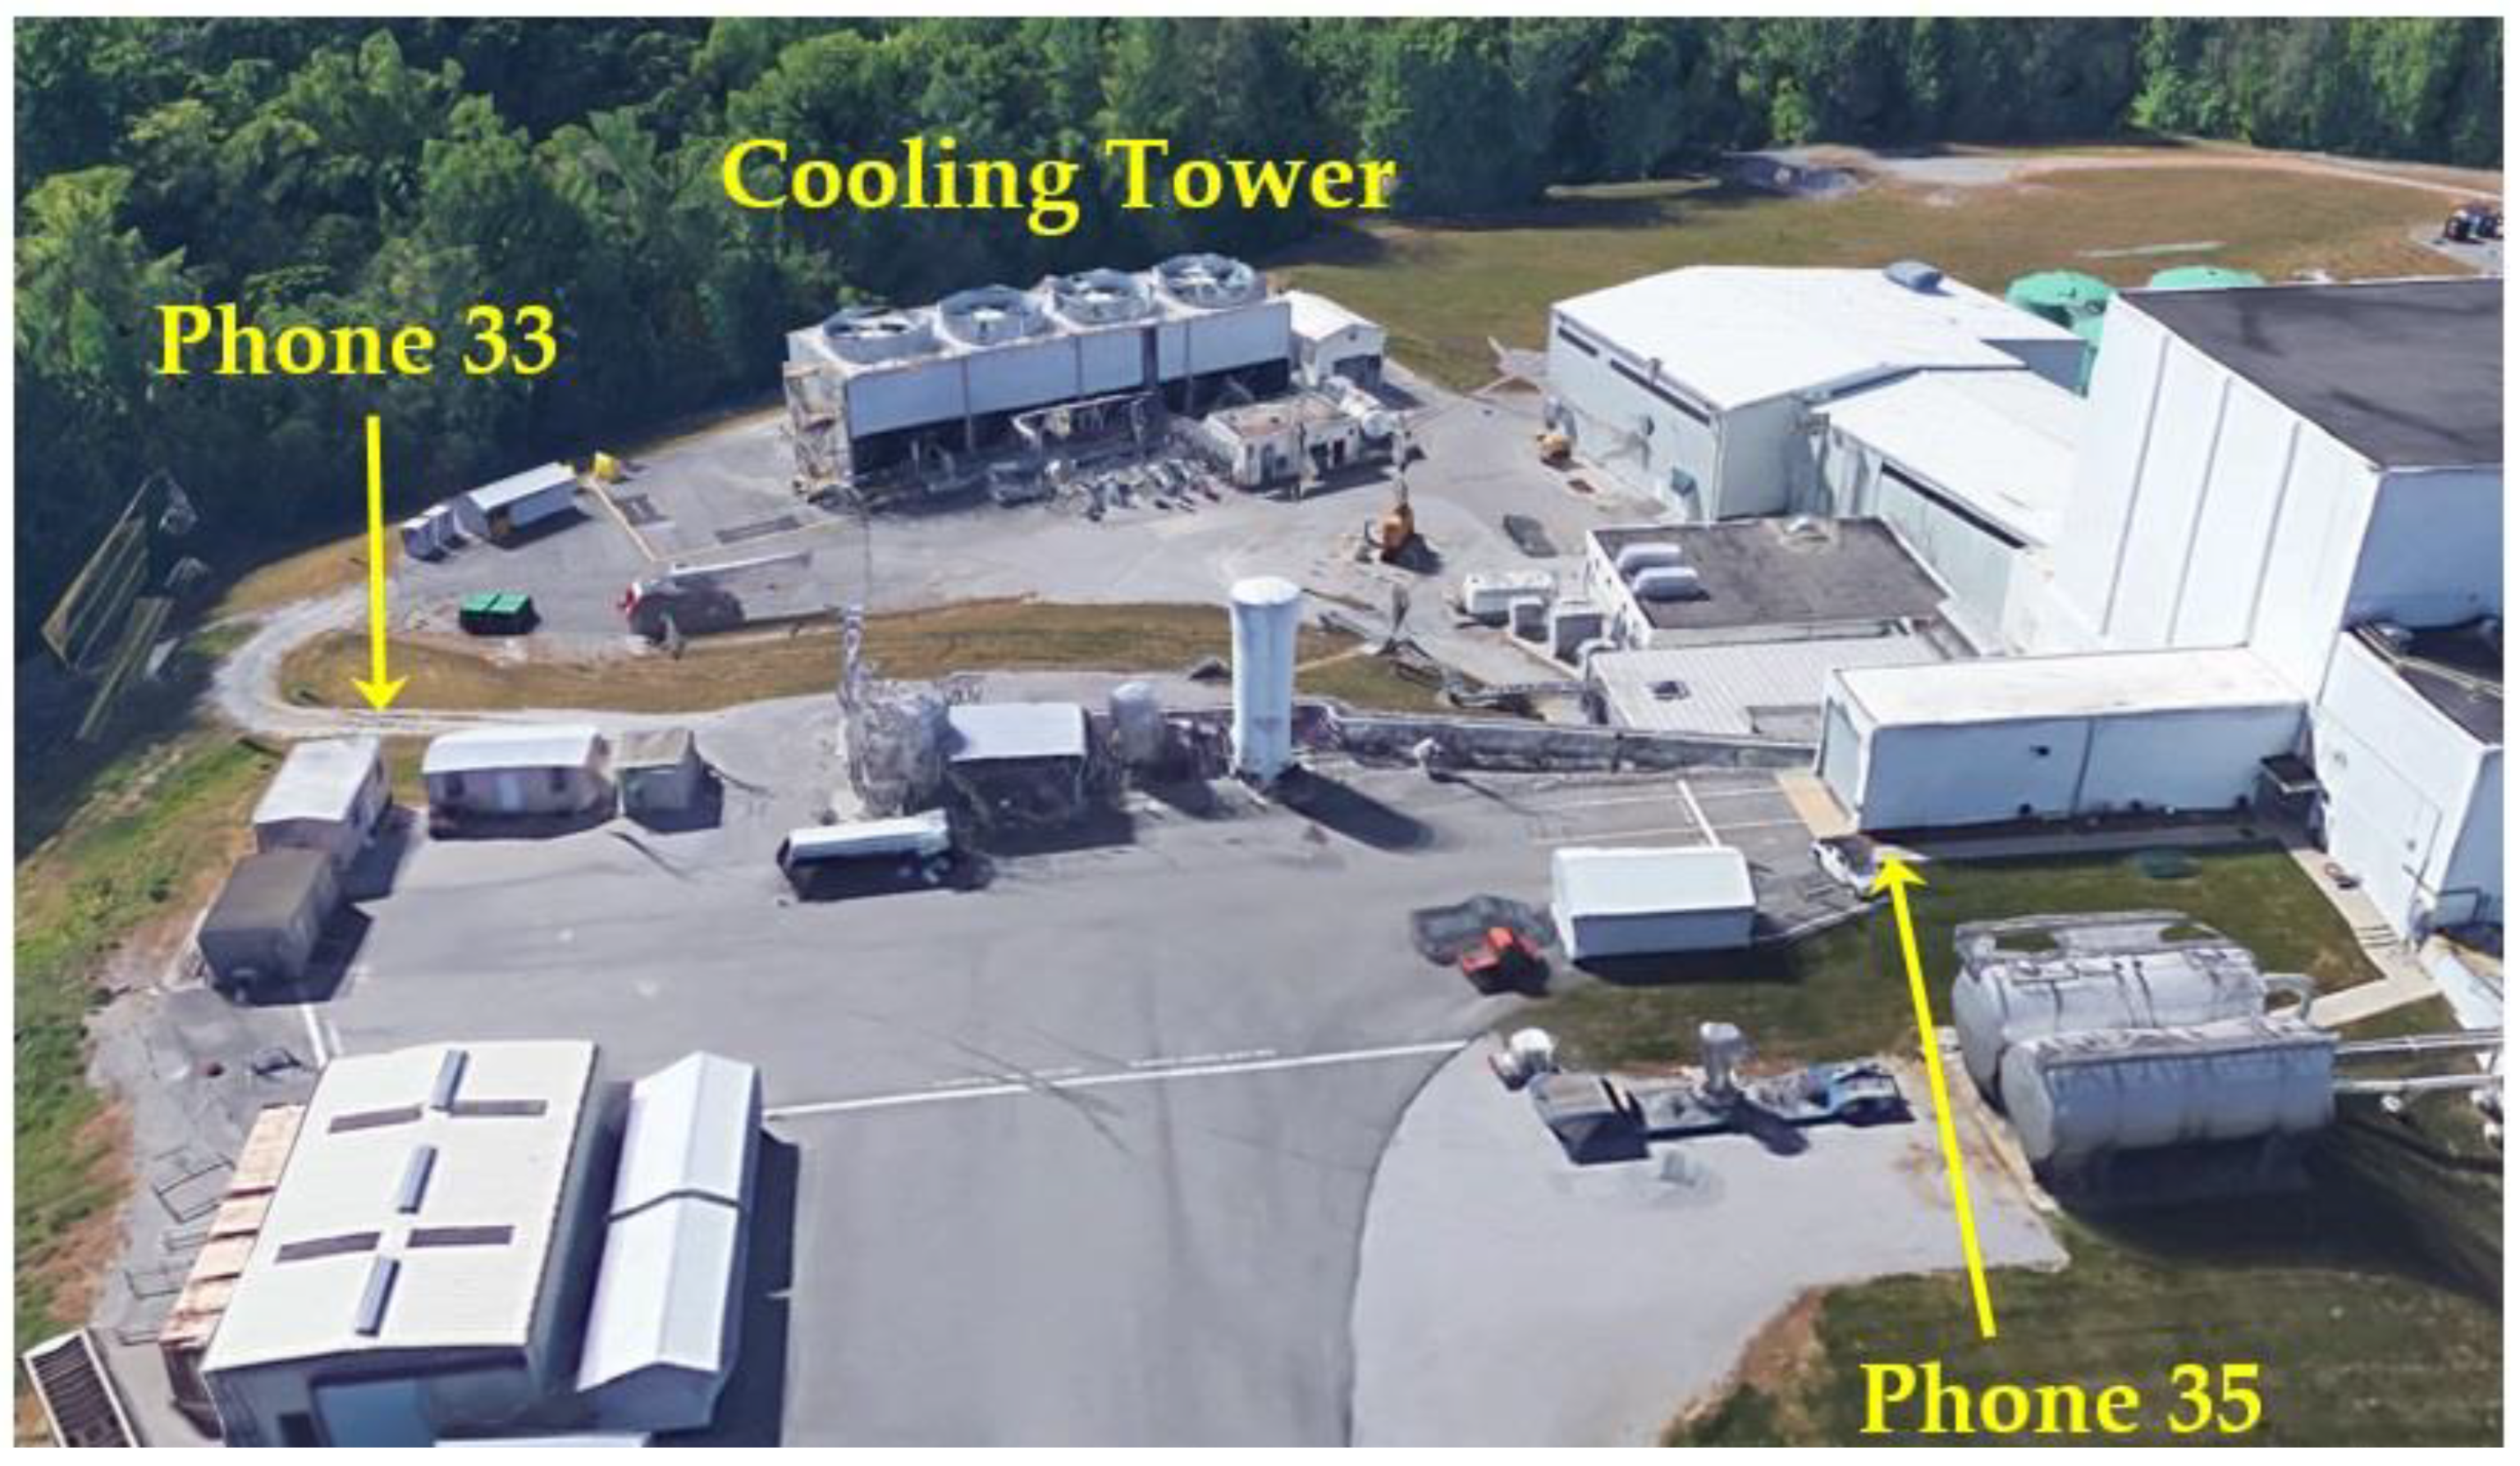
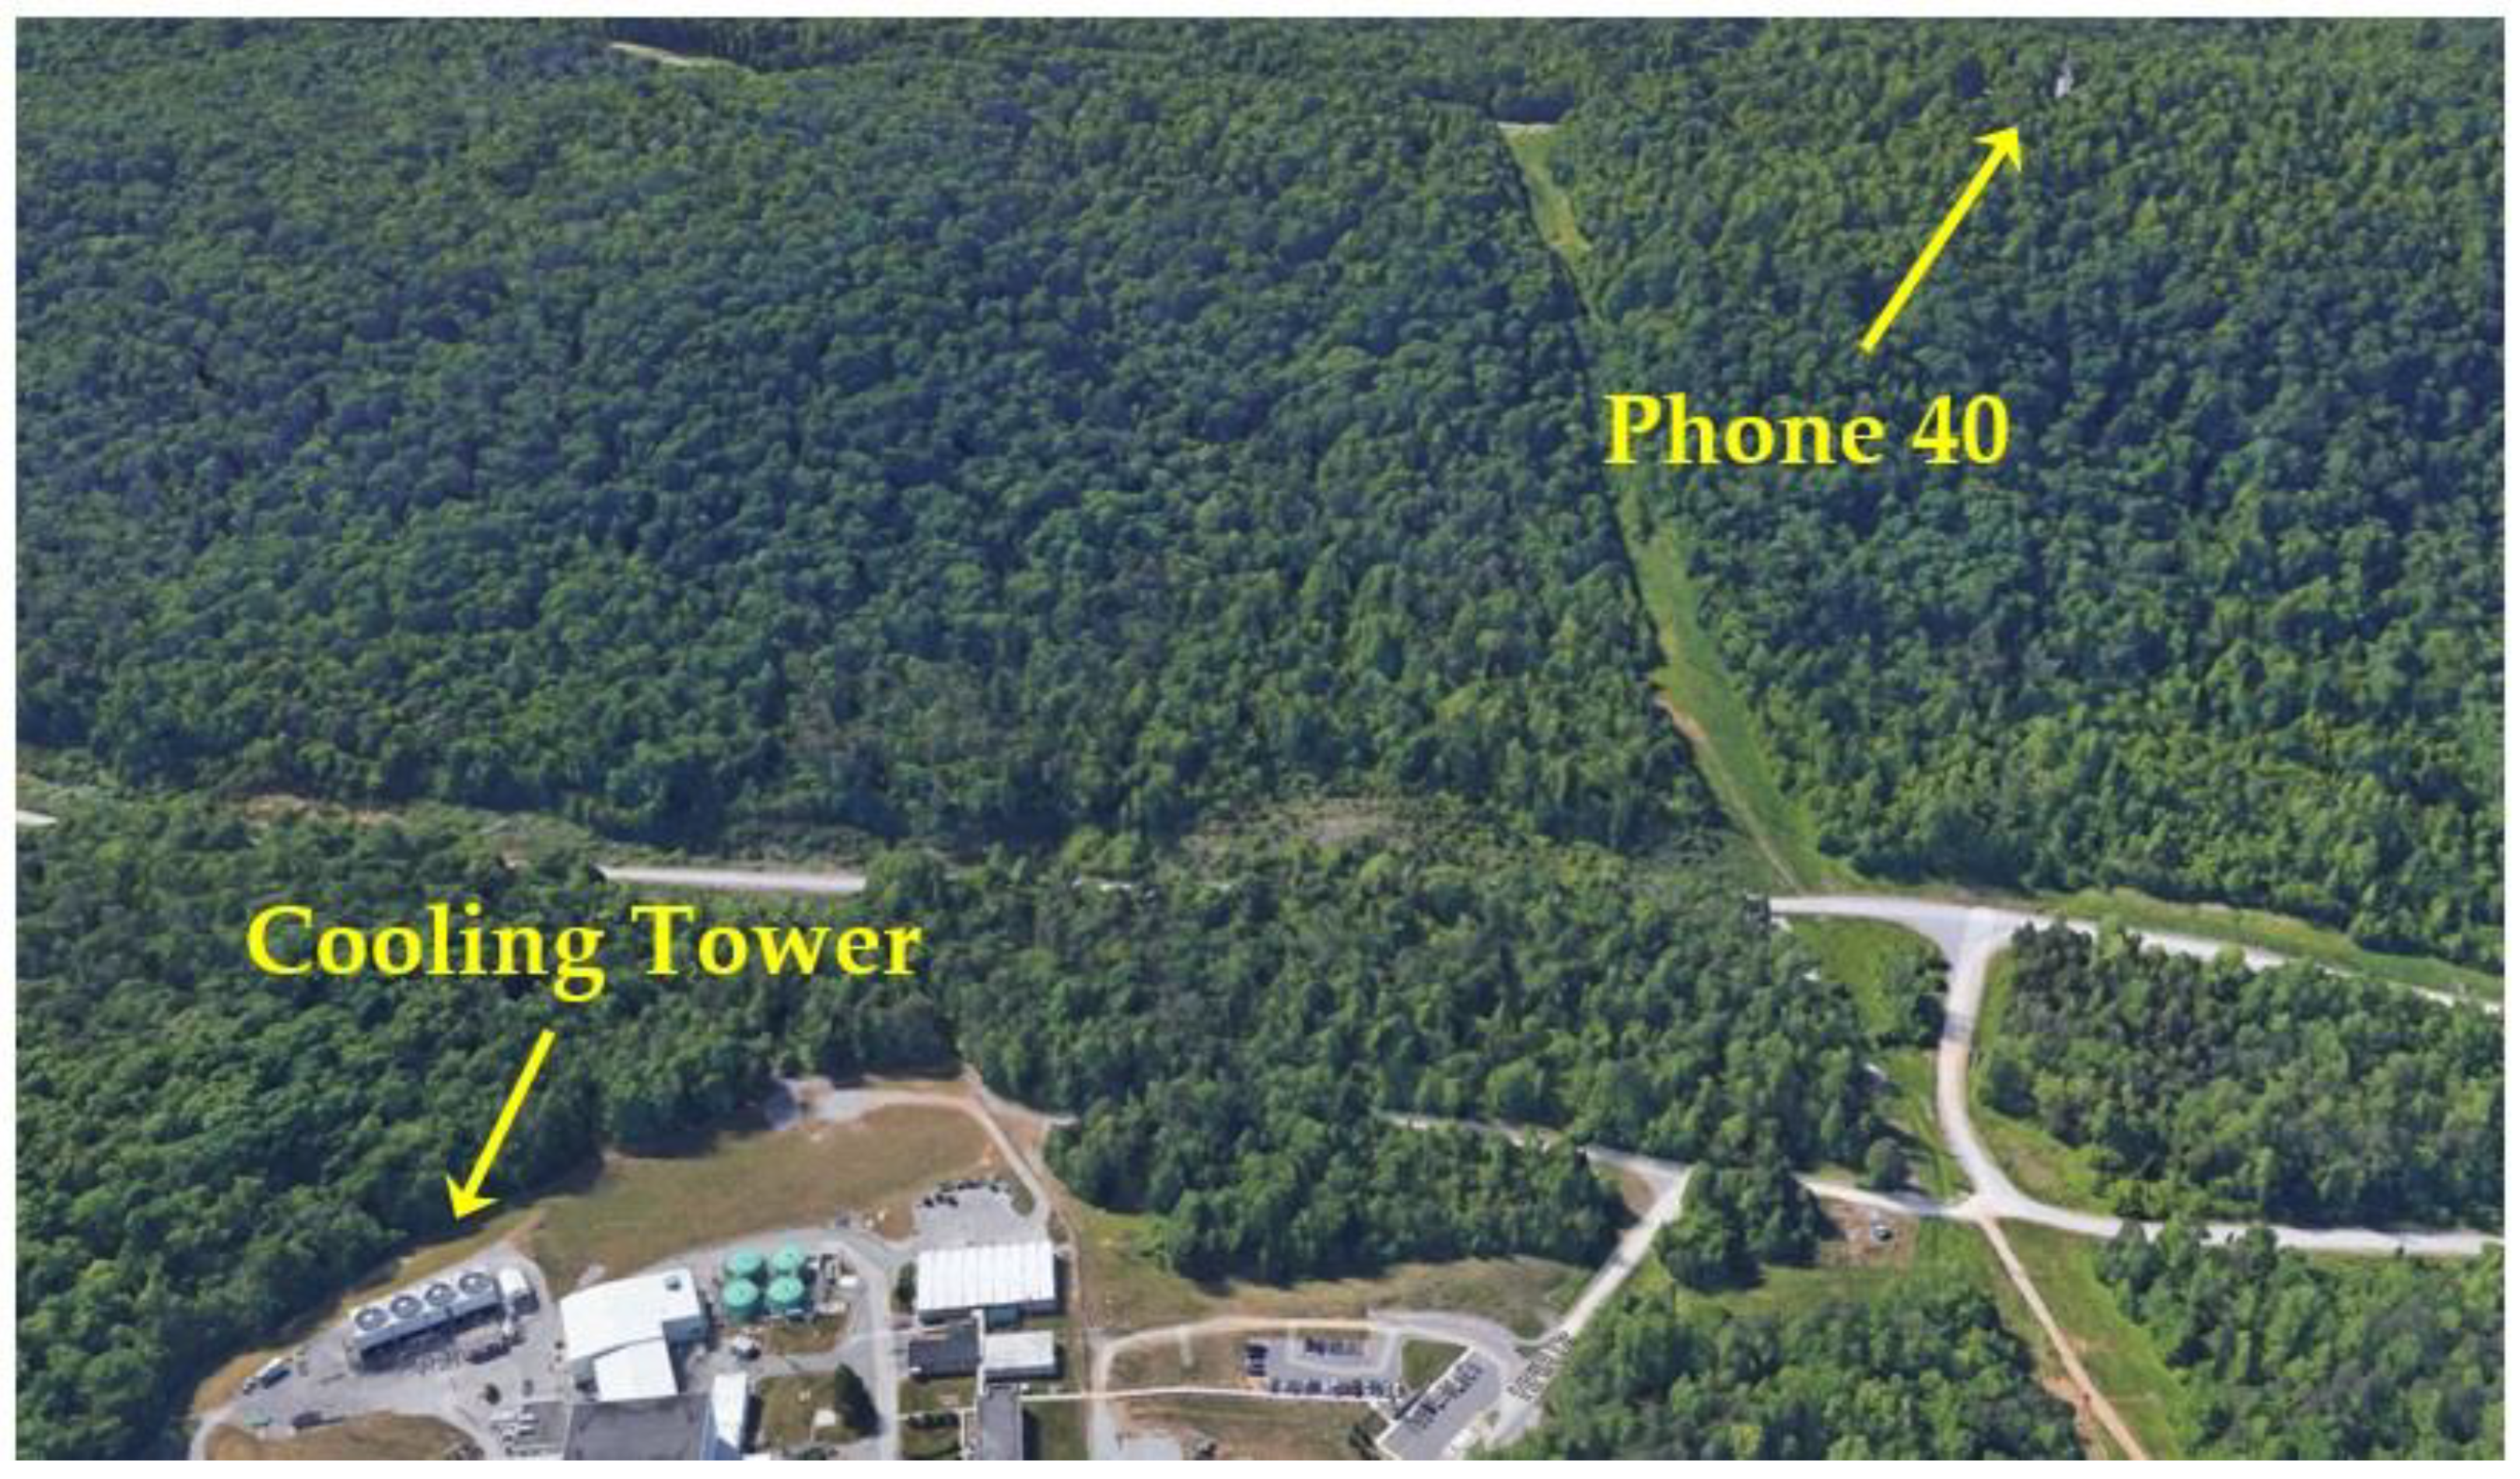
| Smartphone ID | Approx. Distance from Cooling Towers, HFIR Facility | Location Description |
|---|---|---|
| Phone 33 | 69 m, 100 m | 1 m above ground on bluff overlooking HFIR cooling towers |
| Phone 35 | 101 m, 34 m | 1 m above ground near truck airlock door at HFIR building |
| Phone 40 | 914 m, 900 m | 1.2 m above ground near communications tower on ridge overlooking HFIR |
| HFIR Cycle and Operation | Start Time (UTC) | End Time (UTC) |
|---|---|---|
| 487 start-up | 28 April 2020 11:19:00 | 28 April 2020 14:19:00 |
| 487 shutdown | 23 May 2020 15:02:00 | 23 May 2020 17:02:00 |
| 488-B start-up | 12 June 2020 11:17:00 | 12 June 2020 14:17:00 |
| 488-B shutdown | 7 July 2020 19:14:00 | 7 July 2020 21:14:00 |
| 489 start-up | 18 August 2020 13:15:00 | 18 Agust 2020 15:35:00 |
| 489 shutdown | 12 September 2020 21:32:00 | 12 September 2020 23:32:00 |
| 490 start-up | 2 March 2021 18:16:00 | 2 March 2021 21:46:00 |
| 490 shutdown | 27 March 2021 06:19:00 | 27 March 2021 08:19:00 |
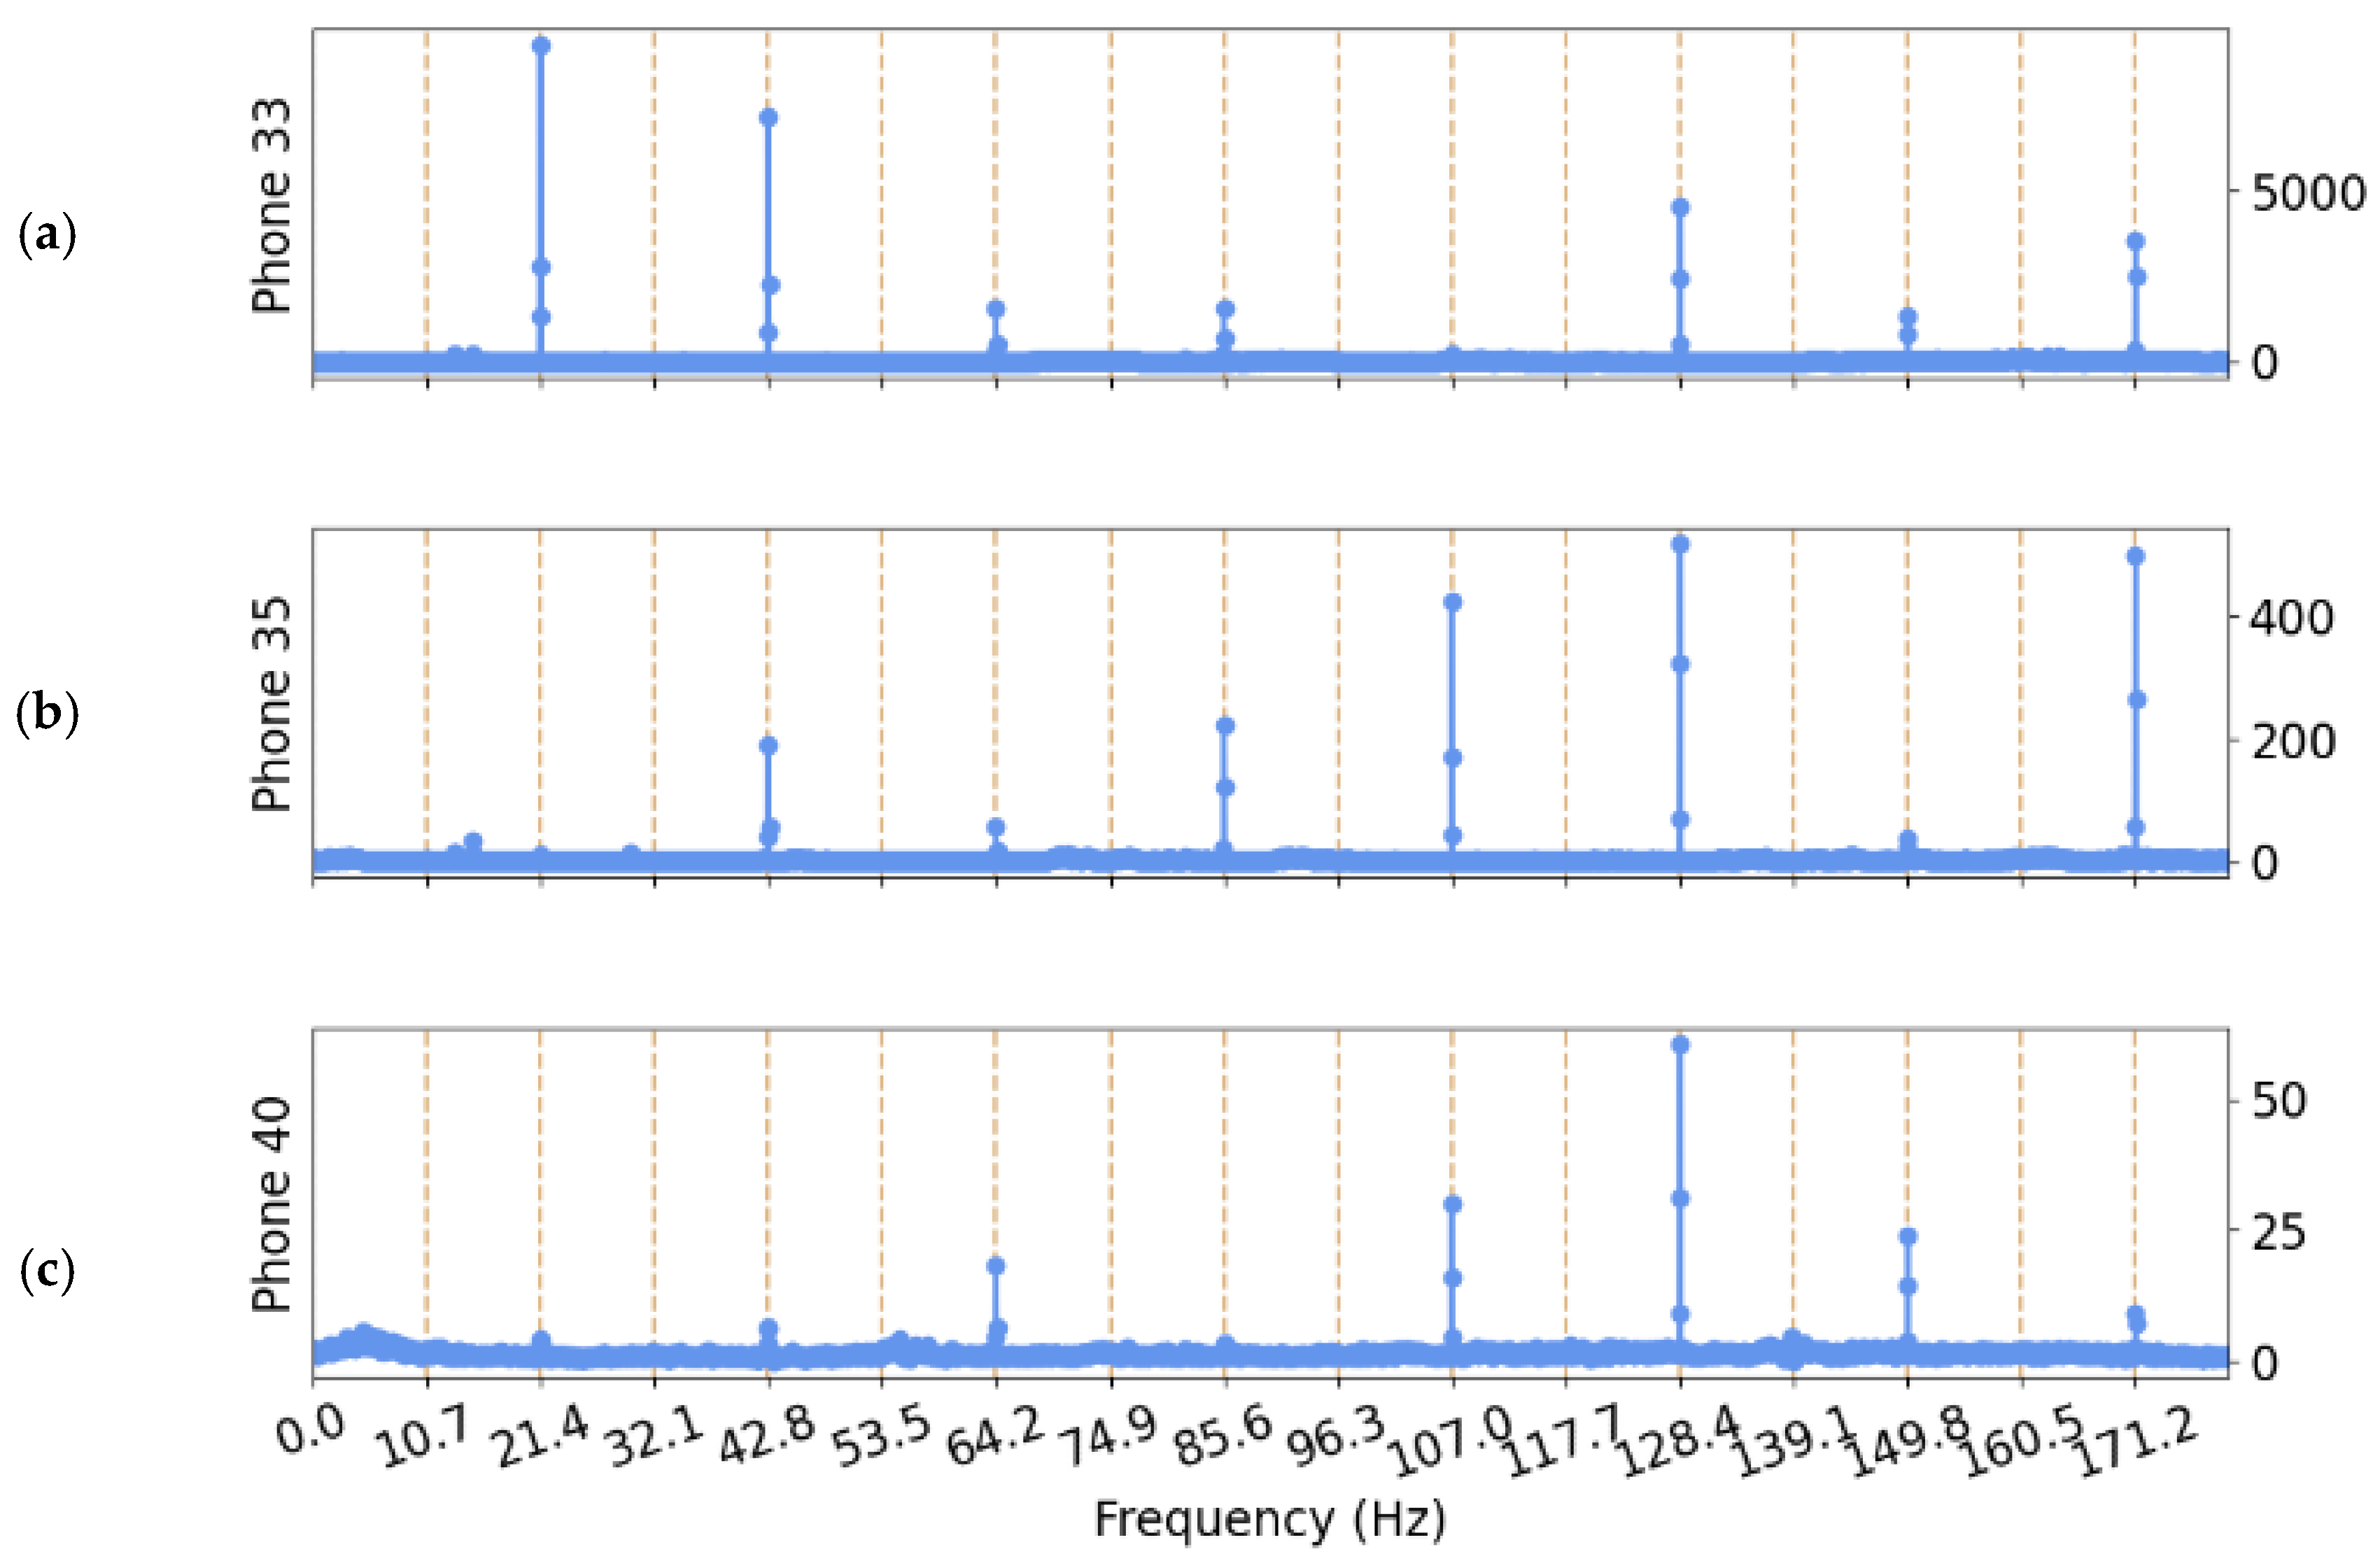
| Cycle | Center of Fundamental Frequency (Hz) |
|---|---|
| 487 start-up | 21.40 |
| 487 shutdown | 21.38 |
| 488-B start-up | 21.18 |
| 488-B shutdown | 21.40 |
| 489 start-up | 21.40 |
| 489 shutdown | 21.38 |
| 490 start-up | 21.15 |
| 490 shutdown | 21.14 |
Disclaimer/Publisher’s Note: The statements, opinions and data contained in all publications are solely those of the individual author(s) and contributor(s) and not of MDPI and/or the editor(s). MDPI and/or the editor(s) disclaim responsibility for any injury to people or property resulting from any ideas, methods, instructions or products referred to in the content. |
© 2023 by the authors. Licensee MDPI, Basel, Switzerland. This article is an open access article distributed under the terms and conditions of the Creative Commons Attribution (CC BY) license (https://creativecommons.org/licenses/by/4.0/).
Share and Cite
Cárdenas, E.S.; Takazawa, S.K.; Garcés, M.A.; Chichester, D.L.; Hunley, R.D.; Young, C.D. An Assessment of Persistent Acoustic Monitoring of a Nuclear Reactor during Full Power Generation. Acoustics 2023, 5, 429-443. https://doi.org/10.3390/acoustics5020025
Cárdenas ES, Takazawa SK, Garcés MA, Chichester DL, Hunley RD, Young CD. An Assessment of Persistent Acoustic Monitoring of a Nuclear Reactor during Full Power Generation. Acoustics. 2023; 5(2):429-443. https://doi.org/10.3390/acoustics5020025
Chicago/Turabian StyleCárdenas, Edna S., Samuel K. Takazawa, Milton A. Garcés, David L. Chichester, Riley D. Hunley, and Chris D. Young. 2023. "An Assessment of Persistent Acoustic Monitoring of a Nuclear Reactor during Full Power Generation" Acoustics 5, no. 2: 429-443. https://doi.org/10.3390/acoustics5020025