Article

Measuring the Acoustical Properties of the BBC Maida Vale Recording Studios for Virtual Reality

AudioLab, Department of Electronic Engineering, University of York, York YO10 5DD, UK
*
Author to whom correspondence should be addressed.
Acoustics 2022, 4(3), 783-799; https://doi.org/10.3390/acoustics4030047
Submission received: 30 June 2022 / Revised: 13 August 2022 / Accepted: 17 August 2022 / Published: 14 September 2022
(This article belongs to the Special Issue Acoustics, Soundscapes and Sounds as Intangible Heritage)

Abstract

:
In this paper we present a complete acoustic survey of the British Broadcasting Corporation Maida Vale recording studios. The paper outlines a fast room acoustic measurement framework for capture of spatial impulse response measurements for use in three or six degrees of freedom Virtual Reality rendering. Binaural recordings from a KEMAR dummy head as well as higher order Ambisonic spatial room impulse response measurements taken using a higher order Ambisonic microphone are presented. An acoustic comparison of the studios is discussed, highlighting remarkable similarities across three of the recording spaces despite significant differences in geometry. Finally, a database of the measurements, housing the raw impulse response captures as well as processed spatial room impulse responses is presented.

1. Introduction

There is an increasing motivation to replicate spaces for Virtual Reality (VR) with the rapid advancement of VR technologies and uptake in the use of the hardware in home situations. Especially for musical situations, the acoustic auralisation of the space needs to be as representative of the real space as possible. These can be created using simulated or measured Room Impulse Responses (RIRs), each technique having its limitations: simulated auralisations based on geometric models created in room acoustics simulation software such as ODEON have been shown to be inaccurate at certain room acoustic parameters [1,2], with perceptually noticeable impact on clarity compared to measured spaces [3]; recorded RIRs however, whilst more representative of the real space, are highly time- and resource-consuming [4]. Consequently, for the latter, fast and efficient workflows for capturing detailed room acoustics for use in VR rendering are necessary. Having efficient frameworks and processes to conduct complete acoustic surveys of recording studios is also important for the posterity of these spaces. It has implications for broadcasting companies worldwide, as they are provided with the opportunity to illustrate their unique and often iconic acoustics as well as connect people virtually within them. This paper presents the acoustic measurement and comparison of four studio spaces at the British Broadcasting Corporation (BBC) Maida Vale studios through RIR capture tailored for use in VR applications. The work was conducted as part of a collaboration between the AudioLab at the University of York and the BBC Research and Development Audio Team.

2. BBC Maida Vale Recording Studios

2.1. History

Originally a Roller skating palace built in 1909, the BBC took over the building on London’s Delaware Road in 1934 to be home of the BBC Symphony Orchestra and created the now iconic Maida Vale studios. During the Second World War it became the standby centre of the radio news service and as a result was targeted and bombed during the blitz, after which it was extensively restored [5]. The building houses seven sound studios, of which four have been measured for this paper. The studios are labelled throughout the paper as they are named by the BBC: by number following the initials MV to represent Maida Vale.
MV2, shown in Figure 1a, is a large rectangular space described as having ‘a lively sound that suits chamber music and piano sessions better than pop music’ [6] and, although no longer used frequently for recording, remains home to the BBC Singers. MV3, shown in Figure 1b, is a similar size to MV2 and used for Radio 1 sessions with a live audience. It was home to the BBC Radio Orchestra and was the last place Bing Crosby recorded in 1977, three days before his death. MV4, which was home of the famous John Peel Live Lounge sessions, is shown in Figure 1c, and from 1967 it hosted sessions by artists from the Beatles to David Bowie, Nirvana and Adele. It is a smaller space with an isolated vocal booth and small balcony. This studio continues to be used by BBC Radio 1 alongside MV5, which is shown in Figure 1d, and which has the smallest, wood-paneled live room.
The importance of BBC Maida Vale Studios as a heritage space is undisputed, with its claim ‘to have recorded more famous artists than any other’ British studio [6]. It is therefore timely to conduct the acoustic measurements of studios within this iconic space, both for acoustical heritage, and to also provide opportunities to exploit the latest technologies to allow future musicians to be a part of its musical history in VR.

2.2. Studio Dimensions and Characteristics

MV2 and MV3’s live rooms (Figure 1a,b and Figure 5) have very similar dimensions; considering all walls to be flat surfaces, MV2’s dimensions would be 13.69 m × 21.96 m and MV3’s 13.38 m × 22.69 m. Despite this, the construction of both spaces and the materials used are quite contrasting. MV2 features ‘zig-zagged’ wooden walls that extend up to 0.5 m into the room and a hard wooden floor. Although there are not any absorbers or diffusers as such in the space, the design of the walls (and the ceiling) causes them to act as geometric diffusers. Given the materials that they are made from, this leads to MV2 being a very reflective space. In contrast to this, MV3 has a much more controlled reverberation time; its walls are mainly constructed using absorptive panelling and preserve the rectangular shape of the room. Large curtains are also hung from walls and add to the absorption in the space. The ceiling features acoustic panelling placed at different heights; this will therefore cause both absorption and diffusion. This studio also features a wooden floor, although a significant portion of this has a carpet placed over the top. This is used in recording sessions in the space; hence, it was not removed for the acoustic measurements. Both studios featured a significant amount of studio equipment, freestanding acoustic baffles and chairs that were present when measurements were taken. In both cases this was all moved to one side of the space.
The live room for MV4 (See Figure 1c and Figure 6) consists of the main downstairs area, a glass vocal booth and a mezzanine level. The downstairs area is based around a rectangle of dimensions 8.50 m × 11.04 m with false walls being used to produce a less regular shape; there is also an additional wall present beneath the mezzanine level that divides that section of the space roughly in half. This wall contains three panel windows. The mezzanine level itself sits 2.69 m above the ground level. Both the ground floor and mezzanine level are carpeted and the walls and ceilings of the space are generally made up of acoustic panelling and wooden diffusers. The same wooden diffusers are used throughout the entire space. It is also worth noting that the space features a stepped ceiling. When the acoustic measurements were taken for this space, two freestanding acoustic baffles were present downstairs and there were three sofas, four chairs and four tables on the mezzanine level.
MV5’s live room (Figure 1d and Figure 7) features two ‘chambers’ (one larger and one smaller) joined along a single line. This room contains no parallel surfaces, however it can be entirely encompassed by a rectangle of dimensions 6.89 m × 6.70 m. The room itself is made up of 12 walls, 11 of which are made from wood and the 12th from acoustic panelling with thin glass panels. The studio’s floor is carpeted, and its ceiling made from acoustic panels. A single sofa and piano were present in the space during the recording of the acoustic measurements. The piano was covered with heavy fabric to prevent interference with the measurements.

3. Acoustic Measurements

3.1. Impulse Response Capture

Impulse response capture requires an excitation signal to be played into the acoustic space, recorded back into a digital audio workstation (or equivalent recording device) and then subsequently run through a deconvolution routine to extract the final impulse response. The nature of the source signal is important and many approaches have been discussed in the literature, ranging from Maximum Length Sweeps [7] or Golay Codes [8] to non-signal processing methods of room excitation such as starter pistols, baloon pops or firecrackers [9]. However, for most acoustic measurements, the Exponential Sine Sweep (ESS) method has proven superior, due to the fact that any non-linearities in the reproduction system can be removed from the final impulse response as well as the logarithmic nature of the sweep ensuring more energy is catered for in the lower end of the spectrum than in linear sweeps, which correlates better with the human auditory response [10].
As Maida Vale is a practicing and busy recording environment, only 4 days total were allocated to the measurement of studio acoustics. Thus, in order to capture comprehensive data, a fast measurement protocol was required that facilitated detailed capture of measurement grids within the studios. A desirable feature of the framework was to facilitate varied source directivity of the sources in post-processing, and is discussed further in Section 5.2. This required each measurement point to be undertaken four times, with the loudspeaker oriented in the North, East, South and West directions each time. It was therefore quite apparent that singular impulse response measurements would take far too long, and would not give the spatial resolution required for 6 Degrees of Freedom (DoF) VR capability. MV4, for example, had a total of 45 specific receiver points and 7 source points, times 4 directions, yielding a minimum of 1260 individual measurements. Prior estimates of the reverberation time of the room were approximately 0.3 s, meaning that at least 3 s sweeps would ideally be used [11]. However, the existence of low-level background noise from air conditioning meant that sweep lengths greater than 3 s were required to maximise signal to noise ratio; hence, 20 s was chosen as a desired sweep length. Considering also a minimum interval time of 20 s between measurements to reconfigure the sources and receivers, this would result in over 64 h of pure measurement time with no breaks or room for errors.
Consequently, an overlapped sweep framework was implemented, which has seen recent success in binaural measurement procedures [12,13]. In this process, multiple sources are excited in each measurement pass, with each source emitting an ESS with a short interval δ i n t between each consequent activated sweep as shown in Figure 2. When the resultant recording is deconvolved, the impulse responses line up one after the other at a time equal to δ i n t . For this, δ i n t must be at least greater than the reverberation time of the room or else the tail from one RIR measurement will run into the direct sound of the consecutive one. Furthermore, if the loudspeakers are overdriven into harmonic distortion, then the harmonic distortion products will manifest as a series of impulse responses before the direct sound of each of the RIRs. Consequently, δ i n t must therefore be big enough to ensure that any harmonic distortion products from each impulse response do not manifest in the reverberation tail of the preceding impulse response.

3.2. Methodology and Instrumentation

The capture of each room consisted of two main measurement phases—measurements for virtual-reality representation of the acoustics, as well as ISO-3382-based reference measurements [14].
The primary goal for VR capture was to facilitate virtual studio representation of the spaces from the performer perspective where movement around the space is typically not necessary (3DoF) and from the audience perspective, with ability to move about the space (6DoF). For example, one VR permutation utilising 3DoF is the case of networked music interactions, where a performer could ‘dial in’ to a virtual version of the studio and occupy one of the pre-defined performer positions, whilst hearing other members of their ensemble with the correct acoustic perception as if they were all together in the real space. Or, with a 6DoF setup, an audience member could move through the VR space through interpolation of the impulse responses across the defined audience area.
ISO-3382 measurements of each space allow for comparison of the acoustics of the studios to assess their similarity and appropriateness for the musical genres recorded there. Typical performer positions were captured that reflected how each studio is commonly used.
A summary of the measurement process for each room is shown in Figure 3. In general, measurement positions are first defined using architectural plans or geometric measurements. The excitation stimulus is then prepared offline ready for playback to the loudspeakers. The source and receiver points are then physically marked up in the space and any environmental noises that can be eliminated are checked. Loudspeakers and microphones are then calibrated and the measurement routine begins. Once all measurement points have been collected, data post-processing can be implemented.
Table 1 summarises the instrumentation used for each measurement phase. For VR measurements, Genelec 8040A loudspeakers were used to represent typical source positions. These loudspeakers have a frequency response of 45 Hz to 20 kHz. An MH-Acoustics Eigenmike, which is a higher order Ambisonic microphone (up to fourth order) and reference omnidirectional microphone (AKG CK-77, mounted on top of the Eigenmike) were used for measurements that would later facilitate 3DOF and 6DOF rendering in VR. A KEMAR binaural manikin also facilitated reference measurements at the performer positions, so as to later compare true binaural room impulse responses to Ambisonically derived binaural room impulse responses from a binaural-based Ambisonic decode [15], as is regularly used in virtual reality applications [16].
For ISO-3382 measurements, the source was changed to an NTI DS3 dodecahedron loudspeaker. Both the Eigenmike and the KEMAR manikin were used as receivers for these measurements.
All measurements were recorded on a Macbook Pro running the Digital Audio Workstation (DAW) Reaper v6.12 for recording and simultaneous playback of the sweeps. The KEMAR and AKG microphones were connected to an RME Fireface UFX interface which has digitally controlled preamplifiers. All loudspeakers were also driven from this interface. The Eigenmike was recorded via its own proprietary TCAT interface and clocked to the Fireface via ADAT. The Macbook Pro aggregated the Eigenmike and Fireface interfaces to one virtual soundcard for recording in Reaper.

3.3. Practical Measurement

Prior to measurement, the architectural plans to the studios were obtained and measurement points were defined for each studio. Setup on the day required marking out the grids of points, which was implemented using a crosshair laser guide on initial string placement and laser distance measures as shown in Figure 4. Once the grid was defined, sources were set in place. Genelec 8040 loudspeakers were calibrated to each other at 85 dBC pink noise at 1 m. The sweeps were played out from Reaper at −20 dBFS.
Playback levels were then adjusted to ensure maximum signal level without any audible harmonic distortion occuring as a result of the sweeps, in particular from the low-end response. Microphone gain for all microphones was set to ensure no clipping for the closest source reciever points, which, for the Eigenmike, occurs when it is located above the loudspeakers.
Each measurement set was preceeded by a synthesised vocal idenfifier documenting the upcoming measurement for the benefit of the recordings. After this, the overlap sweeps played out, each with 20 s duration with 2 s intervals. Sweep frequency range was from 20 Hz to 20 kHz. Then, 3 s after the last sweep ends, another voice identifier occurs, indicating the next source–receiver combination. The measurement team then had 20 s to reconfigure the source and receivers to their new orientations before the next new measurement voice identifier. For more complex source–receiver reconfiguring, the recording was paused.
The highest density of measurements was captured in MV4 because it is regularly used for BBC ‘Live Lounge’ sessions, co-existing during productions as a recording studio and live performance space. Focus on this studio was also particularly important as it was decided to create a full Virtual Reality model of this space for networked music performance experiments [17]. MV2 and MV3 are larger spaces and comparable in size. Thus, the measurement grids were less dense than in MV4 in order to capture the spaces completely within the allocated time. Finally MV5 has the smallest live room, and therefore had the smallest concentration of measurements. Measurements for each room are now discussed in detail:
Figure 4. Markup for measurement session in MV4 live room. The image depicts the markup of the main PA grid.
Acoustics 04 00047 g004

3.3.1. MV2 and MV3 Measurement Phases
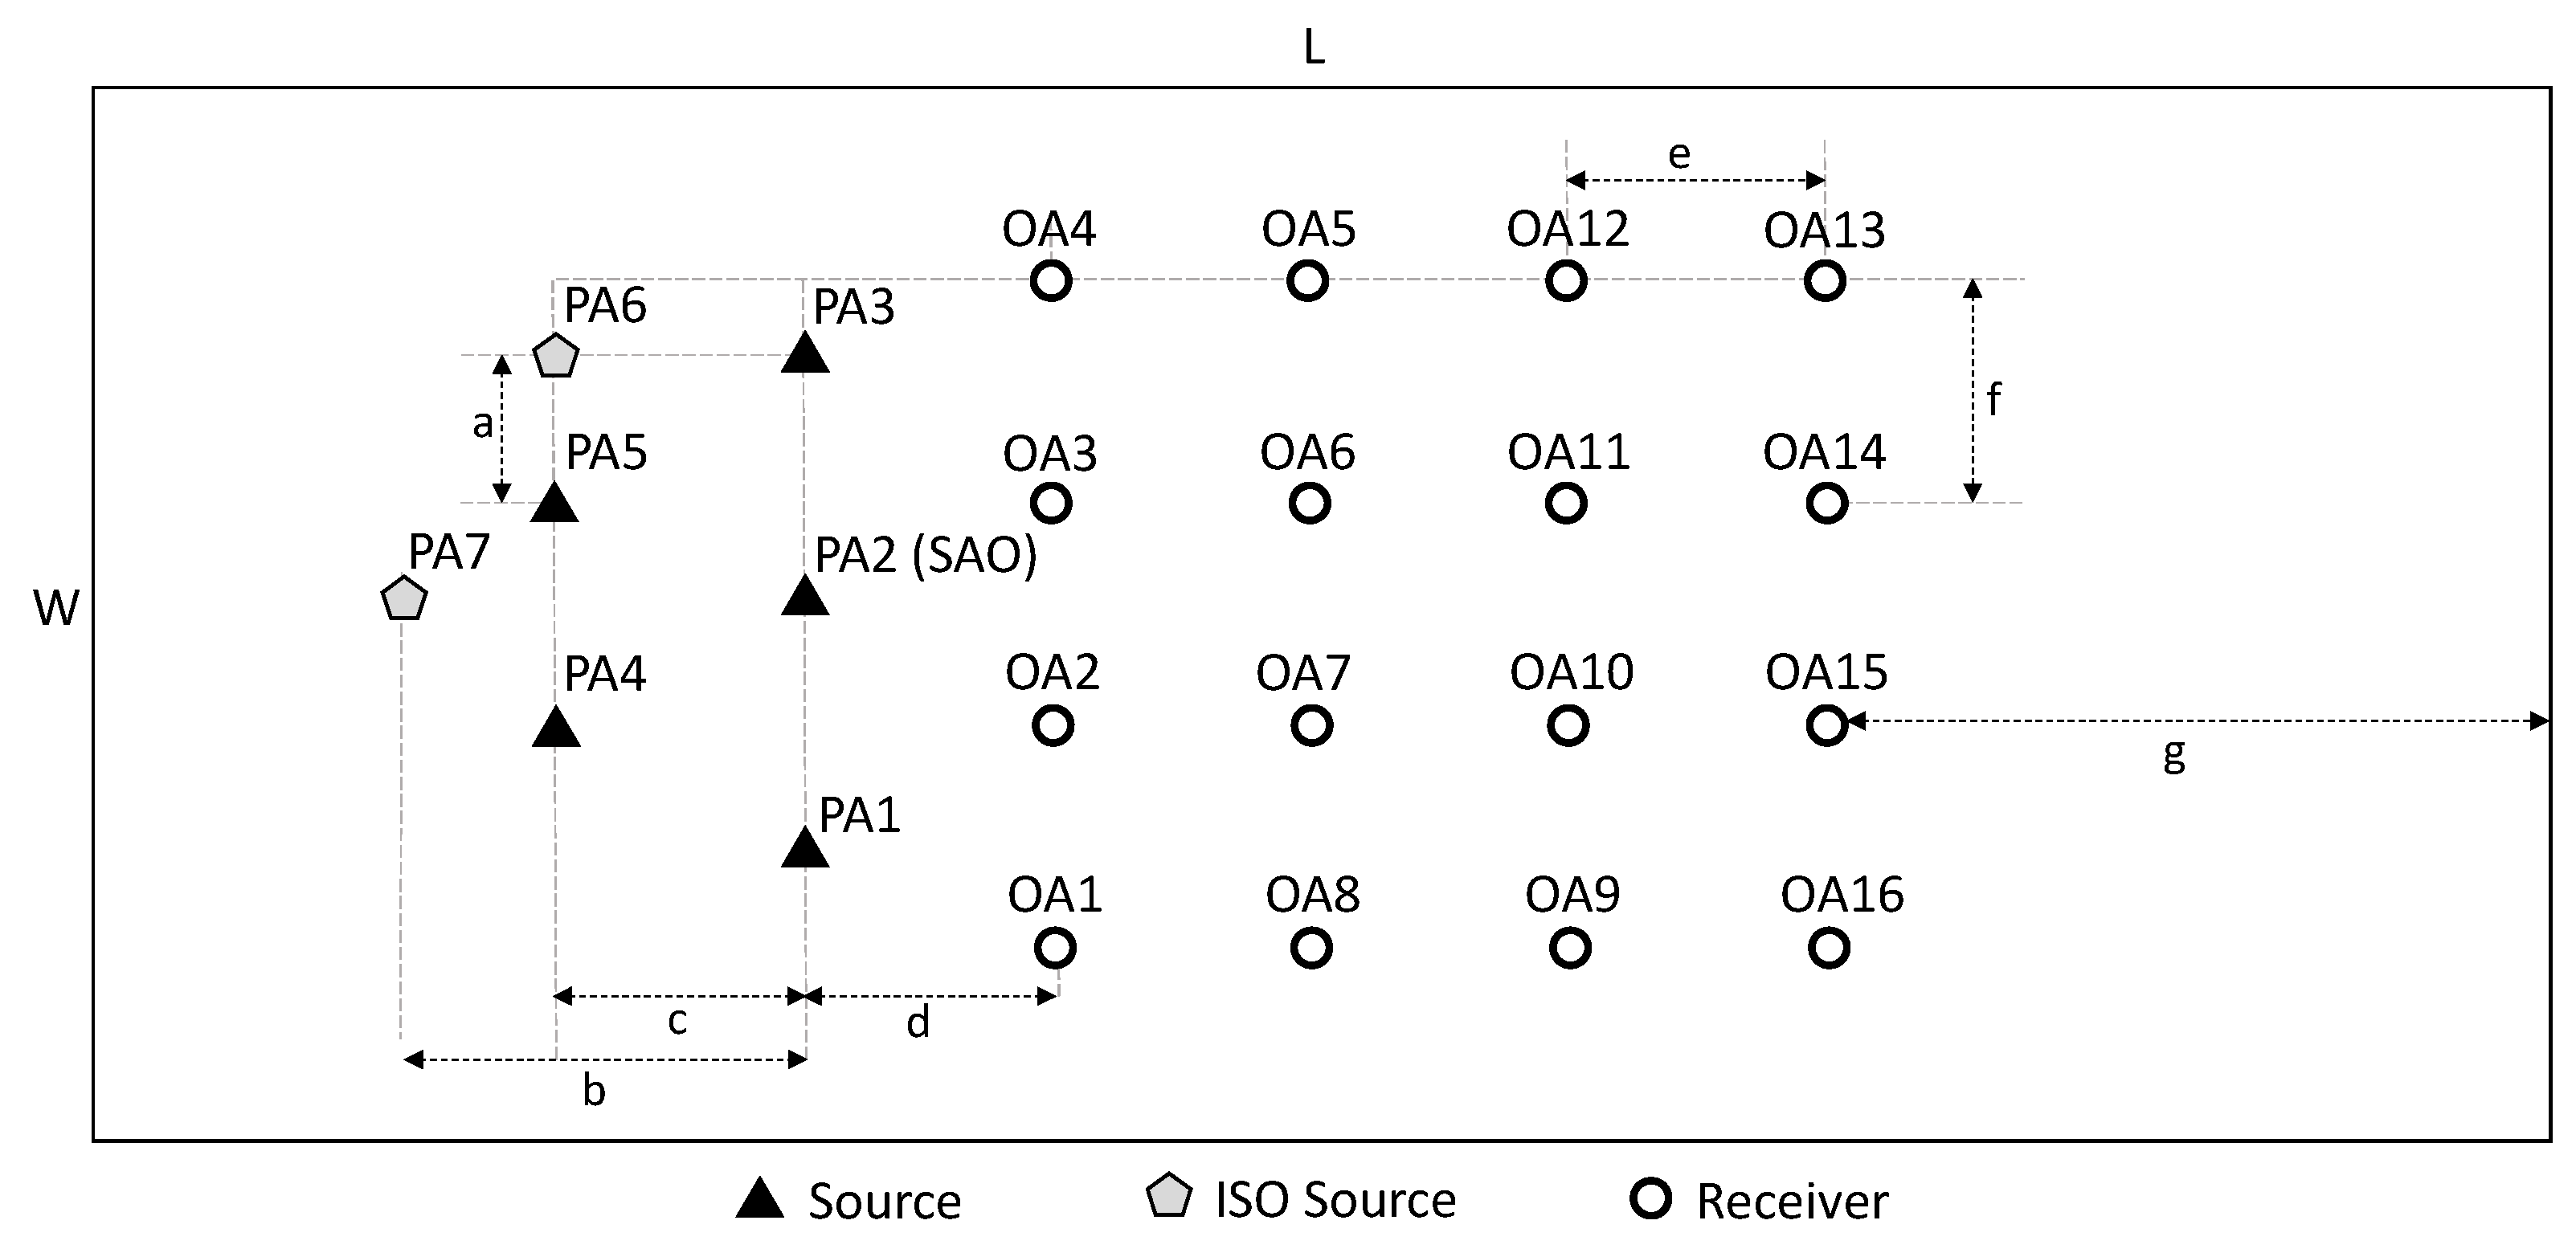
The measurement configuration for MV2 and MV3 is shown in Figure 5. Fully defined Cartesian coordinates for all points in the studios are presented as part of the online database.
  • MV2/MV3 Virtual Reality Capture:
    5 Genelec 8040a sources, representing sources at typical recording positions were set up on a stage area, at points labelled PA1 to PA5 (PA stands for Performance Area), all at 1.5 m height to tweeter. A grid of 16 receiver points, labelled OA1-16 (OA stands for Outside performance Area) were set up, each 3 m apart. The Eigenmike and reference omninidirectional microphone were measured at each of these points at a height of 1.7 m. Both were north facing. No sitting audience positions were captured in the studios due to time constraints.
  • MV2/MV3 ISO-3382 Capture:
    Referring to Figure 5, an additional two source points at PA6 and PA7 were set for the ISO measurements. Receiver locations for the these measurements were at OA1, OA6 and OA14. The Eigenmike, reference lav and a KEMAR binaural manikin were measured at these positions. The Eigenmike was at 1.7 m height and KEMAR was set to 1.5 m height to the ear canal, which is in range for the typical heights of UK men (175 cm) and women (161 cm) [18] with consideration of ear canal offset. Both were north-facing.
    For MV2, points OA13 to OA16 were 3.29 m from the back wall (distance g). The grid spacing was 2.5 m (distances c, d, e and f). Line PA1–PA3 was 2 m from line PA4–PA6 (distance c). Dodecahedron point PA7 was 4 m from PA2 (distance b). Dodecahedron point PA6 was 1.25 m from PA5 (distance a). Width (W) is 13.69 m and length (L) is 21.96 m.
    For MV3, the line of points OA13 to OA16 were 4.3 m from the back wall (distance g). Grid spacing was 1.5 m between points (distances c, d, e and f).Dodecahedron point PA7 was 3 m from PA2 (distance b). Dodecahedron point PA6 was 0.75 m from PA5 (distance a). Width (W) is 13.38 m and length (L) is 22.69 m.

3.3.2. MV4 Measurement Phase

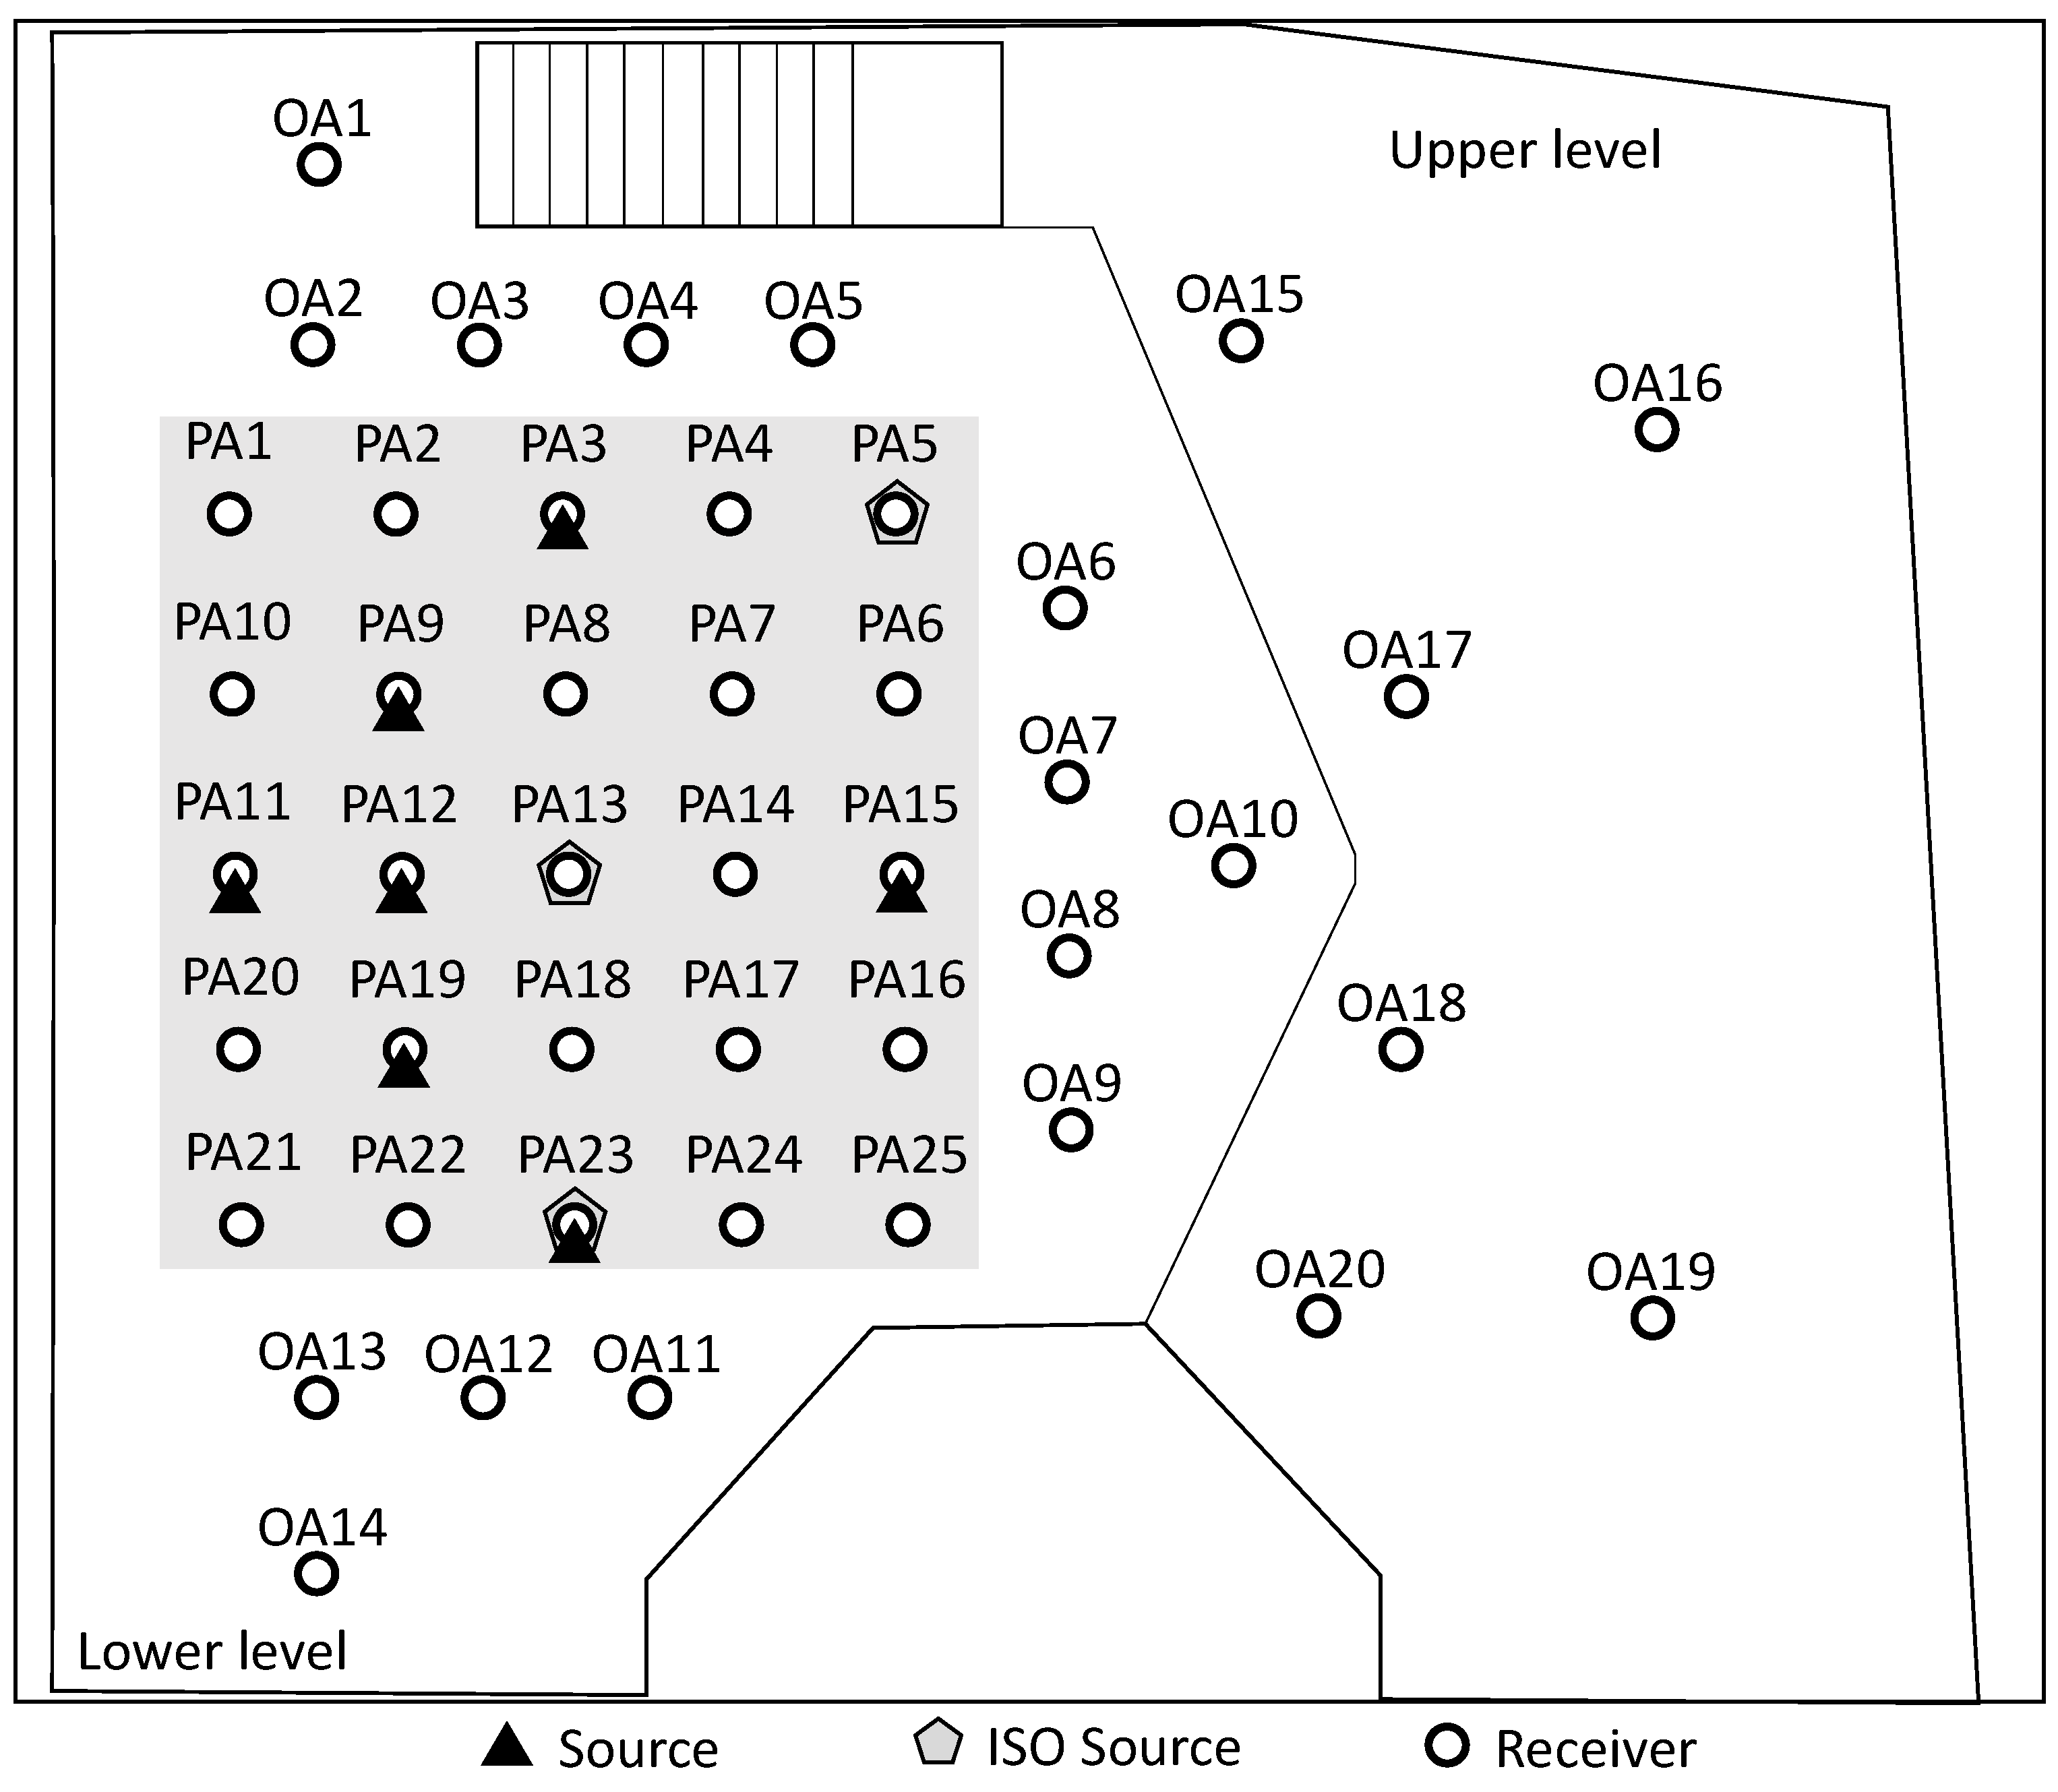
  • MV4 Virtual Reality Capture: This was the largest measurement phase of all studios. Four performer positions were defined, with three sources representing performers at 1.5 m height and a fourth position representing a drum kit. These positions are labelled PA3, PA11, PA15 and PA23 as shown in Figure 6. The drummer position consists of 4 sources, representing a triangular spread of drums and a kick drum at point PA9, PA11, PA19 and PA12 respectively. The triangular configuration covering the drum area allows for IR interpolation to be undertaken to more clearly define drum source positions for any given virtual drum kit.
    Figure 6. Source and receiver points for Studio MV4.
    Figure 6. Source and receiver points for Studio MV4.
    Acoustics 04 00047 g006
    Impulse responses using the Eigenmike were captured at each performer position, including simultaneous source–receiver points. This was to facilitate foldback of a musician’s own acoustic within the virtual space, i.e., when they perform, they should hear back the room response to their own performance at their performance position. Consequently, for these measurements, the Eigenmike was placed 2 cm above the Genelecs. Care was taken to ensure that the signal did not distort. However a noticeable low frequency boost was captured due to the off-axis (on top) position of the Eigenmike relative to the loudspeaker and the proximity of the transducers. This effect was removed in post-processing.
    For 6DoF-enabled measurements, the receiver area was extended in between the performers to a grid of 25 measurement points, equally spaced 1 m apart. An additional 20 measurement points were captured outside of the performance area (OA points) to facilitate audience perspective. These include points on the main studio floor as well as on the upper balcony. All receiver points are at a height of 1.5 m, with the exception of PA11 (drummer position), which is at a height of 1.2 m. Full coordinates of each datapoint are available in the online database.
  • MV4 ISO-3382 measurements: The NTI dodecahedron loudspeaker was again used for measurements at points PA5, PA13 and PA23. Three receiver positions on the lower level (OA2, OA7 and OA13) and three positions on the upper level (OA15, OA16 and OA20) were utilised. Both the Eigenmike and KEMAR were again used to capture the ISO measurements and were both north-facing, with heights of 1.6 m. The dodecahedron was at a height of 1.5 m.
  • MV4 Performer Reference Positions: The KEMAR binaural head utilised in these sessions also includes a voice box (model GRAS 45BC). Measurements were taken by running an equalised sweep through the voice box and capturing the returning room acoustic at the manikin’s ears. Equalisation for this sweep was performed in the anechoic chamber at the University of York [19]. This gives an excellent reference for understanding the self-direct-to-reverberant ratio as experienced at each performer position. It also provides a calibration level for performer-direct sound-to-reverberation auralisation in the virtual environment. The four performer positions were measured for this setup. KEMAR faced PA13 in each measurement.

3.3.3. MV5 Measurement Phase

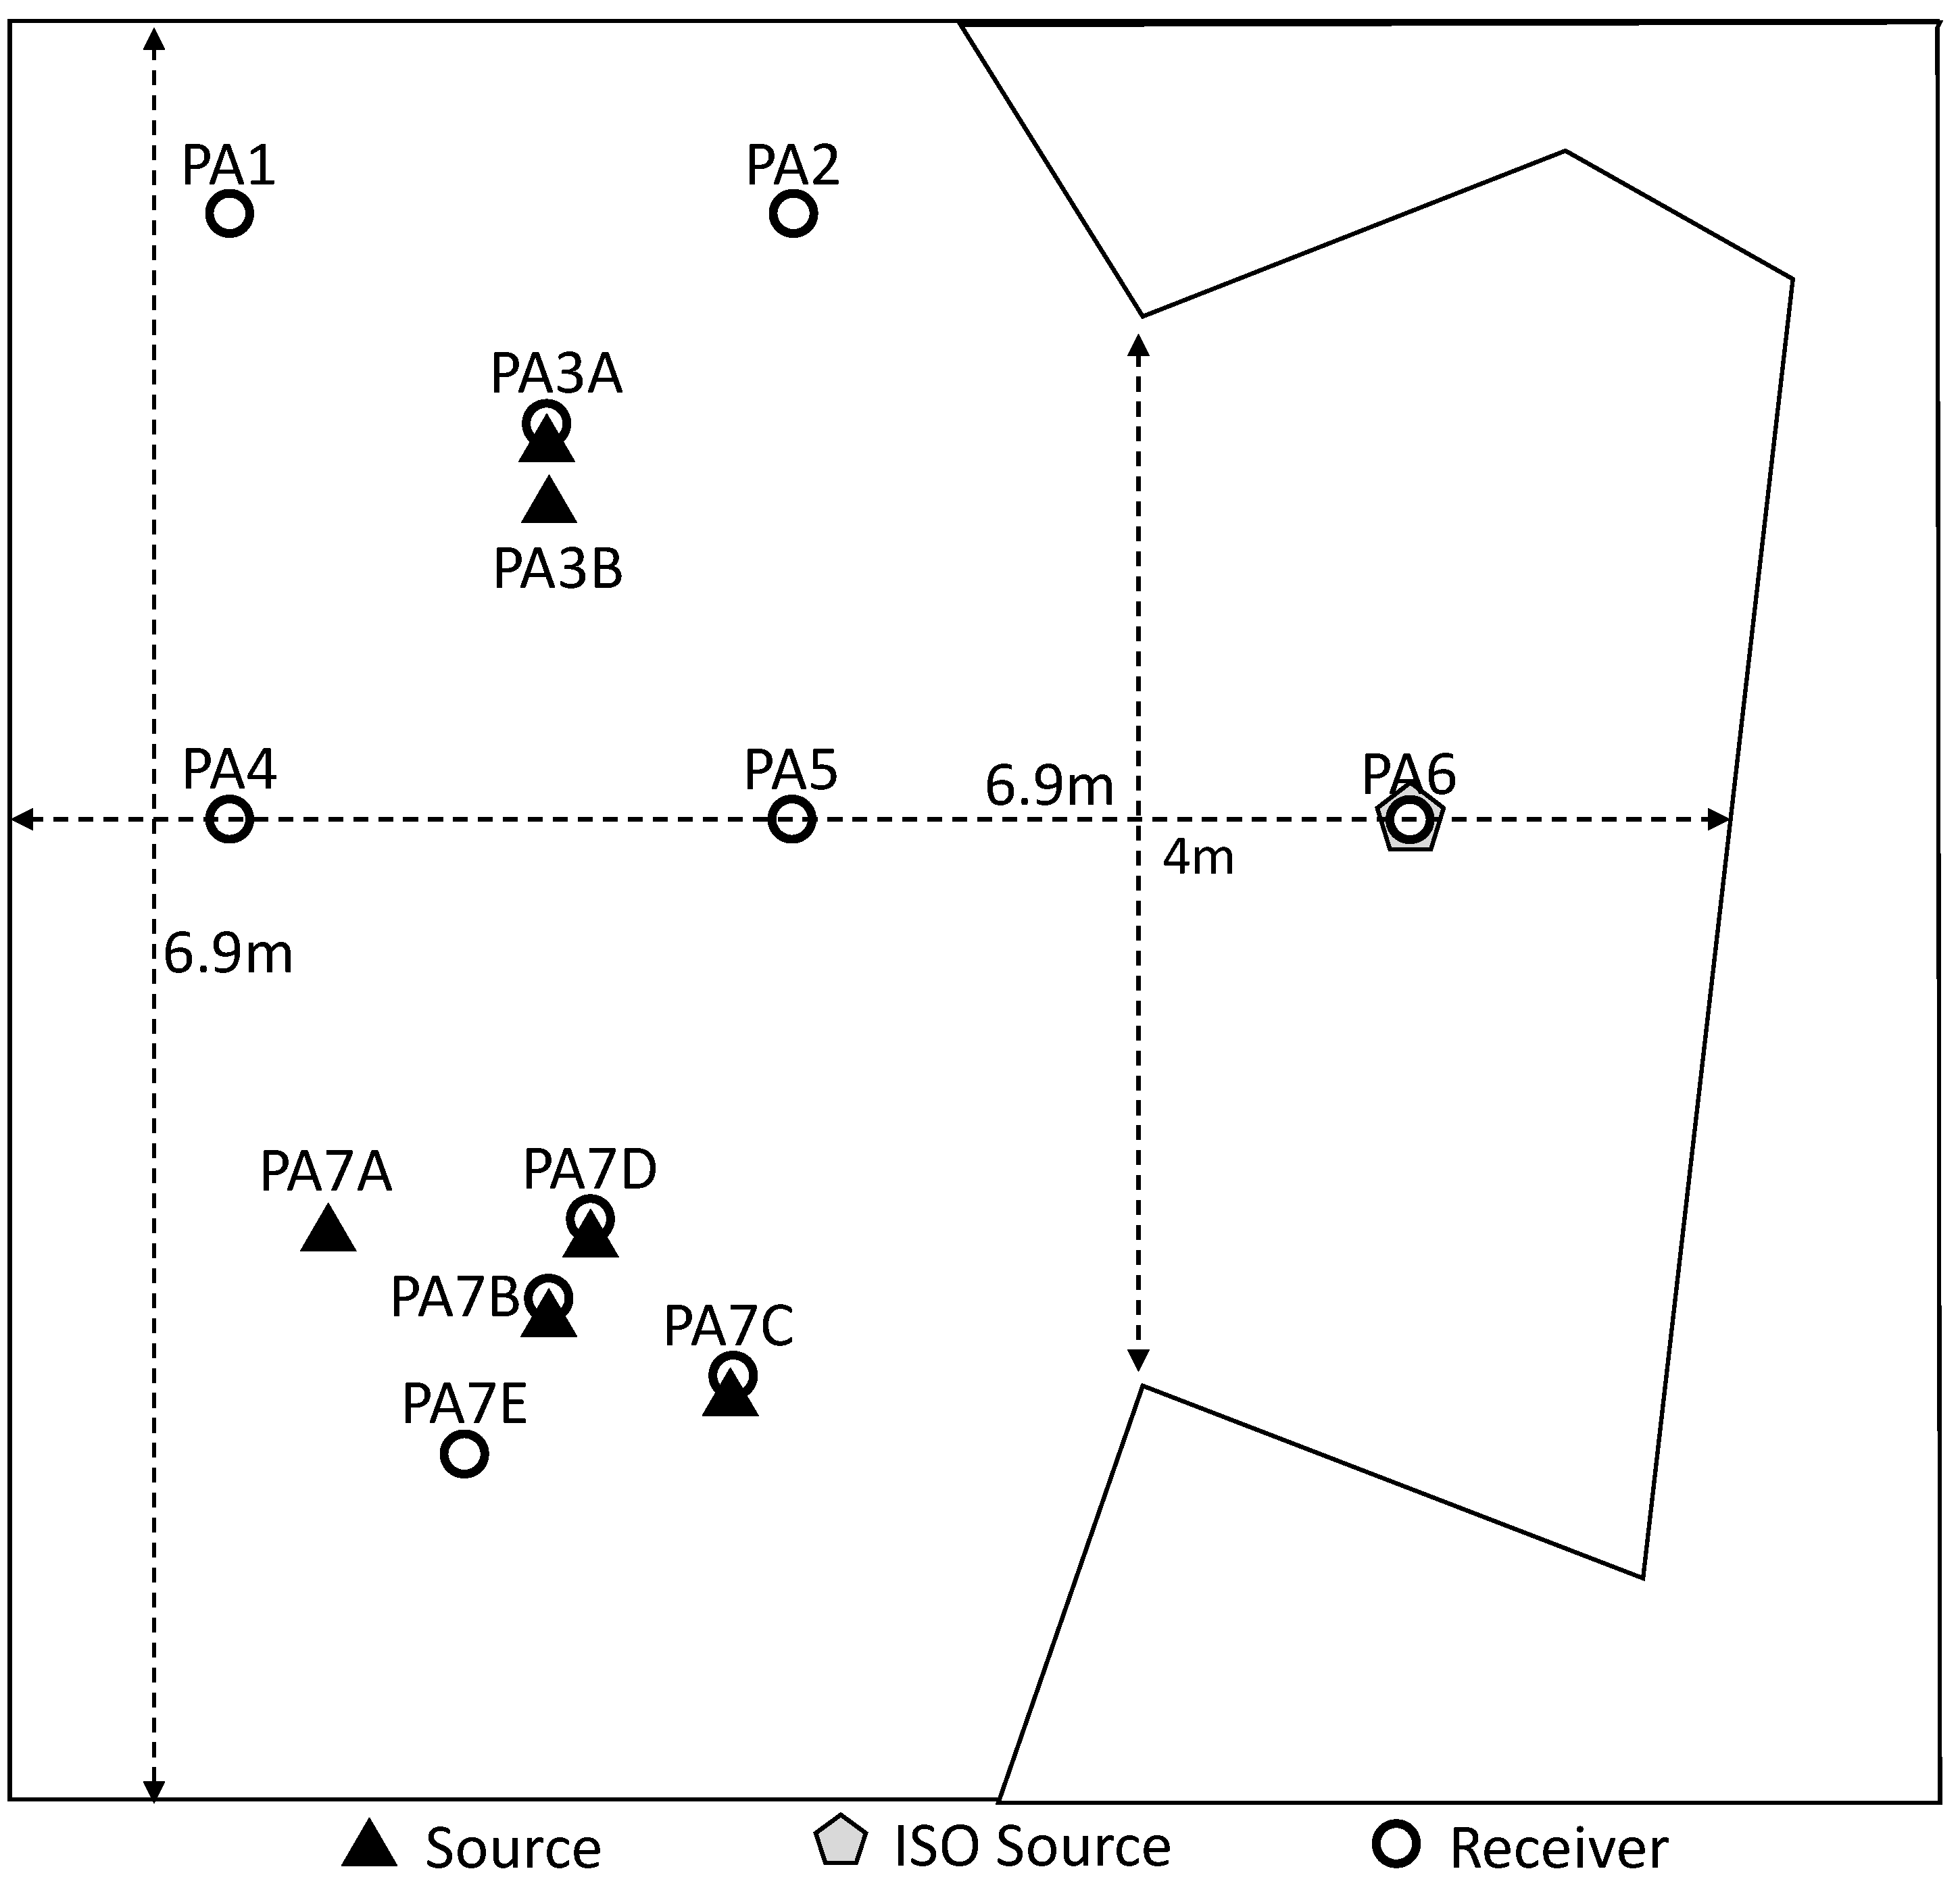
  • MV5 VR Capture: MV5 consisted of 12 measurement points altogether, as shown in Figure 7. Two performer positions were defined at PA3A, set 1.5 m into the room with a height of 1.5 m, and PA7B, set 5 m into the room at a height of 1 m. As the studio is often used to record intimate acoustic guitar or piano performances, these points were augmented with further measurements to simulate these instruments. Points PA7A and PA7C were included for simulation of a piano (at a height of 1.2 m), and points 3B and 7C were included to simulate acoustic guitars (at a height of 1 m). The Eigenmike was set to 1.6 m and faced east for all measurements.
  • MV5 ISO-3382 Capture: The docecahedron was set to a height of 1.5 m. For ISO-3382, two source–receiver combinations were captured. First with the dodecahedron loudspeaker at PA3A and receivers at PA4, PA5, PA6 and PA7B. Second, with the dodecahedtron at PA6, with receivers PA7B, PA3A, PA4 and PA5. The Eigenmike was set to 1.7 m facing east and KEMAR to 1.5 m facing south.
  • MV5 Performer Reference Positions: Similar to MV4, reference measurements were captured at each of the performer positions using 5 Genelec loudspeakers and the KEMAR binaural head with voicebox as the sources. The in-ear microphones of the KEMAR were used as receivers. KEMAR was positioned at PA3A and PA7B for these measurements, facing south then north, respectively, at a height of 1.5 m.

4. Data Post-Processing

4.1. Data Extraction and Cleanup

Recorded sweeps were exported from Reaper in batches according to the measurement setup. For example, for MV4, the entirety of the VR recording pass for the Eigenmike was exported as a single 32-channel file. Also exported in the same time windows were the other corresponding microphone channels, (KEMAR, reference omni microphone) as well as the original sweep playback stem for the entire recording pass.
Eigenmike recordings were then split into mono files in Matlab and batch-processed along with the other microphones in Izotope RX8 audio editor [20] for cleaning. A major advantage of working with tonal sweeps is that transients are not a desired part of the recorded signal, and will therefore result in ‘phantom reversed’ sweeps if deconvolved. Occasional low-level transients can occur during measurements due to air conditioning rattle or inadvertant movement from a member of the measurement team. In cleaning such events, we utilised the RX8 ‘Deconstruct’ feature, which seperates the signal into tonal, noise and transient characteristics through spectral decomposition. Further cleaning of the recordings can be achieved through spectral denoising and equalisation if required, although care must be taken to ensure that the low-level tail of the impulse response is not compromised. A frequency-dependent noise profile must first be learned for a silent portion of the recorded signal to set an appropriate frequency-dependent threshold. Noise can then be suppressed through frequency-dependent expansion of the signal. We recommend for this process that once the signal level within a frequency bin has gone below the threshold (ideally 60 dB below the main signal) that the expander release be set to a high value (in this case 350 ms) to ensure the reverberation decay is not unduly gated. Furthermore, care should be taken in the amount of expansion, as −10 dB is usually sufficient to hear a significant improvement in perceived signal-to-noise ratio upon deconvolution. Finally, any signal below (in this case 60 Hz) or above the excitation frequency range of the transducer can also be removed through high-pass filtering.

4.2. Data Parsing and Transcoding

Once the data was cleaned, it was then ready for the deconvolution routine. As previously mentioned, Channel 1 of the sweep playback consisted of a short burst of low-level metadata, which identified the start of the playback. Since the exported original sweeps and recorded sweeps have the same timestamps (i.e., they were both exported simultaneously from Reaper under the same timeline selection), then the metadata marker in the original sweep is used to identify the start of a measurement in the recorded sweep. A Matlab routine was created which identified the sample index of such markers in a recording, extracted the corresponding recorded sweeps and then convolved the recordings with a time-reversed and amplitude-compensated version of the original sweep to extract the impulse responses. In the case of MV4, for instance, the first metadata marker is for receiver position PA1 with all sources north-facing. Under this measurement, seven impulse responses were extracted, each IR separated by δ i n t seconds. Within each IR window, the front of the IR was detected and windowed to allow only 128 samples before the direct sound with any preceeding harmonic distortion components set to zero amplitude.
Impulse responses were then equalised to remove the diffuse field responses of the transducers: the Eigenmike, housing 32 DPA capsules, the KEMAR dummy head, 2 GRAS 40 AH low-noise microphone capsules, and the reference omnidirectional microphone, which is a single AKG CK77 capsule. An equalisation filter response was obtained by measuring the response of each microphone within an array of Genelec 8030 and 8040 loudspeakers in the AudioLab listening room at the University of York. The array is arranged in a 50-point spherical Lebedev formation [21]. Impulse responses were windowed to remove any early reflection components, leaving only the direct sound responses. For each microphone, the minimum phase responses were then averaged and an inverse filter response was calculated using Kirkeby regularisation [22]. Each Maida Vale impulse response measurement was then convolved with the correspoding equalisation filter. The IRs were then exported and named based on the studio, measurement setup, source–receiver combination, source orientation and microphone type.
Further processing was implemented on the RAW 32-channel Eigenmike capsules. The signals were converted to third-order spherical harmonic format using the MH Acoustics Em32-Encoder plugin within Matlab. As the Eigenmike was also recorded in endfire position, the soundfield was pitched down by 90 degrees about the y-axis to compensate.

5. Results

The following subsections present the measured acoustic parameters of each of the studios taken from the recorded RIRs and their similarities and differences followed by the approach taken to render VR environments from the captured data.

5.1. Acoustic Comparison

For each room, all ISO-3382 impulse responses were extracted from their corresponding measurements and their acoustic properties derived. A spatial average of the different acoustic properties was then computed for each room. A comparison of the acoustics of the four measured studios is presented in Figure 8. Here, we present the acoustic definition (D50), clarity (C80), Centre Time (CT), Early Decay Time (EDT) and reverberation time (T30).
D50 gives us a comparison of the energy in the first 50 ms of the impulse response to the total received energy and is related to subjective speech intelligibility [14]. We can readily see that studios MV3, MV4 and MV5 have high levels of definition (80% to 90% on average), but this is much lower for MV2, which is the more reverberant space.
C80 gives us a comparison of the energy before and after the first 80 ms in the impulse response [14]. MV2 gives a clarity level closer to that expected of concert halls than any of the other studios. It is therefore no surprise that this room is favored for rehearsals by the BBC Singers. The other studios have a stronger direct sound response and much higher clarity overall, which makes them more favorable for recording rock or pop music, which again is their main function at the studios. This tendency of MV3, MV4 and MV5 to favor the direct sound is reinforced by the measure of Centre Time (CT), which is the time of the centre of gravity of the squared response, measured in seconds [14]. The frequency dependency of MV3/4/5 in this regard is remarkably similar, demonstrating an incredible level of control throughout these studios. Conversely, the Centre time of MV2 averages close to 80 ms, which again shows remarkable balance in the acoustics, given a T30 level around 0.75 s. It is interesting to note that EDT values for MV2 are greater than the T30 values, indicating the presence of strong early reflections from the wood panelling on the walls of the room as well as the exposed wooden floor. However, the effect of the geometric diffusion throughout the space lessens the impact of later reflections, resulting in a lower T30.
The measured reverberation time for MV3 is marginally higher in the lower frequencies at around 0.5 s, but drops off with higher frequency, due in part to the absorptive effect of the curtain material throughout the space. MV4 shows the shortest T30 overall, averaging at 0.4 s. This is largely consistent across the spectrum, with some high-frequency deviation to 0.35 s at 8 kHz. MV5 demonstrates an interesting range of energy decay, (0.45 s at 125 Hz, dropping to 0.35 s at 500 Hz and then rising again) which is not surprising as it is the smallest space overall, with wooden refelective surfaces giving more potential for modal interaction at low to low–mid frequencies. Nonetheless, it is remarkable that MV3, MV4 and MV5 have such distinct similarities in their responses, despite the radical difference in their dimensions.

5.2. Vr Rendering

The Spatial Room Impulse Response (SRIR) measurements extracted from the Eigenmike can be utilised in 3DoF or 6DoF VR rendering [17]. Instrument audio can be rendered in real time through convolution with a desired SRIR decoded to binaural or loudspeaker rendering using an Ambisonic framework.
For applications where movement about the space is required, interpolation across the impulse responses is necessary [23]. This interpolation can be used to increase the density of impulse responses or interpolate the IRs in real-time within the rendering engine as the user moves through the space. Many methods of interpolation have been presented in the literature [24,25,26,27,28,29,30], with good results in increasing the measurement density obtained using a non-linear dynamic time-warping approach [31,32].
Another factor for any virtual acoustic rendering to be convincing is the realistic representation of the directional properties of the source audio. Complex sound sources such as drums will not radiate with equal power in all directions. Several approaches to measuring and synthesising source directionality have been proposed in the literature, primarily with regard to wave field synthesis reproduction. The capture of source directivity is traditionally achieved using arrays of microphones surrounding a performer and databases of such measurements are available [33]. Directivity filters can then be applied to a single monophonic recording of a performance to simulate the change in frequency response with source/listener movement. A simple approach has been proposed by Giron [34], where the interference of several monopole virtual sources is used to synthesise the directivity of real sources. However, the resulting frequency-dependent directivity does not behave like that of real world sources. A further approach is that the array of microphones used to capture the directivity measurements can actually be used to capture the performance (in an anechoic chamber) entirely, and virtual loudspeakers can be synthesised at reproduction using monopoles or virtual cardioids [35]. Although, this is not a practical solution to a real performance situation. Another method is the decomposition of the directional response into spherical harmonics, which has been proposed for computational-based auralisation in numerous papers, most notably in Spors [36].
Additionally, it has been found by Jacques et al. [35] that the directivity characteristics of a natural musical instrument do not have to be completely objectively identical to the original response, provided that the end-listener is not familiar with every single aspect of the particular instrument’s directional response. A close approximation is generally sufficient to create a plausible reproduction.
The use of spherical loudspeaker arrays has also been proposed by Farina [37] and Zotter [38] for modeling the directivity of sound sources. Farina demonstrates how complete directional information can be obtained by measuring sweeps with spherical harmonic emission due to manipulation of the individual loudspeaker feeds in a docdecahedron [37]. This does require customisation of such a loudspeaker array as commercial solutions are not readily available, thereby limiting the uptake of the method. Kessler [11] has broadly outlined a method of approximating source directivity using standard loudspeakers by taking multiple spatial impulse response measurements at the same position, but at different loudspeaker rotations. An approximated directional characteristic can then be derived by simply exciting the room in different directions from the source position, capturing the SRIRs in each source direction and combining the impulse responses in a given ratio for auralisation. Here, we too utilise a similar approach to Kessler’s, with the exception that we employ a least-squares optimisation to the measured directional signals and the corresponding SRIRs, such that a plausible directional characteristic is obtained [23].
The broadband directional response of a Genelec 8040 loudspeaker is approximately sub-cardioid, meaning that it has some significant attenuation (around 10 dB) to the rear of the loudspeaker [39]. For each receiver position there are four such sub-cardioid sources, measured in the North, East, South and West directions. We will define the matrix containing the directivity vectors of each of the loudspeakers as D = d 1 d 2 d 3 d 4 . The directivity of our virtual source must match that of real source directivity measurements p such that
D α 1 α 2 α 3 α 4 = p
where a = α 1 α 2 α 3 α 4 T , the gain factors to be applied to the loudspeakers such that the desired directional characteristic is obtained. Thus if
D T D α 1 α 2 α 3 α 4 = D T p
then we can solve for a with
a = α 1 α 2 α 3 α 4 = ( D T D ) 1 D T p
For example, imagine we wish to approximate a source with a supercardioid directivity, such as might be the case with a bass drum—high intensity from the front direction with phase reversed output from behind the drum. Starting with sub-cardioid responses, the above optimisation process will then yield a = 0.4211 1.0000 0.4211 0.4211 , where a negative gain represents a phase inversion. Therefore, at post-production, the final SRIR to be rendered at position i, h i ( t ) is the linear summation of the weighted measured impulse responses for that position, given by
h i ( t ) = α 1 h s 1 ( t ) + α 2 h s 2 ( t ) + α 3 h s 3 ( t ) + α 4 h s 4 ( t )
Note that the true directional excitation of complex sources is also frequency-dependent. Consequently, we propose that the above optimisation be performed in perceptual frequency bands [23].

6. Database of Measurements

The measurements of Studios 4 and 5 are freely available online with the permission of the BBC. The following elements for each recording studio are included:
  • 32-Channel Eigenmike capsule impulse responses (RAW);
  • 32-Channel Eigenmike capsule impulse responses (Diffuse Field Equalised);
  • 16-channel third-order Ambisonic Impulse Responses;
  • 2-channel KEMAR impulse Responses (RAW);
  • 2-channel KEMAR impulse Responses (Diffuse Field Equalised);
  • Mono Reference omnidirectional microphone impulse responses (RAW);
  • Mono Reference omnidirectional microphone impulse responses (Diffuse Field Equalised).
Additional TOA impulse responses are presented that simulate instruments at MV4 source positions and demonstrate the source directivity simulation methodology outlined in Section 5.2. These IRs match the MV4 Unity project [17] also included with the database. All data is stored at 48 kHz sample rate, 24 bit resolution. Version 1.0 of the entire database can be downloaded at https://audiolab.york.ac.uk/resources/ (accessed on 10 August 2022). Measurements are available under the Non-Commercial Creative Commons License https://creativecommons.org/licenses/by-nc/3.0/ (accessed on 10 August 2022).

7. Conclusions

We have presented a database of acoustic measurements of the BBC Maida Vale Recordings Studios. The database consists of spatial impulse responses in third-order Ambisonic format as well as measurements from a KEMAR binaural manikin. The acoustic data captured facilitated a comparative study of the studios, that demonstrates the remarkable similarity of acoustic properties of studios MV3, MV4 and MV5 despite the major differences in geometry. MV2, which is equivalent in size to MV3, has a much longer reverberation time, with C80 and D50 values closer to concert hall acoustics than the other spaces, making it an ideal space for choirs or orchestral rehearsal. The short reverberation time and high clarity of the other spaces make them more appropriate for rock and pop recording.
The measurements captured facilitate 3DoF and 6DoF VR rendering and in the case of MV4 also correspond to an interactive Unity project of the space which accompanies the database. The database enables future work in reverberator design using, for example, feedback delay networks to approximate the distribution of SRIRs or alternate methods of spatial impulse response interpolation for 6DoF rendering. Other avenues of exploration include using the SRIRs for shared immersive musical experiences, for instance in networked music performance or fully virtual recording frameworks [17].

Author Contributions

Conceptualisation, G.K. and H.D.; methodology, G.K. and H.D.; measurement, G.K., H.D., P.C., T.R., A.H., J.C., P.T. and B.L. geometric measurement and visualisation, J.C. and D.J.; formal analysis, G.K.; resources, G.K., H.D. and B.L.; data curation, G.K. and B.L. writing—original draft preparation, G.K. and H.D.; writing—review and editing, G.K. and H.D.; project administration, G.K. and H.D.; funding acquisition, G.K. and H.D. All authors have read and agreed to the published version of the manuscript.

Funding

This research was funded by Engineering and Physical Sciences Research Council IAA project “MINERVA: Musical Interactions in Networked Experiences using Real-time Virtual Audio”, EP/R51181X/1.

Institutional Review Board Statement

Not applicable.

Informed Consent Statement

Not applicable.

Data Availability Statement

Version 1.0 of the Maida Vale Impulse Response Database can be downloaded from https://audiolab.york.ac.uk/resources/ (accessed on 10 August 2022). Measurements are available under the Non-Commercial Creative Commons License https://creativecommons.org/licenses/by-nc/3.0/ (accessed on 10 August 2022).

Acknowledgments

The authors gratefully acknowledge the assistance of Emma Young, Chris Pike, Jack Reynolds and the BBC R&D team, as well as Andrew Rogers and the staff at BBC Maida Vale Recording Studios. The assistance of Andrew Chadwick in logistical preparation of the measurements is also gratefully appreciated.

Conflicts of Interest

The authors declare no conflict of interest.

Abbreviations

The following abbreviations are used in this manuscript:
ESSExponential Sinetone Sweep
DFEDiffuse Field Equalised
HOAHigher Order Ambisonic
IRImpulse Response
KEMARKnowles Electronic Manikin for Acoustic Research
OAOutside performance Area
PAPerformance Area
RIRRoom Impulse Response
SRIRSpatial Room Impulse Response
VRVirtual Reality

References

  1. Bork, I. Report on the 3rd round robin on room acoustical computer simulation—Part II: Calculations. Acta Acust. United Acust. 2005, 91, 753–763. [Google Scholar]
  2. Luizard, P.; Otani, M.; Botts, J.; Savioja, L.; Katz, B.F. Comparison of sound field measurements and predictions in coupled volumes between numerical methods and scale model measurements. In Proceedings of the Meetings on Acoustics ICA2013, Montreal, QC, Canada, 2–7 June 2013; Acoustical Society of America: New York, NY, USA, 2013; Volume 19, p. 015114. [Google Scholar]
  3. Postma, B.N.; Katz, B.F. Perceptive and objective evaluation of calibrated room acoustic simulation auralizations. J. Acoust. Soc. Am. 2016, 140, 4326–4337. [Google Scholar] [CrossRef] [PubMed]
  4. Gomez-Agustina, L.; Barnard, J. Practical and technical suitability perceptions of sound sources and test signals used in room acoustic testing. In Proceedings of the INTER-NOISE and NOISE-CON Congress and Conference Proceedings, Madrid, Spain, 16–19 June 2019; Institute of Noise Control Engineering: Reston, VA, USA, 2019; Volume 259, pp. 7076–7087. [Google Scholar]
  5. BBC. Maida Vale: The Home of the BBC Symphony Orchestra. 2009. Available online: https://www.bbc.com/historyofthebbc/buildings/maida-vale/ (accessed on 12 August 2022).
  6. Burton, J. BBC Maida Vale Studios. 2013. Sound on Sound. Available online: https://www.soundonsound.com/music-business/bbc-maida-vale-studios (accessed on 12 August 2022).
  7. Borish, J.; Angell, J.B. An Efficient Algorithm for Measuring the Impulse Response Using Pseudorandom Noise. J. Audio Eng. Soc. 1983, 31, 478–488. [Google Scholar]
  8. Foster, S. Impulse response measurement using Golay codes. In Proceedings of the ICASSP’86. IEEE International Conference on Acoustics, Speech, and Signal Processing, Tokyo, Japan, 7–11 April 1986; Volume 11, pp. 929–932. [Google Scholar]
  9. Papadakis, N.M.; Stavroulakis, G.E. Review of acoustic sources alternatives to a dodecahedron speaker. Appl. Sci. 2019, 9, 3705. [Google Scholar] [CrossRef]
  10. Farina, A. Simultaneous measurement of impulse response and distortion with a swept-sine technique. In Proceedings of the 108th Convention of the Audio Engineering Society, Paris, France, 19–22 February 2000. [Google Scholar]
  11. Kessler, R. An Optimised Method for Capturing Multidimensional Acoustic Fingerprints. In Proceedings of the 118th Convention of the Audio Engineering Society, Barcelona, Spain, 28–31 May 2005. [Google Scholar]
  12. Armstrong, C.; Thresh, L.; Murphy, D.; Kearney, G. A perceptual evaluation of individual and non-individual HRTFs: A case study of the SADIE II database. Appl. Sci. 2018, 8, 2029. [Google Scholar] [CrossRef]
  13. Majdak, P.; Balazs, P.; Laback, B. Multiple exponential sweep method for fast measurement of head-related transfer functions. J. Audio Eng. Soc. 2007, 55, 623–637. [Google Scholar]
  14. ISO 3382-1:2009; Acoustics-Measurement of Room Acoustic Parameters—Part 1: Performance Spaces. International Organization for Standardization: Geneva, Switzerland, 2009. Available online: http://www.iso.org/ (accessed on 21 September 2009).
  15. Noisternig, M.; Sontacchi, A.; Musil, T.; Holdrich, R. A 3D Ambisonic Based Binaural Sound Reproduction System. In Proceedings of the 24th International Conference of the Audio Engineering Society, St. Petersburg, Russia, 1–3 June 2002. [Google Scholar]
  16. Gorzel, M.; Allen, A.; Kelly, I.; Kammerl, J.; Gungormusler, A.; Yeh, H.; Boland, F. Efficient encoding and decoding of binaural sound with resonance audio. In Proceedings of the Audio Engineering Society Conference: 2019 AES International Conference on Immersive and Interactive Audio, York, UK, 27–29 March 2019; Audio Engineering Society: New York, NY, USA, 2019. [Google Scholar]
  17. Cairns, P.; Hunt, A.; Cooper, J.; Johnston, D.; Lee, B.; Daffern, H.; Kearney, G. Recording Music in the Metaverse: A case study of XR BBC Maida Vale Recording Studios. In Proceedings of the 2022 Audio Engineering Society International Conference on Audio for Virtual and Augmented Reality, Washington, DC, USA, 15–17 August 2022. [Google Scholar]
  18. Moody, A. Adult anthropometric measures, overweight and obesity. Health Surv. Engl. 2013, 1, 1–39. [Google Scholar]
  19. McKenzie, T.; Murphy, D.; Kearney, G. Assessing the authenticity of the KEMAR mouth simulator as a repeatable speech source. In Proceedings of the Audio Engineering Society Convention 143, New York, NY, USA, 18–21 October 2017; Audio Engineering Society: New York, NY, USA, 2017. [Google Scholar]
  20. Izotope. RX9 User Manual. 2021. Available online: https://www.izotope.com/en/products/rx.html (accessed on 12 August 2022).
  21. Lecomte, P.; Gauthier, P.A.; Langrenne, C.; Garcia, A.; Berry, A. On the use of a lebedev grid for ambisonics. In Proceedings of the Audio Engineering Society Convention 139, New York, NY, USA, 29 October–1 November 2015; Audio Engineering Society: New York, NY, USA, 2015. [Google Scholar]
  22. Kirkeby, O.; Nelson, P. Fast Deconvolution of Multi-Channel Systems Using Regularisation; ISVR Technical Report No. 255. Southampton, UK, 1996. Available online: https://citeseerx.ist.psu.edu/viewdoc/download?doi=10.1.1.472.184&rep=rep1&type=pdf (accessed on 12 August 2022).
  23. Kearney, G. Auditory Scene Synthesis Using Virtual Acoustic Recording and Reproduction. Ph.D. Thesis, Trinity College Dublin, Dublin, Ireland, 2010. [Google Scholar]
  24. Antonello, N.; De Sena, E.; Moonen, M.; Naylor, P.A.; Van Waterschoot, T. Room impulse response interpolation using a sparse spatio-temporal representation of the sound field. IEEE/ACM Trans. Audio Speech Lang. Process. 2017, 25, 1929–1941. [Google Scholar] [CrossRef]
  25. Matsumoto, M.; Tohyama, M.; Yanagawa, H. A method of interpolating binaural impulse responses for moving sound images. Acoust. Sci. Technol. 2003, 24, 284–292. [Google Scholar] [CrossRef]
  26. Bruschi, V.; Nobili, S.; Cecchi, S.; Piazza, F. An innovative method for binaural room impulse responses interpolation. In Proceedings of the Audio Engineering Society Convention 148, Online, 2–5 June 2020; Audio Engineering Society: New York, NY, USA, 2020. [Google Scholar]
  27. Mignot, R.; Chardon, G.; Daudet, L. Low frequency interpolation of room impulse responses using compressed sensing. IEEE/ACM Trans. Audio Speech Lang. Process. 2013, 22, 205–216. [Google Scholar] [CrossRef] [Green Version]
  28. Das, O.; Calamia, P.; Gari, S.V.A. Room impulse response interpolation from a sparse set of measurements using a modal architecture. In Proceedings of the ICASSP 2021–2021 IEEE International Conference on Acoustics, Speech and Signal Processing (ICASSP), Toronto, ON, Canada, 6–11 June 2021; pp. 960–964. [Google Scholar]
  29. Garcia-Gomez, V.; Lopez, J.J. Binaural room impulse responses interpolation for multimedia real-time applications. In Proceedings of the Audio Engineering Society Convention 144, Milan, Italy, 23–26 May 2018; Audio Engineering Society: New York, NY, USA, 2018. [Google Scholar]
  30. Mehrotra, S.; Chen, W.g.; Zhang, Z. Interpolation of combined head and room impulse response for audio spatialization. In Proceedings of the 2011 IEEE 13th International Workshop on Multimedia Signal Processing, Hangzhou, China, 17–19 October 2011; pp. 1–6. [Google Scholar]
  31. Masterson, C.; Kearney, G.; Boland, F. Acoustic impulse response interpolation for multichannel systems using dynamic time warping. In Proceedings of the Audio Engineering Society Conference: 35th International Conference: Audio for Games, London, UK, 11–13 February 2009; Audio Engineering Society: New York, NY, USA, 2009. [Google Scholar]
  32. Kearney, G.; Masterson, C.; Adams, S.; Boland, F. Dynamic time warping for acoustic response interpolation: Possibilities and limitations. In Proceedings of the 2009 17th European Signal Processing Conference, Glasgow, UK, 24–28 August 2009; pp. 705–709. [Google Scholar]
  33. Physikalisch-Technische-Bundesanstalt. Directivities of Musical Instruments. 2009. Available online: http://www.catt.se/udisplay.htm#SD_instruments (accessed on 12 August 2022).
  34. Giron, F. Investigations about the Directivity of Sound Sources. Ph.D. Thesis, Ruhr-Universität, Bochum, Germany, 1996. [Google Scholar]
  35. Jacques, R.; Albrecht, B.; Melchior, F.; de Vries, D. An approach for multichannel Recording and Reproduction of Sound Source Directivity. In Proceedings of the 119th convention of the Audio Engineering Society, New York, NY, USA, 7–10 October 2005. [Google Scholar]
  36. Ahrens, J.; Spors, S. Implementation of Directional Sources in Wave Field Synthesis. In Proceedings of the IEEE Workshop on Applications of Signal Processing to Audio and Acoustics, New Paltz, NY, USA, 21–24 October 2007. [Google Scholar]
  37. Farina, A.; Martignon, P.; Capra, A.; Fontana, S. Measuring Impulse Responses Containing Complete Spatial Information. In Proceedings of the 22nd UK Conference of the Audio Engineering Society, London, UK, 25–27 June 2007. [Google Scholar]
  38. Zotter, F.; Höldrich, R. Modeling radiation synthesis with spherical loudspeaker arrays. In Proceedings of the 19th ICA, Madrid, Spain, 2–7 September 2007. [Google Scholar]
  39. Streicher, R.; Everest, F.A. The New Stereo Soundbook, 3rd ed.; Audio Engineering Associates: Pasadena, CA, USA, 2006. [Google Scholar]
Figure 1. Maida Vale measured live rooms: (a) MV2, (b) MV3, (c) MV4, (d) MV5.
Acoustics 04 00047 g001
Figure 2. Multiple Source Exponential Sine Sweep excitation signal.
Acoustics 04 00047 g002
Figure 3. Flowchart of the measurement process.
Acoustics 04 00047 g003
Figure 5. Source and receiver points for Studios MV2 and MV3.
Acoustics 04 00047 g005
Figure 7. Source and receiver points for Studio MV5.
Acoustics 04 00047 g007
Figure 8. Comparison of acoustic parameters of the four measured live rooms: Top left—Definition D50, Top middle—Clarity C80, Top right—Centre time CT, Bottom left—Early Decay Time EDT, Bottom right—Reverb Time T30. Each image shows responses in octave bands as well as averaged weighted response using A, C, or L (linear) weighting.
Acoustics 04 00047 g008
Table 1. Instrumentation utilised during measurements.
Measurement PhaseLoudspeakerReceiversRecording Device
VR7 × Genelec 8040AEigenmike,
AKG CK-77,
KEMAR
Reaper v6.12,
Macbook Pro,
Fireface UFX II,
TCAT interface
ISO-3382NTI DS3 DodecahedronEigenmike,
KEMAR
Publisher’s Note: MDPI stays neutral with regard to jurisdictional claims in published maps and institutional affiliations.

