1. Introduction
The Palace of Charles V (from now on referred to as the Palace, in capital letters), inside the Alhambra fortification, has been used as a concert hall for a long time with quite a degree of success. Previous acoustic research in the Alhambra covers soundscape [
1] and concert noise [
2] but not room acoustics. Analysing the Palace as a concert hall is not straightforward for several reasons: it is open-air, part of the cultural heritage of the city and it was not designed for speech or music transmission.
Open-air venues lack reflections from a ceiling, so most of the energy is reflected from walls that usually have low absorption. Scattering depends on the geometry. Some researched cases are Greek or Roman theatres [
3,
4], or public squares [
5]. The shape of the Palace and its porticoed gallery has some similitudes to the use of arcades in squares [
6]. Using room acoustic parameters in urban squares is useful, according to Thomas et al. [
7]. The listener position has a strong influence on the space wideness assessment, and C
50 and T
30 are important in urban spaces according to the research of Calleri et al. [
8]. Paini et al. [
6] conclude that the addition of arcades to a public square increases T
30, while decreasing C
80. Previous research has discussed the applicability of the ISO 3382-1 [
9] standard to unroofed spaces [
10] and the relevant objective parameters to describe them [
11].
The use of heritage buildings as concert venues is a common practice. Being in a historical place can improve the concert experience of attendants from an emotional point of view [
12]. Brezina [
13] divides the studies of historical places into two: the measurement of acoustic parameters and the storage of acoustics as audio heritage. The safeguard of the acoustic behaviour was pioneered by M. Gerzon [
14] and continued by others such as Farina or Katz [
15,
16,
17]. This work proved to be very important when the Gran Teatro La Fenice in Venice burned in 1996, but its sonic behaviour was saved because several acoustic measurements had been performed prior by Tronchin and Farina [
18]. Furthermore, a fire destroyed the Notre Dame Cathedral in Paris and works by Katz et al. stored the original acoustics [
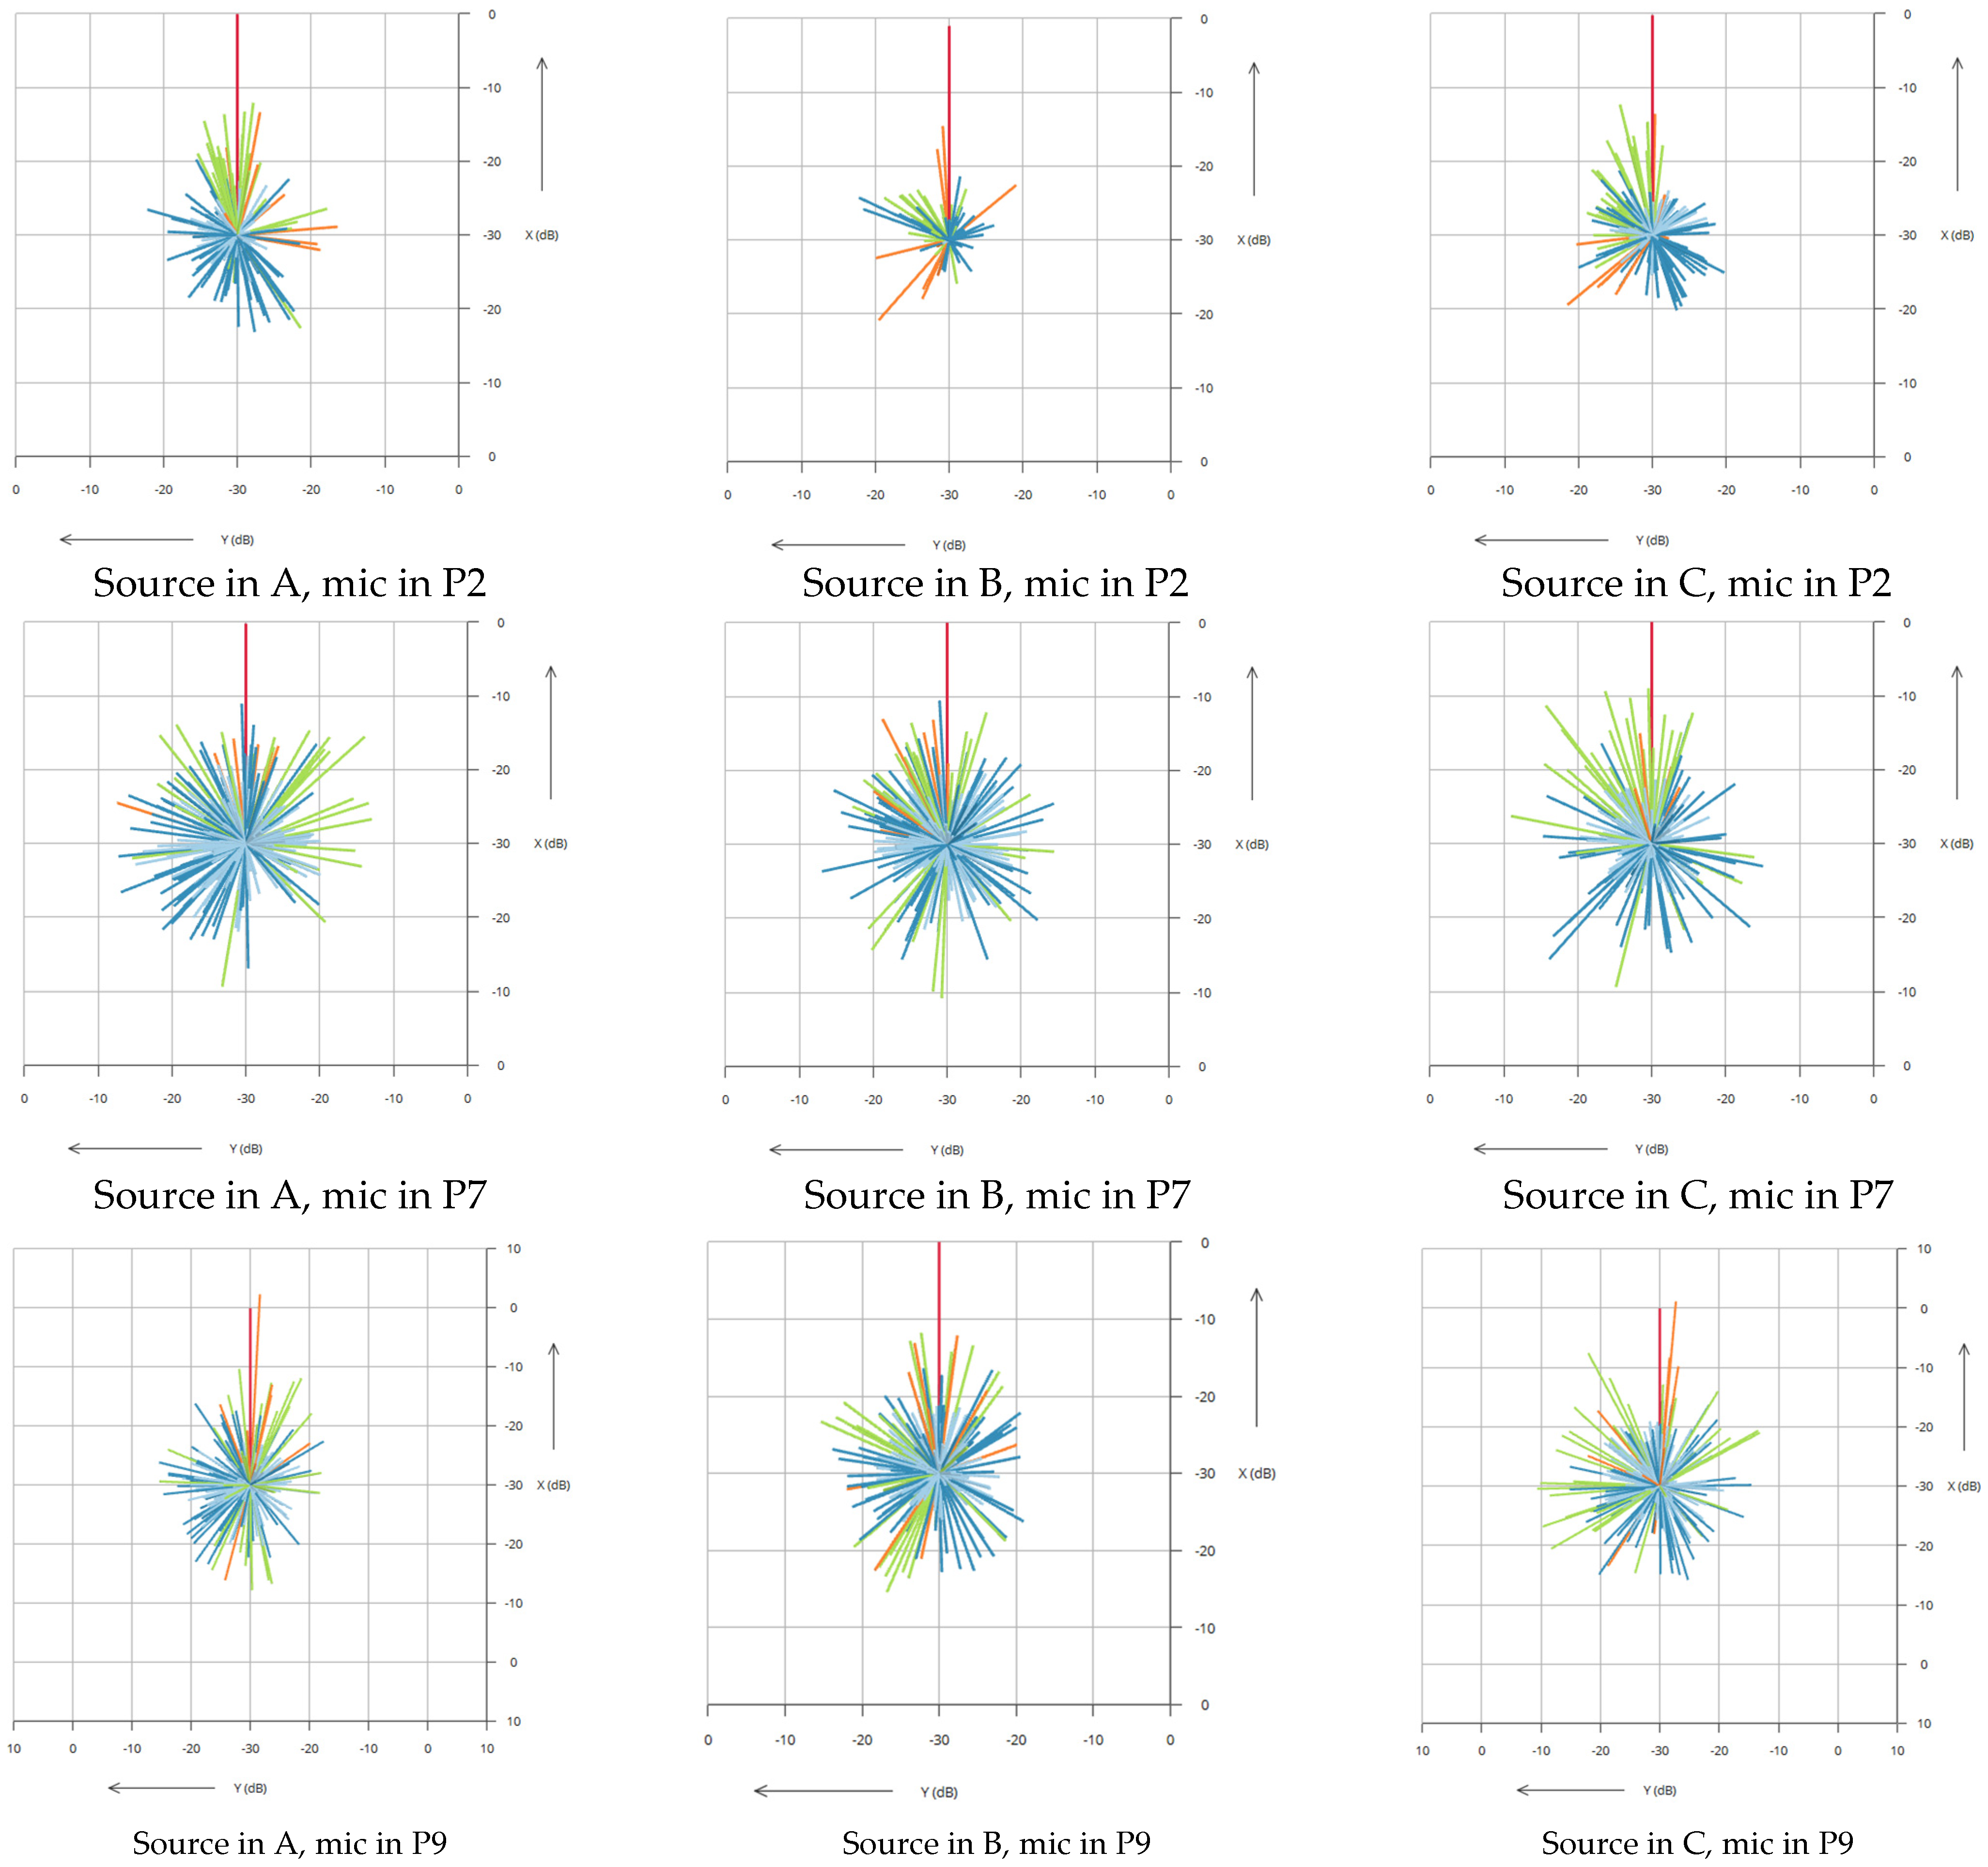
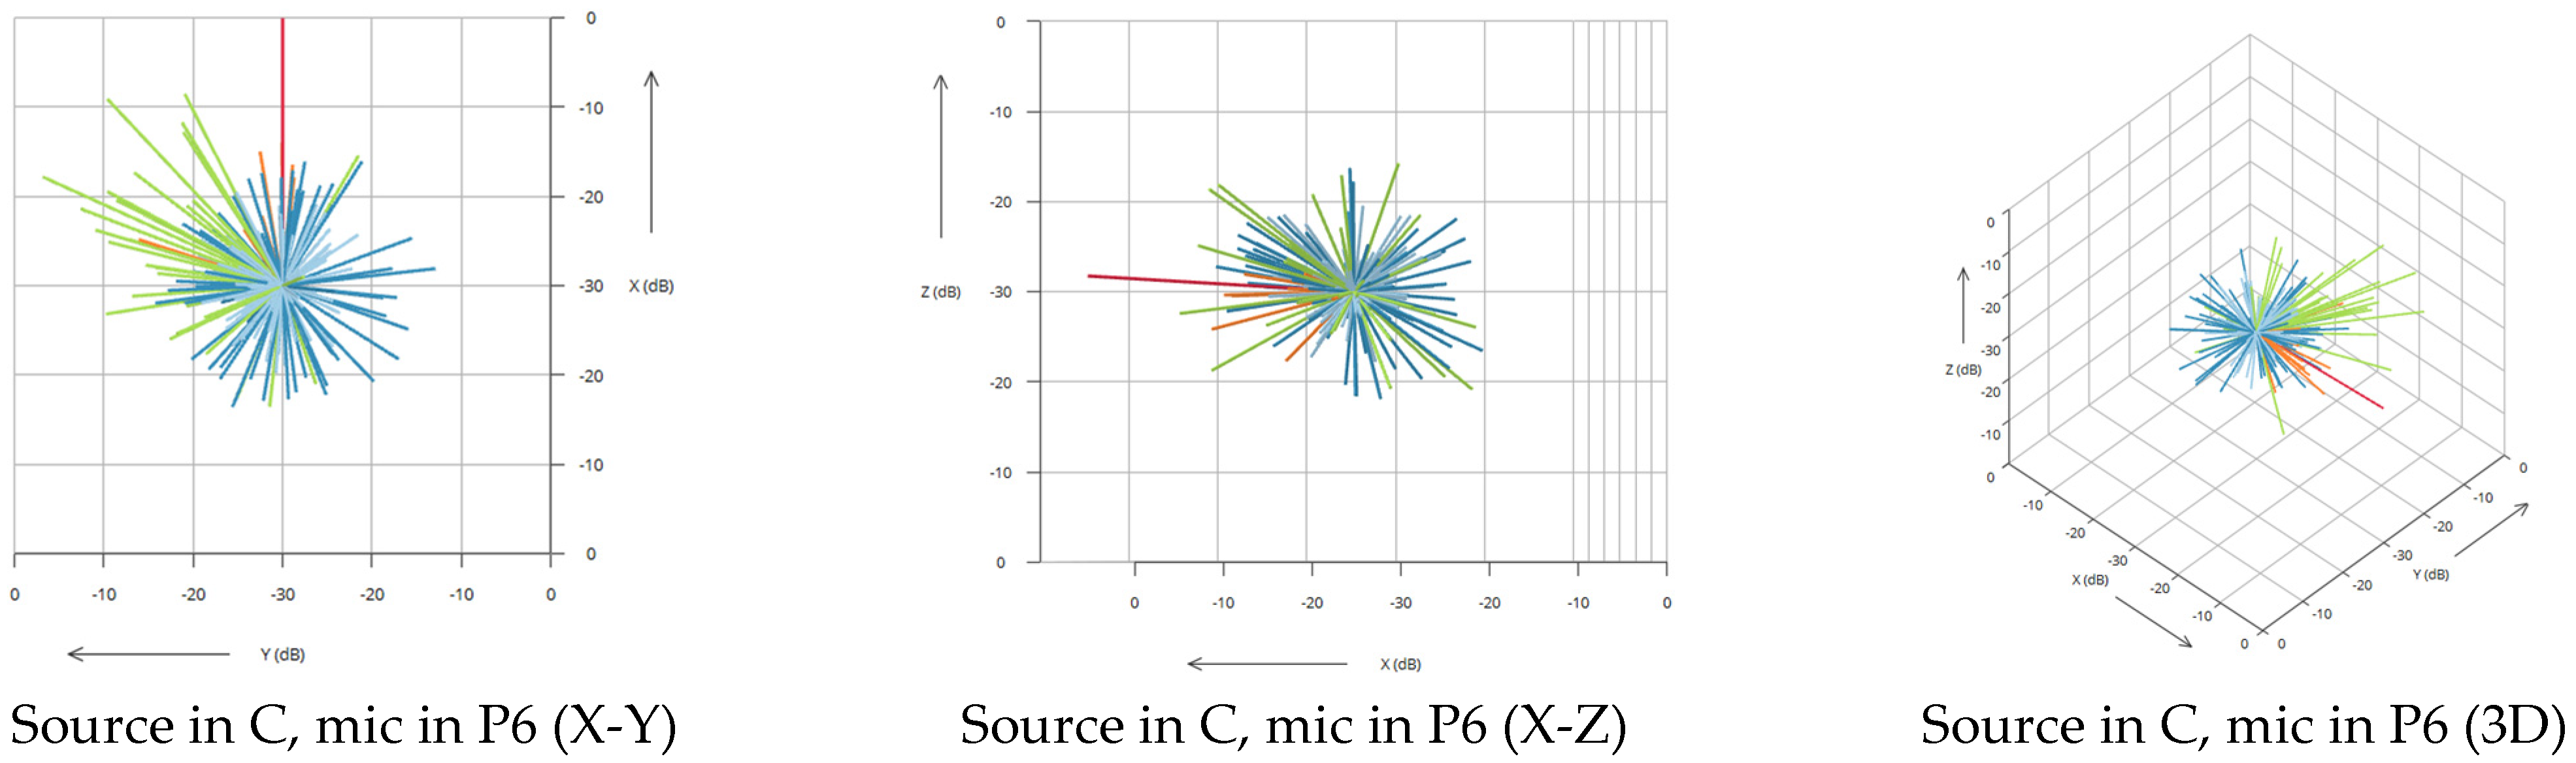
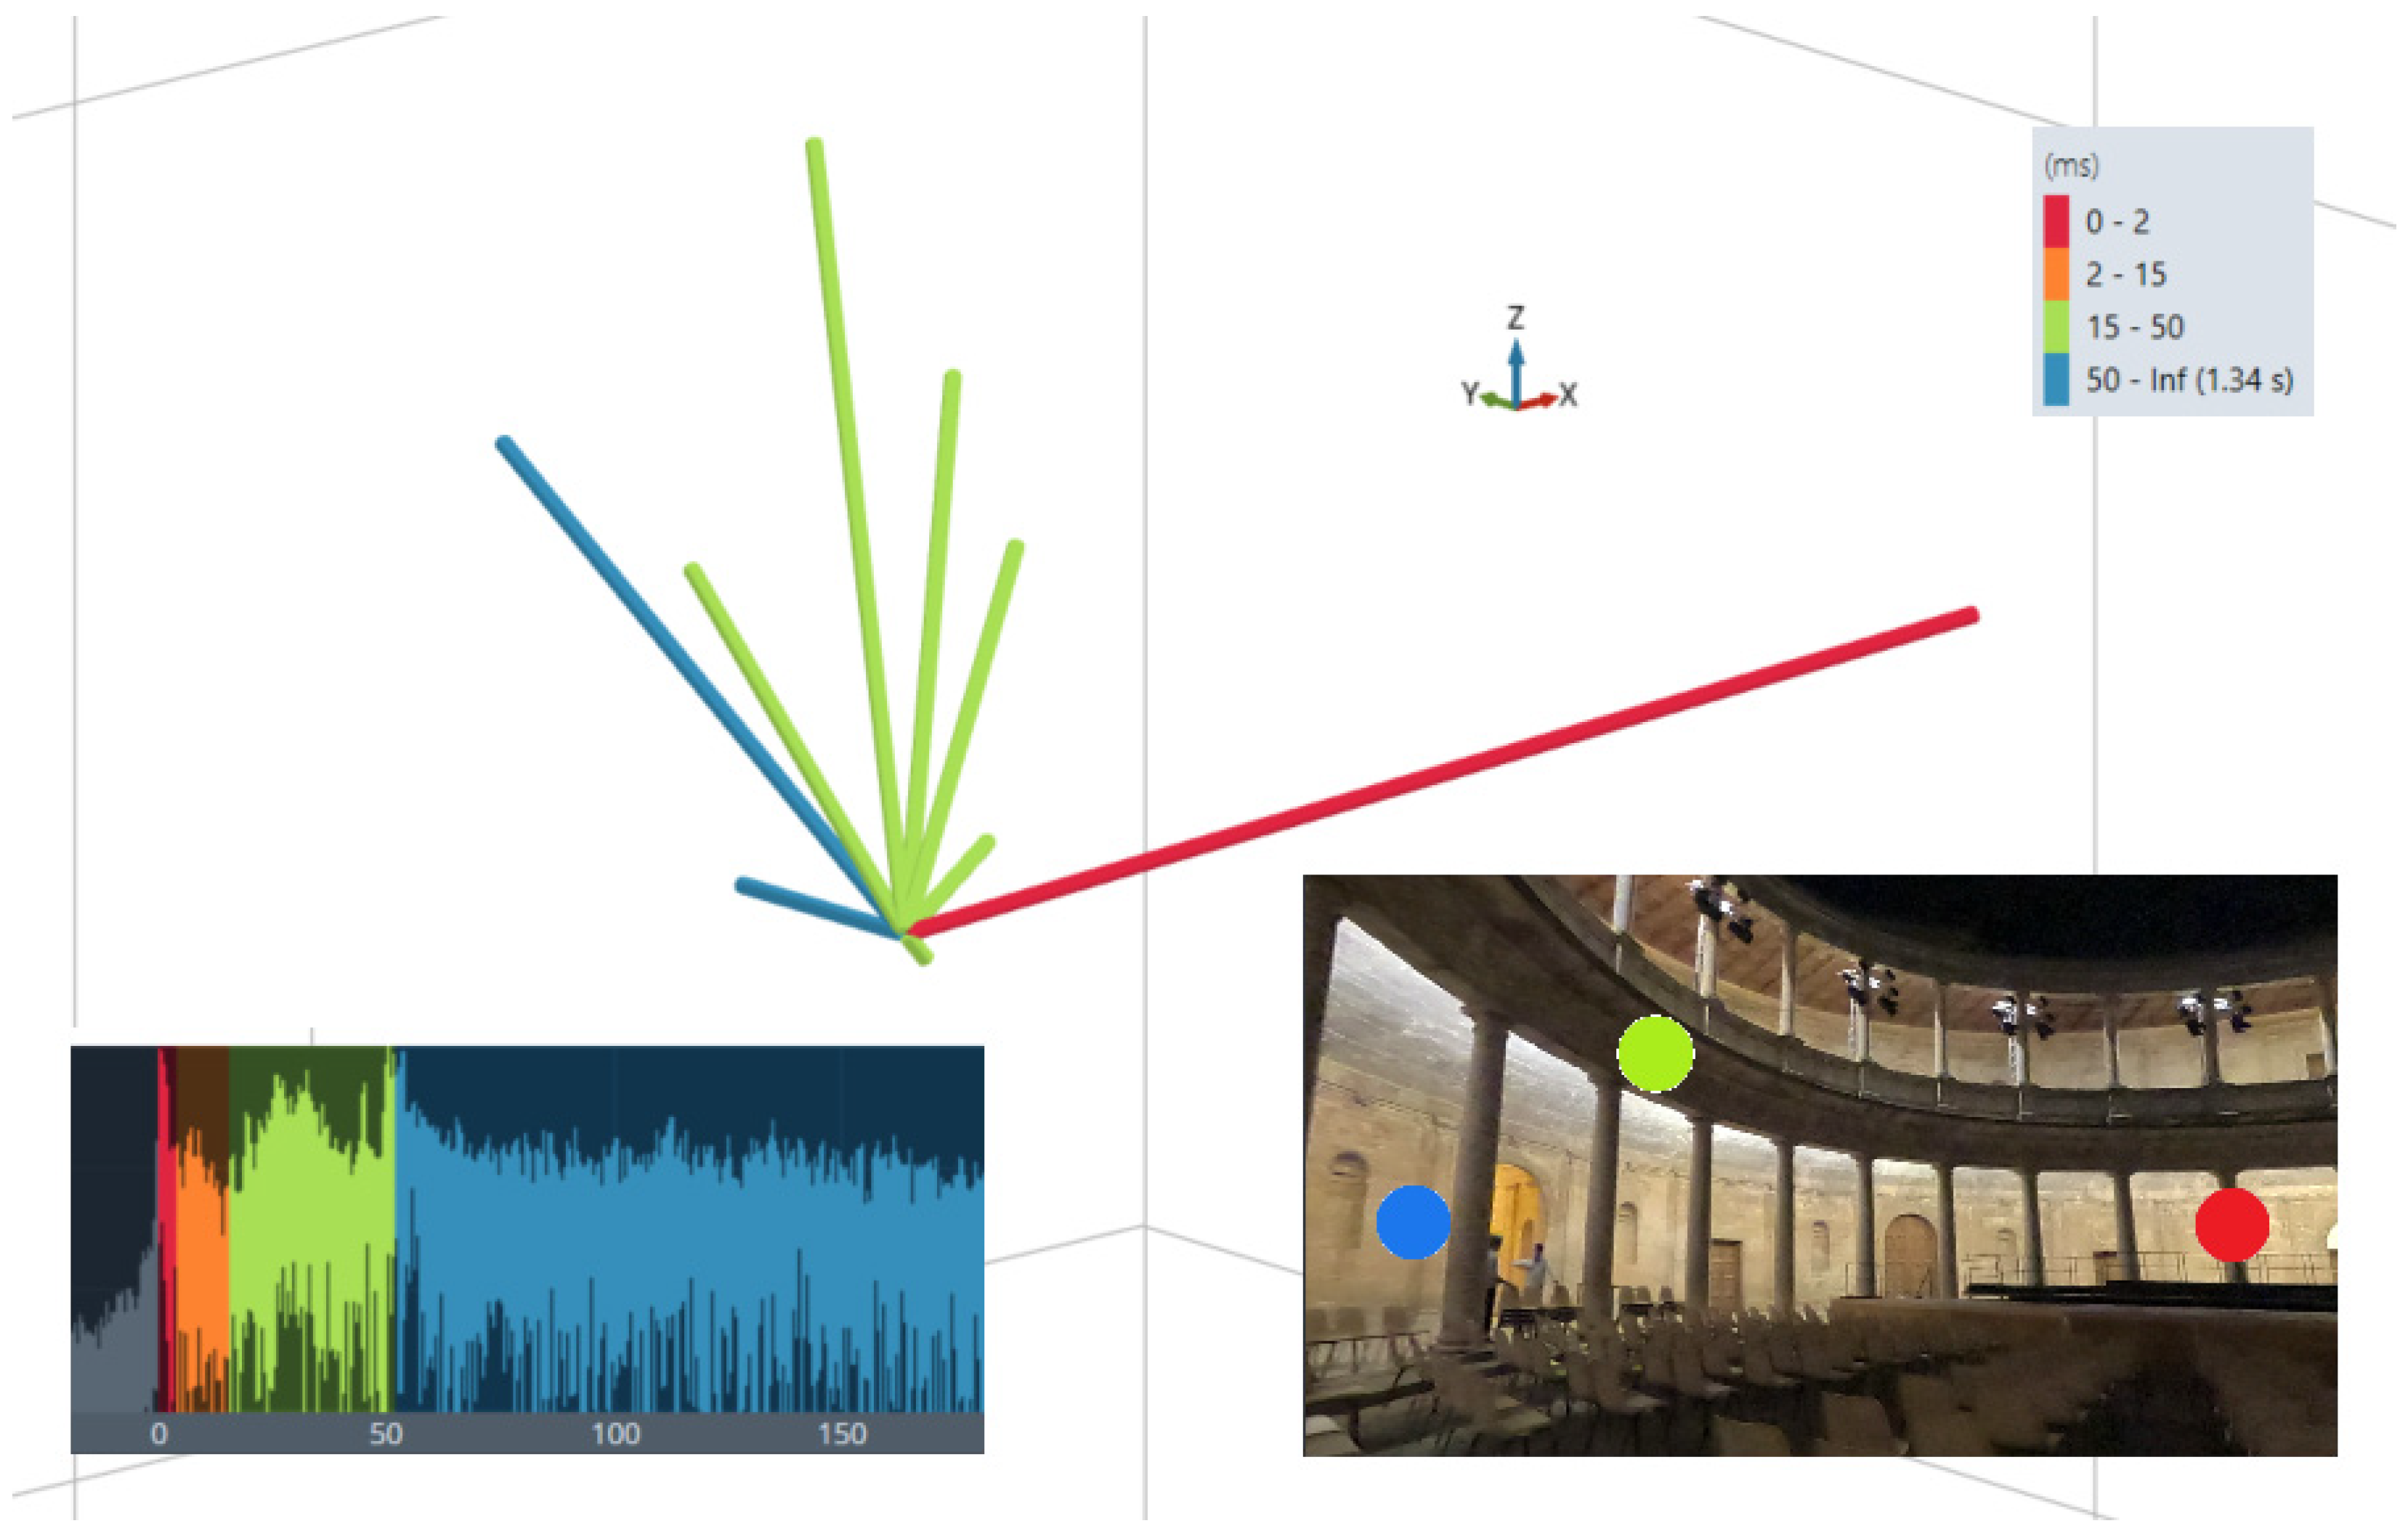
19]. Recording of Ambisonic RIR allows the reconstruction of the sound field and the estimation of the direction-of-arrival (DOA) of the reflections [
20]. This also allows the calculation of the impulse responses of virtual microphones, such as dipoles for lateral fraction or binaural microphones by Menzer and Faller [
21], enabling the calculation of IACC or auralisation. Other reasons to keep Ambisonic RIRs are documentation and safeguarding of the historical heritage, visualisation of spatial information such as the research by Martellotta [
22] or Alary and Valimaki [
23], or using different available 3D reproduction techniques to recreate concerts, as shown by Tronchin and Farina [
16].
There is not a lot of research regarding the room acoustics of heritage places that are not designed for music or speech transmission. Previous work by Iannace [
24] showed that historical courtyards can be used for concerts without acoustic issues and good feedback from the performers. Heritage places have different sizes and shapes, and can even be open-air or squares. Most of them were not thought to be used for music or even speech transmission. Those singularities may suggest that their acoustics and their suitability for different kinds of music should be studied in each heritage place. Suitability, in this case, should be interpreted as ‘eignung’, used in sound quality. Blauert [
25] groups sound-quality aspects into several degrees of abstraction. The same author [
26] explores the idea of the composers and performers using the acoustic properties of a room to relay messages to the audience. Musical programmers should also take decisions based on the venues they have available. Farina [
27] and Pätynen-Lokki [
28] moved forward to improve the understanding of the relationship between measurements and preferred acoustics.
Lots of research has been carried out for historical concert hall acoustic measurements and there are some guidelines such as those by Pompoli and Prodi [
29], but not too much concerning cultural heritage places not built as concert halls, excluding churches and different religious buildings as some guidelines for churches [
30], cathedrals [
31] and mosques [
32] exists. The main musical use of the Palace is for orchestral music but it is also used for opera, jazz, flamenco or even rock [
33].
This paper aims to review the physical descriptors that may explain the different and high aural quality of the Palace. The claim of good acoustics in the place is something explained in every guided visit, but it had never been scientifically researched. The descriptors used in this paper are included in the ISO 3382-1 [
9] and the IEC 60268-16 [
34] standards. The focus will be on measuring the objective parameters and discussing the results but the chance of safeguarding the acoustics must not be wasted. Ambisonic room impulse responses (RIR) were computed, used to estimate the direction of arrival of several reflections and to calculate the IACC. The Palace and its use as a concert hall will be discussed as part of this introduction. The material and Methods section will explain the tests made during the measurement campaign. The results and Discussion section will explain the outcomes with attention to the singularities of the space. Finally, some conclusions will be set forth.
1.1. The Palace of Charles V and the Alhambra of Granada
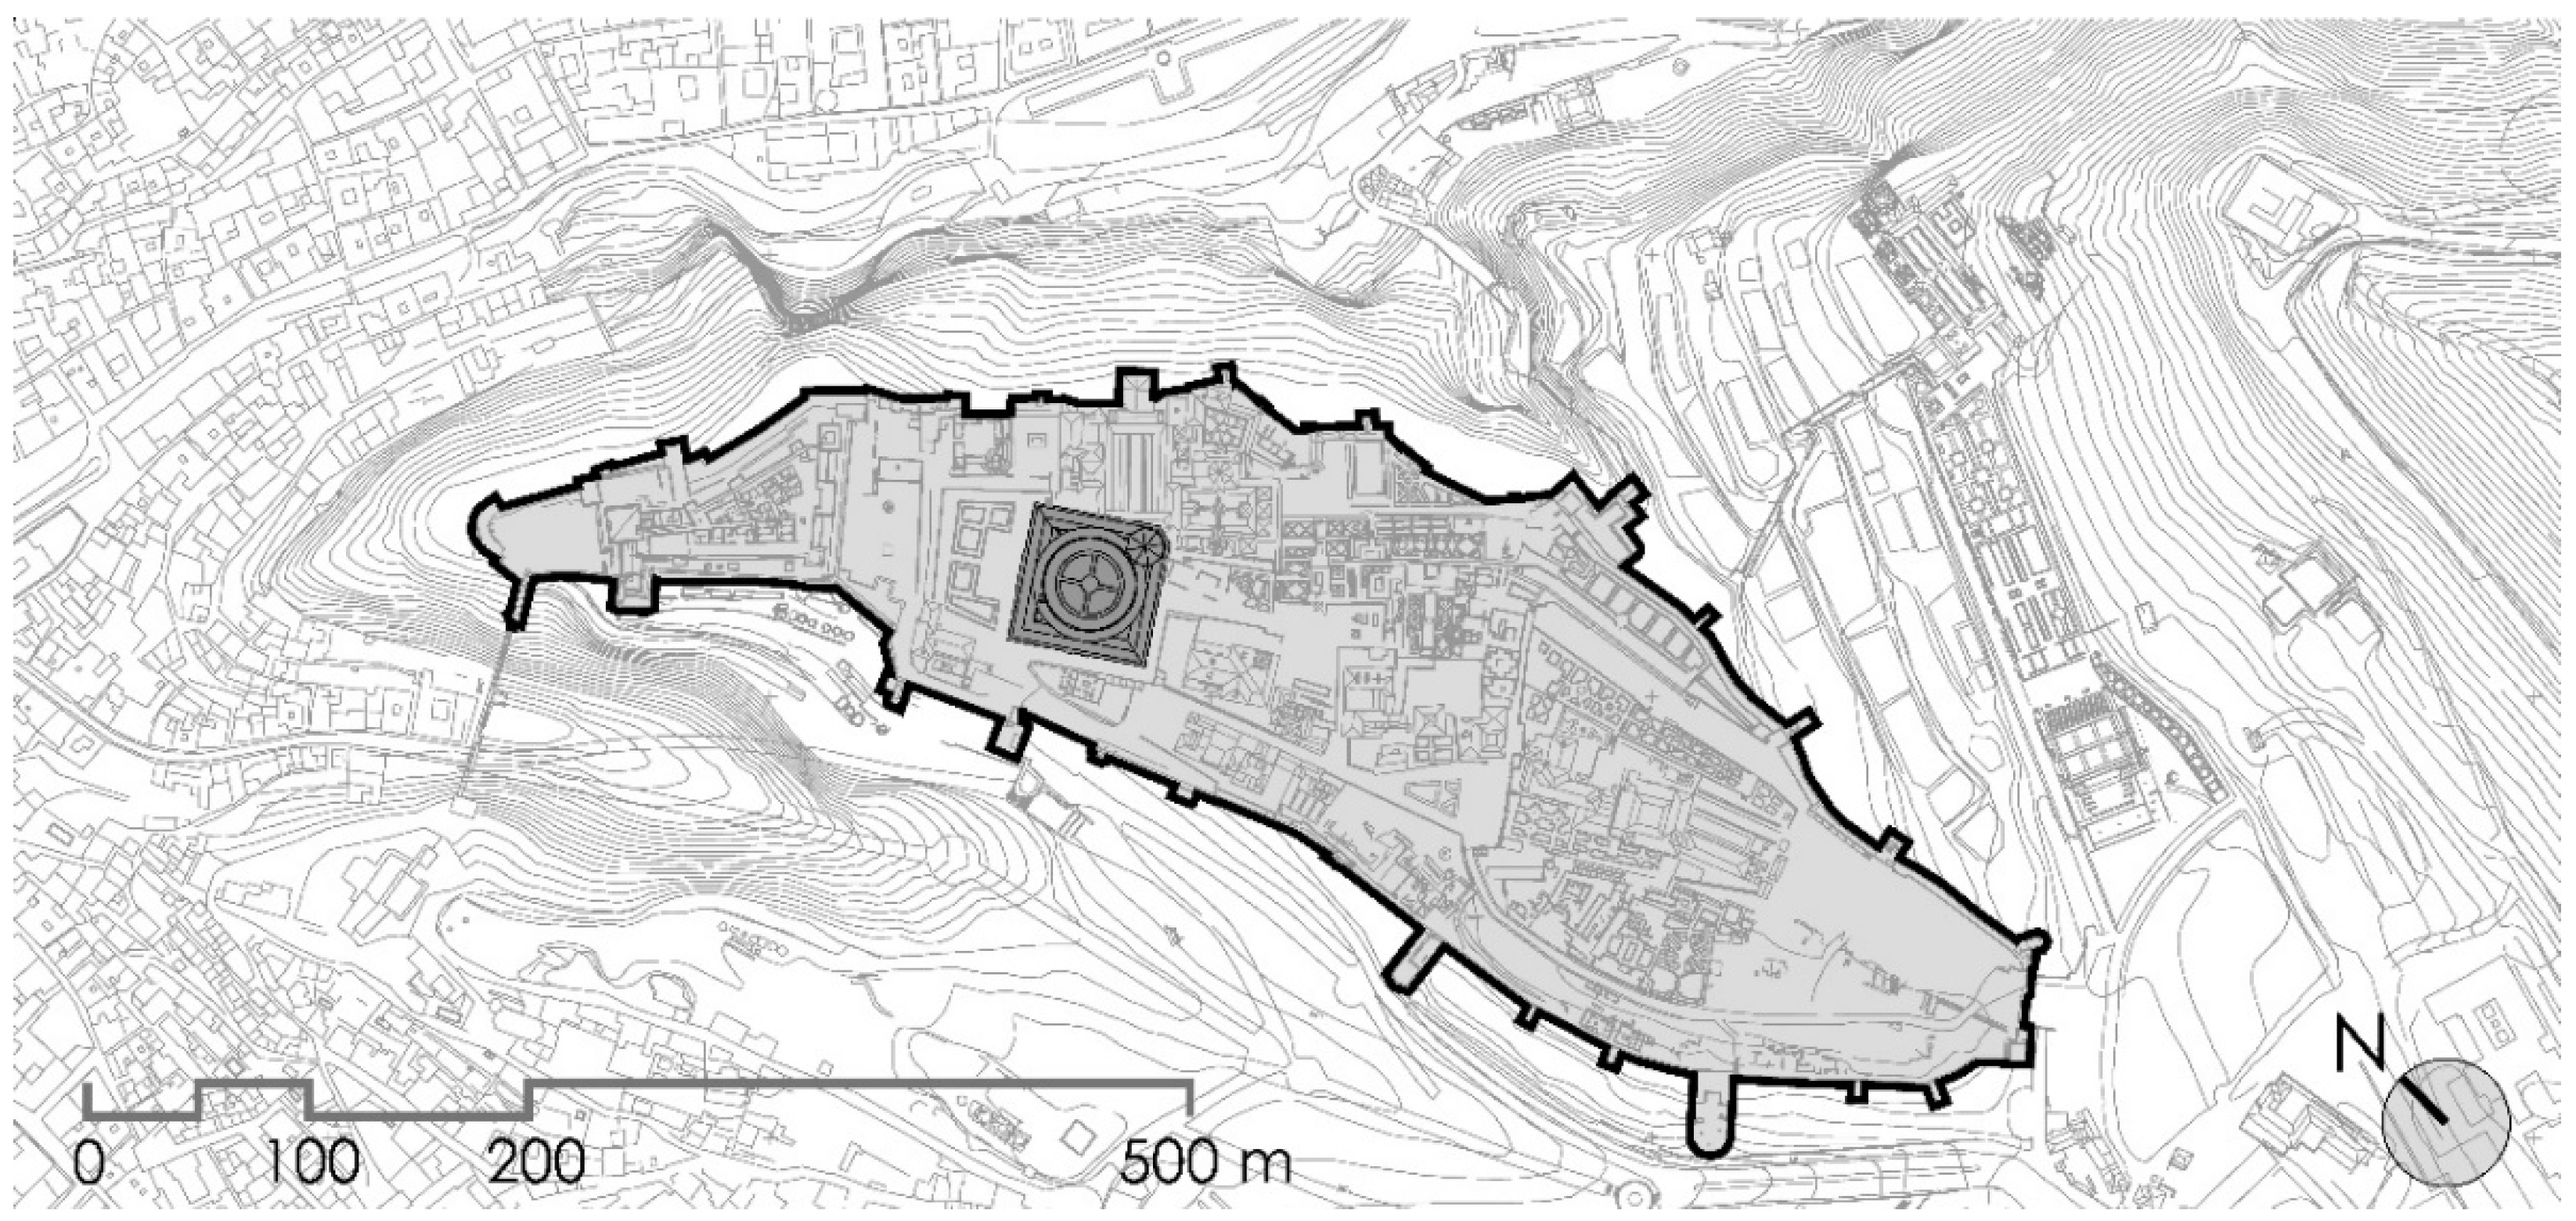
On both sides of the river Darro rise two hills that have seen several cultures throughout the history of the city. The Albaycín hill, where the city started, and the Sabica hill. The fortification of the Alhambra is on the Sabica hill. Inside, the Palace of Charles V is located (see
Figure 1), an example of the best Italian Renaissance in Spain. Names such as Enrique de Egas, Diego de Siloé and Pedro Machuca have imprinted the history of the construction of the Palace in the style of the best Italian Renaissance. More information about the building and its historical circumstances can be found in the work by Rosenthal [
35] and Brothers [
36].
In 1637, the construction process was finally abandoned due to the decline in the Spanish Empire and political factors. We owe the appearance of the Palace that we admire today to Leopoldo Torres Balbás and later to Francisco Prieto Moreno, who finally carried out a master plan for the Palace restoration, including the covering (the roof), all between 1923 and 1958. The first known musical event held in the Palace of Charles V was in 1883 as part of the city’s Corpus Christi festival. It was also used to hold international flamenco competitions, such as the one held in 1922 by García Lorca, Manuel de Falla, Andrés Segovia and other intellectuals of that time. More recently, every year since 1952, the International Festival of Music and Dance of Granada has been using it as a concert hall. In this important musical event, the Palace of Charles V always occupies a central position. According to the local press [
37], Daniel Barenboim said “The sound of the Palace of Charles V is much better than that of many enclosed halls. The shape of its walls makes it a wonderful acoustic shell.”
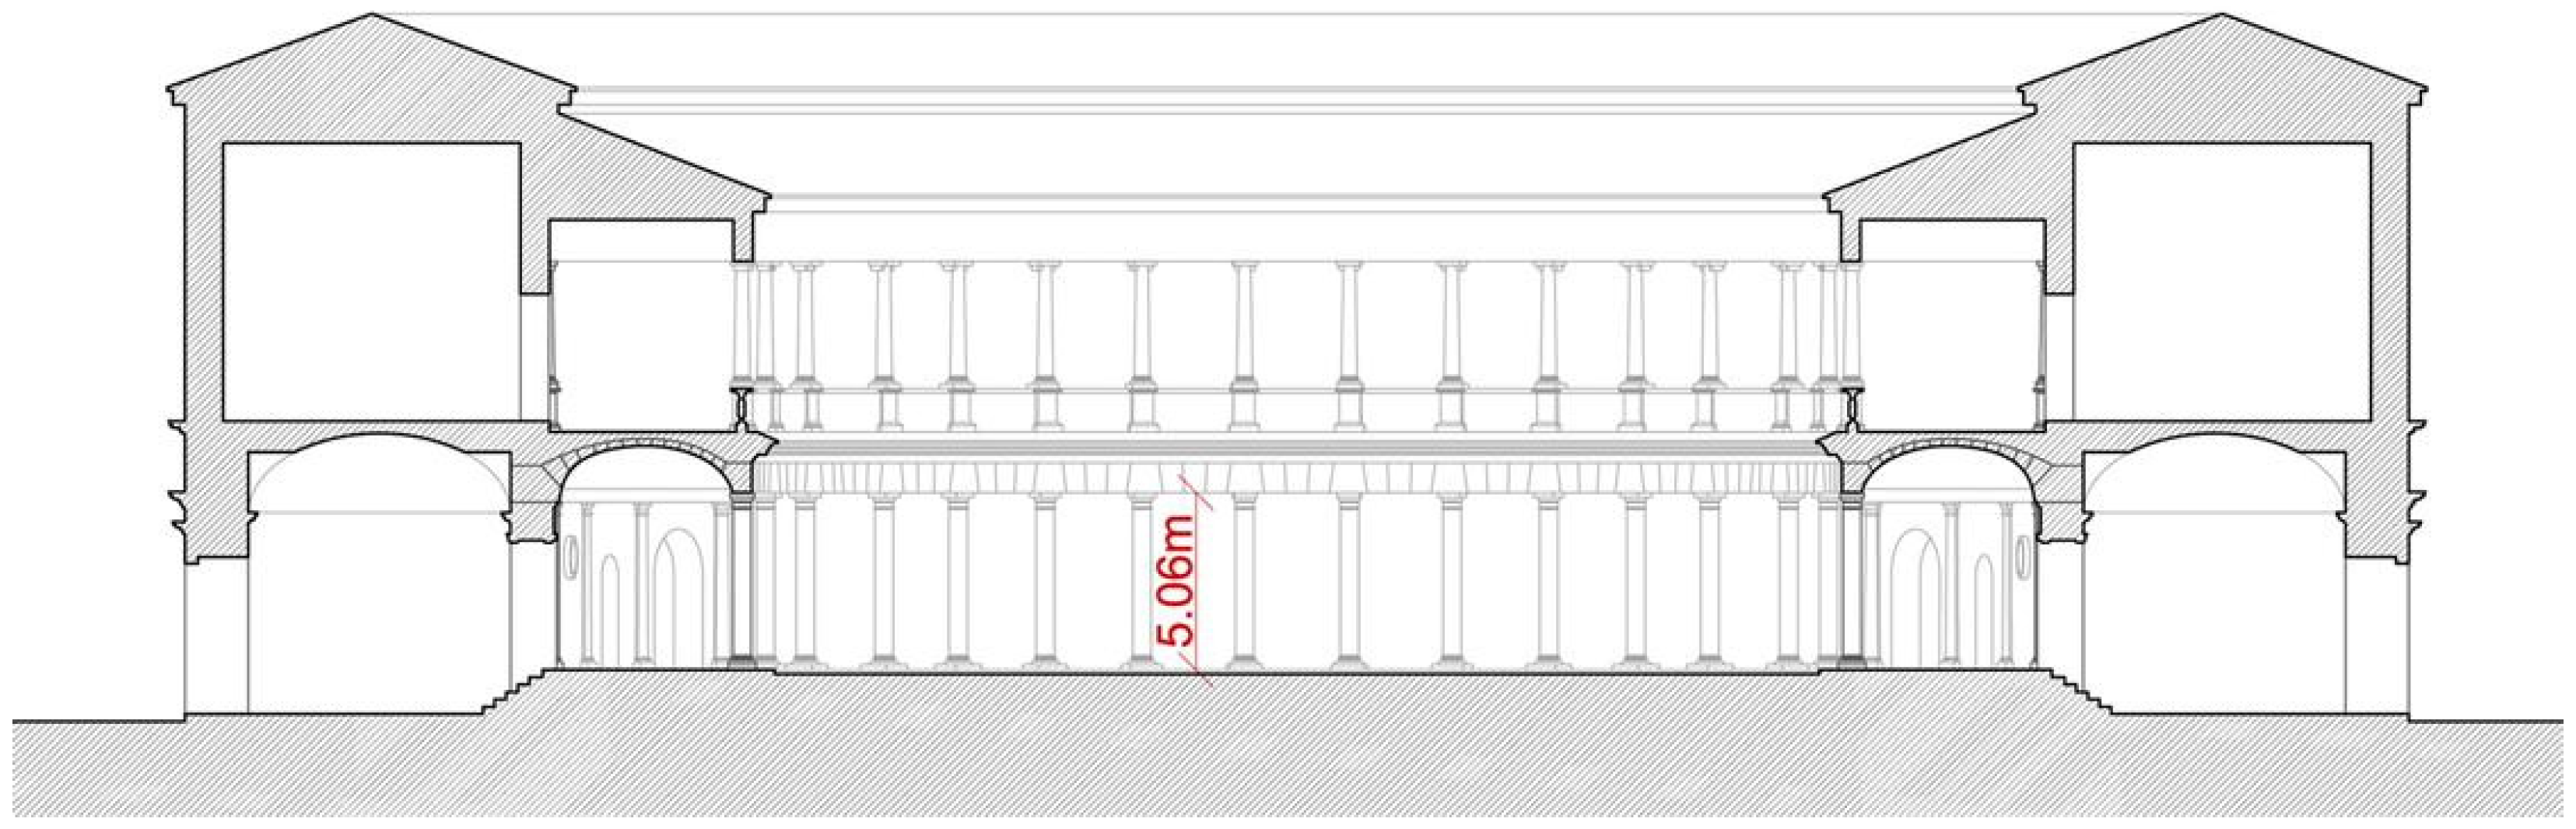
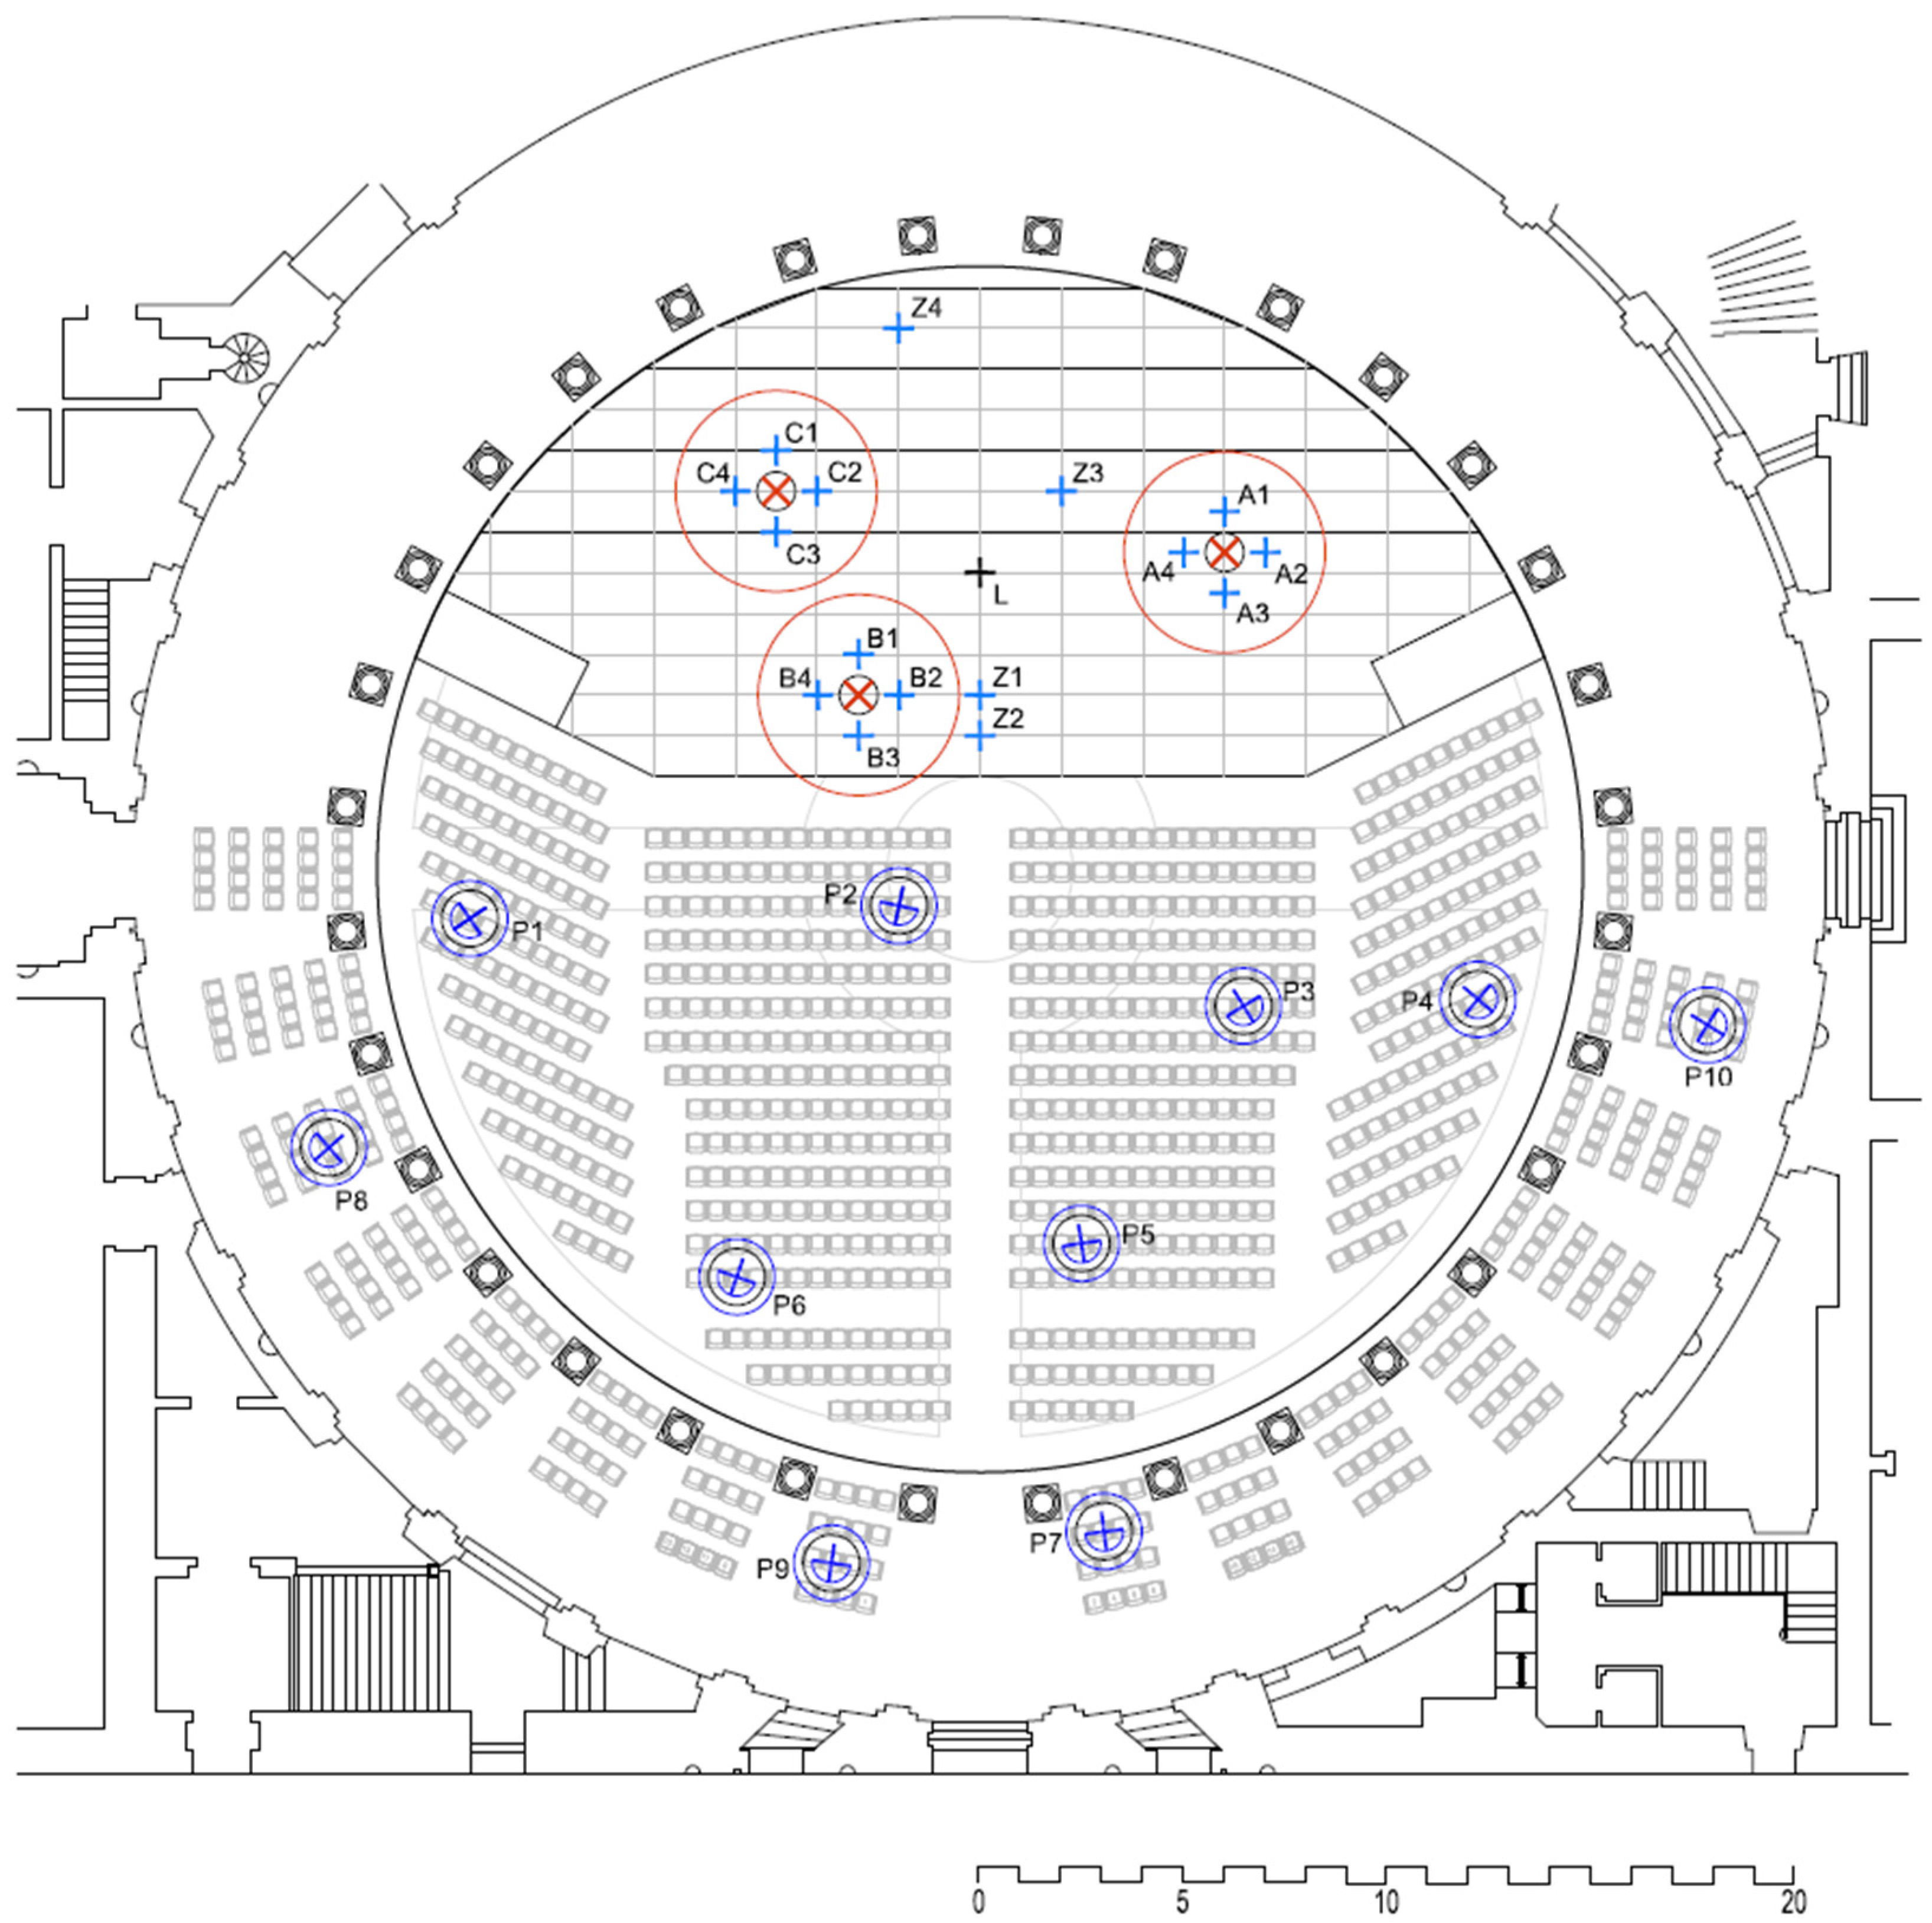
The space used as a concert hall is circular and open-air with a diameter of 30 m (see
Figure 2). On its perimeter, there is a 5 m wide porticoed gallery covered with a toroidal vault with basket-handle arches whose height from the keystone to the floor is 5.80 m. On the upper floor, another porticoed gallery crowns the building, this time covered by recent wooden porticoes and wooden coffered ceilings from 1958. The entire solid cylinder enclosing the interior of the arcaded galleries is around 17,907 m
3 (see
Table 1), with built-in stone with bas-reliefs, half-columns and pediments framing various openings to the interior of the palace.
The cylinder enclosing the interior of the courtyard is a sequence of voids between stone columns and other elements enclosing the galleries. In the interior cylinder of the courtyard, the closing element located halfway up the building, between heights of 5 and 8.12 m, stands out, with a thickness of more than 3 m; this is the group of friezes, triglyphs and metopes that cover the development of the bell-shaped arches of the toroidal vault, together with the height of the parapet. Most of the concerts are orchestral music but some others can include public address systems. The sound engineers working at the Palace deal with the strong delayed reflections and reverberation using high-directivity line arrays. The PA projects are not straightforward as they must cover the central area but also the second floor. This is problematic for rock but especially flamenco concerts.
1.2. Audience
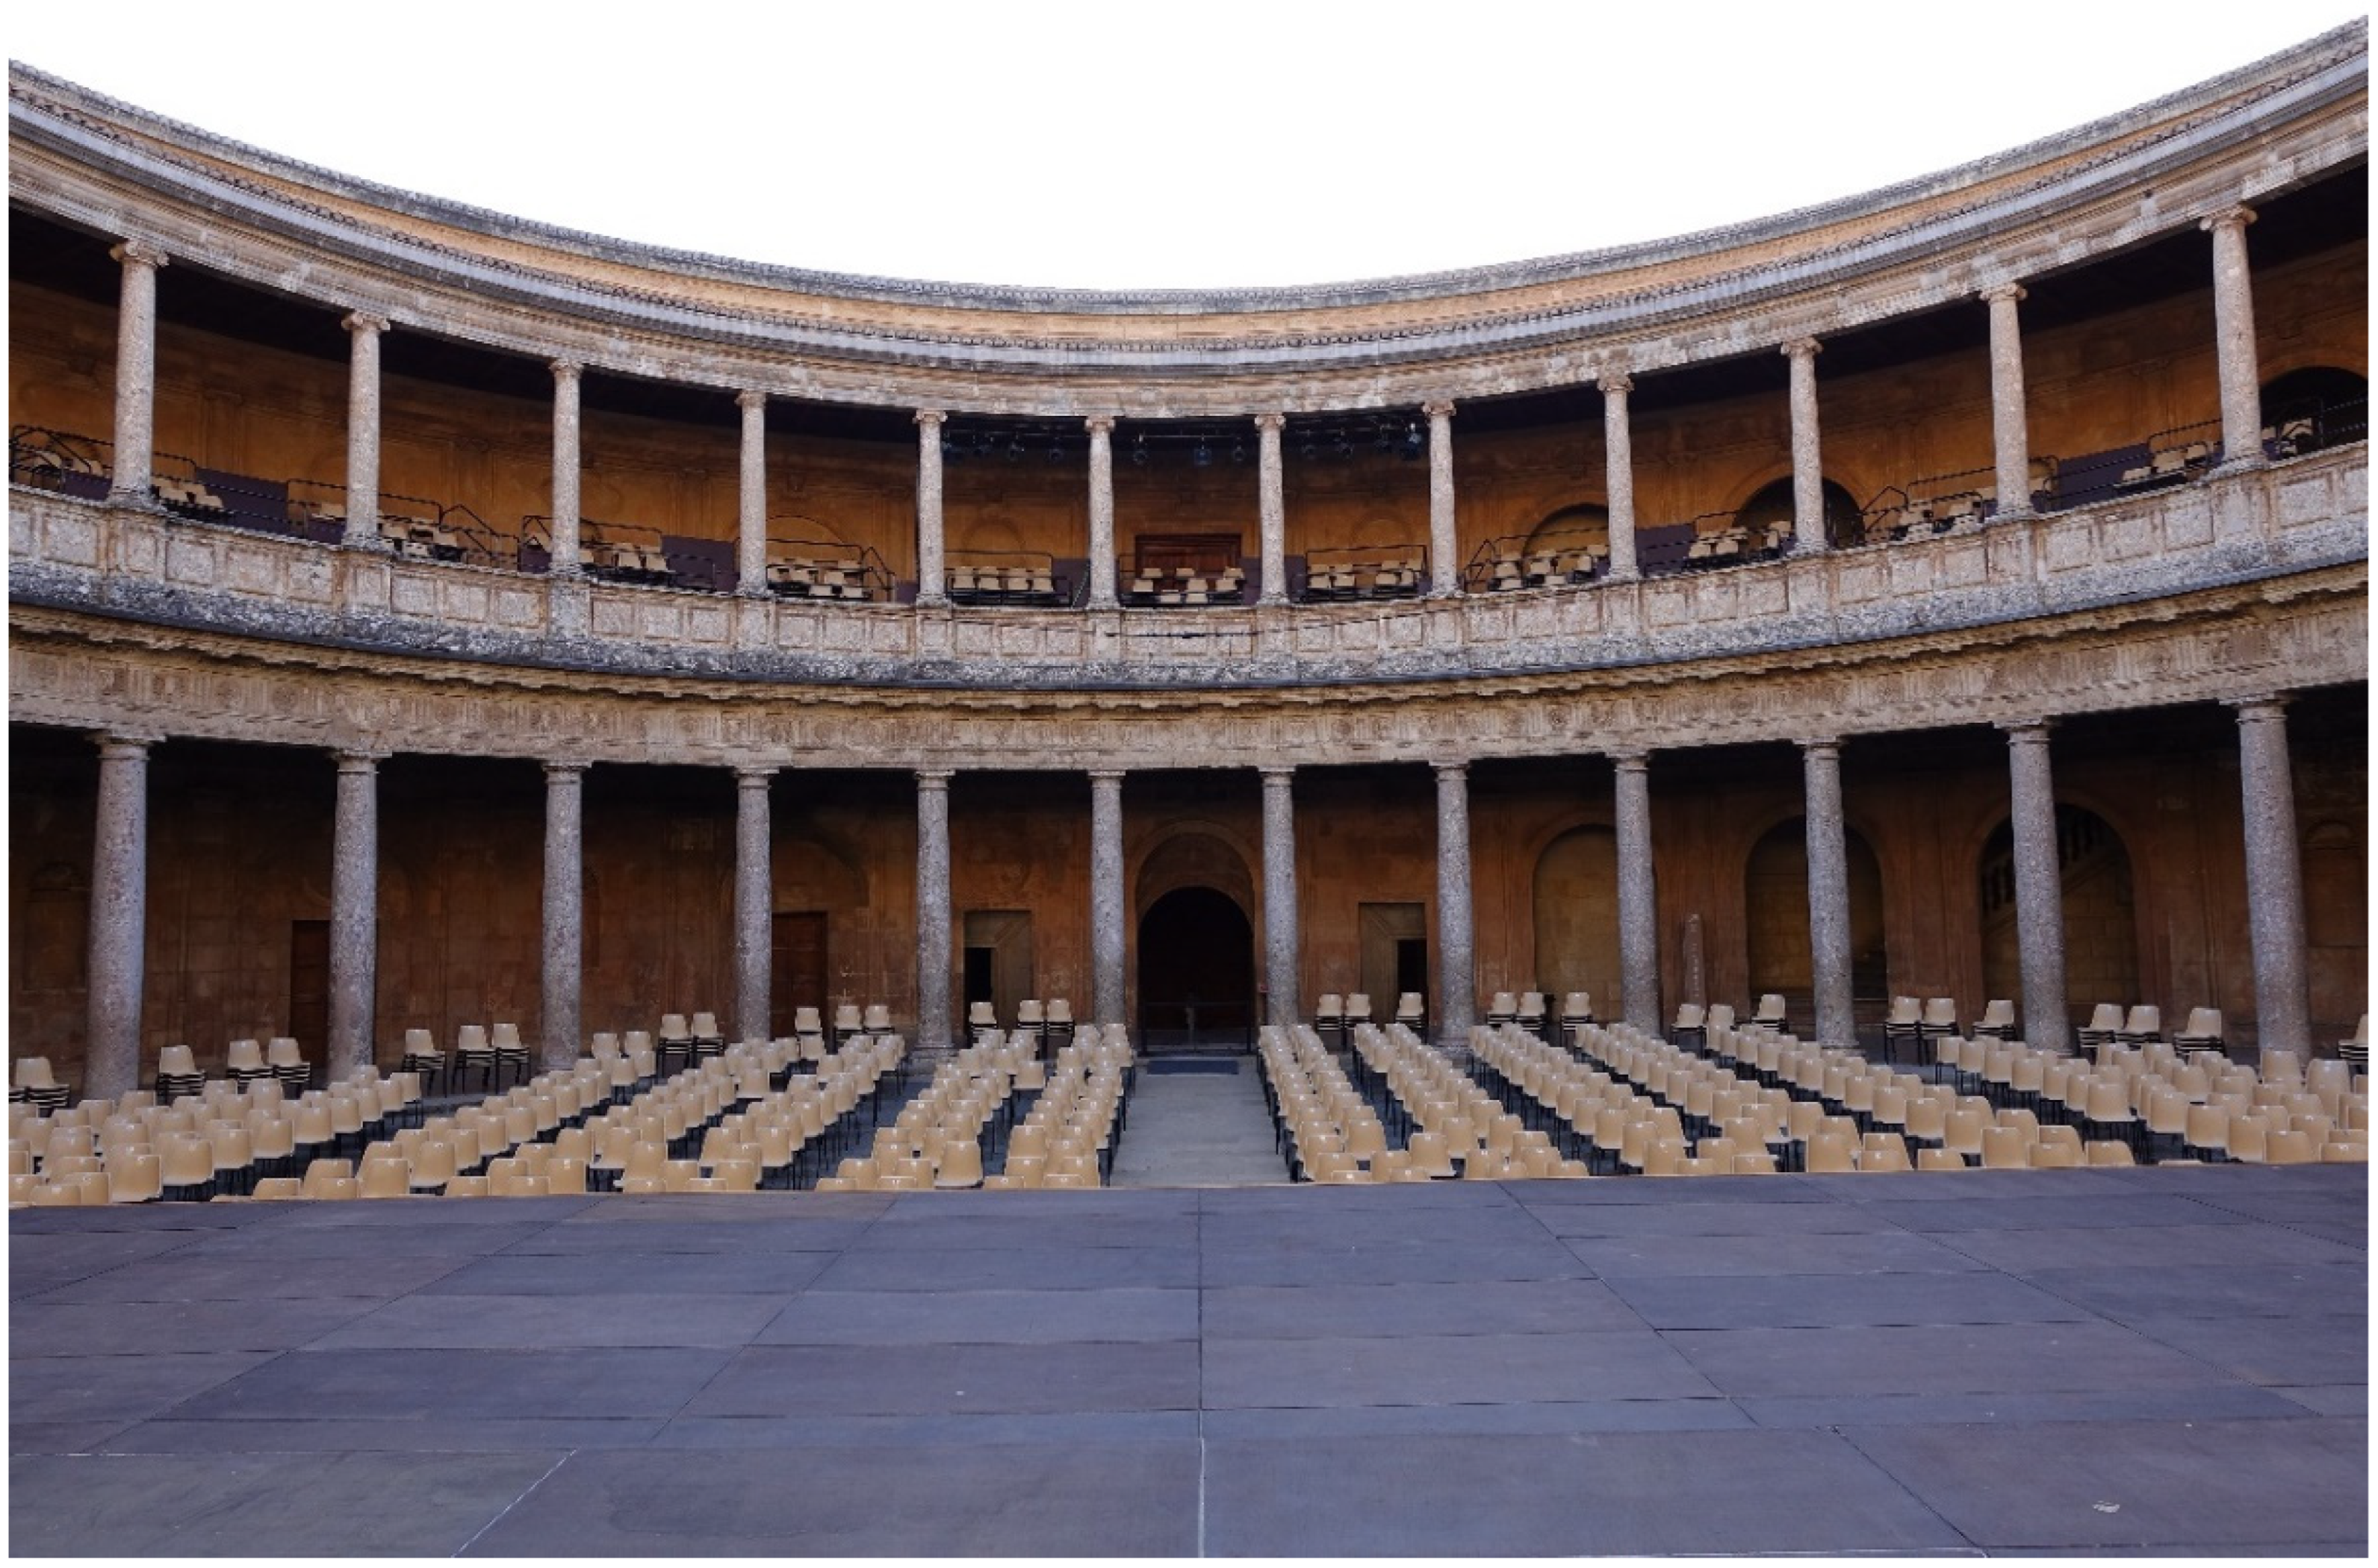
The layout for the concerts has slight variations every year. The maximum audience is 1200 people, but restrictions due to COVID-19 had a big impact on the audience size in terms of distance among members of the audience. Being an open-air venue helped to safely keep enough seats and did not affect the layout. A big proportion of the audience is located in the patio; there are side stalls in the lower gallery and an audience arch in the upper floor gallery. All of the audience is seated on plastic chairs. On the upper floor, the chairs are on grandstands to enable the visibility of the stage (see
Figure 3).
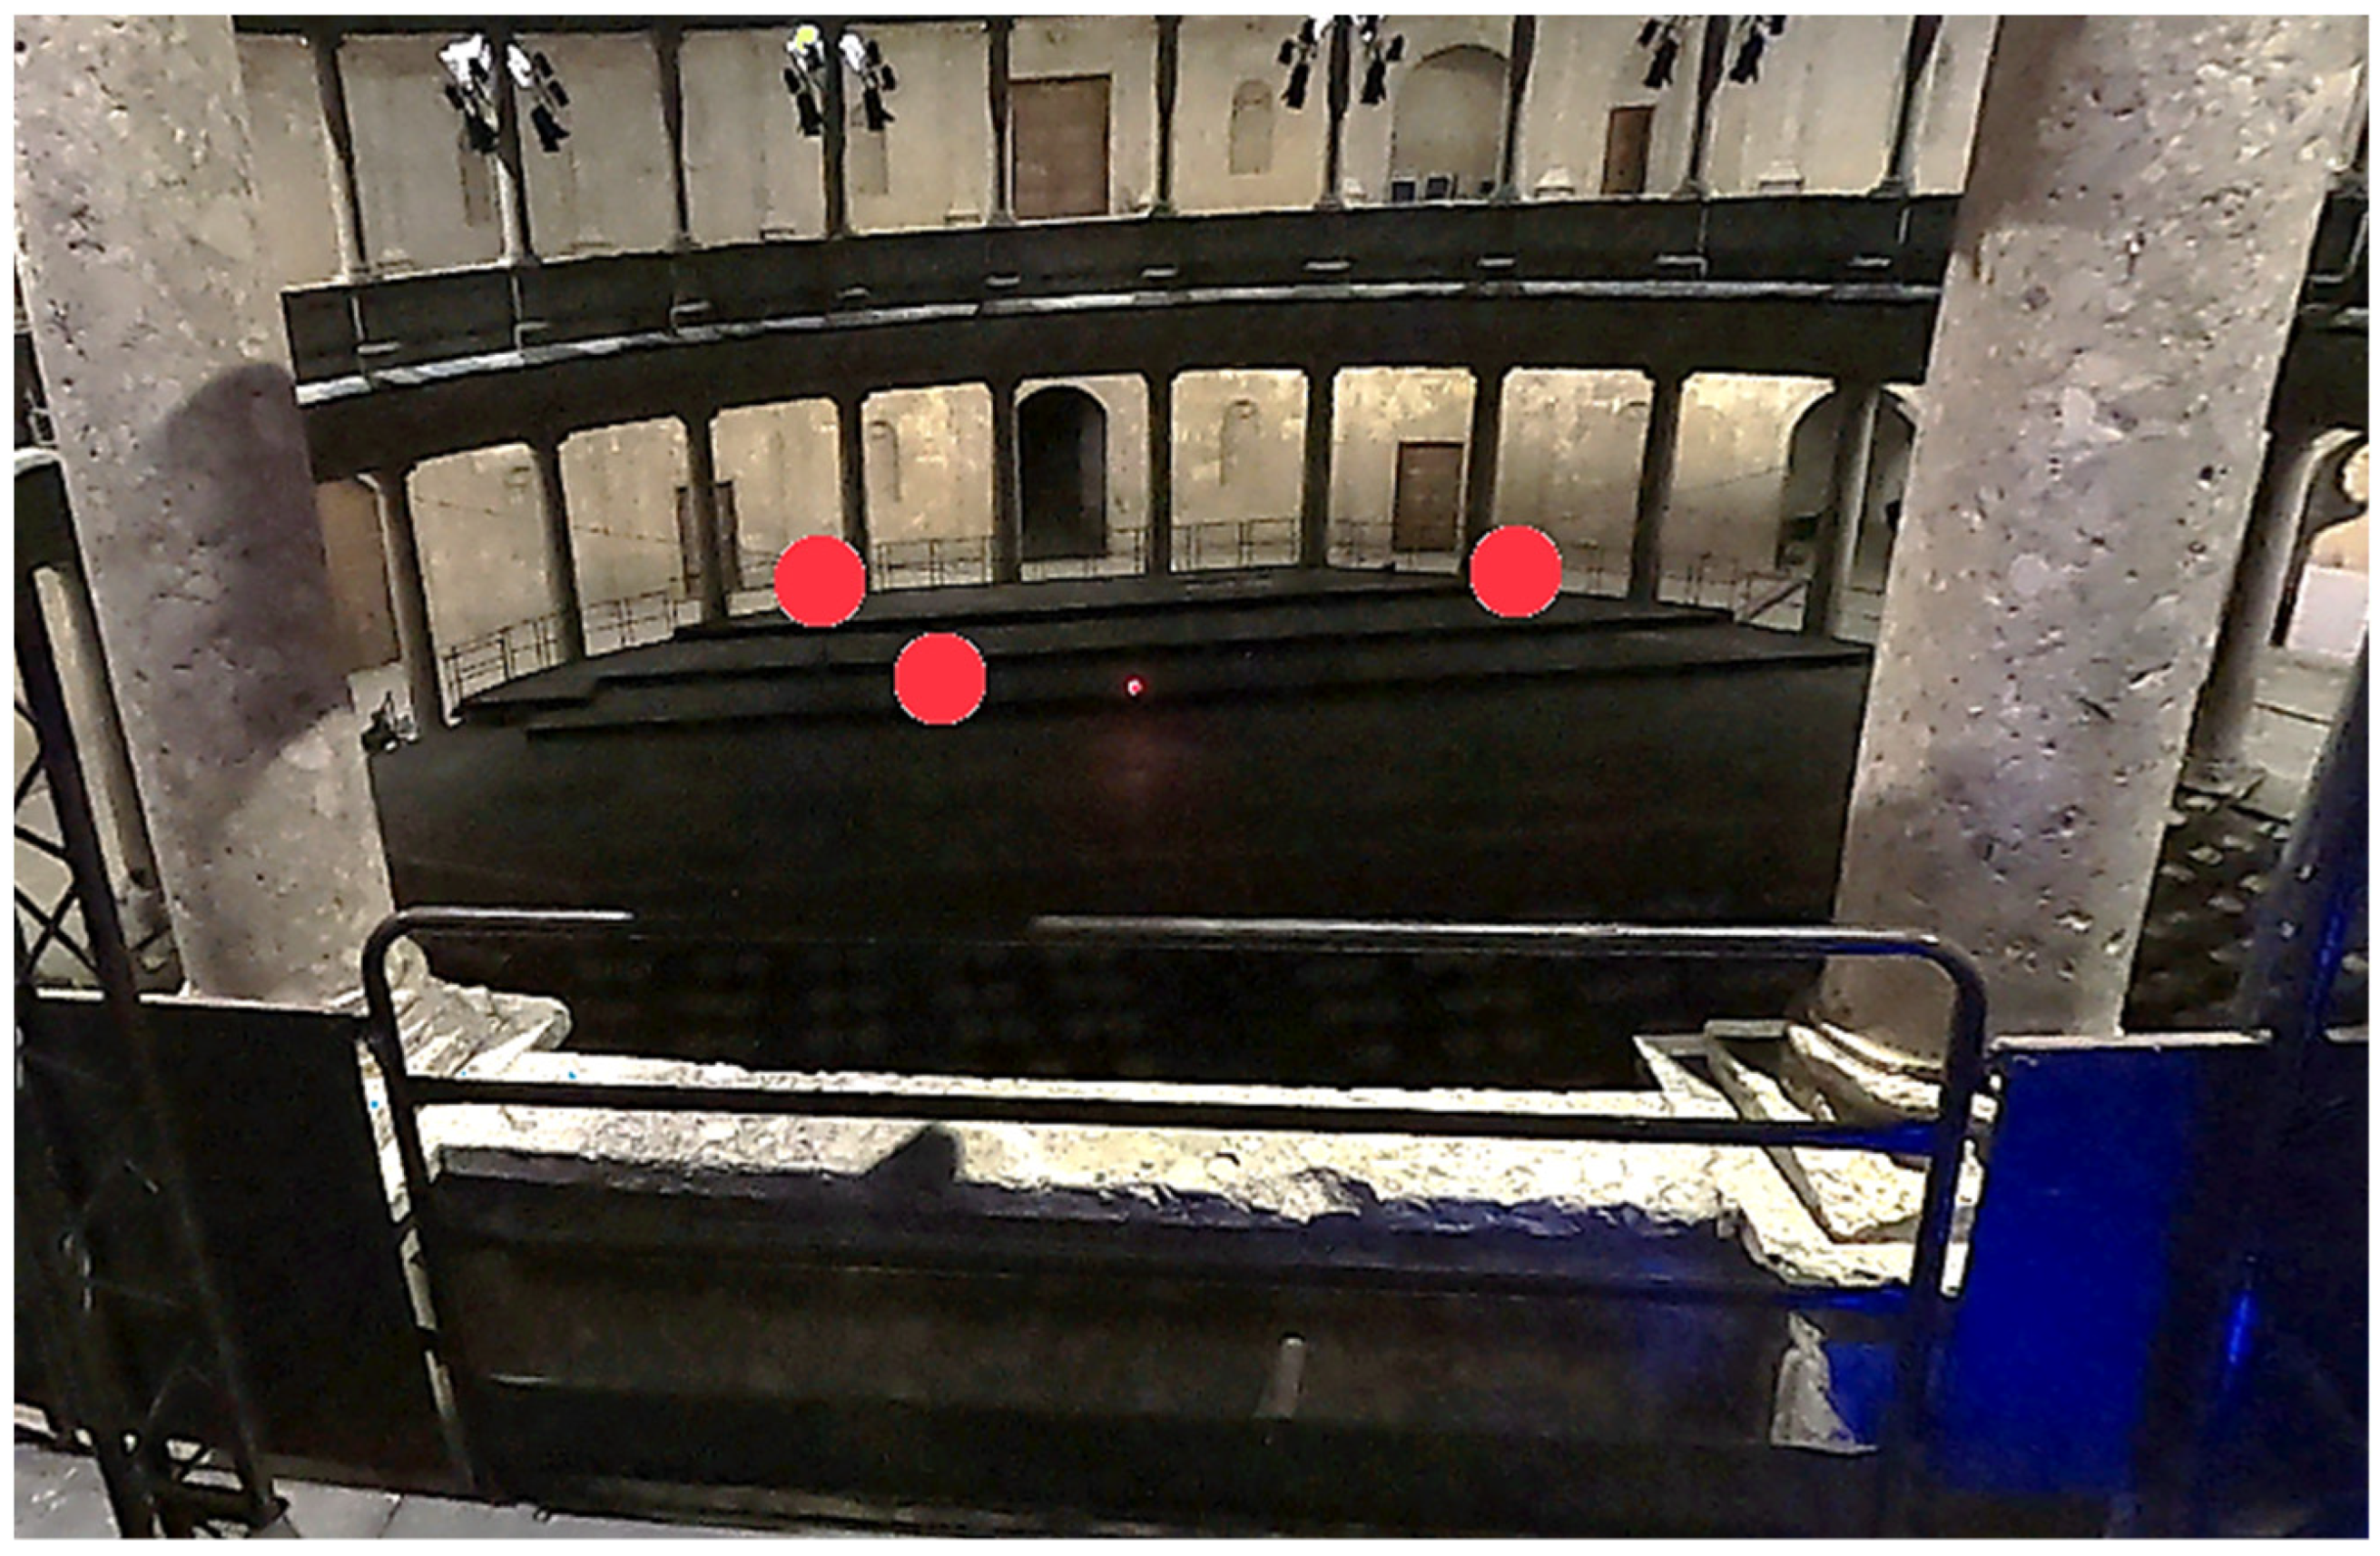
1.3. Stage
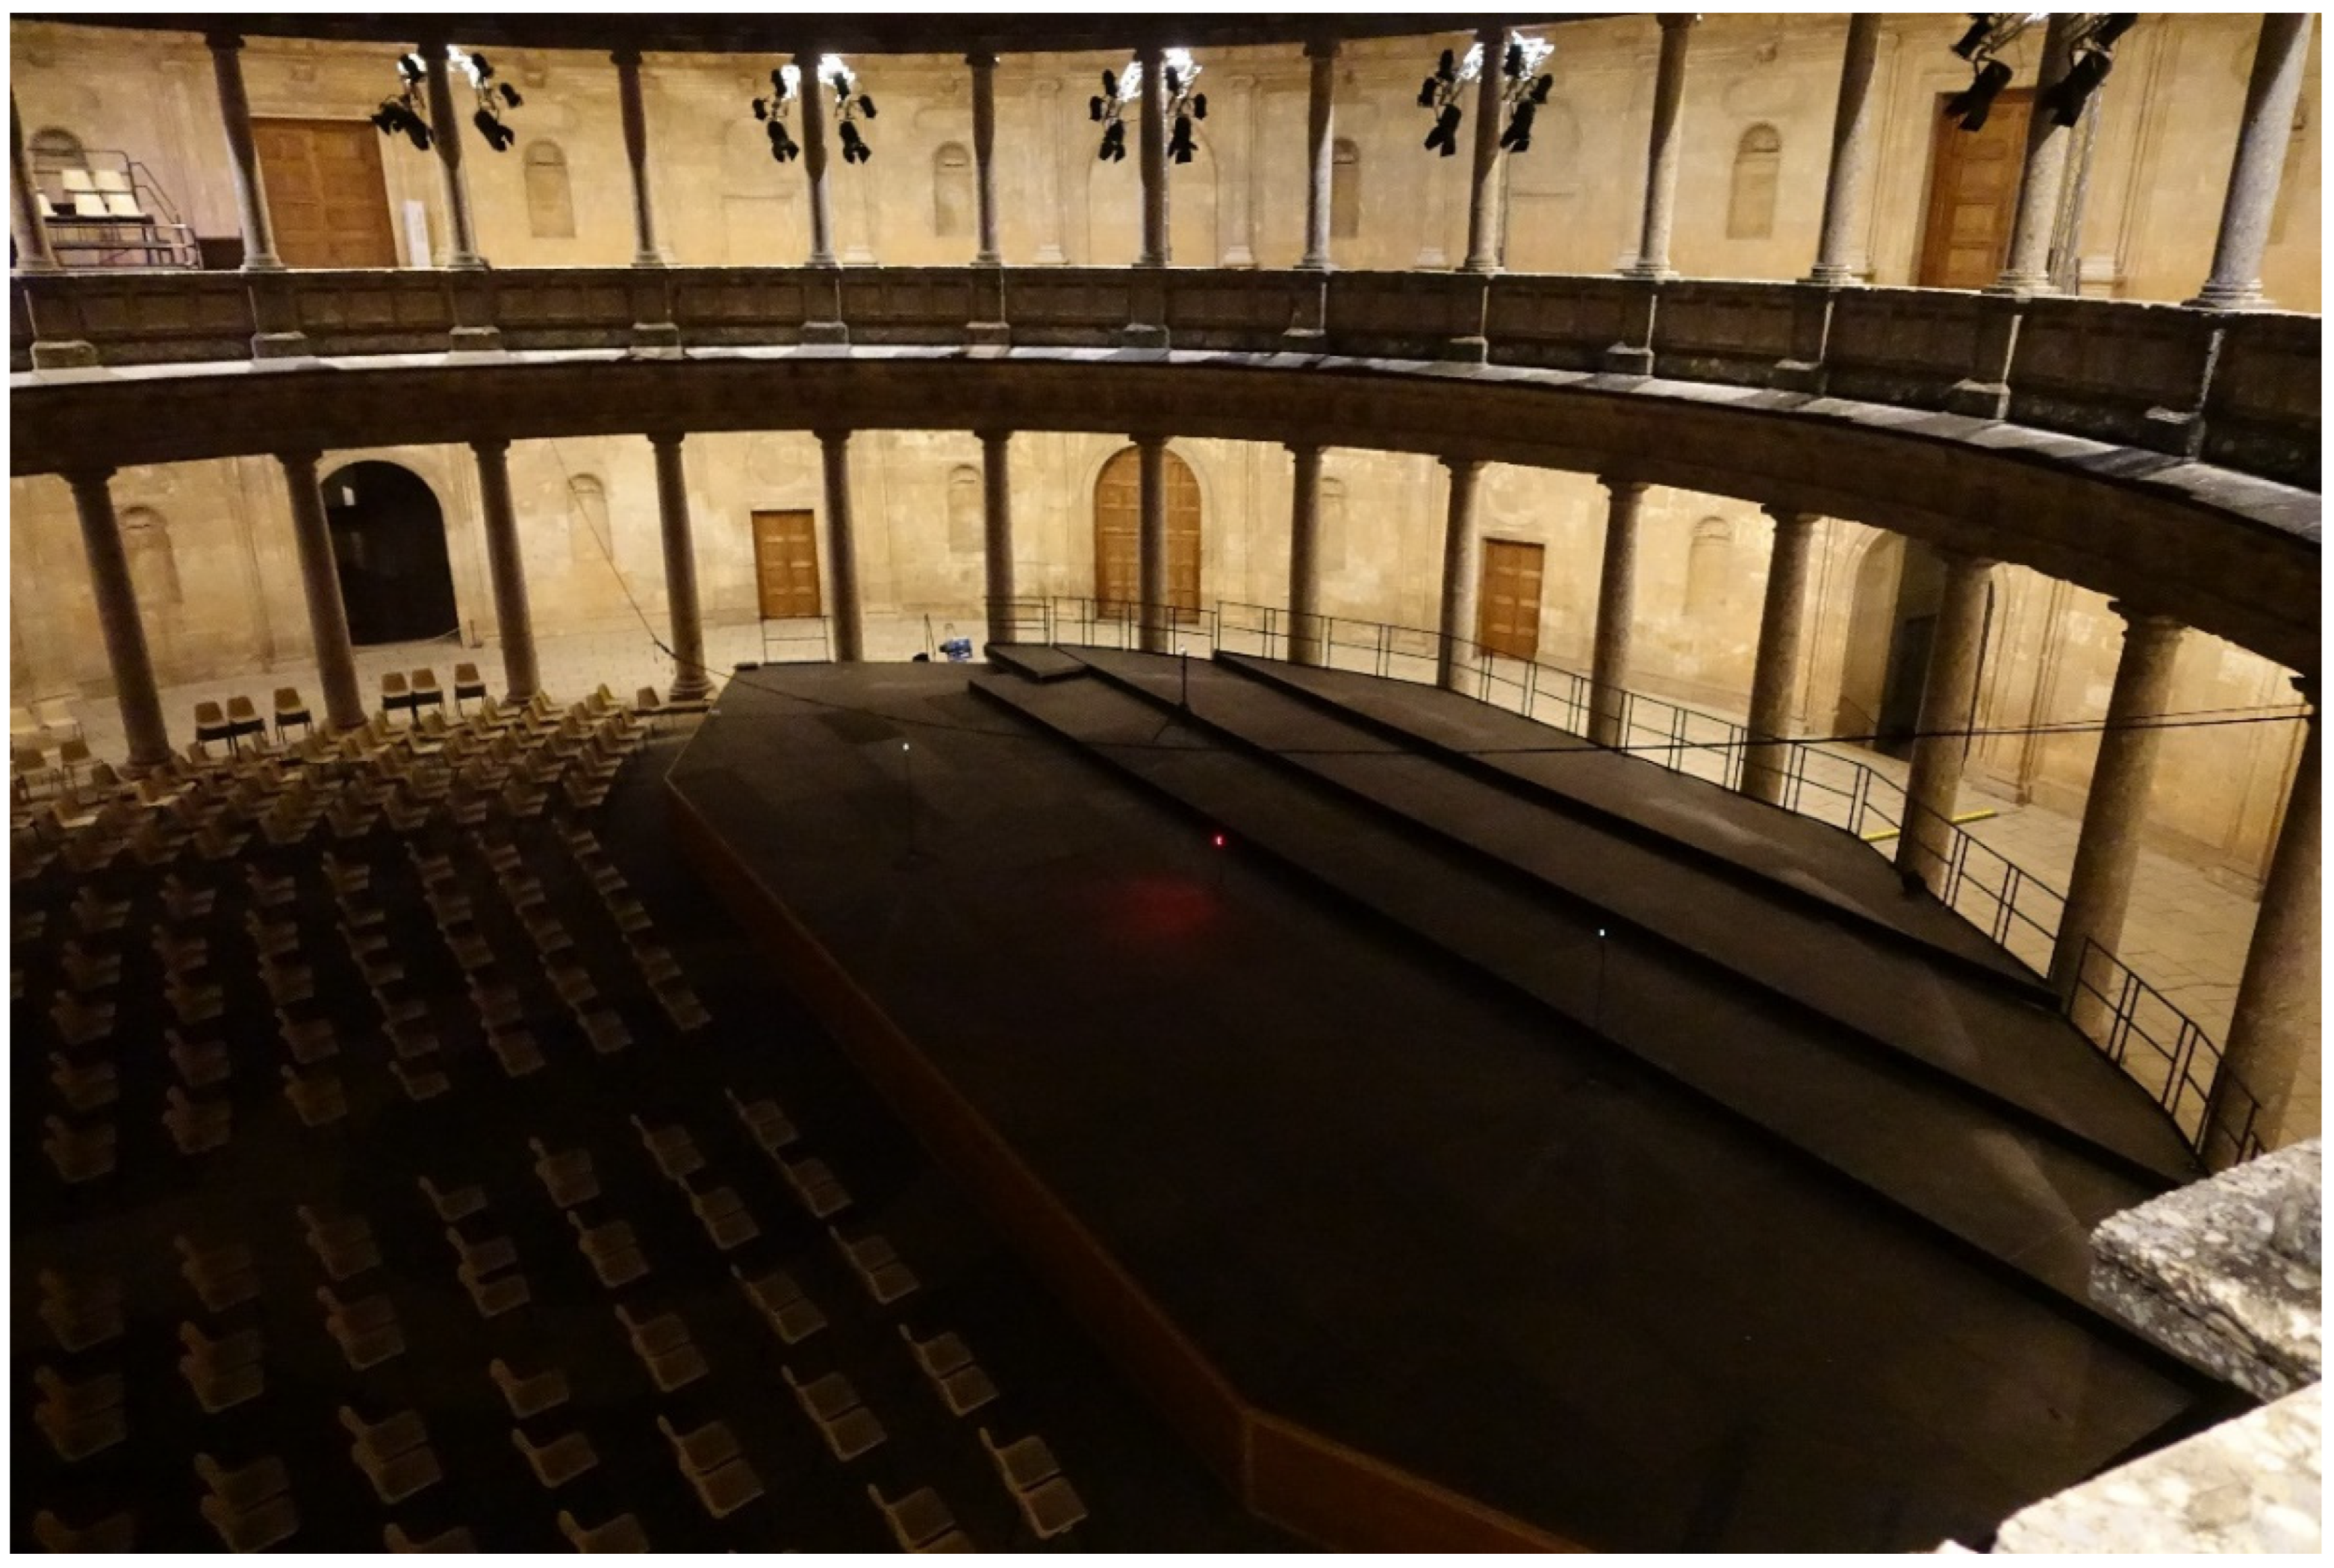
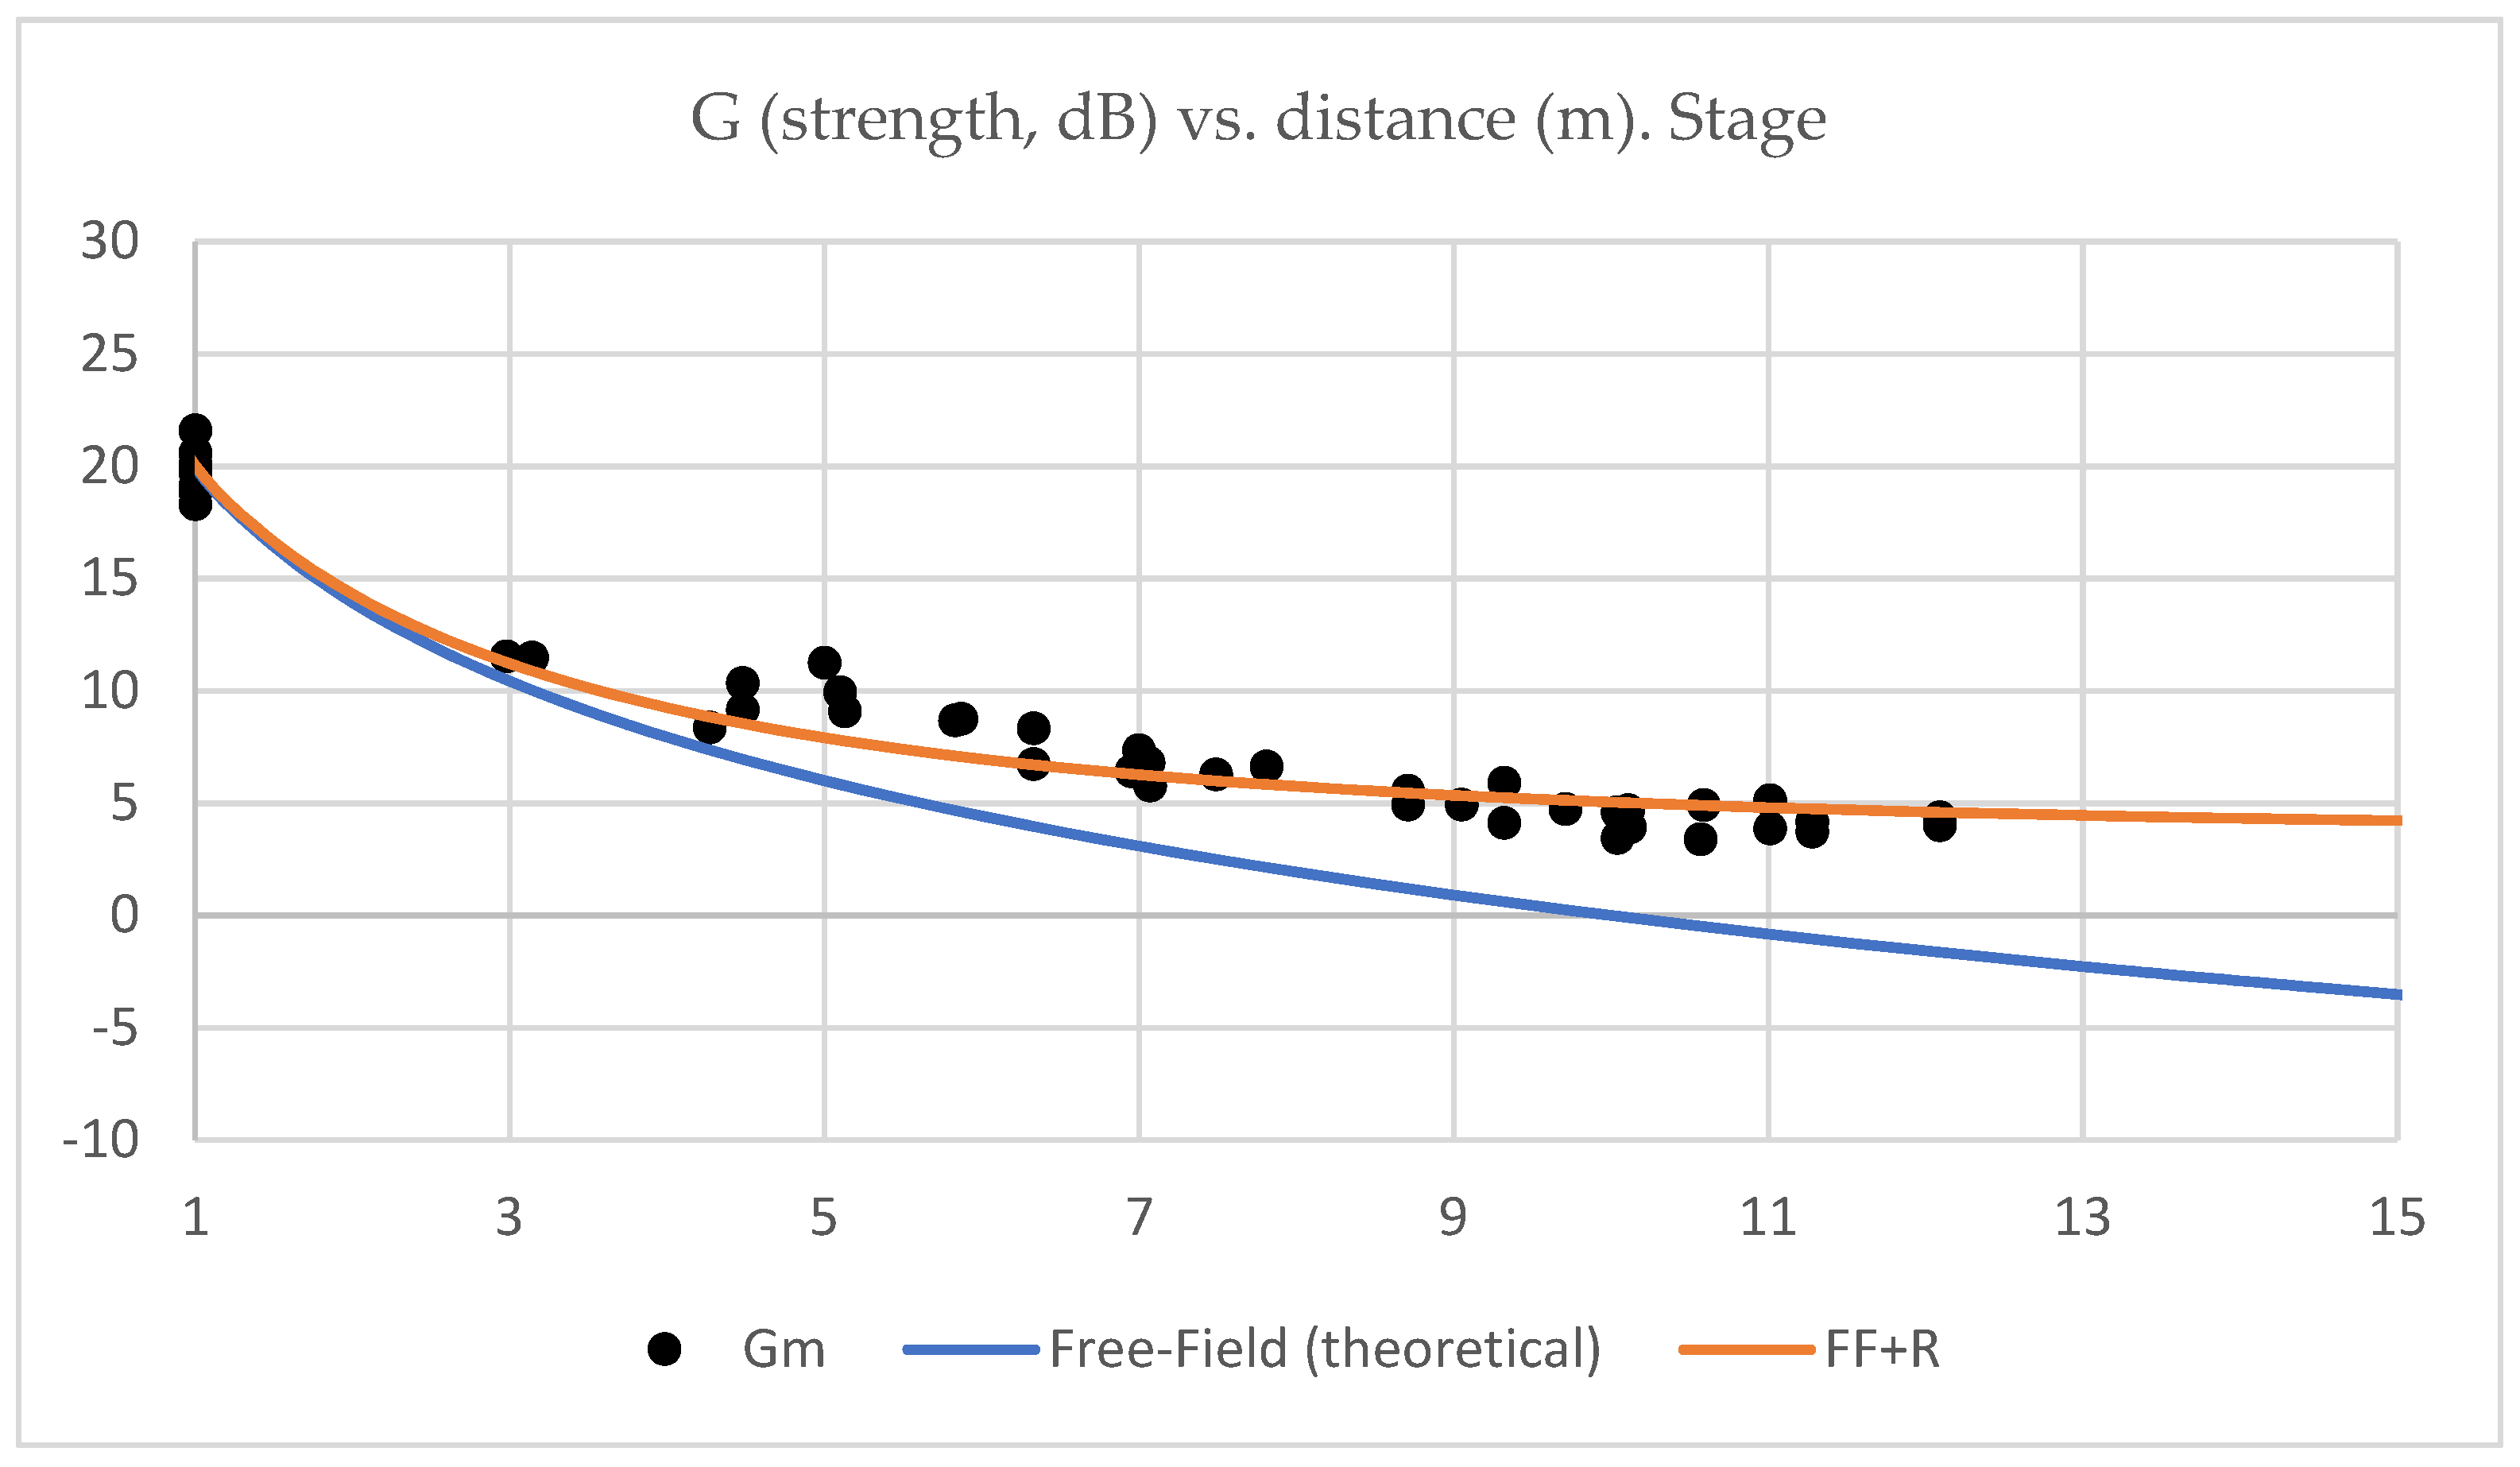
The stage is wide and covers an important part of the open-air central patio (
Figure 4). The particular geometry of the stage makes the stage acoustics of the Palace quite singular. Some performers can be quite near, while others can be more than 20 m away from a given musician in the orchestra.
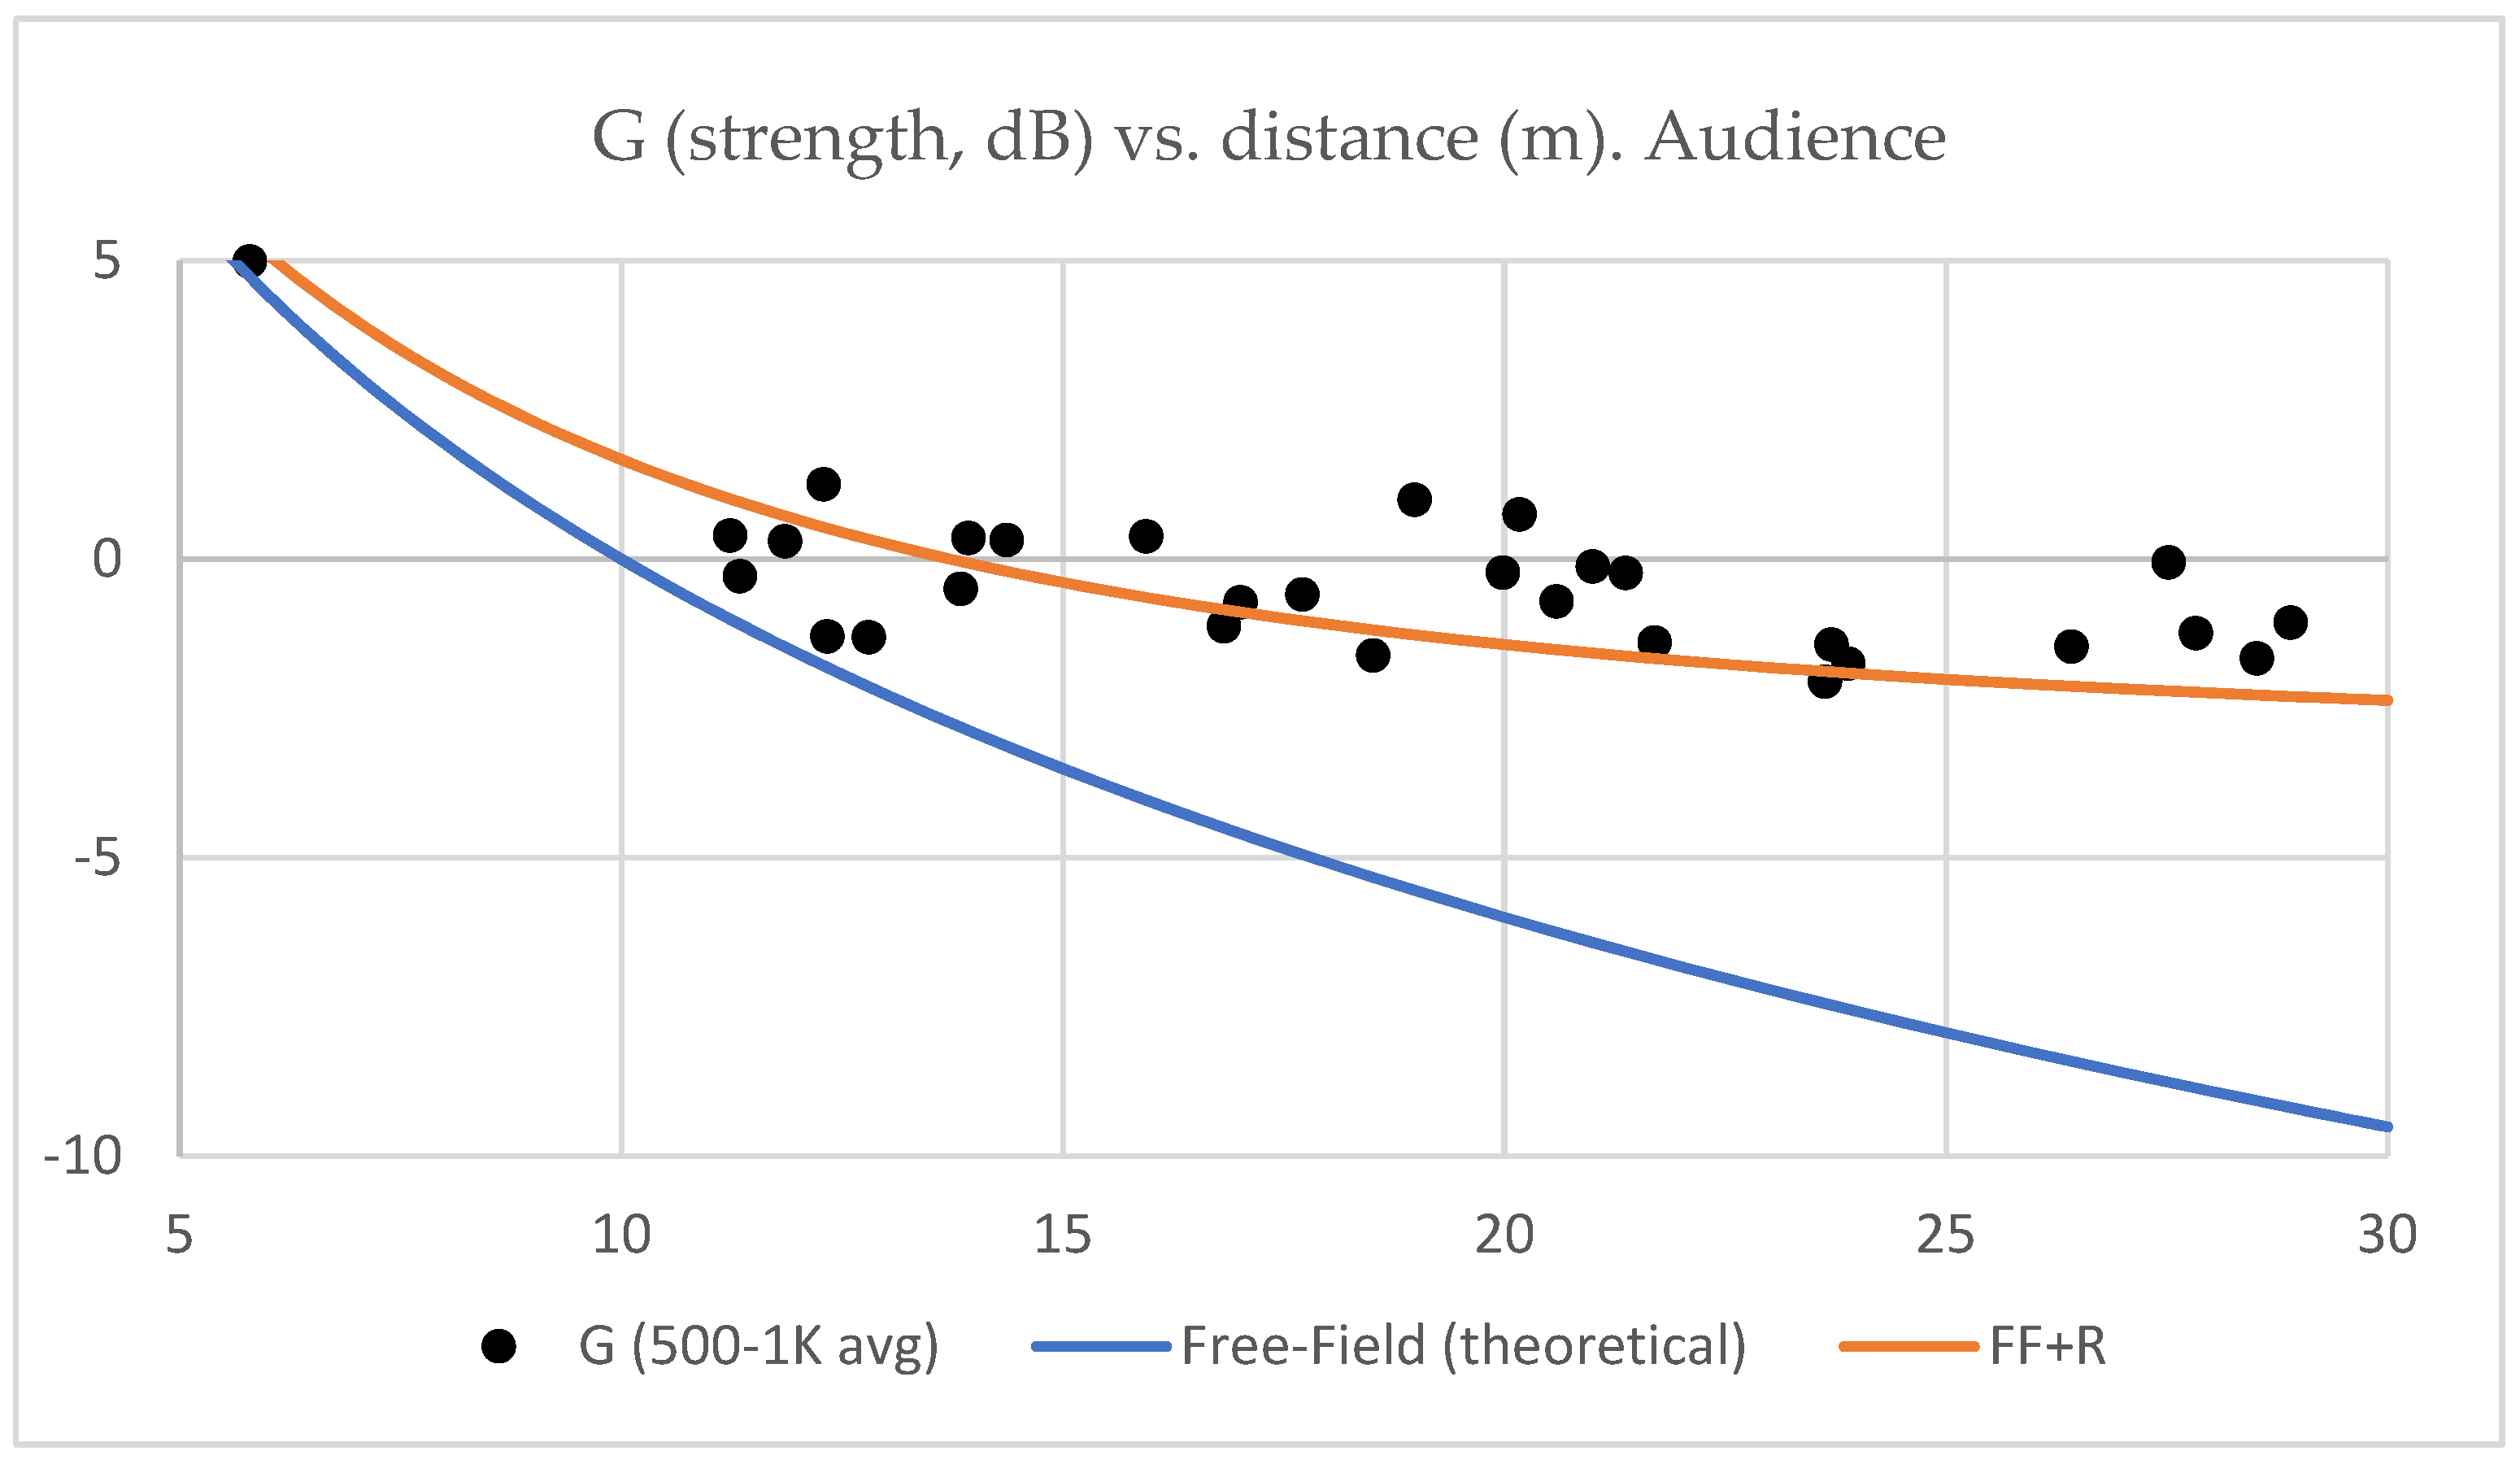
The long distance from closer walls can exacerbate this problem as the direct sound path will predominate over the first reflections among near performers. A quick estimation would predict an attenuation of more than 25 dB, comparing a musician 20 m away to another one at a 1 m distance (under free-field conditions). The high reverberation is expected to reduce this issue by enhancing the strength (G) between distant positions.
Gade [
38,
39,
40] recommends measuring ST (see
Section 2.2.4) with chairs on stage. In addition, Dammerud [
41] deepens into the different results obtained in real-condition experiments (with musicians). Sadly, this set of measurements was made without musicians or chairs on stage, as was explained previously. Uncertainty of stage measurements can be higher than expected for other descriptors according to Giovannini and Astolfi [
42].
4. Conclusions
This paper tries to answer the question of whether the Palace of Charles V has good acoustics, and if not, why the audience thinks it sounds so good. It is a heritage building where musical performances are held. Concerts include different genres such as classical music, opera, flamenco or rock, with different acoustic needs. Several acoustic parameters were measured without the public or musicians in the audience and stage areas. The most remarkable findings are related to the high energy and delayed reflections due to the circular shape of the inner patio.
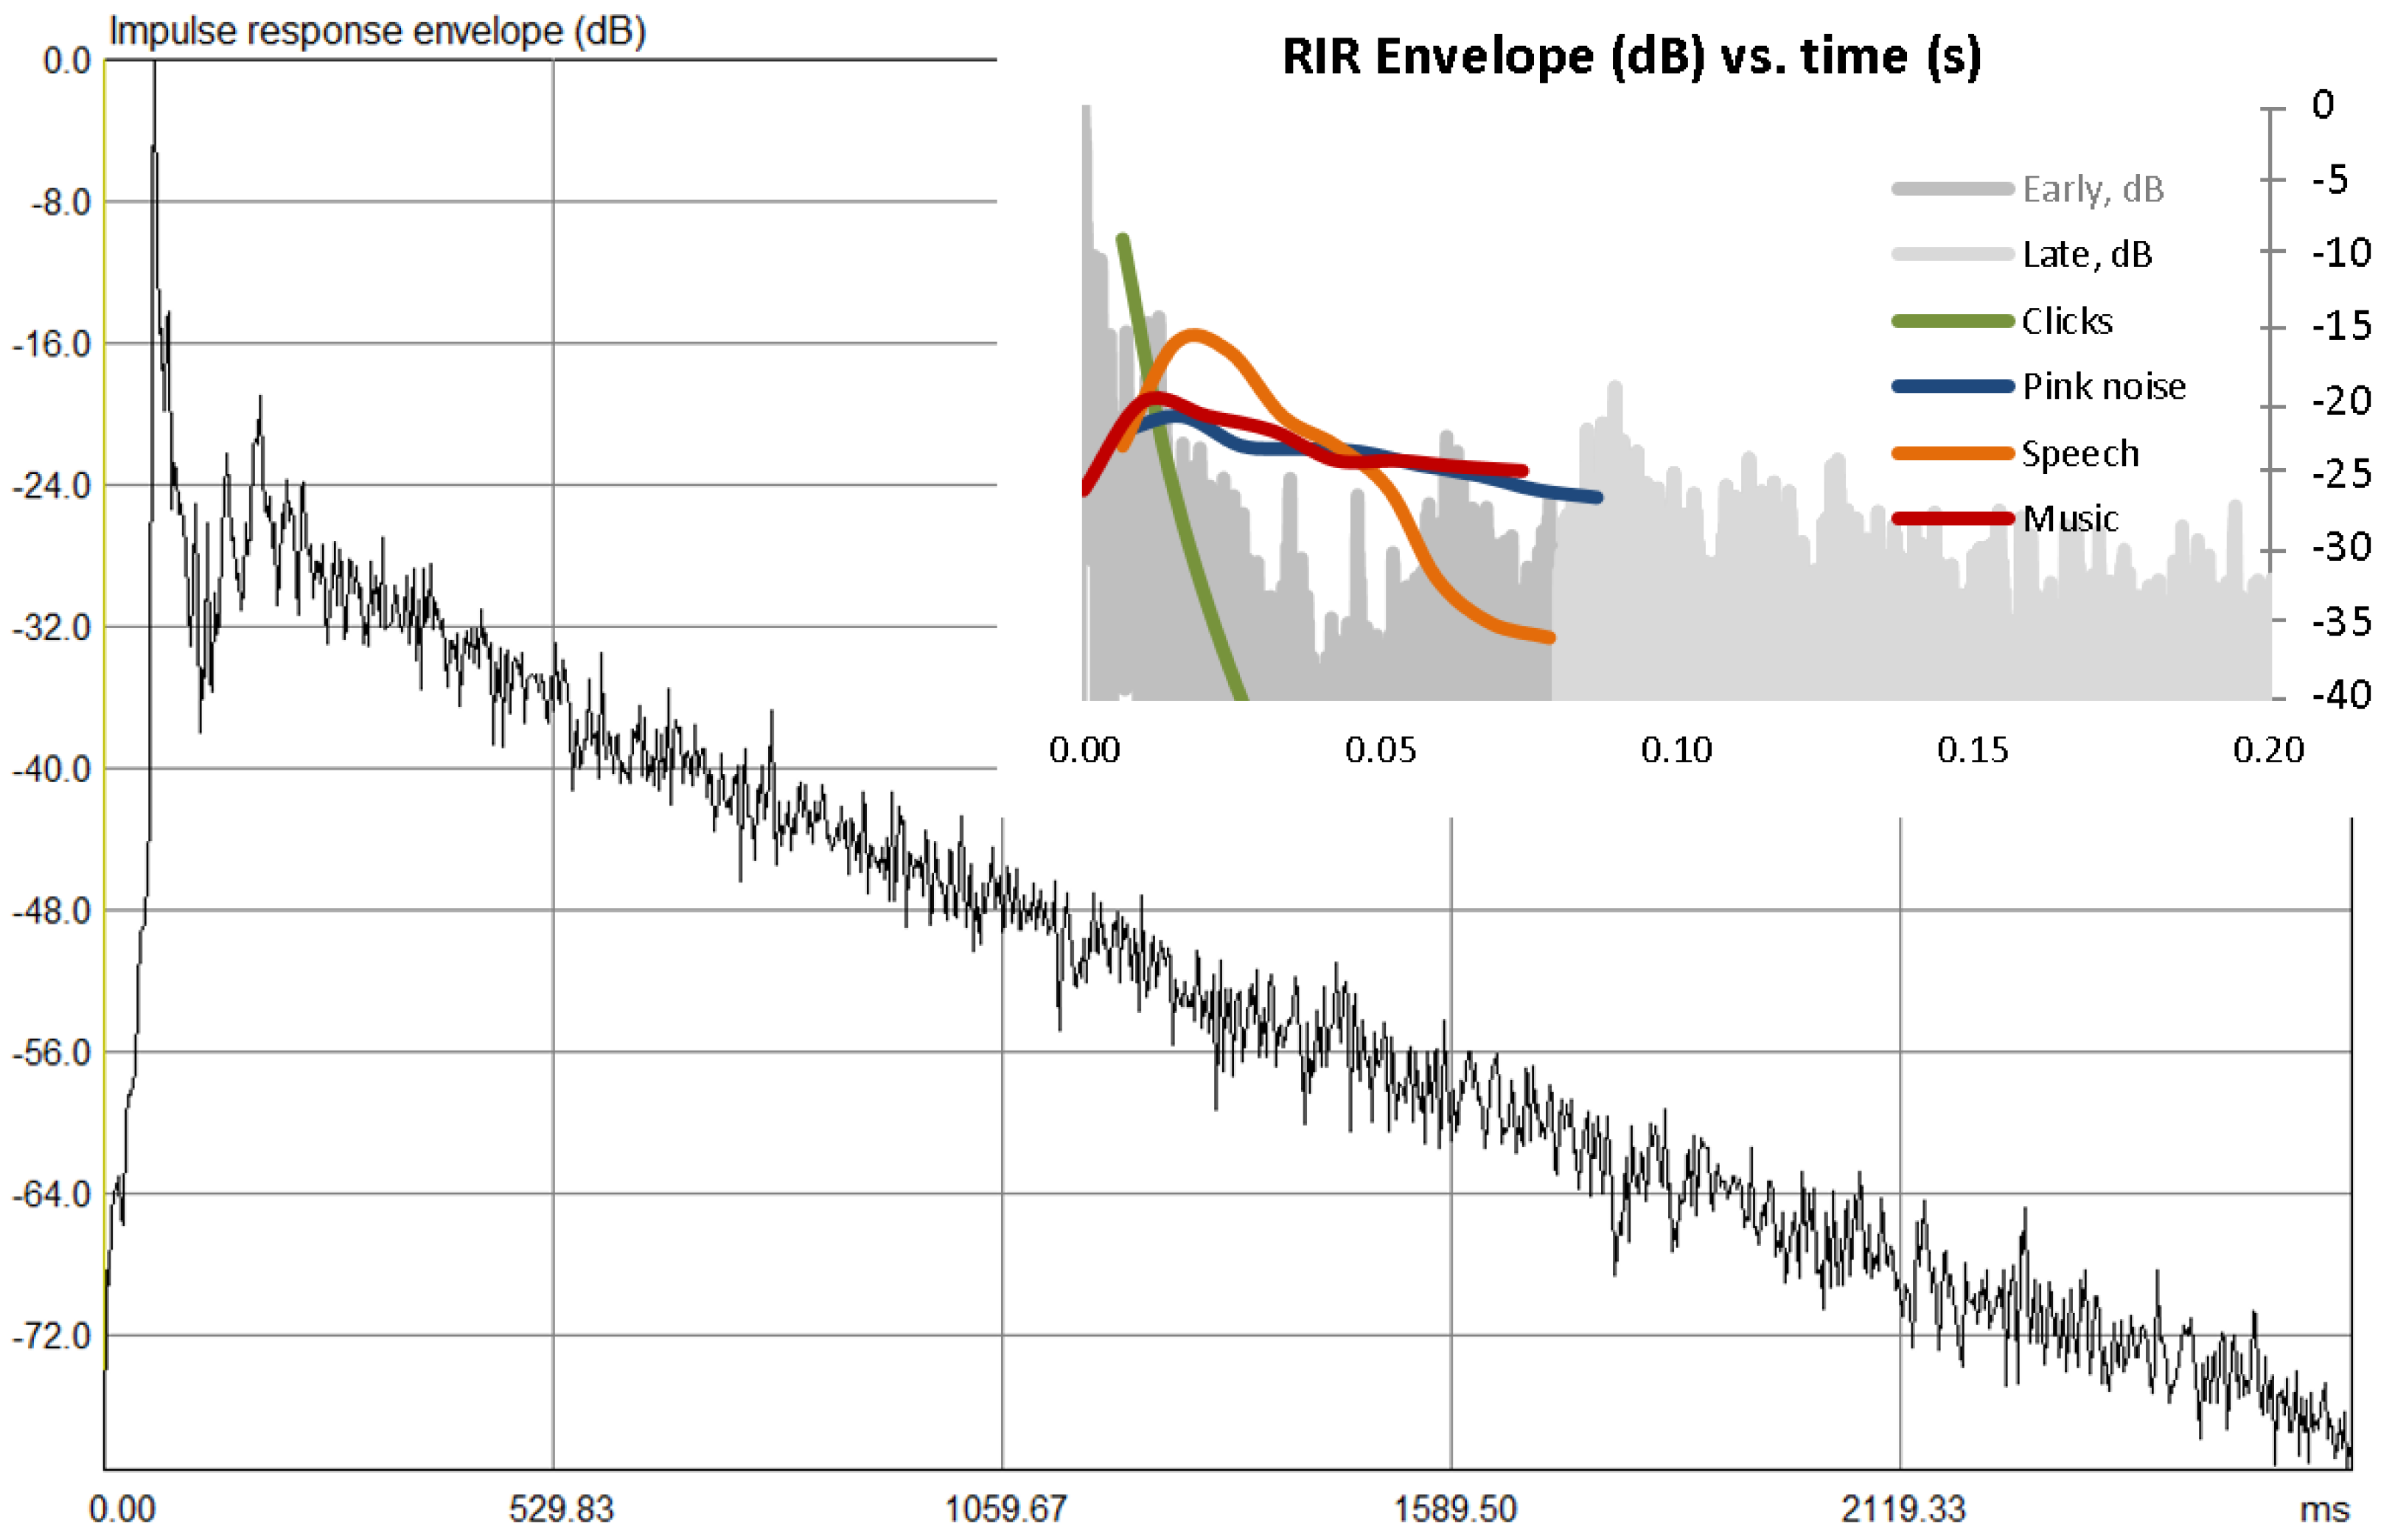
The RTU500-1000 was 2.24 s, while the RTO was expected to be between 1.28 and 1.98 s, which is not excessive given the size of the building. The high RT is due to the massive stone building. The absence of a ceiling leads to a predominance of reflections in the horizontal plane. This non-diffuse field affects the calculations of reverberation times under different conditions (occupied or adding treatment).
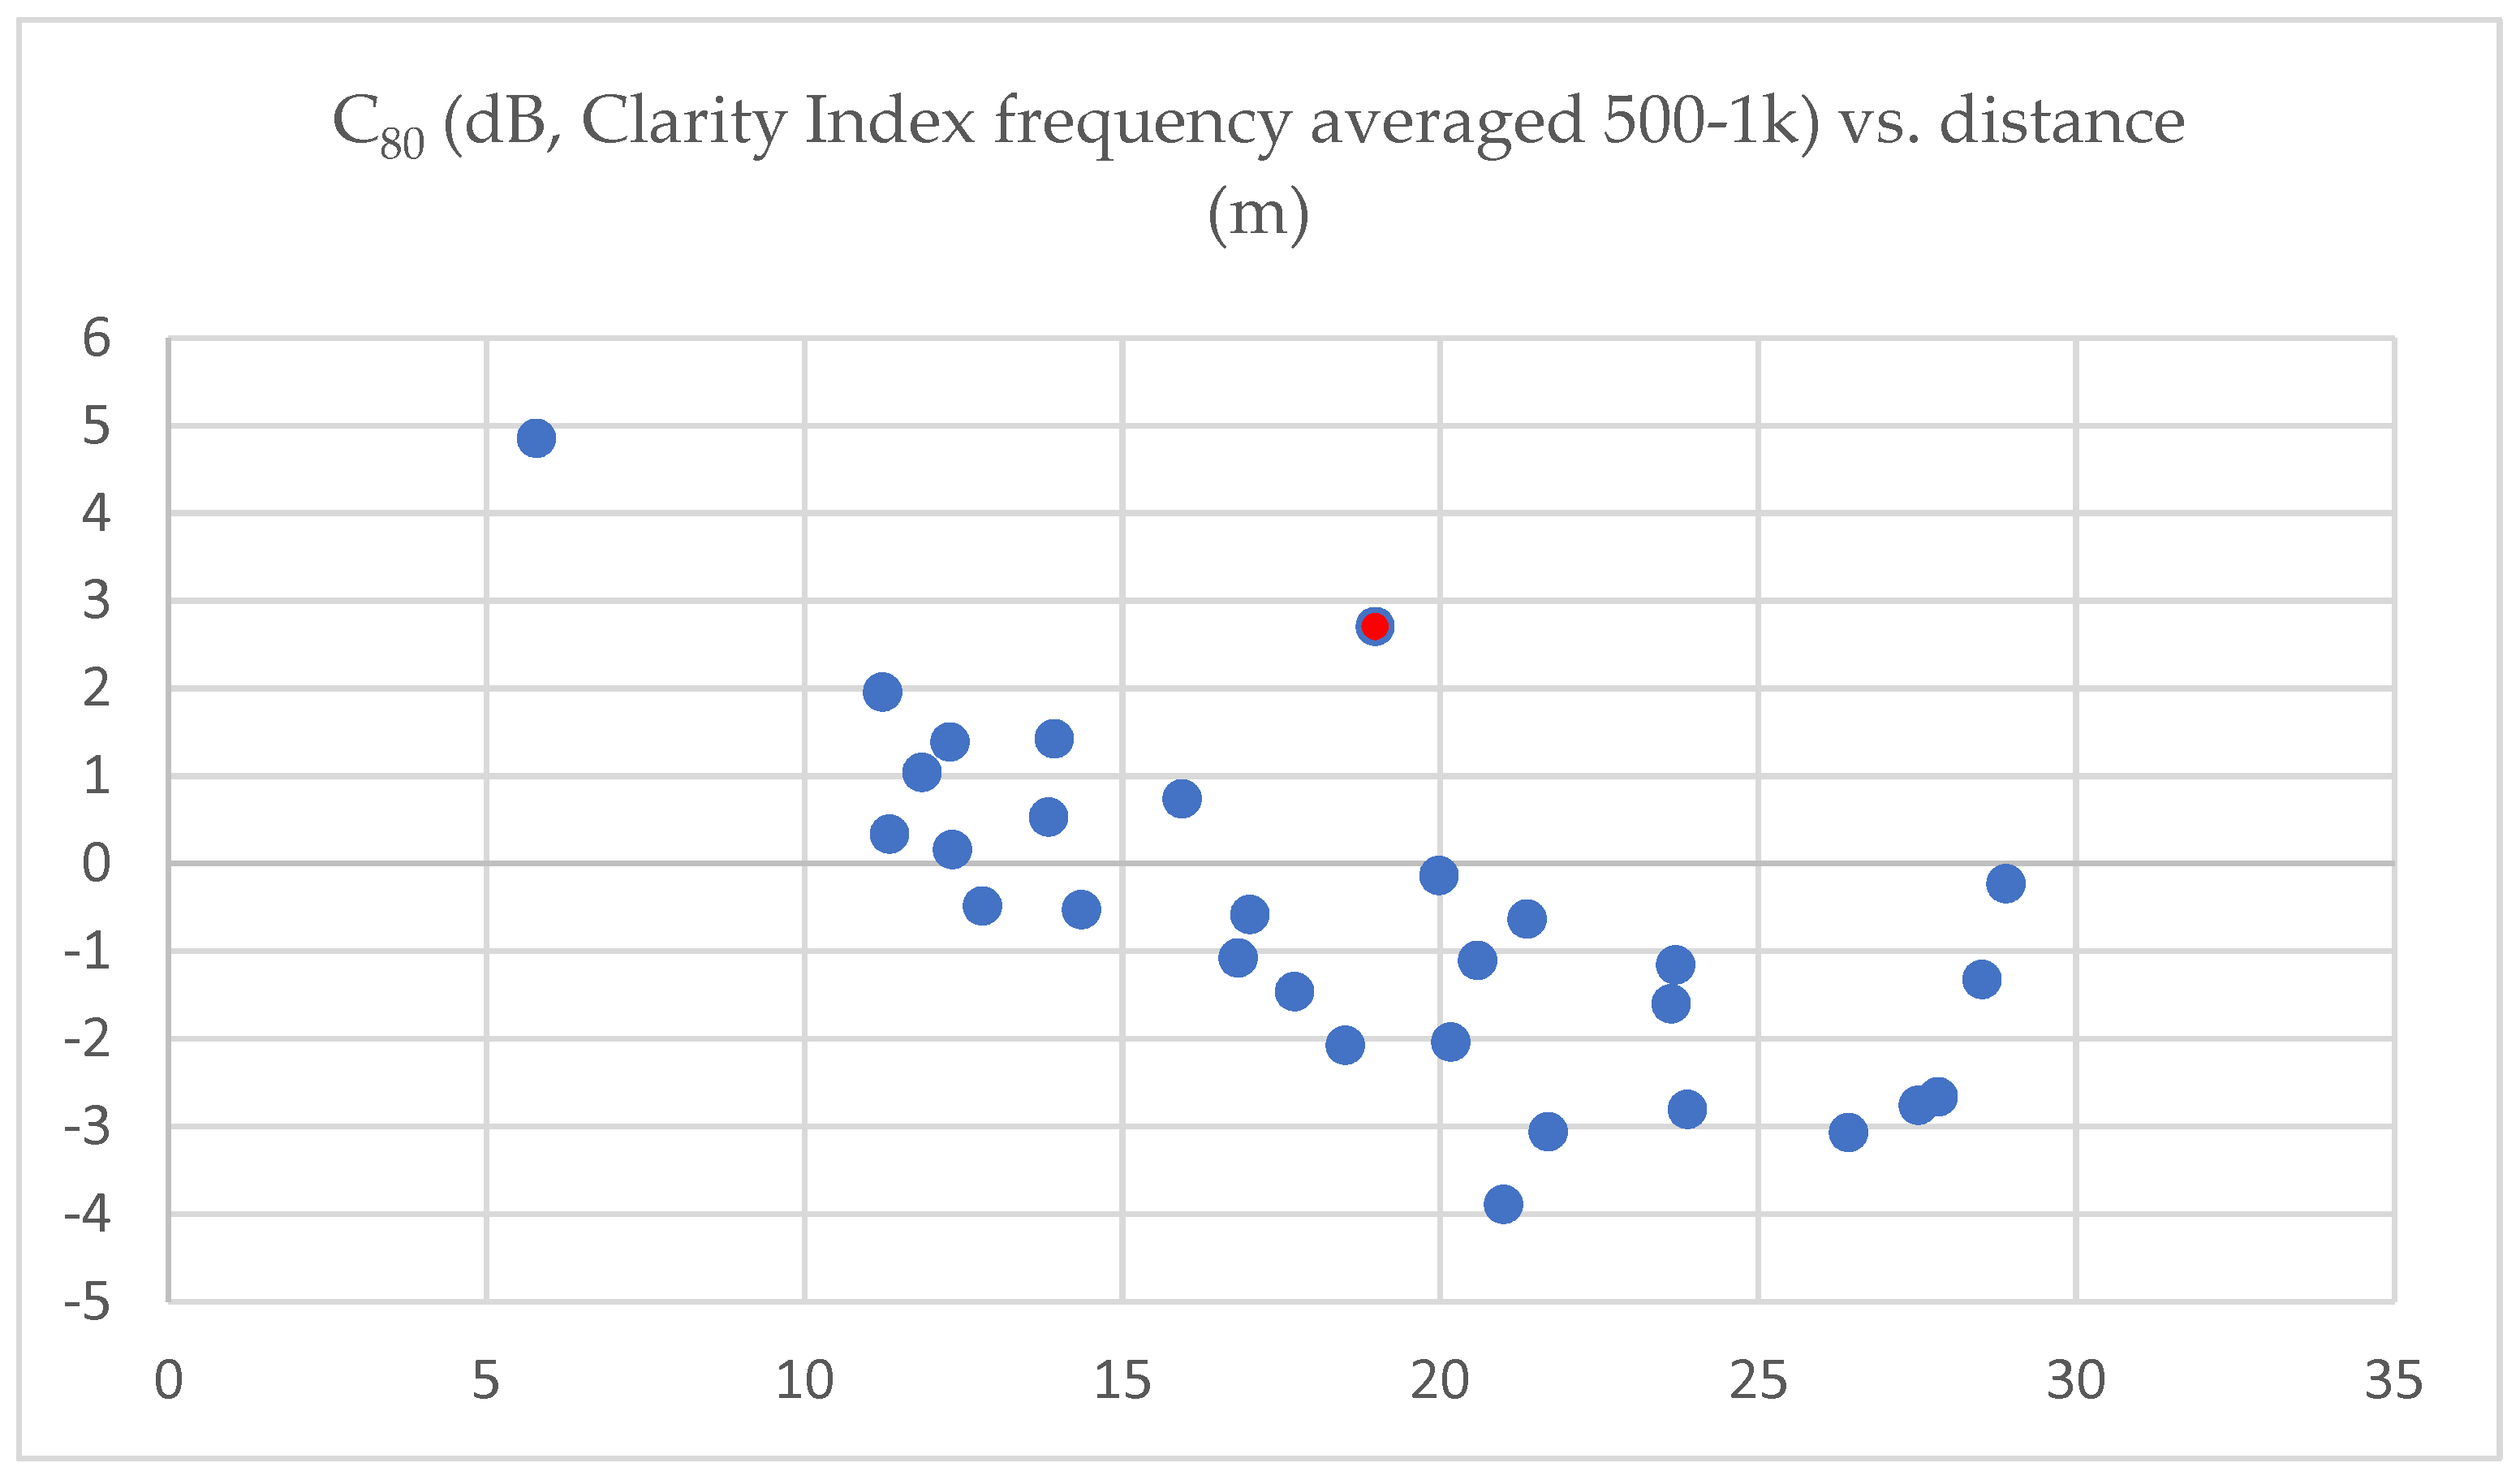
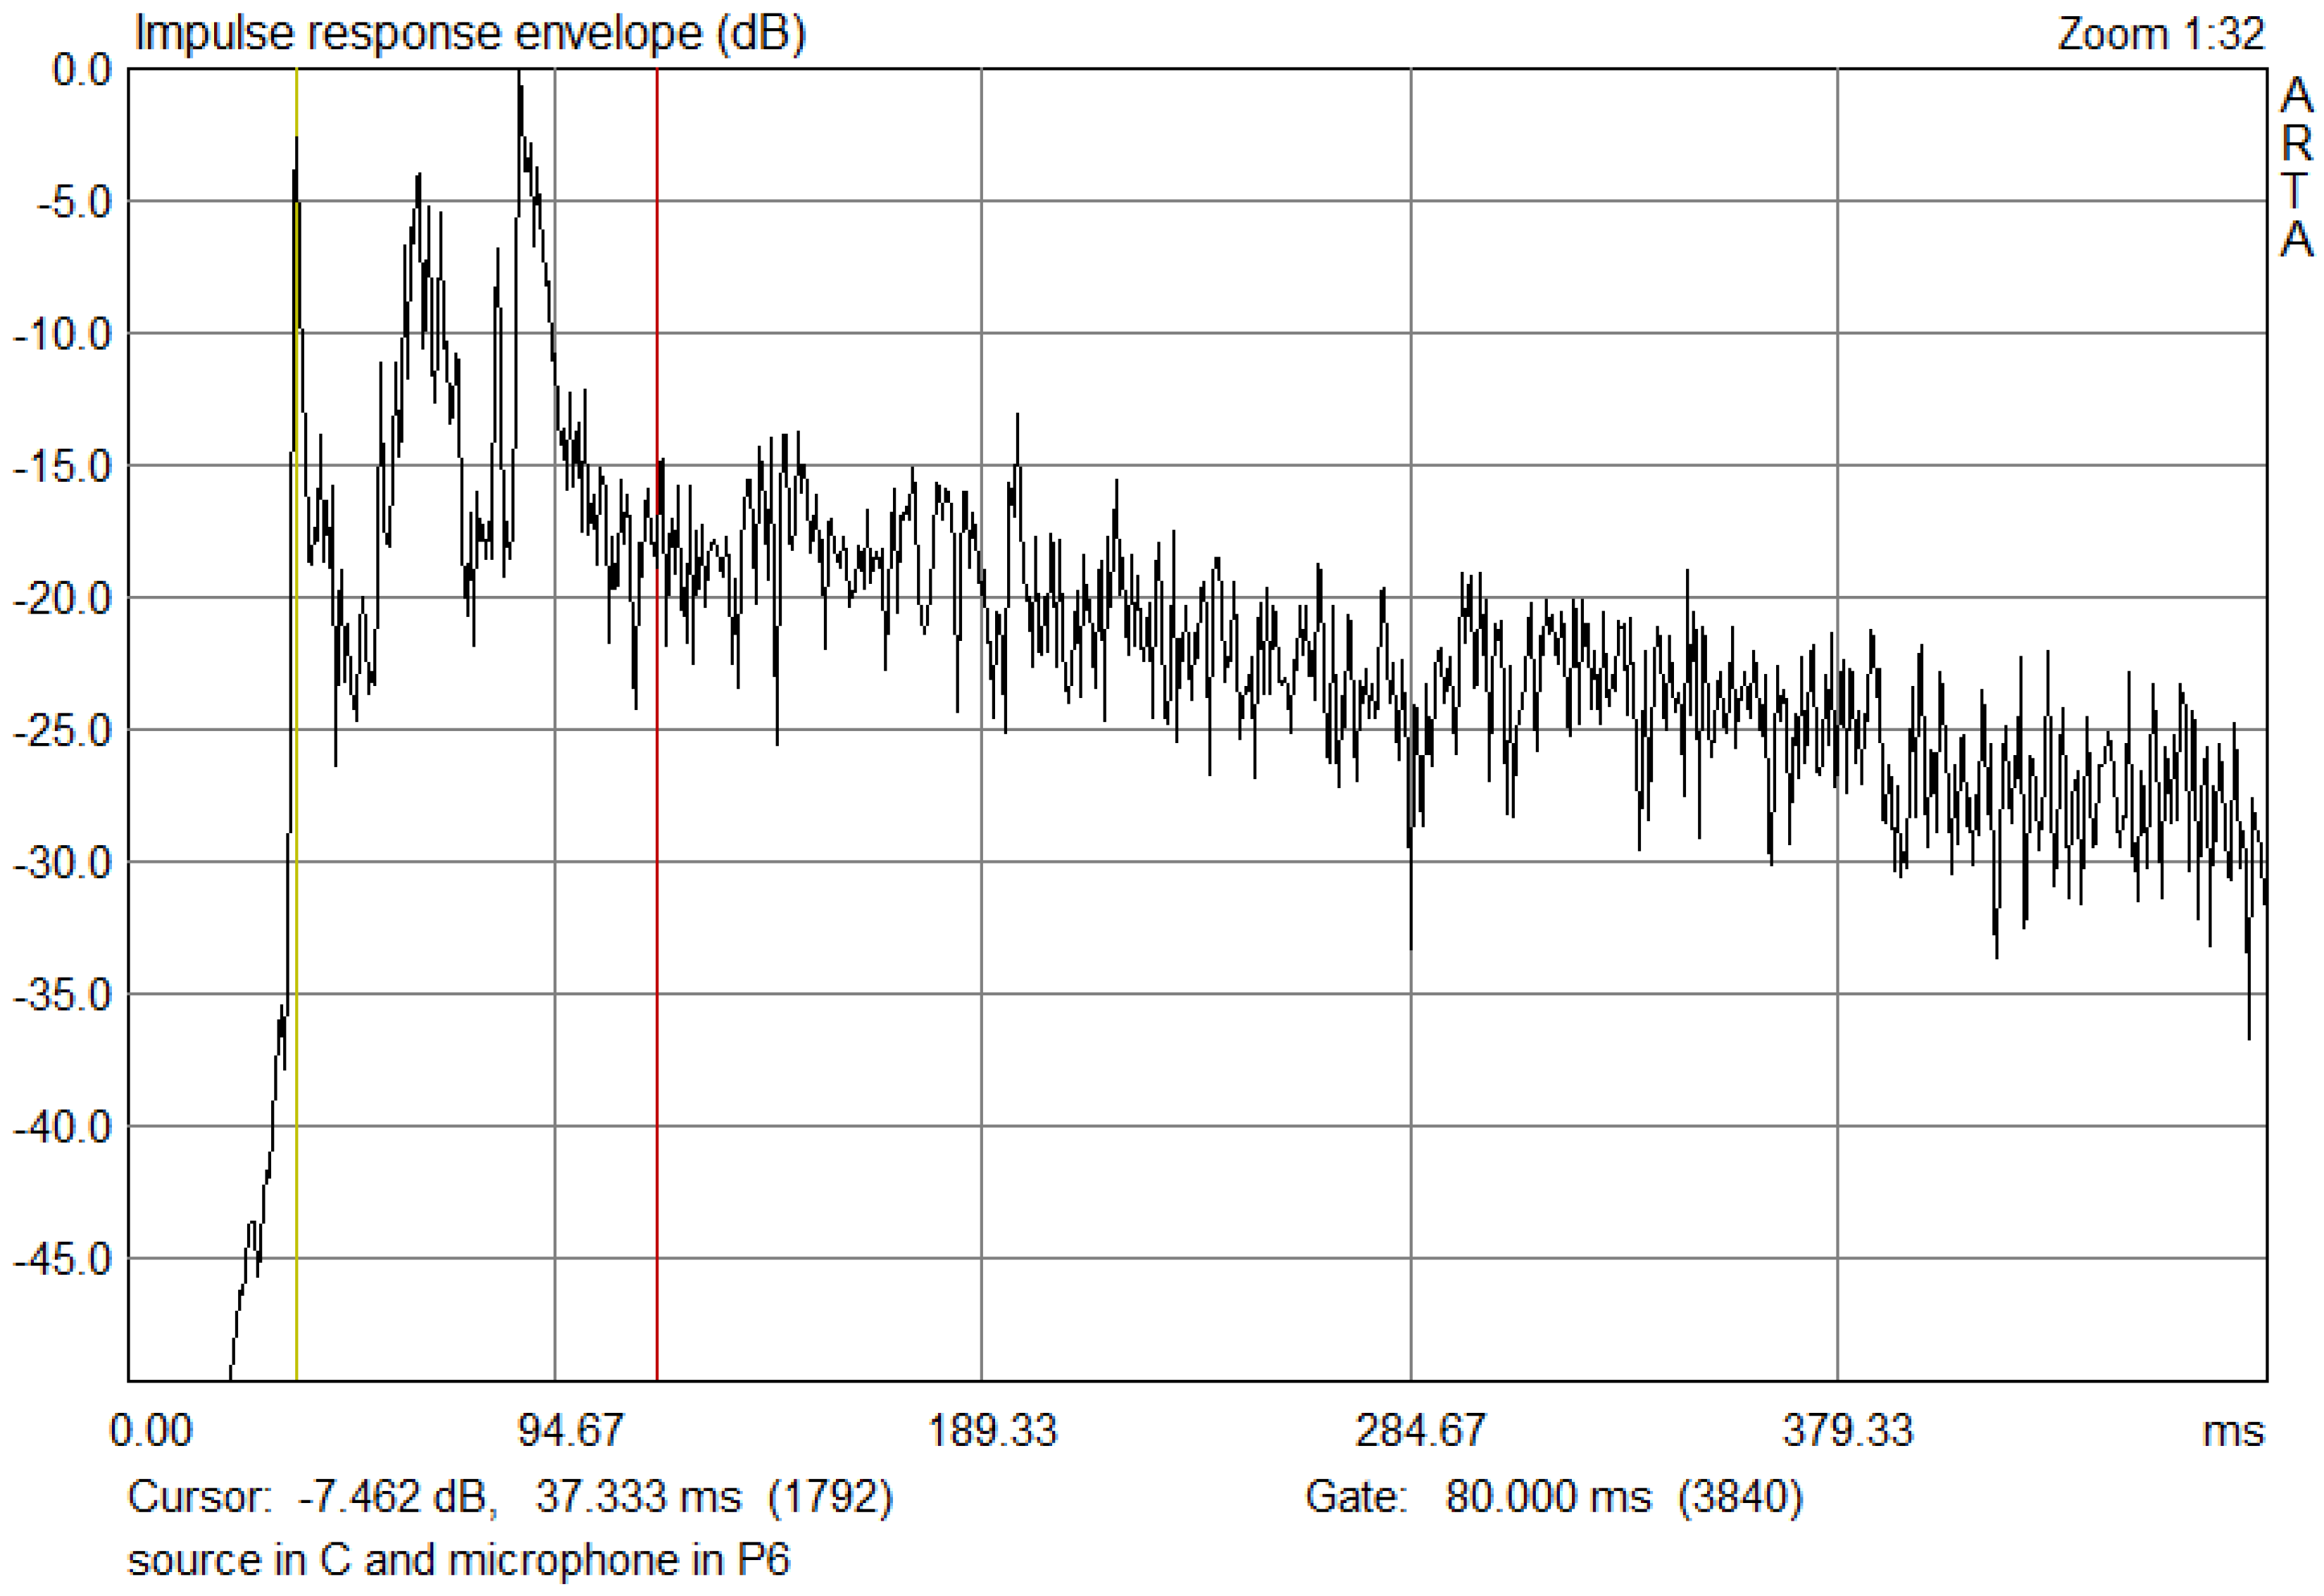
Clarity is very low due to the delay of the first strong reflections after 80 ms. Intimacy is supposed to be very important for concert halls. This palace is the opposite of intimate. Furthermore, the LEV was very low but the BQI was quite good. The lack of earlier reflections from the sides, compared to a similar shoebox-style concert hall, causes all these issues.
Using standard descriptors has been found useful in open-air spaces and heritage buildings but it is still not clear if the recommendations regarding their value should be applied. The emotional response to historical architecture or suitability of the place and the music must be taken into account. This research includes an extensive set of descriptors and also Ambisonic RIR that can be used for auralisation, documentation and safeguarding. Further research can use these data to assess specific recommendations for heritage buildings. Which acoustic indices are important for music in heritage places deserve further research.
Auralisations with visual content can be an effective tool for checking whether the sound of the Palace can be improved with the use of absorbers or by reconsidering the design of the stage to give earlier reflections. There is no doubt that the acoustic indices would improve, but it would be interesting to know if the audience would find it appropriate as the architecture of the Palace is monumental, not intimate.
Programmers need to understand the acoustics of singular heritage halls such as this. A search for appropriately sized and aesthetically pleasing heritage sites can result in possible high-quality venues. Further research is needed, including semiology and audio-visual interactions, to understand why halls that were not designed as auditoria and are far from perfect in terms of hall acoustic recommendations sound so good.


 ,
, 


