Article

Advanced Steam Reforming of Bio-Oil with Carbon Capture: A Techno-Economic and CO2 Emissions Analysis

School of Chemical and Process Engineering, University of Leeds, Leeds LS2 9JT, UK
*
Authors to whom correspondence should be addressed.
Clean Technol. 2022, 4(2), 309-328; https://doi.org/10.3390/cleantechnol4020018
Submission received: 11 March 2022 / Revised: 17 April 2022 / Accepted: 18 April 2022 / Published: 26 April 2022
(This article belongs to the Special Issue CO2 Capture and Sequestration)

Abstract

:
A techno-economic analysis has been used to evaluate three processes for hydrogen production from advanced steam reforming (SR) of bio-oil, as an alternative route to hydrogen with BECCS: conventional steam reforming (C-SR), C-SR with CO2 capture (C-SR-CCS), and sorption-enhanced chemical looping (SE-CLSR). The impacts of feed molar steam to carbon ratio (S/C), temperature, pressure, the use of hydrodesulphurisation pretreatment, and plant production capacity were examined in an economic evaluation and direct CO2 emissions analysis. Bio-oil C-SR-CC or SE-CLSR may be feasible routes to hydrogen production, with potential to provide negative emissions. SE-CLSR can improve process thermal efficiency compared to C-SR-CCS. At the feed molar steam to carbon ratio (S/C) of 2, the levelised cost of hydrogen (USD 3.8 to 4.6 per kg) and cost of carbon avoided are less than those of a C-SR process with amine-based CCS. However, at higher S/C ratios, SE-CLSR does not have a strong economic advantage, and there is a need to better understand the viability of operating SE-CLSR of bio-oil at high temperatures (>850 °C) with a low S/C ratio (e.g., 2), and whether the SE-CLSR cycle can sustain low carbon deposition levels over a long operating period.

Graphical Abstract

1. Introduction

With ever-increasing global energy demand and calls for all-sector decarbonisation, interest in green and blue hydrogen is swelling. Hydrogen is and will continue to be a vital component for chemical and fertiliser manufacturing [1]. Whilst hydrogen is flexible and able to provide for a range of energy applications such as transport and energy storage, it is also highly attractive for heat in future energy landscapes [2]. Hydrogen production is currently dominated by steam methane reforming (SMR), which uses fossil-based natural gas as its feedstock [1]. The streamlined SMR process, which has benefitted from decades of optimisation, produces a cost-effective product, and the tailored global infrastructure has led multiple SMR plant operators to be open to operation with carbon capture utilisation and storage (CCUS) [3]. Combining fossil-derived hydrogen with CCUS has been termed “blue hydrogen”.
Green hydrogen includes that derived from renewably fueled electrolysis of water or from biogenic feedstock [3]. Biogenic hydrogen is of particular interest from an environmental perspective due to the potential of introducing CCUS and therefore providing negative CO2 emissions. Bioenergy with carbon capture and storage (BECCS) is one of the most promising options in not just limiting but reducing emissions according to the IPCC [4]. One encouraging method of generating H2 from biomass is via the steam reforming of bio-oil. Bio-oil is the energy-dense liquid formed from pyrolysis of biomass-derived feedstocks, and its steam reforming has shown advantages in yield for hydrogen production compared to alternatives such as biomass gasification with shift conversion [5]. H2 production may be an effective method to upgrade bio-oil, which suffers from medium–low heating value, high acidity, and chemical instability [6]. However, bio-oil is far easier to transport than H2 and provides the potential for centralised plants that can benefit from economies of scale.
Recent advancements in reforming techniques such as sorption enhancement and chemical looping may provide the spark to bring hydrogen from biomass and BECCS into future energy markets [7]. Sorption-enhanced steam reforming (SE-SR) performs in situ CO2 removal with a high-temperature sorbent in the reformer, providing a product stream of high H2 purity. Moreover, the in situ CO2 removal provides a favourable chemical equilibrium shift, aiding yields, meeting high temperature requirements, and forming an ideal foundation for CCUS. CaO is the most popular sorbent choice due to its low cost and availability, whilst demonstrating strong affinity for CO2 sorption and capture [7].
Chemical looping steam reforming (CLSR) uses oxygen transfer material (OTM) for partial oxidation of the feedstock, which provides heat for autothermal conditions. The partial oxidation produces CO2 as a by-product which also lends itself to CCU opportunities. The OTM is normally formed of a metal oxide such as Cu, Fe2O3, NiO, or Mn3O4 supported on an inert material such as Al2O3, MgAl2O4, SiO2, TiO2, or ZrO [8]. The OTM not only provides the oxygen for partial oxidation, but also often acts as a catalyst for steam reforming or water gas shift. As such, OTM analysis and selection make up the bulk of literature on CLSR, with nickel-based options being the most extensively researched [9]. Ni-based OTMs not only show high reactivity, high temperature stability and high selectivity to syngas production [8,10,11,12], but also are relatively low-cost and commercially widespread.
Sorption-enhanced chemical looping steam reforming (SE-CLSR) integrates the technical aspects behind both CLSR and SESR to provide autothermal operation and a high-purity product with in situ carbon capture [7,13,14,15]. SE-CLSR is characterised by at least two-stage cycling, where saturated sorbent is regenerated at higher temperatures by heat generated by OTM re-oxidation. The thermodynamic study presented by Spragg et al. [15] showcased the benefits of bio-oil SE-CLSR in purity, yield, carbon deposition, and process efficiency.
Because of the predominance of experimental and thermodynamic studies on bio-oil reforming, there is a need for techno-economic investigation to assess the potential for commercialisation and widespread implementation. Previous studies on steam reforming of bio-oil have revealed it can produce cost-competitive H2. In 2010, Sarkar and Kumar [6] showed H2 from autothermal bio-oil steam reforming from whole-tree biomass, forest residue, and agricultural biomass could be costed at USD 2.40, USD 3.00, and USD 4.55 per kg H2, respectively. In 2014, Brown et al. [16] calculated conventional steam reforming (CSR) of bio-oil to produce H2 at USD 3.25 to USD 5 per kg.
There is also scope to produce a techno-economic evaluation of the CO2 capture potential in line with bio-oil reforming to H2. Numerous studies have investigated CO2 capture with steam methane reforming [17,18,19]. In 2021, a review by Yang et al. [20] detailed the avoidance costs for SMR plants ranging from EUR 40 to EUR 130 per t CO2. In the same review, CLSR avoidance costs of EUR 86 per t CO2 and advanced autothermal reforming systems as low as EUR 18 per t CO2 were showcased. To the authors’ knowledge, this paper will be the first of its kind to perform techno-economic studies on the CO2 capture from bio-oil steam reforming, which can be compared to alternatives. This is of particular interest due to the negative emission potential of using a biogenic feedstock such as bio-oil.

2. Materials and Methods

The methods used for the techno-economic analysis operate on the basis that the plant is located in an industrial area such as Teesside (United Kingdom), where H2 pipeline infrastructure can be taken advantage of. It is proposed that the H2 is prepared under the same conditions as the H21 Leeds City Gate project [21] which also sets its plant location at Teesside. A H2 export pressure of 40 bar was therefore assumed, at 25 °C and hydrogen purity greater than 99.98%.
Teesside was also chosen as the location for the case study due to the region’s inevitable participation in future CO2 capture and storage (CCS), where CO2 will be piped to empty North Sea oil fields [22]. Where CO2 capture was considered, a set of purity conditions were applied to the separated CO2 to maintain transportation and storage infrastructure integrity. Given a lack of standardised CO2 purity specifications, those used in this study and presented in Table 1 were based on those generated by CCS stakeholders in the CO2 Europipe project [23]. For supercritical phase transportation, 110 bar was assumed as the specified CO2 pressure.
The discussed facility is assumed as a centralised reforming plant that receives feedstock from multiple pyrolysis sites. This combines the benefits of economies of scale for the reforming stage with providing realistic capacities for pyrolysis from bio-compounds and associated feedstock limitations. A range of 5000 to 100,000 Nm3 h−1 of bio-oil from 1 to 20 pyrolysis plants, to feed a central reforming facility, was used to analyse the impact of scale on the techno-economics.

2.1. Bio-Oil Feedstock

Bio-oil was modelled using a surrogate mixture, as in the work of Spragg et al. [15], closely resembling the elemental composition and differential thermogravimetric (DTG) curve of a real palm empty fruit bunch (PEFB) bio-oil [24]. Sensitivity analysis on PEFB bio-oil model mixtures shows equilibrium results are not sensitive to the exact mixture composition, provided a known elemental composition [25]. The bio-oil surrogate mixture was based on the work of Dupont et al. [26], and the bio-oil has been represented with a mixture of 6 macro-families following the methodology of García-Pérez et al. [27]. The mass fraction of each compound is described by Spragg et al. [15] and in the Supplementary Materials (S1). In this study, it is assumed that the bio-oil is mixed with 10 wt% methanol to reduce its viscosity and density [6]. Stainless steel tanks are used to store the bio-oil due to its corrosive nature [28].

2.2. Desulphurisation

Many existing techno-economic studies on bio-oil reforming, have assumed sufficiently low sulphur content in bio-oils to avoid the requirement for desulphurisation [6,29,30]. However, as this is a potentially important sensitivity for reforming catalysts, the impact of desulphurisation is considered and compared to a base case without. Assumptions for desulphurisation are based upon data available for naphtha hydrodesulphurisation (HDS), a common approach in refining [31]. Transition metal catalysts, such as sulphided CoMo/Al2O3 and NiMo/Al2O3, convert sulphur compounds in the liquid feedstock into H2S, via reaction with hydrogen [32]. As well as consuming hydrogen, the process is a net consumer of power and steam, as well as fuel gas for a fired heater.
Sulphur levels are assumed equivalent to those used for the inlet to naphtha reforming, around 0.5 to 1 ppmwt [31,33]. Detailed process design was not performed for desulphurisation, rather order of magnitude estimates were used for techno-economic considerations based on data from Maples [31], such as the utilities presented in Table 2 and single point cost data in Table 3. Hydrogen consumption for a given wt% sulphur in the feed was derived from a correlation within the same work. The analysis performed details only the costs associated with desulphurisation and does not illustrate the potential benefits of improving catalyst lifetime and performance.

2.3. Economic Costing

Levelised cost of hydrogen (LCOH) was used for a consistent comparison between the processes and the comparative systems in the literature. LCOH estimates the H2 product value required to recover lifetime project costs, as calculated in Equation (1):
LCOH = t = 1 n T C I t + C O M d , t ( 1 + r ) t t = 1 n H t ( 1 + r ) t
where n is the lifetime of the project, T C I t is the capital investment, and C O M d , t is the cost of manufacture in year t . H t is the hydrogen generated in year t . The time value of money is accounted for by the discount rate ( r ), which discounts costs to the present value over the plant’s lifetime.
For economic quantification of CO2 capture, the cost of CO2 avoided (CCA) was calculated; the CCA can be defined as the required carbon tax value for competitive CO2 capture against a benchmark plant [18], as calculated in Equation (2):
C C A = LCOH LCOH r e f E H 2 , r e f E H 2
where LCOH and LCOH r e f are the levelised cost of hydrogen (USD kgH2−1) in the plant with and without CO2 capture, respectively. E H 2 and E H 2 , r e f are the specific emissions per unit production of H2 (kgCO2 kgH2−1) of the plant with and without CO2 capture, respectively.
The total emissions include not only CO2 emissions in the flue gases, but also those associated with imports and exports of electricity and steam. The specific emissions (kgCO2 kgH2−1) were calculated as in Equation (3):
E H 2 = m ˙ C O 2 + ( Q ˙ t h + Q ˙ t h ) E t h + ( P ˙ e l + P ˙ e l + ) E e l m ˙ H 2
where m ˙ C O 2 is flue gas CO2 mass flow rate and m ˙ H 2 is the H2 mass flow rate. E t h and E e l are the thermal and electrical emissions factors, respectively. Q ˙ t h and P ˙ e l are the thermal energy and electrical power, with + and − subscripts to signify imports and exports, respectively. Emission factors are taken from European Union data [34], where E e l is 0.391 kg kWh−1 and E t h is 0.224 kg kWh−1, assuming 90% natural gas boiler efficiency. Any emissions of biogenic origin have been accounted as carbon-neutral.
Bare module costs were taken from Turton et al. [35] as much as possible, and the size factor was accounted for using Equation (4):
l o g 10 C P o = K 1 + K 2 l o g 10 ( A ) + K 3 [ l o g 10 ( A ) ] 2
where C P o is the purchased cost of equipment at base case conditions (ambient operating pressure and carbon steel construction) and A is the size parameter. Aspen Plus–derived size parameters were used to calculate equipment cost under base conditions. The purchased cost ( C P o ) was then multiplied by a series of factors that account for deviations from the base conditions, including specific equipment type, system pressure, and materials of construction, as outlined by Turton et al. [35,36] and described in the Supplementary Materials (S2). Due to the corrosiveness of bio-oil, exposed process parts were assumed as stainless steel. Remaining parts were assumed as carbon steel.
For systems and processing units where data was unavailable from Turton et al. [35], bare module costs ( C m o d ) were acquired from the literature and scale-adjusted using Equation (5):
C m o d = C m o d , 0 ( S S 0 ) f × I
where f is the scaling exponent, S m o d , and C m o d , 0 and S m o d , 0 are the cost and size of the reference case, respectively. The value I is the installation factor (where given). Table 3 details the process units costed using this method with associated data for Equation (5).
Table 3. Single point cost data for bare module cost.
UnitBase SizeBase Cost (mUSD)fInstallation FactorYearRef.
WGS15.6 Mmol h−1 CO + H2 36.90.8512001[37]
PSA9600 kmol h−1 throughput280.71.692001[37]
CO2 capture (MDEA)62.59 kg s−1 CO2 captured104.20.8-2017[37]
CO2 compression and drying13 MW compressor power17.90.67-2017[18]
High temperature three-way valve2 m3 s−10.16950.6-2014[18]
HDS plant30,000 BPD160.65-1991[31]
The refractory-lined reactor vessels in the SE-CLSR study were designed in more detail, based on the methods of Peters et al. [38] and Hamers et al. [39]. This was performed due to the identification of their influence on overall plant cost. Reactor volumes were estimated via catalyst weight hourly space velocity (WHSV) and sorbent quantity. On the basis of this reactor volume, the masses of steel and refractory material were calculated, providing cost. Full details of calculations are available in the Supplementary Materials (S3).
To account for inflation, all costs were aligned to the year 2018 using the Chemical Engineering Plant Cost Index (CEPCI):
C B M , 2018 = C B M , b a s e ( C E P C I 2018 C E P C I b a s e )
where C E P C I 2018 is the index value from 2018 (603.1) and C E P C I b a s e is the index value from the year of the source cost. C B M , b a s e is the cost in the base year and C B M , 2018 is the 2018 adjusted cost.
Total capital investment (TCI) was calculated taking into account a number of additional factors. Firstly, fees were assumed at 3% of bare module costs C B M [35], a contingency of 30% of C B M , as recommended by NETL for a concept with bench-scale data [40]. Consideration for auxiliary facilities, such as site development and buildings, was accounted as 50% of C B M . These generated a figure for total fixed capital investment (FCI). Working capital was assumed at 15% of FCI, which when applied, created the TCI.
Operating costs were determined using the method from Turton et al. [35]. When each operating factor is accounted for, the total cost of manufacture without depreciation ( C O M d ) is as shown in Equation (7):
C O M d = 0.18 F C I + 2.73 C O L + 1.23 ( C U T + C W T + C R M )
where C O L is operating labour costs, C U T is utility costs, C W T is waste treatment costs, and C R M is costs of raw materials. Table 4 details further assumptions made for the calculation of C O M d .

2.4. Process Modelling Methodology

As previous studies on bio-oil steam reforming have achieved bio-oil conversion and hydrogen yields close to 100% [49], an equilibrium-based approach has been used throughout the Aspen Plus model. Peng–Robinson property method was selected as suggested for hydrogen-rich applications [58] and used for similar applications in the literature [51,59,60].
For all models, RGibbs reactors were used to simulate each reforming reactor. For C-SR an isothermal reforming reactor is connected to an isothermal burner by an energy stream, representing external firing on reformer tubes. For SE-CLSR, adiabatic RGibbs blocks were utilised, where the outlet temperature is determined by Aspen Plus on a chemical equilibrium basis. The WGS reactor was an adiabatic REquil reactor in which the WGS reaction is specified, instead of an RGibbs block, to represent a reaction supported by a catalyst selective to CO2 rather than CH4 production.
SE-CLSR reactors are difficult to simulate due to their packed bed design, in which different stages (time intervals with different feed streams) are initiated by switching gas inputs. Figure 1a illustrates how this is implemented in a packed bed, showing each SE-CLSR stage with the catalyst redox changes. Figure 1b demonstrates the autothermal cycle formed by each stage with a temperature–pressure diagram.
To model this gas switching process in Aspen Plus, each stage is represented by a different reactor block in the process flowsheet, despite them being of a singular vessel design in reality. Conceptual separator blocks isolate solids from the outlet of the reactors and are copied by transfer blocks as inputs to the next stage, rather than representing the physical movement of material between reactors. This approach instead simulates the retention of solids in the same reactor like a type of semi-batch process. Meanwhile, the C-SR is modelled as a continuous, steady-state process.
Separator blocks were used to simulate the PSA with a 90% H2 recovery and the absorption-based capture process with 95% CO2 recovery. Energy demand for capture and compression was taken from the work of Meerman et al. [62], who modelled an activated MDEA process in syngas at similar conditions. Pressure drops in heat exchangers were used as in the work of Seider et al. [63], and efficiencies of turbomachines were used as in the work of Spallina et al. [47]. Other assumptions were as follows:
  • Where gas volumes are given in Nm3, normal conditions are 20 °C and 1.01325 bar;
  • Air is composed of 79% N2 and 21% O2;
  • To ensure storage in liquid form, the bio-oil/methanol mixture is stored above its vapour pressure (around 3 bar);
  • All other fluid inputs enter the system at 25 °C and 1.01325 bar;
  • Reactor pressure drop is 5% of inlet pressure;
  • Heat exchanger minimum approach of 10 °C.
Flue gases from the furnace and gas turbine are cooled to 180 °C before emission to the atmosphere [64]. Low-pressure (LP) steam at 6 bar and 160 °C is produced using process excess heat and sold as a by-product [47]. The only system heat imports are fuel gas for the net demands of C-SR and C-SR-CCS. The process flow diagrams for the Aspen Plus models for C-SR without CO2 capture, C-SR with CO2 capture, and the SE-CLSR process can be found in Figure 2, Figure 3 and Figure 4, respectively. Reactions involved in each process are as in the work of Spragg et al. [15].

3. Results

3.1. Process Design Basis Selection

The process simulation performed on Aspen Plus provided sensitivity analysis for the impact of parameters such as temperature, pressure, steam:carbon (S/C) feed molar ratio, and steam export on the yield, thermal efficiency, and carbon emission potentials of each process. These results were utilised for the selection of a design basis for further economic analysis and comparison. The key conditions selected from the sensitivity analysis are provided in Table 5, with rationale provided in the following two sections.

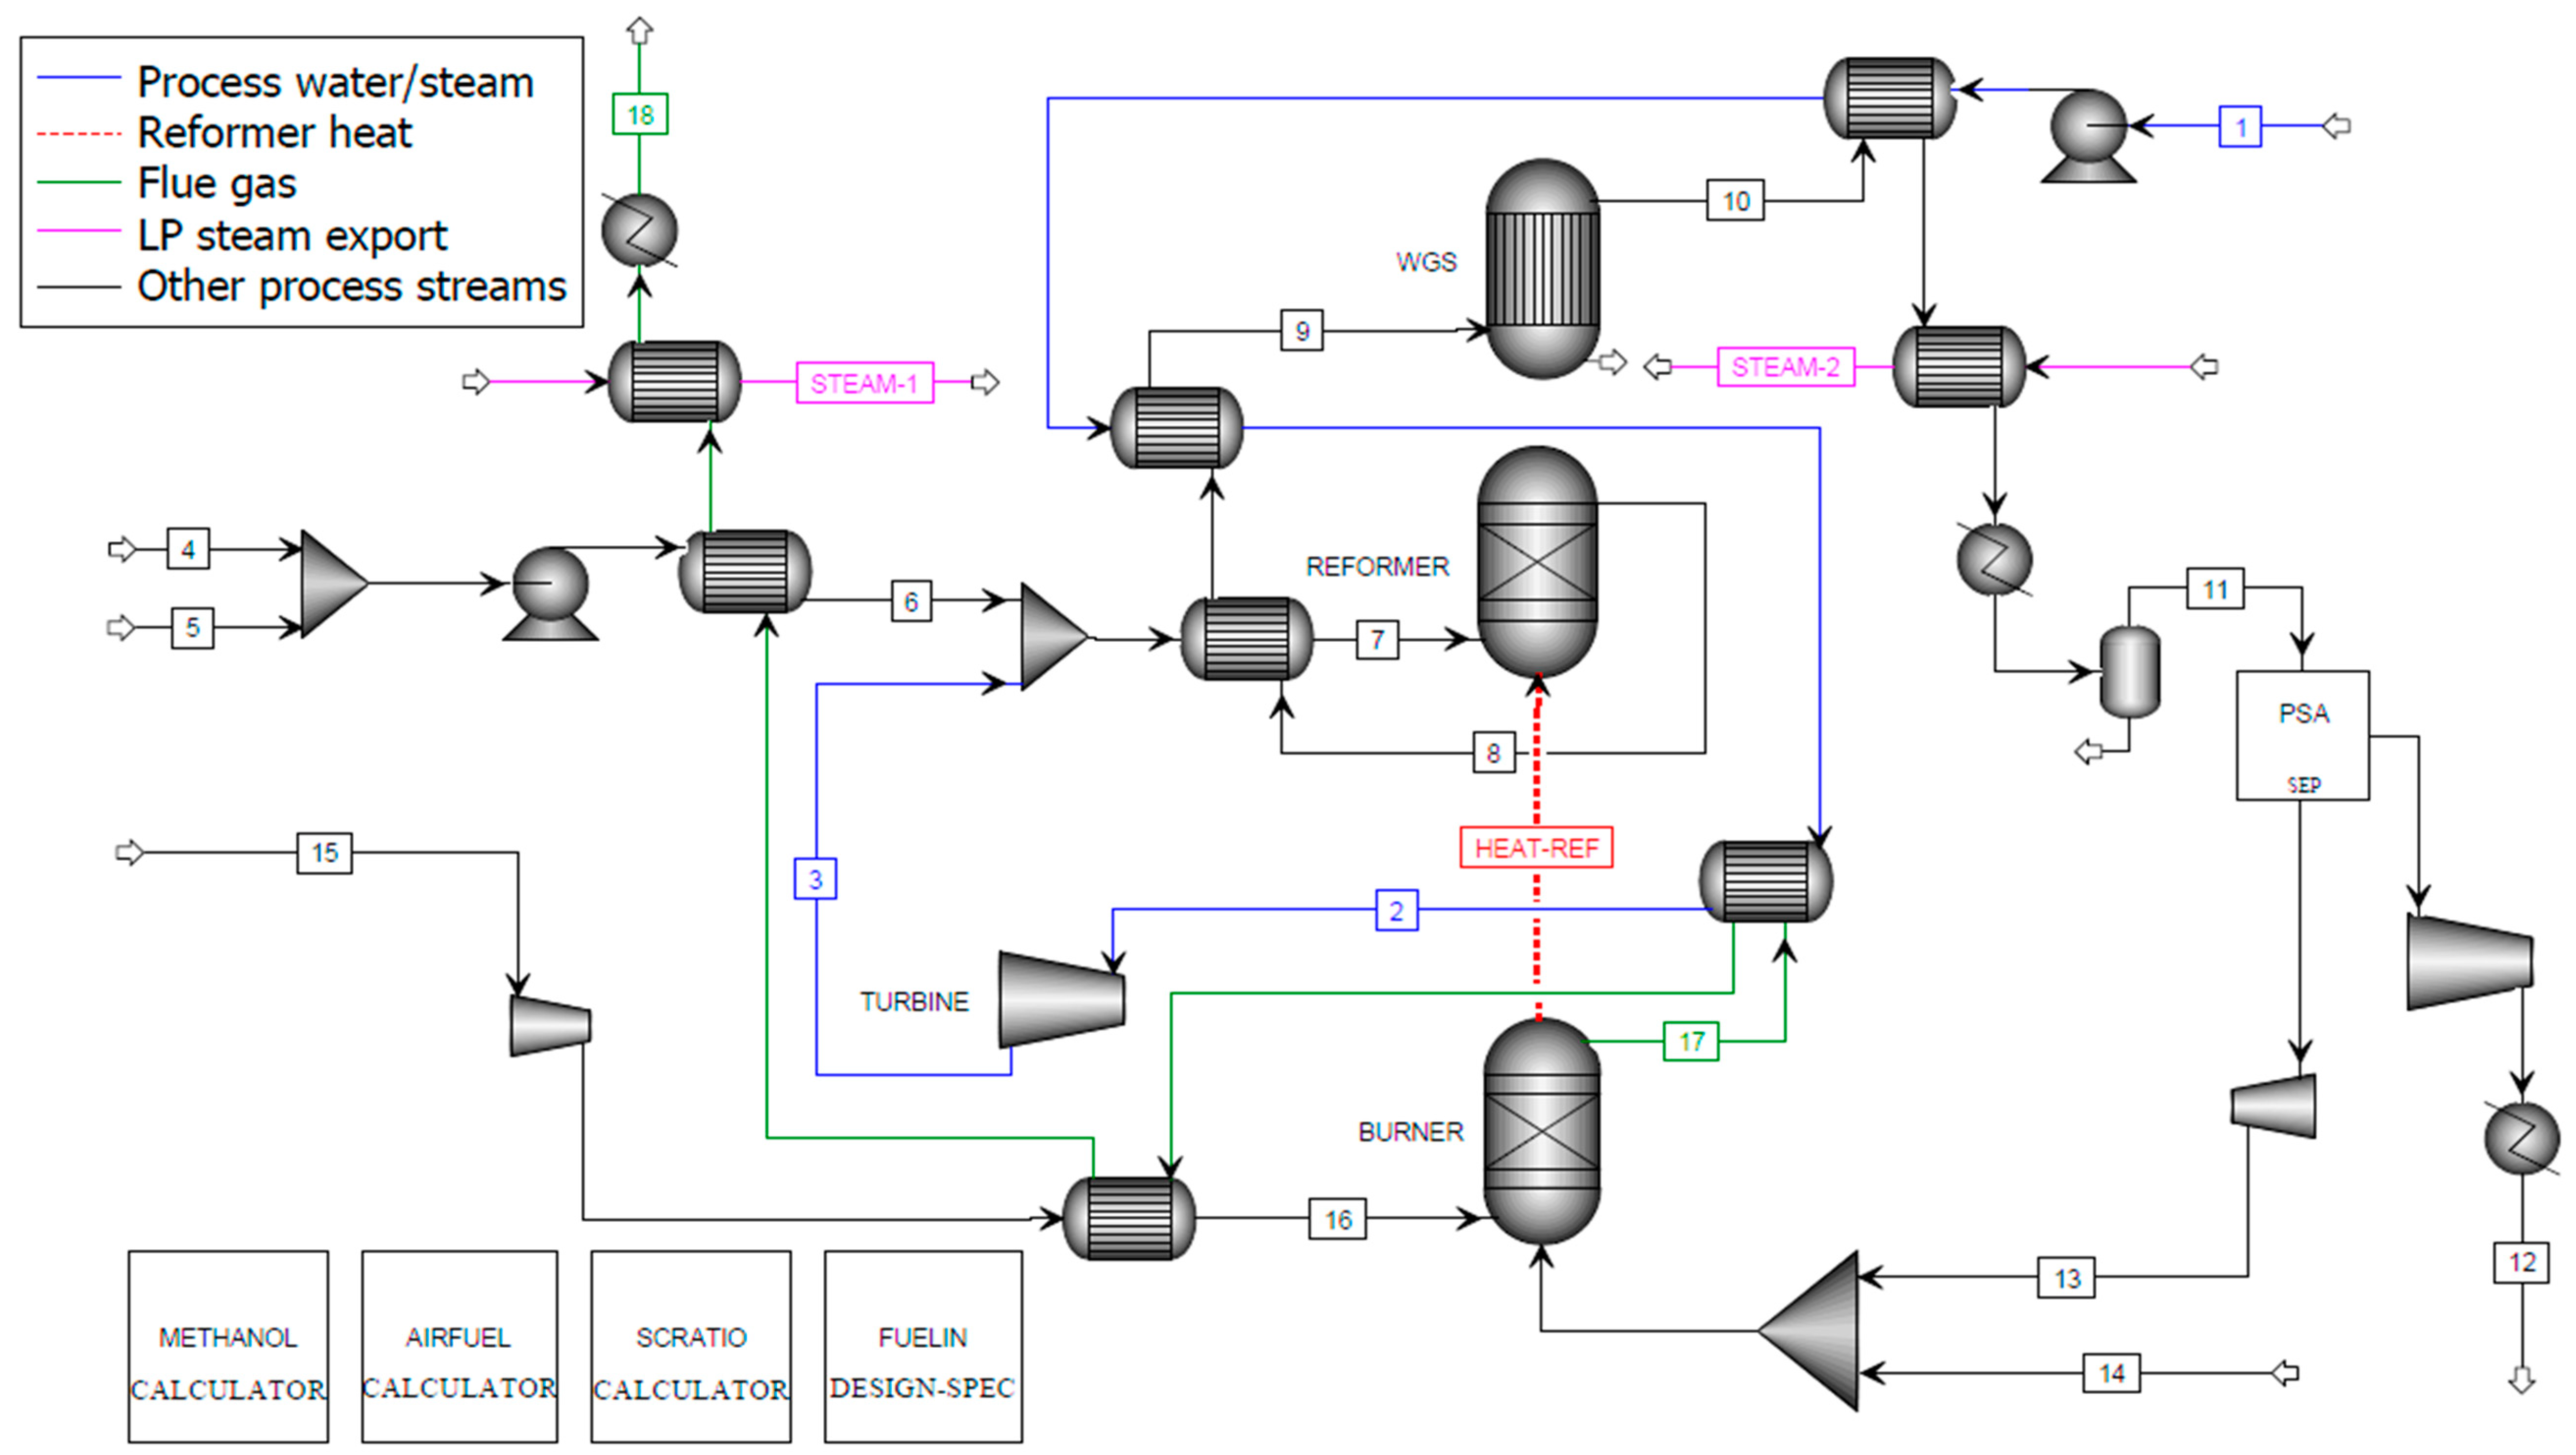
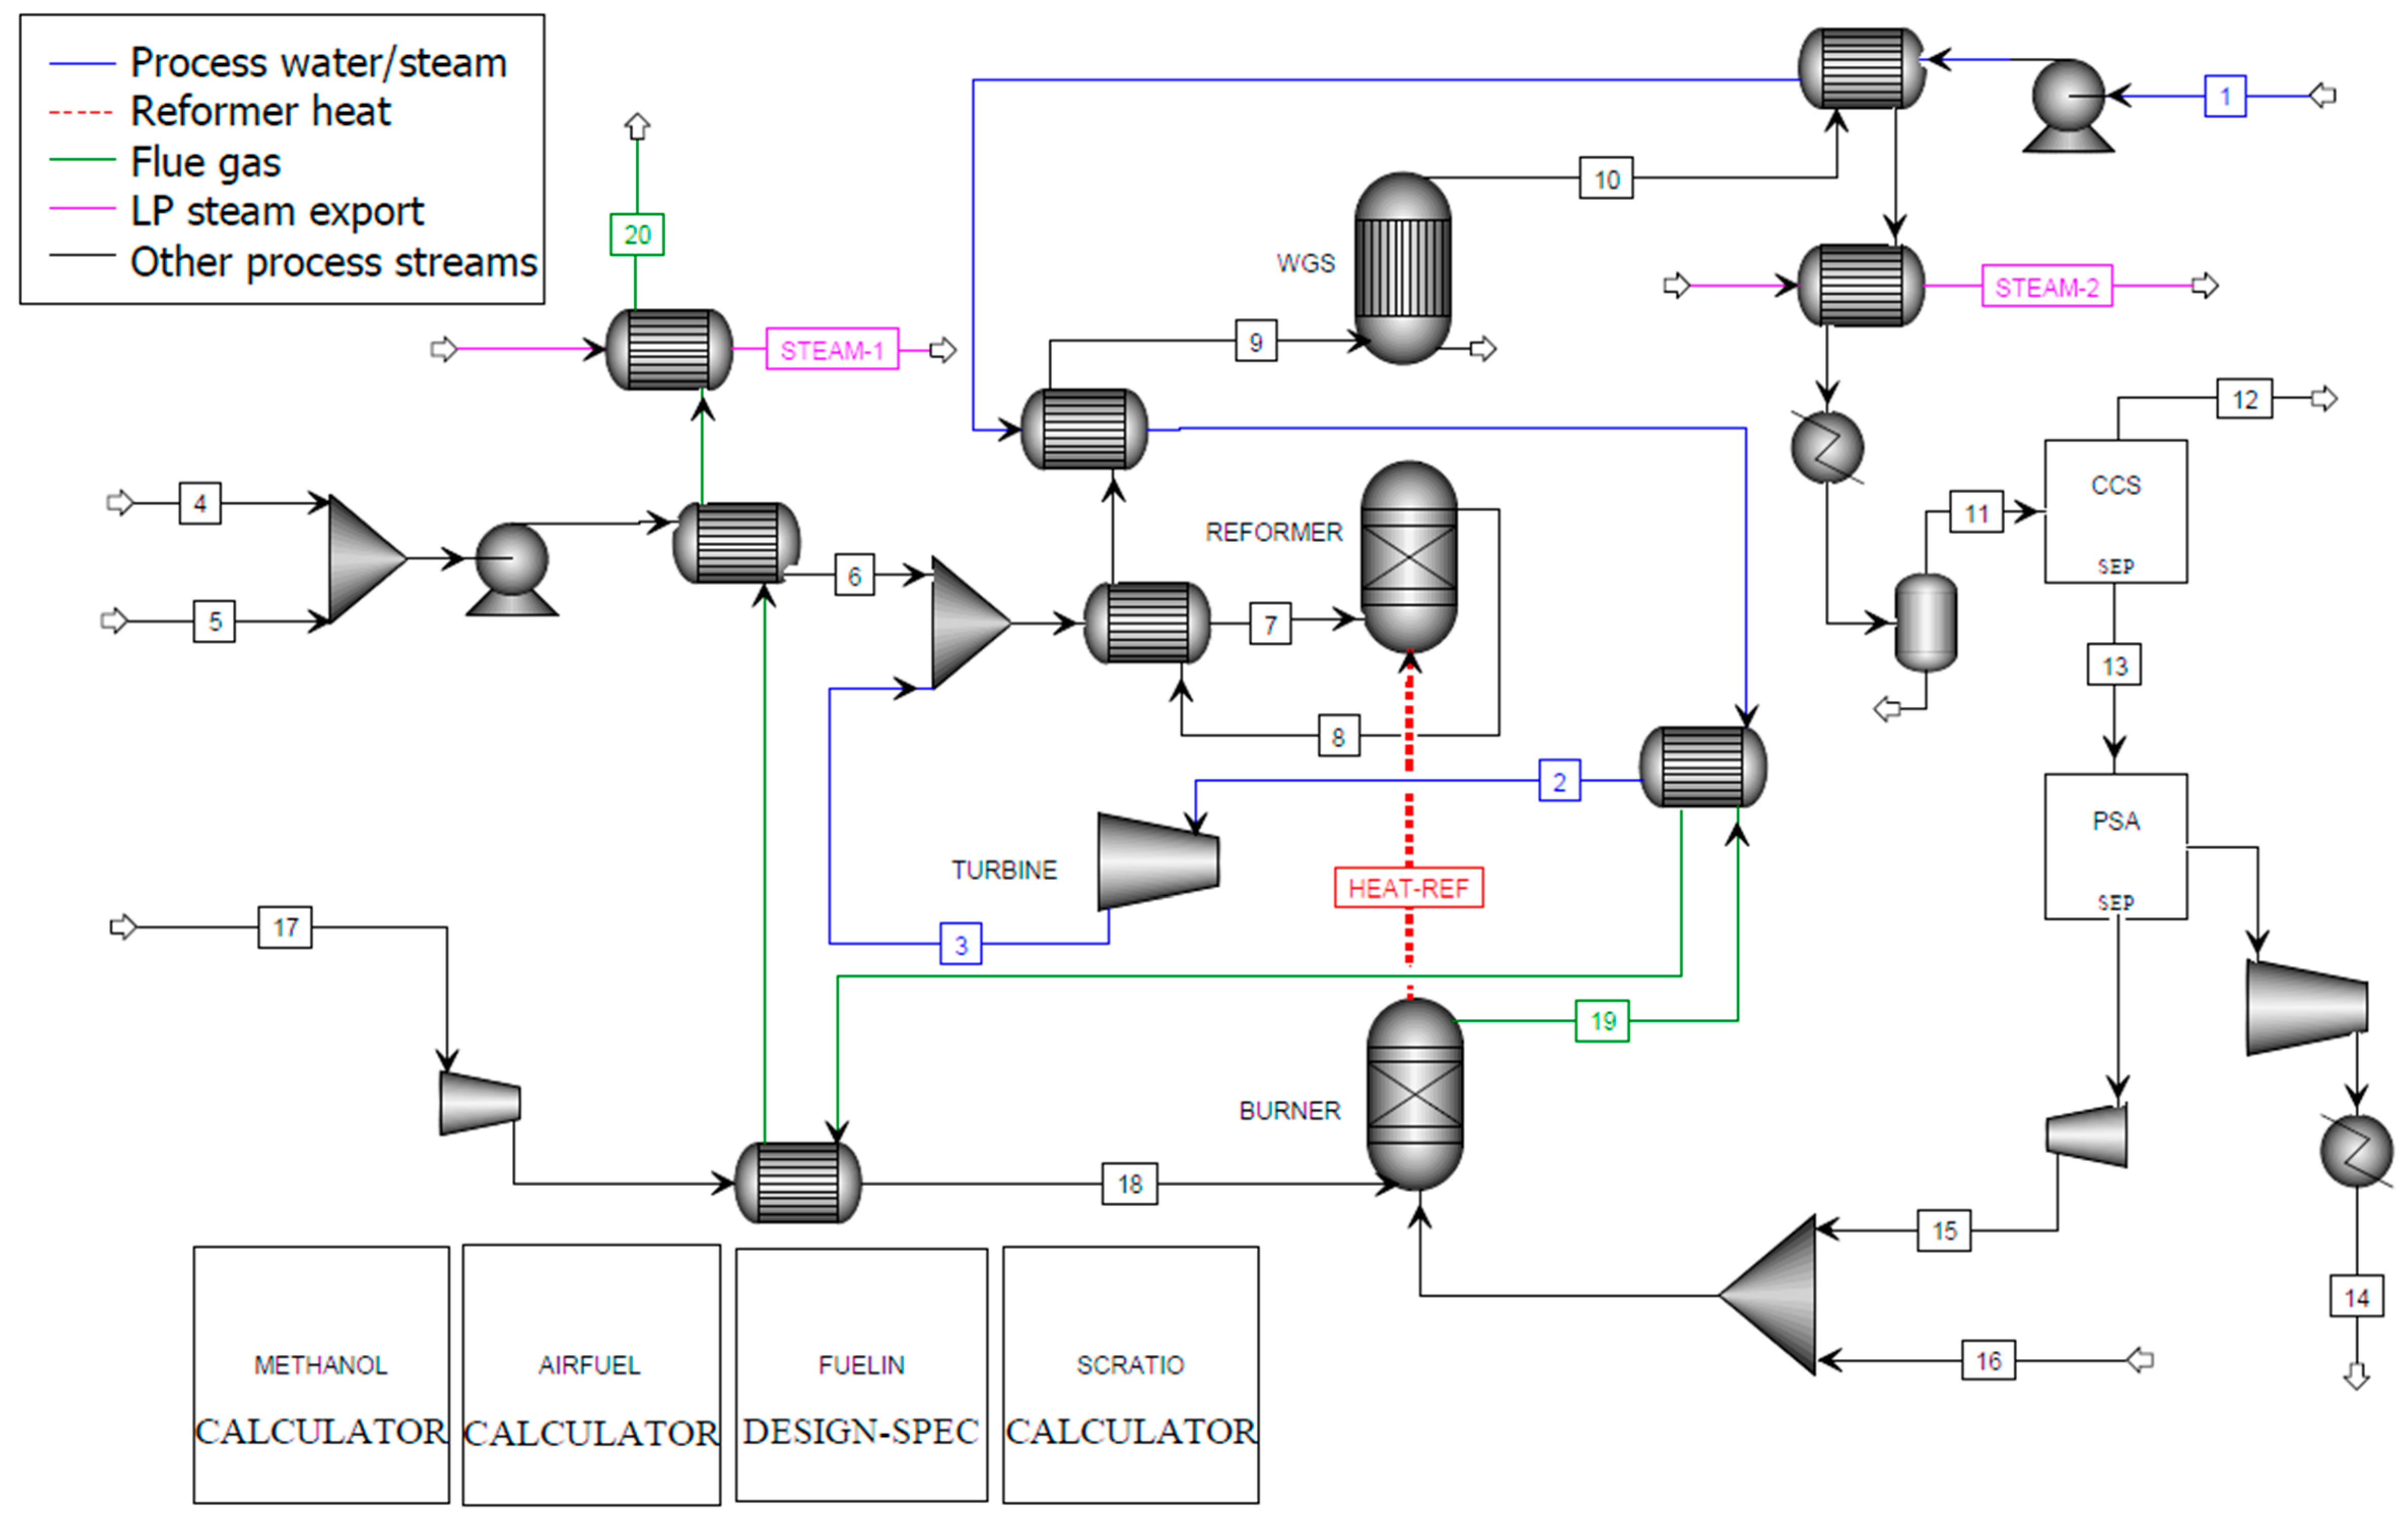
3.1.1. C-SR and C-SR-CCS
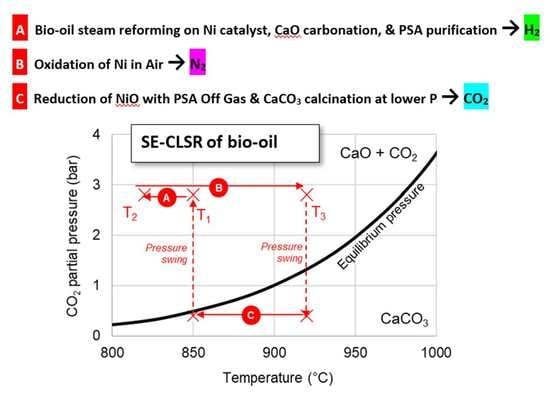
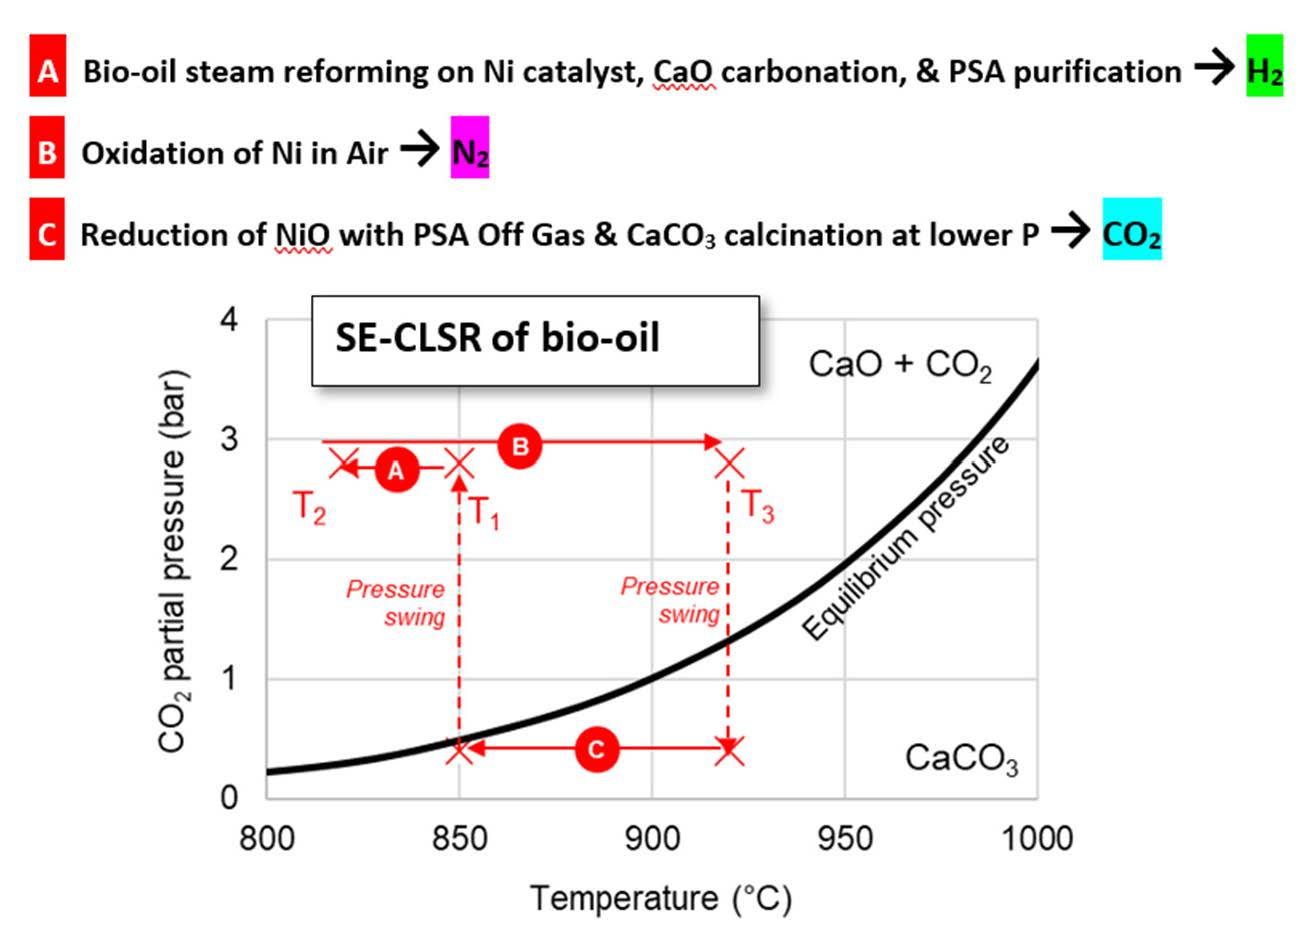
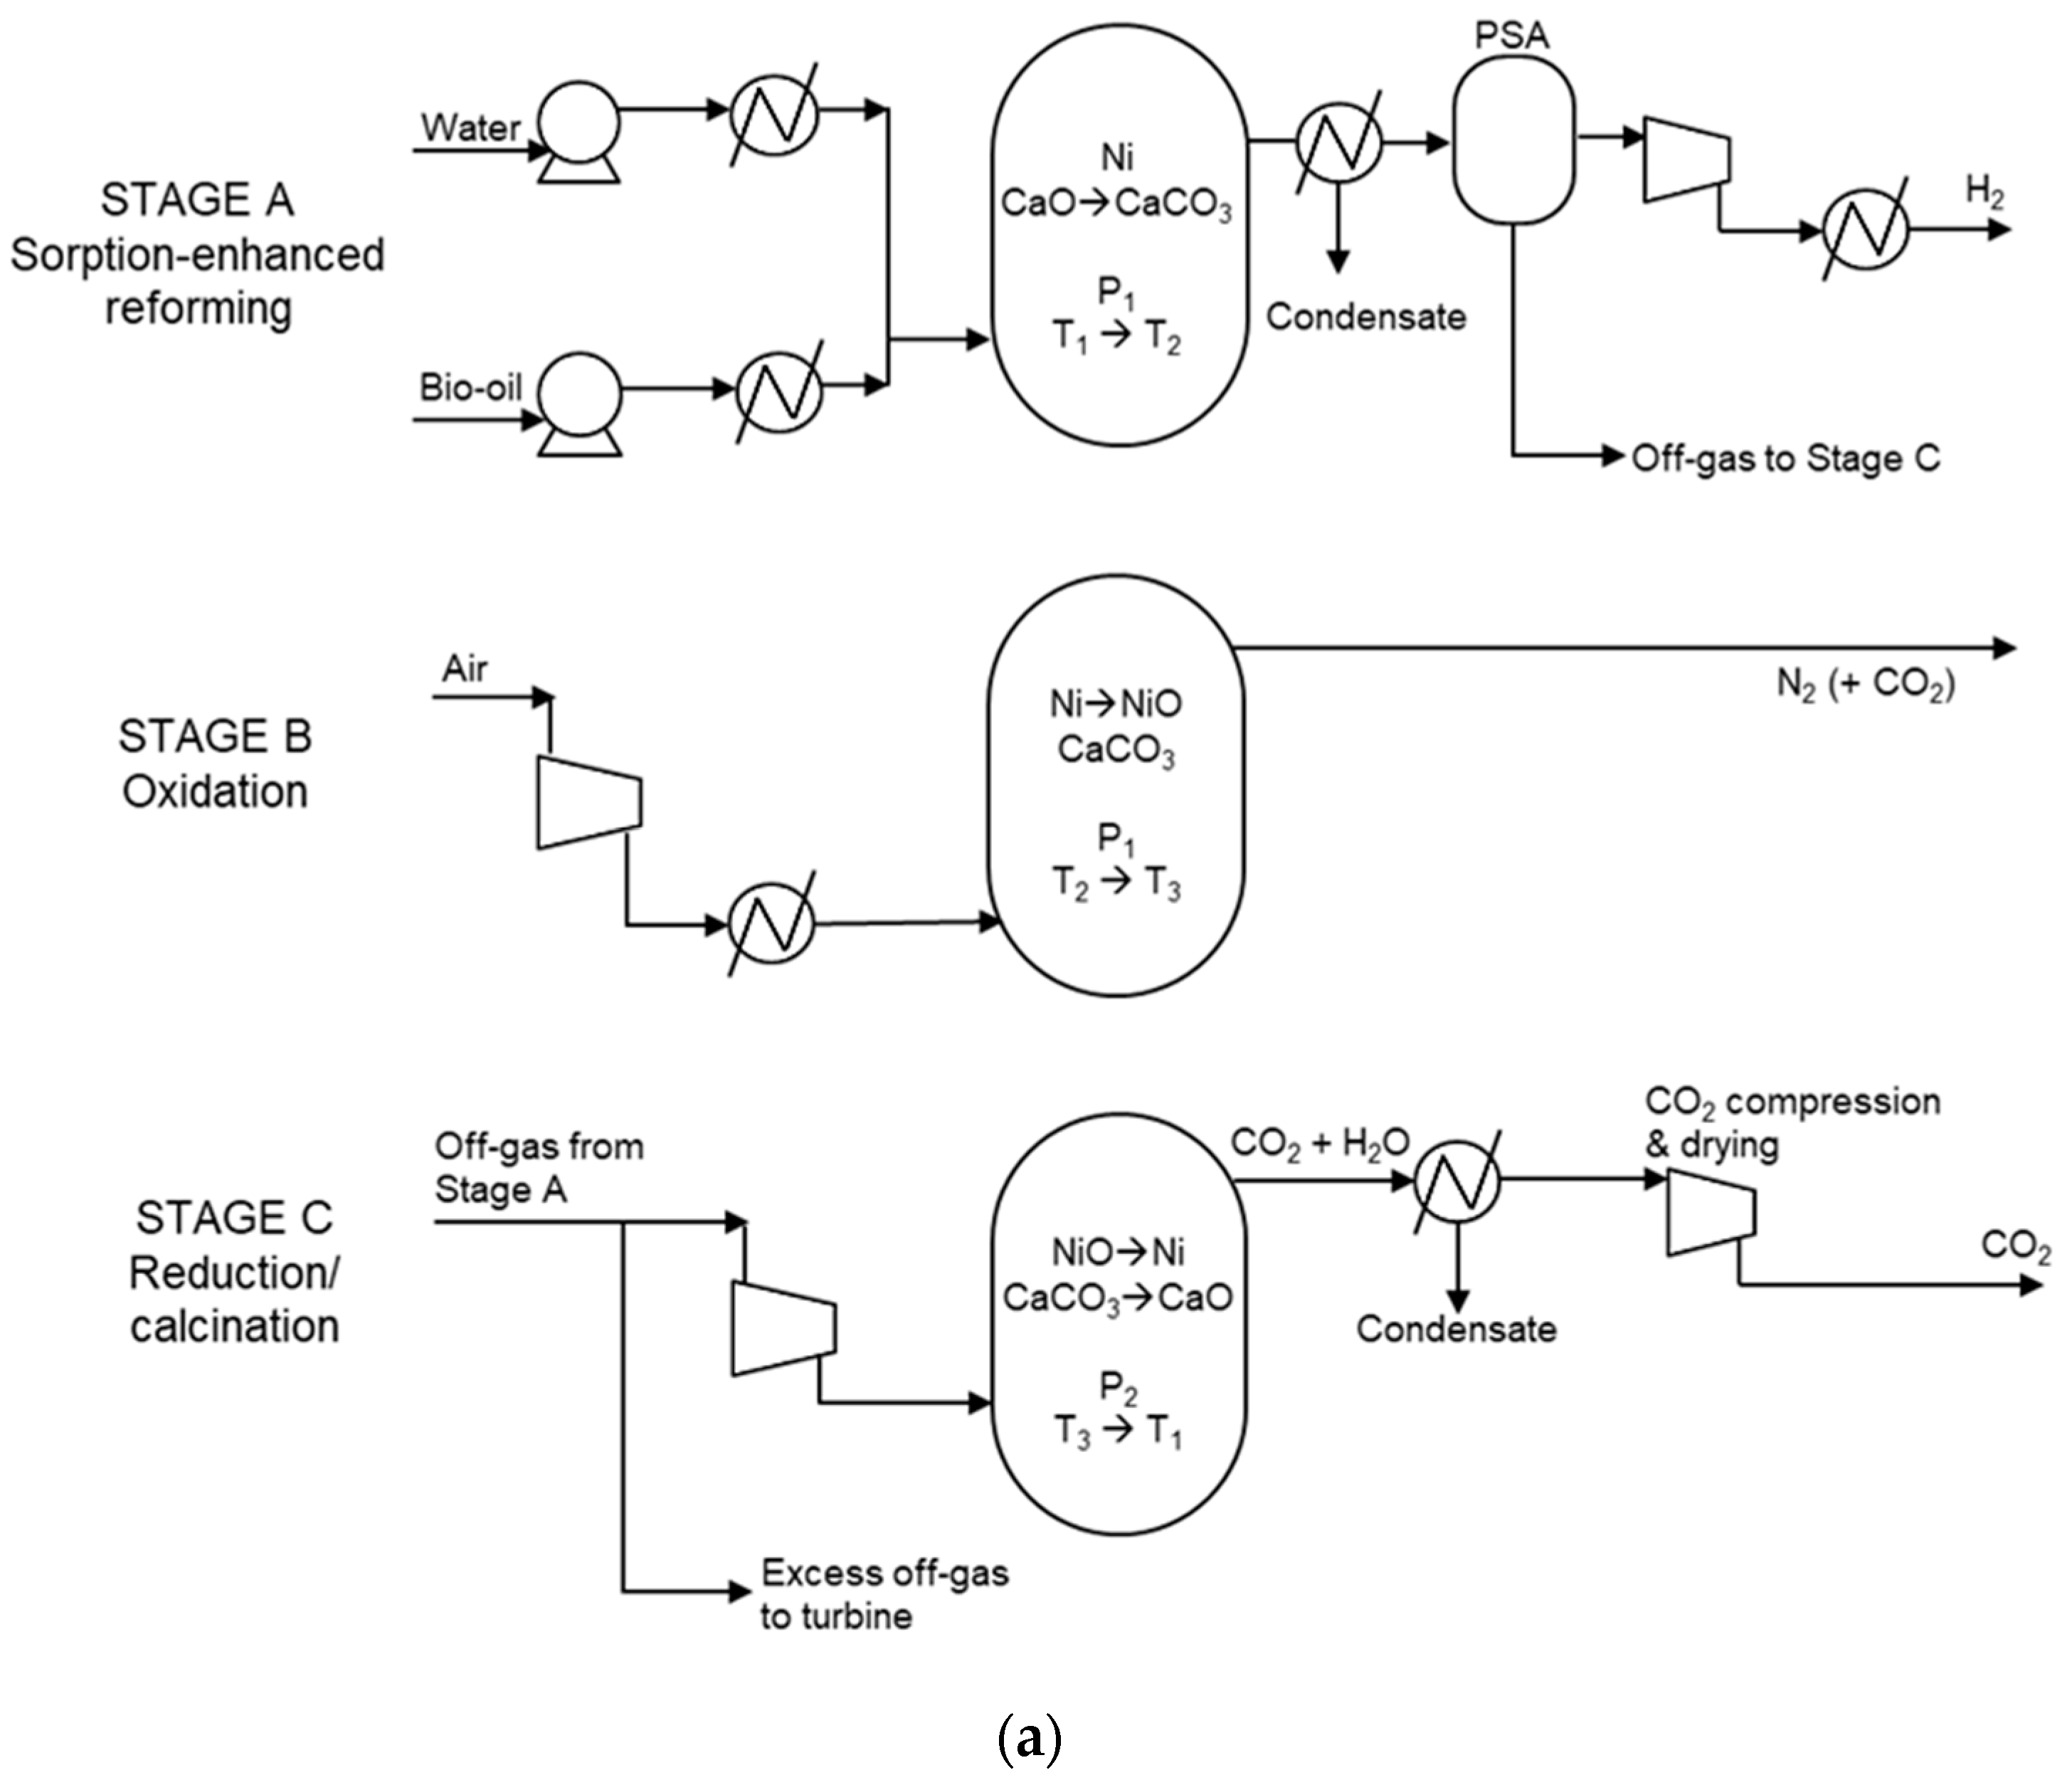
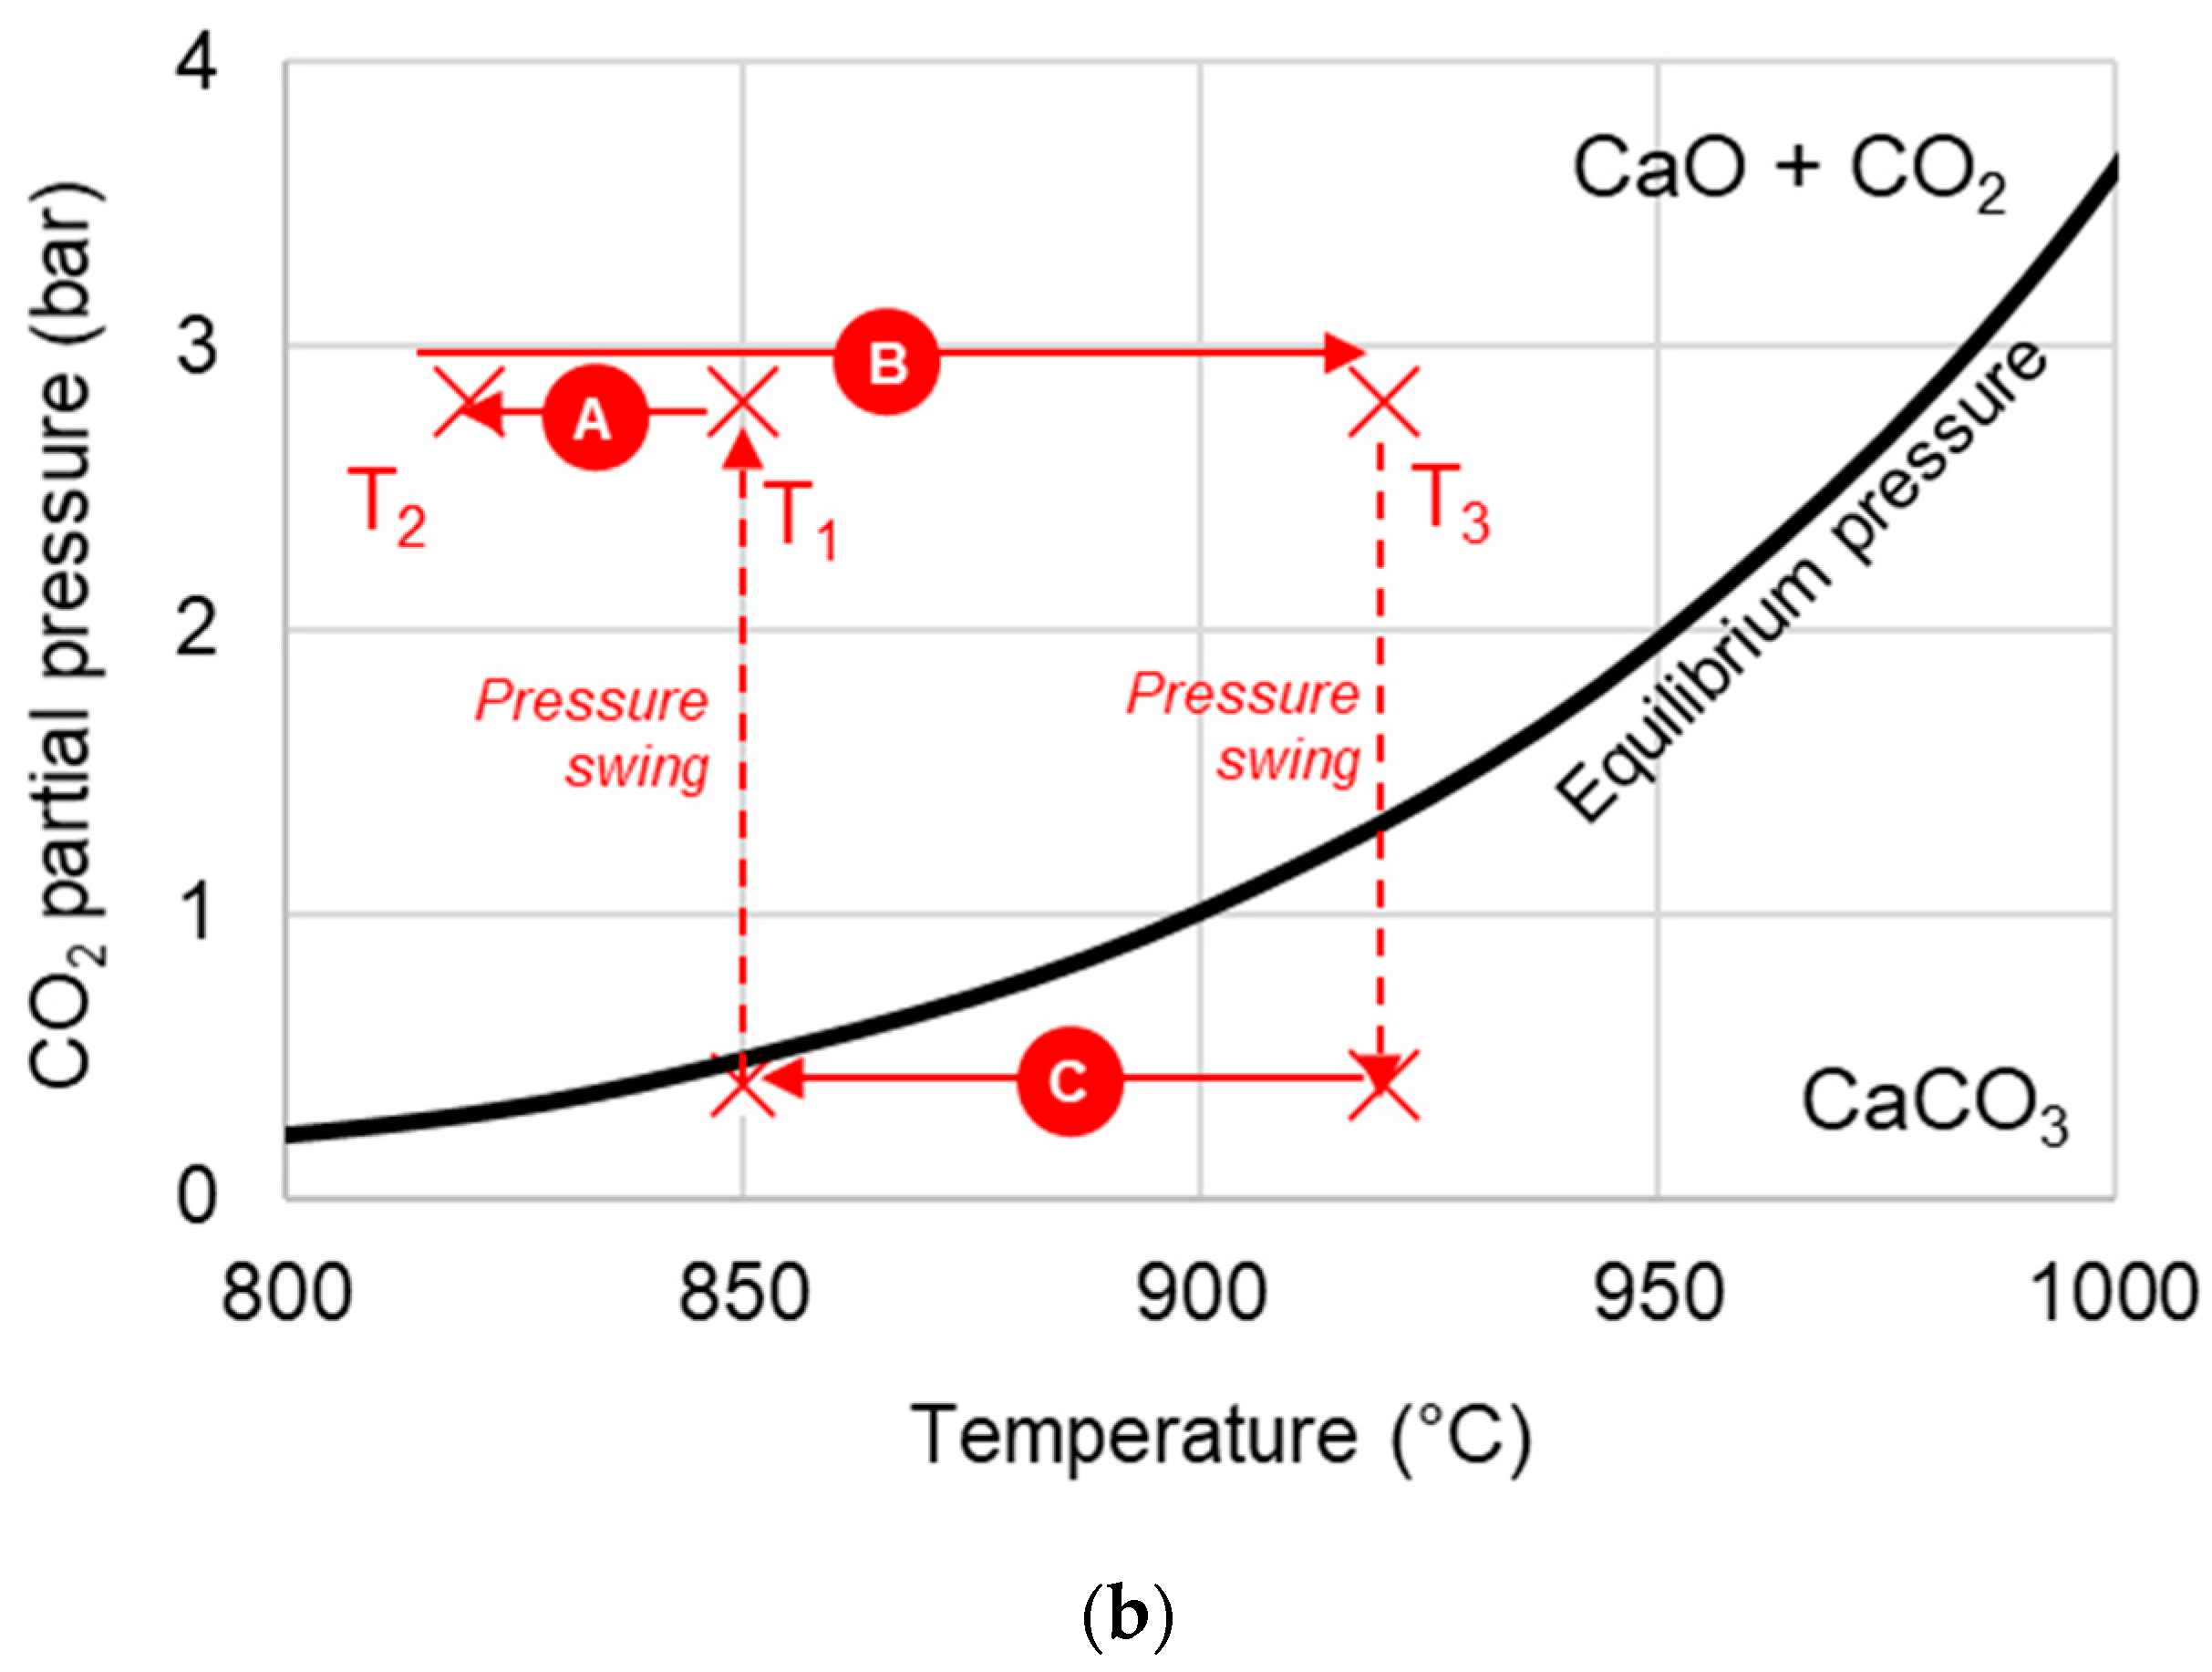
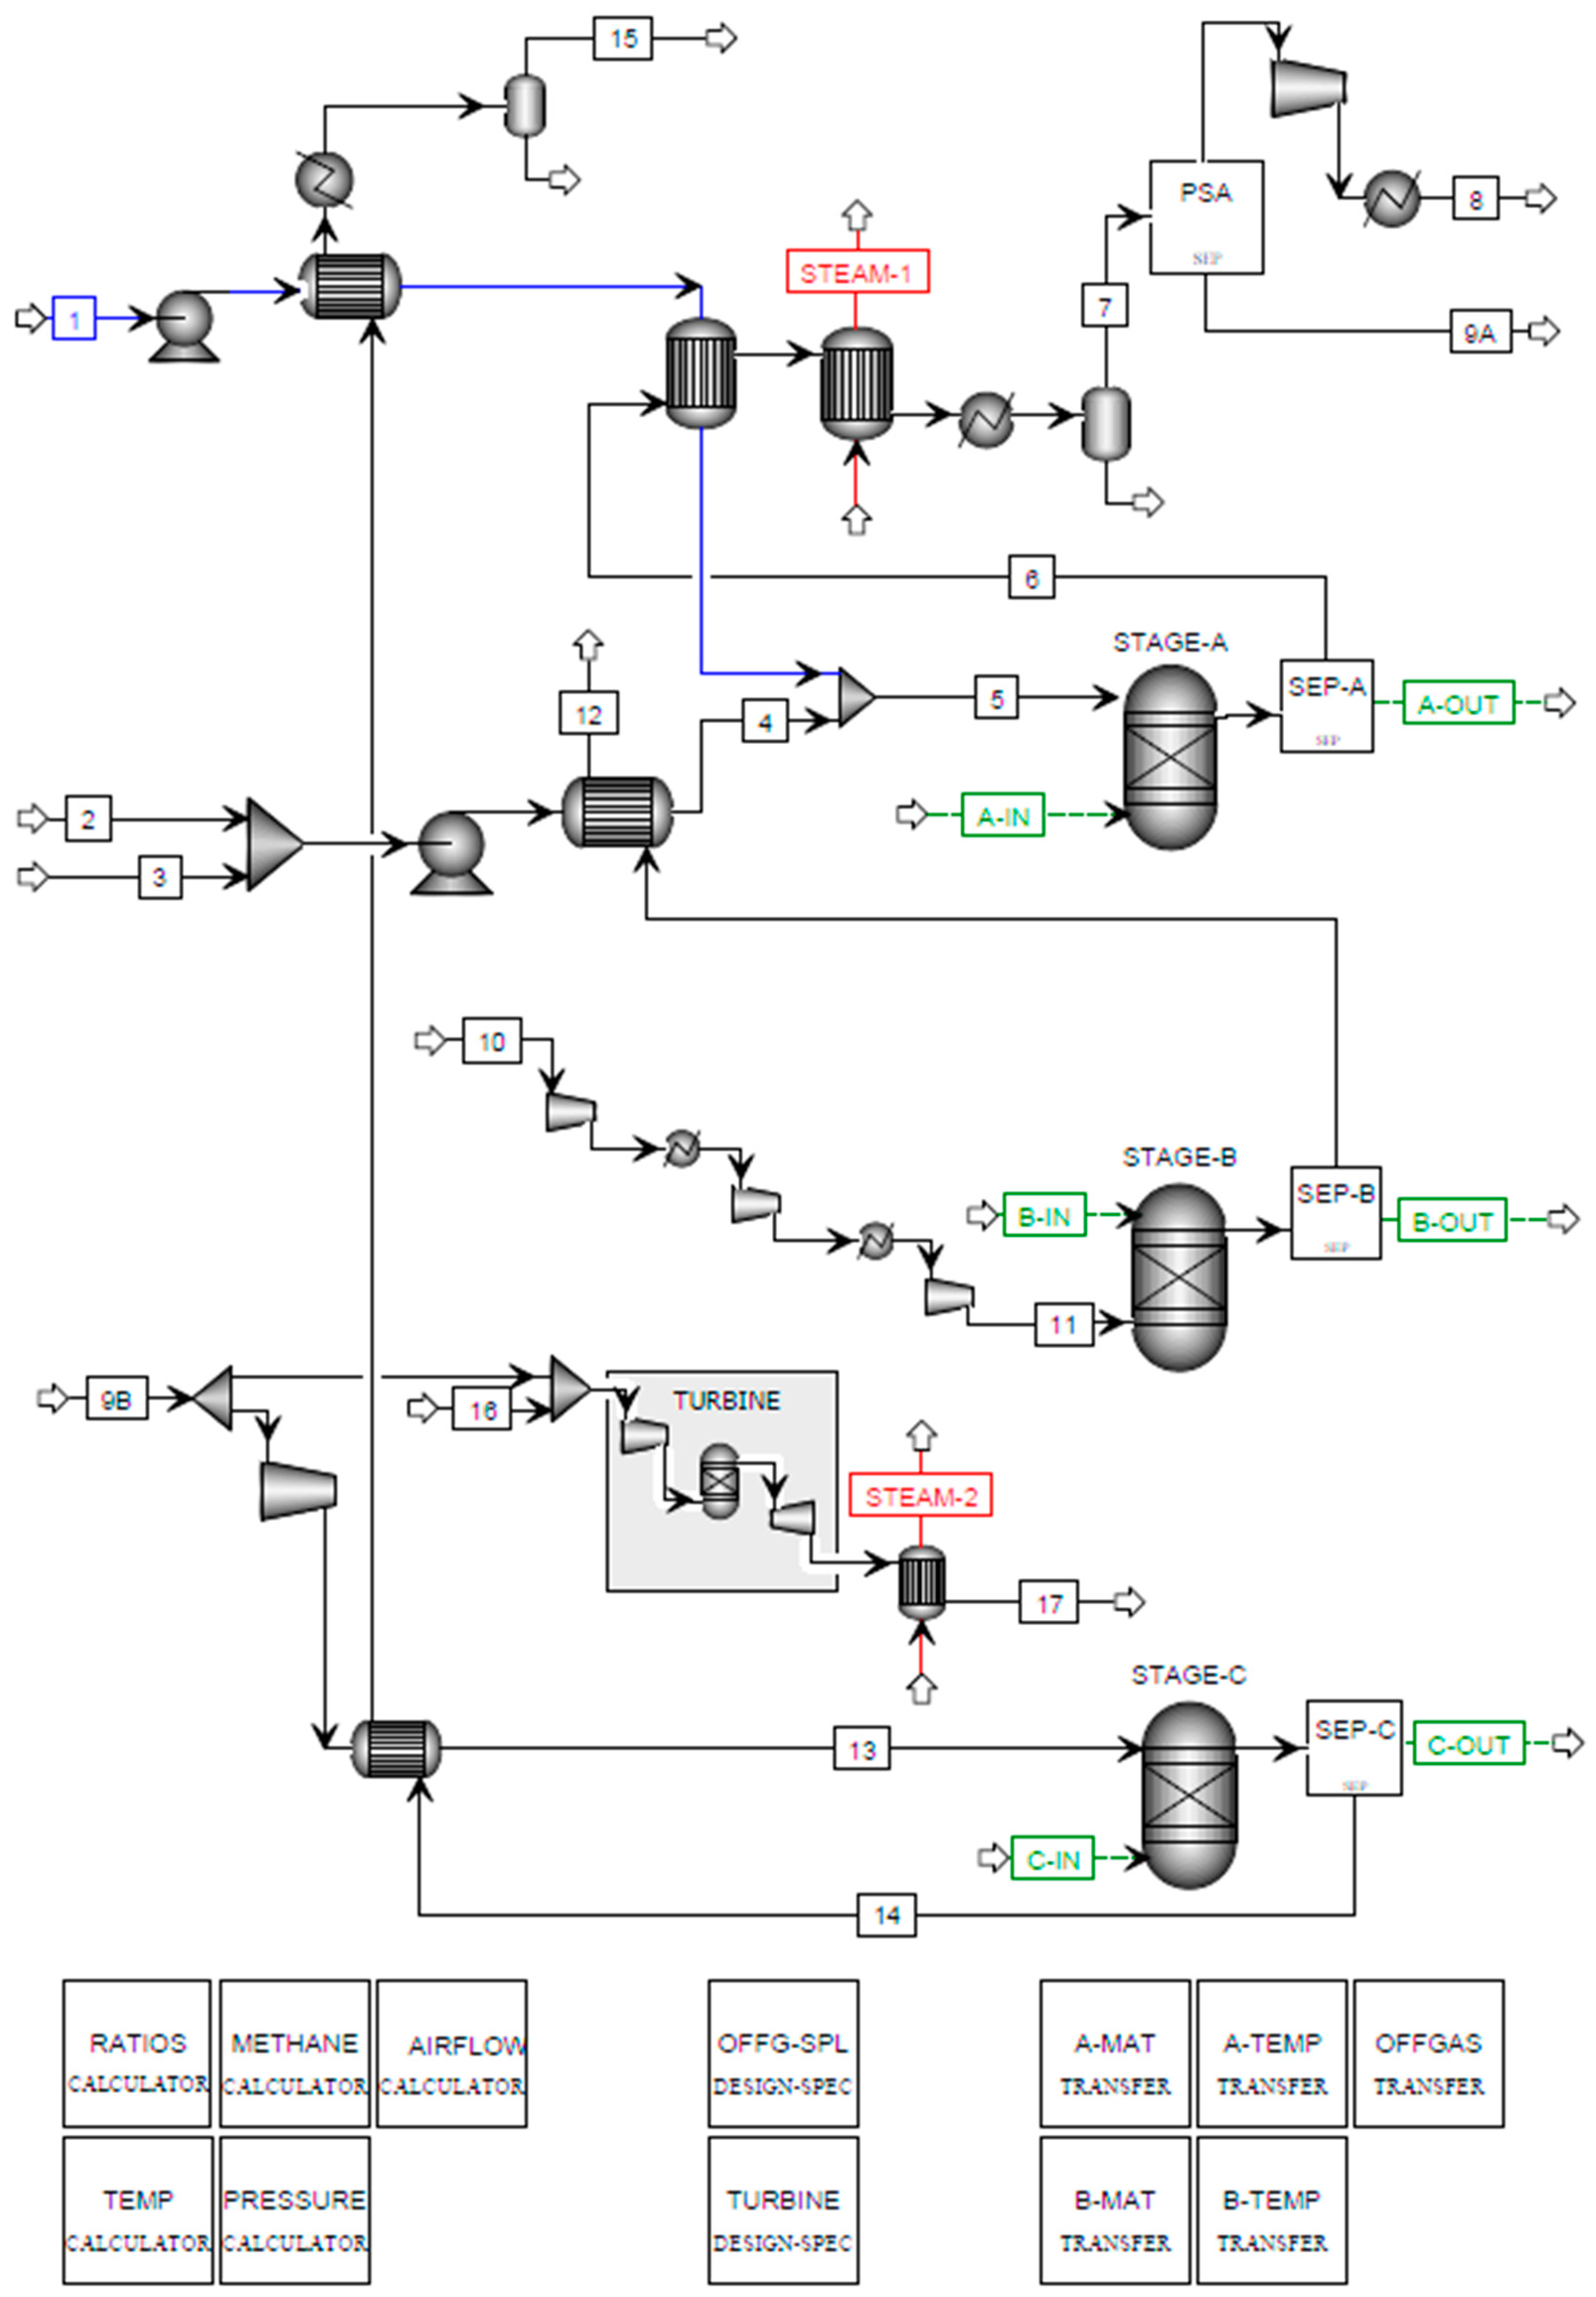
For the C-SR and C-SR-CCS processes, a reforming temperature of 900 °C was chosen, which provided close to maximum yields and thermal efficiencies. A pressure of 30 bar was also selected, which improved thermal efficiencies compared to lower pressures due to the benefits in operations such as hydrogen compression demand, despite providing lower reformer yields.
Under the C-SR scenario, increasing the S/C ratios between 3 and 7 boosted yields but decreased thermal efficiencies. The additional H2 product was outweighed by the energy demand for supporting increased steam use. However, if LP steam is exported from the system, then increasing S/C between 3 and 5 provides marginally higher efficiencies as the exported steam counters the initial energy input for raising the steam. Exporting steam tends to increase thermal efficiencies by around 10%. However, not all plants will be able to export their steam, so this should be scrutinised on a case-by-case basis.
Due to the complex impact of S/C on operation, the effect of varying S/C on LCOH at varying scales has been analysed and is presented in Figure 5. It shows that there is only a marginal difference in LCOH between S/C 3 and 5 scenarios. This arises because the increased costs to raise the additional steam are offset by increased H2 yields and furthered by steam export potential (Figure 5b). However, at S/C 7, the steam generation costs are considerably greater, causing the increase in LCOH illustrated in Figure 5. These results suggest an S/C of 5 may be optimal, especially when considering the added benefits in catalyst carbon deposition, which is not considered in the analysis. An S/C of 5 has, therefore, been selected for further economic evaluation.
Figure 5 also shows the positive impact steam export has on the LCOH, reducing the value by around 10%. This further reinforces the worth of external heat integration. For C-SR-CCS, the process analysis showed the value of utilising the excess reforming heat within the CO2 capture process and therefore holds inherent value.

3.1.2. SE-CLSR

Sensitivity analysis with the SE-CLSR process showed that increasing the temperature (T1 as in Figure 1b) above 850 °C decreases the overall yield, as does increasing the S/C ratio. Therefore, 850 °C was selected for the base scenario and further analysis. The higher NiO/C ratio required with high S/C ratios to sustain the autothermal temperature cycle increases bed heat capacity, oxidation air requirement, and off-gas used for reduction. Therefore, both yield and thermal efficiency are reduced with the higher solids inventory associated with greater NiO/C ratios. For this reason, a low S/C ratio of 2 and NiO/C ratio of 0.7 were selected for further techno-economic analysis.
If steam export is not included in the SE-CLSR process, increasing pressure between 20 and 40 bar leads to an approximately 5% drop in thermal efficiency. However, if steam export is considered, thermal efficiency is not significantly affected by changes in pressure, as the ability to export spare heat compensates for the drop in hydrogen yield. A pressure of 20 bar was selected for further analysis, as the condition fits both scenarios.

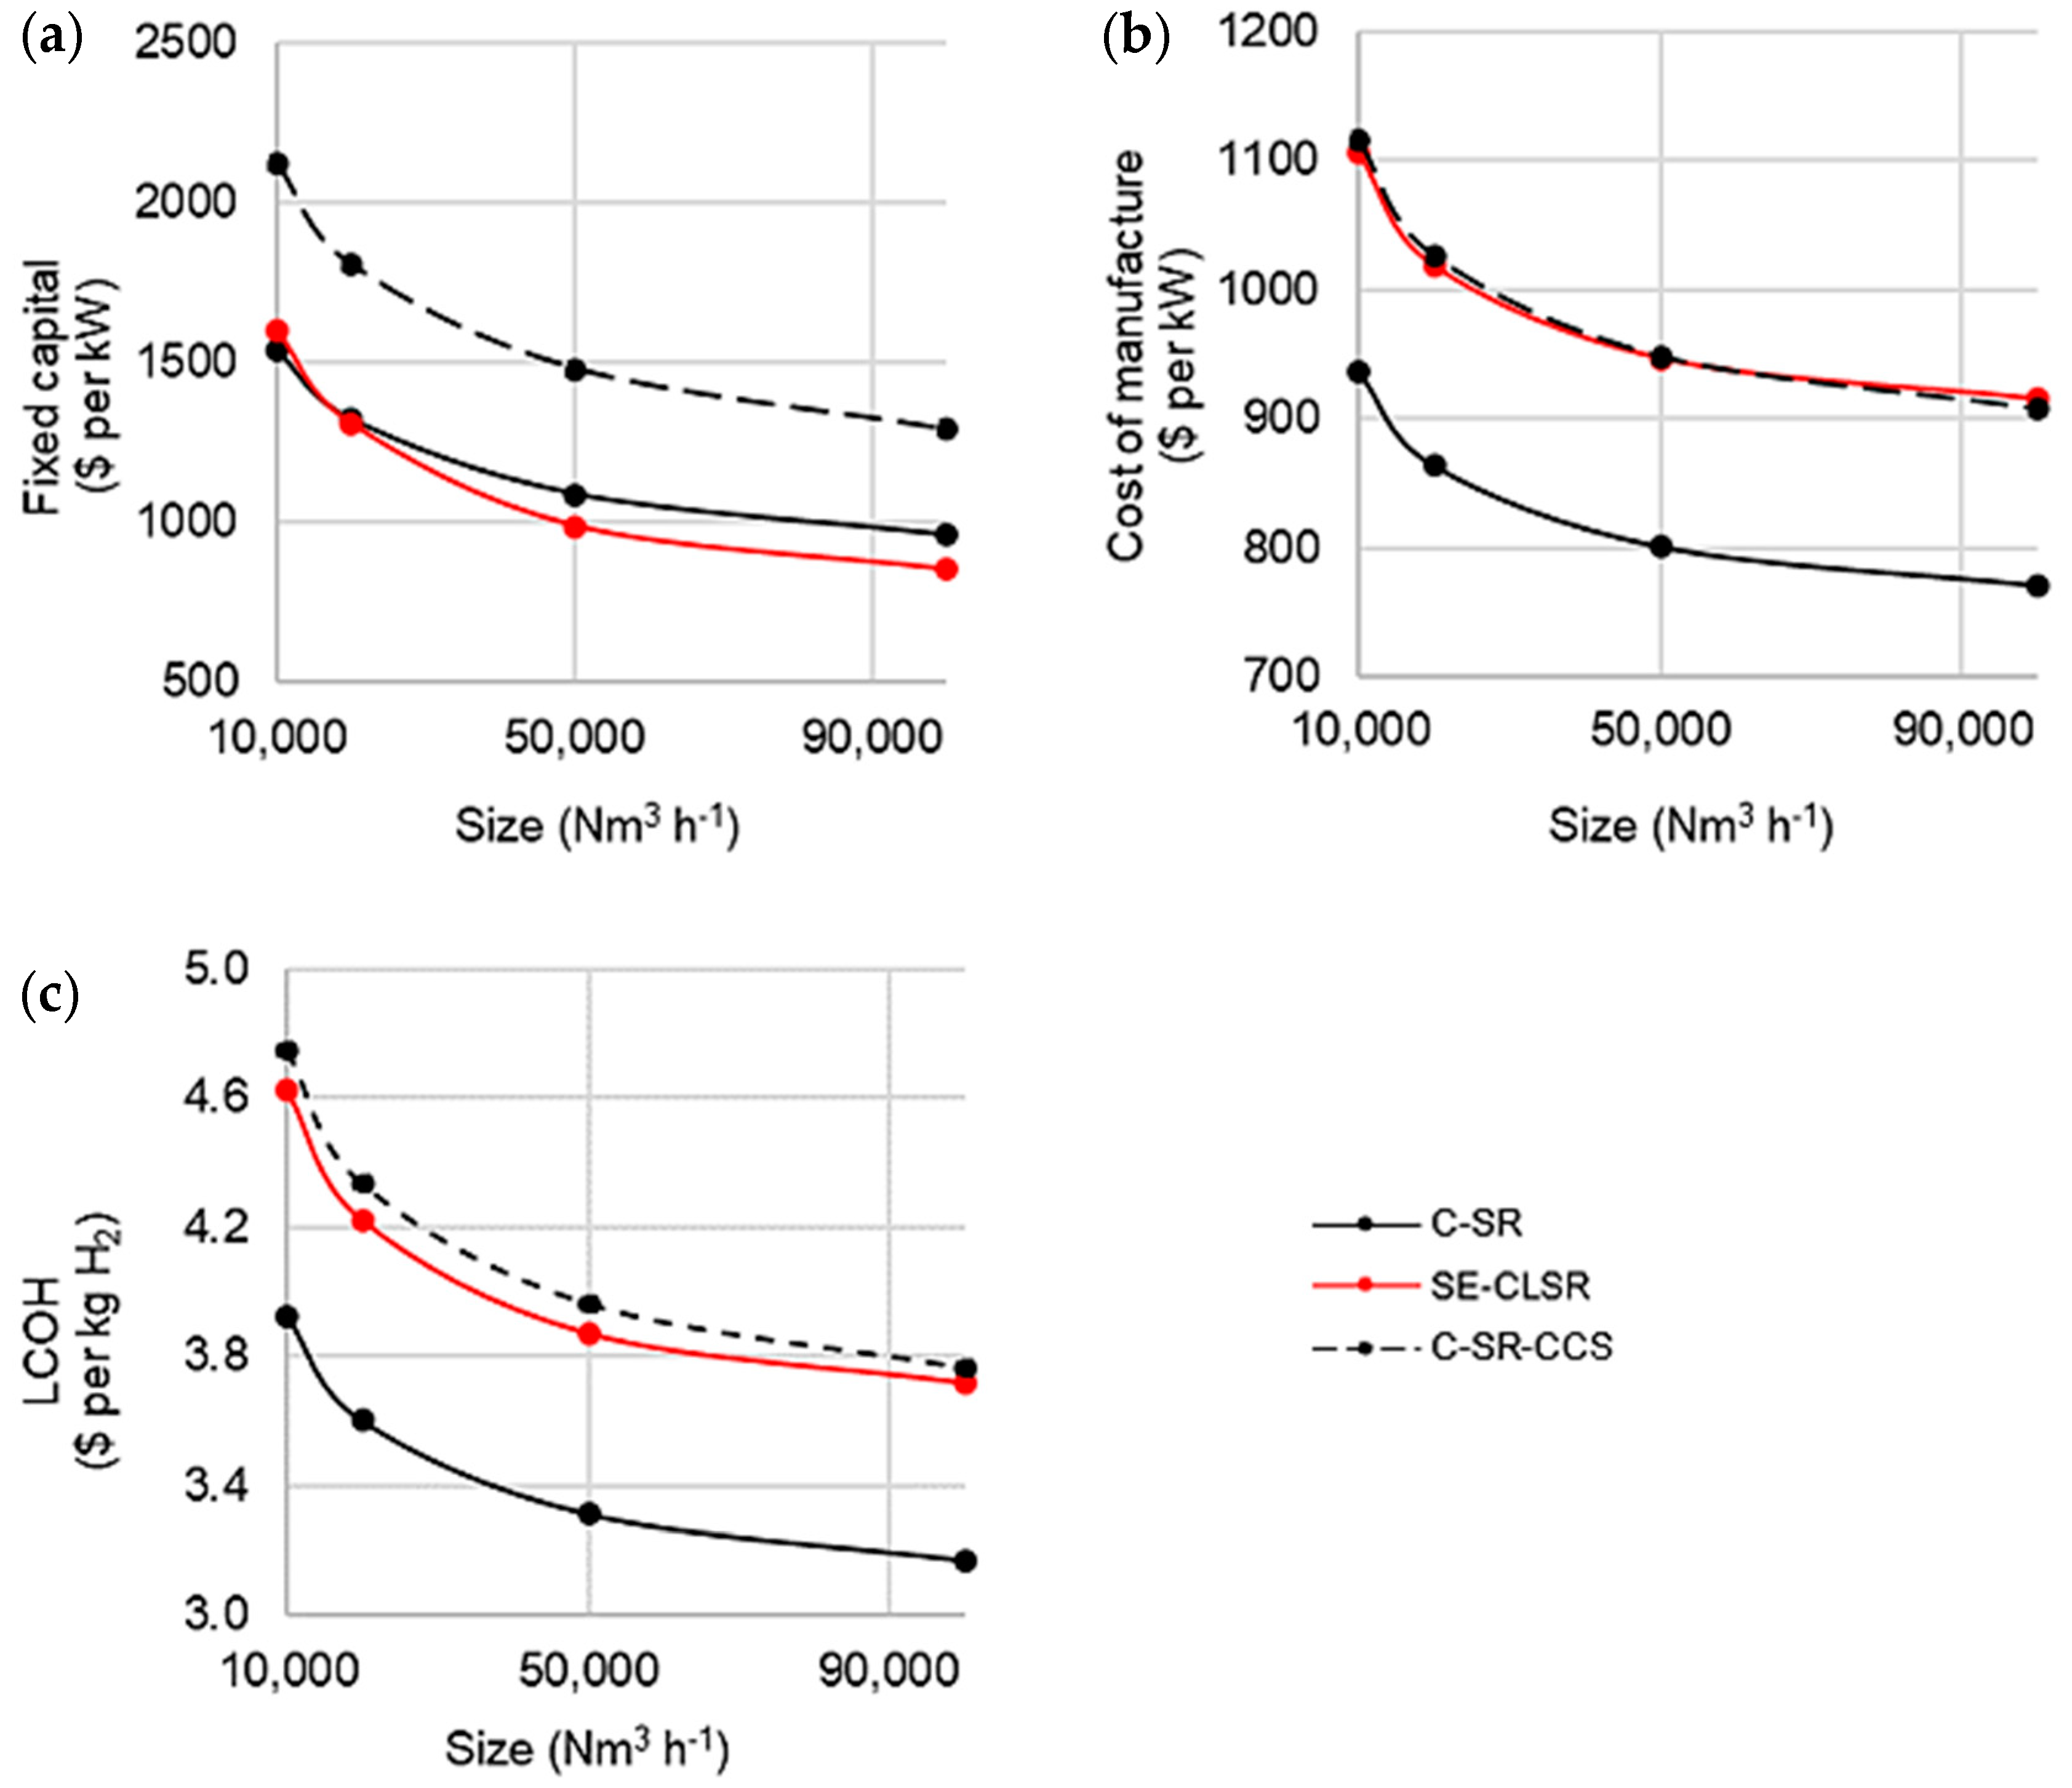
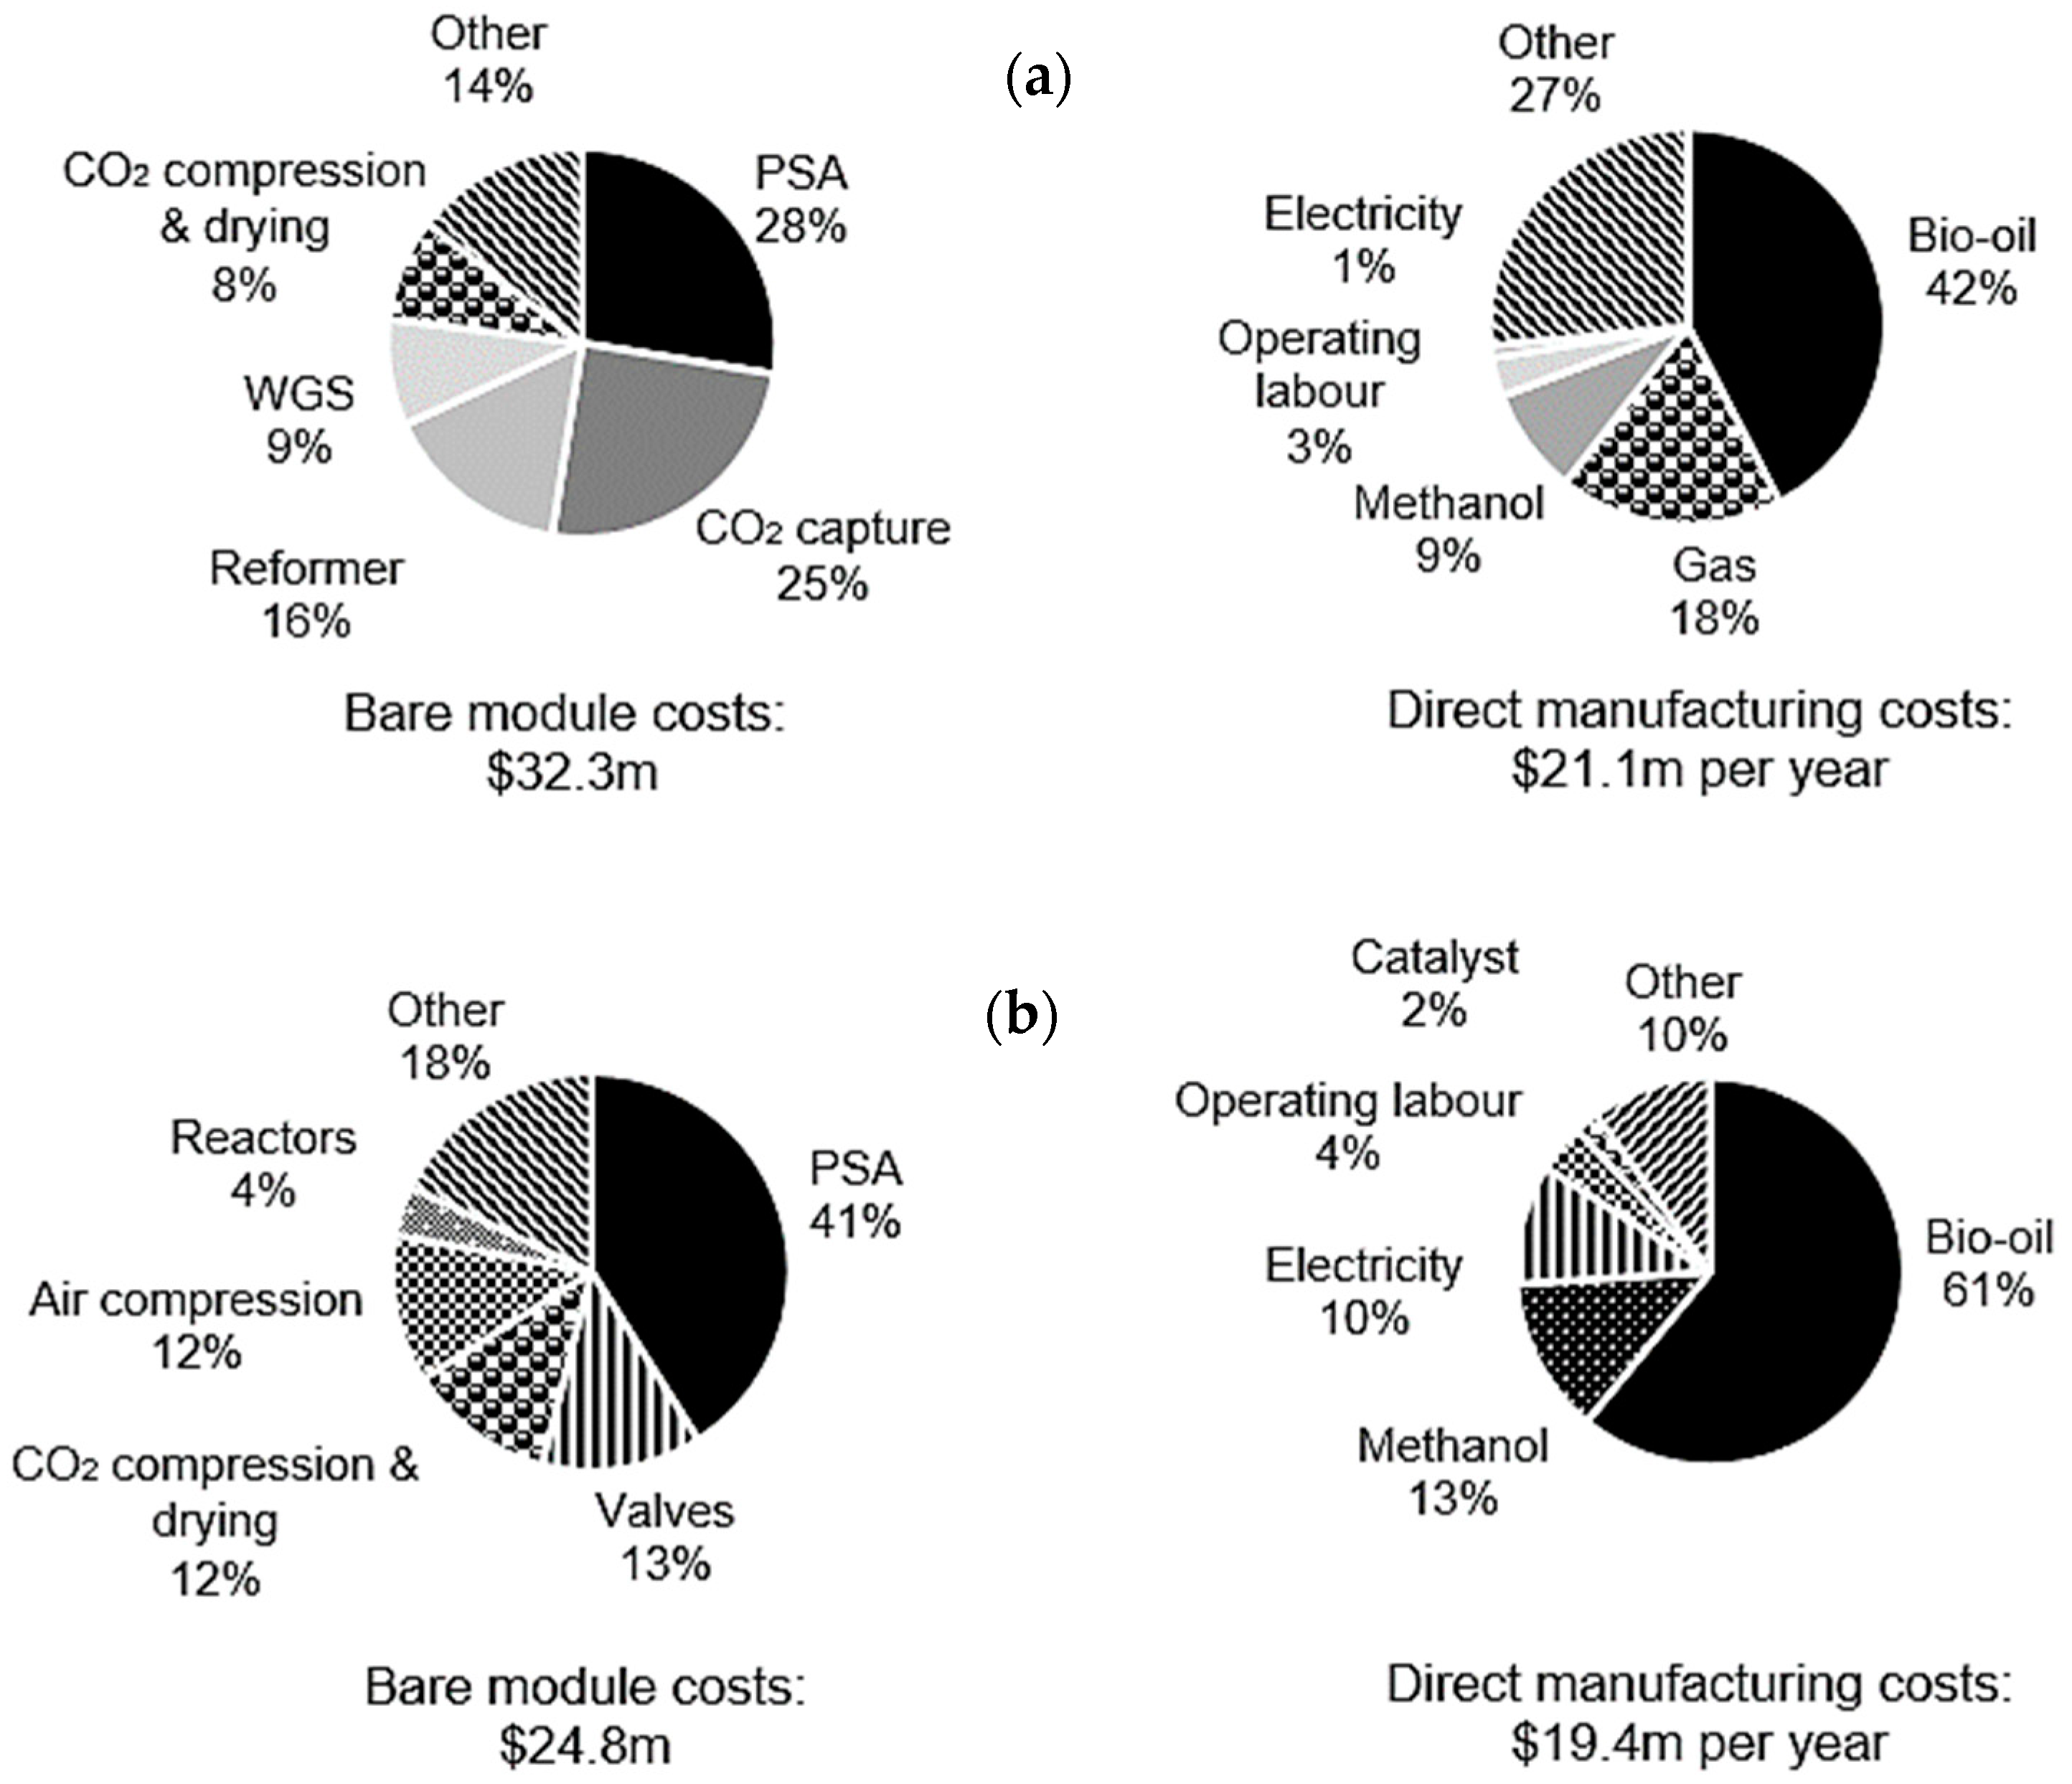
3.2. Process Cost Comparison

The three processes applied with conditions selected in the design basis were compared for economic performance. Fixed capital, cost of manufacture, and LCOH results against capacity are presented in Figure 6. Here, the benefit of economies of scale is clear. For example, in the case of SE-CLSR, LCOH is reduced by 19%, from USD 4.63 to USD 3.76 per kg H2 with an increase in process size from 10,000 to 100,000 Nm3 h−1.
The LCOH for both SE-CLSR and C-SR-CCS is, as expected, greater than that of C-SR without CCS, reflecting the costs of CO2 capture capabilities. SE-CLSR has comparable fixed capital requirements to C-SR, but that is countered by the high costs of manufacture forecasted for SE-CLSR. Nonetheless, the comparatively lower fixed capital range for SE-CLSR is reflected in a marginally lower LCOH than for C-SR-CCS. However, accounting for a level of uncertainty, the significance of this difference may be questioned.
Although the LCOH for each process option may be higher than that of other hydrogen production methods [65], these process options may still be competitive. Their low-carbon/carbon-negative status provides additional value. Additionally, the Hydrogen Council projects that H2 costs at the pump of USD 6 per kg would still be cost-competitive for 15% of transport energy demand by 2030 [66].
The bare module and manufacturing costs have been broken down further for interpretation as displayed in Figure 7 for C-SR-CCS and SE-CLSR. For both processes, the PSA is the most costly module at 28% and 41% of totals for C-SR-CCS and SE-CLSR, respectively. The CO2 capture unit for C-SR-CCS is a further 25%. This brings the total cost of gas separation in C-SR-CCS (PSA and CO2 capture) to 53% of the total, whereas an equivalent CO2 capture unit is not required for gas separation in SE-CLSR. The three-way valves incorporated in SE-CLSR also contribute significantly at 13% of the total cost.
Under both scenarios, bio-oil purchasing presents the most substantial manufacturing cost at 42% and 61% of the total for C-SR-CCS and SE-CLSR, respectively. The greater influence of bio-oil on SE-CLSR manufacturing cost is the case, in part, because of the heat supplied from the bio-oil/methanol feeds rather than a cheaper fossil-fuel alternative, such as natural gas. Nonetheless, the emission reduction potential is highly attractive and should be factored into assessments. The electricity demand is also a noteworthy contributor to SE-CLSR operating costs, highlighting potential benefits from optimising towards greater self-sufficiency.

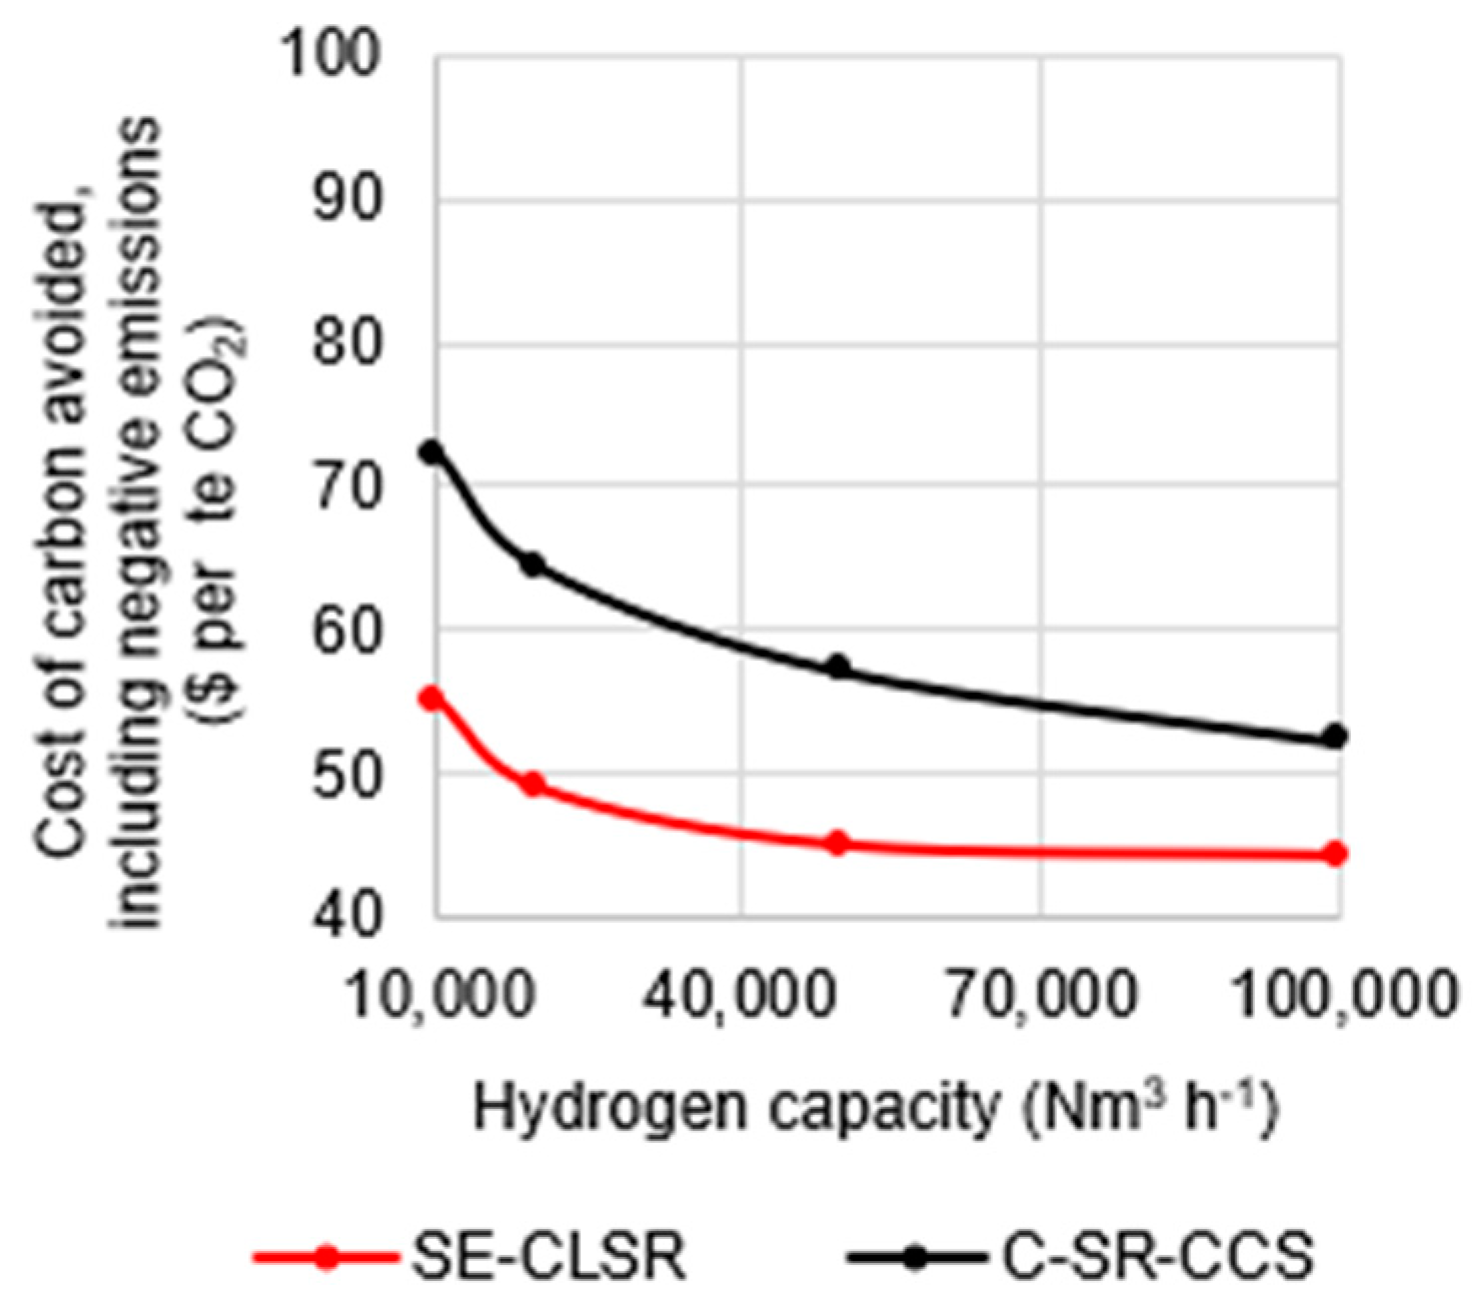
3.3. Carbon Emission Comparison
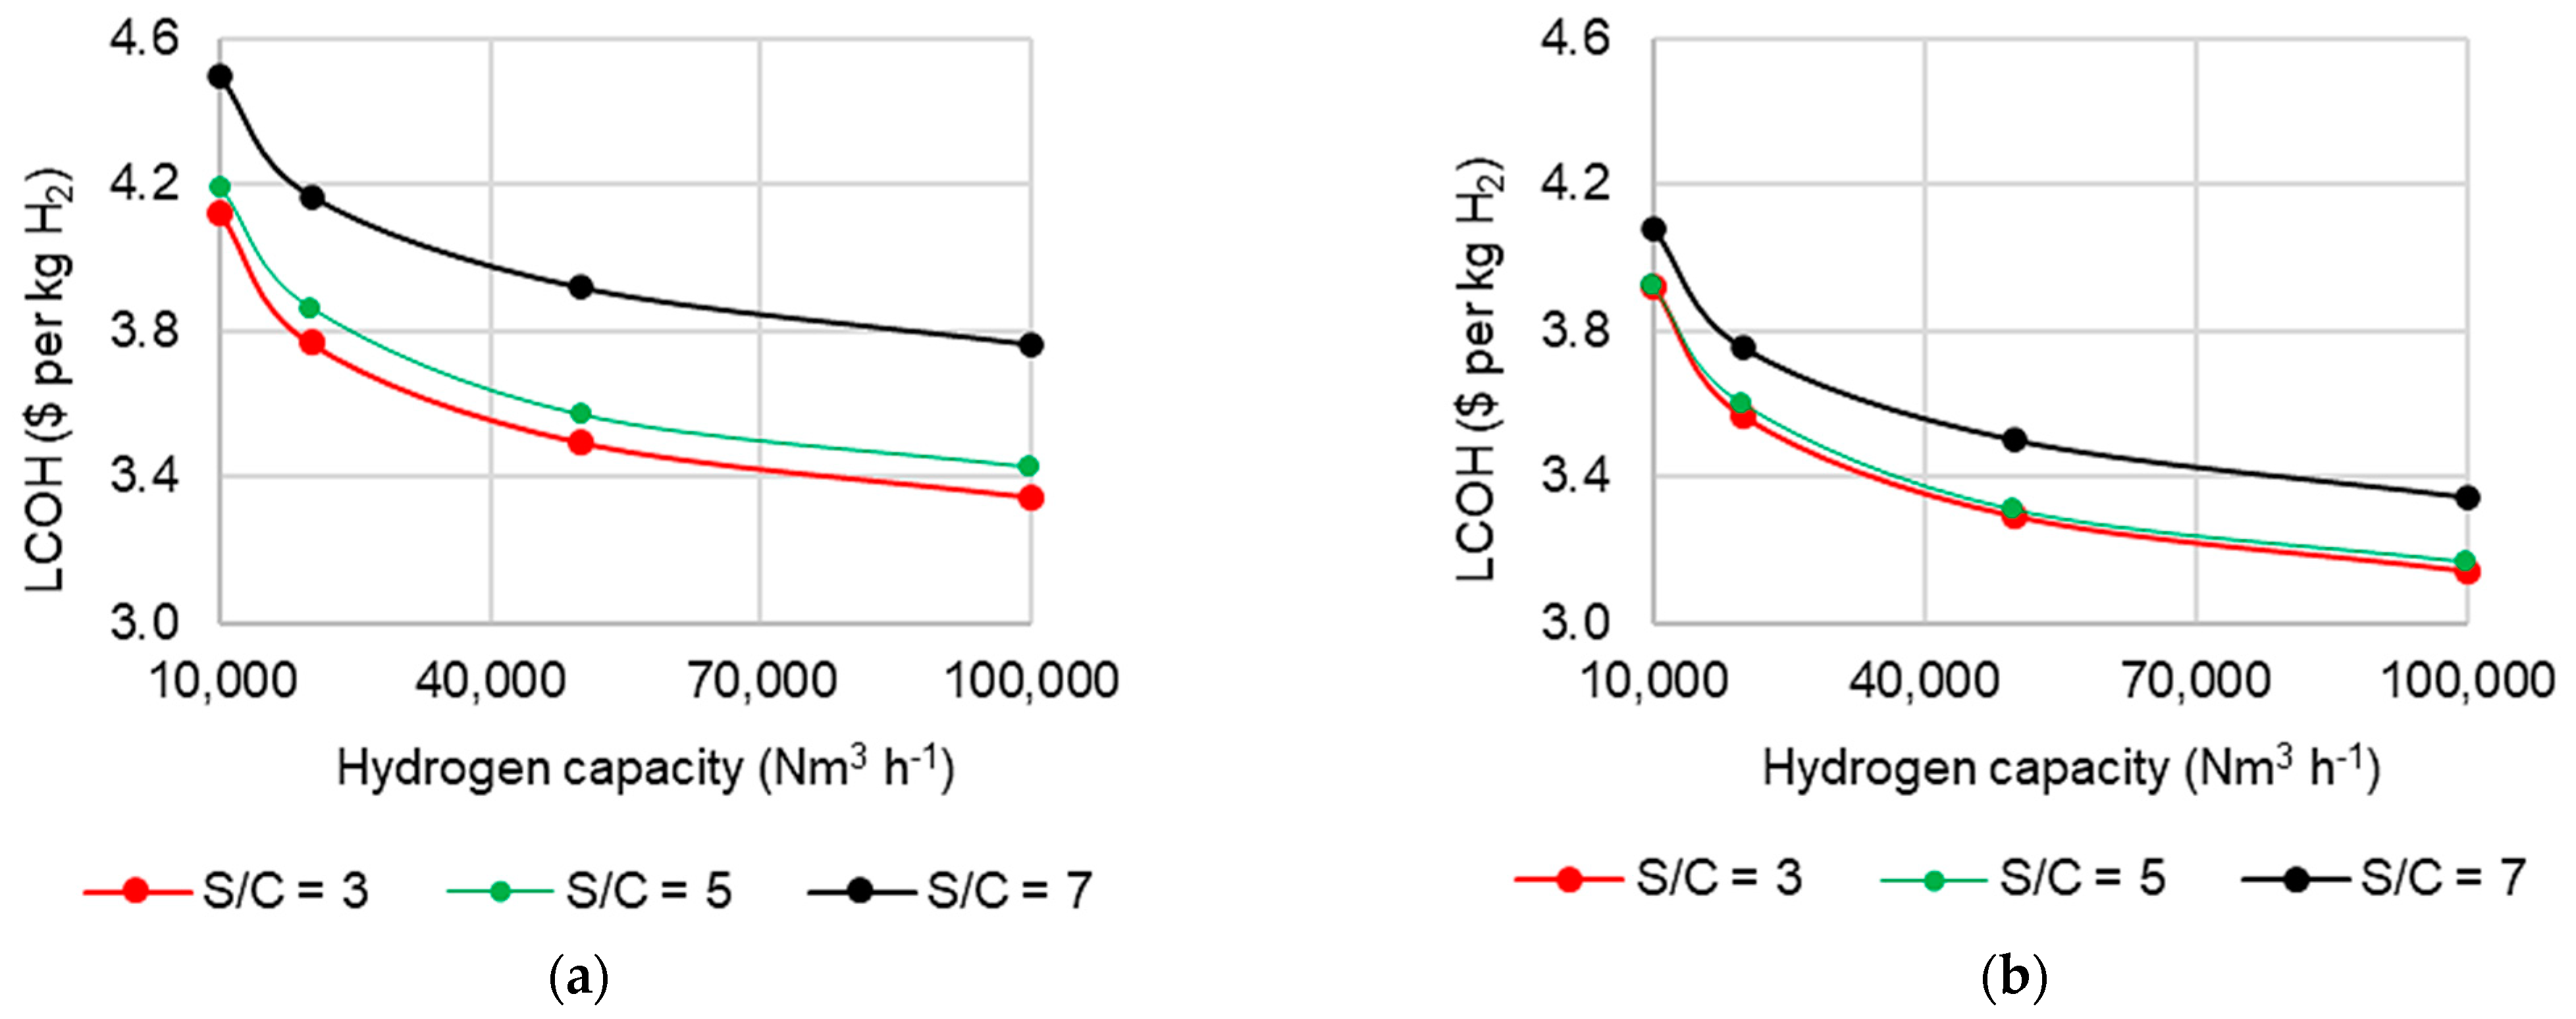
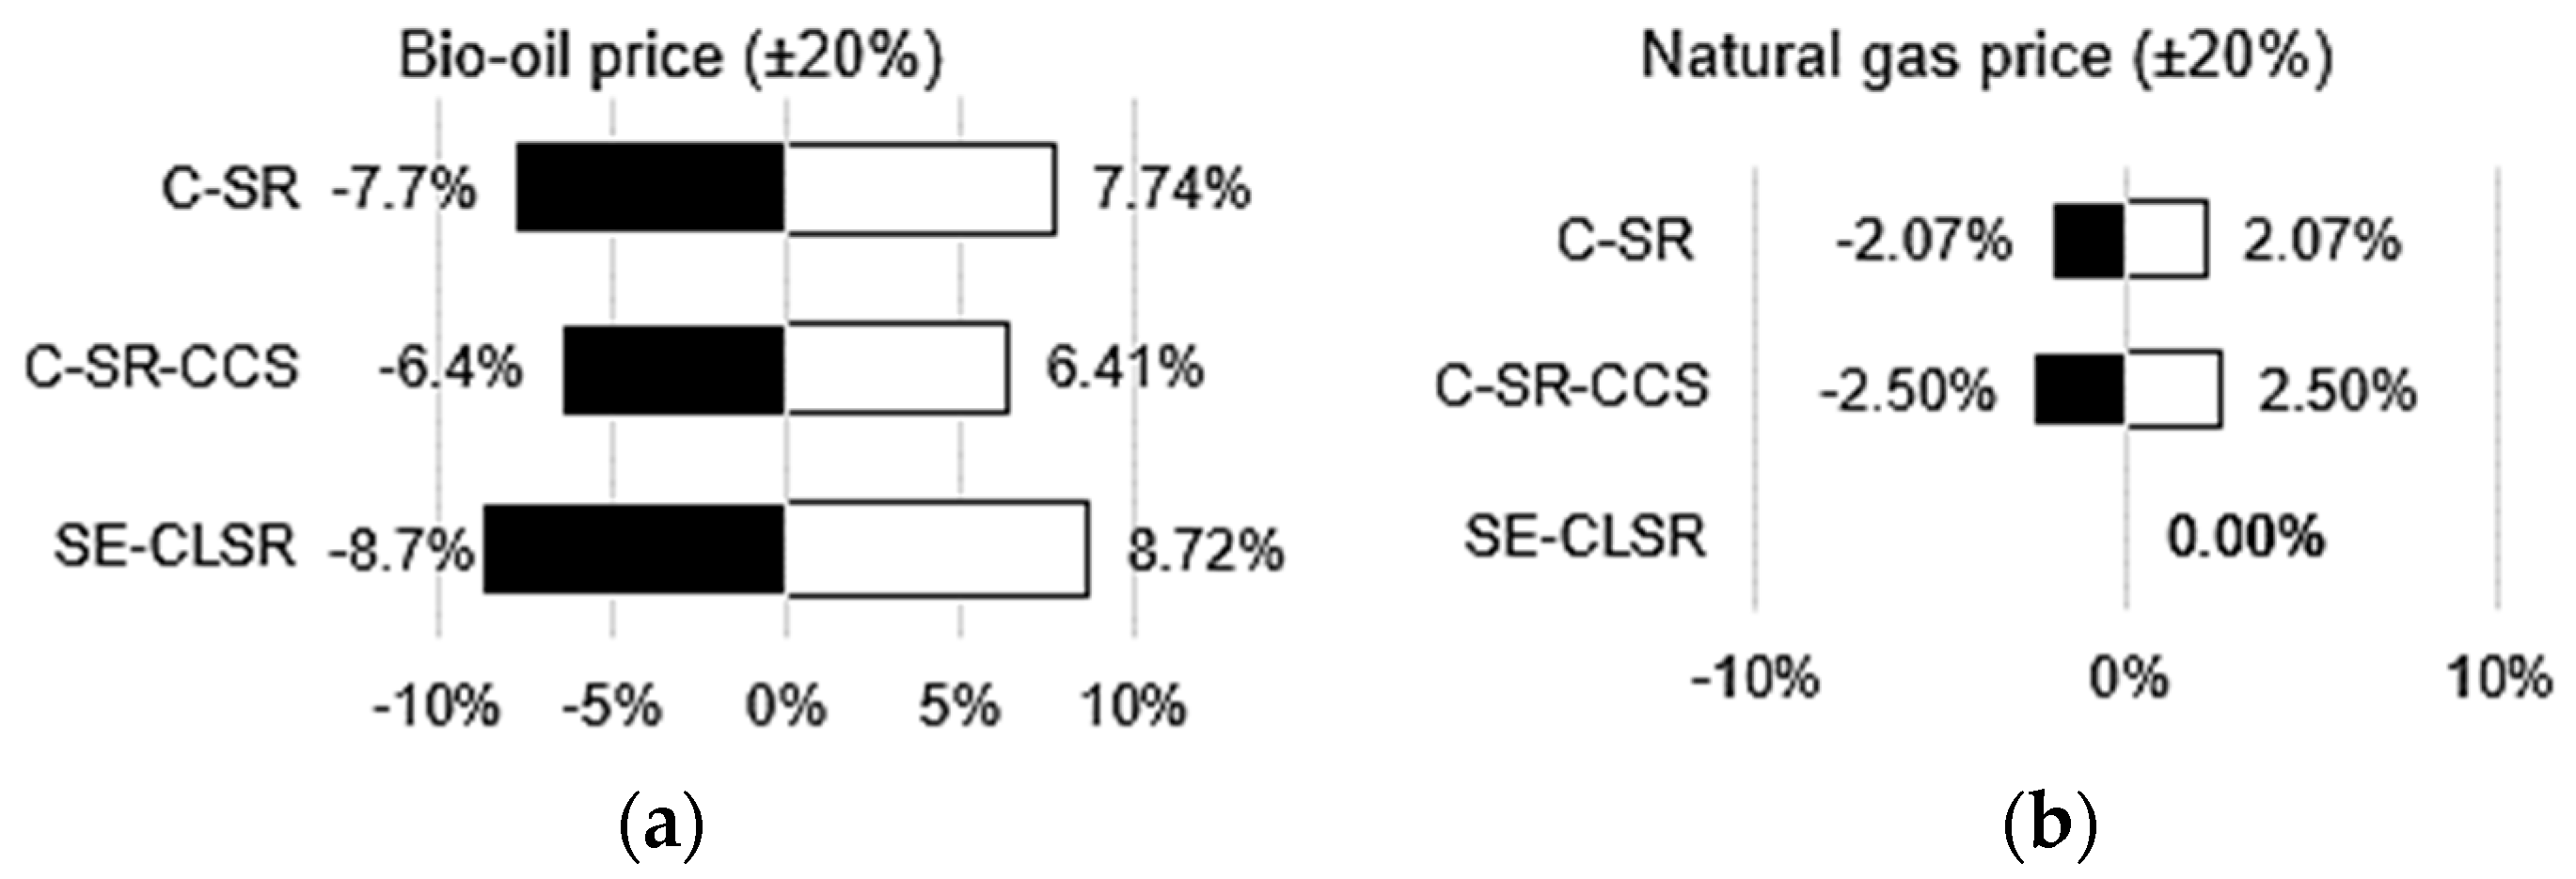
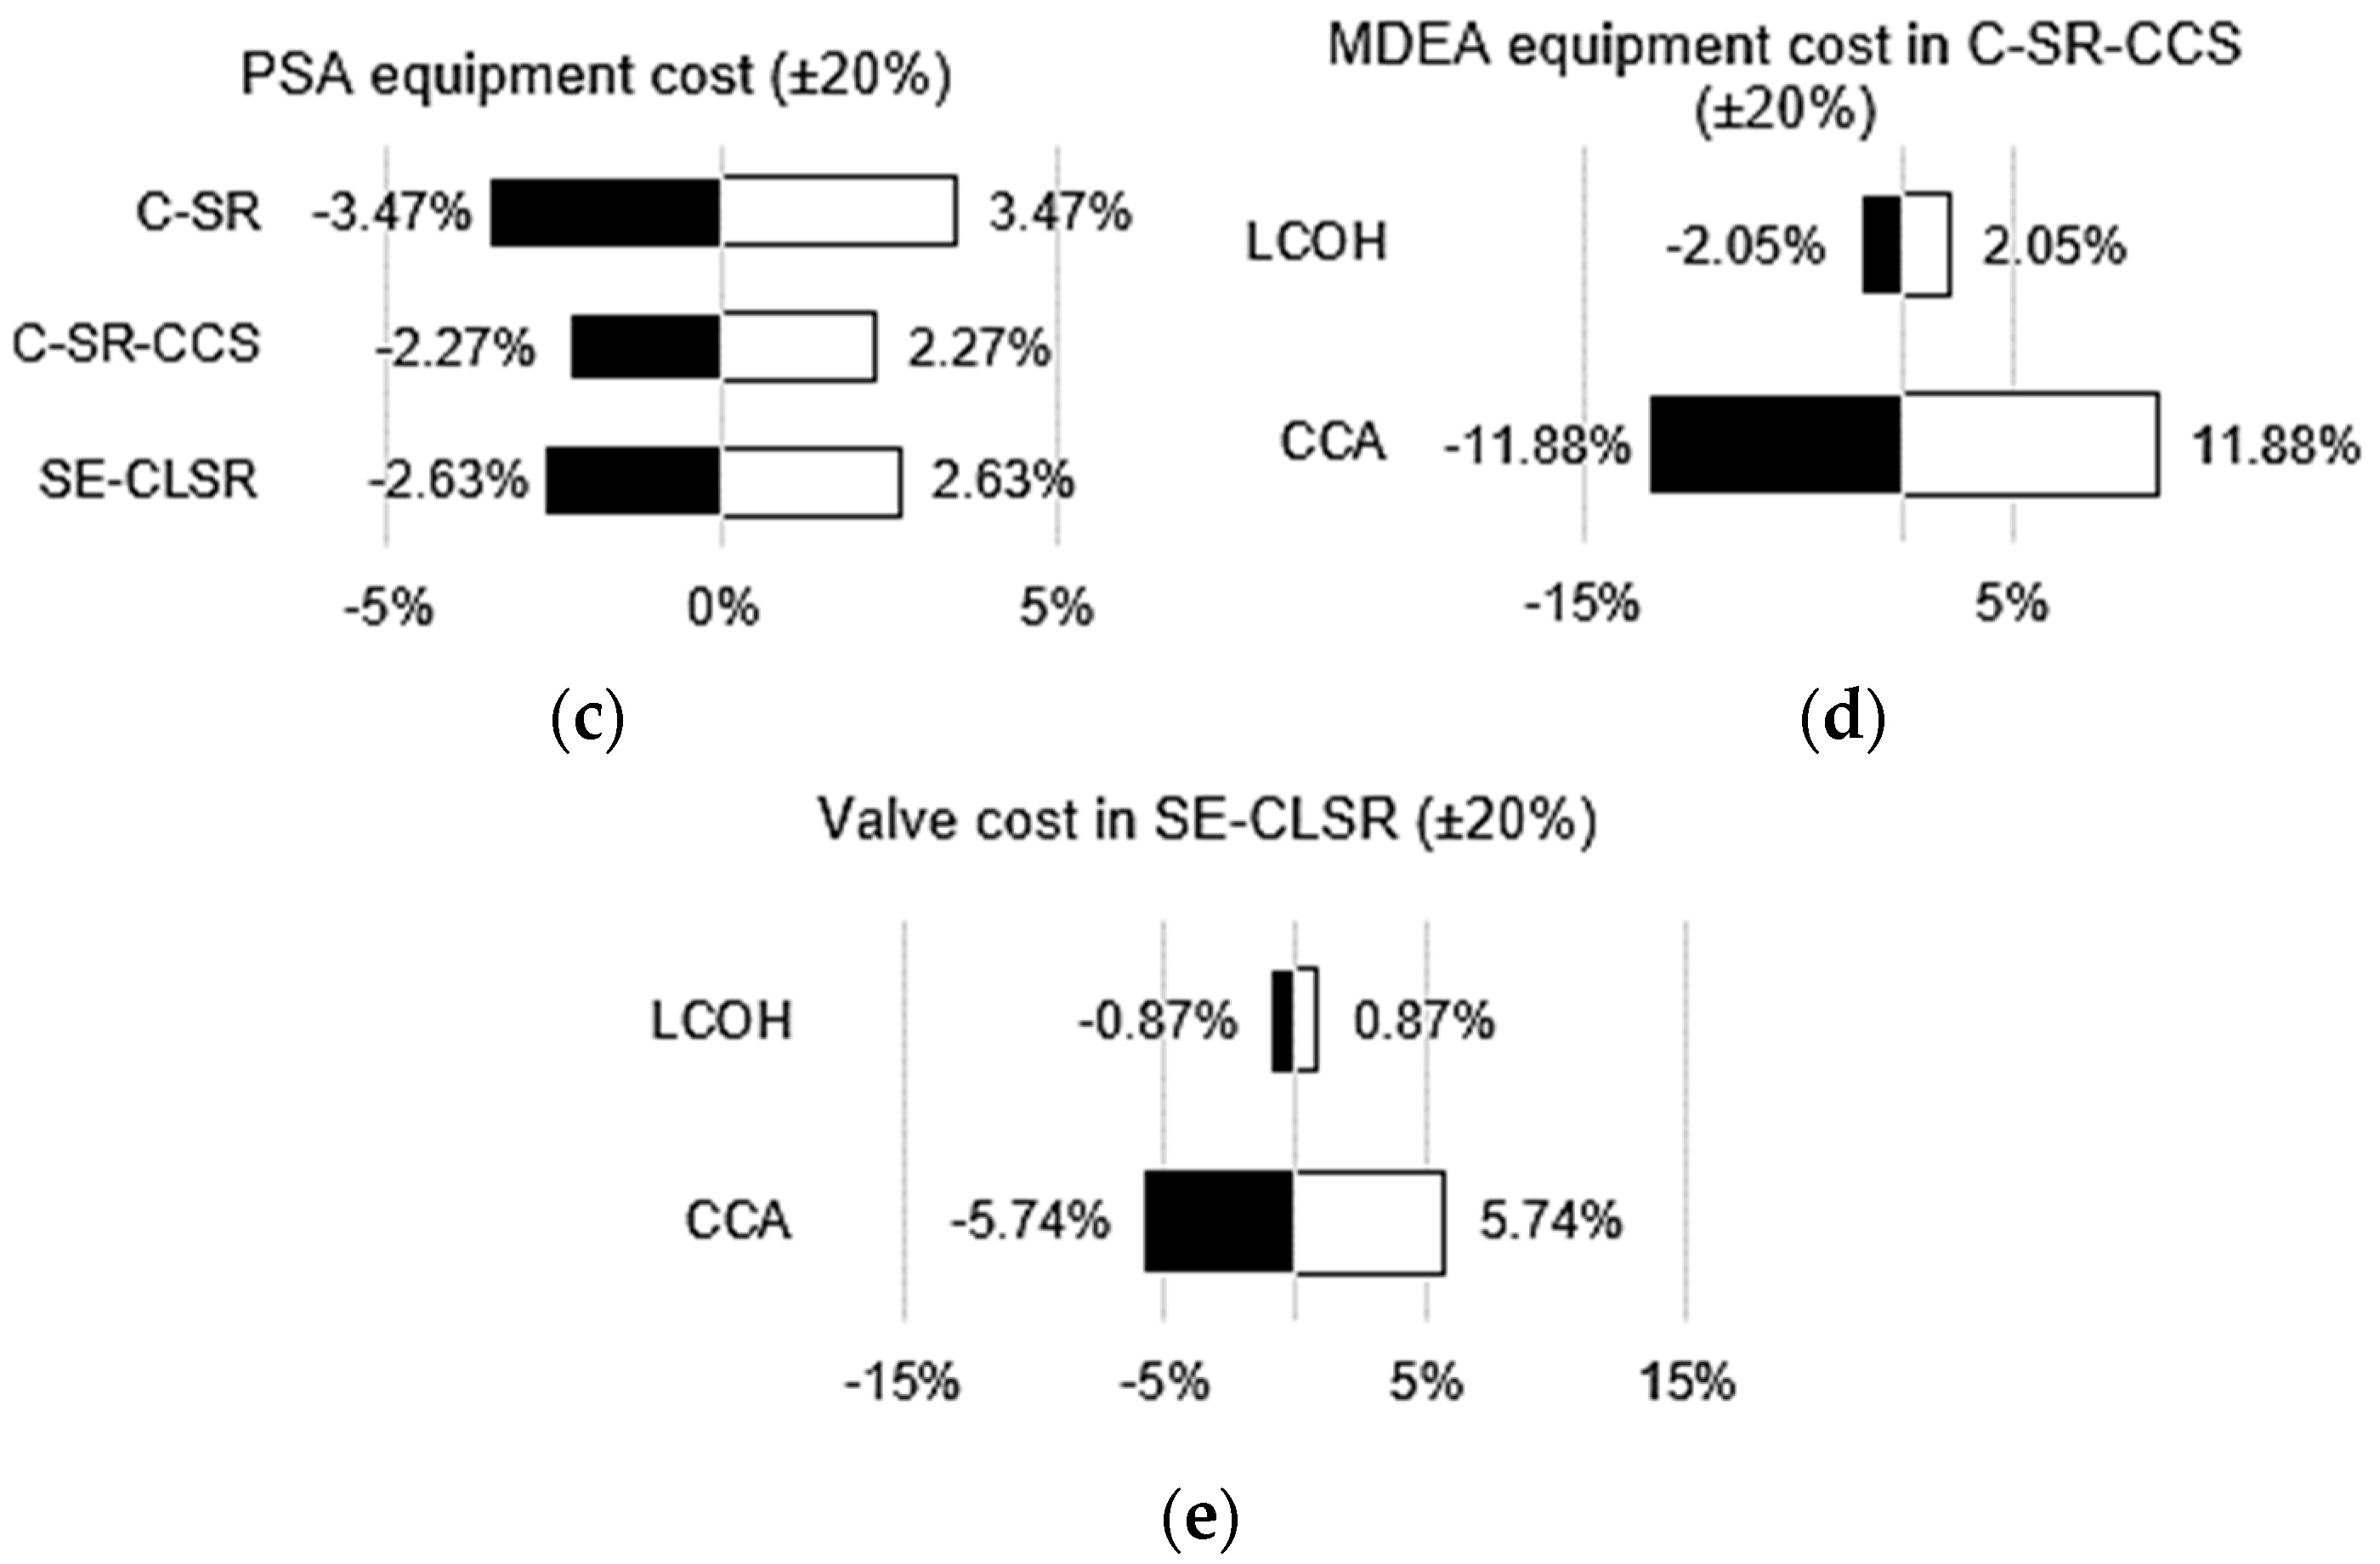
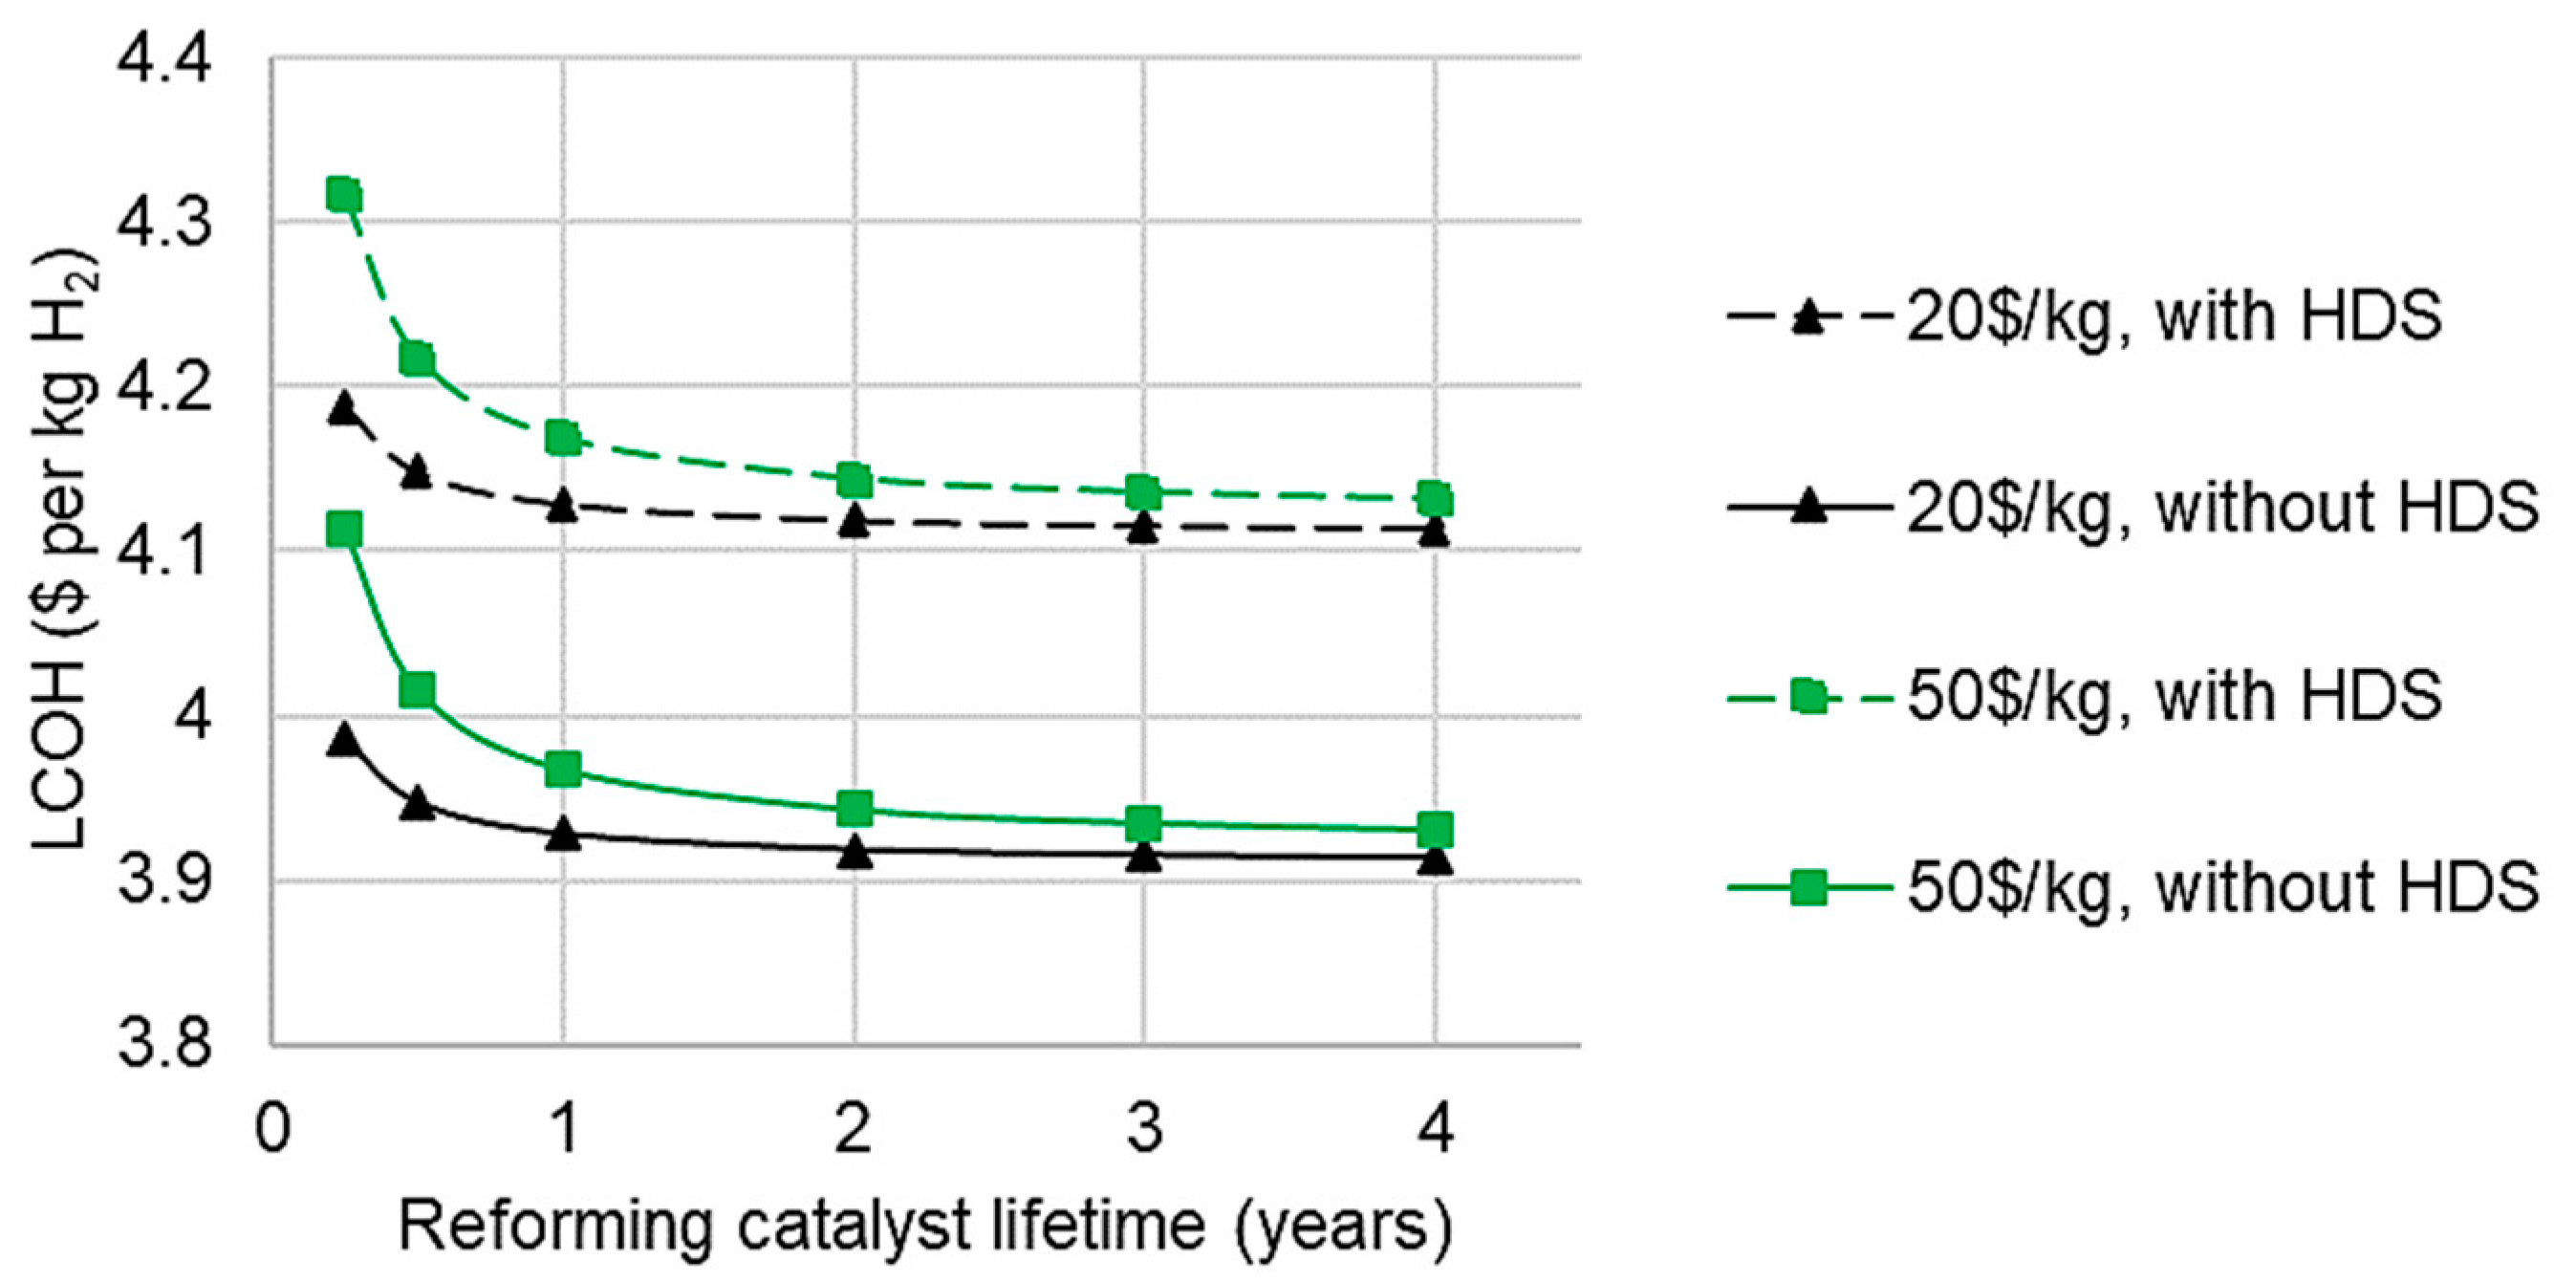
Table 6 details the emission balance for each process. The net CO2 emissions are the biogenic CO2 captured minus the fossil CO2 emissions, whereas the avoided CO2 is the biogenic CO2 captured plus the difference in fossil emissions from the C-SR reference case. SE-CLSR has a superior emission outlook to C-SR-CCS because only 10% of the system CO2 emissions are derived from electricity import and methanol use. The rest of the CO2 is of biogenic origin, and all of the heat demand is met by the feedstock. For C-SR-CCS, around 15% of process emissions are fossil-derived, in part from the methane (natural gas) demand to top up the furnace requirements.
The difference in the emissions is reflected in the cost of carbon, as presented in Figure 8 where the CCA for SE-CLSR is lower than that for C-SR-CCS at all scales. For the scale selection shown in Figure 8, the CCA of SE-CLSR ranges from 44 to 55 USD/teCO2, whereas C-SR-CCS ranges from 52 to 72 USD/teCO2.
The avoided emissions and associated CCA analysis above is based on the use of bio-oil steam reforming as the reference case. If a conventional SMR process is used as a reference, the CCA for the same capacity range is between 94 and 144 USD/teCO2 for SE-CLSR and between 103 and 163 USD/teCO2 for C-SR-CCS. This is useful for comparison against other bioenergy with carbon capture and storage (BECCS) processes presented by Consoli [67]. The CCA of bio-oil C-SR-CCS and SE-CLSR is competitive against combustion and ethanol BECCS but 2–4 times greater than that of pulp/paper mills and biomass gasification.

3.4. Sensitivity

Figure 9 provides insight into the effect of key economic factors on the LCOH and CCA through sensitivity analysis. As expected, due to the weight of bio-oil purchasing on manufacturing costs (Figure 7), altering its price (+/−)20% has the largest impact on LCOH compared to other costs. For example, a 20% decrease in bio-oil price results in a 6.4% reduction in the LCOH for C-SR-CCS, whereas the same percentage reduction in natural gas price results in a 2.5% reduction in LCOH for C-SR-CCS. An alteration in PSA price has the greatest impact on LCOH of any of the bare module costs. This shows that future reductions or increases in the purchasing prices of these factors will significantly impact the financial outlook of process implementation.
Variations in MDEA and valve cost are of interest because price variations have a limited impact on LCOH for C-SR-CCS and SE-CLSR but significantly influence CCA. For example, a 20% increase in MDEA equipment cost would increase the CCA of C-SR-CCS by almost 12%. Similarly, a 20% increase in the cost of three-way valves would boost the CCA by 5.74% for SE-CLSR. Therefore, if there are strong future incentives for BECCS/negative emissions, then plant operators need to be aware of factors such as this affecting the processing costs.

3.5. Desulphurisation Impacts

As mentioned, desulphurisation is often unaccounted for in bio-oil reforming studies due to the presumption of sufficiently low sulphur levels. Accordingly, a summary has been generated of the technical and economic impacts of HDS implementation based on a naphtha HDS system, reducing sulphur levels from 0.2 wt% to 1 ppmwt [31]. This is likely to far exceed the needs of a bio-oil plant and provides a conservative outlook for feasibility assessment. The analysis shows that despite the minimal impact on thermal efficiency and yields, the 11% addition bare module costs at a 10,000 Nm3H2 h−1 scale would increase the LCOH by 5% from 3.93 to 4.13 USD kgH2−1.
This analysis does not incorporate the positive impact desulphurisation may have on catalyst lifetime and, therefore, plant economics. As such, Figure 10 shows the effect of reforming catalyst lifetime on LCOH for C-SR at 10,000 Nm3 h−1. It shows that beyond a two-year catalyst lifetime there is not much difference in LCOH. However, below this and between 0 and 1 years particularly, there are definite benefits of prolonging the catalyst lifetime. In practice, the benefit of an improved lifetime would be superior to that shown in Figure 10 as fewer catalyst replacements would facilitate lower maintenance costs, downtime, and safety impacts. An improved understanding of catalyst lifetime in bio-oil reforming is required to further analyse and quantify the effects of improvement strategies.
Considering the predicted lower sulphur content of bio-oil compared to naphtha, HDS may not be the most suitable. For example, metal oxide sulphur guard beds may be more cost-effective, as evidenced by ZnO sulphur guard beds for biogas and biomass syngas [68] or Matheson’s Nanochem GuardBed used for bio-ethanol, bio-diesel, and biogas applications [69]. However, the limited available data restrict the current techno-economic impact analysis, and this area is suggested for future research.

4. Conclusions

The economic analysis showed that SE-CLSR is comparable to C-SR-CCS for the levelised cost of hydrogen (LCOH), with costs in the region of USD 3.8 to USD 4.6 per kg. These costs are similar to projected costs for the more conventional hydrogen with the BECCS biomass gasification route. As expected, they are higher than those of other H2 production routes, but within the range that the Hydrogen Council has predicted will make H2 cost-competitive at forecourts; thus, bio-oil might have a role in a diversified hydrogen production sector, especially if the potential value of negative emissions is considered.
The cost of carbon avoided (CCA) was shown to vary considerably depending on its method of calculation. If all emissions, both biogenic and fossil-based, were considered the same, the cost would range from USD 60 to USD 100 per ton equivalent (te) of CO2. If biogenic emissions captured were considered as “negative emissions”, the cost would be reduced to USD 40 to USD 70 per te CO2. When a natural-gas-based SMR process was used as the reference to calculate CCA, the CCA increased to USD 90 to USD 160 per te CO2 because methane is a considerably less expensive feedstock. However, for larger-scale plants (100,000 Nm3 h−1), the CCA of USD 95 to USD 105 per te CO2 was within the range of BECCS in other industries.
Significant contributors to process cost were the PSA system, CO2 capture (in the case of C-SR-CCS), and three-way valves (in the case of SE-CLSR). The high capital cost of hydrodesulphurisation could increase the LCOH by around 11%. However, this expense may be justified if required to extend catalyst lifetime, especially considering the potential costs associated with high process downtime.

Supplementary Materials

The following supporting information can be downloaded at: https://www.mdpi.com/article/10.3390/cleantechnol4020018/s1, S1: Bio-oil composition; S2: Equations for bare module cost of equipment; S3: reactor design.

Author Contributions

Conceptualisation, J.R., V.D. and T.M.; methodology, J.R.; software, J.R.; validation, V.D. and T.M.; formal analysis, J.R.; investigation, J.R.; resources, V.D. and T.M.; data curation, J.R.; writing—original draft preparation, O.G.; writing—review and editing, O.G. and V.D.; visualisation, O.G. and V.D.; supervision, V.D. and T.M.; project administration, J.R., V.D. and T.M.; funding acquisition, V.D. and T.M. All authors have read and agreed to the published version of the manuscript.

Funding

This research was funded by EPSRC Bioenergy Centre for Doctoral Training, grant number EP/L014912/1, and KCCSRC EPSRC consortium Call 2 grant “Novel Materials and Reforming Process Route for the Production of Ready-Separated CO2/N2/H2 from Natural Gas Feedstocks”, grant number EP/K000446/1.

Institutional Review Board Statement

Not applicable.

Informed Consent Statement

Not applicable.

Data Availability Statement

The data associated with this paper can be downloaded from https://doi.org/10.5518/1143 (accessed on 10 March 2022).

Conflicts of Interest

The authors declare no conflict of interest.

References

  1. Abdin, Z.; Zafaranloo, A.; Rafiee, A.; Mérida, W.; Lipiński, W.; Khalilpour, K.R. Hydrogen as an Energy Vector. Renew. Sustain. Energy Rev. 2020, 120, 109620. [Google Scholar] [CrossRef]
  2. Dawood, F.; Anda, M.; Shafiullah, G.M. Hydrogen Production for Energy: An Overview. Int. J. Hydrogen Energy 2020, 45, 3847–3869. [Google Scholar] [CrossRef]
  3. Noussan, M.; Raimondi, P.P.; Scita, R.; Hafner, M. The Role of Green and Blue Hydrogen in the Energy Transition—A Technological and Geopolitical Perspective. Sustainability 2020, 13, 298. [Google Scholar] [CrossRef]
  4. Intergovernmental Panel on Climate Change (IPCC) IPCC. Climate Change 2021: The Physical Science Basis; Cambridge University Press: Cambridge, UK; New York, NY, USA, 2021. [Google Scholar]
  5. Wang, D.; Czernik, S.; Montané, D.; Mann, M.; Chornet, E. Biomass to Hydrogen via Fast Pyrolysis and Catalytic Steam Reforming of the Pyrolysis Oil or Its Fractions. Ind. Eng. Chem. Res. 1997, 36, 1507–1518. [Google Scholar] [CrossRef]
  6. Sarkar, S.; Kumar, A. Large-Scale Biohydrogen Production from Bio-Oil. Bioresour. Technol. 2010, 101, 7350–7361. [Google Scholar] [CrossRef] [PubMed]
  7. Dou, B.; Zhang, H.; Song, Y.; Zhao, L.; Jiang, B.; He, M.; Ruan, C.; Chen, H.; Xu, Y. Hydrogen Production from the Thermochemical Conversion of Biomass: Issues and Challenges. Sustain. Energy Fuels 2019, 3, 314–342. [Google Scholar] [CrossRef]
  8. Tang, M.; Xu, L.; Fan, M. Progress in Oxygen Carrier Development of Methane-Based Chemical-Looping Reforming: A Review. Appl. Energy 2015, 151, 143–156. [Google Scholar] [CrossRef] [Green Version]
  9. Adanez, J.; Abad, A.; Garcia-Labiano, F.; Gayan, P.; De Diego, L.F. Progress in Chemical-Looping Combustion and Reforming Technologies. Prog. Energy Combust. Sci. 2012, 38, 215–282. [Google Scholar] [CrossRef] [Green Version]
  10. Ortiz, M.; De Diego, L.F.; Abad, A.; García-Labiano, F.; Gayán, P.; Adánez, J. Catalytic Activity of Ni-Based Oxygen-Carriers for Steam Methane Reforming in Chemical-Looping Processes. Energy Fuels 2012, 26, 791–800. [Google Scholar] [CrossRef]
  11. Pröll, T.; Bolhàr-Nordenkampf, J.; Kolbitsch, P.; Hofbauer, H. Syngas and a Separate Nitrogen/Argon Stream via Chemical Looping Reforming—A 140 KW Pilot Plant Study. Fuel 2010, 89, 1249–1256. [Google Scholar] [CrossRef]
  12. Yu, Z.; Yang, Y.; Yang, S.; Zhang, Q.; Zhao, J.; Fang, Y.; Hao, X.; Guan, G. Iron-Based Oxygen Carriers in Chemical Looping Conversions: A Review. Carbon Resour. Convers. 2019, 2, 23–34. [Google Scholar] [CrossRef]
  13. Dou, B.; Zhang, H.; Cui, G.; Wang, Z.; Jiang, B.; Wang, K.; Chen, H.; Xu, Y. Hydrogen Production by Sorption-Enhanced Chemical Looping Steam Reforming of Ethanol in an Alternating Fixed-Bed Reactor: Sorbent to Catalyst Ratio Dependencies. Energy Convers. Manag. 2018, 155, 243–252. [Google Scholar] [CrossRef]
  14. Pimenidou, P.; Rickett, G.; Dupont, V.; Twigg, M.V. Chemical Looping Reforming of Waste Cooking Oil in Packed Bed Reactor. Bioresour. Technol. 2010, 101, 6389–6397. [Google Scholar] [CrossRef] [Green Version]
  15. Spragg, J.; Mahmud, T.; Dupont, V. Hydrogen Production from Bio-Oil: A Thermodynamic Analysis of Sorption-Enhanced Chemical Looping Steam Reforming. Int. J. Hydrogen Energy 2018, 43, 22032–22045. [Google Scholar] [CrossRef]
  16. Brown, D.; Rowe, A.; Wild, P. Techno-Economic Comparisons of Hydrogen and Synthetic Fuel Production Using Forest Residue Feedstock. Int. J. Hydrogen Energy 2014, 39, 12551–12562. [Google Scholar] [CrossRef]
  17. Collodi, G.; Azzaro, G.; Ferrari, N.; Santos, S.; Brown, J.; Cotton, B.; Lodge, S. Techno-Economic Evaluation of SMR Based Standalone (Merchant) Hydrogen Plant with CCS; IEAGHG Technical Report; IEAGHG: Cheltenham, UK, 2017. [Google Scholar]
  18. Riva, L.; Martínez, I.; Martini, M.; Gallucci, F.; van Sint Annaland, M.; Romano, M.C. Techno-Economic Analysis of the Ca-Cu Process Integrated in Hydrogen Plants with CO2 Capture. Int. J. Hydrogen Energy 2018, 43, 15720–15738. [Google Scholar] [CrossRef]
  19. Romano, M.C.; Chiesa, P.; Lozza, G. Pre-Combustion CO2 Capture from Natural Gas Power Plants, with ATR and MDEA Processes. Int. J. Greenh. Gas Control. 2010, 4, 785–797. [Google Scholar] [CrossRef]
  20. Yang, F.; Meerman, J.C.; Faaij, A.P.C. Carbon Capture and Biomass in Industry: A Techno-Economic Analysis and Comparison of Negative Emission Options. Renew. Sustain. Energy Rev. 2021, 144, 111028. [Google Scholar] [CrossRef]
  21. Northern Gas Networks. H21 Leeds City Gate. Available online: https://h21.green/projects/h21-leeds-city-gate/ (accessed on 24 May 2018).
  22. Sutherland, F.; Duffy, L.; Ashby, D.; Legrand, P.; Jones, G.; Jude, E. Net Zero Teesside: Subsurface Evaluation of Endurance. In Proceedings of the 1st Geoscience & Engineering in Energy Transition Conference, Strasbourg, France, 16 November 2020; Volume 2020, pp. 1–5. [Google Scholar]
  23. CO2 Europipe Consortium. D3.1.2. Standards for CO2: CO2 Europipe Towards a Transport Infrastructure for Large-Scale CCS in Europe. 2009. Available online: http://www.co2europipe.eu/Publications/D2.2.1%20-%20CO2Europipe%20Report%20CCS%20infrastructure.pdf (accessed on 10 March 2022).
  24. Pimenidou, P.; Dupont, V. Characterisation of Palm Empty Fruit Bunch (PEFB) and Pinewood Bio-Oils and Kinetics of Their Thermal Degradation. Bioresour. Technol. 2012, 109, 198–205. [Google Scholar] [CrossRef] [Green Version]
  25. Abdul Halim Yun, H.; Dupont, V. Thermodynamic Analysis of Methanation of Palm Empty Fruit Bunch (PEFB) Pyrolysis Oil with and without in Situ CO2 Sorption. AIMS Energy 2015, 3, 774–797. [Google Scholar] [CrossRef]
  26. Dupont, V.; Abdul Halim Yun, H.; White, R.; Tande, L. High Methane Conversion Efficiency by Low Temperature Steam Reforming of Biofeedstock. In Proceedings of the REGATEC 2017 4th International Conference on Renewable Energy Gas Technology, Verona, Italy, 20 April 2017; pp. 22–23. [Google Scholar]
  27. Garcia-Perez, M.; Chaala, A.; Pakdel, H.; Kretschmer, D.; Roy, C. Characterization of Bio-Oils in Chemical Families. Biomass Bioenergy 2007, 31, 222–242. [Google Scholar] [CrossRef]
  28. Darmstadt, H.; Garcia-Perez, M.; Adnot, A.; Chaala, A.; Kretschmer, D.; Roy, C. Corrosion of Metals by Bio-Oil Obtained by Vacuum Pyrolysis of Softwood Bark Residues. An X-Ray Photoelectron Spectroscopy and Auger Electron Spectroscopy Study. Energy Fuels 2004, 18, 1291–13011. [Google Scholar] [CrossRef]
  29. Heracleous, E. Well-to-Wheels Analysis of Hydrogen Production from Bio-Oil Reforming for Use in Internal Combustion Engines. Int. J. Hydrogen Energy 2011, 36, 11501–11511. [Google Scholar] [CrossRef]
  30. Zhang, Y.; Brown, T.R.; Hu, G.; Brown, R.C. Comparative Techno-Economic Analysis of Biohydrogen Production via Bio-Oil Gasification and Bio-Oil Reforming. Biomass Bioenergy 2013, 51, 99–108. [Google Scholar] [CrossRef] [Green Version]
  31. Maples, R.E. Petroleum Refinery Process Economics; PennWell Corporation: Nashville, TN, USA, 2000. [Google Scholar]
  32. Srifa, A.; Chaiwat, W.; Pitakjakpipop, P.; Anutrasakda, W.; Faungnawakij, K. Advances in Bio-Oil Production and Upgrading Technologies. In Sustainable Bioenergy: Advances and Impacts; Elsevier: Amsterdam, The Netherlands; Oxford, UK; Cambridge, MA, USA, 2019. [Google Scholar]
  33. Parkash, S. Refining Processes Handbook; Elsevier: Amsterdam, The Netherlands; Oxford, UK; Cambridge, MA, USA, 2003. [Google Scholar]
  34. Davis, S.J.; Lewis, N.S.; Shaner, M.; Aggarwal, S.; Arent, D.; Azevedo, I.L.; Benson, S.M.; Bradley, T.; Brouwer, J.; Chiang, Y.M.; et al. Net-Zero Emissions Energy Systems. Science 2018, 360, eaas9793. [Google Scholar] [CrossRef] [PubMed] [Green Version]
  35. Turton, R.; Bailie, R.C.; Whiting, W.B.; Shaeiwitz, J.A. Analysis, Synthesis and Design of Chemical Processes, 3rd ed.; Prentice Hall: Upper Saddle River, NJ, USA, 2009; ISBN 978-0-13-512966-1. [Google Scholar]
  36. Turton, R.; Bailie, R.C.; Whiting, W.B.; Shaeiwitz, J.A. Analysis, Synthesis, and Design of Chemical Processes, 4th ed.; Prentice Hall: Upper Saddle River, NJ, USA, 2008; Volume 53. [Google Scholar]
  37. Sadhukhan, J.; Ng, K.S.; Hernandez, E.M. Biorefineries and Chemical Processes: Design, Integration and Sustainability Analysis; John Wiley & Sons Ltd.: Chichester, UK, 2015. [Google Scholar]
  38. Peters, M.S.; Timmerhaus, K.D.; West, R.E. Plant Design and Economics for Chemical Engineers, 5th ed.; McGraw-Hill: New York, NY, USA; London, UK, 2004. [Google Scholar]
  39. Hamers, H.P.; Romano, M.C.; Spallina, V.; Chiesa, P.; Gallucci, F.; Annaland, M.V.S. Comparison on Process Efficiency for CLC of Syngas Operated in Packed Bed and Fluidized Bed Reactors. Int. J. Greenh. Gas Control 2014, 28, 65–78. [Google Scholar] [CrossRef]
  40. Turner, J.; Sverdrup, G.; Mann, M.K.; Maness, P.-C.; Kroposki, B.; Ghirardi, M.; Evans, R.J.; Blake, D. Renewable Hydrogen Production. Int. J. Energy Res. 2008, 32, 379–407. [Google Scholar] [CrossRef] [Green Version]
  41. Czernik, S.; French, R. Distributed Production of Hydrogen by Autothermal Reforming of Biomass Pyrolysis Oil. In Proceedings of the ACS National Meeting Book of Abstracts, Atlanta, GA, USA, 26–30 March 2006. [Google Scholar]
  42. Campanario, F.J.; Gutiérrez Ortiz, F.J. Fischer-Tropsch Biofuels Production from Syngas Obtained by Supercritical Water Reforming of the Bio-Oil Aqueous Phase. Energy Convers. Manag. 2017, 150, 599–613. [Google Scholar] [CrossRef]
  43. Do, T.X.; Lim, Y.I.; Yeo, H. Techno-Economic Analysis of Biooil Production Process from Palm Empty Fruit Bunches. Energy Convers. Manag. 2014, 80, 525–534. [Google Scholar] [CrossRef]
  44. Methanex. Methanex Posts Regional Contract Methanol Prices for North America, Europe and Asia. Available online: https://www.methanex.com/our-business/pricing (accessed on 17 September 2019).
  45. Song, H.; Ozkan, U.S. Economic Analysis of Hydrogen Production through a Bio-Ethanol Steam Reforming Process: Sensitivity Analyses and Cost Estimations. Int. J. Hydrogen Energy 2010, 35, 127–134. [Google Scholar] [CrossRef]
  46. Swanson, R.M.; Platon, A.; Satrio, J.A.; Brown, R.C. Techno-Economic Analysis of Biomass-to-Liquids Production Based on Gasification. Fuel 2010, 89, S11–S19. [Google Scholar] [CrossRef] [Green Version]
  47. Spallina, V.; Motamedi, G.; Gallucci, F.; van Sint Annaland, M. Techno-Economic Assessment of an Integrated High Pressure Chemical-Looping Process with Packed-Bed Reactors in Large Scale Hydrogen and Methanol Production. Int. J. Greenh. Gas Control 2019, 88, 71–84. [Google Scholar] [CrossRef]
  48. Nazir, S.M.; Cloete, S.; Bolland, O.; Amini, S. Techno-Economic Assessment of the Novel Gas Switching Reforming (GSR) Concept for Gas-Fired Power Production with Integrated CO2 Capture. Int. J. Hydrogen Energy 2018, 43, 8754–8769. [Google Scholar] [CrossRef] [Green Version]
  49. Trane, R.; Dahl, S.; Skjøth-Rasmussen, M.S.; Jensen, A.D. Catalytic Steam Reforming of Bio-Oil. Int. J. Hydrogen Energy 2012, 37, 6447–6472. [Google Scholar] [CrossRef]
  50. Kemper, J.; Sutherland, L.; Watt, J.; Santos, S. Evaluation and Analysis of the Performance of Dehydration Units for CO2 Capture. Energy Procedia 2014, 63, 7568–7584. [Google Scholar] [CrossRef] [Green Version]
  51. Gil, M.V.; Fermoso, J.; Pevida, C.; Chen, D.; Rubiera, F. Production of Fuel-Cell Grade H2 by Sorption Enhanced Steam Reforming of Acetic Acid as a Model Compound of Biomass-Derived Bio-Oil. Appl. Catal. B Environ. 2016, 184, 64–76. [Google Scholar] [CrossRef] [Green Version]
  52. Wright, M.M.; Román-Leshkov, Y.; Green, W.H. Investigating the Techno-Economic Trade-Offs of Hydrogen Source Using a Response Surface Model of Drop-in Biofuel Production via Bio-Oil Upgrading. Biofuels Bioprod. Biorefin. 2012, 6, 503–520. [Google Scholar] [CrossRef]
  53. Arregi, A.; Amutio, M.; Lopez, G.; Bilbao, J.; Olazar, M. Evaluation of Thermochemical Routes for Hydrogen Production from Biomass: A Review. Energy Convers. Manag. 2018, 165, 696–719. [Google Scholar] [CrossRef]
  54. Marda, J.R.; DiBenedetto, J.; McKibben, S.; Evans, R.J.; Czernik, S.; French, R.J.; Dean, A.M. Non-Catalytic Partial Oxidation of Bio-Oil to Synthesis Gas for Distributed Hydrogen Production. Int. J. Hydrogen Energy 2009, 34, 8519–8534. [Google Scholar] [CrossRef]
  55. Spallina, V.; Pandolfo, D.; Battistella, A.; Romano, M.C.; van Sint Annaland, M.; Gallucci, F. Techno-Economic Assessment of Membrane Assisted Fluidized Bed Reactors for Pure H2 Production with CO2 Capture. Energy Convers. Manag. 2016, 120, 257–273. [Google Scholar] [CrossRef]
  56. Dupont, V.; Ross, A.B.; Hanley, I.; Twigg, M.V. Unmixed Steam Reforming of Methane and Sunflower Oil: A Single-Reactor Process for H2-Rich Gas. Int. J. Hydrogen Energy 2007, 32, 67–69. [Google Scholar] [CrossRef] [Green Version]
  57. Marquevich, M.; Farriol, X.; Medina, F.; Montané, D. Hydrogen Production by Steam Reforming of Vegetable Oils Using Nickel-Based Catalysts. Ind. Eng. Chem. Res. 2001, 40, 4757–4766. [Google Scholar] [CrossRef]
  58. Aspen Plus V.10; Aspen Technology: Houston, TX, USA, 2015.
  59. Chattanathan, S.A.; Adhikari, S.; McVey, M.; Fasina, O. Hydrogen Production from Biogas Reforming and the Effect of H2S on CH4 Conversion. Int. J. Hydrogen Energy 2014, 39, 19905–19911. [Google Scholar] [CrossRef]
  60. Tian, X.; Wang, S.; Zhou, J.; Xiang, Y.; Zhang, F.; Lin, B.; Liu, S.; Luo, Z. Simulation and Exergetic Evaluation of Hydrogen Production from Sorption Enhanced and Conventional Steam Reforming of Acetic Acid. Int. J. Hydrogen Energy 2016, 41, 21099–21108. [Google Scholar] [CrossRef]
  61. Baker, E.H. 87. The Calcium Oxide-Carbon Dioxide System in the Pressure Range 1-300 Atmospheres. J. Chem. Soc. (Resumed) 1962, 87, 464–470. [Google Scholar] [CrossRef]
  62. Meerman, J.C.; Hamborg, E.S.; van Keulen, T.; Ramírez, A.; Turkenburg, W.C.; Faaij, A.P.C. Techno-Economic Assessment of CO2 Capture at Steam Methane Reforming Facilities Using Commercially Available Technology. Int. J. Greenh. Gas Control 2012, 9, 160–171. [Google Scholar] [CrossRef]
  63. Seider, W.D.; Seader, J.D.; Lwein, D.R. Product and Process Design Principles: Synthesis, Analysis and Evaluation; John Wiley & Sons, Ltd.: Hoboken, NJ, USA, 2009. [Google Scholar]
  64. Schmidtsche Schack Flue Gas Convection Section in Steam Reformer Plants for Ammonia, Methanol, Hydrogen Production. Available online: https://www.schmidtsche-schack.com/products/flue-gas-convection-section-in-steam-reformer-plants/ (accessed on 25 April 2017).
  65. Shahabuddin, M.; Krishna, B.B.; Bhaskar, T.; Perkins, G. Advances in the Thermo-Chemical Production of Hydrogen from Biomass and Residual Wastes: Summary of Recent Techno-Economic Analyses. Bioresour. Technol. 2020, 299, 122557. [Google Scholar] [CrossRef]
  66. The Hydrogen Council. Path to Hydrogen Competitiveness a Cost Perspective; The Hydrogen Council: Brussels, Belgium, 2020. [Google Scholar]
  67. Consoli, C. Bioenergy and Carbon Capture and Storage-2019 Perspective; Global CCS Institute: Melbourne, Australia, 2019. [Google Scholar]
  68. Alptekin, G.O.; Jayataman, A.; Schaefer, M.; Ware, M.; Hunt, J.; Dobek, F. Novel Sorbent to Clean Up Biogas for CHPs; US Department of Energy: Washington, DC, USA, 2015. [CrossRef]
  69. MATHESON Nanochem GuardBed for Sulfur Removal 2020. Available online: https://www.mathesongas.com/gas-equipment/ultrapurification/desulfurization/ (accessed on 9 February 2022).
Figure 1. (a) Simplified process flow diagram of bio-oil SE-CLSR. (b) Example SE-CLSR operating conditions on CO2 equilibrium partial-pressure diagram. CaO/CO2 equilibrium properties from [61].
Cleantechnol 04 00018 g001aCleantechnol 04 00018 g001b
Figure 2. Aspen Plus flowsheet for C-SR of bio-oil without CO2 capture.
Cleantechnol 04 00018 g002
Figure 3. Aspen Plus flowsheet for C-SR of bio-oil with CO2 capture.
Cleantechnol 04 00018 g003
Figure 4. Aspen Plus flowsheet for SE-CLSR of bio-oil.
Cleantechnol 04 00018 g004
Figure 5. Effect of S/C ratio and capacity on levelised cost of hydrogen in C-SR at 30 bar and 900 °C (a) without steam export and (b) with steam export.
Cleantechnol 04 00018 g005
Figure 6. Cost analysis of base case C-SR and SE-CLSR processes with steam export: (a) fixed capital costs, (b) cost of manufacture, and (c) LCOH.
Cleantechnol 04 00018 g006
Figure 7. Breakdown of bare module costs and direct manufacturing costs in a 10,000 Nm3 h−1 process for (a) C-SR-CCS and (b) SE-CLSR.
Cleantechnol 04 00018 g007
Figure 8. Cost of carbon avoided in C-SR-CCS and SE-CLSR, compared to bio-oil C-SR base case.
Cleantechnol 04 00018 g008
Figure 9. Various economic sensitivity analyses: (a) effect of bio-oil price on LCOH; (b) effect of natural gas price on LCOH; (c) effect of PSA equipment cost on LCOH; (d) effect of MDEA cost on LCOH and CCA for C-SR-CCS; (e) effect of valve cost on LCOH and CCA for SE-CLSR.
Cleantechnol 04 00018 g009aCleantechnol 04 00018 g009b
Figure 10. Effect of catalyst lifetime, cost, and hydrodesulphurisation on levelised cost of hydrogen from C-SR, 10,000 Nm3 h−1.
Cleantechnol 04 00018 g010
Table 1. CO2 specifications.
ComponentLimit in CO2
CO2>95 vol%
ArTotal noncondensables
<5 vol%
CH4
H2
N2
O2
H2ONo free water (<500 ppmv)
Table 2. Utilities consumption for desulphurisation.
UtilityRequirement per m3 Bio-Oil/Methanol Feed
Power 12.58 kWh
Steam 42.79 kg
Fuel gas 55.30 kWh
Table 4. Operating cost calculation assumptions.
Materials
Bio-oil price0.2 USD kg−1[41,42,43]
Methanol price 0.37 USD kg−1 [44]
Reforming catalyst/oxygen carrier price20 USD kg−1[45,46]
WGS catalyst price60 USD kg−1[47]
CaO sorbent1.1 USD kg−1[48]
WHSV for steam reforming 1 h−1[49]
GHSV for WGS3000 h−1[45,50]
WHSV for reforming stage of SE-CLSR0.8 h−1[51]
Reforming catalyst lifetime (C-SR)1 yearAssumed
Oxygen carrier lifetime (SE-CLSR)2 yearsAssumed
WGS catalyst lifetime 5 years[52]
CaO sorbent lifetime2 yearsAssumed
MDEA solvent a0.04 mUSD/year per kgCO2/s[18]
Waste treatment
Waste water disposal0.538 USD t−1[53]
Catalyst recovery−0.11 USD/kg [54]
Utilities
Process water2 USD m−3[55]
Electricity (purchase)100 USD MWh−1[14]
Electricity (export)50 USD MWh−1[14]
Steam (purchase/export)20.9 USD MWh−1Calculated b
Natural gas25 USD MWh−1[14]
Cooling water0.4 USD m−3[55]
Other assumptions
Plant availability360 days per year-
Conversion GBP to USD1.29[56]
Conversion EUR to USD1.13[56]
Labour cost for workers in UK industryGBP 40,000 per year[57]
Shifts worked per worker per week5-
Shifts per day3-
Weeks worked per year47-
a MDEA solvent cost estimated from [18] prorated to process size. b Based on natural gas boiler with 90% efficiency [18].
Table 5. Design basis for economic comparisons.
C-SRC-SR-CCSSE-CLSR
Reformer pressure (bar)303020
Reformer temperature (°C)900900850
S/C ratio552
NiO/C ratio--0.7
Table 6. Comparison of emissions from processes (kgCO2 kgH2−1).
ProcessFossil-Based CO2 Emitted Biogenic CO2 CapturedNet CO2 EmissionsCO2 Avoided
C-SR3.203.2-
C-SR-CCS0.468.7−8.211.4
SE-CLSR1.110.6−9.512.7
Publisher’s Note: MDPI stays neutral with regard to jurisdictional claims in published maps and institutional affiliations.

