
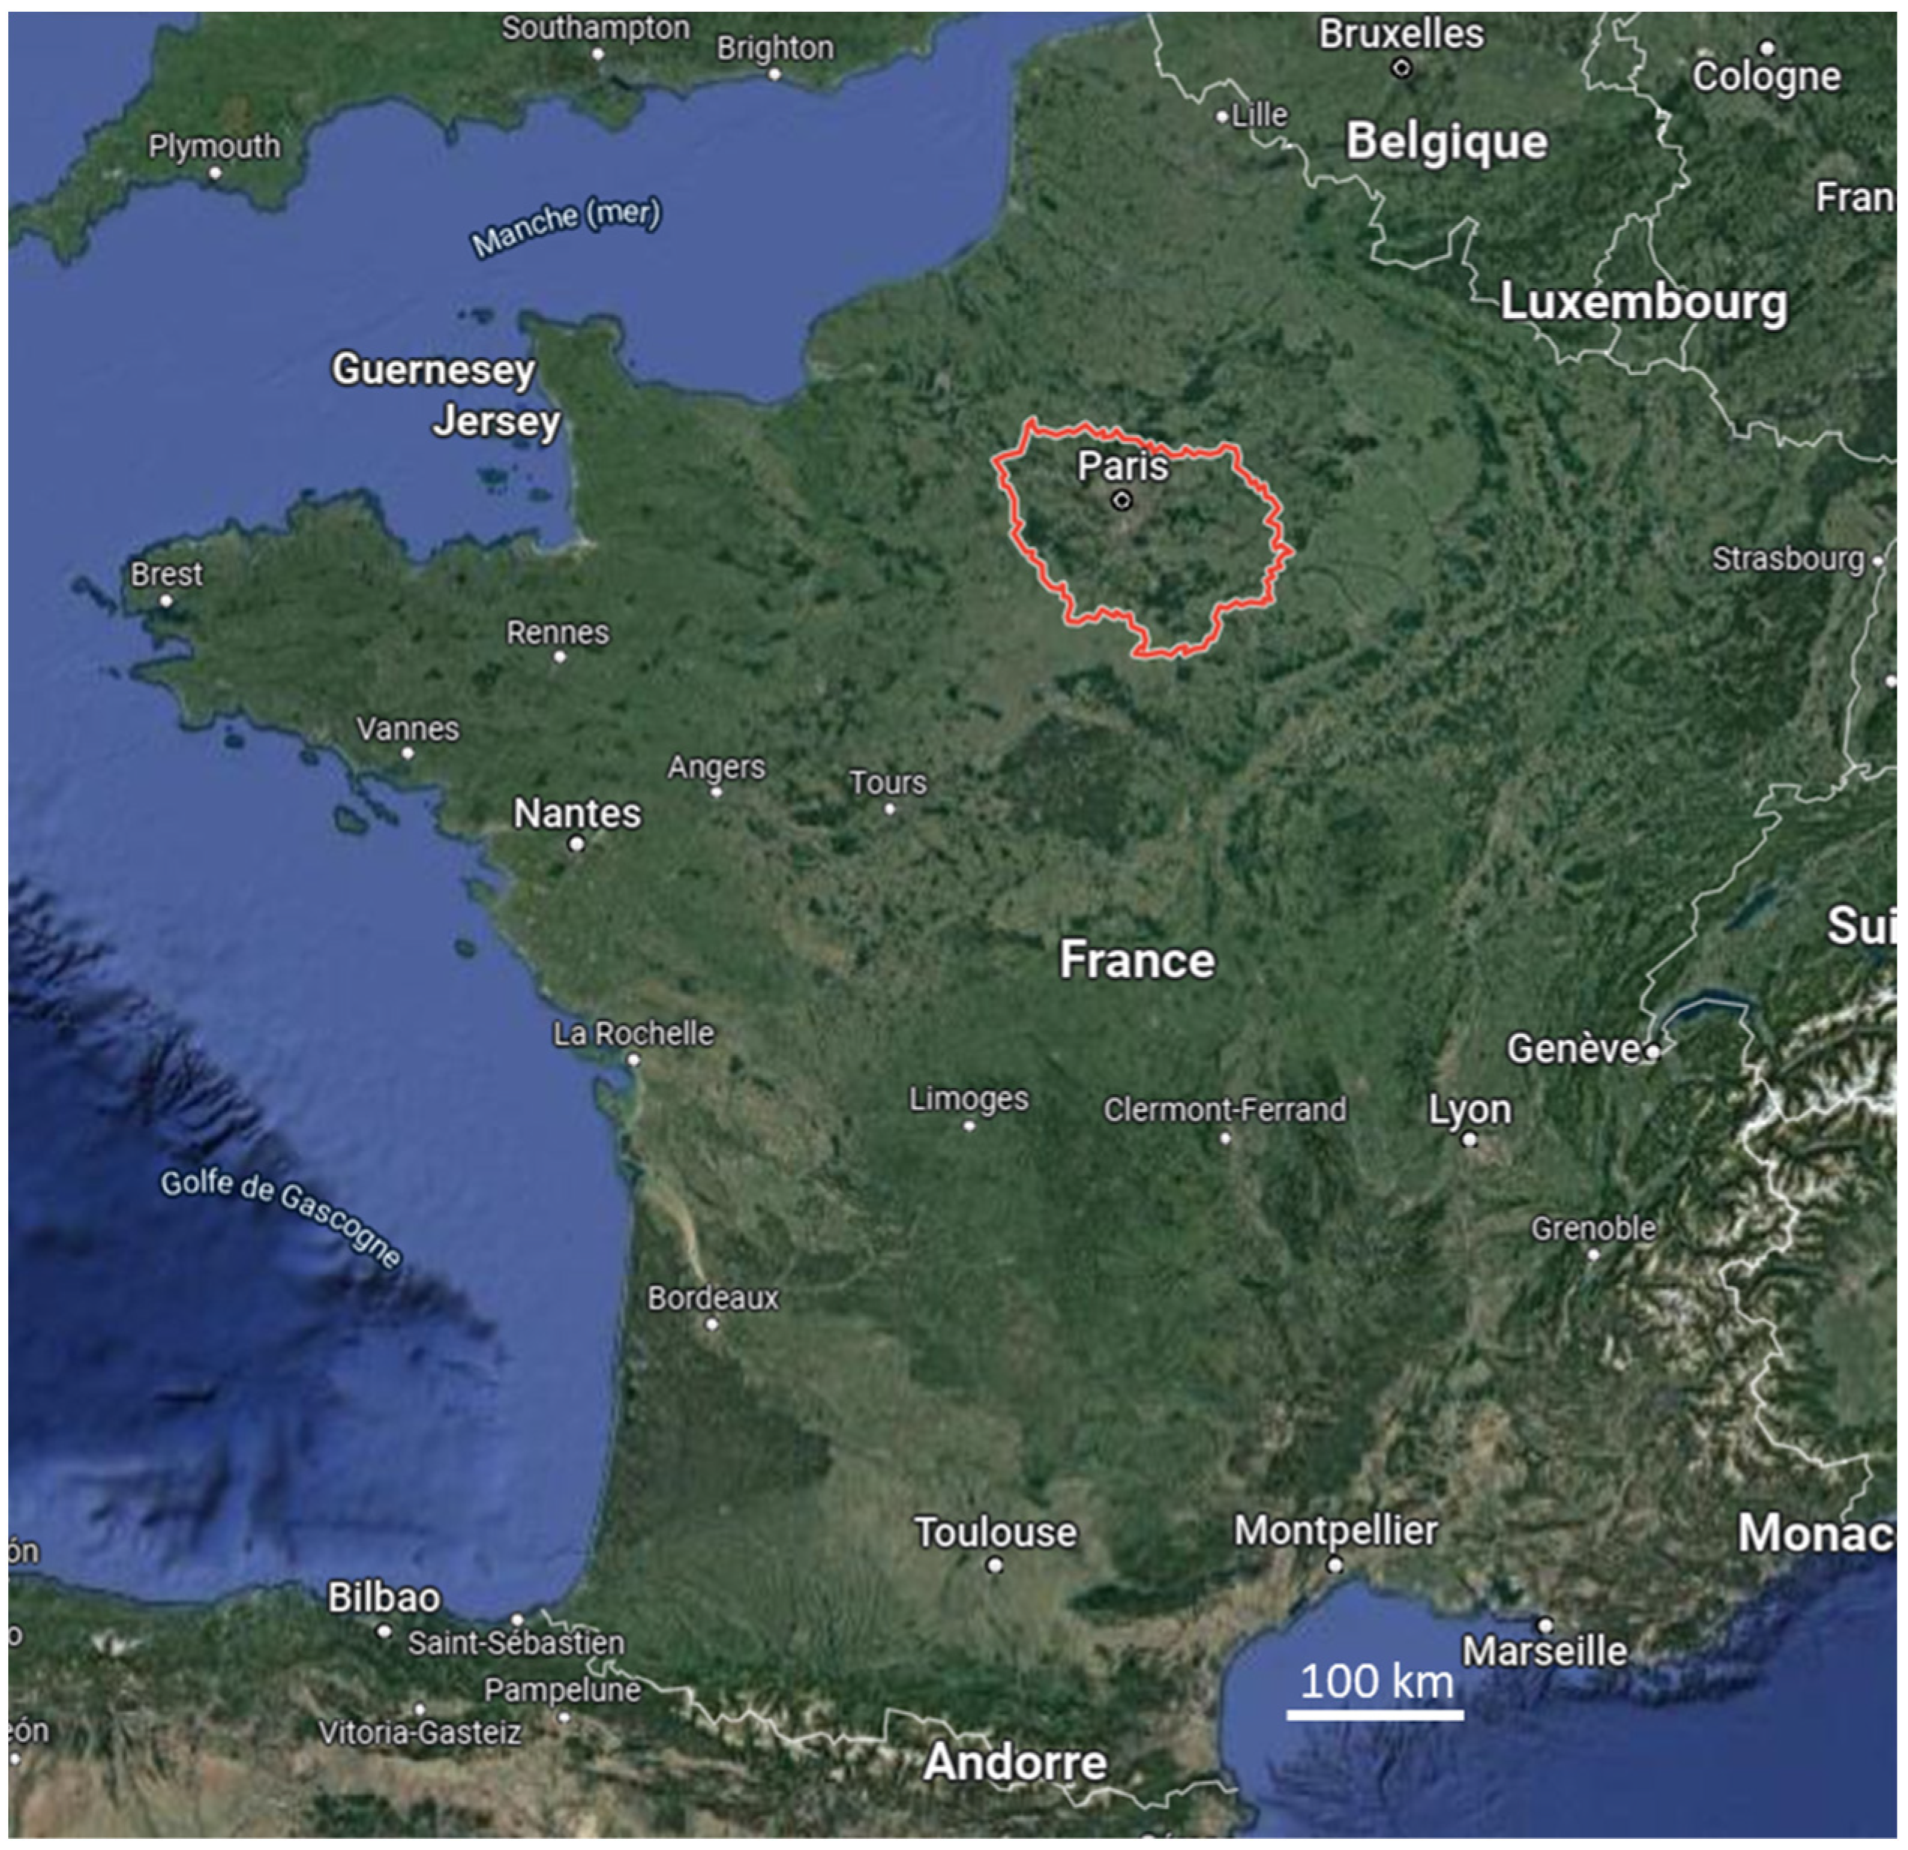
Planning a Notable CCS Pilot-Scale Project: A Case Study in France, Paris Basin—Ile-de-France


Abstract
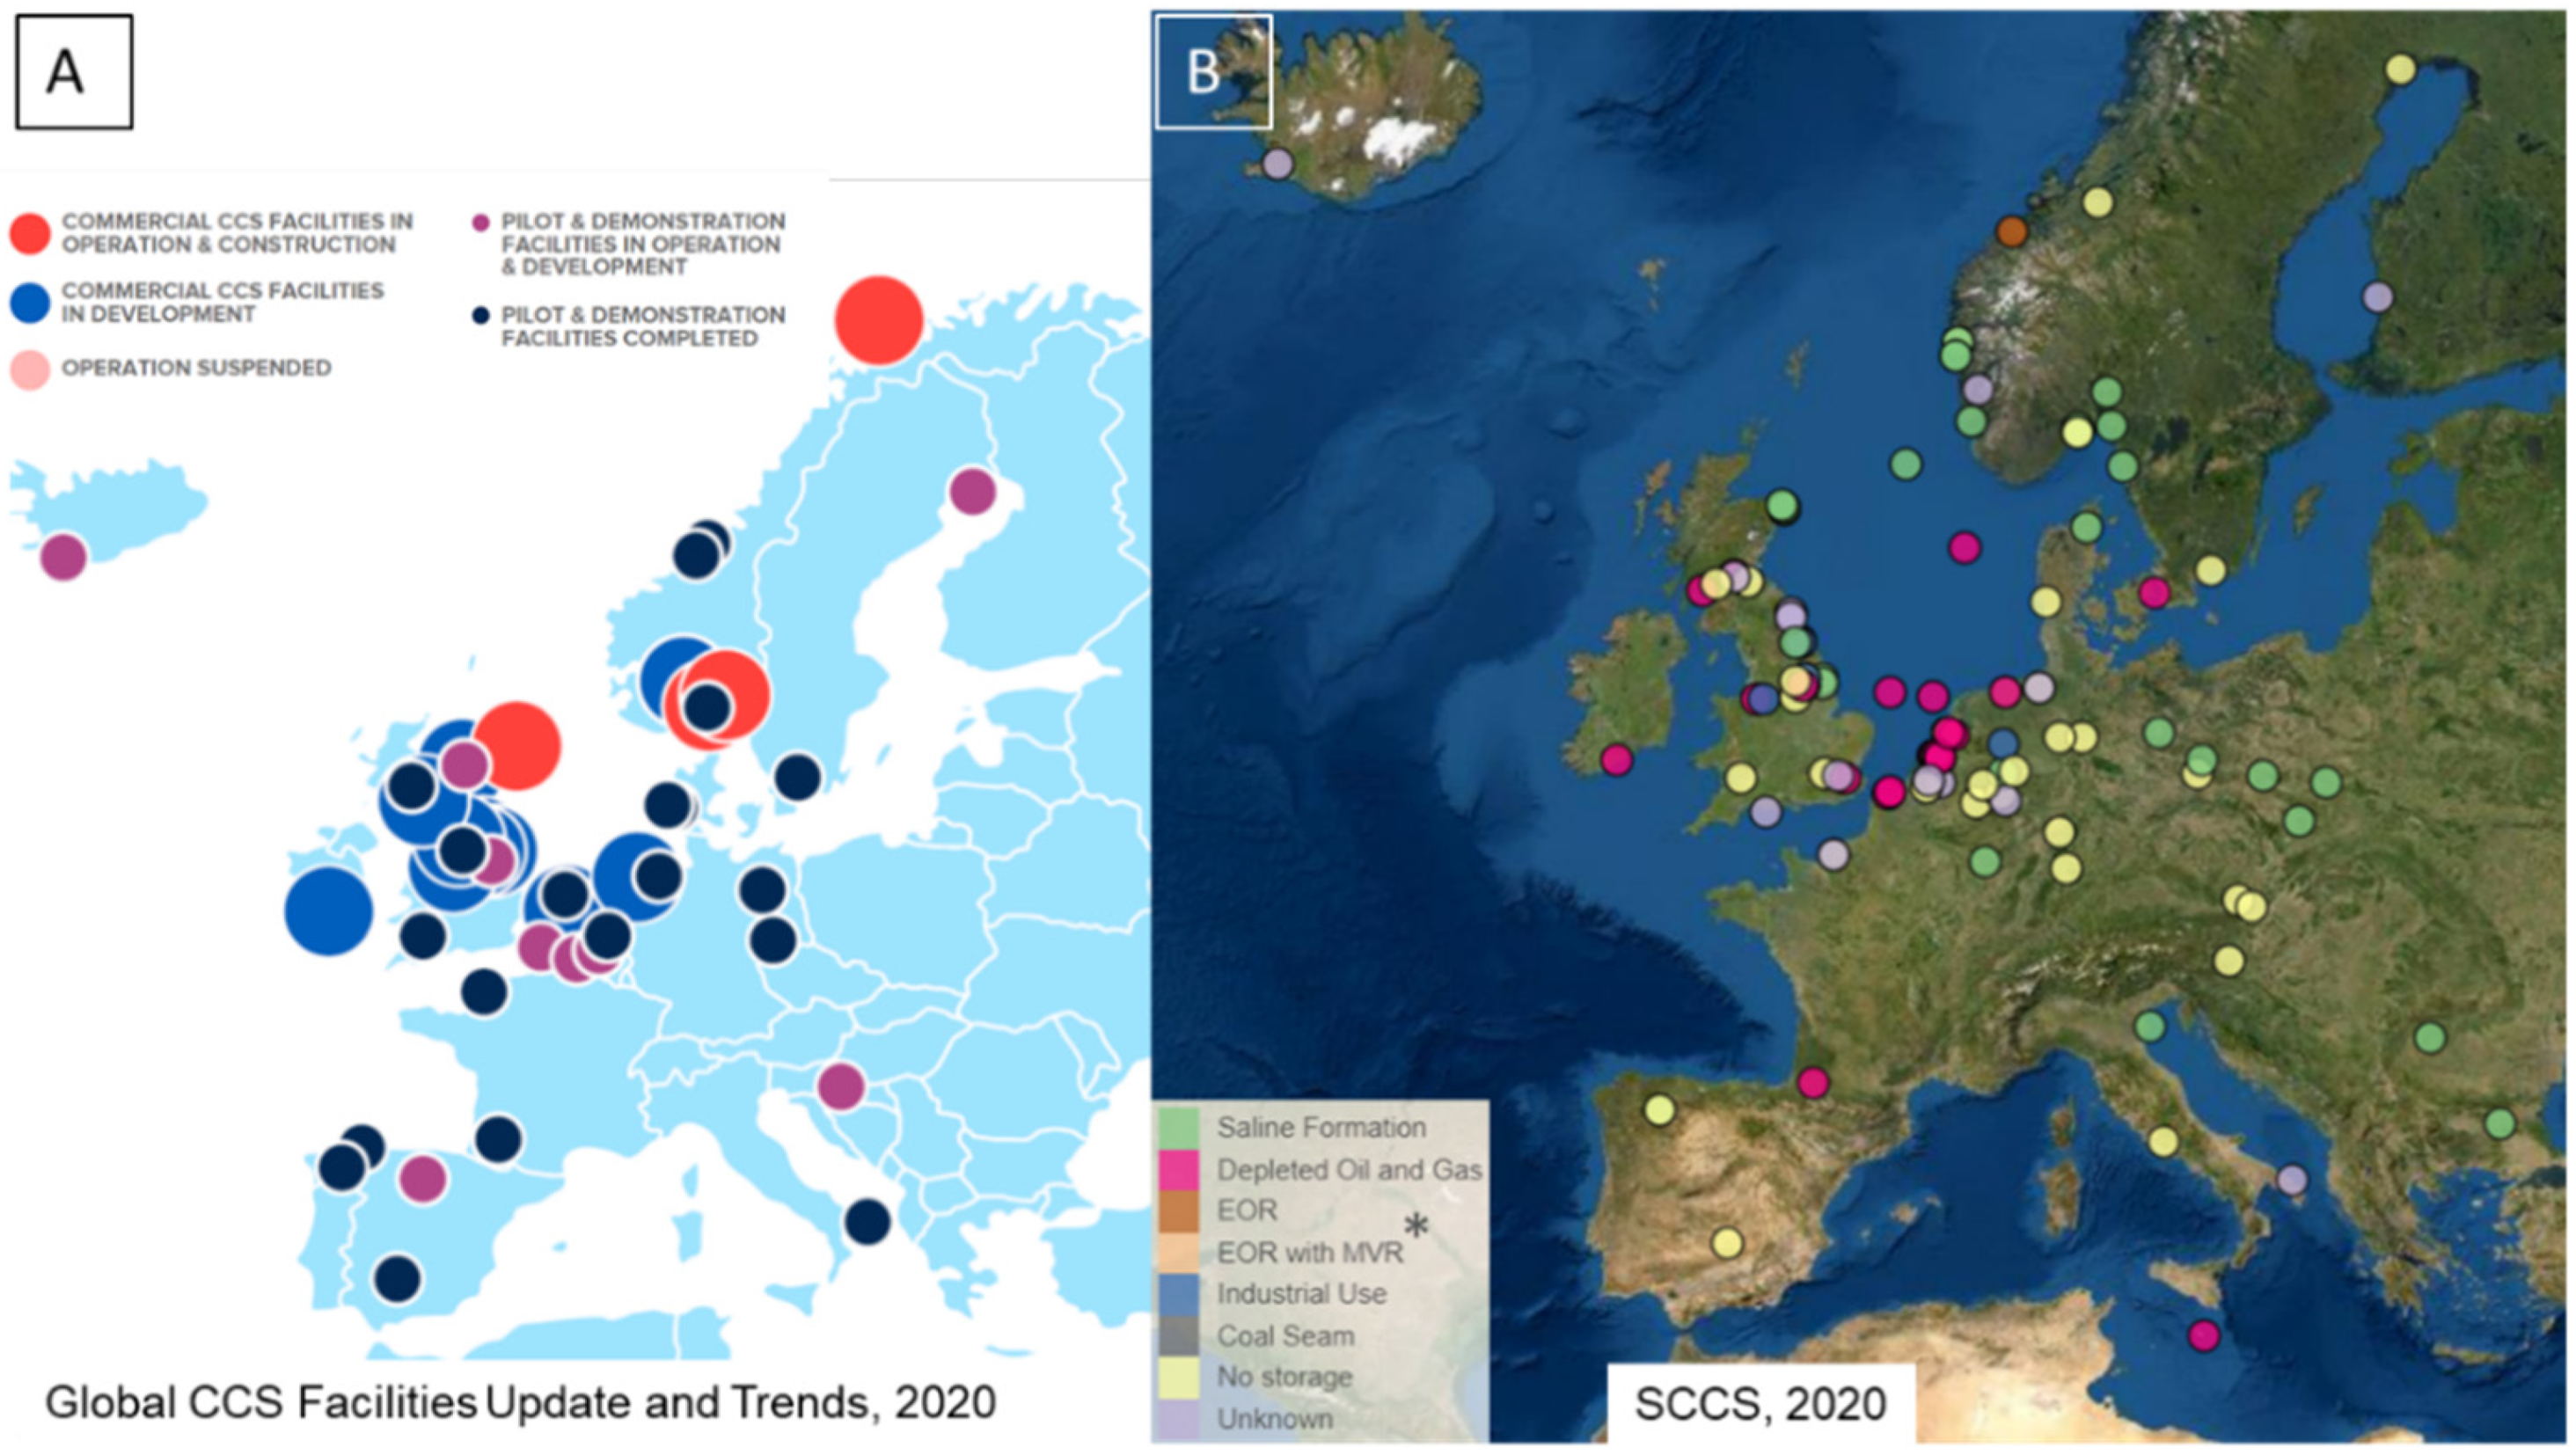
:1. Introduction
2. Materials and Methods
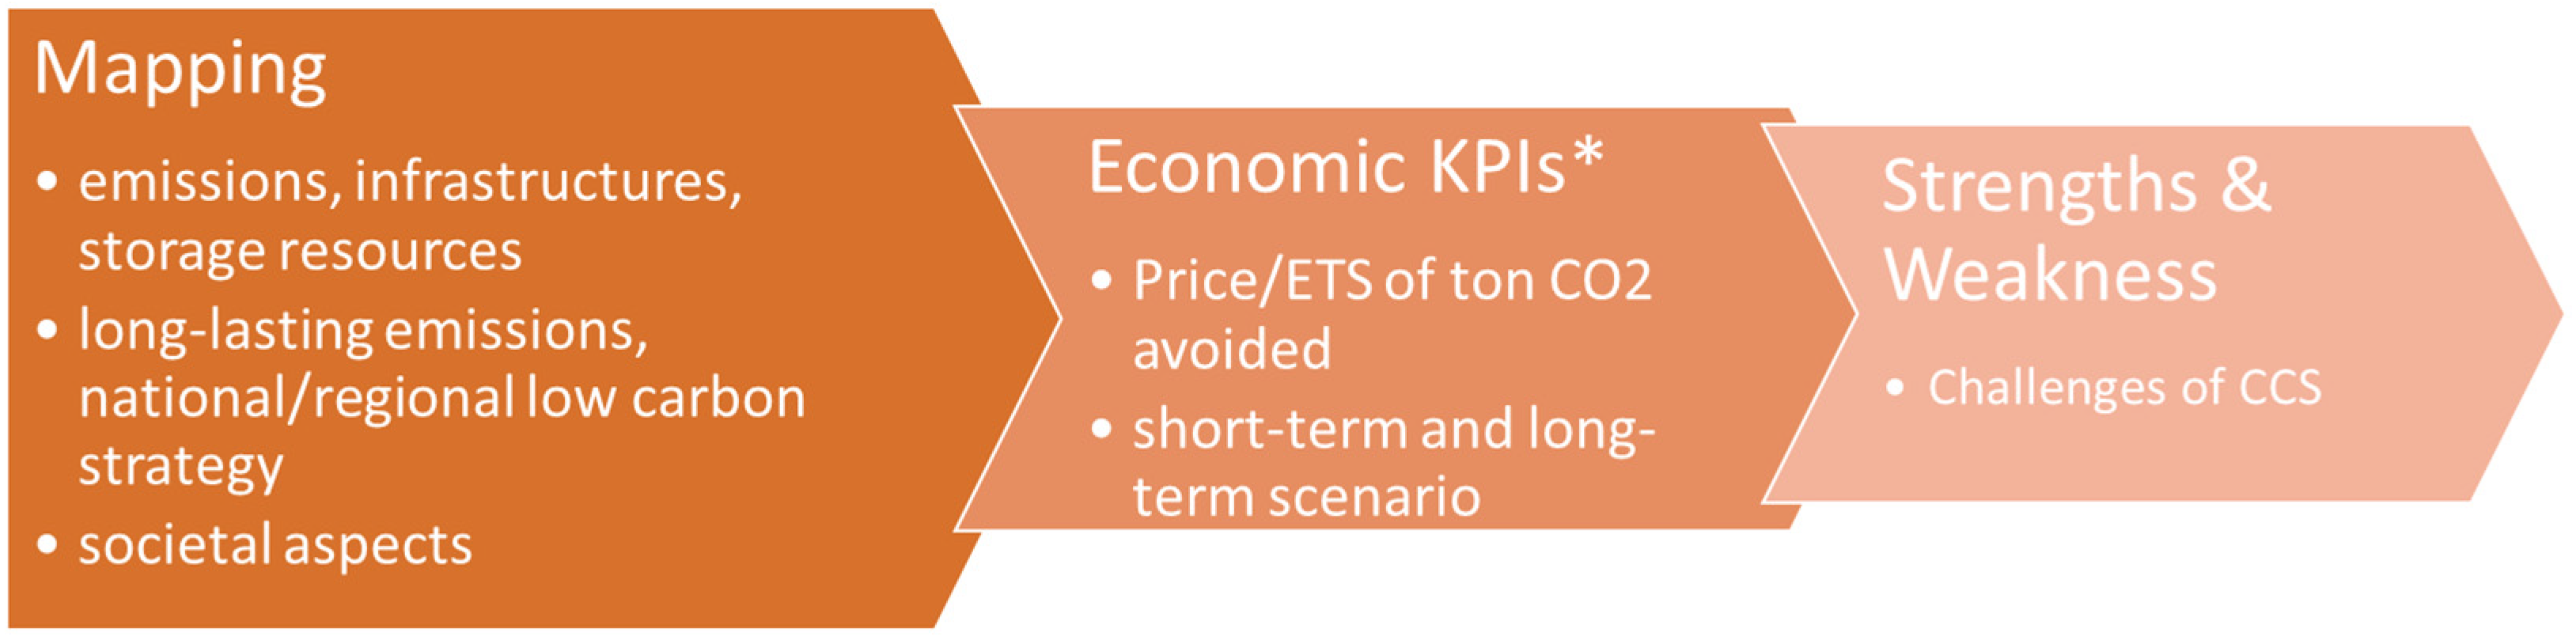
2.1. Mapping CCUS Aspects
2.2. Economic Key Performance Indicators (KPIs)
- Energy consumption.
- Net present costs for the capture, transport and storage.
- Amount of CO2 emissions avoided and negative emissions.
- Revenue created by the down-stream utilization industries.
3. Results
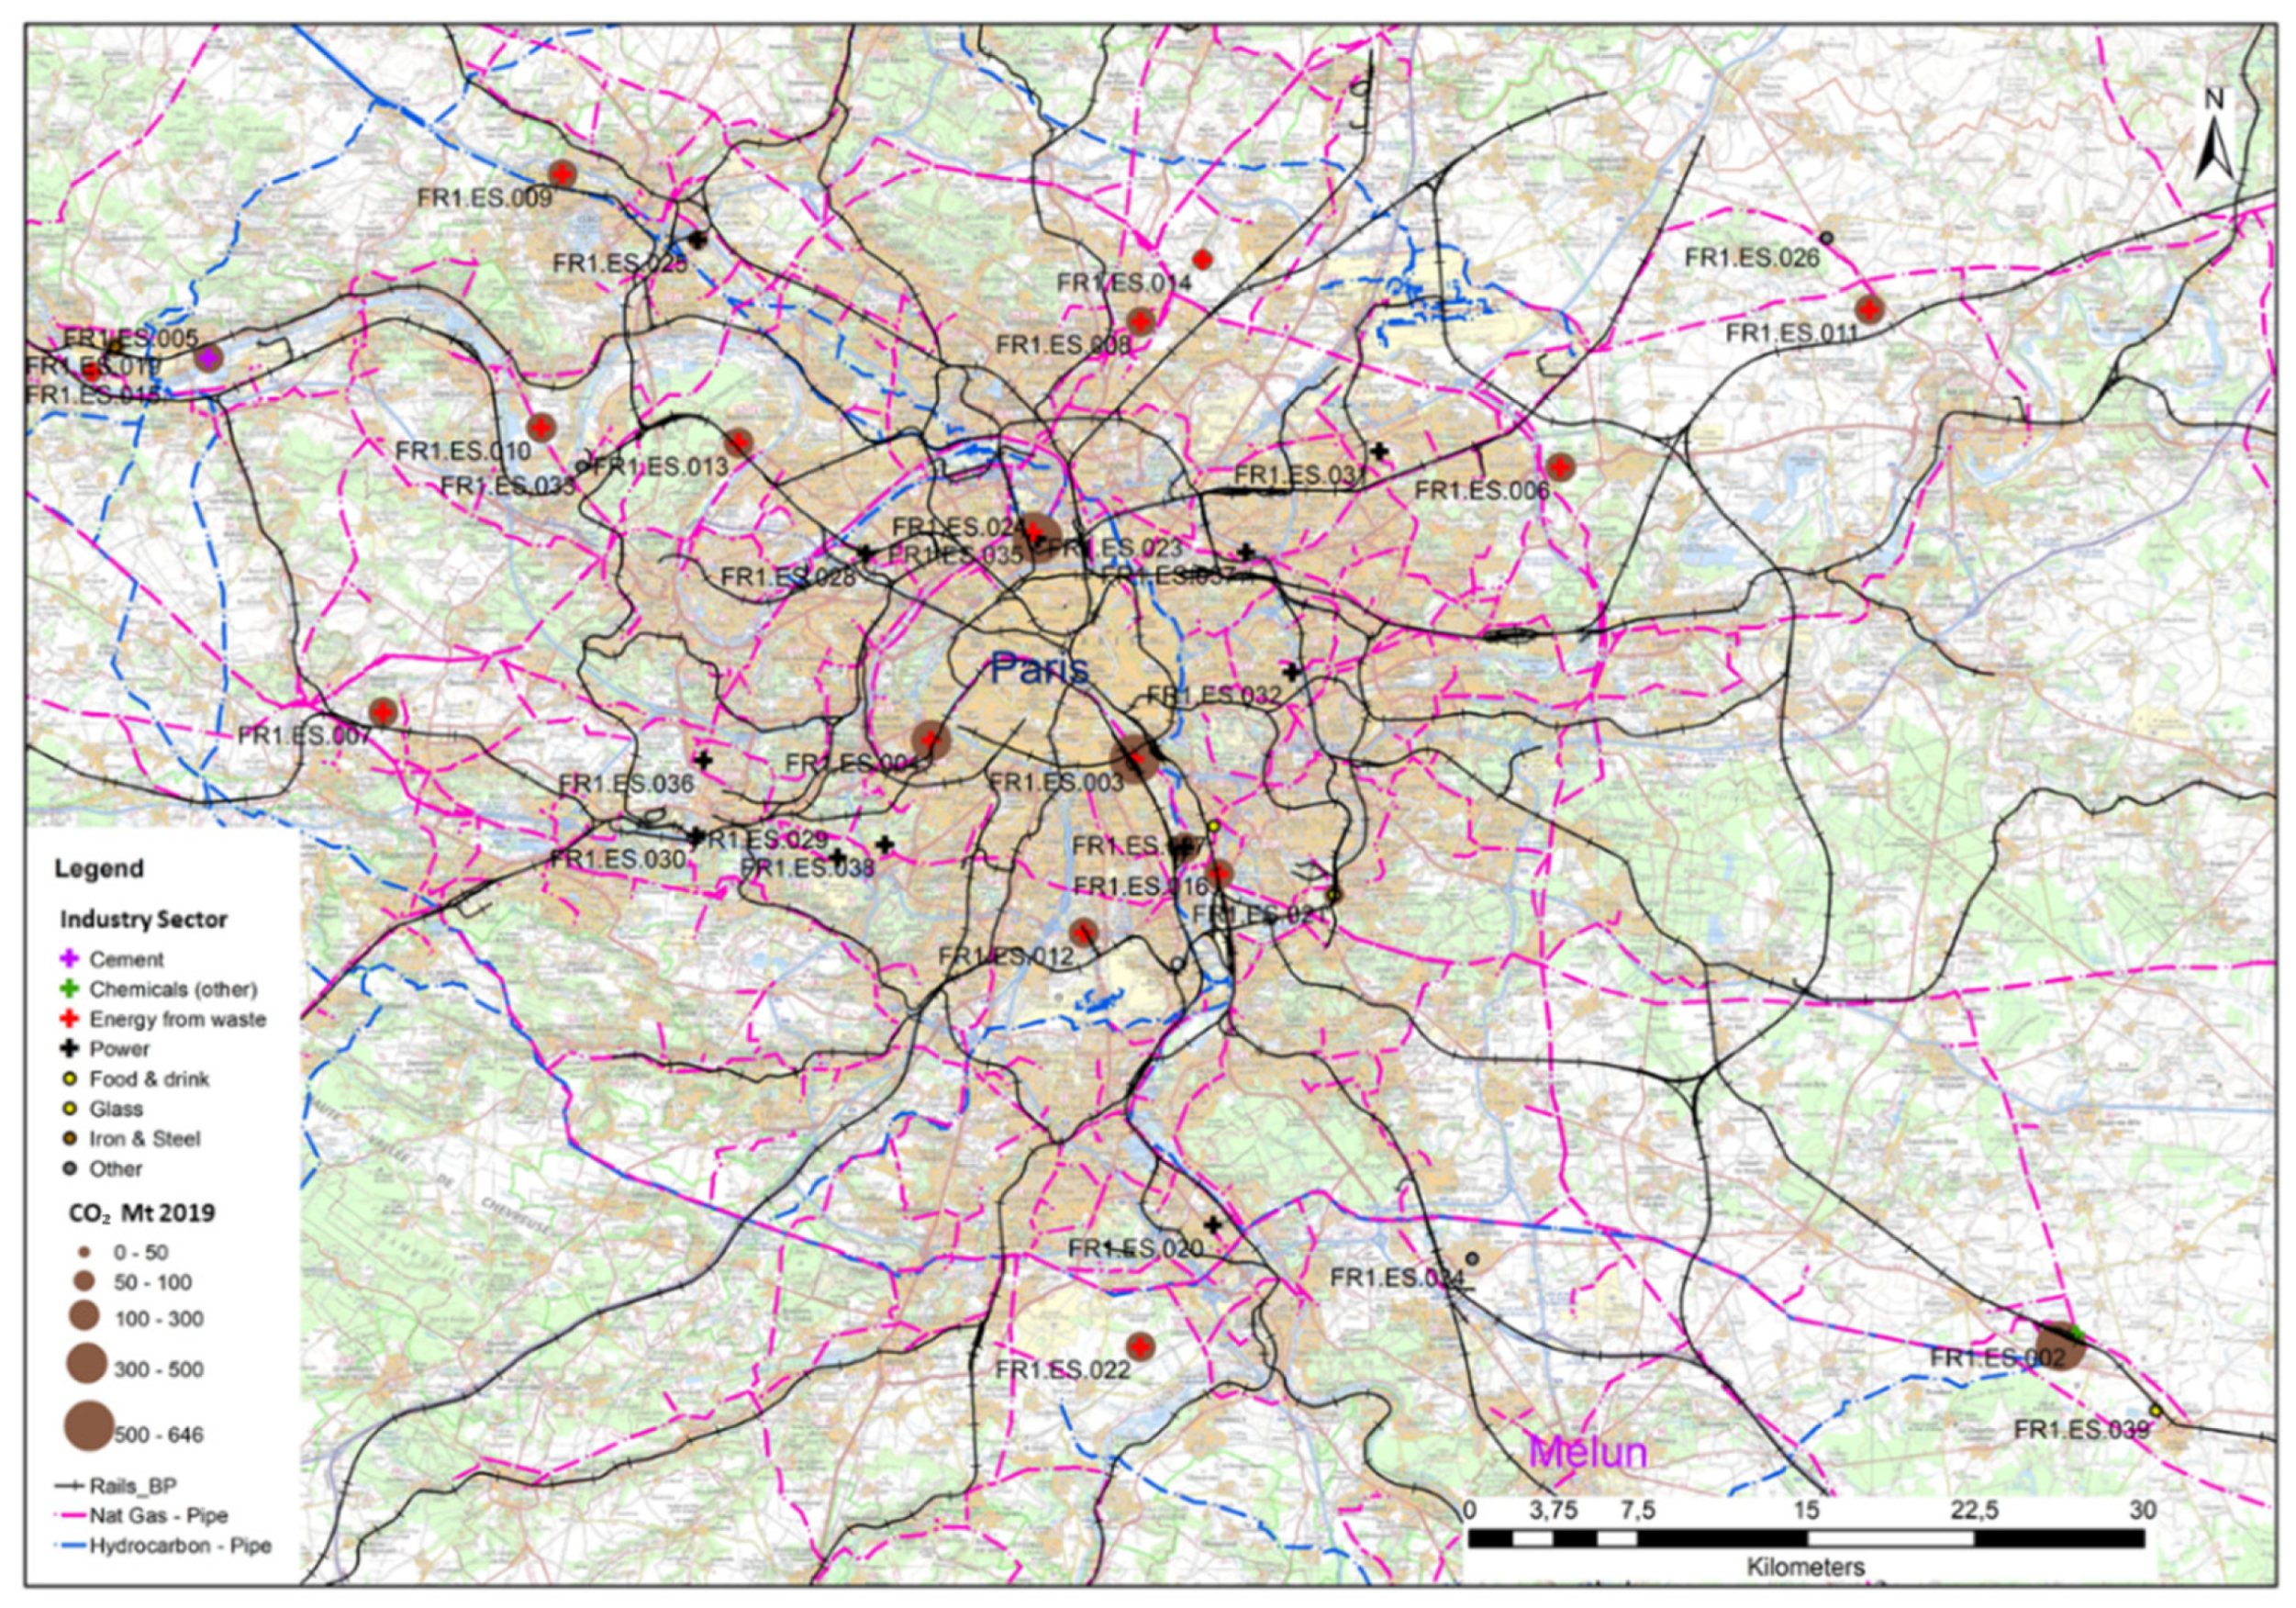
3.1. Mapping Results
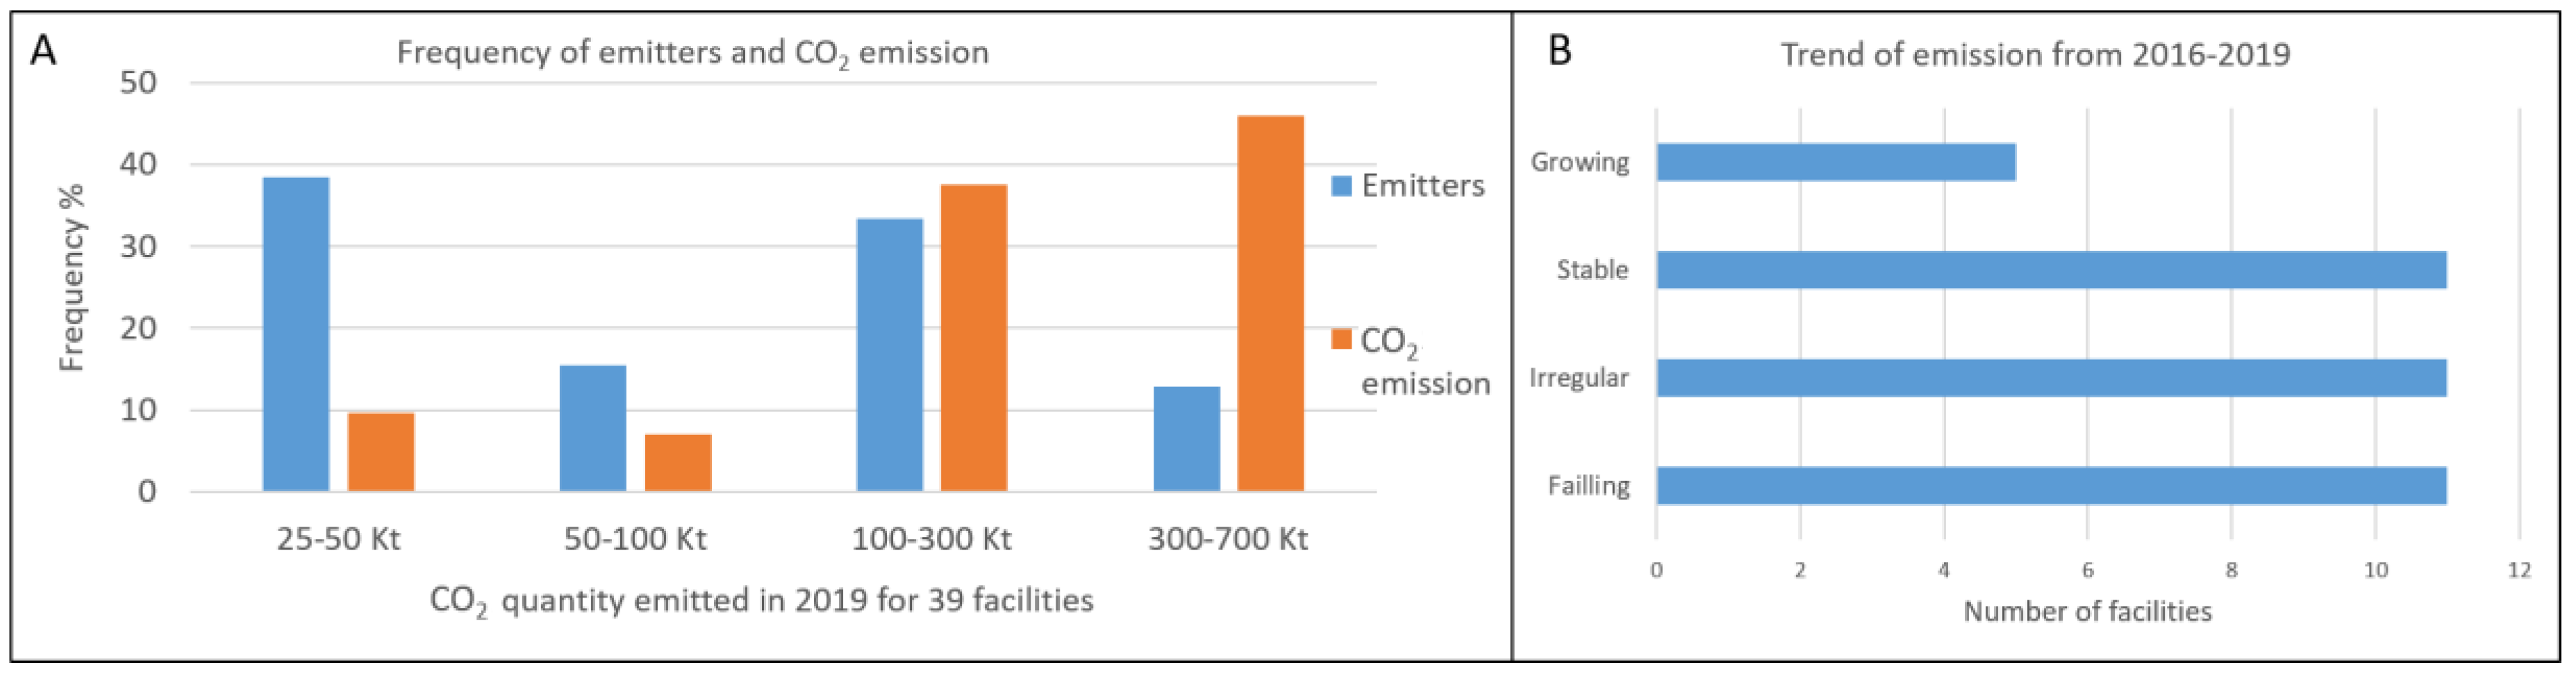
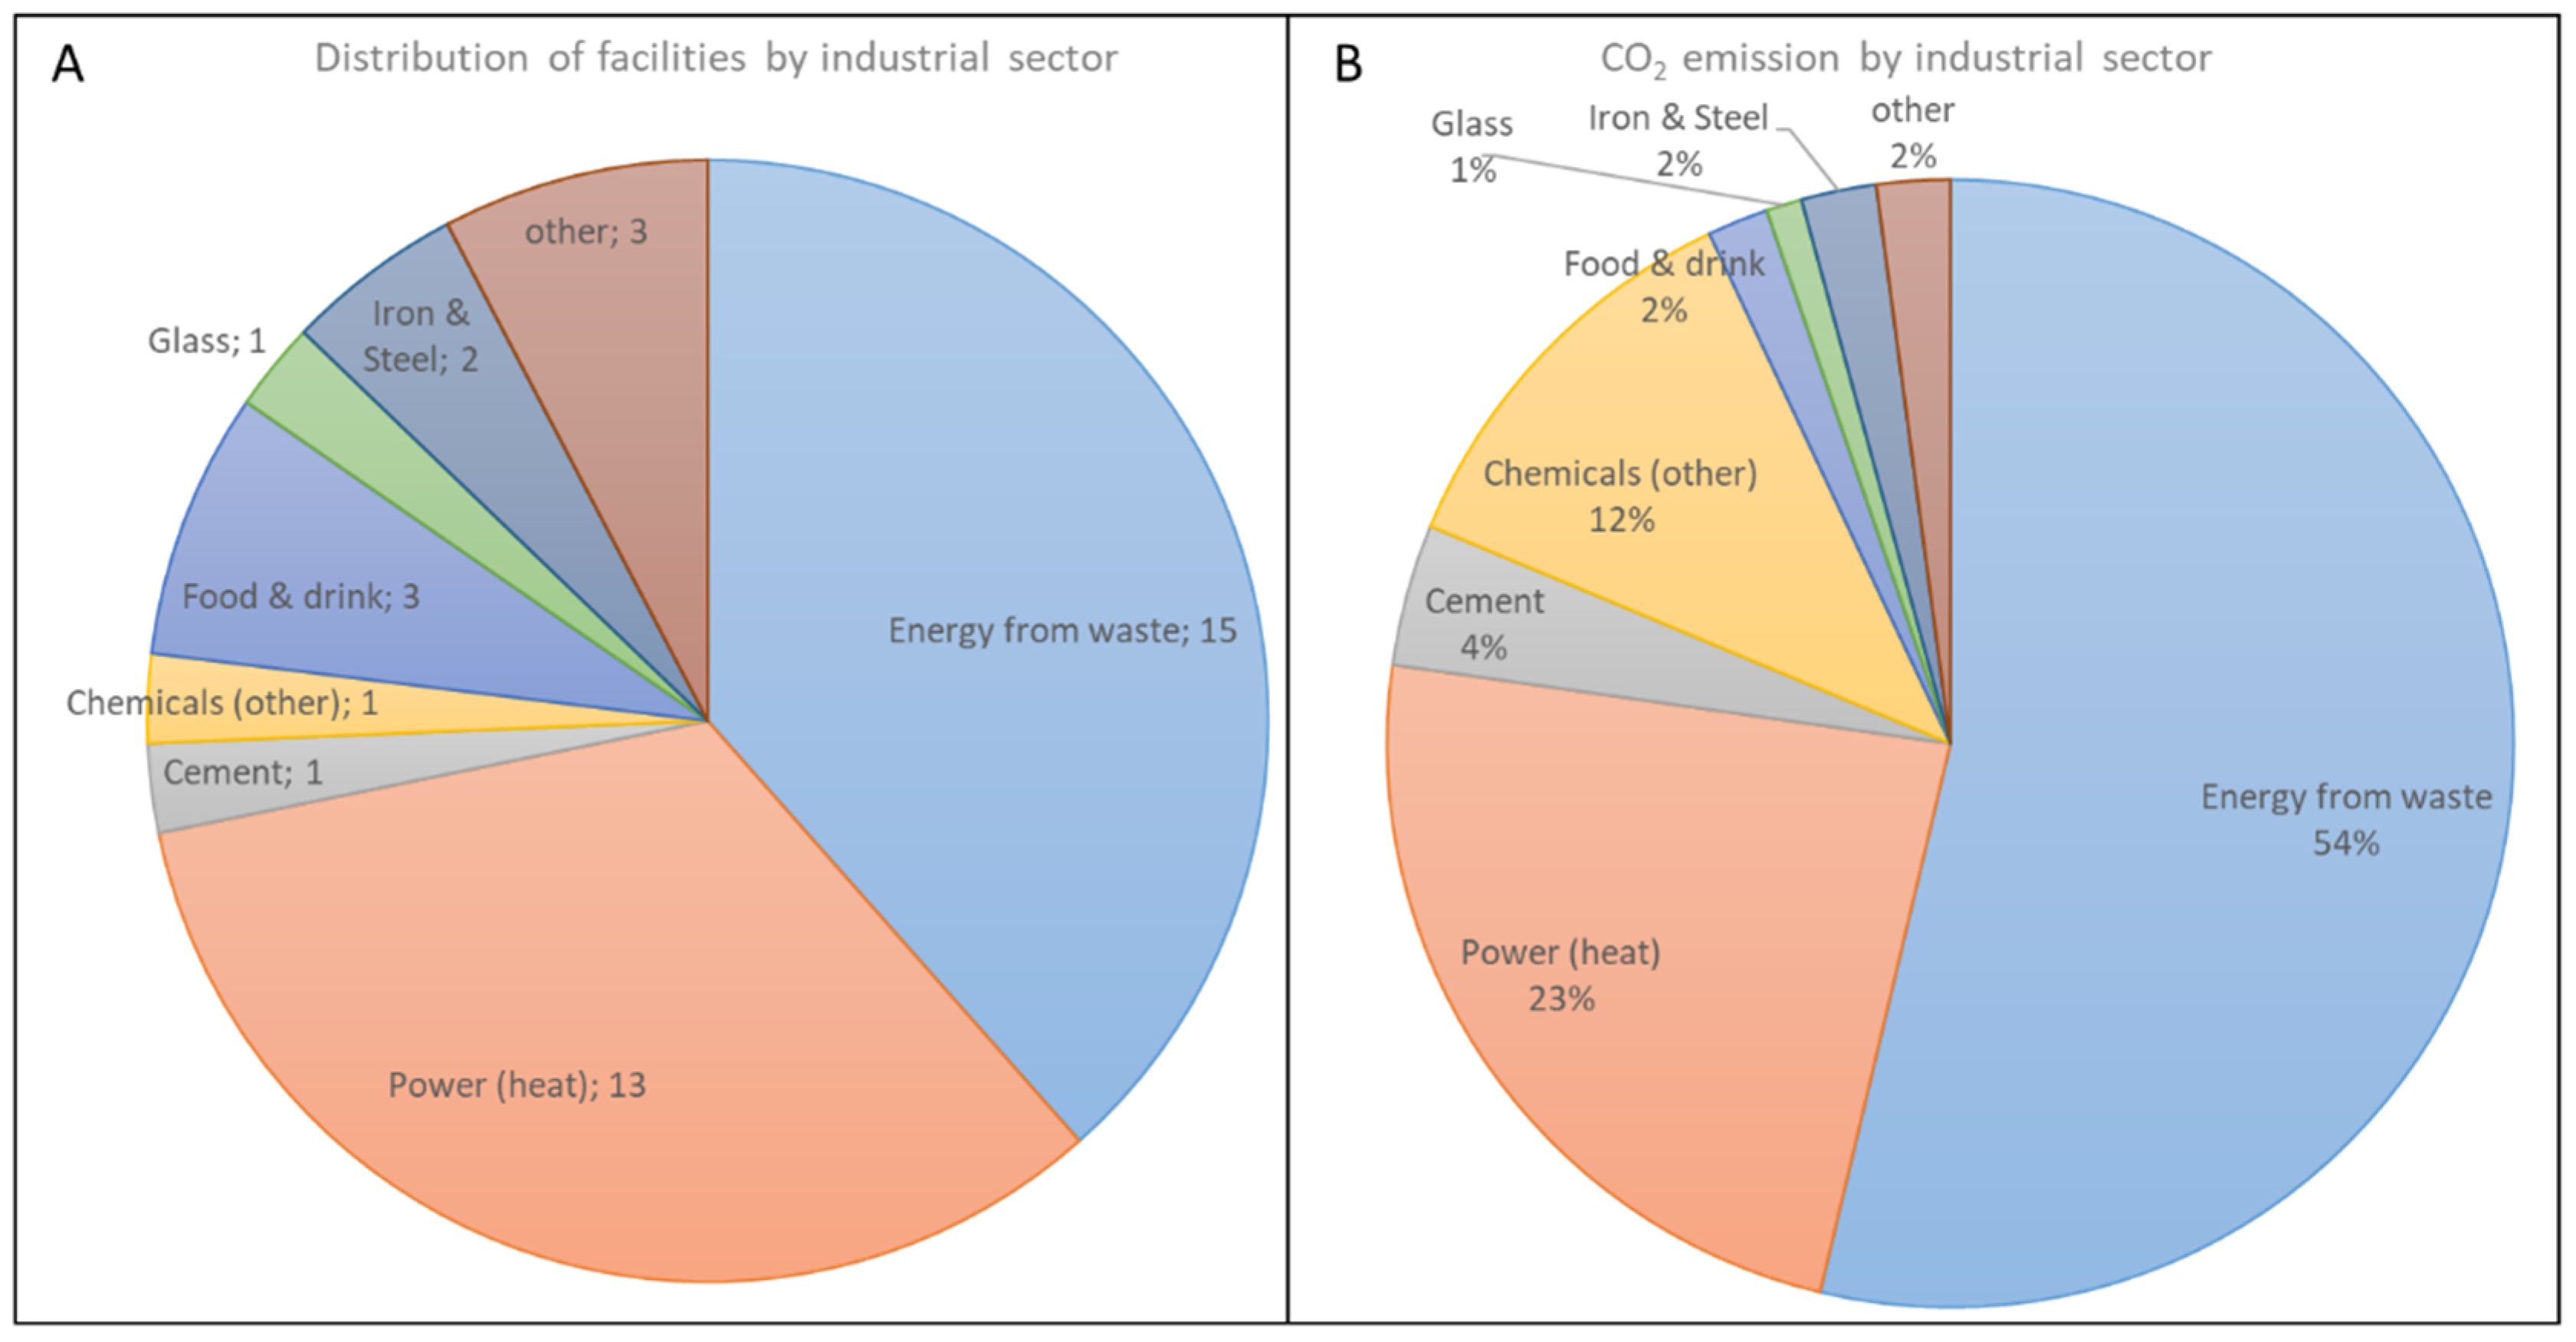
3.1.1. Emissions Sources
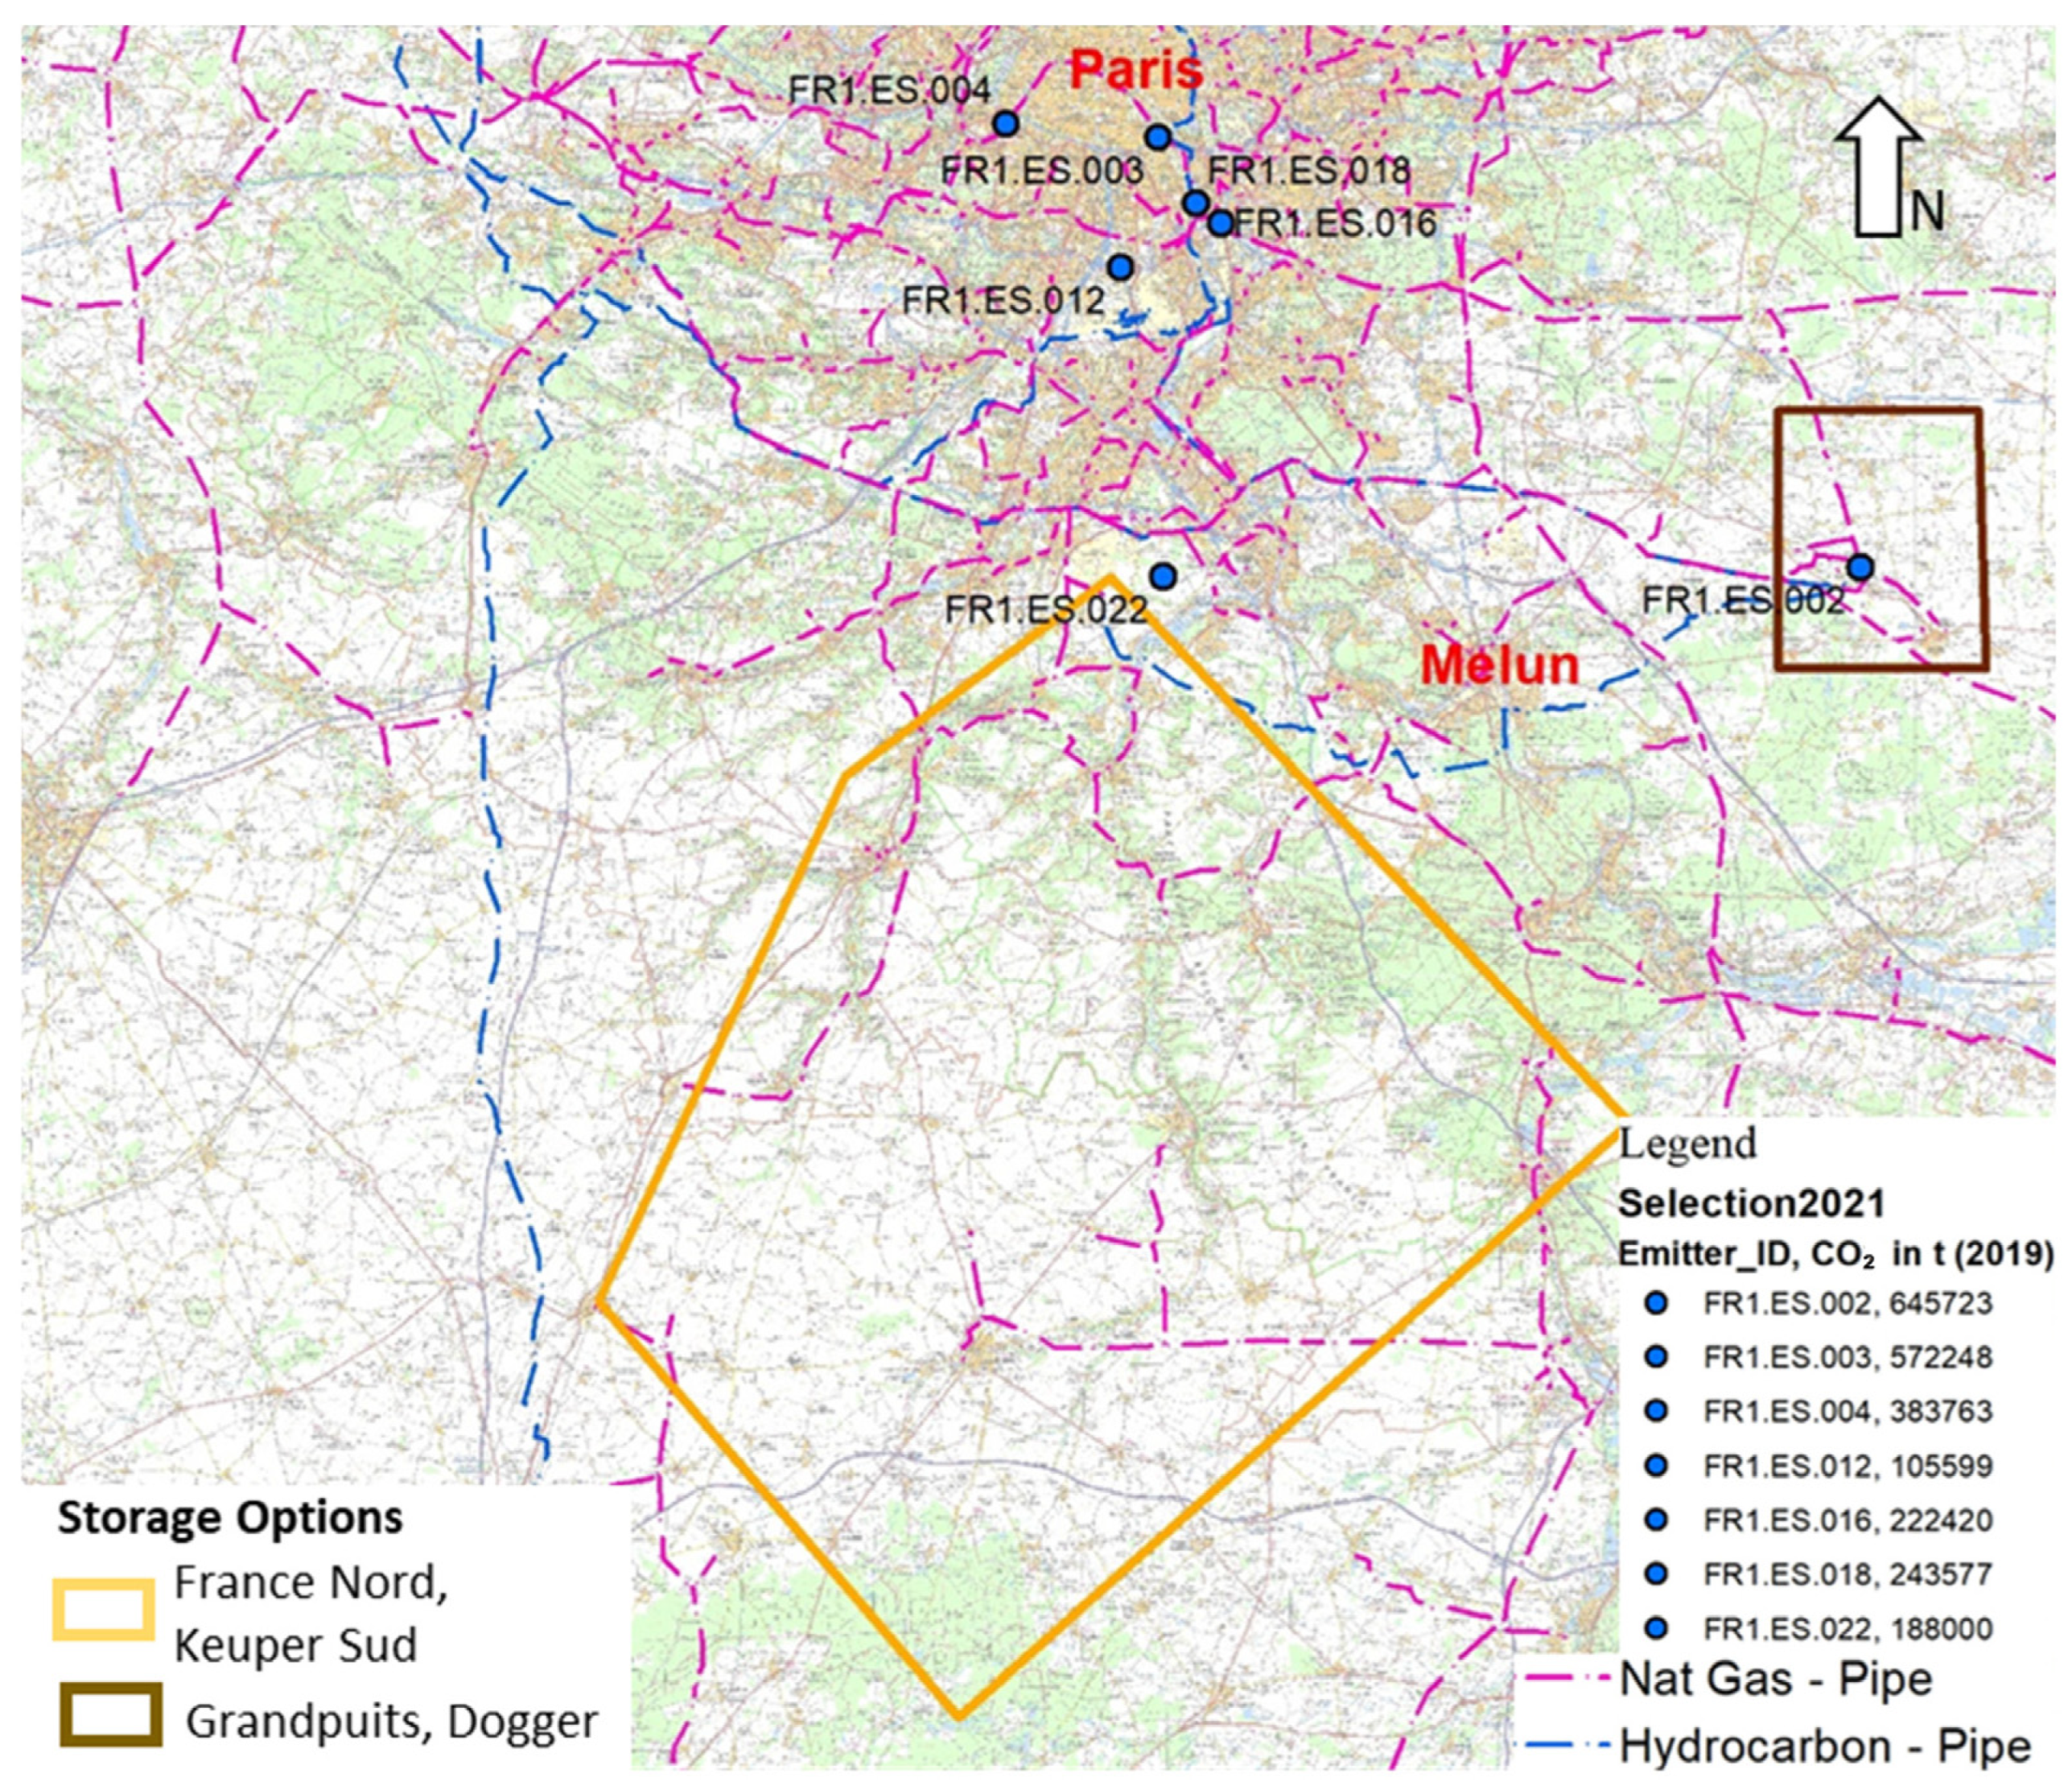
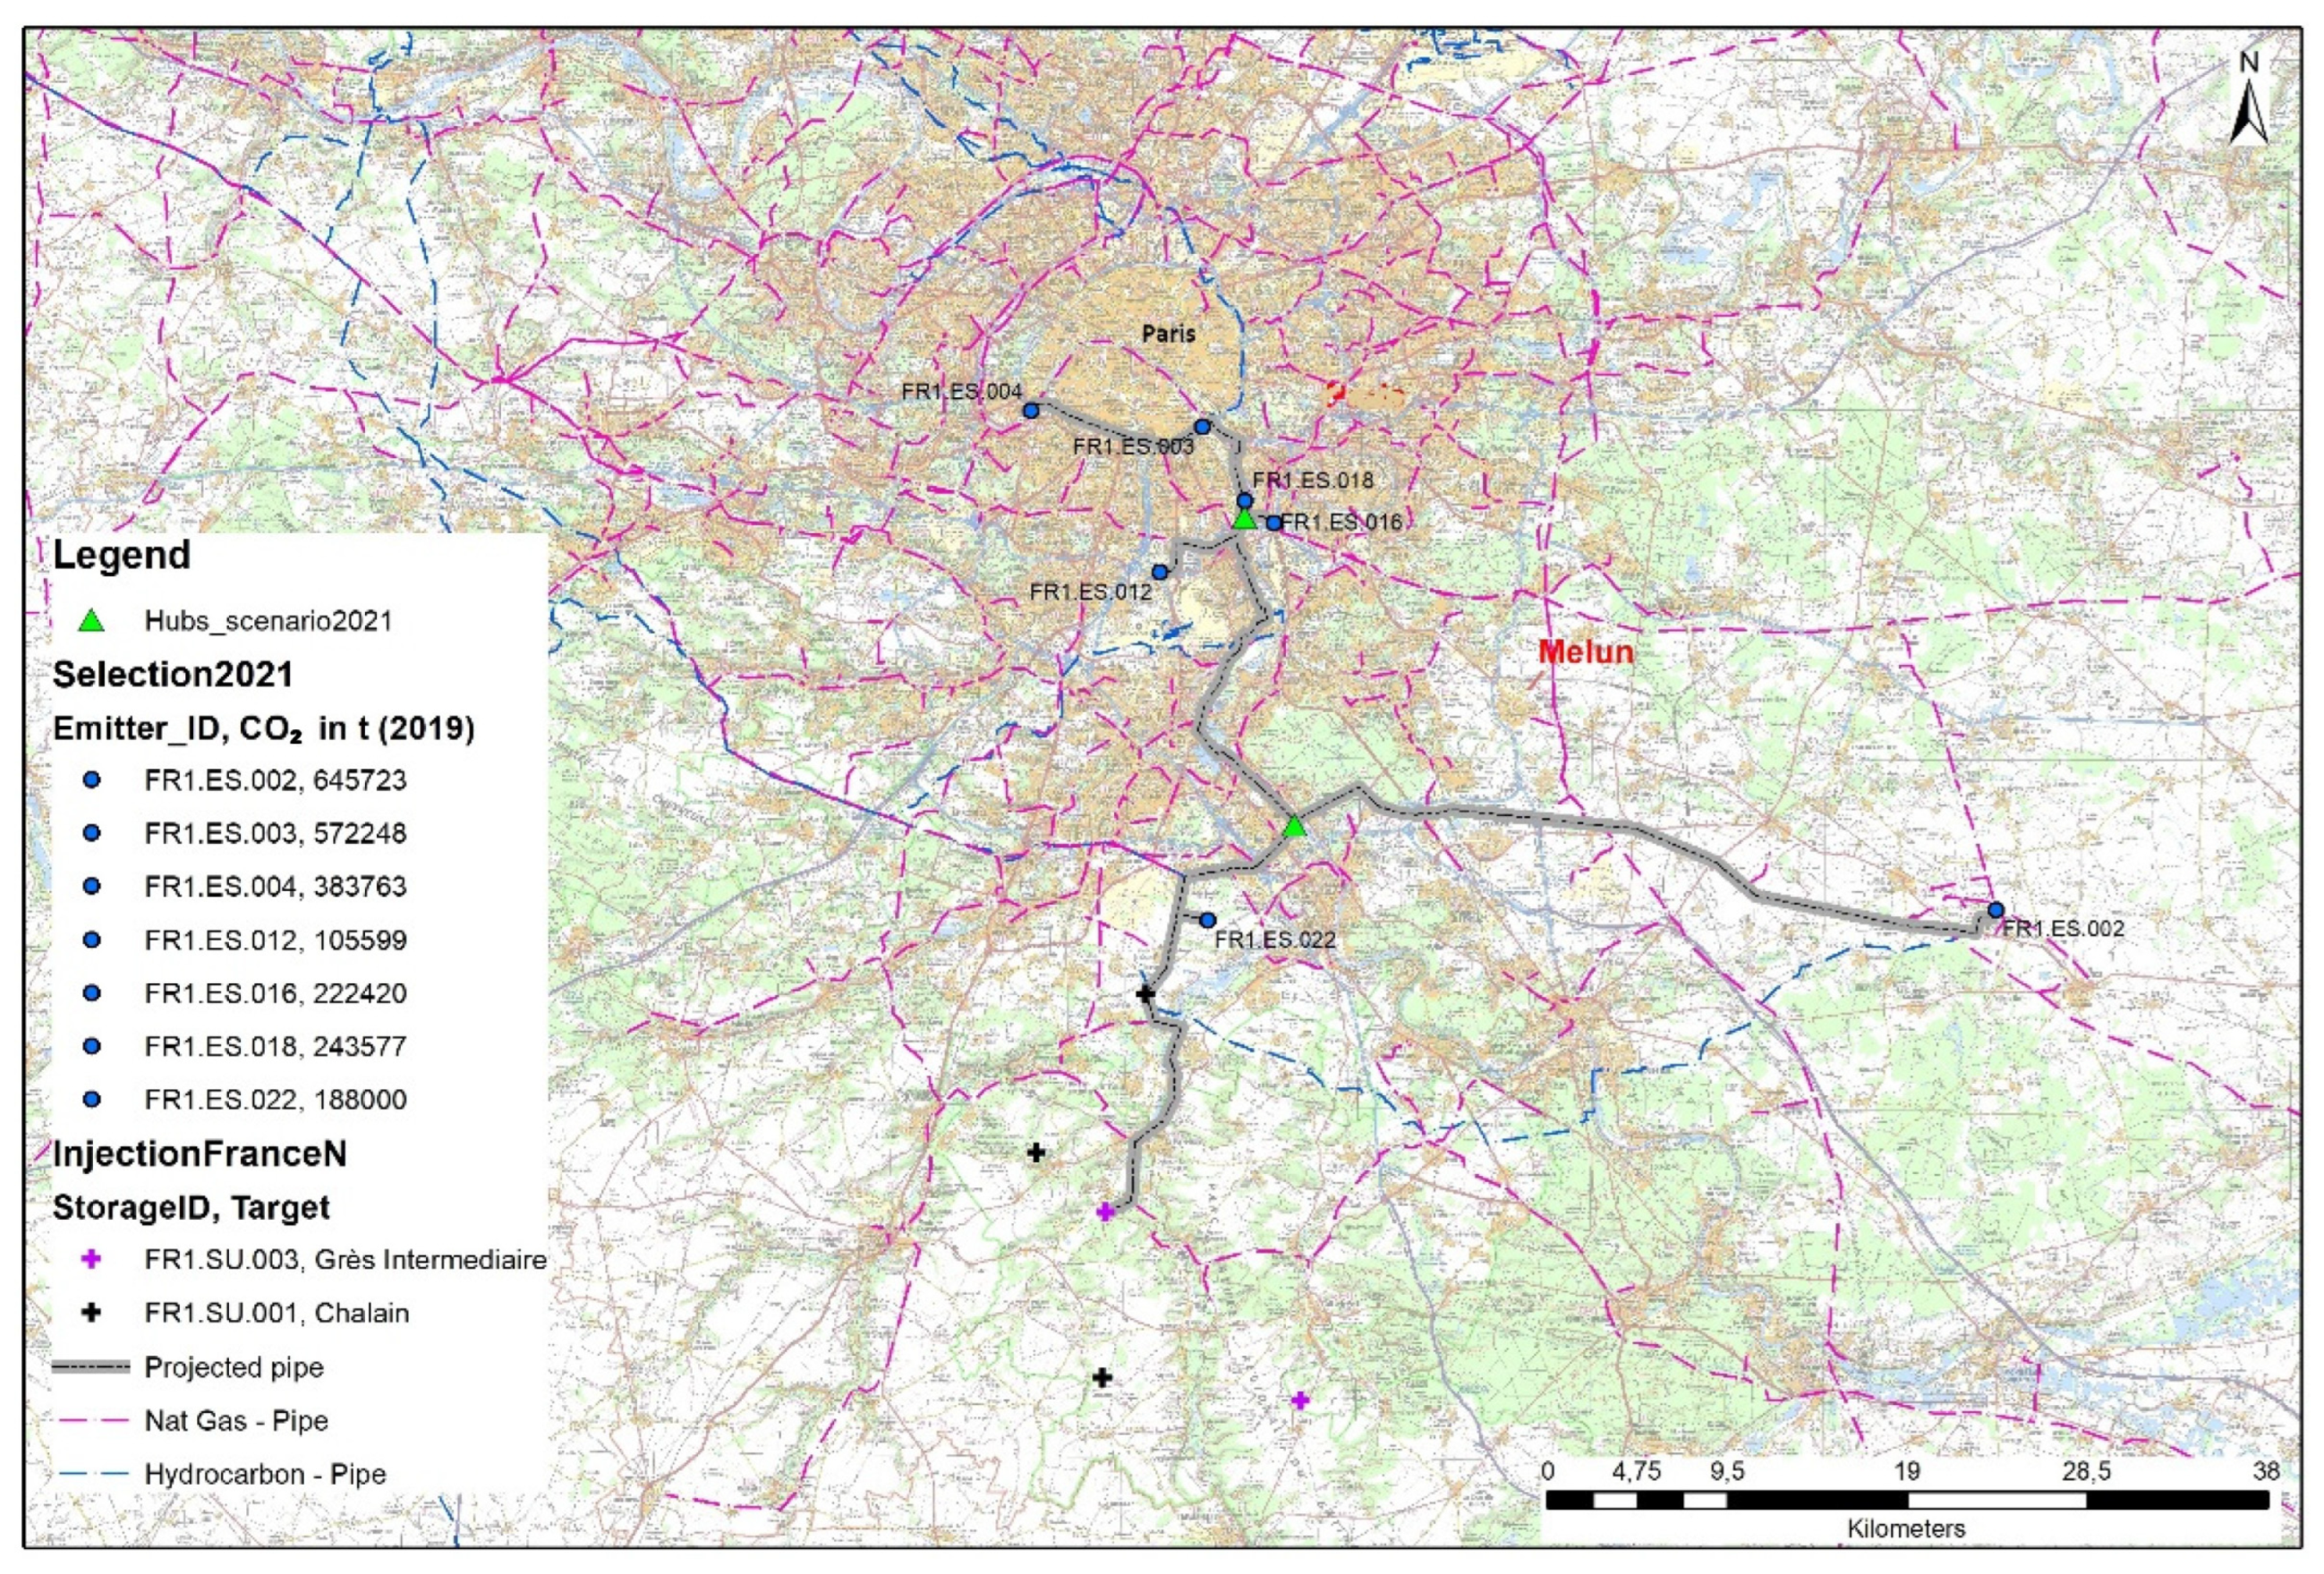
3.1.2. Storage Options
With
[(A × 1 × 10⁶) × h × Phi] = Reservoir Pore volume
3.1.3. Spatial Condition for Cluster and Network
3.1.4. National Low-Carbon Strategy and Emission Profile
3.1.5. Mapping Societal Aspects
- The majority of interviewees considered CCUS technologies as a potential option to fight against climate change.
- Interviewees often underline that CCUS is only one option among other solutions to reduce carbon dioxide emissions.
- CCU is particularly well-perceived by interviewees and appears to them to offer higher potential than CCS, regardless of the current limited volumes concerned by CO2 valorization.
3.2. Economic KPIs
Waste-to-Energy Challenge
4. Discussion and Conclusions
Author Contributions
Funding
Institutional Review Board Statement
Informed Consent Statement
Data Availability Statement
Acknowledgments
Conflicts of Interest
Appendix A

| Emitter ID | Facility Name | Industry Sector | CO2 from Biomass Combustion (Ton) | CO2 Reported (Ton) | Year Reported | Emission Trend (2016–2019) |
|---|---|---|---|---|---|---|
| FR1.ES.002 | Borealis Grandpuits | Chemicals (other) | 645,723 | 2019 | Irregular | |
| FR1.ES.003 | IVRY PARIS XIII | Energy from waste | 330,683 | 572,248 | 2019 | Stable |
| FR1.ES.004 | CPCU chaufferies de ST-OUEN I et ST-OUEN II | Power | 150,949 | 522,182 | 2019 | Stable |
| FR1.ES.005 | DALKIA WASTENERGY | Energy from waste | 231,791 | 416,366 | 2019 | |
| FR1.ES.006 | TSI | Energy from waste | 217,779 | 383,763 | 2019 | Growing |
| FR1.ES.007 | SNC Cogé VITRY | Power | 243,577 | 2019 | Stable | |
| FR1.ES.008 | Ciments Calcia usine de Gargenville | Cement | 100,275 | 224,897 | 2019 | Falling |
| FR1.ES.009 | VALO’MARNE | Energy from waste | 123,700 | 222,420 | 2019 | Stable |
| FR1.ES.010 | SEMARIV-CITD | Energy from waste | 107,000 | 188,000 | 2018 | Falling |
| FR1.ES.011 | CPCU ST-OUEN III | Power | 163,579 | 2019 | Stable | |
| FR1.ES.012 | SIAAP Site Seine Aval | Energy from waste | 143,847 | 144,299 | 2019 | Falling |
| FR1.ES.013 | SAREN | Energy from waste | 81,893 | 143,672 | 2019 | Growing |
| FR1.ES.014 | Routière de l’Est Parisien (ISDND de Claye Souilly) | Energy from waste | 140,933 | 140,933 | 2019 | Falling |
| FR1.ES.015 | AUROR’ENVIRONNEMENT | Energy from waste | 78,501 | 137,944 | 2019 | Falling |
| FR1.ES.016 | CVD Thiverval-Grignon | Energy from waste | 76,000 | 133,000 | 2018 | Irregular |
| FR1.ES.017 | AZALYS | Energy from waste | 67,860 | 119,053 | 2019 | Falling |
| FR1.ES.018 | SOMOVAL | Energy from waste | 60,085 | 106,088 | 2019 | Stable |
| FR1.ES.019 | GENERIS—Site de Rungis | Energy from waste | 60,033 | 105,599 | 2019 | Falling |
| FR1.ES.020 | BOUQUEVAL ENERGIE | Energy from waste | 86,736 | 86,736 | 2019 | Falling |
| FR1.ES.021 | SARP Industries | Energy from waste | 72,764 | 2019 | Irregular | |
| FR1.ES.022 | SAM MONTEREAU | Iron & Steel | 68,948 | 2019 | Irregular | |
| FR1.ES.023 | SGD Usine de SUCY EN BRIE | Glass | 56,851 | 2019 | Stable | |
| FR1.ES.024 | CYEL | Power | 32,042 | 54,489 | 2019 | Irregular |
| FR1.ES.025 | ALPA | Iron & Steel | 50,398 | 2019 | Growing | |
| FR1.ES.026 | KNAUF Plâtres | Other | 48,995 | 2019 | Stable | |
| FR1.ES.027 | BIO SPRINGER | Food & drink | 45,223 | 2019 | Stable | |
| FR1.ES.028 | GRAND PARIS SUD ENERGIE POSITIVE | Power | 44,095 | 2019 | Growing | |
| FR1.ES.029 | ENERTHERM Noël Pons | Power | 40,437 | 2019 | Irregular | |
| FR1.ES.030 | VELIDIS Chaufferie Vélizy V3 | Power | 39,226 | 2019 | Falling | |
| FR1.ES.031 | VERSEO | Power | 37,512 | 2019 | Irregular | |
| FR1.ES.032 | chaufferie zup de fontenay | Power | 35,777 | 2019 | Falling | |
| FR1.ES.033 | SAFRAN AIRCRAFT ENGINES | Other | 35,666 | 2019 | Irregular | |
| FR1.ES.034 | Chaufferie de Parly 2 | Power | 32,344 | 2019 | Stable | |
| FR1.ES.035 | PEUGEOT CITROËN POISSY SNC | Other | 31,713 | 2019 | Falling | |
| FR1.ES.036 | SEMECO (et IDEX ENERGIES) | Power | 30,916 | 2019 | Stable | |
| FR1.ES.037 | chaufferie zup de sevran | Power | 16,938 | 30,738 | 2019 | Irregular |
| FR1.ES.038 | LESAFFRE FRERES | Food and drink | 27,850 | 2019 | Irregular | |
| FR1.ES.039 | ENGIE Chaufferie de Meudon | Power | 26,585 | 2019 | Growing | |
| FR1.ES.040 | OUVRE FILS Sucrerie et Distillerie | Food and drink | 23,812 | 2019 | Irregular |
References
- Carbon European Trade System Viewer. Available online: https://ember-climate.org/data/carbon-price-viewer/ (accessed on 1 March 2022).
- Oltra, C.; Upham, P.; Riesch, H.; Boso, A.; Brunsting, S.; Dütschke, E.; Lis, A. Public Responses to CO2 Storage Sites: Lessons from Five European Cases. Energy Environ. 2012, 23, 227–248. [Google Scholar] [CrossRef]
- Anderson, C.; Schirmer, J.; Abjorensen, N. Exploring CCS community acceptance and public participation from a hu-man and social capital perspective. Mitig. Adapt. Strateg. Glob. Chang. 2012, 17, 687–706. [Google Scholar] [CrossRef]
- Wallquist, L.; Orange Seigo, S.; Visschers, V.; Siegrist, M. Public acceptance of CCS system elements: A conjoint measurement. Int. J. Greenh. Gas Control. 2012, 6, 77–83. [Google Scholar] [CrossRef]
- Hammond, J.; Shackley, S. Towards a public communication and engagement strategy for carbon dioxide capture and storage projects in Scotland. In Scottish Centre for Carbon Capture Working Paper; British Geological Survey: Edinburgh, UK, 2010. [Google Scholar]
- Dütschke, E.; Wesche, J.; Oltra, C.; Prades, A.; Álvarez, F.C.; Carneiro, J.F.; Gravaud, I.; Vulin, D. Stakeholder Mapping Report WP3-Deliverable 3.1, Report, 2019. EU H2020 STRATEGY CCUS Project 837754. Available online: https://cordis.europa.eu/project/id/837754/results/fr (accessed on 15 March 2022).
- Rothkirch, V.J.; Ejderyan, O. Anticipating the social fit of CCS projects by looking at place factors. Int. J. Greenh. Gas Control 2021, 110, 103399. [Google Scholar] [CrossRef]
- Page, B.; Turan, G.; Zapantis, A.; Burrows, J.; Zhang, T. The Global Status of CCS. In Technical Report; Global CCS Institute: Melbourne, Australia, 2020; Available online: https://www.globalccsinstitute.com/resources/global-status-report/ (accessed on 1 January 2022).
- Scottish Carbon Center (SCCS) Map of European Map of CCS Facilities. Available online: https://www.sccs.org.uk/expertise/global-ccs-map (accessed on 1 March 2022).
- Bentham, M.; Mallows, T.; Lowndes, J.; Green, A. CO2 STORage Evaluation Database (CO2 Stored). The UK’s online storage atlas. Energy Procedia 2014, 63, 5103–5113. [Google Scholar] [CrossRef] [Green Version]
- Halland, E.K.; Johansen, W.T.; Riis, F. Geographical data as shape and rasterfiles in zip-archive, Norwegian North Sea. In CO2 Storage Atlas North Sea. Norwegian Petroleum; Directorate: Stavanger, Norway, 2014; p. 72. [Google Scholar] [CrossRef]
- Kearns, D.; Liu, H.; Consoli, C. Technology Readiness and Costs of CCS; Global CCS Institute: Brussels, Belgium, 2021; Available online: https://www.globalccsinstitute.com/wp-content/uploads/2021/04/CCS-Tech-and-Costs.pdf (accessed on 1 March 2022).
- Cavanagh, A.J.; Wilkinson, M.; Haszeldine, R.S. Bridging the Gap, Storage Resource Assessment Methodologies. In Methodologies for Cluster Development and Best Practices for Data Collection in the Promising Regions; EU H2020 STRATEGY CCUS Project 837754, Report; Brownsort, P.A., Cavanagh, A.J., Wilkinson, M., Haszeldine, R.S., Eds.; 2020; p. 67. Available online: https://cordis.europa.eu/project/id/837754/results/fr (accessed on 15 March 2022).
- Brownsort, P.A. Part 1, Industrial CCUS Clusters and CO2 transport systems: Methodologies for characterisation and definition. In Methodologies for Cluster Development and Best Practices for Data Collection in the Promising Regions; EU H2020 STRATEGY CCUS Project 837754, Report; Brownsort, P.A., Cavanagh, A.J., Wilkinson, M., Haszeldine, R.S., Eds.; 2020; p. 68. Available online: https://cordis.europa.eu/project/id/837754/results/fr (accessed on 15 March 2022).
- Carneiro, J.F.; Mesquita, P. Key Data for Characterising Sources, Transport Options, Storage and Uses in Promising Regions; EU H2020 STRATEGY CCUS Project 837754, Report; 2020; p. 146. Available online: https://cordis.europa.eu/project/id/837754/results/fr (accessed on 15 March 2022).
- France Nord Project. Final Report Confidential. 2013. Available online: https://www.ademe.fr/france-nord (accessed on 1 December 2020).
- Oltra, C.; Preuß, S.; Gérman, S.; Gravaud, I.; Vulin, D. Stakeholders’ Views on CCUS Developments in the Studied Regions; EU H2020 STRATEGY CCUS Project 837754. Report; 2020; p. 96. Available online: https://cordis.europa.eu/project/id/837754/results/fr (accessed on 15 March 2022).
- Coussy, P. Deliverable D5.2: Description of CCUS Business Cases in Eight Southern European Regions; EU H2020 STRATEGY CCUS. Project 837754. Report; 2021; p. 133. Available online: https://cordis.europa.eu/project/id/837754/results/fr (accessed on 15 March 2022)(after European Commission Approval).
- Berenblyum, R. Deliverable D5.1 Elaboration and Implementation of Data Collected of the Business Case for Each Region; EU-H2020 STRATEGY CCUS Project 837754. Deliverable Report; 2021; p. 75, (confidential). [Google Scholar]
- IREP—French Register of Polluting Emissions. 2021. Available online: https://www.georisques.gouv.fr/risques/registre-des-emissions-polluantes (accessed on 1 December 2021).
- Veloso, F.M.L. Maturity Level and Confidence of Storage Capacities Estimates in the Promising Regions; EU H2020 STRATEGY CCUS Project 837754, Deliverable Report; 2021; p. 125. Available online: https://cordis.europa.eu/project/id/837754/results/fr (accessed on 15 March 2022).
- Robelin, C.; Matray, J.M. Geology of Paris Basin reservoirs. In Feasibility of CO2 Storage in Geothermal Reservoirs Example of the Paris Basin—France. GESTCO Report; Bonijoly, D., Ed.; 2003; pp. 31–60. Available online: https://cordis.europa.eu/project/id/ENK6-CT-1999-00010/fr (accessed on 15 March 2022).
- Geocapacity European Project (SES6-518318–6th Framework Programme): D16 WP2 Report Storage Capacity. 2009. Available online: http://www.geology.cz/geocapacity/publications (accessed on 1 December 2020).
- Veloso, F.M.L.; Estublier, A.; Bonte, D.; Mathurin, F.; Frey, J.; Maury, J.; Poumadère, M.; Stephant, S. Target Area of Paris Basin Region—FR: Data Inventory, Seismic Target and GAP Analysis; EU H2020 PilotSTRATEGY project 101022664, Report; 2021; p. 29. Available online: https://cordis.europa.eu/project/id/101022664 (accessed on 15 March 2022)(after Europe Commission approval).
- ANR-SHPCO29. French National Agency—Simulation Haute Performance du Stockage Géologique de CO2. 2012. Available online: https://anr.fr/Colloques/Energies2012/presentations/SHPCO2.pdf (accessed on 1 March 2022).
- French National Low Carbon Strategy. 2021. Available online: https://www.ecologie.gouv.fr/sites/default/files/en_SNBC-2_complete.pdf (accessed on 1 January 2022).
- Carbon Limits. The Role of Carbon Capture and Storage in a Carbon Neutral Europe. Assessment of the Norwegian Full-Scale Carbon Capture and Storage Project’s Benefits. 2020. Available online: https://www.regjeringen.no/contentassets/971e2b1859054d0d87df9593acb660b8/the-role-of-ccs-in-a-carbon-neutral-europe.pdf (accessed on 1 March 2022).
- Directive (EU) 2018/851 on Waste Amending EU Directive 2008/98/EC. Available online: https://eur-lex.europa.eu/legal-content/en/TXT/PDF/?uri=CELEX:32018L0851&from=EN (accessed on 1 January 2022).
- ADEME, Le Traitement des Déchets Ménagers et Assimilés—ITOM. Available online: https://librairie.ademe.fr/dechets-economie-circulaire/4336-le-traitement-des-dechets-menagers-et-assimiles-itom.html (accessed on 1 March 2022).
- Kearns, D.T. Waste-to-Energy with CCS: A pathway to Carbon-Negative Power Generation; Perspective Global CCS Institute. 2019. Available online: https://www.globalccsinstitute.com/wp-content/uploads/2019/10/Waste-to-energy-with-CCS_A-pathway-to-carbon-negative-power-generation_Oct2019-4.pdf (accessed on 1 March 2022).
- Aker Carbon Capture. Aker Carbon Capture Ready to Start CCUS Project at Twence’s Waste-to-Energy Plant in the Netherlands. Press Release. 2021. Available online: https://akercarboncapture.com/?cision_id=9DDF1859C78B5320 (accessed on 1 January 2022).
- KlimaOslo. Sustainable Waste Management for a Carbon Neutral Europe. Press Release. 2021. Available online: https://www.klimaoslo.no/2021/02/26/the-klemetsrud-carbon-capture-project/ (accessed on 1 March 2022).
- French Decree. 2017. Available online: https://www.legifrance.gouv.fr/jorf/id/JORFTEXT000036339396 (accessed on 1 March 2022).


| Tiers | Classification | Suitability Criteria |
|---|---|---|
| Tier 1 | Regional assessment; equivalent to prospective (theoretical) | Generic SEFs (storage efficiency factor). Formation and storage unit estimate. First approximation. Low data burden and global storage efficiency values where boundary conditions are poorly constrained or uncertain. |
| Tier 2 | Discovery assessment; equivalent to low contingent (effective) | Tailored SEFs. Daughter unit estimates. Second approximation. Moderate data burden and lithology-specific regional storage efficiency factors. Distinction between deep saline aquifers, depleted hydrocarbon fields and coal beds. Boundary conditions are established. |
| Tier 3 | Prospect assessment; equivalent to pending/on hold (practical) | Detailed data prospective candidates. Third approximation with a more taxing data burden, including subattributes of the main factors used to estimate capacity and lithology-specific local SEFs. Each candidate prospect requires either existing or targeted data acquisition sufficient to build a simple geomodel for first-pass simulation and well location consideration. |
| Tier 4 | Site assessment; equivalent to justified/approved/on injection (matched), project. | Targeted storage sites. The final approximation prior to operation. This has the highest data burden and requires a detailed geomodel for reservoir simulation studies. Outcomes from the simulations test the accuracy of the storage efficiency factors and provide scenarios for maximizing capacity based on well planning and scheduling. |
| Benefits | Risks |
|---|---|
| Environmental benefits (climate change mitigation, carbon neutrality in the industries in the region and pollution reduction in the region) | Economic viability (increase in cost and decrease in competitiveness for industries) |
| Economic development in the region (new industries, employment, investments and allowing power plants to keep working) | Environmental risks (risk of underground storage) |
| Other (financial benefits for companies, beneficial for company image and promotion of a circular economy) | Social impacts (public opposition) |
| Industries | Sector | Location | Capture Start Year | Annual CO2 Emissions Considered—MtCO2/y | CO2 Capture Rate (%) | Annual CO2 Captured (Mt/y) | Total CO2 Captured (Mt/y) | Part of CO2 Captured from Biomass (Mt/y) |
|---|---|---|---|---|---|---|---|---|
| E#01 (FR1.ES.002) | Chemistry | Grandpuits | 2027 | 0.65 | n/a | 0.36 | 9.7 | 0.0 |
| E#02 (FR1.ES.003) | Energy from waste | Ivry-sur-Seine | 2030 | 0.30 | 0.90 | 0.27 | 7.4 | 3.7 |
| E#03 (FR1.ES.004) | Energy from waste | Issy-les-Moulineaux | 2032 | 0.38 | 0.85 | 0.33 | 8.1 | 4.0 |
| Industries with Capture Medium Term | CAPEX (M EUR) | Fixed OPEX (M EUR) | Variable OPEX (M EUR) | Total Costs (M EUR) | Excess of Energy Consumption for Capture (TJ) |
|---|---|---|---|---|---|
| E#01 (FR1.ES.002) | 4.1 | 2.9 | 1.3 | 8.3 | n/a |
| E#02 (FR1.ES.003) | 76.4 | 360.1 | 0.3 | 436.8 | 24,413.0 |
| E#03 (FR1.ES.004) | 84.9 | 362.2 | 0.4 | 447.5 | 28,255.0 |
| EU ETS Parameters (EUR/tCO2) | Price of Allowances in 2025 | 70.1 |
|---|---|---|
| Price of Allowances in 2045 | 212.4 | |
| Whole regional expense without CCUS (M EUR) | ETS costs without CCUS | 2270.0 |
| Whole region expense with CCUS (M EUR) | ETS costs with CCUS and remaining emissions | 89.8 |
| Costs of CCUS | 1041.2 | |
| TOTAL costs with CCUS | 1131.0 |
| CCS Value Chain (EUR/tCO2 Avoided) | −42 | |
| CAPEX (EUR/tCO2 avoided) | Total per block | −8.3 |
| Cost of Capture | −2.9 | |
| Cost of Transport | −1.1 | |
| Cost of Storage | −4.3 | |
| OPEX (EUR/tCO2 avoided) | OPEX per block | −33.4 |
| Cost of Capture | −24.7 | |
| Cost of Transport | −0.6 | |
| Cost of Storage | −8.1 | |
| Transport cost (EUR/tCO2 transported) | −1.1 | |
| Utilization (income from CO2 sales) (M EUR) | 0 | |
| EU ETS credit savings in the region (M EUR) | 2180 | |
Publisher’s Note: MDPI stays neutral with regard to jurisdictional claims in published maps and institutional affiliations. |
© 2022 by the authors. Licensee MDPI, Basel, Switzerland. This article is an open access article distributed under the terms and conditions of the Creative Commons Attribution (CC BY) license (https://creativecommons.org/licenses/by/4.0/).
Share and Cite
Veloso, F.M.L.; Gravaud, I.; Mathurin, F.A.; Ben Rhouma, S. Planning a Notable CCS Pilot-Scale Project: A Case Study in France, Paris Basin—Ile-de-France. Clean Technol. 2022, 4, 458-476. https://doi.org/10.3390/cleantechnol4020028
Veloso FML, Gravaud I, Mathurin FA, Ben Rhouma S. Planning a Notable CCS Pilot-Scale Project: A Case Study in France, Paris Basin—Ile-de-France. Clean Technologies. 2022; 4(2):458-476. https://doi.org/10.3390/cleantechnol4020028
Chicago/Turabian StyleVeloso, Fernanda M. L., Isaline Gravaud, Frédéric A. Mathurin, and Sabrine Ben Rhouma. 2022. "Planning a Notable CCS Pilot-Scale Project: A Case Study in France, Paris Basin—Ile-de-France" Clean Technologies 4, no. 2: 458-476. https://doi.org/10.3390/cleantechnol4020028