Article

Modeling of Vacuum Temperature Swing Adsorption for Direct Air Capture Using Aspen Adsorption

1
EDF R&D Lab Chatou, 78400 Chatou, France
2
Center of Energy Efficiency of Systems (CES), MINES ParisTech, PSL Research University, 75006 Paris, France
*
Author to whom correspondence should be addressed.
Clean Technol. 2022, 4(2), 258-275; https://doi.org/10.3390/cleantechnol4020015
Submission received: 21 December 2021 / Revised: 20 February 2022 / Accepted: 21 March 2022 / Published: 8 April 2022
(This article belongs to the Special Issue CO2 Capture and Sequestration)

Abstract

:
The paper evaluates the performance of an adsorption-based technology for CO2 capture directly from the air at the industrial scale. The approach is based on detailed mass and energy balance dynamic modeling of the vacuum temperature swing adsorption (VTSA) process in Aspen Adsorption software. The first step of the approach aims to validate the modeling thanks to published experimental data for a lab-scale bed module in terms of mass transfer and energy performance on a packed bed using amine-functionalized material. A parametric study on the main operating conditions, i.e., air velocity, air relative moisture, air temperature, and CO2 capture rate, is undertaken to assess the global performance and energy consumption. A method of up-scaling the lab-scale bed module to industrial module is exposed and mass transfer and energy performances of the industrial module are provided. The scale up from lab scale to the industrial size is conservative in terms of thermal energy consumption while the electrical consumption is very sensitive to the bed design. Further study related to the engineering solutions available to reach high global gas velocity are required. This could be offered by monolith-shape adsorbents.

1. Introduction

Climate change has become a critical issue during the last decades and is attributed to the increased levels of greenhouse gases (GHG) in the atmosphere. Today, carbon dioxide (CO2) is present in the atmosphere at a concentration over 415 ppmv, i.e., about 0.04 volume percent, equivalent to an atmospheric reservoir of about 3200 GtCO2 [1]. To address the increase in global CO2 emissions to the atmosphere, GHG emission reduction targets and a wide range of greenhouse gas mitigation technologies are being considered, such as CO2 capture from flue gases at power plants and other industrial sites followed by CO2 transport and long-term geological storage [2,3]. The direct capture of CO2 in the ambient air (DAC: Direct Air Capture) through a contactor is an alternative pathway among the negative emissions technologies to capture CO2 directly from the atmosphere and should be deployed to achieve emission trajectories in line with the carbon neutrality objective and climate change mitigation [4,5]. Indeed, CO2 removal is expected to play a key role in the transition to a net-zero system, in particular, to offset the emissions of industrial sectors that are difficult to decarbonize. In this regard, CO2 removal technologies and changes in land-use sinks account for 450–1000 GtCO2 of negative emissions to keep the global warming below 1.5 °C by 2100 [6]. The CO2 can be permanently stored in deep geological formations, resulting in negative emissions, or used in the production of building materials, chemical intermediates, or synthetic fuels to replace conventional fossil fuels. The DAC technique seems attractive given its potential to decarbonize the atmosphere: it can address distributed emissions such as aviation and transport and can be installed close to suitable storage sites and to low- or zero-carbon energy sources which are needed to run the plant, with little degradation performance in the case of low-pollutant air. However, it still presents multiple technical and economic uncertainties and barriers [7]. Furthermore, the relatively high dilution of CO2 in the atmosphere leads to higher energy needs (approximately three times more energy) and costs for DAC relative to other conventional CO2 capture technologies and applications. Thus, DAC is energetically and economically challenging to be deployed at large scale.
DAC technologies have attracted new interest for several years [8,9] but the first developments of CO2 capture in ambient air date back to the 1930s, with first applications in gas separation upstream of cryogenic air separation (N2/O2/Ar) in order to avoid CO2 solidification, then for the control of air composition in confined systems (submarine, spacecraft) to keep the air breathable with no possibility of renewal [10]. There are currently a number of small pilot and demonstration DAC plants operating worldwide [11], mainly in Europe, the United States, and Canada, capturing around 10,000 tCO2/year, with large-scale facilities (1 MtCO2/year) in advanced development in the United Kingdom and in the United States, e.g., for use in enhanced oil recovery. After production is scaled up, the costs are expected to become competitive and fall to USD 200 per ton of CO2 [12]. However, the DAC sector is still in an early stage of commercial development, and research and development are still needed to overcome some challenges, e.g., to redesign and optimize the materials and processes to achieve low-cost and low-carbon performances [13]. Several approaches to DAC are technically feasible but the development efforts are mainly focused on two reversible techniques for CO2 capture in air: chemical absorption [14], which relies on the property of a liquid basic solution to solubilize CO2, such as sodium and potassium hydroxide, and adsorption, where CO2 is fixed on the surface of a porous solid sorbent [15,16]. Both techniques require roughly 80% thermal energy (e.g., sorbent regeneration) and 20% electricity (e.g., contactor fans, vacuum pumps) for operation [11], and have to be fueled by low-carbon energy sources [17], in particular close to industrial sites where low-carbon heat can be recovered, to reduce lifecycle emissions [18,19].
The DAC technique based on low-temperature adsorption is developed by several companies among which are Climeworks in Switzerland and Global Thermostat in the United States. Such technologies have limited land and water footprints [7]. However, the co-adsorption of H2O in wet air treatment increases the thermal energy consumption for regeneration and the sorbent regeneration requires large amounts of low temperature heat [15]. Compared to absorption that works continuously with solvent looping, the adsorption process works generally in batches with several beds filled in parallel. Processes have been developed to allow efficient contact of air with adsorbent and efficient regeneration of the material. The adsorption phenomena are schematically divided into two large families according to the nature of the bonds between the adsorbate and the solid: physisorption (weak interaction), e.g., on activated carbons, activated aluminas, silica gels or zeolites, and chemisorption (strong interaction), e.g., on chemical adsorbents based on amines immobilized on a solid support or alkali carbonates [20,21]. An optimal adsorbent would combine the following qualities: high adsorption capacity, high selectivity, easily regenerable, fast kinetics, high resistance (mechanical, chemical, and thermal) and lifetime, high availability, low pressure drop, low toxicity, and low cost. In practice, a major limitation of physical adsorbents is their low adsorption capacity at low CO2 partial pressure, which leads to a preferable use of chemical adsorbents for CO2 capture from air. On the other hand, while chemical adsorbents have a higher adsorption capacity compared to physical adsorbents, the energy consumption associated with their regeneration is higher for breaking the chemical bonds between the adsorbate and the adsorbent. The use of an amine bonded to a porous solid support, e.g., such as honeycomb monoliths, pellets, or other granular shapes, is therefore suitable [15,16,22].
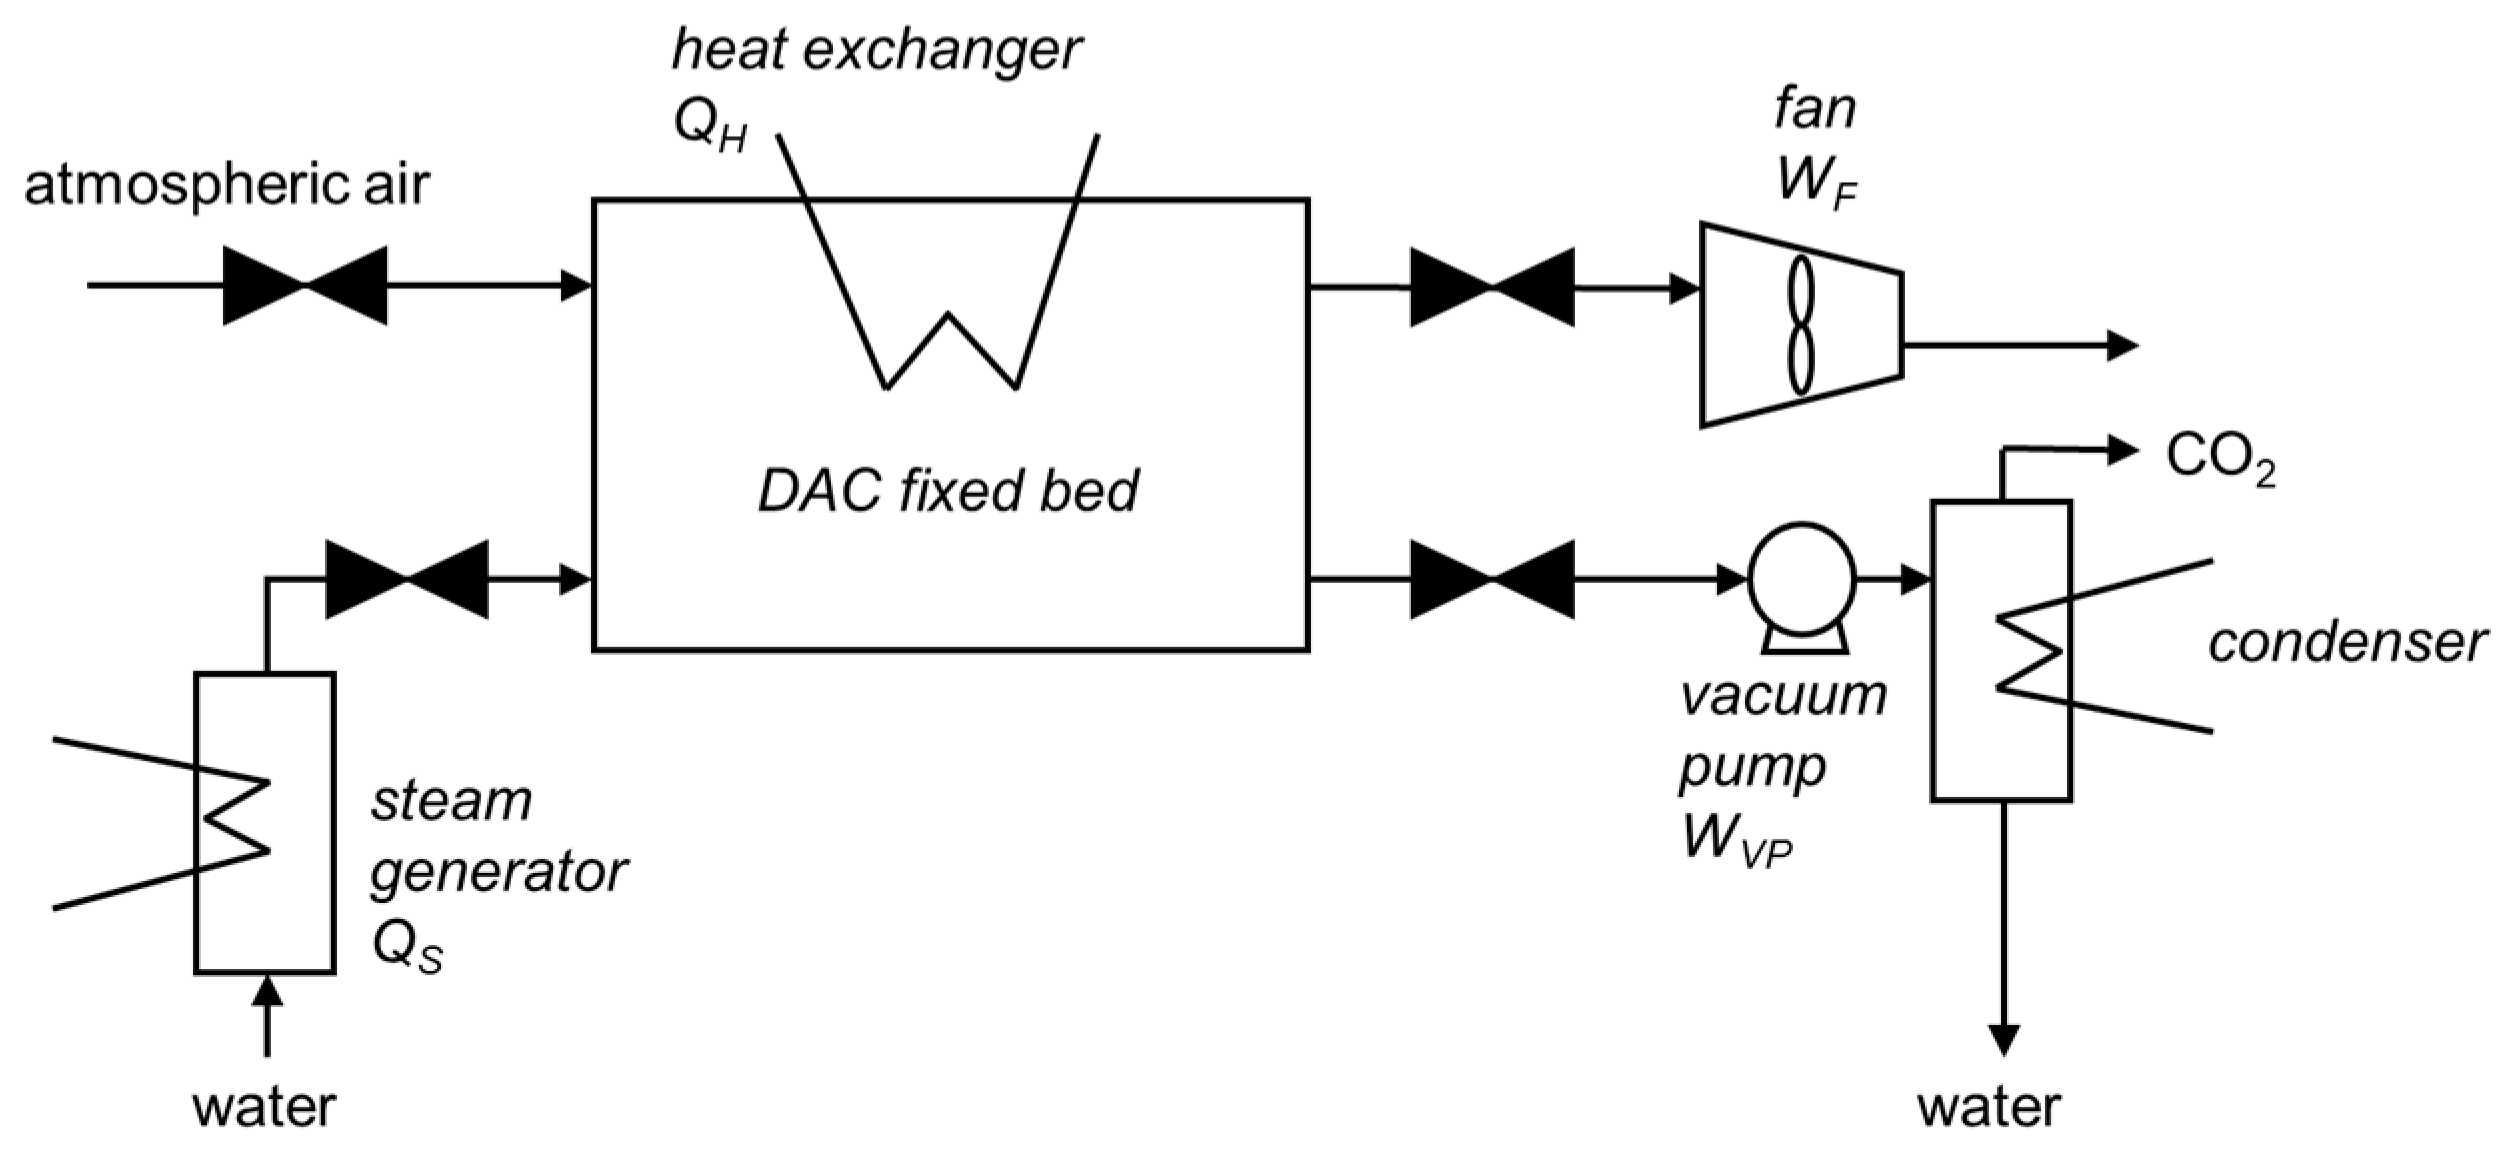
In cyclic VTSA (vacuum temperature swing adsorption), the air ventilated from the atmosphere may flow through a fixed bed of solid adsorbent, where the CO2 (and H2O) is adsorbed on a porous material at ambient temperature and pressure. The flow to be treated is depleted as it progresses through the solid bed, which gradually becomes saturated. After operation and when the adsorbent approaches saturation, the adsorbent is regenerated in situ by heating (TSA around 80–130 °C) and rough vacuum (VSA below 300 mbarabs). The CO2 and H2O are then released in the gas phase, which allows, after gas drying, to recover a high-purity CO2 stream that can be compressed for transport and storage. The adsorbent is finally cooled to room temperature for reuse in a new cycle (adsorption, purge, regeneration, repressurization). The VTSA proves to be a promising process from analysis of productivity and energy consumption [23].
Despite their apparent simplicity, the design and development of adsorption processes is time consuming and requires cost reductions to be competitive at full scale. Process modularization is a strong feature in order to reduce investment costs through series and learning effects [24,25]. Compared to an all-in-one architecture, the modular design allows to realize and test a large number of modules in a first development phase, before completely setting the optimal module architecture which can then be standardized and produced in large series in order to lower the costs by learning rate. Modularity allows scale-up by increasing the number of components operating in parallel.
There have been a few studies on the modeling of a DAC fixed bed process [16,26,27,28]. Simulations are most commonly performed at the laboratory scale, i.e., with sorbent material masses in the range of grams to kilograms using amine-functionalized nano-fibrillated cellulose [16], metal organic framework [26,28], or polystyrene [27]. In this paper, we propose to model in Aspen Adsorption software a DAC modular process that employs VTSA on a packed bed using amine-functionalized material. The one-dimensional model accounts for adsorption isotherms, mass, energy, and momentum balances to simulate temperature and concentration dynamics along the bed. The simulations are performed for several adsorption–desorption cycles at two scales: first at the laboratory scale (2 kgCO2/year), then at the larger scale of a pilot module (50 tCO2/year). A parametric study on the main operating conditions, i.e., air velocity (superficial gas velocity lower to minimum fluidization velocity), air relative moisture (0–80%), air temperature (5–35 °C), and CO2 capture rate (5–98%), is undertaken to assess the global performances and energy consumption. The results obtained in this work can guide future research on the design of a DAC modular process.

2. Process and Model Description

Aspen Adsorption software (V12) was used for modeling as it offers a framework of numerical and physical methods facilitating the dynamic mass and energy balance evaluation of the process’ adsorption/desorption full cycle. This software is a comprehensive flowsheet simulator for the design, simulation, and analysis of dynamic adsorption processes.

2.1. Process Overview

The simplified scheme of the DAC adsorption process is given in Figure 1: air is drawn into the fixed adsorbent bed using fans. The CO2 of the air is physically and chemically bound to the solid sorbent material. CO2-free air is released back into the atmosphere. Once the sorbent is saturated with CO2, it is heated using indirect internal heating and/or steam stripping. The internal heating and steam stripping could use free-carbon electricity and/or low-grade heat source thanks to vacuum conditions ensured by vacuum pumps during the stripping step. The CO2 is then released from the sorbent and collected as concentrated gas thanks to a condenser. This continuous cycle is then ready to start again. The sorbent is reusable and lasts for several thousand cycles (approx. 2–3 years).
The dynamic bed model in Aspen Adsorption is based on the fundamental equations of an adsorbent bed composed of multiple layers: isotherms (thermodynamics), mass and energy balances of gas and solid, including mass and heat transfers, and pressure drop. The following equations are used to model continuous cycles of CO2 and H2O adsorption/desorption through a packed bed of amine-functionalized sorbent material.

2.2. Adsorption Isotherms of CO2 and H2O

An adsorption isotherm is the relation between the amount of adsorbate (loading) and the gas phase composition (partial pressure) at thermodynamic equilibrium for a given temperature. The adsorption capacity of the solid increases with CO2 partial pressure and decreases with temperature. A simple theoretical model for single component adsorption is the Langmuir model well-suited for chemisorption. This model uses the assumptions that all adsorption sites on the homogeneous solid surface are energetically equivalent, and that the adsorbate forms a monolayer without interactions between the adsorbate particles. The Toth model [29] used for pure CO2 adsorption on amine-functionalized nano-fibrillated cellulose material [30] differs from the Langmuir isotherm by considering the heterogeneity of the adsorbent surface characterized by the Toth parameter t ( T ) :
q C O 2 ( T , p C O 2 ) = n S ( T ) · b ( T ) · p C O 2 ( 1 + ( b ( T ) · p C O 2 ) t ( T ) ) 1 t ( T )
where b , t , and n s are temperature-dependent parameters:
b ( T ) = b 0 · e Δ h a d s , C O 2 , 0 R . T 0 · ( T 0 T 1 )
t ( T ) = t 0 + α · ( 1 T 0 T )
n s ( T ) = n s , 0 · e χ · ( T 0 T 1 )
The H2O adsorption isotherm on the same material [30] is modeled by the Guggenheim–Anderson–de-Boer (GAB) isotherm [31] defined by the following equation.
q H 2 O ( T , p H 2 O ) = C m ( T ) . C G ( T ) · K a d s ( T ) · p H 2 O p v a p ( T ) ( 1 K a d s ( T ) · p H 2 O p v a p ( T ) ) · ( 1 + ( C G ( T ) 1 ) · K a d s ( T ) · p H 2 O p v a p ( T ) )
where p H 2 O p v a p ( T ) = ϕ is the relative humidity.
The following coefficient provides the water content of a monolayer at the surface of the adsorbent:
C m ( T ) = C m , 0 · e β T
The following coefficients are following Arrhenius-type and temperature-dependent equations:
C G ( T ) = C G , 0 · e Δ H C R T
K a d s ( T ) = K a d s , 0 · e Δ H K R T
In addition, the binary CO2 and H2O adsorption isotherms consider the competitive adsorption of the two substances. The CO2 has very little effect on the H2O adsorption capacity, so the H2O adsorption isotherm remains largely unaffected by the presence of CO2 [32]. On the contrary, the CO2 adsorption capacity is generally enhanced in the presence of H2O [22]. An empirical function applicable in a small pressure range is used at first approximation to describe the CO2 adsorption under humid conditions by multiplying the Toth isotherm by an enhancing parameter f R H ( p C O 2 , ϕ ) which is function of the relative humidity and the CO2 partial pressure:
q C O 2 b i n a r y ( T , p C O 2 , ϕ ) = f R H ( p C O 2 , ϕ ) · q C O 2 ( T , p C O 2 )
f R H ( p C O 2 , ϕ ) = 1 + ϕ · ( 0.6 p C O 2 59   m b a r · 0.47 )
where ϕ is the relative humidity of air.
The coefficients obtained on the same material from [30,32] are summarized in Table 1.

2.3. Main Assumptions

The bed model makes the main following assumptions:
  • A one-dimensional model using axial dispersion is considered. The effect of axial dispersion along the gas flow direction is studied according to the axial Péclet dimensionless number. The Péclet number is the product of the Reynolds number and the Schmidt number and is used to compare the mass transport by dispersion and diffusion:
    P e z = ν g H b E z
    where ν g is the gas velocity in m/s, H b the height of the bed in m, and E z the dispersion coefficient in m2/s.
    As a gas flows through a packed bed, axial dispersion occurs by molecular diffusion, turbulent mixing arising from the splitting and recombining of flows around the solid particles, and wall effects due to non-uniformity of packing. In general, wall effects can be controlled by a large ratio of bed-to-particle diameters. The molecular diffusion and turbulent mixing are additive and can be lumped into an effective dispersion coefficient [33]. Mass transport by convection takes control, i.e., the bed operates near ideal plug-flow conditions, when the mass Péclet number is significantly larger than 1. Therefore, the dispersion term is included in the material balance described later. Moreover, to limit the radial dispersion, three conditions are required: the ratio of the bed diameter to the particle diameter must be high (typically larger than 15 [34]), the gas must be uniformly mixed before entering the bed, and the pressure drop must not be too low to allow the gas to be equidistributed. A high value of the radial Péclet number can be considered according to the radial dispersion coefficient [35]:
    E r = ν g r p 4
    Thus, radial dispersion is negligible, and the bed model is one-dimensional.
  • CO2 and H2O are the only adsorbed substances. Adsorption of the other substances of air, such as N2, O2, and Ar, are neglected given the dominant role of chemisorption. In addition, there are no parasitic reactions between the gas and the adsorbent.
  • The substances in ideal gas phase flow first from the bulk gas to the macropore, and then from the macropores to the solid surface via the micropores with uniform pore structure (isotropic material). The microporous diffusion term is assumed to be negligible in comparison to the external film resistance term and the macropore diffusion term.
  • The bed is non-isothermal and is considered adiabatic with uniform heating from the walls. The clogging resistance is neglected.

2.4. Mass Balance

The overall mass balance for a multi-component gas phase considers the convection, axial dispersion, and mass transfer from the gas to the solid phase. Each substance in the gas phase is governed by the equation below:
ε i E z k 2 c k z 2 + ( ν g c k ) z + ε B c k t + J k = 0
where ε i is the interparticle voidage, ε B the total bed voidage, and E z k the dispersion coefficient given by the correlation below [33]:
E z k = 0.73   D m k +   ν g r p ε i   ( 1 + 9.49   ε i   D m k 2 ν g r p )
where D m k is the molecular diffusivity in m2/s (estimated by Aspen properties database) and r p the particle radius in m.
The rate of flux to the solid surface per unit volume is:
J k = ρ s w k t
where ρ s is the particle bulk density in kg/m3 (i.e., the mass of solid per unit volume of column) and the rate of adsorption is expressed as:
w k t = k k ( w * k w k ) = k k   K K k   ( c * k c k )
and where Henry’s coefficient K K k is derived from the isotherms:
K K k = w * k c k = R T w * k P k
To get to the adsorption surface, the substances must diffuse from bulk gas phase into the pores of solid particles, then diffuse from pore phase into the surface of solid particles. The overall mass transfer coefficient between the gas and solid phases is given as a lumped term comprising the external film resistance term and the macropore diffusion term:
1 k k = r p 3   k f k +   r p 2 15   ε p   K p k
k f k is the film resistance coefficient defined below:
k f k = S h k   D m k 2 r p
The Sherwood number S h k is obtained by [36] for a Reynolds number Re in the range 3–10,000:
S h k = 2.0 + 1.1   S c k 1 / 3 R e 0.6
where the Schmidt number and the Reynolds number are:
S c k = μ D m k ρ g
R e = v g   2 r p ρ g μ
where μ is the dynamic gas viscosity in Pa·s.
The macropore diffusion coefficient K p k is obtained from:
1 K p k = τ ( 1 D k k + 1 D m k )
where τ is the particle tortuosity factor and the Knudsen coefficient D k k is obtained from the following correlation:
D k k = 97 r p o r e   ( T M k ) 0.5
where r p o r e is the macropore radius in m and M k is the molecular weight of the substance in kg/mol.

2.5. Energy Balance

The energy balance is separated into two expressions, the gas energy balance and the solid energy balance.

2.5.1. Gas-Phase Energy Balance

The energy balance of the gas phase in the bed includes the following terms, i.e., the gas conductivity, the convection, and the transfers with the adsorbent bed and with the internal wall:
ε i   k g z 2   T g z 2 + C v g ν g ρ g T g z + ε B C v g ρ g   T g t + P ν g z + H T C a p   ( T g T s ) + a H x Q H x = 0
The heat transfer between the gas and solid is modeled with the film resistance model according to:
H T C = j C p g ν g ρ g P r 2 3
where the Prandtl number and the j-factor are:
P r = μ C v g k g z
j = 1.66   R e 0.51   if   R e < 190
j = 0.983   R e 0.41   otherwise
The specific particle surface per unit volume bed is:
a p = ( 1 ε i )   3 r p
A jacket heat exchanger is used to heat the bed and for cooling according to:
Q H x = U H x   ( T g T H x )
where U H x is the heat transfer coefficient of the heat exchanger in W/(m2·K) and T H x the heating source temperature in K at the axial position of the bed.

2.5.2. Solid Energy Balance

The energy balance on the adsorbent considers the heat transfer by convection between the gas flow and the adsorbent but also the heat released during the adsorption:
k s z 2   T s z 2 + ρ s C p s T s t + k H k + ρ s k ( Δ H k   w k t ) H T C a p ( T g T s ) = 0
The heat of the adsorbed phase for each component is given by the following equation:
H k = ρ s C p a k   w k   T s t
where C p a k is the heat capacity of the adsorbed phase component in J/(kg·K).

2.6. Energy Requirements

The main electric utilities through the proposed VTSA model are the electrically driven fan used to compensate for the pressure drop inside the bed (WF) and the vacuum pump (WVP).
The Ergun equation expresses the pressure drop (in Pa/m) in a fixed bed by the Karman–Kozeny equation for laminar flow and the Burke–Plummer equation for turbulent flow:
P z = ( 150   ( 1 ε i ) 2 ( 2 r p ψ ) 2   ε i 3   μ   ν g + 1.75   M ρ g ( 1 ε i ) 2 r p ψ ε i 3   ν g 2 ) .
where ψ is the particle shape factor and M refers to the molecular weight of the gas in kg/mol.
The fan work (in GJ/tCO2) considering the fan isentropic efficiency η f (typically 0.7) and the overall pressure drop from the Ergun equation is assessed using Aspen Plus:
W F = P F t a d s m C O 2 , a d s
where P F is the net work required by the fan in GW, t a d s the adsorption duration in s, and m C O 2 , a d s the mass of adsorbed CO2 in t.
The work of the vacuum pump (in GJ/tCO2) considering the pump efficiency (typically 0.7) is also assessed using Aspen Plus:
W V P = P V P t V m C O 2 , a d s
where P V P is the net work required by the vacuum pump in GW and t V the vacuum duration in s.
The thermal energy requirement (QH) is provided by indirect heating through a jacket heat exchanger or by direct heating using steam during the purge step. The heating need (in GJ/tCO2) is assessed using Aspen Adsorption from the heat exchanger energy:
Q H = Q H X m C O 2 , a d s
where Q H X is the heat exchanger energy (in GJ) during heating.
Similarly, the heat (QS) provided by steam (in GJ/tCO2) is given from:
Q S = t S m ˙ H 2 O C p H 2 O Δ T d t 10 6 n C O 2 , a d s M C O 2 .
where m ˙ H 2 O is the steam mass flow rate in kg/s, C p H 2 O the steam heat capacity in J/(kg·K), Δ T the temperature difference from the inlet and outlet in K, n C O 2 , a d s the quantity of adsorbed CO2 in mol, M C O 2 the molecular weight of CO2 in kg/mol, and t S the steam step duration in s.

2.7. Thermodynamic Comparison

The energy requirements can be compared to the thermodynamic minimum separation work. For a substance to be separated from an ideal mixture, e.g., CO2 in a mixture of CO2 and N2, the minimum separation work can be calculated as a function of the CO2 capture rate between 0 and 100%, as follows according to the thermodynamic principles:
W m i n S = R T 3600 M ( l n ( x ) + ( 1 x ) x l n ( 1 x y ) + ( 1 y ) l n ( 1 x y x ( 1 y ) ) )
where W m i n S is the minimum separation work (kWh/tCO2), R the perfect gas constant (8.314 J/(mol·K)), T the mixture temperature (K), x the molar fraction of CO2 in the mixture, M C O 2 is the molecular weight of CO2 in kg/mol, and y the CO2 capture rate.
The minimum separation work at 415 ppmv and 293.15 K varies between 6 kWh/tCO2 for a 5% CO2 capture rate, 119 kWh/tCO2 for a 90% CO2 capture rate, and 132 kWh/tCO2 for a 98% CO2 capture rate.

2.8. Parameters and Cycle Description

The typical air conditions considered in this study are the following: pressure of 1.013 bar, temperature of 283.15 K, relative humidity of 40%, molar composition with N2 (78.70%), O2 (20.50%), H2O (0.76%), and CO2 (0.04%). The model parameters are given in Table 2.
The cycle is composed of eight different steps (Table 3) described below:
  • Adsorption. Air from the atmosphere is sent into the bed where the CO2 and H2O are adsorbed. The step must end before the bed reaches saturation and cannot adsorb CO2 anymore. Therefore, the overall recovery of CO2 is maximized. Adsorption is stopped when the concentration of CO2 at the bed outlet reaches 10% of the inlet concentration.
  • Evacuation. The inlet air flow is stopped, and the vacuum pump is turned on until a pressure of 300 mbarabs is reached at the end of the bed. The vacuum pump continues to work to maintain this low pressure during the regeneration.
  • Pre-heating. To eliminate N2 and O2 residues in the bed and meet the purity target, the sorbent is heated up to 60 °C via indirect heating, to start the desorption of H2O and evacuate the gas in the atmosphere.
  • Pre-purge. The purge is finished by a short steam step that completely removes the remaining N2 and O2 from the bed. The duration of the step is designed so that the purity of the desorbed CO2 is higher than 95% and must be short to avoid desorbing too much CO2 in the atmosphere.
  • VTSA. To recover CO2, the bed is heated indirectly to 110 °C to desorb H2O and CO2. The outlet gas composed of CO2 and H2O is recovered.
  • Steam-stripping under vacuum. The desorption is finished by injection of overheated steam in direct contact with the adsorbent to desorb and recover the maximum amount of CO2. The duration of steps 5 and 6 have a strong impact on the cyclic capacity and on the energy penalty.
  • Cooling. To avoid the bed poisoning, e.g., by urea formation in the presence of O2 at high temperature because of amine oxidation, the bed is cooled at least below 60 °C via the heat exchanger before sending the air in the adsorber for a new adsorption cycle.
  • Repressurization. Air is progressively injected to reach atmospheric pressure to be ready for adsorption.
The detailed simulations are performed with the commercial software Aspen Adsorption (V12) by applying the “single bed approach” and a cycle organizer (Figure 2) to control the duration of the different sequential steps, the manipulated variables, and the setting-up of the boundary conditions (flowrate, composition, temperature, pressure). The evolution of concentrations, pressure, and velocity profiles is followed in real time throughout the simulation of successive entire cycle steps.

3. Results

The modeling approach was at first validated within experimental data of [32] performed on a lab-scale pilot, around 2.8 kgCO2/year. A parametric study was then performed on the lab-scale pilot before the latter was scaled-up to the module of around 50 tCO2/year. The module’s bed was equipped with a jacket indirect heat exchanger. Low-grade overheated steam was provided co-currently via a separate inlet. Two separate outlets were used, one rejected the bed gas into the atmosphere during adsorption and the purge steps, while the second one transported the desorbed gas during the desorption step. Both outlet streams were evacuated by dedicated vacuum pumps.
The CO2 was recovered from the gas exiting the bed during the desorption steps and then experiences a condensation and a phase separation step to fully eliminate the steam. The remaining gas was CO2 with a purity superior to 95%.

3.1. Lab-Scale Configuration

The lab-scale characteristics are given in 
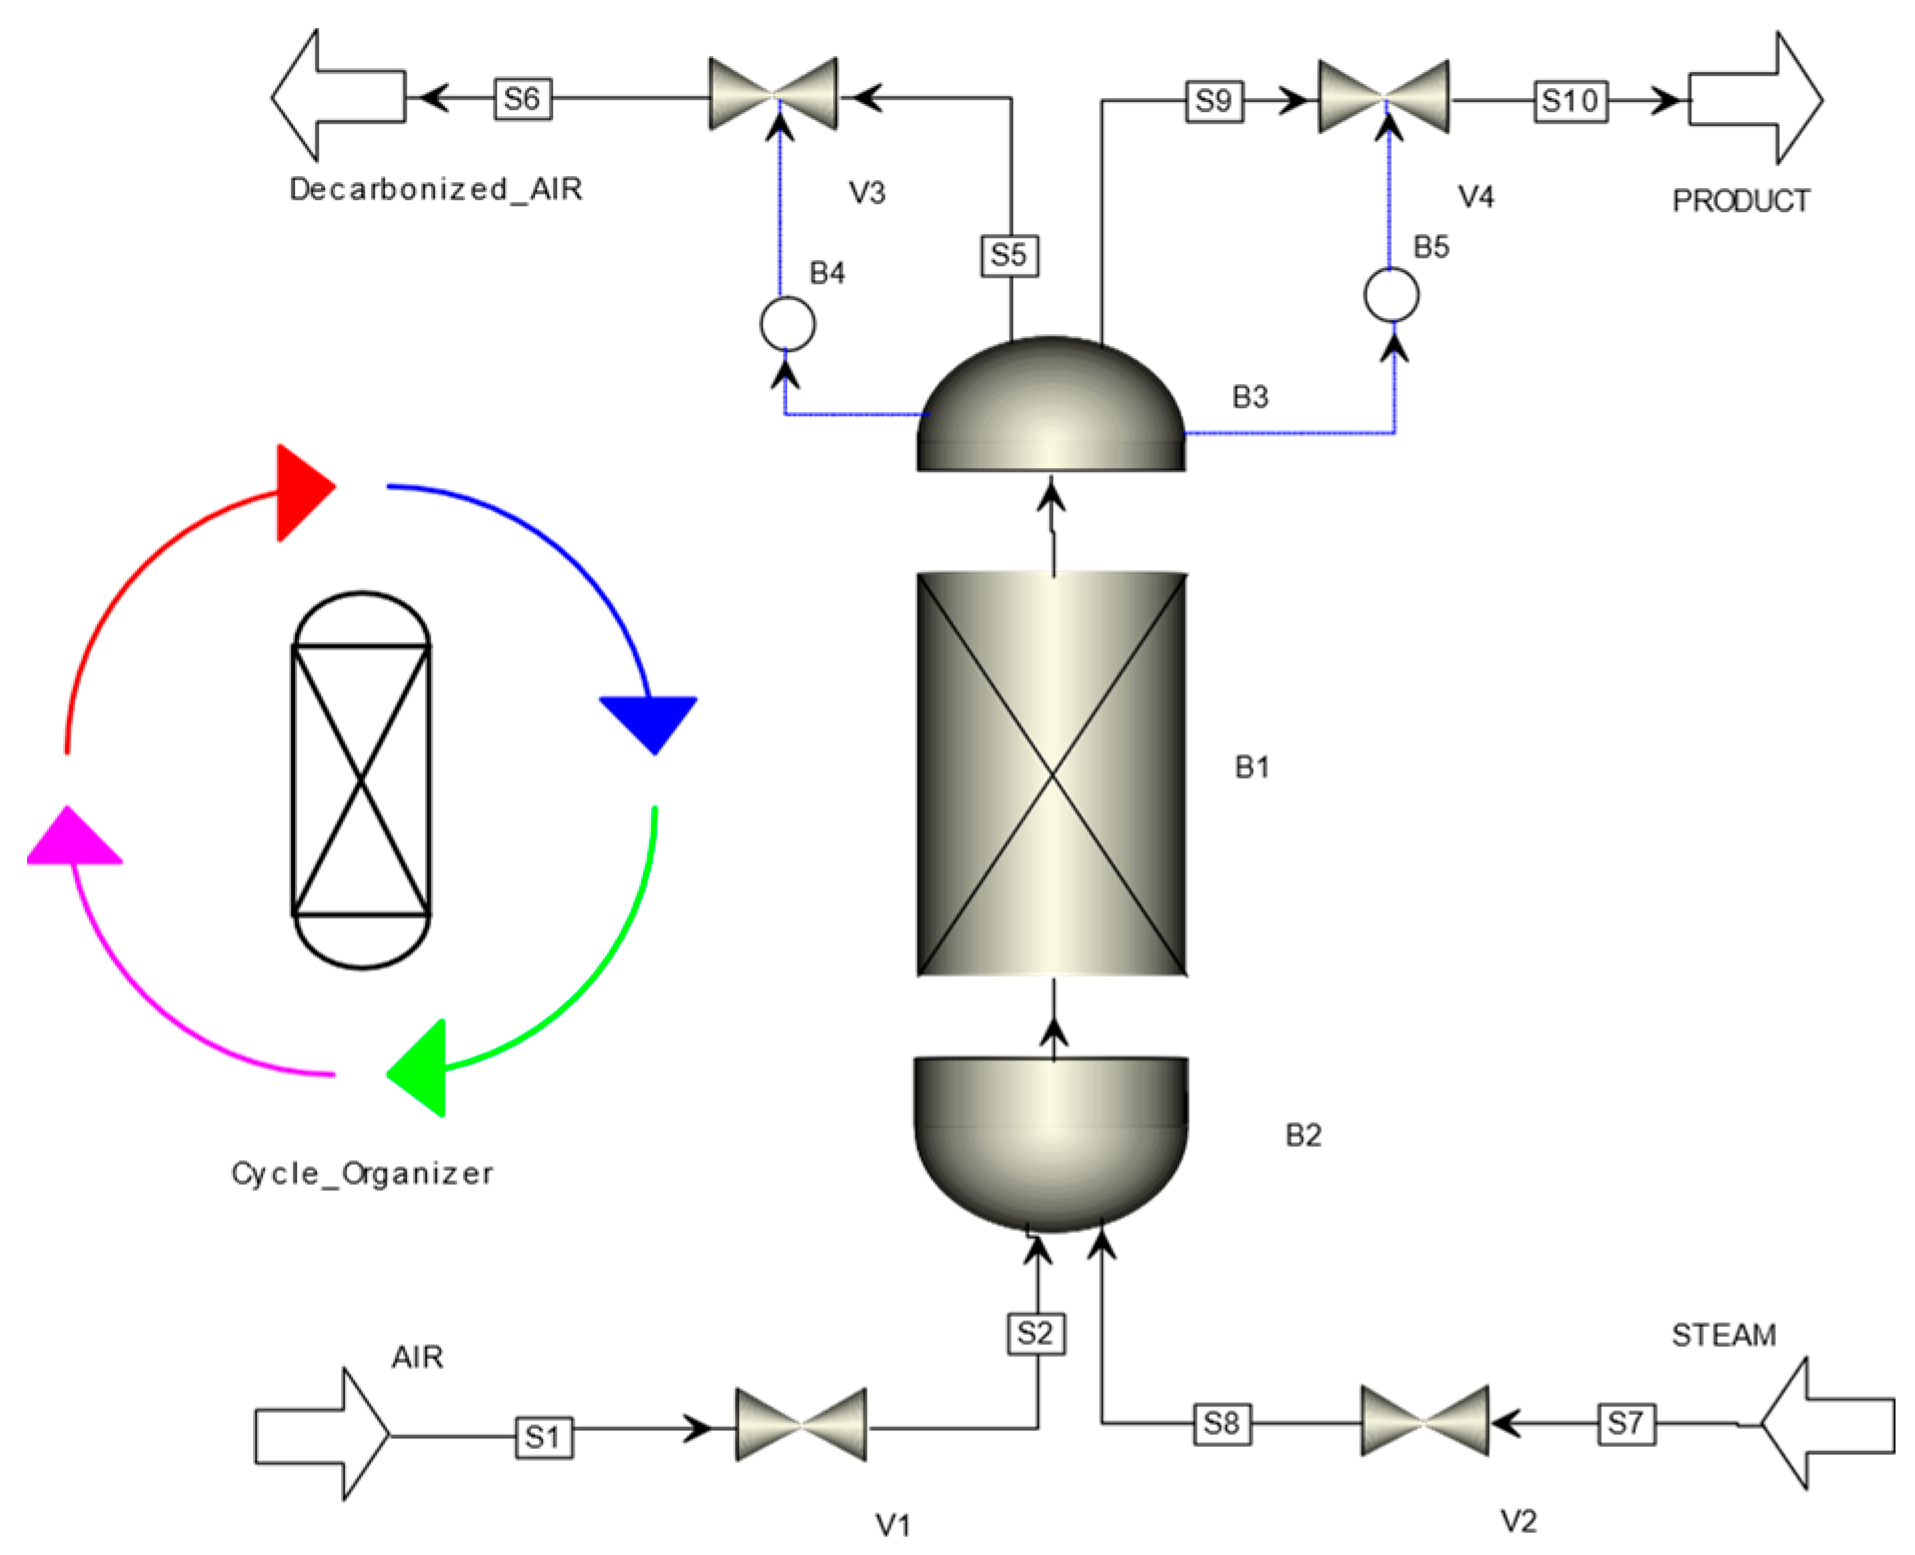
Table 4. Depending on initialization values provided to the cycle organizer block (Figure 2), steady state cycles would not be reached within the first cycle but only starting from the second and successive following cycles. 
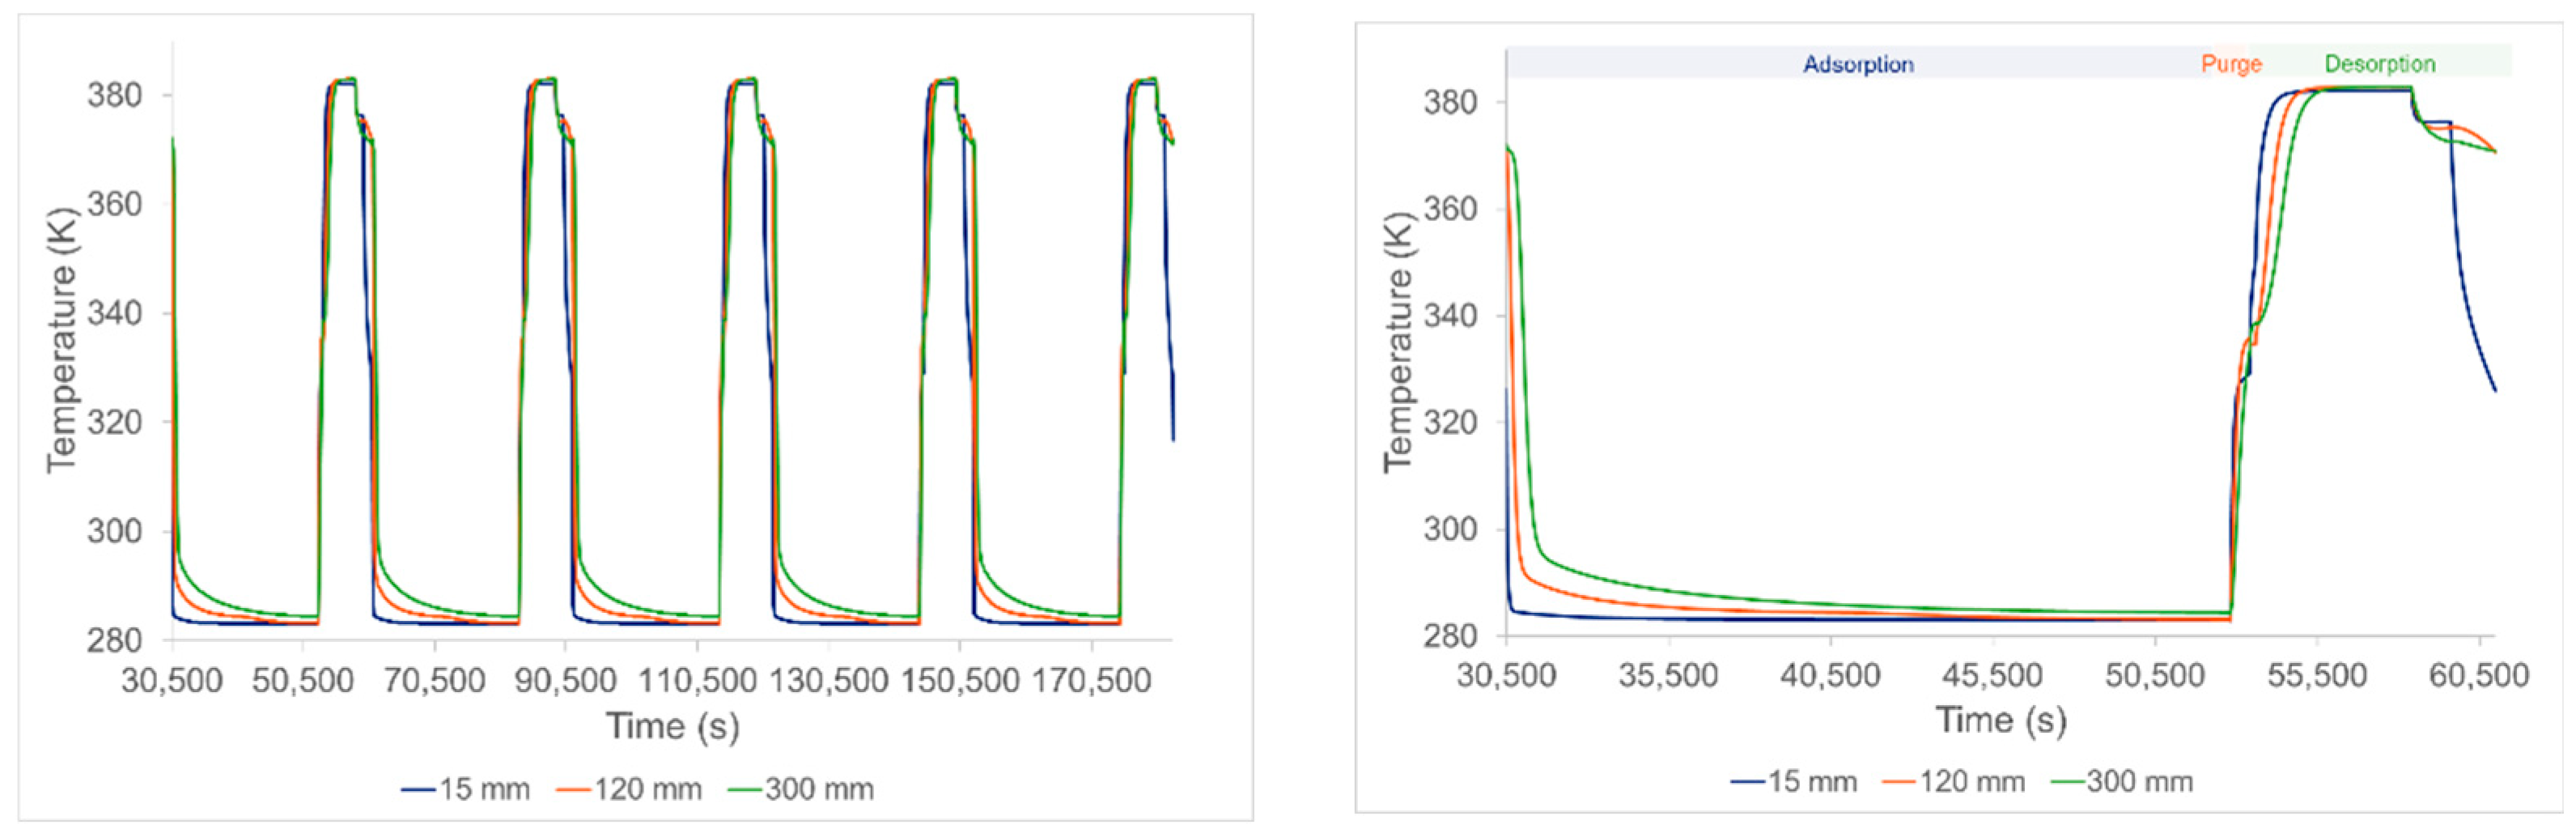
Figure 3 shows established regime of the temperature during cycles.
The largest spatial temperature gradient was about 30 K (Figure 3) meaning that the bed was globally homogeneous in temperature. A non-obvious behavior occurred at the end of the desorption step when the temperature decreased before the cooling step. This was linked to the endothermic nature of desorption during the steam-stripping step. During this latter step, a higher amount of CO2 was desorbed in a relatively short time, therefore the temperature of the bed slightly decreased.
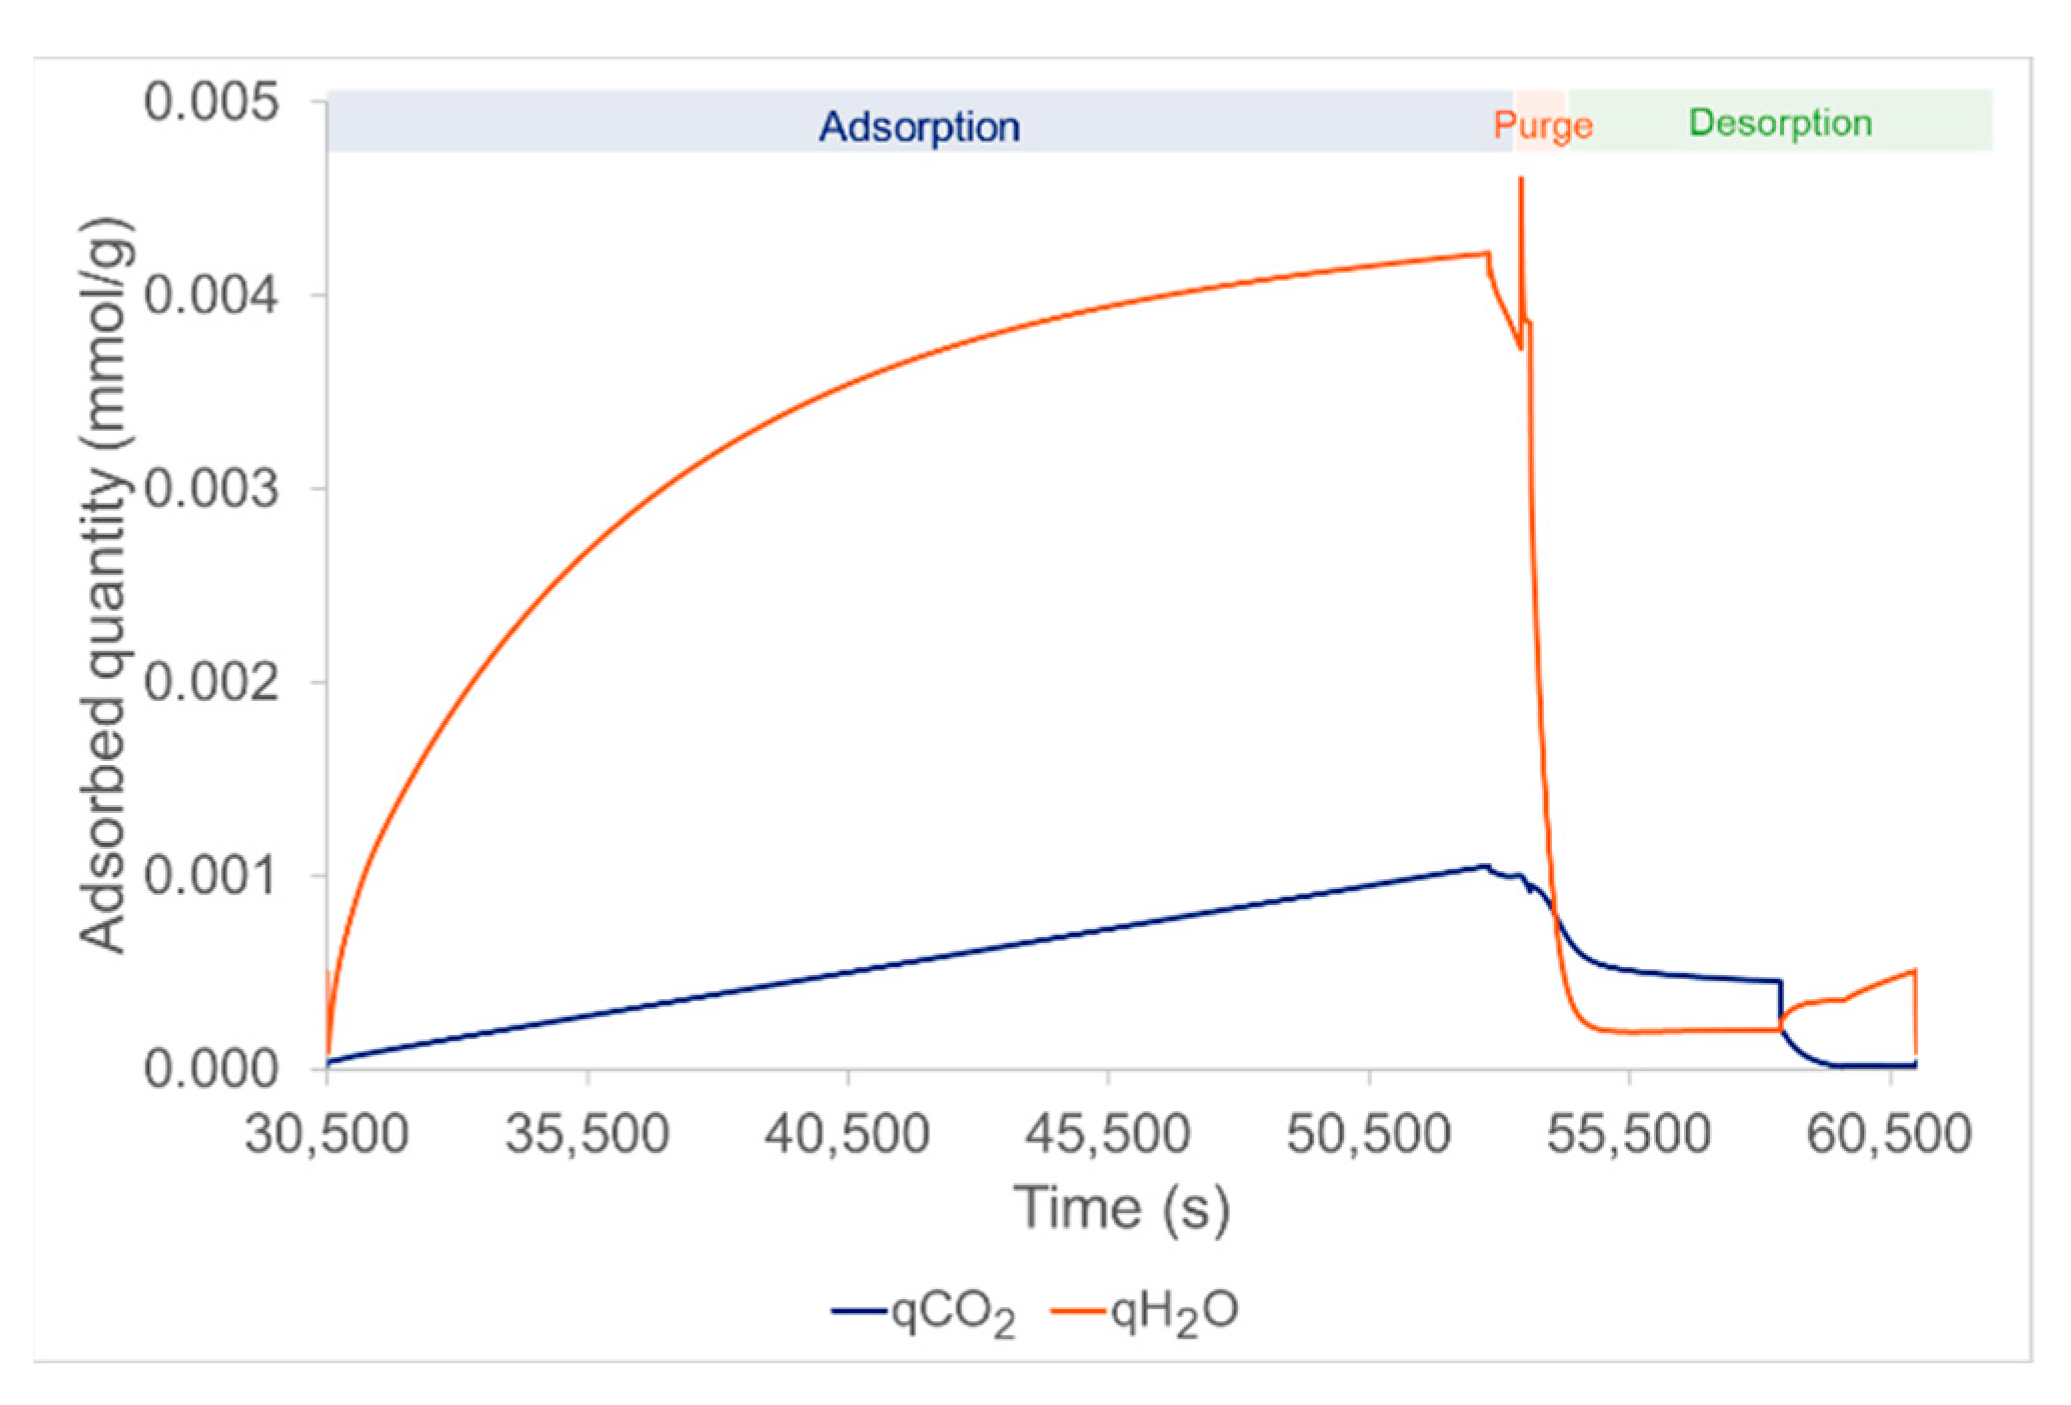
Figure 4 represents the adsorbed quantities of CO2 and H2O over time. The evolution during the adsorption phase was relatively different for the H2O and CO2. In fact, the adsorbed quantity of H2O was more than four times larger than for CO2. This is linked to the partial pressures of the substances and to the fact that the two substances have different isotherms with different mathematical expressions derived from the experimental measurement on the lab-scale pilot test facility. Moreover, H2O adsorption seems to saturate over adsorption phase time while CO2 adsorption continues to increase linearly. The H2O adsorption peak, around t = 52,500 s (Figure 4), is linked to the pre-purge step using steam because there is a steep increase in the vapor partial pressure resulting in a quick increase in the adsorbed quantities. Finally, during the vapor stripping step, the vapor partial pressure increases compared to the previous step. Therefore, there is adsorption of H2O and desorption of CO2 because of high temperature and low CO2 partial pressure.
The adsorption uptake was calculated via the results of the CO2 loading variable of adsorbent material over time during the adsorption step. The cycle’s CO2 cyclic capacity was calculated by time integration of the CO2 quantity at the outlet of the bed during desorption and was equal to around 0.83 mmol/g, i.e., 0.037 g/g. The capture rate, i.e., the quantity of CO2 recovered at the end of a whole cycle divided by the quantity of CO2 treated during the adsorption step, was around 77% at a purity larger than 99%.
The specific energy requirements are summarized in Table 5 below.
Finally, the specific energy need given by the model was consistent with the energy need evaluated by Wurzbacher et al. [15]. In fact, the data provided values around 9.3 GJ/tCO2 (i.e., 2600 kWh/tCO2) for the total thermal energy need and 100 kWh/tCO2 for the electrical energy need. Furthermore, the significant difference from the minimum separation work, around 100 kWh/tCO2 (25 times smaller factor in order of magnitude) must be pointed out, which shows the energetic improvement potential to improve this capture technique.

3.2. Parametric Study of the Lab-Scale Process

The objective of this section is to investigate the impact of ambient air parameters on the performance of the DAC process. This way, it is possible to determine the bed dimensions for the most stringent operating point with the objective to minimize energy requirements, while maintaining the highest possible cyclic capacity. Otherwise, it is necessary to increase the bed volume to achieve similar annual capture values.
The parameters of the study and the associated variations are summarized in Table 6 and the reference points used in the different studies are presented in Table 7.
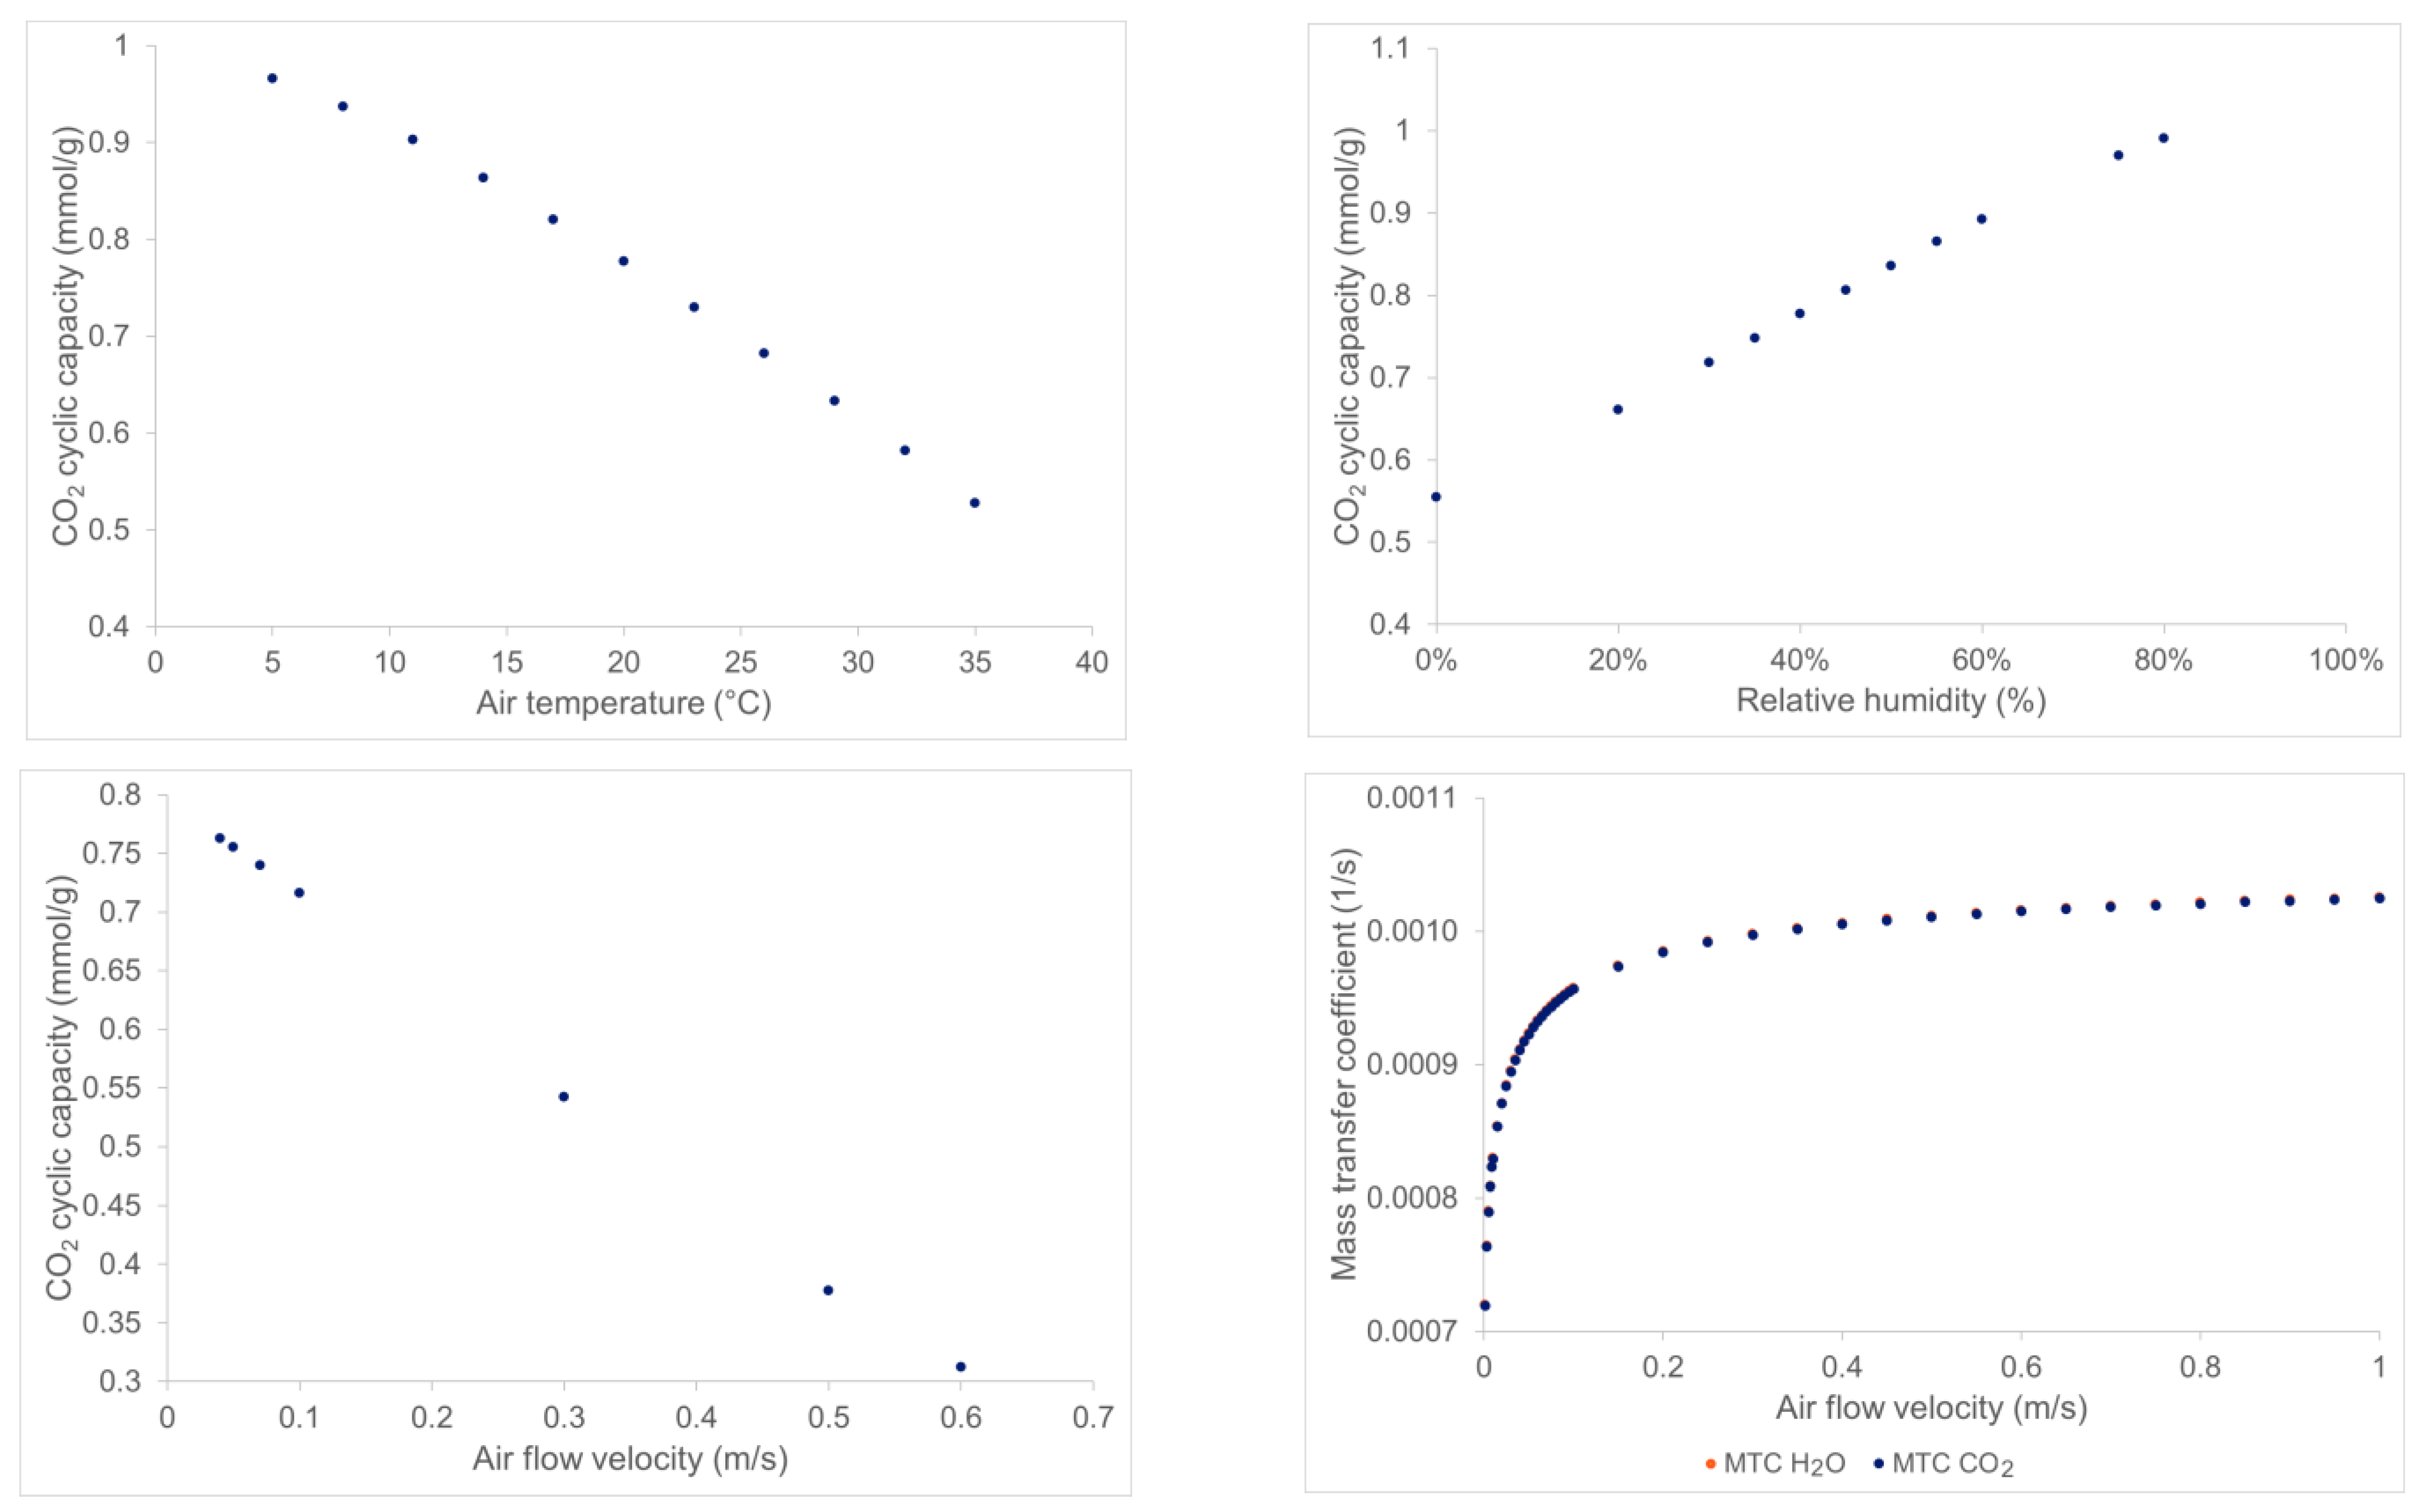
The results are presented in Figure 5. The evolutions of the CO2 cyclic capacity (Figure 5, upper left) are shown to decrease with increasing ambient air temperature. This is directly linked to the isotherm equations presented before that indicate a better adsorption at lower temperature. Surprisingly, as shown in upper-right of Figure 5, the increase in ambient air relative humidity is favorable for increasing CO2 cyclic capacity. This is also explained by the expression of the humidity enhancement factor in the binary CO2 isotherm (Equations (9) and (10)). Indeed, there is competition between increasing the relative humidity and temperature; the first trend increases the CO2 capacity linearly while the latter is decreased with increasing temperature. These trends are coherent with VTSA desorption technology characteristics observed in laboratory-scale beds [32].
Figure 5 (bottom-left and right) shows the evolution of the CO2 cyclic capacity and the mass transfer coefficient (MTC) as functions of the air velocity in the bed. The condition stopping the adsorption remains the same for all simulations, i.e., when the CO2 breakthrough reaches 10% of the inlet CO2 concentration. Thus, increasing the air flow leads to an adsorption duration that is too short because of two competitive phenomena: the first one is that adsorption is kinetically faster because there is more CO2 entering the bed in the same time period leading to higher CO2 bed-volumetric mole concentration, and the second one is that by increasing air velocity, the residence time of the CO2 inside the bed becomes closer and closer to the characteristic time of adsorption (~ 1 M T C ) (see bottom-right of Figure 5). Therefore, the thermodynamics of adsorption become less and less predominant over the kinetics. Some CO2 cannot be adsorbed and goes directly to the outlet. The bed is consequently less charged than in the lower air velocity cases when applied to the CO2 concentration, at the bed exit, a fixed breakthrough of 10% of the inlet CO2 concentration.
Figure 5 (bottom-right) shows the sensitivity analysis of the mass transfer coefficients of CO2 and H2O on air velocity which was performed for air velocity variation. It shows the interest in working with high air velocity, because the higher the air velocity the lower the predominant diffusion and, consequently, the adsorption step of the cycle is quicker. However, if the increased air velocity is obtained via forced ventilation, then the energy penalty of the fan will increase with the flow velocity. Therefore, there is a tradeoff between the adsorption kinetics, the CO2 cyclic capacity, and the energy need of the process.
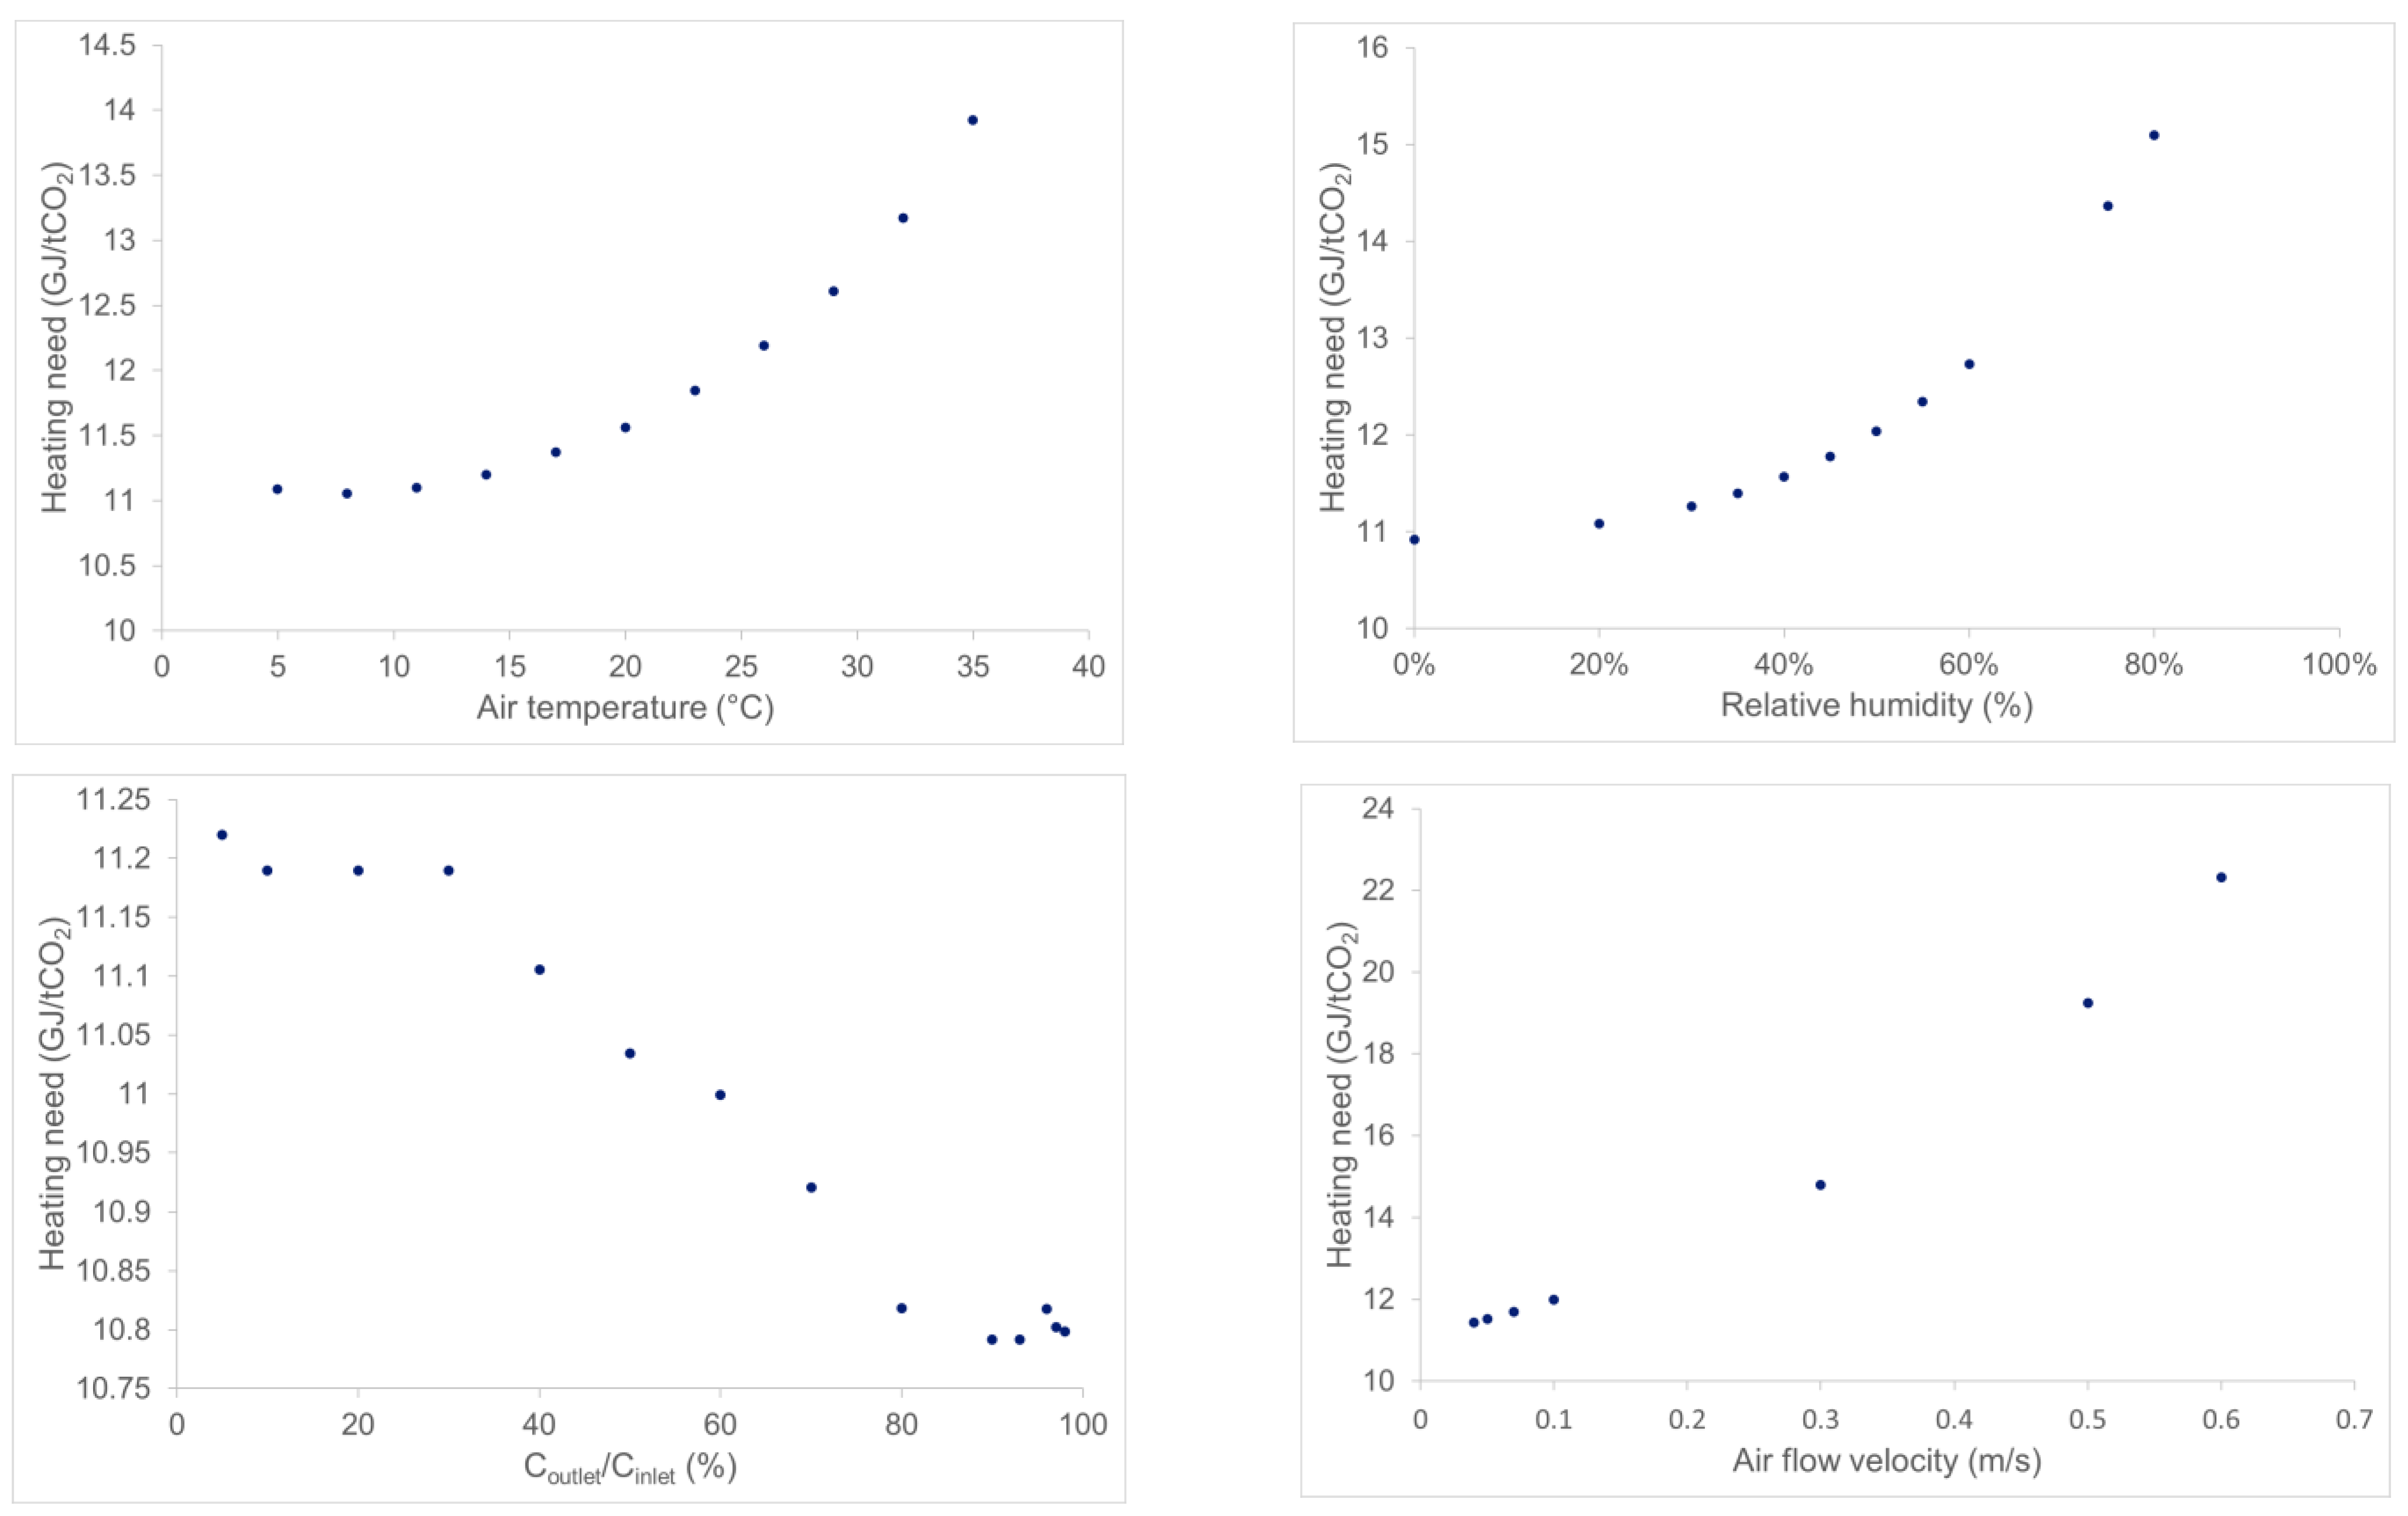
Figure 6 summarizes the specific heating energy results of the parametric study. The results can be explained for ambient temperature and velocity impacts by the same arguments as above: CO2 cyclic capacity decreases by increasing these parameters, but the cycle’s conditions are unchanged particularly for a fixed breakthrough cutoff level, this leads to a higher specific heating need because all the solid sorbent is heated during the stripping step, while it is not sufficiently loaded with CO2.
When increasing the breakthrough level (Figure 6, bottom-left), the cyclic capacity increases, which means that the solid sorbent is loaded with more CO2 and the heating need decreases slightly. Finally, increasing the humidity rate also increases the partial pressure of H2O during adsorption, therefore, there is more H2O being adsorbed and more H2O to desorb. As desorption is endothermic, an increased amount of H2O in the air increases the heating need; indeed, increasing the cyclic capacity is not enough to maintain at least a constant specific heating need.

3.3. Modular-Scale Configuration

The lab-scale bed design is very similar to the design presented in [32], apart from the shape of the bed. The scale-up methodology aims to define the size of the adsorbent bed and the flow rates so that the yearly capture of 50 tCO2 could be reached.
Given that a large bed diameter allows to increase the volumetric rate of inlet air without increasing the superficial velocity, however, the bed diameter was limited to 1.8 m in order to avoid radial dispersion. In addition, the bed length is also dependent on the material characteristics such as the density and the amine content along with the superficial velocity. A bed with a length of 2 m and a density of 55.4 kg/m3 was considered at first. Increasing the density by a factor of four to reach 221.6 kg/m3, but conserving the adsorbent mass and the same adsorption duration implies having a shorter length of the bed of 0.50 m. Finally, starting from the latter configuration, increasing the amine content of the adsorbent material by 14% implies reducing the length of the bed more, to 0.44 m, to keep the adsorption time constant. Therefore, when increasing both the volume of the bed and the sorbent density or amine content, it allows to increase the superficial velocity while keeping the adsorption time constant.
The chosen design has a bed density of 221.6 kg/m3, a length of 1.78 m, to reach a total weight of bed of 1 ton of adsorbent material. The bulk air velocity during adsorption is about 1.97 m/s.

3.3.1. Up-Scaling Approach

At the lab scale, the global Reynolds number, used to determine whether the fluid flow is laminar or turbulent, reaches a value of 21 (i.e., 1 < Re < 100). It is in a transitory regime where both the inertia and viscous terms have an impact. This configuration allows to limit the pressure drop and still have high values for the mass transfer. For the chosen modular-scale design, the value of the Reynolds number is much higher, around 985. In this configuration, the fluid flow is much more turbulent; therefore, the viscous term becomes negligeable in comparison with inertia forces and, consequently, the pressure drop is around 1500 times higher than the lab-scale bed case.
For the selected design (Table 8), the Sherwood number is around 64, which is roughly in the same order of magnitude as the lab-scale dimension, around 8. It has little impact on the MTC because the latter is only increased by 8% during the scale-up operation. In both configurations, the axial Péclet numbers are superior to 104. Those high values imply that the dispersion is weak.

3.3.2. Performances

The goal of the scaling-up is to design an adsorption bed that could achieve the capture of 50 tCO2 yearly. The chosen design with high bed weight and short cycle duration (around 6 h 30 min) allows the module to perform more than three cycles per day. The cyclic capacity of this configuration was evaluated as 0.958 mmol of CO2/g of sorbent, i.e., 0.042 g/g. In this configuration, the module can capture up to 56 tons of CO2 yearly with a purity superior to 95%. The specific energy requirements are summarized in Table 9 below.
The strong increase in the fan work (by 345%) is linked to the pressure loss which is much higher in the industrial bed comparatively to the lab-scale bed: −1395 Pa compared to −0.95 Pa for the lab-scale pilot.

4. Conclusions

Performance of an adsorption-based technology for CO2 capture directly from the air was evaluated numerically at the industrial scale. Detailed mass and heat balance dynamic modeling of the vacuum temperature swing adsorption process was developed in adsorption-dedicated commercial software. The first step of the proposed work validated the modeling thanks to published experimental data of a lab-scale bed module in terms of mass transfer and energy performance. Modeling results of energy performance of the lab-scale bed were found close to experimental data. A method of up-scaling the lab-scale bed to an industrial module was also exposed and mass transfer and energy performances of industrial module were provided.
The modeling design of 50 tCO2/year industrial unit was achieved while conserving almost the same technology which was experimented at lab scale, but for the solid sorbent which is supposed to be enhanced for industrial modules. The scale up from a lab scale to the industrial size is conservative in terms of thermal energy consumption while the electrical consumption is very sensitive to the bed design. Because of the very low concentrations of CO2 in the air, the specific electrical energy consumption of fans to overcome the bed pressure drop is very high per captured CO2 unit. The compression work should be minimized by minimizing the bed pressure drop, otherwise, electric consumption of air fans could be prohibitive. A parametric study over the characteristics of the air in terms of temperature, relative humidity, and gas velocity in the bed could also have a large impact on mass transfer and energy performance.
Further research related to the engineering solutions available to reach high global gas velocity without fluidization of the bed is required. This could be offered by monolith-shape adsorbents. The impact on the mass transfer and the pressure drop must be considered. Good energy integration of the available heat and electrical consumption minimization are paramount to achieve the specific energetical need targeted by this type of technology.

Author Contributions

Conceptualization, M.K. and O.A.; methodology, M.K. and O.A.; software, T.D. and M.K.; validation, M.K. and O.A.; formal analysis, T.D., M.K. and O.A.; investigation, T.D.; resources, L.G.; data curation, M.K. and O.A.; writing—original draft preparation, T.D., M.K. and O.A.; writing—review and editing, M.K. and O.A.; visualization, T.D.; supervision, M.K. and O.A.; project administration, L.G.; funding acquisition, L.G. All authors have read and agreed to the published version of the manuscript.

Funding

This research received no external funding.

Institutional Review Board Statement

Not applicable.

Informed Consent Statement

Not applicable.

Conflicts of Interest

The authors declare no conflict of interest.

References

  1. Hepburn, C.; Adlen, E.; Beddington, J.; Carter, E.A.; Fuss, S.; Mac Dowell, N.; Minx, J.C.; Smith, P.; Williams, C.K. The Technological and Economic Prospects for CO2 Utilization and Removal. Nature 2019, 575, 87–97. [Google Scholar] [CrossRef] [PubMed] [Green Version]
  2. Kanniche, M.; Le Moullec, Y.; Authier, O.; Hagi, H.; Bontemps, D.; Neveux, T.; Louis-Louisy, M. Up-to-Date CO2 Capture in Thermal Power Plants. Energy Procedia 2017, 114, 95–103. [Google Scholar] [CrossRef]
  3. Bui, M.; Adjiman, C.S.; Bardow, A.; Anthony, E.J.; Boston, A.; Brown, S.; Fennell, P.S.; Fuss, S.; Galindo, A.; Hackett, L.A.; et al. Carbon Capture and Storage (CCS): The Way Forward. Energy Environ. Sci. 2018, 11, 1062–1176. [Google Scholar] [CrossRef] [Green Version]
  4. Fuss, S.; Lamb, W.F.; Callaghan, M.W.; Hilaire, J.; Creutzig, F.; Amann, T.; Beringer, T.; de Oliveira Garcia, W.; Hartmann, J.; Khanna, T.; et al. Negative Emissions—Part 2: Costs, Potentials and Side Effects. Environ. Res. Lett. 2018, 13, 063002. [Google Scholar] [CrossRef] [Green Version]
  5. Sustainable Development Scenario—World Energy Model—Analysis. Available online: https://www.iea.org/reports/world-energy-model/sustainable-development-scenario (accessed on 1 October 2021).
  6. Rogelj, J.; Luderer, G.; Pietzcker, R.C.; Kriegler, E.; Schaeffer, M.; Krey, V.; Riahi, K. Energy System Transformations for Limiting End-of-Century Warming to below 1.5 °C. Nat. Clim. Chang. 2015, 5, 519–527. [Google Scholar] [CrossRef]
  7. Viebahn, P.; Scholz, A.; Zelt, O. The Potential Role of Direct Air Capture in the German Energy Research Program—Results of a Multi-Dimensional Analysis. Energies 2019, 12, 3443. [Google Scholar] [CrossRef] [Green Version]
  8. Fasihi, M.; Efimova, O.; Breyer, C. Techno-Economic Assessment of CO2 Direct Air Capture Plants. J. Clean. Prod. 2019, 224, 957–980. [Google Scholar] [CrossRef]
  9. Zolfaghari, Z.; Aslani, A.; Moshari, A.; Malekli, M. Direct Air Capture from Demonstration to Commercialization Stage: A Bibliometric Analysis. Int. J. Energy Res. 2022, 46, 383–396. [Google Scholar] [CrossRef]
  10. House, K.Z.; Baclig, A.C.; Ranjan, M.; van Nierop, E.A.; Wilcox, J.; Herzog, H.J. Economic and Energetic Analysis of Capturing CO2 from Ambient Air. Proc. Natl. Acad. Sci. USA 2011, 108, 20428–20433. [Google Scholar] [CrossRef] [Green Version]
  11. McQueen, N.; Gomes, K.V.; McCormick, C.; Blumanthal, K.; Pisciotta, M.; Wilcox, J. A Review of Direct Air Capture (DAC): Scaling up Commercial Technologies and Innovating for the Future. Prog. Energy 2021, 3, 032001. [Google Scholar] [CrossRef]
  12. Bourzac, K. We Have the Technology. Nature 2017, 550, S66–S69. [Google Scholar] [CrossRef] [PubMed] [Green Version]
  13. Sanz-Pérez, E.S.; Murdock, C.R.; Didas, S.A.; Jones, C.W. Direct Capture of CO2 from Ambient Air. Chem. Rev. 2016, 116, 11840–11876. [Google Scholar] [CrossRef] [PubMed]
  14. Keith, D.W.; Holmes, G.; Angelo, D.S.; Heidel, K. A Process for Capturing CO2 from the Atmosphere. Joule 2018, 2, 1573–1594. [Google Scholar] [CrossRef] [Green Version]
  15. Wurzbacher, J.A.; Gebald, C.; Piatkowski, N.; Steinfeld, A. Concurrent Separation of CO2 and H2O from Air by a Temperature-Vacuum Swing Adsorption/Desorption Cycle. Environ. Sci. Technol. 2012, 46, 9191–9198. [Google Scholar] [CrossRef] [PubMed]
  16. Wurzbacher, J.A.; Gebald, C.; Brunner, S.; Steinfeld, A. Heat and Mass Transfer of Temperature–Vacuum Swing Desorption for CO2 Capture from Air. Chem. Eng. J. 2016, 283, 1329–1338. [Google Scholar] [CrossRef]
  17. Fahr, S.; Powell, J.; Favero, A.; Giarrusso, A.J.; Lively, R.P.; Realff, M.J. Assessing the Physical Potential Capacity of Direct Air Capture with Integrated Supply of Low-carbon Energy Sources. Greenh. Gases 2022, 12, 170–188. [Google Scholar] [CrossRef]
  18. Terlouw, T.; Treyer, K.; Bauer, C.; Mazzotti, M. Life Cycle Assessment of Direct Air Carbon Capture and Storage with Low-Carbon Energy Sources. Environ. Sci. Technol. 2021, 55, 11397–11411. [Google Scholar] [CrossRef]
  19. Deutz, S.; Bardow, A. Life-Cycle Assessment of an Industrial Direct Air Capture Process Based on Temperature–Vacuum Swing Adsorption. Nat. Energy 2021, 6, 203–213. [Google Scholar] [CrossRef]
  20. Shi, X.; Xiao, H.; Azarabadi, H.; Song, J.; Wu, X.; Chen, X.; Lackner, K.S. Sorbents for the Direct Capture of CO2 from Ambient Air. Angew. Chem. Int. Ed. 2020, 59, 6984–7006. [Google Scholar] [CrossRef]
  21. Singh, G.; Lee, J.; Karakoti, A.; Bahadur, R.; Yi, J.; Zhao, D.; AlBahily, K.; Vinu, A. Emerging Trends in Porous Materials for CO2 Capture and Conversion. Chem. Soc. Rev. 2020, 49, 4360–4404. [Google Scholar] [CrossRef]
  22. Wijesiri, R.P.; Knowles, G.P.; Yeasmin, H.; Hoadley, A.F.A.; Chaffee, A.L. Desorption Process for Capturing CO2 from Air with Supported Amine Sorbent. Ind. Eng. Chem. Res. 2019, 58, 15606–15618. [Google Scholar] [CrossRef]
  23. Sabatino, F.; Grimm, A.; Gallucci, F.; van Sint Annaland, M.; Kramer, G.J.; Gazzani, M. A Comparative Energy and Costs Assessment and Optimization for Direct Air Capture Technologies. Joule 2021, 5, 2047–2076. [Google Scholar] [CrossRef]
  24. Dahlgren, E.; Göçmen, C.; Lackner, K.; van Ryzin, G. Small Modular Infrastructure. Eng. Econ. 2013, 58, 231–264. [Google Scholar] [CrossRef]
  25. Wilson, C.; Grubler, A.; Bento, N.; Healey, S.; De Stercke, S.; Zimm, C. Granular Technologies to Accelerate Decarbonization. Science 2020, 368, 36–39. [Google Scholar] [CrossRef] [Green Version]
  26. Sinha, A.; Darunte, L.A.; Jones, C.W.; Realff, M.J.; Kawajiri, Y. Systems Design and Economic Analysis of Direct Air Capture of CO2 through Temperature Vacuum Swing Adsorption Using MIL-101(Cr)-PEI-800 and Mmen-Mg2(Dobpdc) MOF Adsorbents. Ind. Eng. Chem. Res. 2017, 56, 750–764. [Google Scholar] [CrossRef]
  27. Yu, Q.; Brilman, D.W.F. Design Strategy for CO2 Adsorption from Ambient Air Using a Supported Amine Based Sorbent in a Fixed Bed Reactor. Energy Procedia 2017, 114, 6102–6114. [Google Scholar] [CrossRef]
  28. Zhu, X.; Ge, T.; Yang, F.; Wang, R. Design of Steam-Assisted Temperature Vacuum-Swing Adsorption Processes for Efficient CO2 Capture from Ambient Air. Renew. Sustain. Energy Rev. 2021, 137, 110651. [Google Scholar] [CrossRef]
  29. Do, D.D. Adsorption Analysis: Equilibria and Kinetics (with Cd Containing Computer Matlab Programs); World Scientific: Singapore, 1998; ISBN 978-1-78326-224-3. [Google Scholar]
  30. Gebald, C. Development of Amine-Functionalized Adsorbent for Carbon Dioxide Capture from Atmospheric Air. Ph.D. Thesis, ETH Zurich, Zurich, Switzerland, 2014. [Google Scholar]
  31. Portugal, I.; Dias, V.M.; Duarte, R.F.; Evtuguin, D.V. Hydration of Cellulose/Silica Hybrids Assessed by Sorption Isotherms. J. Phys. Chem. B 2010, 114, 4047–4055. [Google Scholar] [CrossRef]
  32. Wurzbacher, J.A. Development of a Temperature-Vacuum Swing Process for CO2 Capture from Ambient Air. Ph.D. Thesis, ETH Zurich, Zurich, Switzerland, 2015. [Google Scholar]
  33. Kast, W. Adsorption aus der Gasphase: Ingenieurwissenschaftliche Grundlagen und Technische Verfahren; VCH: Vancouver, BC, Canada, 1988; ISBN 978-3-527-26719-4. [Google Scholar]
  34. Delgado, J.M.P.Q. A Critical Review of Dispersion in Packed Beds. Heat Mass Transf. 2006, 42, 279–310. [Google Scholar] [CrossRef]
  35. Carberry, J.J. Chemical and Catalytic Reaction Engineering; McGraw-Hill: New York, NY, USA, 1976; ISBN 978-0-07-009790-2. [Google Scholar]
  36. Wakao, N.; Funazkri, T. Effect of Fluid Dispersion Coefficients on Particle-to-Fluid Mass Transfer Coefficients in Packed Beds: Correlation of Sherwood Numbers. Chem. Eng. Sci. 1978, 33, 1375–1384. [Google Scholar] [CrossRef]
Figure 1. Simplified process flowsheet for adsorption-based DAC technology.
Cleantechnol 04 00015 g001
Figure 2. Process flowsheet for DAC in Aspen Adsorption.
Cleantechnol 04 00015 g002
Figure 3. Temperature profiles of successive cycles (left) and a zoom on a single cycle (right).
Cleantechnol 04 00015 g003
Figure 4. Adsorbed quantity of CO2 (blue curve) and H2O (red curve) over time during a full cycle.
Cleantechnol 04 00015 g004
Figure 5. Results of the different parametric studies on the CO2 cyclic capacity of the process at the lab-scale.
Cleantechnol 04 00015 g005
Figure 6. Results of the parametric studies on the specific heating need of the process at the lab scale.
Cleantechnol 04 00015 g006
Table 1. Material properties (isotherms).
CO2—Toth IsothermsH2O—GAB Isotherms
b 0 1/bar22,500 C m , 0 kmol/kg0.0000208
T 0 K296 β K1540
t 0 -0.422 C G , 0 -6.86
α -0.949 Δ H C kJ/kmol−4120
n s , 0 kmol/kg0.00197 k a d s , 0 -2.27
χ -2.37 Δ H K kJ/kmol−2530
Δ h a d s , C O 2 , 0 kJ/mol60 Δ h a d s , H 2 O , 0 kJ/mol49
Table 2. Adsorbent properties and model parameters.
ParameterSymbolValue
Interparticle voidage ε i 0.446
Particle radius r p 0.0036m
Macropore radius r p o r e 10−6m
Particle shape factor ψ 0.83
Particle tortuosity τ 3.36
Molecular diffusivity D m 2.02 × 10⁻⁵m2/s
Particle heat capacity C p s 2.07kJ/(kg·K)
Adsorbed CO2 heat capacity C p a C O 2 88kJ/(kmol·K)
Adsorbed H2O heat capacity C p a H 2 O 75kJ/(kmol·K)
Steam heat capacity C p H 2 O 1.86kJ/(kg·K)
Particle thermal conductivity k s z 0.0445W/(m·K)
Gas dynamic viscosity μ 1.8 × 10⁻⁵Pa·s
Gas density ρ g 1.2kg/m3
Heating source temperature T H x , 0 383.15K
Heat transfer coefficient U H x 60W/(m2·K)
Table 3. Cycle parameters.
StepDurationTemperature (°C)Pressure (bar)
1AdsorptionUntil Cout/C0 = 10%101.013
2Evacuation10 s10<0.150
3Pre-heating10 min60<0.300
4Pre-purge3 min-<0.300
5VTSA1 h 20 min110<0.300
6Steam purge under vacuum20 min-<0.300
7Cooling24 min<60<0.300
8RepressurizationUntil p = 1.013 bar101.013
Table 4. Lab-scale bed characteristics.
Lab Scale
Bed height H b 0.299m
Bed internal diameter D 0.081m
Intraparticle voidage ε p 0.937
Particle bulk density ρ s 55.4kg/m3
Air flow rate Q a i r 14NL/min
Table 5. Energy performances of the lab-scale module.
Fan work (kWh/tCO2)2.78
Vacuum work (kWh/tCO2)97.22
Total electrical energy need (kWh/tCO2)100
Steam heating need (GJ/tCO2)0.26
Heating need (GJ/tCO2)12.88
Active cooling need (GJ/tCO2)0.64
Total thermal energy need (GJ/tCO2)13.14
Table 6. Studied parameters and range of variation.
Parameters of the AnalysisVariation Range
Air flow velocity (m/s)[0.001–0.6]
Relative humidity (RH) (%)[0–80]
Air temperature (K)[268.15–293.15] at 0%RH
[278.15–308.15] at 40% RH
Breakthrough curve position Cout/Cin (%)[5–98]
Table 7. Reference points for the different parametric studies.
Variation ParameterTemperatureHumidity RateBreakthrough Curve PositionAir Flow Speed
Characteristics of the reference pointTemperature/293.15 K293.15 K293.15 K
Humidity rate40%/40%40%
Breakthrough curve position10%10%/10%
Air flow speed0.044 m/s0.044 m/s0.044 m/s/
CO2 concentration400 ppm400 ppm400 ppm400 ppm
Table 8. Industrial module scale.
Module Scale
Bed height H b 1.78m
Bed internal diameter D 1.80m
Intraparticle voidage ε p 0.811
Particle bulk density ρ s 221.6kg/m3
Air flow rate Q a i r 1.8Nm3/s
Table 9. Energy performance of the industrial module scale.
Fan work (kWh/tCO2)3419.44
Vacuum work (kWh/tCO2)30.56
Total electrical energy need (kWh/tCO2)3450
Steam heating need (GJ/tCO2)0.12
Heating need (GJ/tCO2)12.60
Active cooling need (GJ/tCO2)1.16
Total thermal energy need (GJ/tCO2)13.87
Publisher’s Note: MDPI stays neutral with regard to jurisdictional claims in published maps and institutional affiliations.

