Article

Sorption of 71 Pharmaceuticals to Powder Activated Carbon for Improved Wastewater Treatment

1
Water and Environmental Engineering at Department of Chemical Engineering, Lund University, P.O. Box 124, SE-221 00 Lund, Sweden
2
Department of Environmental Engineering, Technical University of Denmark, B113, DK-2800 Kgs Lyngby, Denmark
3
Department of Chemistry, Umeå University, SE-901 87 Umeå, Sweden
*
Author to whom correspondence should be addressed.
Clean Technol. 2022, 4(2), 296-308; https://doi.org/10.3390/cleantechnol4020017
Submission received: 16 March 2022 / Revised: 7 April 2022 / Accepted: 20 April 2022 / Published: 25 April 2022
(This article belongs to the Collection Water and Wastewater Treatment Technologies)

Abstract

:
In this study, sorption distribution coefficients were determined for 71 pharmaceuticals, aiming to describe their sorption behavior to powder activated carbon (PAC). The data are expected to be applied when designing and upgrading wastewater treatment plants (WWTP) for improved removal of pharmaceuticals by applying sorption to PAC as an additional removal technique. Sorption isotherms were determined for the pharmaceuticals over a concentration interval covering a wide range from 0.08 to 10 µg/L using PAC at a concentration of 10 mg/L. The best fitted sorption isotherms were used to calculate the distribution coefficients (Kd) and these were applied to estimate that the PAC doses needed to achieve a target concentration of 10 ng/L in the effluent. A target concentration was used since neither discharge limit values nor environmental quality standards in general have been defined for these compounds. Using a %-removal approach does not guarantee achievement of concentrations low enough to protect the water ecosystems. Some of the pharmaceuticals will be reduced by the addition of small amounts of PAC. Examples are atenolol, carbamazepine, citalopram, codeine, fluoxetine and ibuprofen. For others, e.g., oxazepam, an alternative treatment has to be considered since the requested dose is too high to be realistic for a target concentration of 10 ng/L.

Graphical Abstract

1. Introduction

The existing conventional wastewater treatment plants (WWTPs) are not designed for removal of anthropogenic organic micropollutants. Industrial chemicals and pharmaceuticals with endocrine disrupting effects and/or other unwanted, and even unknown, biological effects have been detected in bodies of water around the world (see, e.g., [1,2,3,4,5]). WWTPs with different types and combinations of treatment processes reduce pharmaceuticals to different extents. Some examples can be found in the literature, e.g., diclofenac, metoprolol and glibenclamide, where the removal efficiencies varied between 45–85, 75–100 and 40–90%, respectively [6]. Sorption to sludge during wastewater treatment has been shown to be important for some pharmaceuticals, such as clotrimazole and haldoperidol, whereas the main part of the 75 pharmaceuticals investigated in that study remained in the water phase [7]. Hence, there is a need to upgrade WWTPs in order to minimize the release of organic micropollutants into the aquatic environment.
Numerous technologies based on biological, chemical and physical treatments have been developed and tested for the extended removal of organic micropollutants during recent years. Advanced biological treatments, i.e., moving bed biofilm reactors, have shown to be more efficient in removing the target compounds compared to active sludge systems [8]. However, not all compounds can be removed with the use of advanced biological treatment. Chemical treatment has also been investigated for the removal of unwanted compounds. In [9], it is shown that ozone selectively could oxidize and remove estrogens. Another oxidant, chlorine dioxide, has been demonstrated to be a promising oxidant for removal of pharmaceuticals [10,11]. However, by applying chemical treatments, there is a risk that unwanted transformation products are formed, as well as by-products from the oxidation process. Both granular activated carbon (GAC) and powder activated carbon (PAC) have been investigated as sorbents for organic micropollutants. In [12] it was found that GAC was better suited as sorbent for nonylphenol compared to naproxen in a drinking water treatment plant in a pilot scale. Further, the authors showed that the need of PAC was less in order to achieve 90% removal of naproxen, while more PAC was needed to achieve 90% removal of nonylphenol compared to the use of GAC. PAC was shown to be an efficient method for removal of some endocrine disrupting compounds (EDCs) in a bench-scale study including 23 pharmaceuticals [13]. Here, it was found that >90% of the EDCs were removed by applying PAC at a dose of 5 mg/L. For ibuprofen, sulfamethoxazole and meprobamate the removal was lower, between 40% and 60%. In a review [14], it was summarized that PAC was showed to be the most efficient sorbent, especially for refractory nonbiodegradable compounds. However, the present knowledge regarding the removal efficiency for many pharmaceuticals is still scarce. Furthermore, sorption isotherms for different organic micropollutants than PAC are rare, although some can be found, e.g., perfluorooctane sulfonate (PFOS) and perfluorooctanoate (PFOA) [15], and some estrogens [16].
Other researchers have studied some of the pharmaceuticals investigated in the present study. In [17], a 69% reduction for both diclofenac and oxazepam by 12 g/m3 PAC is reported. Diclofenac in concentrations from 2600 to 5800 ng/L was reduced by 80% by applying 10 g/m3 PAC [18]. PAH, pharmaceuticals and pesticides were included in [13]. It was shown that PAH were reduced to a greater extent than the pharmaceuticals studied. Evaluation of the removal of endocrine disrupting compounds by use of PAC (3 g/m3) revealed a removal efficiency of 2–35% for bisphenol A during 15 min of contact time [19]. Further, the author found that at a PAC dose of 30 g/m3, nonylphenol and octylphenol were removed by 100% and 60%, respectively.
The objectives of this study were to experimentally determine the sorption isotherms and sorption coefficients for 120 pharmaceuticals to PAC. Further, based on the obtained coefficients and based on observed concentrations in Swedish wastewater effluents [4], this study estimates the quantity of PAC needed in order to reduce the pharmaceuticals from WWTPs’ effluents substantially. The observed concentrations in Swedish WWTPs were supplemented with corresponding, worldwide observations in cases where the Swedish values deviated substantially from data found in the published literature. The obtained results are expected to be useful information when determining for which pharmaceuticals the application of PAC could be a realistic option and when WWTPs are going to be upgraded to remove organic micropollutants.

2. Materials and Methods

The methodology and design applied for determining the sorption isotherms for a large number of pharmaceuticals have been published earlier in a study by the authors [7]. The aim in that study was to determine sorption isotherms for pharmaceuticals to primary and secondary sludge. Shortly, a stock solution including all the pharmaceuticals with the concentration of 100 × 103 g/L was prepared in methanol. From this, four methanol stock solutions with the concentrations of 0.4 × 10³, 2.0 × 10³, 10.0 × 10³ and 50.0 × 10³ g/L, respectively, were prepared. Earlier studies have shown that there is no significant difference when the distribution coefficients are determined for single compounds or mixtures (see [7] and references therein). Furthermore, in the present study it was important to mimic a wastewater where the compounds are all present together. As in the previous study [7], 1 L artificial wastewater was used. It consisted of a phosphate-buffered mineral medium containing Ca2+, K+, Mg2+, Na+, Cl and SO42−, to which PAC 0.01 g was added in 1 L Schott Duran® bottles. In order to inhibit microbial growth, the bottles were flushed with N2(g) for 1 min, and Na2SO3 was added to a final concentration of 50 mg/L. The bottles were left at +4 °C in the dark and stirred for 12 h before the addition of the pharmaceutical mixture. By adding 200 µL of the different stock solutions, using a Hamilton syringe, the final concentrations given in Table 1 were reached. The sorption and equilibrium processes were set to 12 h, during which the bottles were stirred in the dark at +4 °C. Included were blanks without pharmaceuticals but with PAC, and controls without PAC but with the selected concentrations of pharmaceuticals (Table 1). PAC used in this study was purchased from Merck, Darmstadt, Germany. The Langmuir surface area was determined and measured to 1036 m2/g and pore volume to 0.61 cc/g with p/po 0.99.
The experimental setup enables the evaluation of sorption of the chosen pharmaceuticals present in a mixture of many substances, in typical concentration levels found in a full-scale wastewater treatment plant. Further, the contact time between PAC and pharmaceutical are similar to what can be expected if PAC is dosed to an activated sludge tank. As such, the results have the potential to show the sorption behavior at a level where reasonable prediction of the needed PAC dose to reach a chosen target concentration can be given. However, since the impact on the sorption by other substances that most likely will be present in the wastewater are excluded and the potential effect on sludge characteristics is not evaluated from the batch experiments, further research is needed in order to give detailed advice for the practical needed PAC doses.

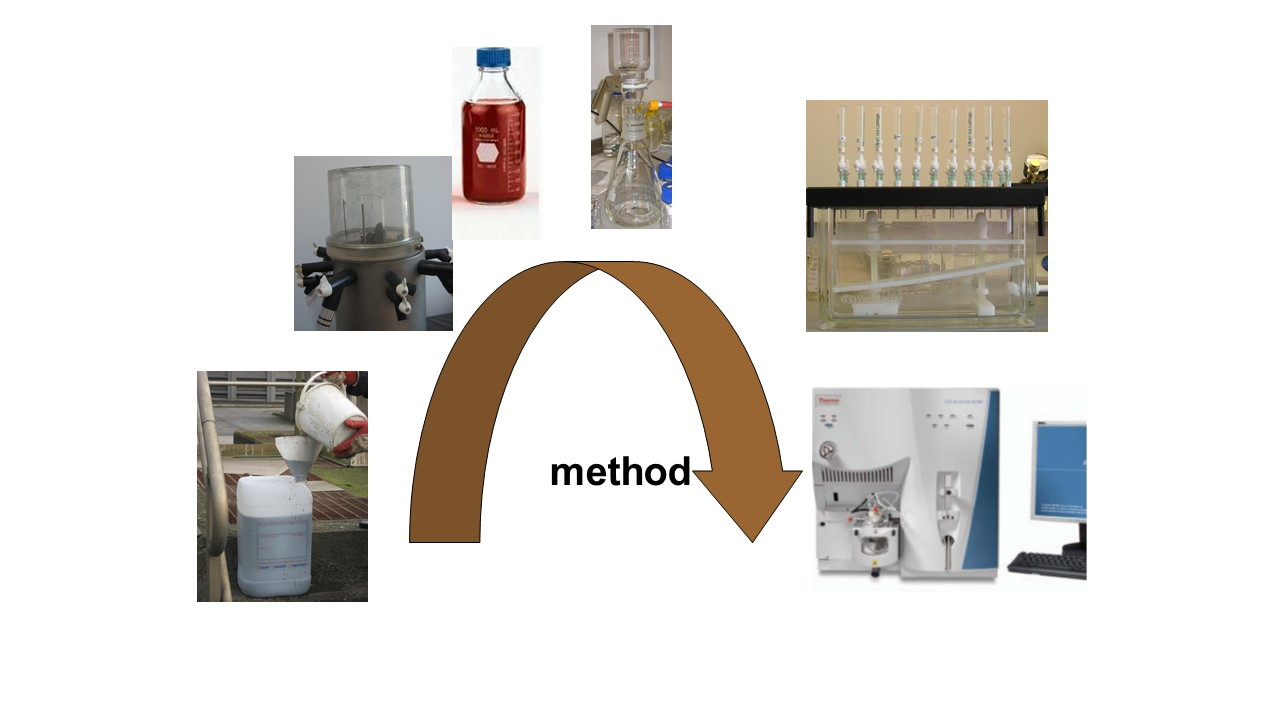
2.1. Extraction and Chromatography

Triplicate extractions were made from each 1 L Schott Duran® bottle as earlier described in [7], using Oasis HLB 200 mg, 30 µm (Waters, Solna, Sweden). The analyses were made according to [20], employing LC-MS/MS.

2.2. Data Analyses

For the data, analyses of the solubility, limit of quantification (LOQ) and the linear range of the analytical method [20] were considered for each pharmaceutical included. The idea was to obtain four API equilibriums with water concentration (Cw) in the range of 90% of the starting concentration (C0) and the LOQ. The water solubility should be larger than the starting concentration. The measured concentrations of the pharmaceutical in the water phase (C0) in the bottles to which no PAC was added and in those where PAC was added (Cw) were used to calculate the sorbed concentration (Cs), Cs = C0Cw. By plotting results from the batch sorption experiments including multiple concentrations, sorption isotherms may be obtained, from which the solid–water distribution coefficients can be determined. Sorption isotherms define the equilibrium between the concentration of a chemical in aqueous and solid phases [21]. In the present study, three equations were included: linear Equation (1), Freundlich Equation (2) and Langmuir Equation (3).
C s = K d × C w
C s = K f × C w 1 n
C s = τ max × K L × C w 1 + K L × C w
where: Cw is the concentration in the water phase (g/L), Cs is the concentration sorbed to the PAC (g/kg) and Kd is the linear sorption coefficient. Kf is the Freundlich coefficient and n is the Freundlich exponent. τ represents the total number of surface sites per mass of sorbent, and KL is the Langmuir coefficient. The linear isotherm is the simplest case where the affinity of the pharmaceutical remains constant over the concentration interval.
With the intention of finding the best fitted isotherm, the software GraphPad Prism 5 for Windows (GraphPad Software, Inc., San Diego, CA, USA) was used. A 95% confidence interval was applied for evaluation of the data. In order to qualify as the best fit, the R2-value for the curve should be >0.7; otherwise, no fit was determined. In order to determine which of the isotherms that had the best fit, two hypotheses were tested: linear against Freundlich and linear against Langmuir. The significance (P) that the linear model has a better fit than the other models was used for that. If both Freundlich and Langmuir isotherms turned out to be better than the linear, the one with the highest R2-value was determined to have the best-fitted isotherm.

2.3. Estimation of the Removal of Pharmaceuticals by Use of PAC

The amount of PAC needed in order to remove pharmaceuticals from the treated wastewater was estimated by employing the obtained sorption isotherms as well as known concentrations for pharmaceuticals quantified in Swedish WWTP effluents [4]. The amount of PAC needed in order to reduce the quantity of a pharmaceutical in the water phase was calculated using Equation (4), where FS was the sorbed fraction of the pharmaceutical at equilibrium for a given amount of PAC.
F S = PAC × K d 1 + PAC × K d
The observed concentrations in Swedish WWTPs were supplemented with corresponding, worldwide observations in cases where the Swedish values deviated substantially from data found in the published literature.

3. Results and Discussion

3.1. Sorption Isotherms

For experimentally obtained isotherms, the Freundlich isotherm often provides a better fit compared to the linear fit. The Langmuir isotherm may have the best fit in cases where the sorbent becomes saturated at higher concentrations of pharmaceuticals. The same shape may also be seen where one important sorbent is present, e.g., activated carbon or clay mineral [21].
Sorption isotherms were determined for 71 pharmaceuticals out of the 120 present in the experiments. For 49 of the tested pharmaceuticals, no isotherms were obtained. This was either due to very high sorption and/or to limitations in the ability to quantify the compounds in low concentrations. For amiodiarone, bromocriptine, chlorpromazine, dihydroergotamin, fluphenazine, miconazole, perphenazine and roxithromycine, sorption was so strong that the differences in the water concentrations when analyzing the lower applied concentrations, both in water and in water with addition of PAC, were insignificant. Thus, except strong sorption, no conclusion can be made for those pharmaceuticals.
Table 2 presents the obtained sorption coefficients for each of the 71 pharmaceuticals.
The Freundlich isotherm was found to provide the best fit for 51% of the pharmaceuticals, while Langmuir was the best fit in 38% of the cases, and for 8% of the pharmaceuticals the linear isotherm gave the best fit. This made it impossible to gain representative, analytical results for estimation of sorption isotherms. These compounds are consequently not included among the 71 pharmaceuticals presented in Table 2.

3.2. Removal of Pharmaceuticals by Use of PAC

In order to estimate the quantity of PAC needed in an additional treatment in WWTPs, the obtained distribution coefficients were used in combination with measured concentrations in the effluent at Swedish WWTPs (data from [4]). Only for the 19 pharmaceuticals given in Table 3 does substantial data exist. The target concentration in the effluent after treatment was set to 10 ng/L. A target concentration was defined since neither discharge limit values nor environmental quality standards had been decided on for pharmaceuticals. There is no scientific evidence saying that 10 ng/L is low enough to avoid unwanted biological effects, especially not in a cocktail containing numbers of micropollutants. However, this approach at least illustrates how much PAC is needed to reach ng/L levels of these pharmaceuticals. It should be noted that the target concentration of 10 ng/L is lower than the majority of the environmental quality standards decided on in the Water Framework Directive [22]. Another reason is that it is not viable to set a concentration limit for any compound in wastewater effluent, which is below present LOQ, since monitoring would not be possible. A literature review showed that LOQ for many of the pharmaceuticals is in the range 1–20 ng/L level when using LC-MS/MS [20,23,24]. However, for some pharmaceuticals, LOQ are higher (50–120 ng/L; [17,20,25]). This means that the target set would be too low to allow quantification for some compounds and the required target concentration has, in practice, to be adjusted after the LOQ. In Switzerland, the choice has fallen on an 80% reduction of micropollutants in the wastewater effluent [26] without considering the concentration in the effluent. However, this approach is not in accordance with the Water Framework Directive, which applies environmental quality standards [22], and consequently was a different approach compared to the one taken in this study.
Since the target concentration in the effluent after treatment was set to 10 ng/L, no additional removal is needed for those pharmaceuticals that are present at low concentrations, i.e., <10 ng/L. A 90% reduction was applied for pharmaceuticals present in concentrations in the range of 10 to 100 ng/L, while a 99% reduction was applied for those found in concentrations >100 ng/L (Table 3).
The doses of PAC needed in order to reduce the pharmaceuticals present in the highest concentrations (100–1000 ng/L) in Swedish WWTP effluents by 99% are presented in Figure 1. It is seen that the needed dose to reach >99% reduction varies a lot, from almost nothing to up to more than 500 g/m3.
Most of the pharmaceuticals in this group will be sufficiently removed by the addition of a low amount of PAC, e.g., 0.1 g/m3. However, three of the pharmaceuticals require greater amounts. For tramadol and diclofenac, 10 g/m3 and 15 g/m3, respectively, are required in order to reach 99% reduction, while for oxazepam more than 500 g/m3 would be required. Doses >50 g/m3 are not practically realistic.
A literature review showed that these nine pharmaceuticals have been observed worldwide in wastewater effluents. The range is large, from 1 to 7043 ng/L, where the concentrations of the individual pharmaceuticals varied between 65–3494, 13–4609, 1–189, 10–1502, 209–4200, 6–660, 87–1603, 60–7043 and 5–1766 ng/L, for atenolol, carbamazepine, citalopram, codeine, ibuprofen, metoprolol, tramadol, diclofenac and oxazepam, respectively (e.g., [17,27,28,29]). The reported worldwide concentrations showed that these pharmaceuticals are discharged in relatively high concentrations. The first six pharmaceuticals in Figure 1 (from the left) remain easily reduced with the low doses of PAC, even if the concentration in the effluent is in the higher range of the above listed. As Figure 1 demonstrates, tramadol, diclofenac and oxazepam are not substantially reduced by PAC. This means, in practice, that PAC may not be a relevant choice if legislation will require concentrations < 10 ng/L of those pharmaceuticals, and other treatments should be considered.
In the middle group (10–100 ng/L) consisting of six pharmaceuticals, the amount of PAC required in order to reduce them by 90% is presented in Figure 2. It is shown that only fluoxetine will be reduced to the target level by the lowest dose of 0.1 g/m3. Increasing the amount of PAC to 1 g/m3 will cause terbutaline to be reduced to the target level, while by applying 5 g/m3, all pharmaceuticals in this group will be reduced to at least 90%.
Most of these pharmaceuticals are found in the same concentration range in wastewater effluents worldwide (e.g., [30,31,32]), except for desloratadine, for which no commentary can be made as no measurements have been found elsewhere, and terbutaline, for which the levels reported are below 10 ng/L [27].
Among the 19 pharmaceuticals, which have been measured in Swedish wastewater effluents, 4 of them were found in the range of 1–10 ng/L. Consequently, no further treatment would be needed. However, there are other studies published where the concentrations of these pharmaceuticals in wastewater effluents are higher. The concentration for the individual pharmaceuticals varied between 3–78, 1–43, 3–86 and 1–43 ng/L for estrone, glibenclamide, risperidon and zoldipem, respectively (e.g., [17,27]). In comparison with the concentrations observed worldwide, the concentrations observed in Swedish wastewater effluents are in the lower end of the scale. When present in the upper end of the scale, a 90% reduction would be required in order to reach the target level. The required dose of PAC needed when applying concentrations observed outside Sweden for these four pharmaceuticals are presented in Figure 3.
As seen in Figure 3, when these four pharmaceuticals are present in concentrations of 10–100 ng/L, at least a 90% reduction will be achieved by applying 5 g/m3 for three of the pharmaceuticals, whereas estrone would require 50 g/m3.
Among the pharmaceuticals included in this study, three of them (diclofenac, oxazepam and tramadol, Figure 1), are difficult to reduce to the target level by using PAC as the treatment, since the sorption of PAC is too low. Consequently, other treatment methods should be considered if the target level cannot be reached by applying realistic doses of PAC, i.e., less than 10–20 g/m3, as stated in [17]. Based on the concentrations observed worldwide in WWTPs’ effluents, estrone also qualifies for the group of pharmaceuticals where PAC is not an appropriate choice.
In [33], it is stated that the ability to remove compounds depends on the dose of PAC, contact time and the structure of the target compound. The present study clearly support the idea that the target compound and the dose affect removal efficiency.
Addition of 5 g/m3 PAC to an activated sludge system will not increase the sludge production significantly compared to the typical total sludge production of ca 400 g/m3 (dry matter), which suggests that PAC treatment-by-addition in the activated sludge system can be an easy way to upgrade WWTPs. Thus, by addition of PAC to the activated sludge system, the existing system for removal of sludge can be used for removal of sludge and PAC.
Another advantaged of PAC is that no transformation products or by-products are formed, which means that no new, more-harmful compounds are added to the wastewater.

4. Conclusions

Sorption isotherms for 71 pharmaceuticals towards PAC were determined in the present study, while for 49 of the tested pharmaceuticals, no isotherms were obtained. This was either due to very high sorption and/or to limitations in the ability to quantify the compounds in low concentrations.
For 19 of the pharmaceuticals, the ranges of concentrations found in Swedish wastewater treatment plants were from levels of ng/L to µg/L. Subdivision of the substances into three ranges, 1–10 ng/L, 10–100 ng/L and 100–1000 ng/L, were used to find the amount of PAC needed to reach a common target of 10 ng/L. Four substances in the lowest range (estrone, glibenclamide, risperidon and zoldipem) do not need any reduction. At a 10-fold higher concentration observed internationally for estrone, a high dose (up to 50 g/m3 PAC) will be needed, whereas the other three compounds could easily be removed to the target concentration at a dose of up to 5 g/m3 PAC. Six substances in the medium range (fluoxetine, terbutaline, estradiol, desloratadine, progesterone and sertraline) could easily be removed to the target concentration with a dose of 5 g/m3 or lower. In the highest range, six out of nine pharmaceuticals (atenolol, carbamazepine, citalopram, codeine, ibuprofen and metoprolol) could easily be removed to the target concentration with a low doses of <1 g/m3 PAC. Two of the remaining three (tramadol and diclofenac) could be reduced with moderate doses of 10 and 15 g/m3, respectively, whereas oxazepam have very low potential to be, in practice, removed with PAC since a dose of more than 500 g/m3 would be needed. Other treatment options have to be considered to reach the target value of 10 ng/L for that pharmaceutical.
More research is needed in order to evaluate the effect of the pharmaceuticals on sorption in a real wastewater matrix.

Author Contributions

Conceptualization, All; methodology, M.H. and H.R.A.; validation, R.G., H.R.A. and M.H.; formal analysis, M.H.; investigation, M.H., H.R.A. and R.G.; resources, A.L., J.l.C.J., H.R.A. and R.G.; data curation, M.H.; writing—original draft preparation, M.H.; writing—review and editing, All; visualization, M.H.; supervision, A.L. and J.l.C.J.; project administration, A.L. and J.l.C.J.; funding acquisition, A.L. and J.l.C.J. All authors have read and agreed to the published version of the manuscript.

Funding

The present study was part of the MistraPharma project, phase 1, which was supported by the Foundation for Strategic Environmental Research (MISTRA). Further, the authors acknowledge The Swedish Research Council for Environment, Agricultural Sciences and Spatial Planning (FORMAS) for the postdoc scholarship to Maritha Hörsing.

Institutional Review Board Statement

Not applicable.

Data Availability Statement

The data are not publicly available.

Acknowledgments

The authors wish to acknowledge Birgitta Lindén, Department of Chemical Engineering, Lund University, for determining the Langmuir surface and the pore volume of the PAC. Further, Salar Haghighatafshar at Water and Environmental Engineering, Department of Chemical Engineering, Lund University is acknowledged for the final editing of the graphs.

Conflicts of Interest

The authors declare no conflict of interest.

References

  1. Herberer, T.; Reddersen, K.; Mechlinski, A. From municipal sewage to drinking water: Fate and removal of pharmaceutical residues in the aquatic environment in urban areas. Water Sci. Technol. 2002, 46, 81–88. [Google Scholar] [CrossRef] [Green Version]
  2. Ternes, T.; Meisenheimer, M.; McDowell, D.; Sacher, F.; Brauch, H.J.; Haist-Gulde, B.; Preuss, G.; Wilme, U.; Seibert, N.Z. Removal of Pharmaceuticals during drinking water treatment. Environ. Sci. Technol. 2002, 36, 3855–3863. [Google Scholar] [CrossRef]
  3. Andersen, H.R.; Siegrist, H.; Halling-Sørensen, B.; Ternes, T. Fate of esterogens in a municipal sewage treatment plant. Environ. Sci. Technol. 2003, 37, 4021–4026. [Google Scholar] [CrossRef]
  4. Falås, P.; Andersen, H.R.; Ledin, A.; la Cour Jansen, J. Occurrence and reduction of pharmaceuticals in water phase at Swedish wastewater treatment plants. Water Sci. Technol. 2012, 66, 783–791. [Google Scholar] [CrossRef]
  5. Petrović, M.; Škrbić, B.; Živančev, J.; Ferrando-Climent, L.; Barcelo, D. Determination of 81 pharmaceutical drugs by high performance liquid chromatography coupled to mass spectrometry with hybrid triple quadrupole–linear ion trap in different types of water in Serbia. Sci. Total Environ. 2014, 468–469, 415–428. [Google Scholar] [CrossRef]
  6. Jelic, A.; Gros, M.; Ginebreda, A.; Cespedes-Sánchez, R.; Ventura, F.; Petrovic, M.; Barcelo, D. Occurrence, partition and removal of pharmaceuticals in sewage water and sludge during wastewater treatment. Water Res. 2011, 45, 1165–1176. [Google Scholar] [CrossRef]
  7. Hörsing, M.; Ledin, A.; Grabic, R.; Fick, J.; Tysklind, M.; la Cour Jansen, J.; Andersen, H.R. Determination of sorption of seventy-five pharmaceutivals in sewage sludge. Water Res. 2011, 45, 4470–4482. [Google Scholar] [CrossRef] [PubMed] [Green Version]
  8. Falås, P.; Baillon-Dhumez, A.; Andersen, H.R.; Ledin, A.; la Cour Jansen, J. Suspended biofilm carrier and activated sludge removal of acidic pharmaceuticals. Water Res. 2012, 46, 1167–1175. [Google Scholar] [CrossRef] [PubMed]
  9. Huber, M.M.; Ternes, T.A.; von Gunten, U. Removal of Estrogenic Activity and Formation of Oxidation Products during Ozonation of 17r-Ethinylestradiol. Environ. Sci. Technol. 2004, 38, 5177–5186. [Google Scholar] [CrossRef] [PubMed]
  10. Hey, G.; Grabic, R.; Ledin, A.; la Cour Jansen, J.; Andersen, H.R. Oxidation of pharmaceuticals by chlorine dioxide in biologically treated wastewater. Chem. Eng. J. 2012, 185–186, 236–242. [Google Scholar] [CrossRef] [Green Version]
  11. Hey, G.; Ledin, A.; la Cour Jansen, J.; Andersen, H.R. Removal of pharmaceuticals in biologically treated wastewater by chlorine dioxide or peracetic acid. Environ. Technol. 2012, 33, 1041–1047. [Google Scholar] [CrossRef] [PubMed]
  12. Yu, Z.; Peldszus, S.; Huck, P.M. Adsorption of selected pharmaceuticals and an endocrine disrupting compound by granular activated carbon. 2. Model prediction. Environ. Sci. Technol. 2009, 43, 1474–1479. [Google Scholar] [CrossRef] [PubMed]
  13. Westerhoff, P.; Yoon, Y.; Snyder, S.; Wert, E. Fate of endocrine-disrupter, pharmaceuticals and personal care product chemicals during simulated drinking water treatment process. Environ. Sci. Technol. 2005, 39, 6649–6663. [Google Scholar] [CrossRef]
  14. Bolong, N.; Ismail, A.F.; Salim, M.R.; Matsuura, T. A review of the effects of emerging contaminants in wastewater and options for their removal. Desalination 2009, 239, 229–246. [Google Scholar] [CrossRef]
  15. Yu, Q.; Zhang, R.; Deng, S.H.J.; Yu, G. Sorption of perfluorooctane sulfonate and perfluorooctanoate on activated carbons and resin: Kinetik and isotherm study. Water Res. 2009, 43, 1150–1158. [Google Scholar] [CrossRef]
  16. Andersen, H.R.; Hansen, M.; Kjølholt, J.; Stuer-Lauridsen, F.; Ternes, T.; Halling-Sørensen, B. Assessment of the importance of sorption for steroid estrogens removal during activated sludge treatment. Chemosphere 2005, 6, 139–146. [Google Scholar] [CrossRef]
  17. Margot, J.; Kienle, C.; Magnet, A.; Weil, M.; Rossi, L.; de Alencastro, L.F.; Abegglen, C.; Thonney, D.; Chèvre, N.; Schärer, M.; et al. Treatment of micropollutants in municipal wastewater: Ozone or powdered activated carbon? Sci. Total Environ. 2013, 461–462, 480–498. [Google Scholar] [CrossRef]
  18. Altmann, J.; Ruhl, A.S.; Zietzschmann, F.; Jekel, M. Direct comparison of ozonation and adsorption onto powdered activated carbon for micropollutant removal in advanced wastewater treatment. Water Res. 2014, 55, 185–193. [Google Scholar] [CrossRef] [PubMed]
  19. Choi, K.J.; Kim, S.G.; Kom, C.W.; Park, J.K. Removal efficiencies of endocrine disrupting chemicals by coagulation/flocculation, ozonation, powdered/granular activated carbon adsorption, and chlorination. J. Chem. Eng. 2006, 23, 399–408. [Google Scholar] [CrossRef]
  20. Grabic, R.; Fick, J.; Lindberg, R.H.; Fedorova, G.; Tysklind, M. Multi-residue method for trace level determination of pharmaceuticals in environmental samples using liquid chromatography coupled to triple quadrupole mass spectrometry. Talanta 2012, 100, 183–195. [Google Scholar] [CrossRef] [PubMed]
  21. Schwazenbach, R.P.; Gschwend, P.M.; Imboden, D.M. Environmental Organic Chemistry; Wiley & Sons, Inc.: Hoboken, NJ, USA, 2003; 1313p. [Google Scholar]
  22. EU. Consolidated Text: Directive 2000/60/EC of the European Parliament and of the Council of 23 October 2000 Establishing a Framework for Community Action in the Field of Water Policy. 2014. Available online: https://eur-lex.europa.eu/legal-content/EN/TXT/?uri=CELEX%3A02000L0060-20141120 (accessed on 7 March 2022).
  23. Bahlmann, A.; Brack, W.; Schneider, R.J.; Krauss, M. Carbamazepine and its metabolites in wastewater: Analytical pitfalls and occurrence in Germany and Portuga. Water Res. 2014, 57, 104–114. [Google Scholar] [CrossRef]
  24. Rodayan, A.; Majewsky, M.; Yargeau, V. Impact of approach used to determine removal levels of drugs of abuse during wastewater treatment. Sci. Total Environ. 2014, 487, 731–739. [Google Scholar] [CrossRef] [Green Version]
  25. Pessoa, G.P.; de Souza, N.C.; Vidal, C.B.; Alves, J.A.C.; Firmino, P.I.M.; Nascimento, R.F.; dos Santos, A.B. Occurrence and removal of estrogens in Brazilian wastewater treatment plants. Sci. Total Environ. 2014, 490, 288–295. [Google Scholar] [CrossRef]
  26. Abegglen, C.; Siegrist, H. Mikroverunreinigungen aus Kommunalem Abwasser. Verfahren zur Weitergehenden Elimination auf Kläranlagen; Bundesamt für Umwelt: Bern, Switzerland, 2012; Umwelt-Wissen Nr.1214: 210 S; Available online: https://www.bafu.admin.ch/bafu/de/home/themen/wasser/publikationen-studien/publikationen-wasser/mikroverunreinigungen-aus-kommunalem-abwasser.html (accessed on 7 March 2022).
  27. Loos, R.; Carvalho, R.; António, D.C.; Comero, S.; Locoro, G.; Tavazzi, S.; Paracchini, B.; Ghiani, M.; Lettieri, T.; Blaha, L.; et al. EU-wide monitoring survey on emerging polar organic contaminants in wastewater treatment plant effluents. Water Res. 2013, 47, 6475–6487. [Google Scholar] [CrossRef]
  28. Al Aukidy, M.; Verlicchi, P.; Jelic, A.; Petrovic, M.; Barcelò, D. Monitoring release of pharmaceutical compounds: Occurrence and environmental risk assessment of two WWTP effluents and their receiving bodies in the Po Valley, Italy. Sci. Total Environ. 2012, 438, 15–25. [Google Scholar] [CrossRef] [PubMed]
  29. Kosma, C.I.; Lambropoulou, D.A.; Albanis, T.A. Investigation of PPCPs in wastewater treatment plants in Greece: Occurrence, removal and environmental risk assessment. Sci. Total Environ. 2014, 466–467, 421–438. [Google Scholar] [CrossRef] [PubMed]
  30. Kostich, M.S.; Batt, A.L.; Lazorchak, J.M. Concentrations of prioritized pharmaceuticals in effluents from 50 large wastewater treatment plants in the US and implications for risk estimation. Environ. Pollut. 2014, 184, 354–359. [Google Scholar] [CrossRef] [PubMed]
  31. Lajeunesse, A.; Smyth, S.A.; Barclay, K.; Sauvé, S.; Gagnon, C. Distribution of antidepressant residues in wastewater and biosolids following different treatment processes by municipal wastewater treatment plants in Canada. Water Res. 2012, 46, 5600–5612. [Google Scholar] [CrossRef] [PubMed]
  32. Manickum, T.; John, W. Occurrence, fate and environmental risk assessment of endocrine disrupting compounds at the wastewater treatment works in Pietermaritzburg (South Africa). Sci. Total Environ. 2014, 468–469, 584–597. [Google Scholar] [CrossRef]
  33. Snyder, S.A.; Adham, S.; Redding, A.M.; Cannon, F.S. Role of membranes and activated carbon in the removal of endocrine disruptors and pharmaceuticals. Desalination 2007, 202, 156–181. [Google Scholar] [CrossRef]
Figure 1. Amount of PAC needed in order to reach 99% reduction if the concentration of the pharmaceuticals was 1000 ng/L in the wastewater effluents. These pharmaceuticals were measured in the range of 100–1000 ng/L.
Cleantechnol 04 00017 g001
Figure 2. Amount of PAC needed in order to reach 90% reduction of the pharmaceuticals present in the range of 10–100 ng/L in wastewater effluents.
Cleantechnol 04 00017 g002
Figure 3. Amount of PAC needed in order to reach 90% reduction of the pharmaceuticals present in the range of 10–100 ng/L in wastewater effluents.
Cleantechnol 04 00017 g003
Table 1. Experimental setup, including pharmaceutical concentrations and PAC concentrations.
Types of Test BottlesPAC Conc. (g/L)Pharmaceutical Conc. (µg/L)
Blank0.010
Control00.08, 0.4, 2, 10
PAC 100.010.08, 0.4, 2, 10
Table 2. Sorption isotherms obtained during sorption to PAC. Included here is the linear sorption coefficient Kd, Freundlich coefficient and exponent Kf and n, respectively, and for the Langmuir isotherm, the Langmuir coefficients KL and τ represent the total number of surface sites per mass of sorbent.
Linear * Isotherm Freundlich Isotherm Langmuir Isotherm
SubstanceKd
(L/g)
R² (%)Kf
(L/g)
nR² (%)p Value (%)τMAX
(L/g)
KLR² (%)p Value (%)
Alfuzosin5440 **96.86.82 × 1031.0496.860.99.47 × 1066.46 × 10−496.951.2
Alprazolam40679.08.27 × 1043.5394.46.316.91 × 1052.74 × 10−294.46.35
Amitryptiline48285.34.54 × 1042.4596.2<0.011.18 × 1065.60 × 10−395.6<0.01
Atenololno fit 1.14 × 1058.8875.7<0.01no fit
Atracurium34082.14.34 × 1043.0995.7<0.014.49 × 1053.33 × 10−295.6<0.01
Azelastine173088.32.23 × 1041.6794.10.161.41 × 1064.56 × 10−393.80.25
Biperiden30985.05.63 × 1042.8297.0<0.011.00 × 1069.13 × 10−397.4<0.01
Bisoprololno fit 7.86 × 1043.7893.3<0.016.69 × 1051.61 × 10−289.30.07
Buprenorphin67090.33.46 × 1042.2096.80.079.82 × 1059.74 × 10−397.70.01
Bupropionno fit 8.09 × 1043.9296.0<0.016.45 × 1051.97 × 10−294.7<0.01
Carbamazepinno fit 6.80 × 1043.0799.8<0.01no fit
Chloprothixen283094.61.05 × 1041.3096.03.061.69 × 1063.42 × 10−396.12.33
Chlorpromazine689094.92.66 × 1041.3396.52.42.75 × 1065.76 × 10−397.20.41
Cilazapril26572.49.72 × 1043.7297.7<0.018.56 × 1052.30 × 10−298.0<0.01
Citaprolamno fit 4.87 × 1043.2792.6<0.015.19 × 1051.25 × 10−287.30.07
Clemastine76389.82.52 × 1041.9996.3<0.019.81 × 1056.56 × 10−397.1<0.01
Clomipramine105091.22.37 × 1041.8796.7<0.011.04 × 1066.01 × 10−396.7<0.01
Clonazepam54880.37.31 × 1042.9797.4<0.019.03 × 1051.78 × 10−297.00.02
Clotrimazol160092.01.55 × 1041.5595.30.391.35 × 1064.30 × 10−395.90.13
Codeineno fit 4.44 × 1043.2397.0<0.014.92 × 1051.06 × 10−294.70.01
Cyproheptadine42281.84.59 × 1042.5095.3<0.011.13 × 1064.89 × 10−394.3<0.01
Desloratidin52288.73.56 × 1042.3297.0<0.019.34 × 1057.58 × 10−397.1<0.01
Diclofenac64687.94.51 × 1042.3398.20.041.26 × 1064.07 × 10−399.5<0.01
Dicycloverin45889.04.44 × 1042.4497.7<0.011.13 × 1066.93 × 10−397.9<0.01
Diltiazem38275.45.10 × 1043.0392.9<0.015.83 × 1052.33 × 10−391.70.02
Diphenhydramin27271.06.72 × 1043.7798.4<0.015.08 × 1051.78 × 10−293.20.02
Donepezil288092.11.47 × 1041.4295.10.681.25 × 1065.53 × 10−395.00.86
Duloxetin97395.01.14 × 1041.6498.20.57.61 × 1054.32 × 10−398.50.24
Eprosartan37681.27.87 × 1043.2297.2<0.018.96 × 1051.88 × 10−297.9<0.01
Estradiol144088.04.11 × 1042.1097.34.771.05 × 1068.59 × 10−398.32.4
Estrone42491.39.03 × 1031.6995.618.71.07 × 1061.49 × 10−397.09.98
Fentanyl31176.71.06 × 1053.1294.6<0.011.92 × 1066.25 × 10−394.4<0.01
Fexofenadine57281.26.26 × 1042.8795.40.017.88 × 1052.69 × 10−296.8<0.01
Finasteride243094.11.70 × 1041.4897.83.441.70 × 1063.39 × 10−398.31.65
Flecainideno fit 6.88 × 1043.5893.0<0.016.61 × 1051.43 × 10−289.6<0.01
Fluconazoleno fit 7.35 × 1043.5096.1<0.017.66 × 1051.22 × 10−295.6<0.01
Fluoxetin47187.43.15 × 1042.2396.3<0.011.05 × 1064.88 × 10−396.00.01
Flutamid223084.87.07 × 1042.2696.35.491.26 × 1061.39 × 10−297.72.61
Glibenclamide721082.66.34 × 1030.9782.688.81.19 × 1076.66 × 10−482.872.25
Haloperidol243090.62.00 × 1041.5995.60.091.04 × 1067.74 × 10−395.60.09
Hydroxyzine35180.44.00 × 1042.7494.1<0.016.33 × 1051.22 × 10−293.3<0.01
Ibersartan160089.97.04 × 1042.2996.6<0.011.38 × 1062.18 × 10−298.0<0.01
Ibuprofen31084.59.27 × 1031.9191.32.56no fit
Levonogestrel52989.9no fit no fit
Loperamide176091.83.12 × 1041.7496.30.171.85 × 1065.55 × 10−396.60.08
Maprotilin44086.93.08 × 1042.3695.6<0.017.54 × 1057.88 × 10−395.3<0.01
Megestrol195093.72.08 × 1041.6699.51.011.18 × 1064.85 × 10−399.31.56
Memantinno fit 4.52 × 1043.8397.4<0.014.38 × 1054.81 × 10−398.0<0.01
Metoprololno fit 8.21 × 1043.9497.9<0.016.04 × 1051.84 × 10−293.40.11
Mianserin36080.63.58 × 1042.6394.6<0.016.47 × 1058.17 × 10−392.50.02
Naloxonno fit 5.32 × 1043.5196.8<0.015.13 × 1051.85 × 10−298.6<0.01
Nefazodon13,20077.31.23 × 1020.4595.7<0.01
Orphenadrin37485.95.28 × 1042.7497.3<0.019.37 × 1051.13 × 10−298.1<0.01
Oxazepam17884.5no fit no fit
Paroxetin135089.22.79 × 1041.8495.20.211.29 × 1065.88 × 10−395.80.9
Pizotifen41985.63.33 × 1042.4096.2<0.018.20 × 1057.04 × 10−396.1<0.01
Progesteron604096.98.58 × 1031.0897.176.53.73 × 1062.00 × 10−397.558.3
Promethazin 112091.73.75 × 1042.1096.60.339.93 × 1051.38 × 10−297.40.08
Repaglinide609717.54 × 1042.8894.70.081.05 × 1068.92 × 10−391.70.41
Risperidone422094.61.15 × 1041.2495.75.41.99 × 1063.57 × 10−395.75.58
Roxithromycine79988.32.99 × 1042.1196.00.138.80 × 1058.19 × 10−397.10.02
Sertraline103092.01.60 × 1041.6796.00.121.26 × 1063.53 × 10−396.00.1
Sotalolno fit 8.07 × 1044.6498.3<0.014.63 × 1052.00 × 10−292.40.01
Sulfamethoxazol22683.82.99 × 1042.4799.80.59.26 × 1052.21 × 10−399.41.98
Tamoxifen355094.11.05 × 1030.8195.65.25no fit
Terbutalinno fit 1.67 × 1044.4095.9<0.018.83 × 1052.41 × 10−288.4<0.01
Tramadolno fit 6.56 × 1043.8795.7<0.015.59 × 1051.89 × 10−297.3<0.01
Trihexyphenidyl26482.95.86 × 1043.0296.8<0.018.70 × 1051.15 × 10−297.5<0.01
Venlafaxinno fit 1.13 × 1055.5996.7<0.015.11 × 1052.09 × 10−282.90.02
Verapamil212094.21.32 × 1041.4497.20.291.42 × 1063.63 × 10−397.60.1
Zoldipem116087.55.38 × 1042.3496.4<0.011.01 × 1061.90 × 10−297.2<0.01
* Forced through zero. ** The best fitted isotherm of linear, Freundlich and Langmuir for the pharmaceuticals studied are shown in bold. Further, the significance (p) shows that the linear model has a better fit than the other models tested.
Table 3. Pharmaceuticals divided into groups based on their concentrations in Swedish wastewater effluents [4], and the desired level of reduction for each group to reach the target concentration.
Conc:1–10 ng/L10–100 ng/L100–1000 ng/L
Preferred reduction0%90%99%
Pharmaceuticalsestrone desloratadine atenolol
glibenclamideestradiol carbamazepine
risperidonfluoxetinecodeine
zoldipemprogesteronecitalopram
sertraline
terbutaline
diclofenac ibuprofen
atenolol
metoprolol
oxazepam
tramadol
Publisher’s Note: MDPI stays neutral with regard to jurisdictional claims in published maps and institutional affiliations.

