
Plasma Energy Loss by Cathode Heat Conduction in a Vacuum Arc: Cathode Effective Voltage
Department of Physical Electronics, School of Electrical Engineering, Faculty of Engineering, Tel Aviv University, Tel Aviv 69978, Israel
Plasma 2023, 6(3), 492-502; https://doi.org/10.3390/plasma6030034
Submission received: 21 June 2023
/
Revised: 5 August 2023
/
Accepted: 9 August 2023
/
Published: 11 August 2023
(This article belongs to the Special Issue Feature Papers in Plasma Sciences 2023)
Abstract
:The importance of understanding the energy loss specifics by the cathode for vacuum arc metallic plasma generation and its applications were emphasized. To this end, the heat conduction losses per unit current were characterized by the cathode effective voltage uef, which is weakly dependent on the current. In this paper, a physical model and a mathematical approach were developed to describe the energy dissipation due to heat conduction in the cathode body, which is heated by energy outflowed from the adjacent plasma. The arc plasma generation was considered by taking into account the kinetics of the heavy particle fluxes in the non-equilibrium layer near the vaporizing surface. The phenomena of electric sheath, heat and mass transfer at the cathode were taken into account. The self-consistent numerical analysis was performed with a system of equations for a copper cathode spot. The transient analysis starts from the spot initiation, modeled by the plasma arising at the initial time determined by the kind of arc triggering, up to spot development. The results of the calculations show that the cathode effective voltage uef is determined by the cathode temperature as a function of spot time. The calculated evolution of the voltage uef shows that the steady state of uef is approximately 7 V, and it is reached when the cathode temperature reaches a steady state at approximately one microsecond. This essential result provides an explanation for the good agreement with the experimental cathode effective voltage (6–8 V) measured for the arc duration from one millisecond up to a few seconds.
1. Introduction
Due to the large number of vacuum arc metallic plasma applications (microelectronic, thin film deposition, electromagnetic acceleration, space, etc. [1,2,3,4]), the study of the existing arc mechanisms is timely and important. In contrast to the different types of electrical discharges, the vacuum arc occurs at considerable currents of ~1 A and significantly more with a relatively large power density concentrating at minute areas on the cathode surface, named cathode spots. The large power density is required in order to significantly heat the local cathode to temperatures high enough for the generation of a conductive plasma in the vacuum gap by intense cathode evaporation, electron emission and metallic vapor ionization.
Different approaches are presented in the literature to describe the mechanism of spot operation. One of them takes into account the phenomenon of explosive electron emission (EEE) to explain the mechanism of cathode spot existence. The description used arbitrary input parameters (crater or protrusion size, etc.) and was based on comparing the EEE measured data with the experiments in cathodic arcs [5] in terms of the observed arc voltage fluctuation, craters and plasma expansion velocity. Such comparison is possible but not enough to use the EEE mechanism. To support the EEE, each spot initiation demands a current density of 109 A/cm2 before its initiation and a rate of current rise of 109 A/s during the EEE lifetime of approximately 1 ns. These parameters can be obtained under the relatively high electrical field of ~108 V/cm, which might be difficult to realize in developed arcs. This is due to the small Debye radius (~0.01 µm) relative to the size of irregularities (~1 µm) at the cathode surface and relatively low ion current density that determines the volume charge in the space charge layer. At the required ion current of 107 A/cm2 and higher, the cathode (or the liquid-metal jet occurred by the plasma pressure) is intensely heated and evaporated by ion bombardment (i.e. not by Joule heating), and cathode plasma is generated to support the spot operation without any explosions, i.e., EEE phenomenon.
We would like to mention recent studies in which the cathode-spot crater formation and droplets phenomena have been calculated in 2D [6] and 3D [7] approximation. While those numerical simulations were conducted using the energy flux density, current density and pressure as the input parameters, useful results were obtained in terms of the shape of the cathode-spot crater and the temperature, velocity, potential and current density distributions dependence on time. The cathode heating and vaporization mechanisms of the plasma flow were formulated in the last few decades using the gas dynamics and kinetic approaches without any arbitrary parameters; the results are summarized in the recent book [8], and this study is based on those approaches. In addition, it is reasonable to cite Miller’s last review of the state of cathode spot theories [9].
One of the important arc characteristics of the cathode energy balance is the power loss by the heat conduction in the cathode bulk. The ratio of the heat power by heat conduction (in Watt) to the arc current is named the equivalent or cathode effective voltage uef. The significance of this parameter is due to the fact that it characterizes the heat condition of different spot types that affect the rate of cathode erosion and spot appearance depending on the time of arc development and cathode geometry. In particular, the uef for the film cathode is significantly lower than for the bulk cathode [10].
The measurements of heat losses and the effective voltages in bulk cathodes were conducted with different methods. A detailed review has been presented in [8]. Let us consider the data mainly for Cu cathodes in order to understand the state of the problem and formulate the goal of the present study. Reece [11] used a calorimetric method and temperature measuring with thermocouples in both the cathode and anode to determine the energy input into the electrodes of a vacuum arc. The effective voltage drops were defined as the ratio between the energy dissipated in the electrodes and the discharge current, considering that the low energy loss to the surroundings can be neglected. It was indicated that, at an arc current of 30 A, the arc voltage for Cu could be divided into an effective cathode voltage drop of 8 V and an effective anode voltage drop of 13 V.
Rondeel [12] studied copper electrodes of 20 mm diameter with an interelectrode distance of approximately 5 mm and a cylindrical shield outside the electrodes. The arc duration was between 20 and 30 ms at a current of approximately 500 A. The influence of the axial magnetic field on the electrode effective voltage was tested. The energy input to both the electrodes and to the shield was determined by the temperature rise, which was measured with three copper–constantan thermocouples mounted on resistive components. The results showed that the effective voltage increased from approximately 4 V (cathode) and 10 V (anode) at a zero magnetic field to approximately 8 V (cathode) and 15 V (anode) at a field of 0.35 T. The effective voltage due to energy loss to the shield was approximately 2 V.
Daalder [13,14] considered the cathode thermal state of a vacuum arc. He measured the accumulated heat in a cathode constructed of a thin disc with a diameter of 30 mm during the arcing. The cathode was mounted on small holders to minimize the heat conduction losses. The cathode surface was cleaned carefully. At the time of 200 s after arc extinguishment, the temperature of the rear surface of the cathode was measured with thermocouples of iron–constantan. The temperature measurements were conducted for arc time tarc, which varied from a few milliseconds to a maximum of half a second. Assuming that the heat conduction and radiation losses were small, the measured maximum temperature Tm was used to determine the accumulated heat as Wcon = mdcpTm, where md is the disc mass, and cp is the specific heat of the disc materials. The cathode effective voltage uef was obtained with the following equation:
The range of the arc current I was chosen for values that one and several cathode spots appeared. Most measurements were taken at an electrode spacing of 1 mm. The observations showed no dependency on the gap distance because the cathode heating occurred in the vicinity of the surface in the spot. The results show that uef only weakly increases with the arc current. This increase is due to the increase in arc voltage with current, which can be up to a volt in a current range from approximately I = 10 A up to several hundreds of amperes. This increase is particularly noticeable in the transition region of one to a few cathode spots. For Cu, it was found that the cathode effective voltage was 5.4 V at I = 40 A and 6.2 V at I = 100 A (Table 1 of Ref. [13]).
A theoretical study [15] showed an agreement of the calculation results with Daalder’s [13] experimental data using the cathode spot theory of Beilis [16], which described the plasma flow in the near-cathode region using a hydrodynamic approach and the cathode heating by ion flux bombardment. Using this theoretical model previously, an analysis of different components of the cathode energy balance indicated that uef = 8 V [17].
Experiments of long-duration vacuum arcs with refractory cathodes are a useful approach to investigate the cathode effective voltage. Such arcs start between the planar surfaces of cylindrical electrodes as a conventional cathode spot vacuum arc. With time, the cathodic plasma jet deposits a film on the cathode material on the anode; simultaneously, the anode is heated by the plasma jet energy. When the thermally isolated anode reaches a sufficiently high temperature, the previously deposited material is re-evaporated and subsequently ionized, and the generated plasma fills the interelectrode gap. The arc is named a hot refractory anode vacuum arc (HRAVA). Rosenthal et al. [18] studied the heat transfer to a thermally isolated graphite anode in a 200 s HRAVA for currents of 175 and 340 A. The effective cathode voltage was determined for copper by measuring the temperature of the cathode cooling water during time Δt. The net power input to the cathode was determined as
where cw is the heat capacity of water, F is the mass flow rate of the cooling water, and ΔT is the increase in the cooling water temperature at the exit port from the cathode. In the case of a 175 A arc with a mass flow rate of 36.5 g/s, the temperature near the beginning of the arc rapidly increased to approximately 8 °C above the ambient water temperature, reaching a value of 8.4 °C near the end of the arc. Using expression (2), the effective cathode voltage was calculated as uef = Ww/I, which was determined to be 6.6 V near the beginning of the arc and 7.2 V near the end of the arc. Similar results were obtained for I = 340 A. At a steady state HRAVA, the anode effective voltage was approximately 6 V.
Another configuration of a vacuum arc with a refractory anode consists of a water-cooled cylindrical cathode and a cup-shaped W or Ta anode that form a closed volume [19]. The gap between the front cathode surface and the inside flat anode surface was approximately 10 mm. Such an arc with a closed electrode configuration is a vacuum arc with a black body assembly (VABBA). After arc initiation, the cathode plasma jet is deposited on and heats the anode. At the hot anode stage, the plasma is ejected through an array of 250 holes of 1 mm diameter in the W anode or through a single 4 mm diameter hole in the Ta anode. The arc currents were I = 175–250 A, and the arc time was 150 s. The effective cathode voltage was determined calorimetrically using a chromel–alumel thermocouple probe by measuring the temperature increase of the cooling water flowing from the cathode relative to the water entering the cathode. One of the thermocouple junctions directly contacted the water, while the other junction remained outside the water. The method details of the measurements can be obtained considering the previous description in [19]. The water mass flow rate was F = 0.193 or 0.290 kg/s. The effective cathode voltage was determined as:
where ΔT is the temperature difference between the output and input cathode cooling water. The measured time-dependent uef using a W shower-head anode with I = 200 A and a Ta one-hole anode with I = 175 A shows that, when the arc was ignited, the uef increased to 6–7 V, where it remained for ~40 s (both anodes), while the anodes were relatively cold. For the hot anodes, the uef increased up to ~11–12 V and reached a steady state. The experiments showed a similar dependence of uef on time for different arc currents, while the average steady state uef weakly increased by a few tenths of a volt, depending on F and the anode material, when I increased from 175 to 250 A. According to the experiment in [8], the calorimetric time dependence indicates that the measurements at the initial stage (up to 40 s) were related to the effective cathode voltage of uef = 6–7 V, which agrees with such measurements in the conventional cathodic arc [13]. However, the further increasing of the heat losses in the cathode up to the steady state ~11–12 V is caused by the part of the cathode plasma jet energy dissipated in the relatively dense plasma at the anode hot stage and returned back to the cathode surface because the cathode–anode assembly is closed in the VABBA.
The above literature overview shows that the published experimental data (uef = 6–8 V) are related to the measurements mainly for the long-arc existing time, namely from one millisecond up to a few seconds and more. The following question can be asked: how does the value of uef vary during the transition period of the spot development? There is no experimental data that characterizes the energy loss due to cathode heat conduction at the spot initiation and its development. In addition, any theoretical description of the losses due to the heat conduction as a dependence on time is absent. Therefore, the main goal of the present paper is to fill this gap using the previously published kinetic model for unsteady spots [20] and develop a calculation approach allowing for the analysis of the numerical behavior of the spot transition from the arc initiation up to the steady state in case when this state can reached in unstable vacuum arc.
2. Physical Model and Calculation Approach
2.1. Kinetic Model
In order to study the cathode energy loss, it is important to understand and describe the essence of cathode plasma generation. A vacuum arc is a discharge arising in the electrode vapor in which the plasma is produced. Therefore, the physical model takes into account the kinetics of the cathode evaporation, particle jump at the surface and presence of multi-charged ions. The kinetic approach to study the plasma generation and plasma flow during the cathode evaporation into the dense plasma of the vacuum arc was first developed in 1982 [21]. The main advantage of this approach is that it allows for the direct capture of the cathode potential drop uc, energy fluxes and the cathode erosion rate G. Below, the model is described briefly. The details of the kinetic theory for cathode vaporization and plasma generation in the spot were summarized recently in [8].
According to the model, the ionized vapor structure near the cathode surface consists of several partially overlapping physical regions separated by characteristic boundaries with corresponding gas dynamic parameters, temperature T, density n and velocity v (Figure 1). The cathode region includes a ballistic region comprised of a space charge sheath located between the cathode surface (boundary 1) and the external boundary (2) of the sheath, and a non-equilibrium Knudsen plasma layer located between boundary 1 and the external boundary of the Knudsen layer 3.
A strong electric field is present within the ballistic zone, where the emitted electrons are accelerated, and the energy relaxation of the beam occurs in the region with boundary 4, after which plasma expands until the anode. The equilibrium for heavy particles n0 and electron ne0 densities was determined by the cathode spot temperature Ts. Two heavy particle fluxes (evaporated and returned) are formed in the Knudsen region. The difference between these fluxes determines the plasma velocity v3 at boundary 3 and the net rate of the mass evaporation. In the electron beam relaxation region, the atoms are ionized by the electrons emitted from the cathode as well as by the plasma electrons, which were heated during the electron beam relaxation. The presence of multiple ionizations of the evaporated atoms is determined by the level of the electron temperature.
The physics of the kinetic approach consist of the consideration of the electron emission as an evaporation process together with the atom vaporization following atom ionization. This allows for the determination of the plasma velocity v3 at boundary 3 of the Knudsen layer by using the quasineutrality condition. This feature of the model distinguishes it from the model of the evaporation of neutral atoms during laser irradiation of metals with moderate power, in which it is required to set the speed of sound at the Knudsen boundary [22]. At the sheath boundary 2, the plasma electrons are returned to the cathode, while the ions and emitted electrons are accelerated with energy determined by the cathode potential drop euc. The charge particle motion and their generation due to high power dissipation are coupled self-consistently with the potential barrier. Therefore, the corresponding height of the barrier, i.e., uc, as well as the energy fluxes from the plasma to the cathode surface can be obtained by studying the equations expressing the energy and momentum conservation laws of charge particle fluxes at the above-mentioned boundaries, including the Knudsen layer and the space charge layer.
2.2. Calculation Approach and Procedure
The methodology for calculating the non-stationary spot parameters was described previously [20]. The main condition for arc initiation in a vacuum is the presence of an initial plasma, which can arise due to different triggering kinds of the electrical discharge in the electrode gap. Depending on the initiating kind (short breakdown pulse, long contact method or post plasma), the initial plasma plume has a different but limited lifetime τ. Obviously, for certain initiating plasma parameters, the plasma density and heat flux to the cathode during a lifetime τ could support the future spot development. As the initiating plasma parameters should be self-consistent, the parameters of this plasma were calculated from the cathode spot model assuming that the heat flux is constant during a small time τ, which was chosen with respect to the kind of triggering.
The transient thermal model takes into account that the plasma plume and, consequently, the heating are concentrated on the cathode surface. According to the calculation method, the solution of the time-dependent heat conduction equation for a solid body heated with a concentrated heat source was taken in general form [20]:
where T(t) is the time-dependent cathode temperature in the spot, QT(T,t′) is the time-dependent heat flux dissipated in the cathode (in Watt), T00 is the surface temperature before spot initiation, f(t′,t0) is a time-dependent function resulting from integrating the heat conduction equation in differential form, and t0(a,r0) is a parameter that indicates the heat flux concentration. This parameter is determined by the thermal diffusivity coefficient a and by the spot radius r0 = I/πj, where j is the current density [8]. Equation (4) is the relationship between the transient temperature and heat conduction energy losses that, at a certain time, is determined by the cathode energy balance [23]. Using energy balance with Equation (4) in the system of equations that described the cathode plasma phenomena, the dynamics of the plasma parameters were calculated as a dependence on time. These parameters were used to determine the following time-dependent characteristics: the energy flux from the plasma (dependent on uc) to the cathode surface Q(T,t), the heat conduction loss in the cathode QT(T,t) and spot temperature T(t), paying attention that QT(t) was mutually determined by the character of transient T(t).
The temperature T(t) and QT(T,t) appeared as implicit parameters in the system of equations due to the non-linear effects of the cathode and plasma phenomena in the spot. Therefore, the cathode plasma system of equations was solved numerically using an iteration method at each time step with a duration of ∆t including integration of Equation (4). In this case, the solution of the cathode system of equations will determine the dependences QT(Tn,t) and f(t′,t0)n for moment t(n) time and, consequently, the temperature Tn(t). The temperature growth is due to its gain by ∆T at each next step ∆t, i.e., Tn(t) = Tn−1(t) + ∆T. These time-dependent values were also used for calculation of the heat conduction flux QT(Tn(t),∆t), which is necessary to increase the temperature from value Tn−1(t) to Tn(t). The initial triggered time τ was served as the first time step to determine the initial plasma parameters, which was used to reproduce a secondary plasma at the next step time ∆t by calculation of the self-consistent system of equations. This procedure was continued for each n-time step. A relatively small ∆t was chosen for the mentioned calculation so that the calculated heat conduction loss could be considered as a constant for simplicity of the integration of Equation (4) during each step ∆t. The solution continued up to time t = τ + n∆t for which the values QT(Tn,t), QT(Tn(t),∆t) and T(t) as well as the cathode plasma parameters, as one of possible, can achieved a steady state.
3. Calculated Results
The calculations were conducted for a Cu cathode due to the abundance of Cu experimental data. The equations for the kinetic model for the cathode with the Equation (4) were supplemented with equations for cathode electron emission, the electric field at the cathode surface E, Saha’s system of equations and the saturated pressure at the cathode temperature in order to obtain a complete system of equations. The unknown parameters are cathode temperature Ts and plasma electron temperature Te, heavy-particle density n0, degree of ionization α, current density j, fraction of electron current s, electrode erosion rate and potential drop at the cathode uc. The system of equations used was recently described in detail in Chapter 17 of book [8]. The spot current was chosen as I = 10 A, the current for the fragments when the group spot was observed as I > 100 A [6], and τ = 7.5, 50 and 100 ns—modeling the arc triggering time. The cathode effective voltage was obtained using the above-mentioned parameters and according to the definition by calculation uef(t) = QT(Tn,t)/I at each n-time step and a step effective voltage ust(t) = QT(Tn(t),∆t)/I, which was determined by the difference Tn(t) − Tn−1(t) during the time step ∆t.
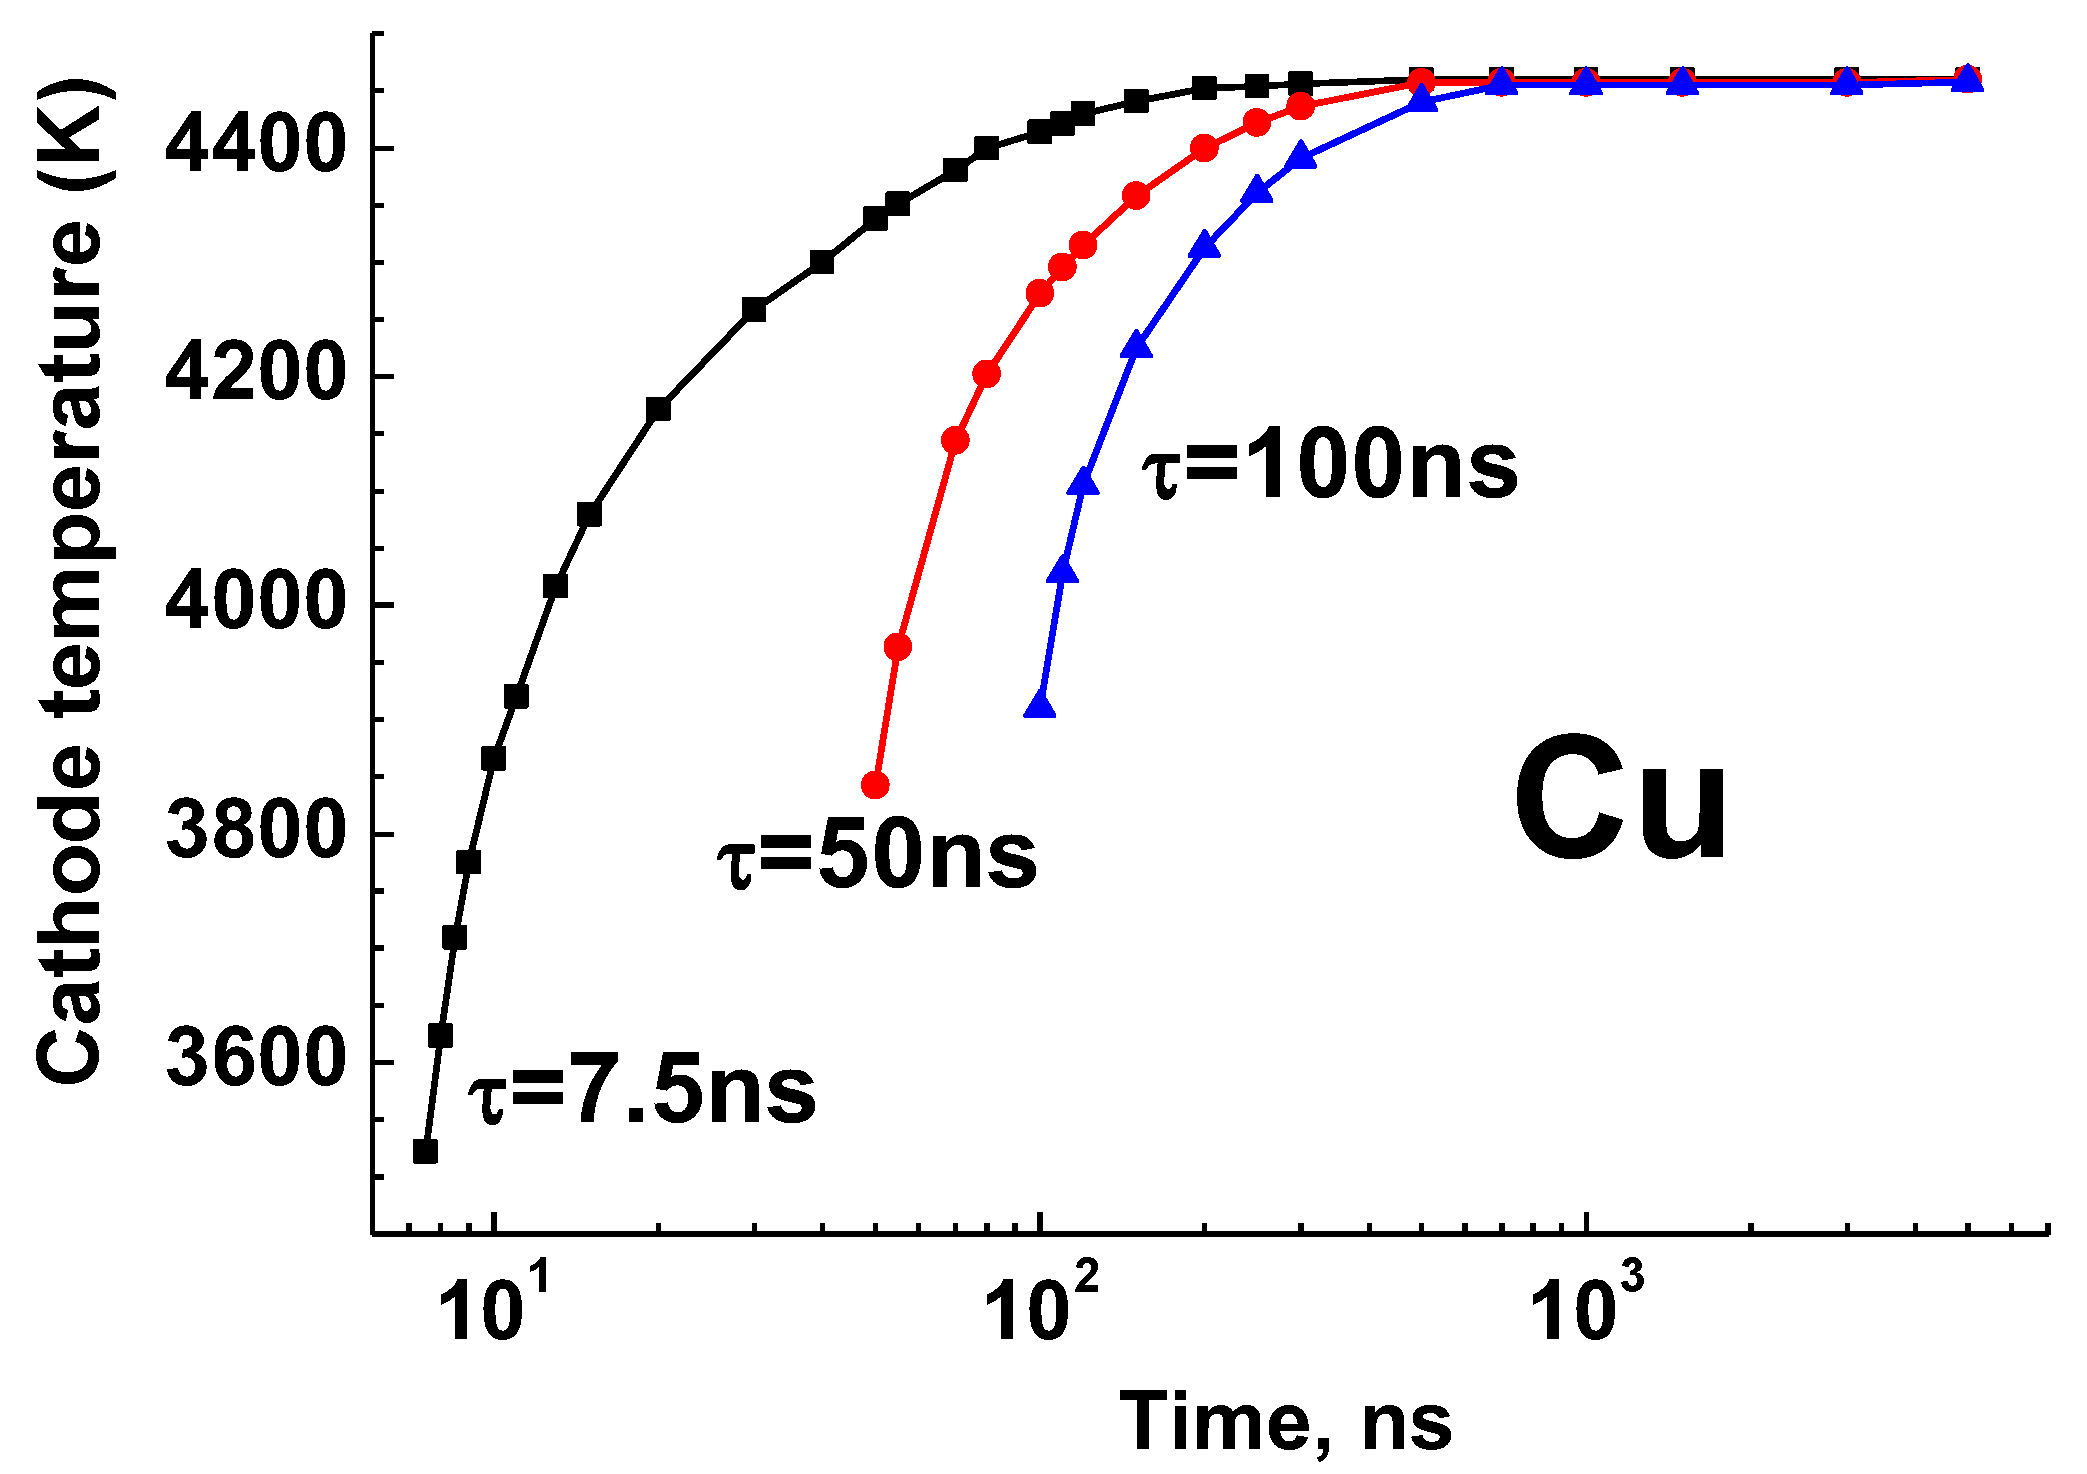
Behavior of the time-dependent cathode spot temperature Ts is an important parameter to describe the time behavior of the effective voltages. The calculated Ts as a function of time with τ as the parameter is illustrated in Figure 2. It can be observed that the cathode temperature increased from some initial value depending on τ to a steady state temperature that did not depend on τ, i.e., on the initial conditions. The initial cathode temperature increased with τ.
The time-dependent functions of the step effective voltage ust(t) for different τ are presented in Figure 3. This result shows that the larger ust ~ 70 V was calculated at the initial step with minimal τ = 7.5 ns, and the value of ust significantly decreased at the initial steps for lower trigger times to 18 V and 16 V at τ = 50 ns and 100 ns, respectively. It is noteworthy that the effective voltage at each step decreased with time and tended to zero at the steady state, which occurred from 0.1 to 0.5 µs depending on τ.
Figure 4 illustrates the decrease in the cathode effective voltage with time from a maximal value depending on τ. The largest values of uef are approximately 65, 20 and 16 at τ = 7.5, 50 and 100 ns, respectively. While at τ = 7.5 ns, the uef decreased monotonically, for τ = 50 and 100 ns, a small maximum arose at the beginning of the spot development. It can be observed that uef decreased with time asymptotically to the steady state value of approximately 7 V, which did not depend on the initial step τ. The steady state uef was reached at approximately 2–3 µs.
Let us discuss the relationship of the other spot parameters for different spot time initiations τ and time t = 1 µs, which are presented in Table 1. The listed parameters are defined above and, in addition, dimensionless density n30 =n3/n0 and dimensionless velocity b3 = v3/vT (vT is the thermal velocity) at the Knudsen boundary 3. The data suggest that uc strongly changes, while the current density remains mostly constant. This result follows from the kinetic model, which examines the role of the arc voltage at the moment of arc initiation and spot development. It can be observed that, when the cathode potential drop is self-consistently calculated, the spot temperature and the current density do not unlimitedly increase with time, as in the case of calculation models in which a constant uc or arc voltage was assumed [1].
The spot radius in the present model (planar cathode with a smooth surface and a passive anode as the collector of electron current) is approximately 10 µm. Note that this size can be changed when a new spot arises on a rough surface with protrusions or impurity films [10]. Some of the calculated data with variations in the parameters of the problem was discussed in recent book [8]. The density at the boundary of the Knudsen layer reached n30 = 0.67, whereas this ratio is 0.31 when the metal target evaporated in the vacuum with laser-moderated power (with free flow, i.e., with sound speed at the Knudsen layer) [22,24]. This result as well as the calculated velocity b3 = 0.17 indicate that the plasma flow in the cathode spot is not free.
4. Discussions
Let us consider the specificity of the results obtained with the above-described numerical approach. The spot development was studied using an initial plasma density at the cathode surface produced by triggering a vacuum gap during 7 ns (breakdown) and 50 ns, 100 ns (contact with the third electrode) [25,26]. The obtained non-stationary behavior (previously unknown) of the heat conduction energy loss in the cathode body can be explained by the transient regime of two energy features calculated in time from an initial value up to the steady state. First is the energy loss in the cathode (characterized by the step effective voltage ust) caused by temperature growth arising during a calculated time step after reaching a cathode surface temperature Tn(t) at time t. Second is the total cathode energy loss at time t that is calculated using the time-dependent cathode surface temperature, which is characterized by the cathode effective voltage uef.
The behavior of the calculated time-dependent ust and uef is different for each τ, and these values were initially significantly larger for τ = 7.5 ns than for τ = 50 and 100 ns. In order to understand the time behavior of ust and uef, we refer to the larger calculated cathode potential drop uc ~ 100 V obtained at the initial step with minimal τ = 7.5 ns. The drop uc significantly decreased with τ as well as with time to a steady state value that agreed with the experimental data. Therefore, the time behavior of ust and uef can be explained by taking into account their dependence on uc influenced in time through the cathode energy balance. In addition, for lower τ, the time step is very small in comparison with the time step for larger τ. As the time step is significantly small, a relatively large energy flux to the cathode is needed, according to the heat conduction equation, to reach the required cathode temperature. The required certain temperature is necessary to obtain a required cathode plasma density, which at self-consistent calculations can be supported by a relatively high uc and, as result, high ust and uef.
The calculated sharp growth of the cathode temperature at the initial time (Figure 2) that tended to saturation with time can be understood by considering the gain ∆T of the temperature at the next step relative to the previous step (see Section 2.2). At each step time, the temperature serves as an initial value to calculate the temperature gain ∆T, taking into account the total spot time t, which increases with each new step. As the spot time t increases, the gain ∆T decreases due to the heat power decrease at each next step determined by the integral of function f(t,t0) in the heat conduction Equation (4) and by the decrease of uc. At some relatively large spot time t, the calculated cathode temperature Ts and the stepwise heat power reach values at which the ust and uef weakly change with spot time by reaching a steady state.
When the cathode temperature approached a steady state, the temperature difference Tn(t) − Tn−1(t) → 0. This trend of temperature change explains the calculated step effective voltage approaching ust → 0 when ust reaches a steady state. The uef evolution is time-dependent, and it is coupled to the cathode temperature evolution. As such, it is obvious that uef reaches a constant value because the temperature also reaches a steady state. According to the calculations, the uef reaches a steady state at a spot time of approximately one microsecond. This result can explain the good agreement with the experiment for which the cathode effective voltage (6–8 V) was measured for different times but always for a relatively large arc duration (see data in Introduction). The presence of a small peak of uef near the starting time can be caused (considering the calculated plasma parameters during the step time) by different time dependence of the cathode temperature and of an integral of the function f(t′,t0) in Equation (4).
Finally, it should be noted that the present study was performed for the case of the most cited Cu cathode [27,28,29] in order to demonstrate the ability of the developed kinetic model to describe the experimental data in the vacuum arcs. Regarding the measurements for other cathode materials, a preliminary estimation shows that an agreement between the calculated and measured data for cathode materials Ag, Al and Ni (indicated in Table 1 of Ref. [13]) can be reached similarly to the Cu cathode. For low melting materials, like Sn and Pb (low uef = 2–3 V), and for refractory materials like W and Mo (high uef = 9 V), the measured data can be explained by respectively relatively low and high cathode temperatures estimated in the developed cathode spot appearing on these materials. However, a detailed study of the transient phenomena from spot initiation to its development requires numerous and complicated calculations that are the subject for a separate study. Note that the relatively large measured energy loss by heat conduction in a cathode bulk cannot be explained with the EEE model due to the significantly lower energy loss needed for the explosion part of a spike or protrusion on the surface, which was discussed by study phenomena in film cathodes [10,30].
5. Conclusions
The physical model and mathematical approach developed in the present paper describe the self-consistent phenomena of the cathode heat-mass transfer that determines the heat conduction losses in the body. The model advance consists of considering the transient spot phenomena, including the kinetics of cathode vaporization, vapor ionization and the mechanism of the plasma generation using initial plasma, that arise by different triggering times τ. The main calculated results can be summarized as follows:
- The step energy loss by heat conduction of the cathode body is determined by the cathode energy needed to increase the cathode temperature from value Tn−1(t) to Tn(t) during step time ∆t and characterized by the effective voltage ust. The time-dependent functions of ust(t) decrease from large values (70, 18 and 16 V) depending on τ to zero due to Tn(t) − Tn−1(t) → 0.
- The transient cathode energy loss is determined by the cathode energy needed to increase the cathode spot temperature at each n-step and characterized by the time-dependent effective voltage uef.
- The time-dependent functions of uef(t) decrease from the largest values (65, 20 and 16) depending on τ to a steady state value due to the steady state of the cathode temperature.
- The predicted cathode effective voltage agrees well with the existing experimental data obtained in a range of arcing from one millisecond to a few seconds and more. This agreement is explained by the calculated cathode surface temperature that reaches a steady state value at approximately 0.1 to 0.5 µs, depending on the time of the arc or spot triggering τ.
Funding
This research received no external funding.
Institutional Review Board Statement
Not applicable.
Informed Consent Statement
Not applicable.
Data Availability Statement
Not applicable.
Conflicts of Interest
The author declares no conflict of interest.
References
- Handbook of Vacuum Arc Science and Technology; Boxman, R.L.; Martin, P.J.; Sander, D.M. (Eds.) Noyes Publisher: Park Ridge, NJ, USA, 1995. [Google Scholar]
- Anders, A. Cathodic Arcs: From Fractal Spots to Energetic Condensation; Springer: Berlin/Heidelberg, Germany, 2008. [Google Scholar]
- Cai, X.; Tan, S.; Lu, J.; Zhang, X.; Guo, Y. Research on active arc-ignition technology as a possible residual-energy-release strategy in electromagnetic rail launch. Plasma Sci. Technol. 2021, 23, 085508. [Google Scholar] [CrossRef]
- Zolotukhin, D.B.; Daniels, K.P.; Brieda, L.; Keidar, M. Onset of the magnetized arc and its effect on the momentum of a low-power two-stage pulsed magneto-plasma-dynamic thruster. Phys. Rev. 2020, 102, 021203. [Google Scholar] [CrossRef] [PubMed]
- Litvinov, E.A.; Mesyats, G.A.; Proskurovski, D.I. Field emission and explosive electron emission processes in vacuum discharges. Sov. Phys. Uspekhi 1983, 26, 138–159. [Google Scholar] [CrossRef]
- Zhang, X.; Wang, L.; Jia, S.; Shmelev, D.L. Modeling of Cathode Spot Crater Formation and Development in Vacuum Arc. J. Phys. D Appl. Phys. 2017, 50, 455203. [Google Scholar] [CrossRef]
- Wang, L.; Zhang, X.; Li, J.; Luo, M.; Jia, S. Study of cathode-spot crater and droplet formation in a vacuum arc. J. Phys. D Appl. Phys. 2021, 54, 215202. [Google Scholar] [CrossRef]
- Beilis, I.I. Plasma and Spot Phenomena in Electrical Arcs; Springer Nature Switzerland AG: Basel, Switzerland, 2020; Volumes 1 and 2. [Google Scholar]
- Miller, H.C. Vacuum Arcs. IEEE Trans. Plasma Sci. 2023, in press. [Google Scholar] [CrossRef]
- Beilis, I.I. Arc Spot on Film Cathode Using Kinetic Approach of Plasma Flow. IEEE Trans. Plasma Sci. 2022, 50(Pt. 2), 2714–2719. [Google Scholar] [CrossRef]
- Reece, M.P. The Vacuum Switch. Part I: Properties of the Vacuum Arc. Proc. IEE 1963, 110, 793–802. [Google Scholar] [CrossRef]
- Foosnaes, J.; Rondeel, W.G.J. The energy balance of a vacuum arc in an axial magnetic field. In Proceedings of the VIIth International Symposium Discharges & Electrical Insulation Vacuum, Novosibirsk, Russia, August 1976; pp. 312–316. [Google Scholar]
- Daalder, J.E. Energy dissipation in the cathode of a vacuum arc. J. Phys. D Appl. Phys. 1977, 10, 2225–2254. [Google Scholar] [CrossRef]
- Daalder, J.E. A cathode spot model and its energy balance for metal vapor arcs. J. Phys. D Appl. Phys. 1978, 11, 1667–1682. [Google Scholar] [CrossRef]
- Zektser, M.P.; Lyubimov, G.A. Electrode heating by the cathode spot of a vacuum arc. J. Phys. D Appl. Phys. 1979, 12, 761–763. [Google Scholar]
- Beilis, I.I. Analysis of the cathode spots in a vacuum arc. Sov. Phys.-Tech. Phys. 1974, 19, 251–256. [Google Scholar]
- Beilis, I.I. Cathode spots on metallic electrode of a vacuum arc. High Temp. 1977, 15, 818–824. [Google Scholar]
- Rosenthal, H.; Beilis, I.I.; Goldsmith, S.; Boxman, R.L. Heat fluxes during the development of hot anode vacuum arc. J. Phys. D Appl. Phys. 1995, 28, 353–363. [Google Scholar] [CrossRef]
- Beilis, I.I.; Koulik, Y.; Boxman, R.L. Effective Cathode Voltage in a Vacuum Arc with a Black Body Electrode Configuration. IEEE Trans. Plasma Sci. 2013, 41 (Pt. II), 1992–1995. [Google Scholar] [CrossRef]
- Beilis, I.I. Cathode Spot Development on a Bulk Cathode in a Vacuum Arc. IEEE Trans. Plasma Sci. 2013, 41 (Pt. II), 1979–1986. [Google Scholar] [CrossRef]
- Beilis, I.I. On the theory of erosion processes in the cathode region of an arc discharge. Sov. Phys. Dokl. 1982, 27, 150–152. [Google Scholar]
- Anisimov, S.I. Vaporization of metal absorbing laser radiation. J. Experim. Theor. Phys. 1968, 27, 182–183. [Google Scholar]
- Beilis, I.I. The Vacuum Arc Cathode Spot and Plasma Jet: Physical Model and Mathematical description. Contrib. Plasma Phys. 2003, 43, 224–236. [Google Scholar] [CrossRef]
- Anisimov, S.I.; Imas, Y.A.; Romanov, S.G.; Khodyko, Y.V. Action of High Power Radiation on Metals; National Technical Information Service: Springerfield, VA, USA, 1971. [Google Scholar]
- Lafferty, J.M. Triggered vacuum gaps. Proc. IEEE 1966, 54, 23–32. [Google Scholar] [CrossRef]
- Boxman, R.L. Triggering mechanisms in triggered vacuum gaps, IEEE Trans. Electron Devices 1977, 24, 122–128. [Google Scholar] [CrossRef]
- Hantzsche, E. On the heat sources of the arc cathode spot. Beiträge Plasma Phys. 1979, 19, 59–79. [Google Scholar] [CrossRef]
- Mungkung, N.; Morimiya, O.; Kamikawaj, T. An Analysis of the Instability Phenomena of a Low-Current Vacuum Arc for Copper Cathodes. IEEE Trans. Plasma Sci. 2003, 31, 963–967. [Google Scholar] [CrossRef]
- Djakov, B.E.; Holmes, R. Cathode spot structure and dynamics in low-current vacuum arcs. J. Phys. D Appl. Phys. 1974, 7, 569–580. [Google Scholar] [CrossRef]
- Grakov, V.E. Cathode fall in vacuum arcs with depostied cathodes. Sov. Phys. Tech. Phys. 1967, 12, 1248–1250. [Google Scholar]
Figure 1.
Schematic presentation of the physical regions according to the kinetic model of the cathode spot. The numbers indicate the boundaries of the regions.
Figure 1.
Schematic presentation of the physical regions according to the kinetic model of the cathode spot. The numbers indicate the boundaries of the regions.

Figure 2.
Cathode spot temperature Ts as a function of time with τ as the parameter, I = 10 A.

Figure 3.
Step effective voltage characterizing the energy needed to increase the cathode temperature from value Tn−1(t) to Tn(t) during step time ∆t with τ as the parameter, I = 10 A.
Figure 3.
Step effective voltage characterizing the energy needed to increase the cathode temperature from value Tn−1(t) to Tn(t) during step time ∆t with τ as the parameter, I = 10 A.

Figure 4.
Cathode effective voltage uef characterized the heat conduction loss in the cathode body at the steady state temperature with τ as the parameter, I = 10 A.
Figure 4.
Cathode effective voltage uef characterized the heat conduction loss in the cathode body at the steady state temperature with τ as the parameter, I = 10 A.


Table 1.
Plasma parameters at spot initiation times determined with different mechanisms and at spot development time of 1 µs.
Table 1.
Plasma parameters at spot initiation times determined with different mechanisms and at spot development time of 1 µs.
| Time | uc V | n0 × 1020 cm−3 | j × 106 c A/cm2 | Te eV | E × 107 V | s | n30 | b3 |
|---|---|---|---|---|---|---|---|---|
| τ = 7.5 ns | 100 | 0.38 | 2 | 9 | 3 | 0.75 | 0.48 | 0.46 |
| τ = 50 ns | 47 | 0.87 | 2.2 | 5.4 | 2.8 | 0.75 | 0.54 | 0.36 |
| τ = 100 ns | 40 | 1 | 2.3 | 4.6 | 2.7 | 0.75 | 0.55 | 0.34 |
| t = 1 µs | 13 | 3 | 1.2 | 1.5 | 1 | 0.73 | 0.67 | 0.17 |
Disclaimer/Publisher’s Note: The statements, opinions and data contained in all publications are solely those of the individual author(s) and contributor(s) and not of MDPI and/or the editor(s). MDPI and/or the editor(s) disclaim responsibility for any injury to people or property resulting from any ideas, methods, instructions or products referred to in the content. |
© 2023 by the author. Licensee MDPI, Basel, Switzerland. This article is an open access article distributed under the terms and conditions of the Creative Commons Attribution (CC BY) license (https://creativecommons.org/licenses/by/4.0/).
Share and Cite
MDPI and ACS Style
Beilis, I.I. Plasma Energy Loss by Cathode Heat Conduction in a Vacuum Arc: Cathode Effective Voltage. Plasma 2023, 6, 492-502. https://doi.org/10.3390/plasma6030034
AMA Style
Beilis II. Plasma Energy Loss by Cathode Heat Conduction in a Vacuum Arc: Cathode Effective Voltage. Plasma. 2023; 6(3):492-502. https://doi.org/10.3390/plasma6030034
Chicago/Turabian StyleBeilis, Isak I. 2023. "Plasma Energy Loss by Cathode Heat Conduction in a Vacuum Arc: Cathode Effective Voltage" Plasma 6, no. 3: 492-502. https://doi.org/10.3390/plasma6030034