
Anodization Time Effect on Silver Particles Deposition on Anodic Oxide Coating over Al Produced by Plasma Electrolytic Oxidation

 ,
,  ,
, 
Abstract
:1. Introduction
2. Experimental Procedure
2.1. Material Characterization
2.2. Factorial Design
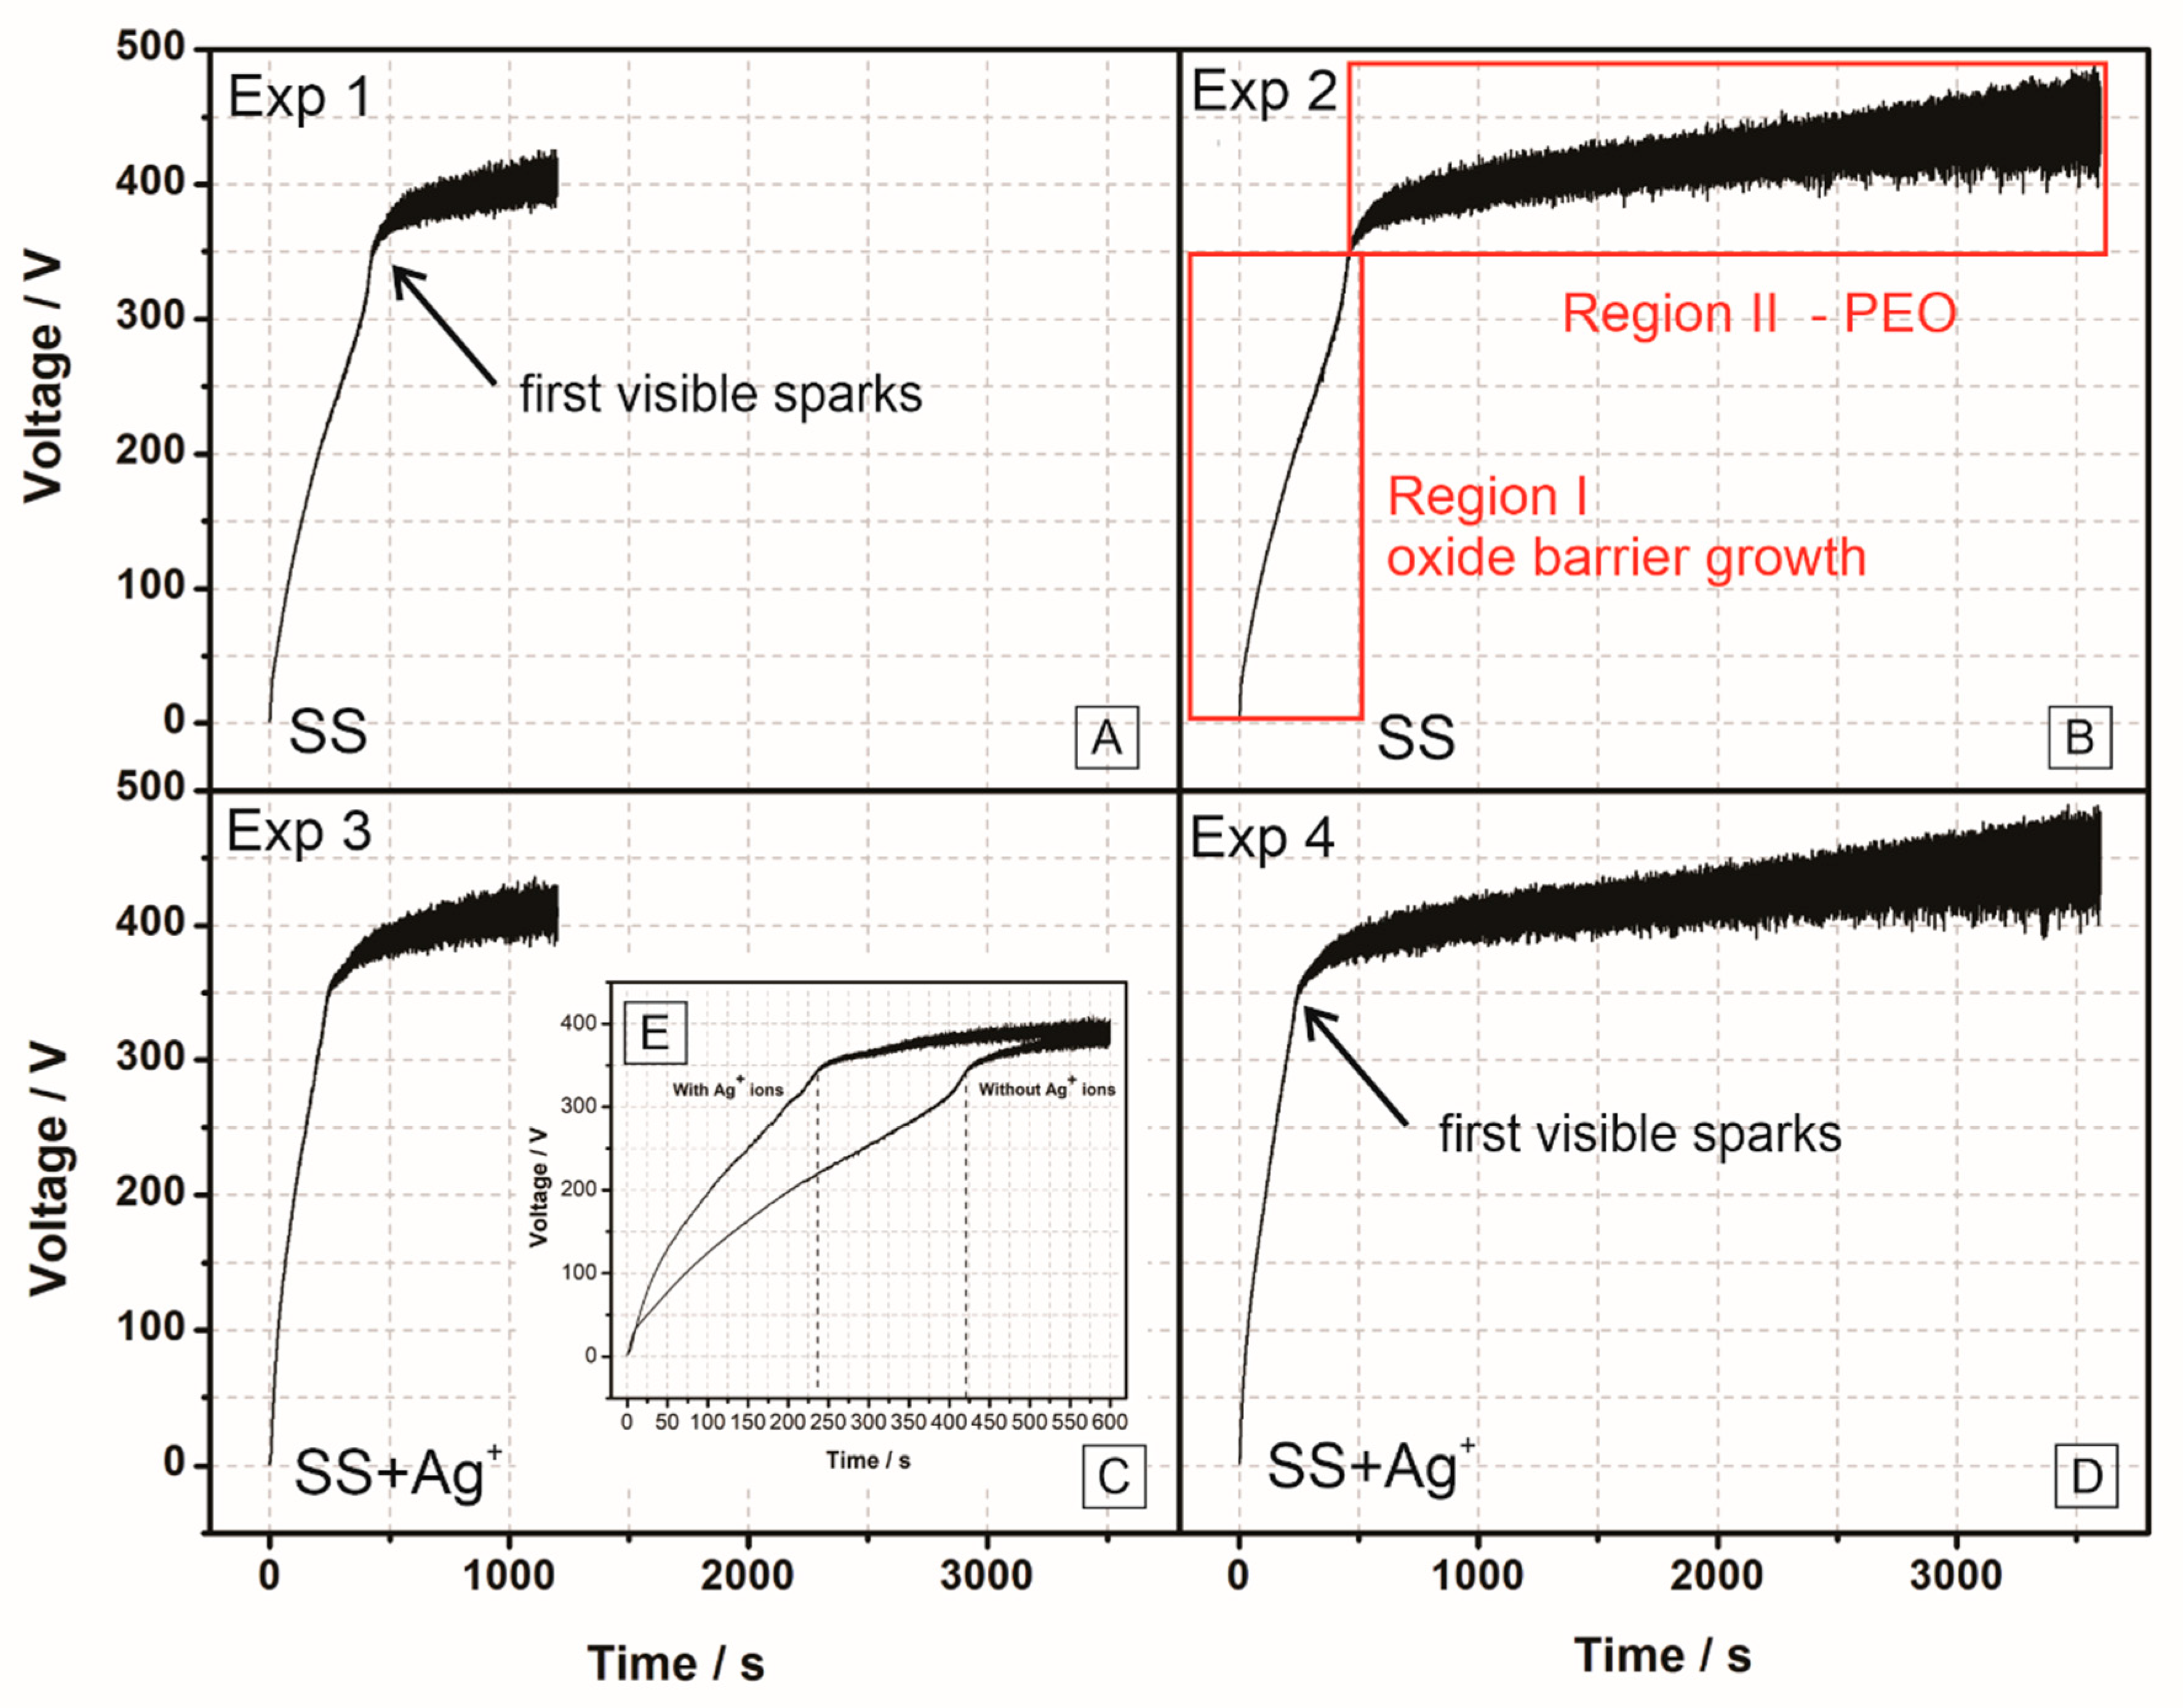
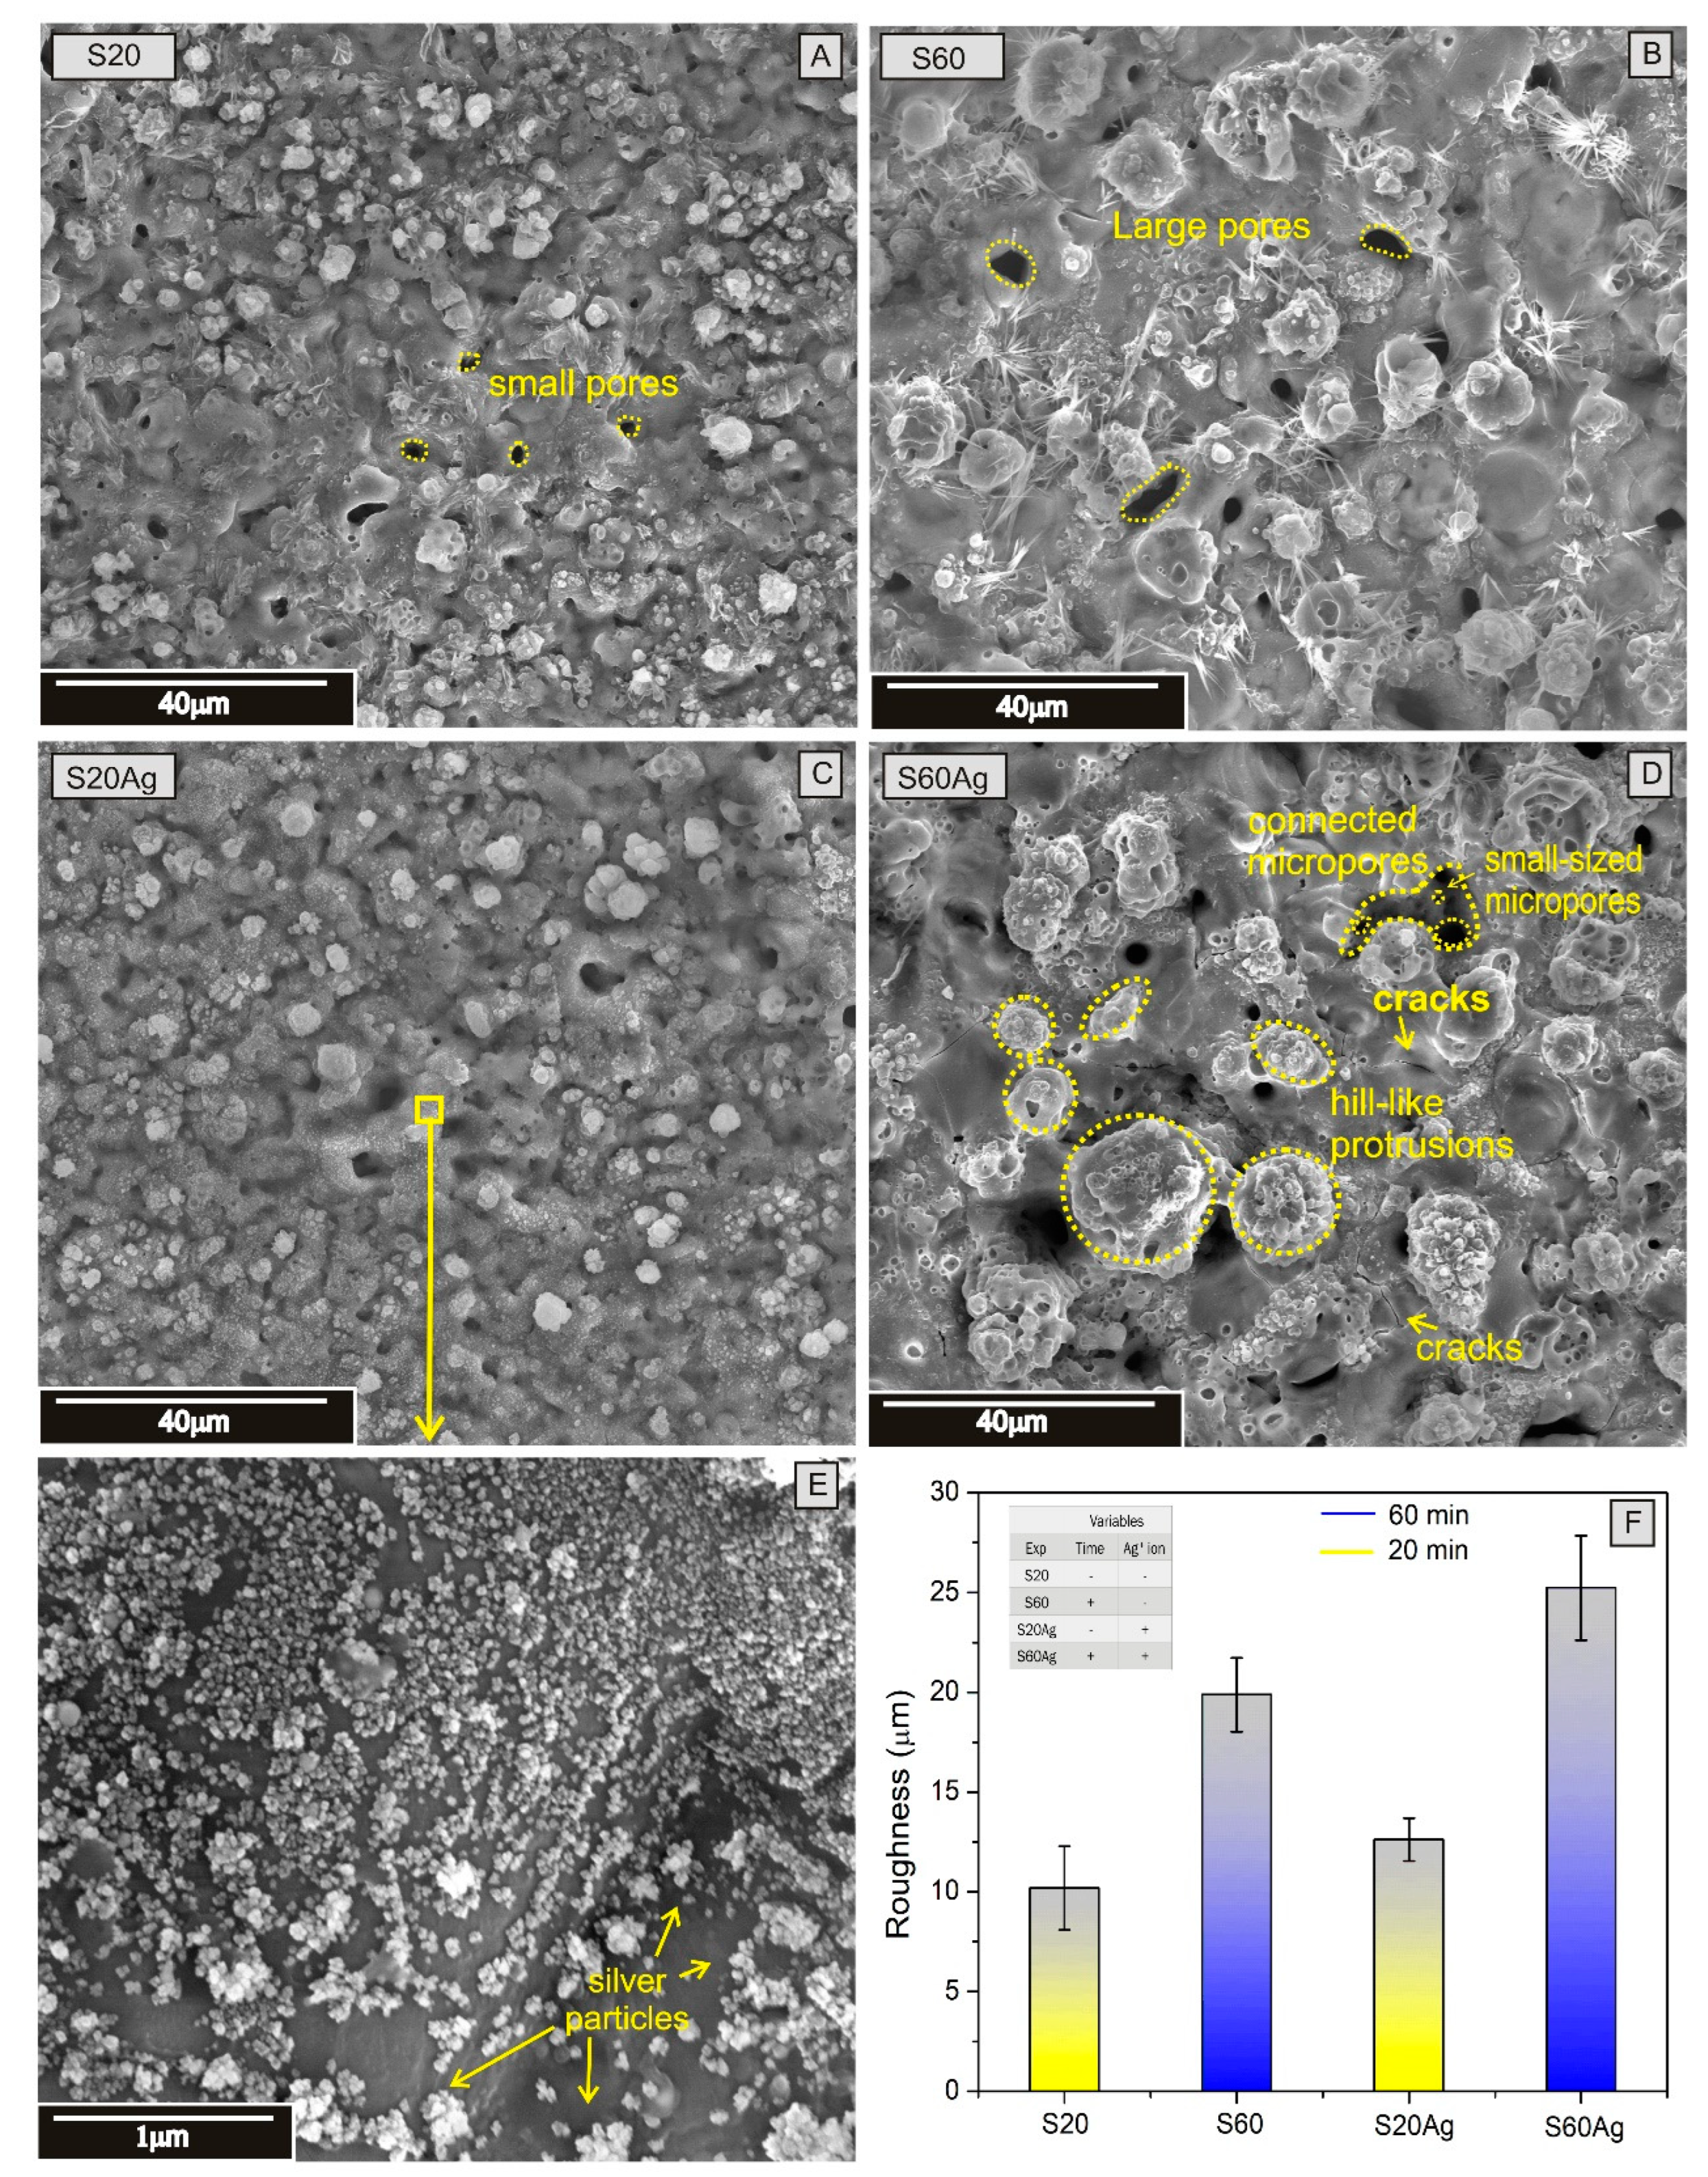
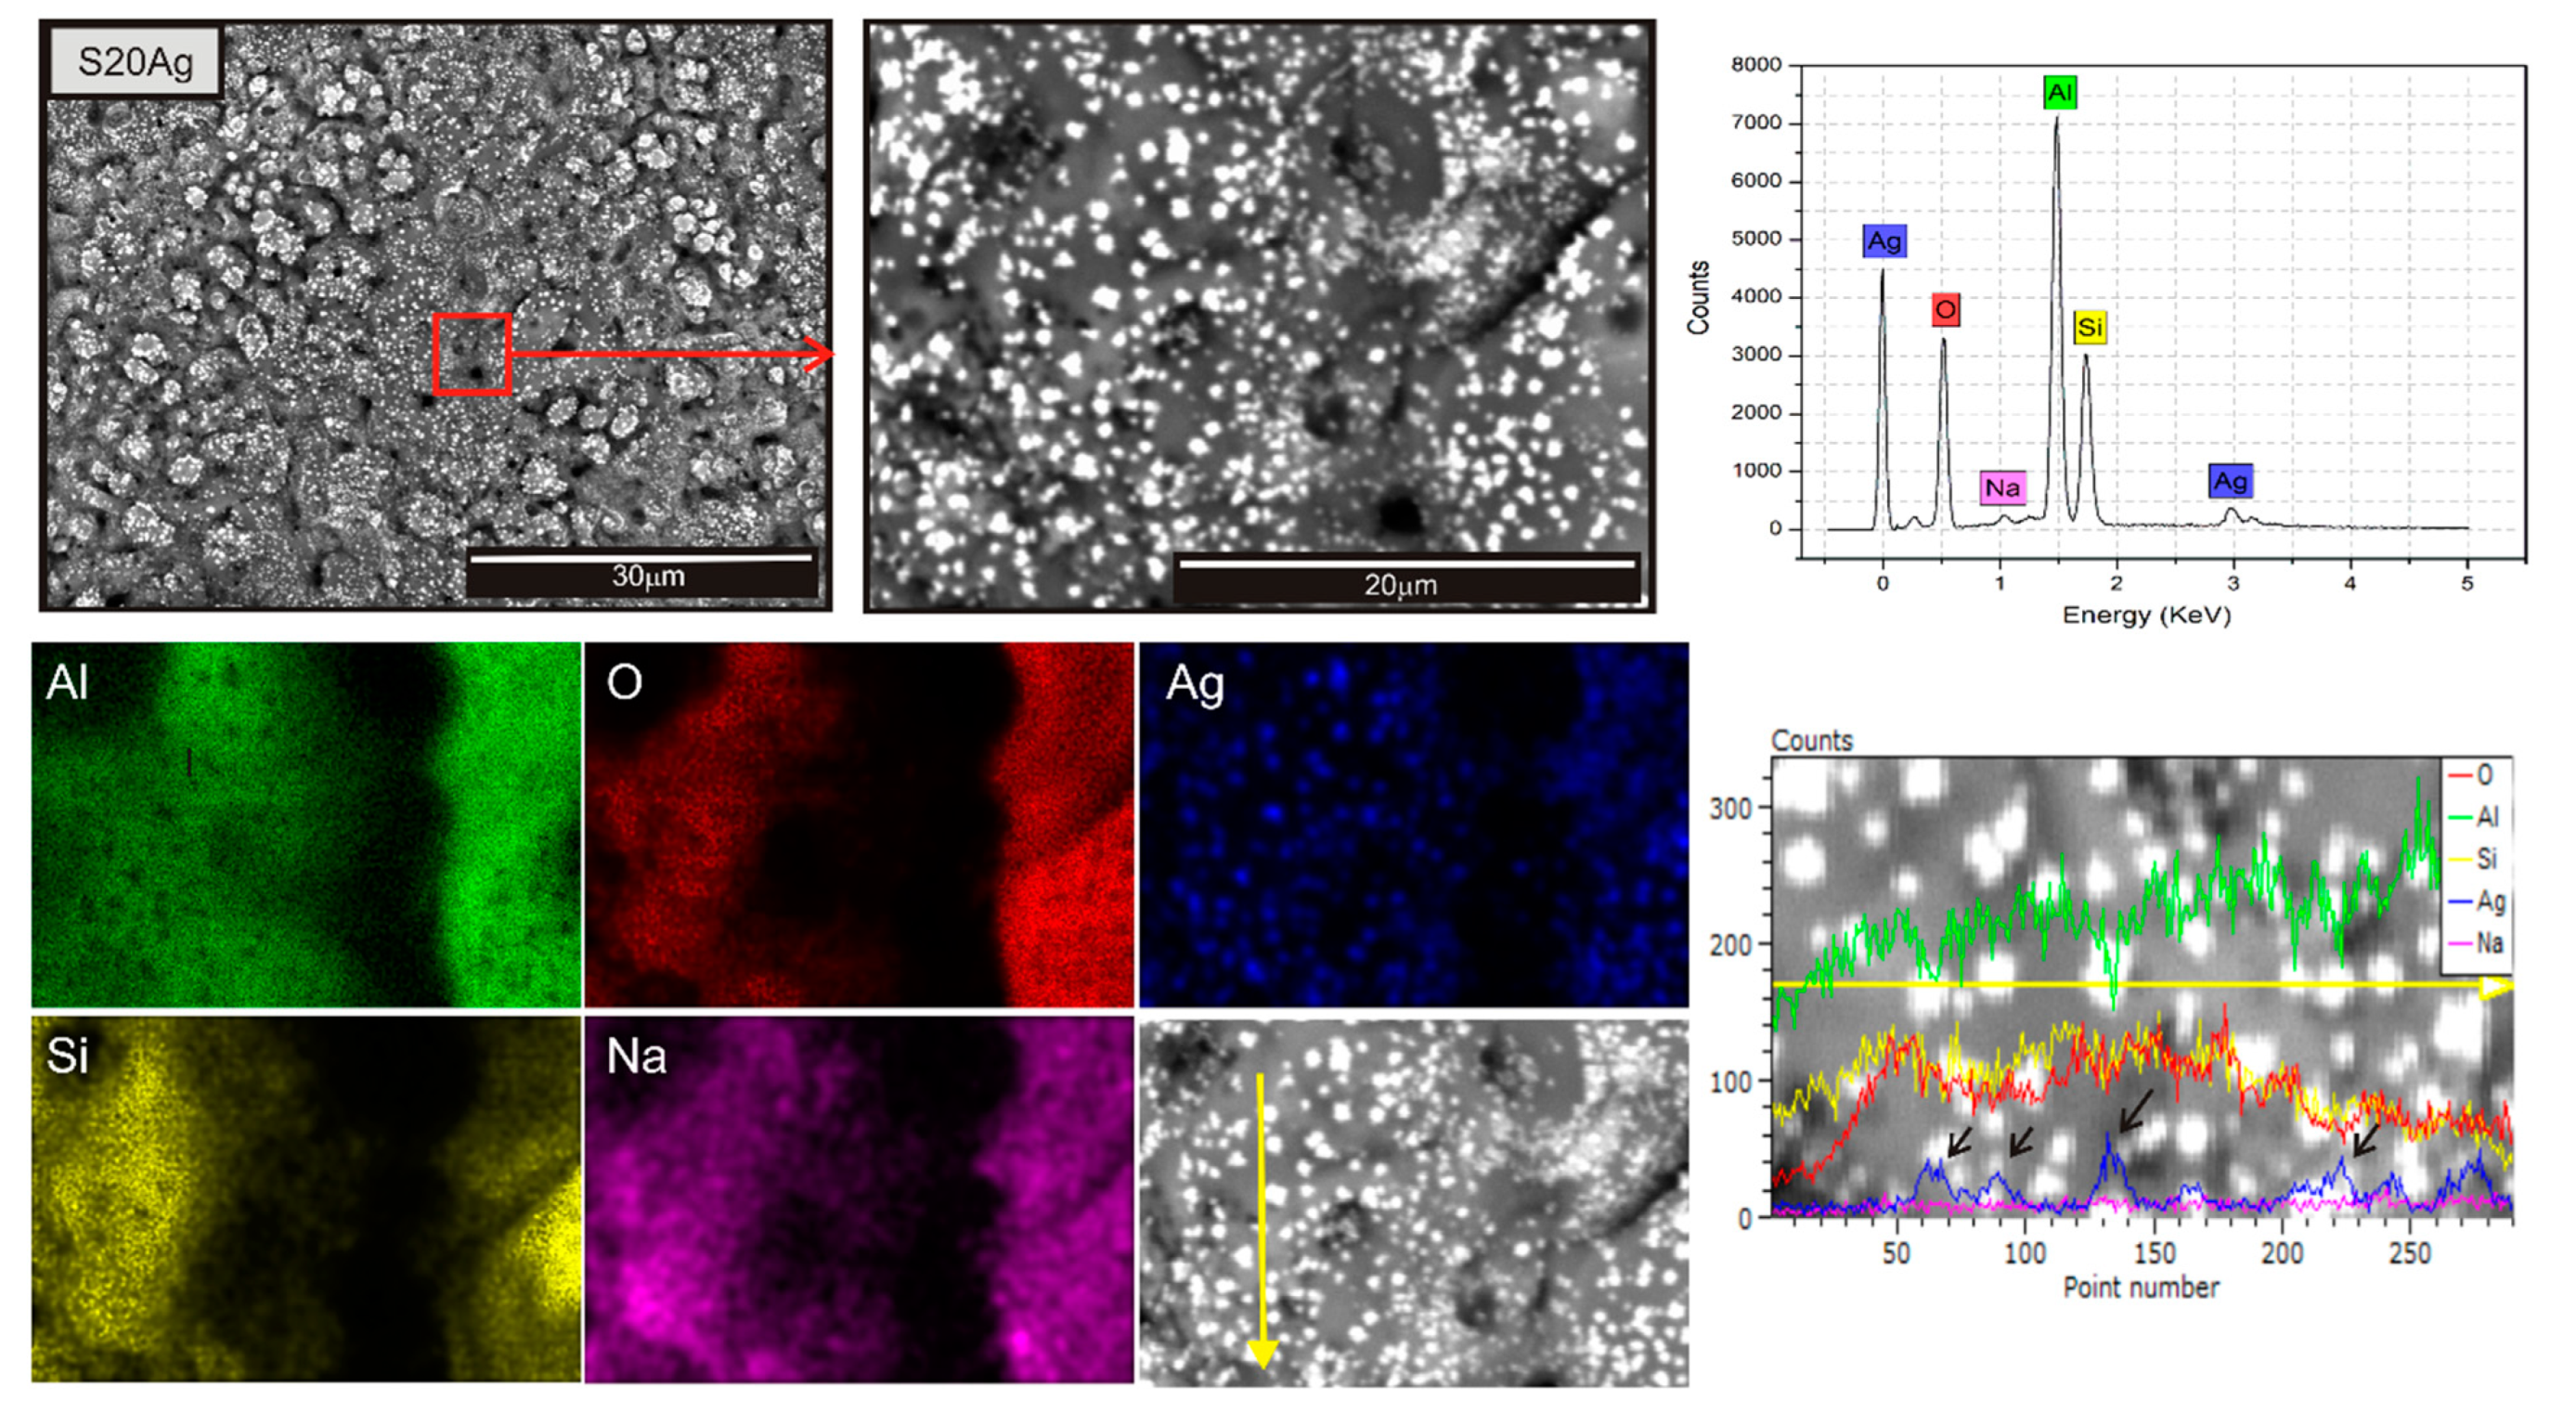
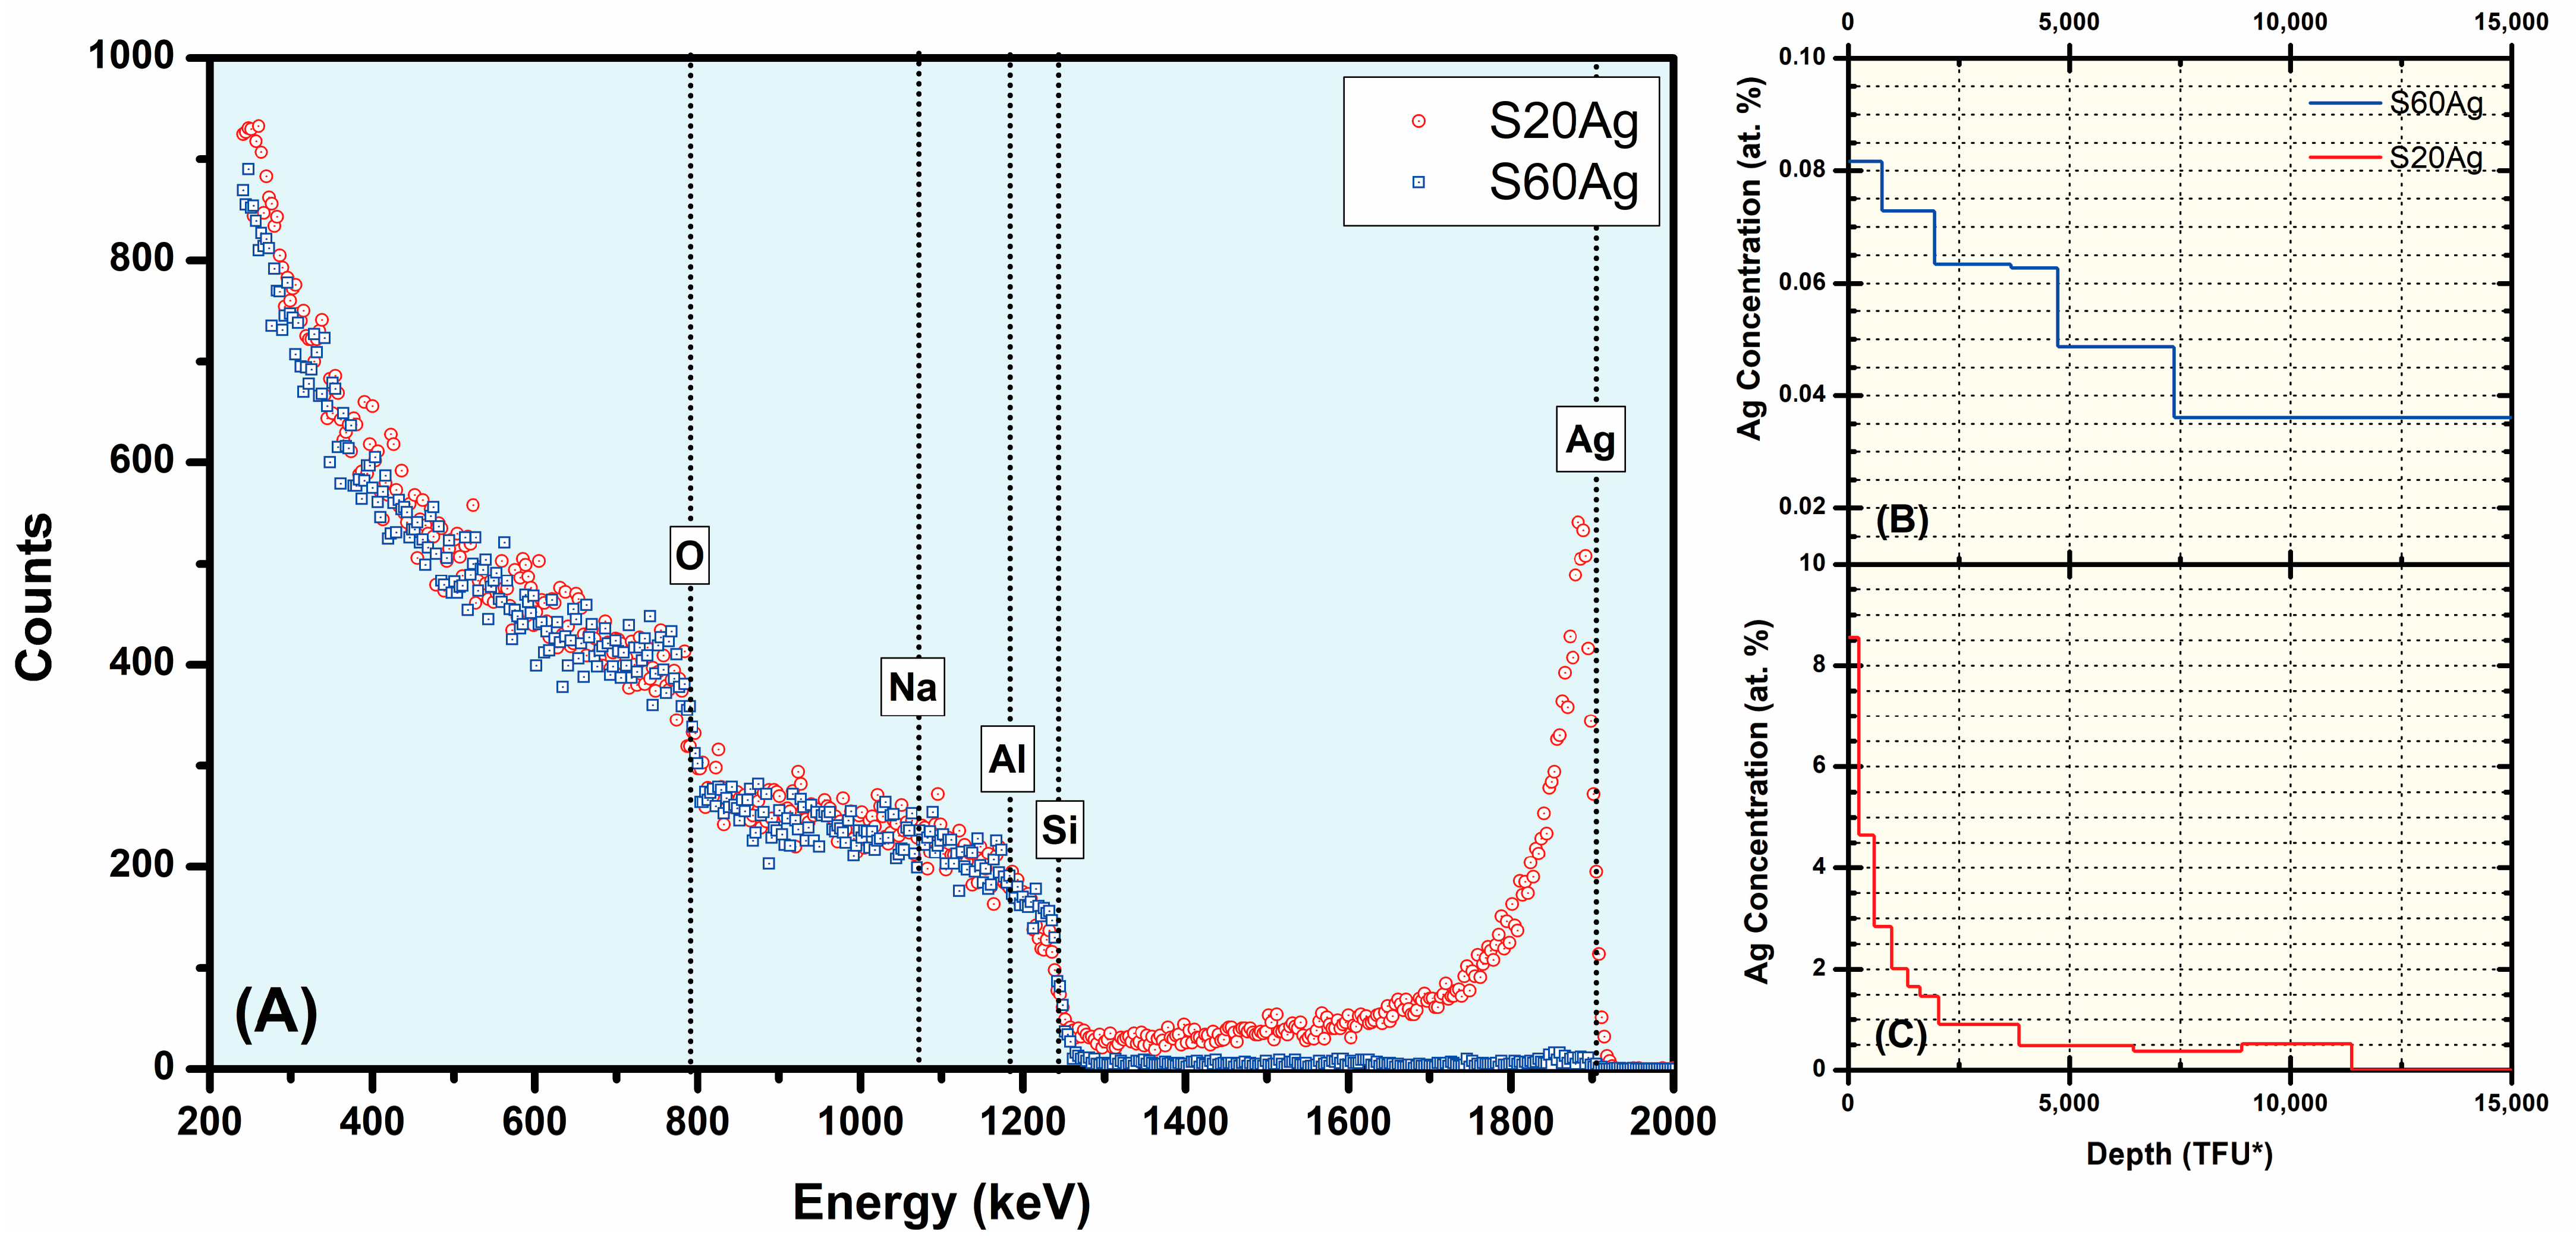
3. Results and Discussion
4. Conclusions
Author Contributions
Funding
Data Availability Statement
Acknowledgments
Conflicts of Interest
References
- Clyne, T.W.; Troughton, S.C. A review of recent work on discharge characteristics during plasma electrolytic oxidation of various metals. Int. Mater. Rev. 2019, 64, 127–162. [Google Scholar] [CrossRef]
- Babaei, K.; Fattah-alhosseini, A.; Chaharmahali, R. A review on plasma electrolytic oxidation (PEO) of niobium: Mechanism, properties and applications. Surf. Interfaces 2020, 21, 100719. [Google Scholar] [CrossRef]
- Trivinho-Strixino, F.; Santos, J.S.; Souza Sikora, M. 3-Electrochemical Synthesis of Nanostructured Materials. In Nanostructures; Da Róz, A.L., Ferreira, M., de Lima Leite, F., Oliveira, O.N., Eds.; William Andrew Publishing: Norwich, NY, USA, 2017. [Google Scholar]
- Santos, J.S.; Trivinho-Strixino, F.; Pereira, E.C. The influence of experimental conditions on the morphology and phase composition of Nb-doped ZrO2 films prepared by spark anodization. Corros. Sci. 2013, 73, 99–105. [Google Scholar] [CrossRef]
- Trivinho-Strixino, F.; Silva, D.X.; Paiva-Santos, C.O.; Pereira, E.C. Tetragonal to monoclinic phase transition observed during Zr anodisation. J. Solid State Electrochem. 2013, 17, 191–199. [Google Scholar] [CrossRef]
- Santos, J.S.; Lemos, S.G.; Gonçalves, W.N.; Bruno, O.M.; Pereira, E.C. Characterization of electrical discharges during spark anodization of zirconium in different electrolytes. Electrochim. Acta 2014, 130, 477–487. [Google Scholar] [CrossRef]
- Sikora, M.S.; Carstensen, J.; Föll, H.; Pereira, E.C. Theoretical Calculation of the Local Heating Effect on the Crystallization of TiO2 Prepared by Sparking Anodization. Curr. Nanosci. 2015, 11, 263–270. [Google Scholar] [CrossRef]
- Lu, X.; Mohedano, M.; Blawert, C.; Matykina, E.; Arrabal, R.; Kainer, K.U.; Zheludkevich, M.L. Plasma electrolytic oxidation coatings with particle additions—A review. Surf. Coat. Technol. 2016, 307 (Pt. C), 1165–1182. [Google Scholar] [CrossRef]
- Lu, X.; Blawert, C.; Zheludkevich, M.L.; Kainer, K.U. Insights into plasma electrolytic oxidation treatment with particle addition. Corros. Sci. 2015, 101, 201–207. [Google Scholar] [CrossRef]
- Trivinho-Strixino, F.; Guimaraes, F.E.G.; Pereira, E.C. Luminescence in anodic ZrO2 doped with Eu(III)ions. Mol. Cryst. Liq. Cryst. 2008, 485, 766–775. [Google Scholar] [CrossRef]
- Orsetti, F.R.; Bukman, L.; Santos, J.S.; Nagay, B.E.; Rangel, E.C.; Cruz, N.C. Methylene blue and metformin photocatalytic activity of CeO2-Nb2O5 coatings is dependent on the treatment time of plasma electrolytic oxidation on titanium. Appl. Surf. Sci. Adv. 2021, 6, 100143. [Google Scholar] [CrossRef]
- Babaei, K.; Fattah-alhosseini, A.; Molaei, M. The effects of carbon-based additives on corrosion and wear properties of Plasma electrolytic oxidation (PEO) coatings applied on Aluminum and its alloys: A review. Surf. Interfaces 2020, 21, 100677. [Google Scholar] [CrossRef]
- Liu, W.; Pu, Y.; Liao, H.; Lin, Y.; He, W. Corrosion and Wear Behavior of PEO Coatings on D16T Aluminum Alloy with Different Concentrations of Graphene. Coatings 2020, 10, 249. [Google Scholar] [CrossRef]
- Arrabal, R.; Mohedano, M.; Matykina, E.; Pardo, A.; Mingo, B.; Merino, M.C. Characterization and wear behaviour of PEO coatings on 6082-T6 aluminium alloy with incorporated α-Al2O3 particles. Surf. Coat. Technol. 2015, 269, 64–73. [Google Scholar] [CrossRef]
- Hu, C.-J.; Hsieh, M.-H. Preparation of ceramic coatings on an Al–Si alloy by the incorporation of ZrO2 particles in microarc oxidation. Surf. Coat. Technol. 2014, 258, 275–283. [Google Scholar] [CrossRef]
- Rudnev, V.S.; Lukiyanchuk, I.V.; Vasilyeva, M.S.; Morozova, V.P.; Zelikman, V.M.; Tarkhanova, I.G. W-containing oxide layers obtained on aluminum and titanium by PEO as catalysts in thiophene oxidation. Appl. Surf. Sci. 2017, 422, 1007–1014. [Google Scholar] [CrossRef]
- Tyrina, L.M.; Rudnev, V.S.; Lukiyanchuk, I.V.; Ustinov, A.Y.; Sergienko, V.I.; Vasil’eva, M.S.; Kondrikov, N.B. Ni- and Cu-containing oxide layers on aluminum: Formation, composition, and catalytic properties. Dokl. Phys. Chem. 2007, 415, 183–185. [Google Scholar] [CrossRef]
- Tyrina, L.M.; Rudnev, V.S.; Nedozorov, P.M.; Ustiniov, A.Y.; Lukiyanchuk, I.V.; Kaidalova, T.A. Preparation, properties, and catalytic activity of platinum-modified plasma electrolytic oxide structures on aluminum. Russ. J. Inorg. Chem. 2011, 56, 1429. [Google Scholar] [CrossRef]
- Jin, F.; Tong, H.; Li, J.; Shen, L.; Chu, P.K. Structure and microwave-absorbing properties of Fe-particle containing alumina prepared by micro-arc discharge oxidation. Surf. Coat. Technol. 2006, 201, 292–295. [Google Scholar] [CrossRef]
- Rogov, A.B.; Terleeva, O.P.; Mironov, I.V.; Slonova, A.I. Iron-containing coatings obtained by microplasma method on aluminum with usage of homogeneous electrolytes. Appl. Surf. Sci. 2012, 258, 2761–2765. [Google Scholar] [CrossRef]
- Cerchier, P.; Pezzato, L.; Gennari, C.; Moschin, E.; Moro, I.; Dabalà, M. PEO coating containing copper: A promising anticorrosive and antifouling coating for seawater application of AA 7075. Surf. Coat. Technol. 2020, 393, 125774. [Google Scholar] [CrossRef]
- Cerchier, P.; Pezzato, L.; Moschin, E.; Coelho, L.B.; Olivier, M.G.M.; Moro, I.; Magrini, M. Antifouling properties of different Plasma Electrolytic Oxidation coatings on 7075 aluminium alloy. Int. Biodeterior. Biodegrad. 2018, 133, 70–78. [Google Scholar] [CrossRef]
- Cerchier, P.; Pezzato, L.; Brunelli, K.; Dolcet, P.; Bartolozzi, A.; Bertani, R.; Dabalà, M. Antibacterial effect of PEO coating with silver on AA7075. Mater. Sci. Eng. C 2017, 75, 554–564. [Google Scholar] [CrossRef] [PubMed]
- Pezzato, L.; Cerchier, P.; Brunelli, K.; Bartolozzi, A.; Bertani, R.; Dabalà, M. Plasma electrolytic oxidation coatings with fungicidal properties. Surf. Eng. 2019, 35, 325–333. [Google Scholar] [CrossRef]
- Santos, J.S.; Rodrigues, A.; Simon, A.P.; Ferreira, C.H.; Santos, V.A.Q.; Sikora, M.S.; Cruz, N.C.; Mambrini, G.P.; Trivinho-Strixino, F. One-Step Synthesis of Antibacterial Coatings by Plasma Electrolytic Oxidation of Aluminum. Adv. Eng. Mater. 2019, 21, 1900119. [Google Scholar] [CrossRef]
- Santos, J.S.; Márquez, V.; Buijnsters, J.G.; Praserthdam, S.; Praserthdam, P. Antimicrobial properties dependence on the composition and architecture of copper-alumina coatings prepared by plasma electrolytic oxidation (PEO). Appl. Surf. Sci. 2023, 607, 155072. [Google Scholar] [CrossRef]
- Thukkaram, M.; Cools, P.; Nikiforov, A.; Rigole, P.; Coenye, T.; Van Der Voort, P.; Du Laing, G.; Vercruysse, C.; Declercq, H.; Morent, R.; et al. Antibacterial activity of a porous silver doped TiO2 coating on titanium substrates synthesized by plasma electrolytic oxidation. Appl. Surf. Sci. 2020, 500, 144235. [Google Scholar] [CrossRef]
- Rizwan, M.; Alias, R.; Zaidi, U.Z.; Mahmoodian, R.; Hamdi, M. Surface modification of valve metals using plasma electrolytic oxidation for antibacterial applications: A review. J. Biomed. Mater. Res. Part A 2018, 106, 590–605. [Google Scholar] [CrossRef]
- Zhu, W.; Zhang, Z.; Gu, B.; Sun, J.; Zhu, L. Biological Activity and Antibacterial Property of Nano-structured TiO2 Coating Incorporated with Cu Prepared by Micro-arc Oxidation. J. Mater. Sci. Technol. 2013, 29, 237–244. [Google Scholar] [CrossRef]
- Zhang, D.; Han, Q.; Yu, K.; Lu, X.; Liu, Y.; Lu, Z.; Wang, Q. Antibacterial activities against Porphyromonas gingivalis and biological characteristics of copper-bearing PEO coatings on magnesium. J. Mater. Sci. Technol. 2021, 61, 33–45. [Google Scholar] [CrossRef]
- Necula, B.S.; Fratila-Apachitei, L.E.; Zaat, S.A.J.; Apachitei, I.; Duszczyk, J. In vitro antibacterial activity of porous TiO2–Ag composite layers against methicillin-resistant Staphylococcus aureus. Acta Biomater. 2009, 5, 3573–3580. [Google Scholar] [CrossRef]
- Muhaffel, F.; Cimenoglu, H. Development of corrosion and wear resistant micro-arc oxidation coating on a magnesium alloy. Surf. Coat. Technol. 2019, 357, 822–832. [Google Scholar] [CrossRef]
- Dancer, S.J. How Much Impact Do Antimicrobial Surfaces Really Have on Healthcare-acquired Infection? Clin. Infect. Dis. 2020, 71, 1814–1816. [Google Scholar] [CrossRef] [PubMed]
- Ellingson, K.D.; Pogreba-Brown, K.; Gerba, C.P.; Elliott, S.P. Impact of a Novel Antimicrobial Surface Coating on Health Care-Associated Infections and Environmental Bioburden at 2 Urban Hospitals. Clin. Infect. Dis. Off. Publ. Infect. Dis. Soc. Am. 2020, 71, 1807–1813. [Google Scholar] [CrossRef] [PubMed]
- Silva, T.F.; Rodrigues, C.L.; Mayer, M.; Moro, M.V.; Trindade, G.F.; Aguirre, F.R.; Added, N.; Rizzutto, M.A.; Tabacniks, M.H. MultiSIMNRA: A computational tool for self-consistent ion beam analysis using SIMNRA. Nucl. Instrum. Methods Phys. Res. Sect. B Beam Interact. Mater. At. 2016, 371, 86–89. [Google Scholar] [CrossRef]
- Mayer, M. SIMNRA, a simulation program for the analysis of NRA, RBS and ERDA. AIP Conf. Proc. 1999, 475, 541–544. [Google Scholar] [CrossRef]
- Rashad, M.M.; Baioumy, H.M. Effect of thermal treatment on the crystal structure and morphology of zirconia nanopowders produced by three different routes. J. Mater. Process. Technol. 2008, 195, 178–185. [Google Scholar] [CrossRef]
- Monfort, F.; Berkani, A.; Matykina, E.; Skeldon, P.; Thompson, G.E.; Habazaki, H.; Shimizu, K. Development of anodic coatings on aluminium under sparking conditions in silicate electrolyte. Corros. Sci. 2007, 49, 672–693. [Google Scholar] [CrossRef]
- Parkhutik, V.P.; Albella, J.M.; Martinez-Duart, J.M. Electric Breakdown in Anodic Oxide Films. In Moderns Aspects of Electrochemistry; Bockris, J.O.M., Conway, B.E., White, R.E., Eds.; Plenum Press: New York, NY, USA, 1992; Volume 23. [Google Scholar]
- Ikonopisov, S.; Girginov, A.; Machkova, M. Electrical breaking down of barrier anodic films during their formation. Electrochim. Acta 1979, 24, 451–456. [Google Scholar] [CrossRef]
- Liu, X.; Wang, S.; Du, N.; Li, X.; Zhao, Q. Evolution of the Three-Dimensional Structure and Growth Model of Plasma Electrolytic Oxidation Coatings on 1060 Aluminum Alloy. Coatings 2018, 8, 105. [Google Scholar] [CrossRef]
- Di Quarto, F.; Piazza, S.; Sunseri, C. A phenomenological approach to the mechanical breakdown of anodic oxide films on zirconium. Corros. Sci. 1986, 26, 213–221. [Google Scholar] [CrossRef]
- Hussein, R.O.; Nie, X.; Northwood, D.O.; Yerokhin, A.; Matthews, A. Spectroscopic study of electrolytic plasma and discharging behaviour during the plasma electrolytic oxidation (PEO) process. J. Phys. D Appl. Phys. 2010, 43, 105203. [Google Scholar] [CrossRef]
- Erfanifar, E.; Aliofkhazraei, M.; Fakhr Nabavi, H.; Sharifi, H.; Rouhaghdam, A.S. Growth kinetics and morphology of plasma electrolytic oxidation coating on aluminum. Mater. Chem. Phys. 2017, 185, 162–175. [Google Scholar] [CrossRef]
- Tian, J.; Luo, Z.; Qi, S.; Sun, X. Structure and antiwear behavior of micro-arc oxidized coatings on aluminum alloy. Surf. Coat. Technol. 2002, 154, 1–7. [Google Scholar] [CrossRef]
- Sundararajan, G.; Rama Krishna, L. Mechanisms underlying the formation of thick alumina coatings through the MAO coating technology. Surf. Coat. Technol. 2003, 167, 269–277. [Google Scholar] [CrossRef]
- Wang, L.; Nie, X. Silicon effects on formation of EPO oxide coatings on aluminum alloys. Thin Solid Film. 2006, 494, 211–218. [Google Scholar] [CrossRef]
- Mohapatra, P.; Shaw, S.; Mendivelso-Perez, D.; Bobbitt, J.M.; Silva, T.F.; Naab, F.; Yuan, B.; Tian, X.; Smith, E.A.; Cademartiri, L. Calcination does not remove all carbon from colloidal nanocrystal assemblies. Nat. Commun. 2017, 8, 2038. [Google Scholar] [CrossRef]
- Rafailovic, L.; Gammer, C.; Rentenberger, C.; Trišović, T.; Kleber, C.; Peter Karnthaler, H. Functionalizing Aluminum Oxide by Ag Dendrite Deposition at the Anode during Simultaneous Electrochemical Oxidation of Al. Adv. Mater. 2015, 27, 6438–6443. [Google Scholar] [CrossRef]
- Fu, J.; Ye, W.; Wang, C. Facile Synthesis of Ag Dendrites on Al Foil via Galvanic Replacement Reaction with [Ag(NH3)2]Cl for Ultrasensitive SERS Detecting of Biomolecules. Mater. Chem. Phys. 2013, 141, 107–113. [Google Scholar] [CrossRef]
- Eliaz, N.; Gileadi, E. Physical Electrochemistry: Fundamentals, Techniques, and Applications; Wiley: Hoboken, NJ, USA, 2018. [Google Scholar]
- Crow, D.R. Principles and Applications of Electrochemistry; CRC Press: Boca Raton, FL, USA, 2017. [Google Scholar]
- Dunleavy, C.S.; Golosnoy, I.O.; Curran, J.A.; Clyne, T.W. Characterisation of discharge events during plasma electrolytic oxidation. Surf. Coat. Technol. 2009, 203, 3410–3419. [Google Scholar] [CrossRef]
- Lv, G.; Gu, W.; Chen, H.; Feng, W.; Khosa, M.L.; Li, L.; Niu, E.; Zhang, G.; Yang, S.-Z. Characteristic of ceramic coatings on aluminum by plasma electrolytic oxidation in silicate and phosphate electrolyte. Appl. Surf. Sci. 2006, 253, 2947–2952. [Google Scholar] [CrossRef]
- Matykina, E.; Monfort, F.; Berkani, A.; Skeldon, P.; Thompson, G.E.; Gough, J. Characterization of Spark-Anodized Titanium for Biomedical Applications. J. Electrochem. Soc. 2007, 154, C279–C285. [Google Scholar] [CrossRef]
- McMurdie, H.F.; Morris, M.C.; Evans, E.H.; Paretzkin, B.; Wong-Ng, W.; Hubbard, C.R. Standard X-ray Diffraction Powder Patterns from The JCPDS Research Associateship. Powder Diffr. 2013, 1, 265–275. [Google Scholar] [CrossRef]
- Matykina, E.; Arrabal, R.; Pardo, A.; Mohedano, M.; Mingo, B.; Rodríguez, I.; González, J. Energy-efficient PEO process of aluminium alloys. Mater. Lett. 2014, 127, 13–16. [Google Scholar] [CrossRef]
- Neufeld, P.; Nagpaul, N.K.; Ashdown, R.; Akbar, M. Crystallization of anodic Al2O3. Electrochim. Acta 1972, 17, 1543–1546. [Google Scholar] [CrossRef]


| Variable | Level | Exp. | A | B | |
|---|---|---|---|---|---|
| (−) | (+) | ||||
| 20 | 60 | S20 | − | − |
| Without | With | S60 | + | − |
| Responses: RMS, Crystallite size, Ag and Si content | S20Ag | − | + | ||
| S60Ag | + | + | |||
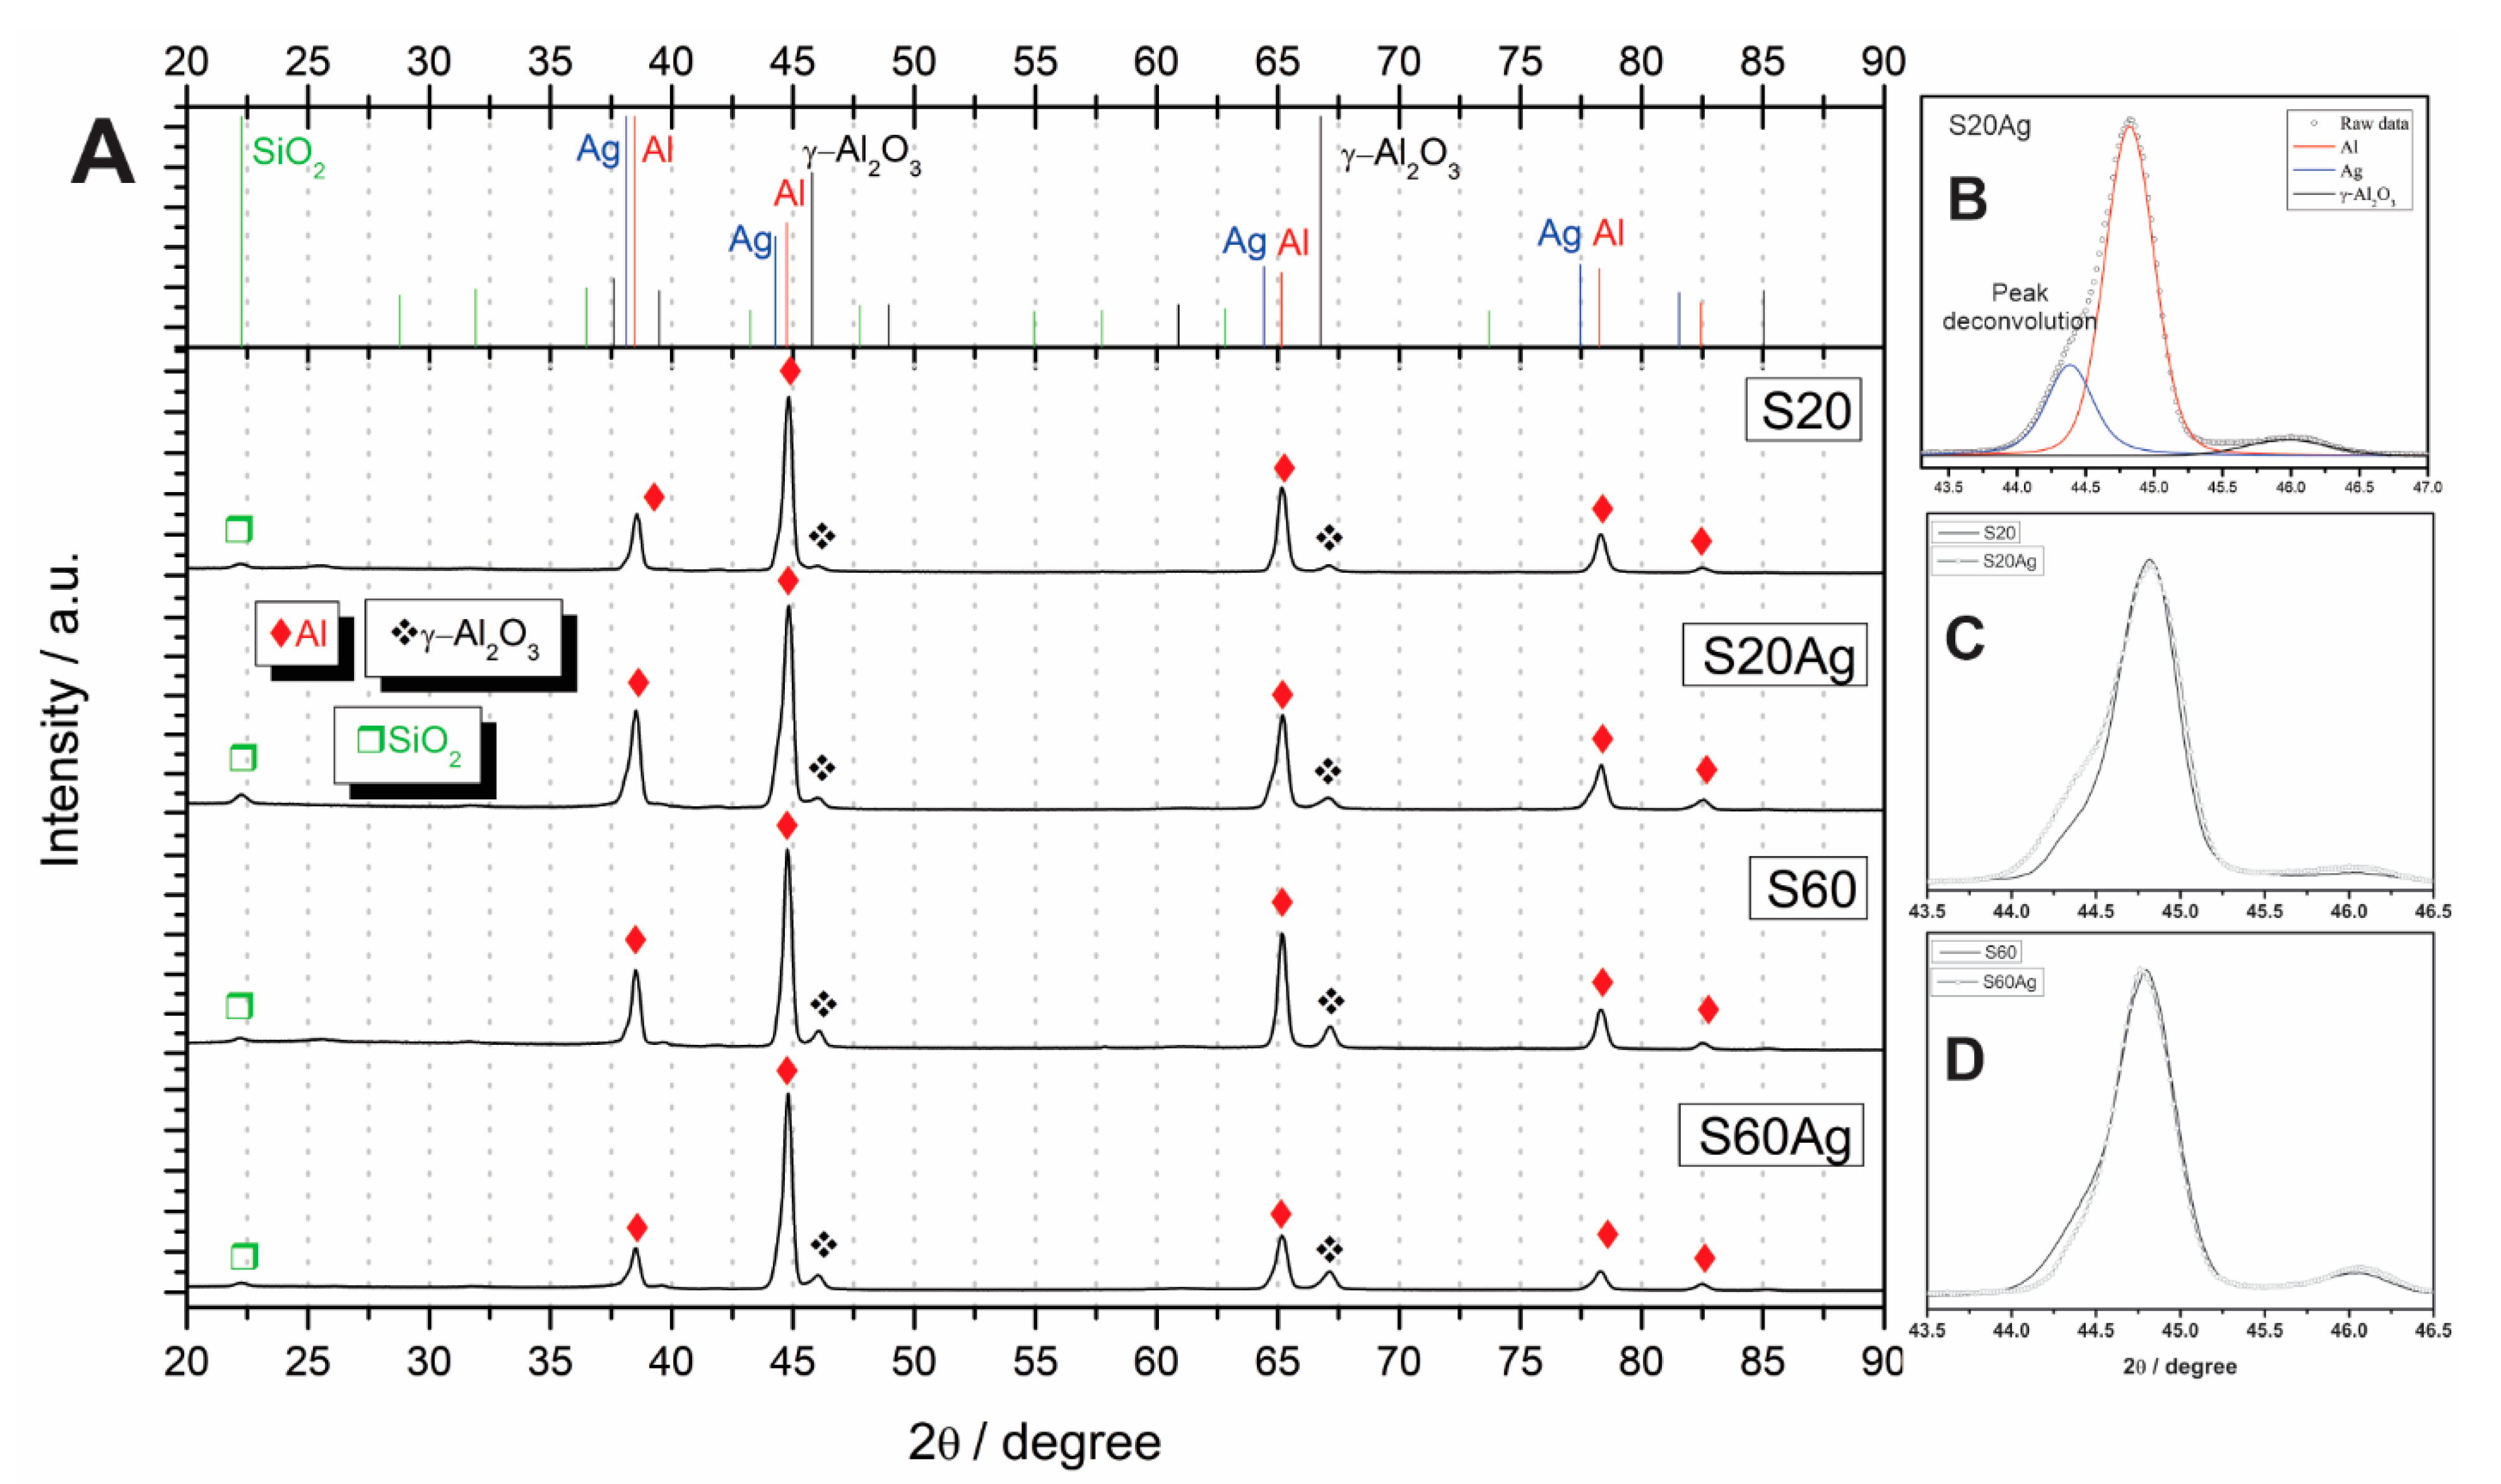
| Exp. | Al (at.%) | O (at.%) | Si (at.%) | Ag (at.%) | Na (at.%) | N (at.%) | γ-Al2O3 Crystallite Size |
|---|---|---|---|---|---|---|---|
| (nm) | |||||||
| S20 | 28.8 ± 1.2 | 57.8 ± 0.4 | 11.1 ± 0.7 | 1.8 ± 0.1 | 0.6 ± 0.0 | 15.1 ± 2.4 | |
| S60 | 17.9 ± 0.3 | 60.1 ± 0.2 | 18.9 ± 0.3 | 2.2 ± 0.2 | 0.9 ± 0.1 | 29.4 ± 0.8 | |
| S20Ag | 27.1 ± 0.7 | 56.7 ± 0.8 | 12.8 ± 0.9 | 1.0 ± 0.1 | 1.8 ± 0.3 | 0.6 ± 0.4 | 14.7 ± 3.1 |
| S60Ag | 19.4 ± 0.3 | 59.9 ± 0.4 | 18.4 ± 0.2 | 0.0 ± 0.0 | 1.5 ± 0.1 | 0.8 ± 0.2 | 23.5 ± 3.5 |
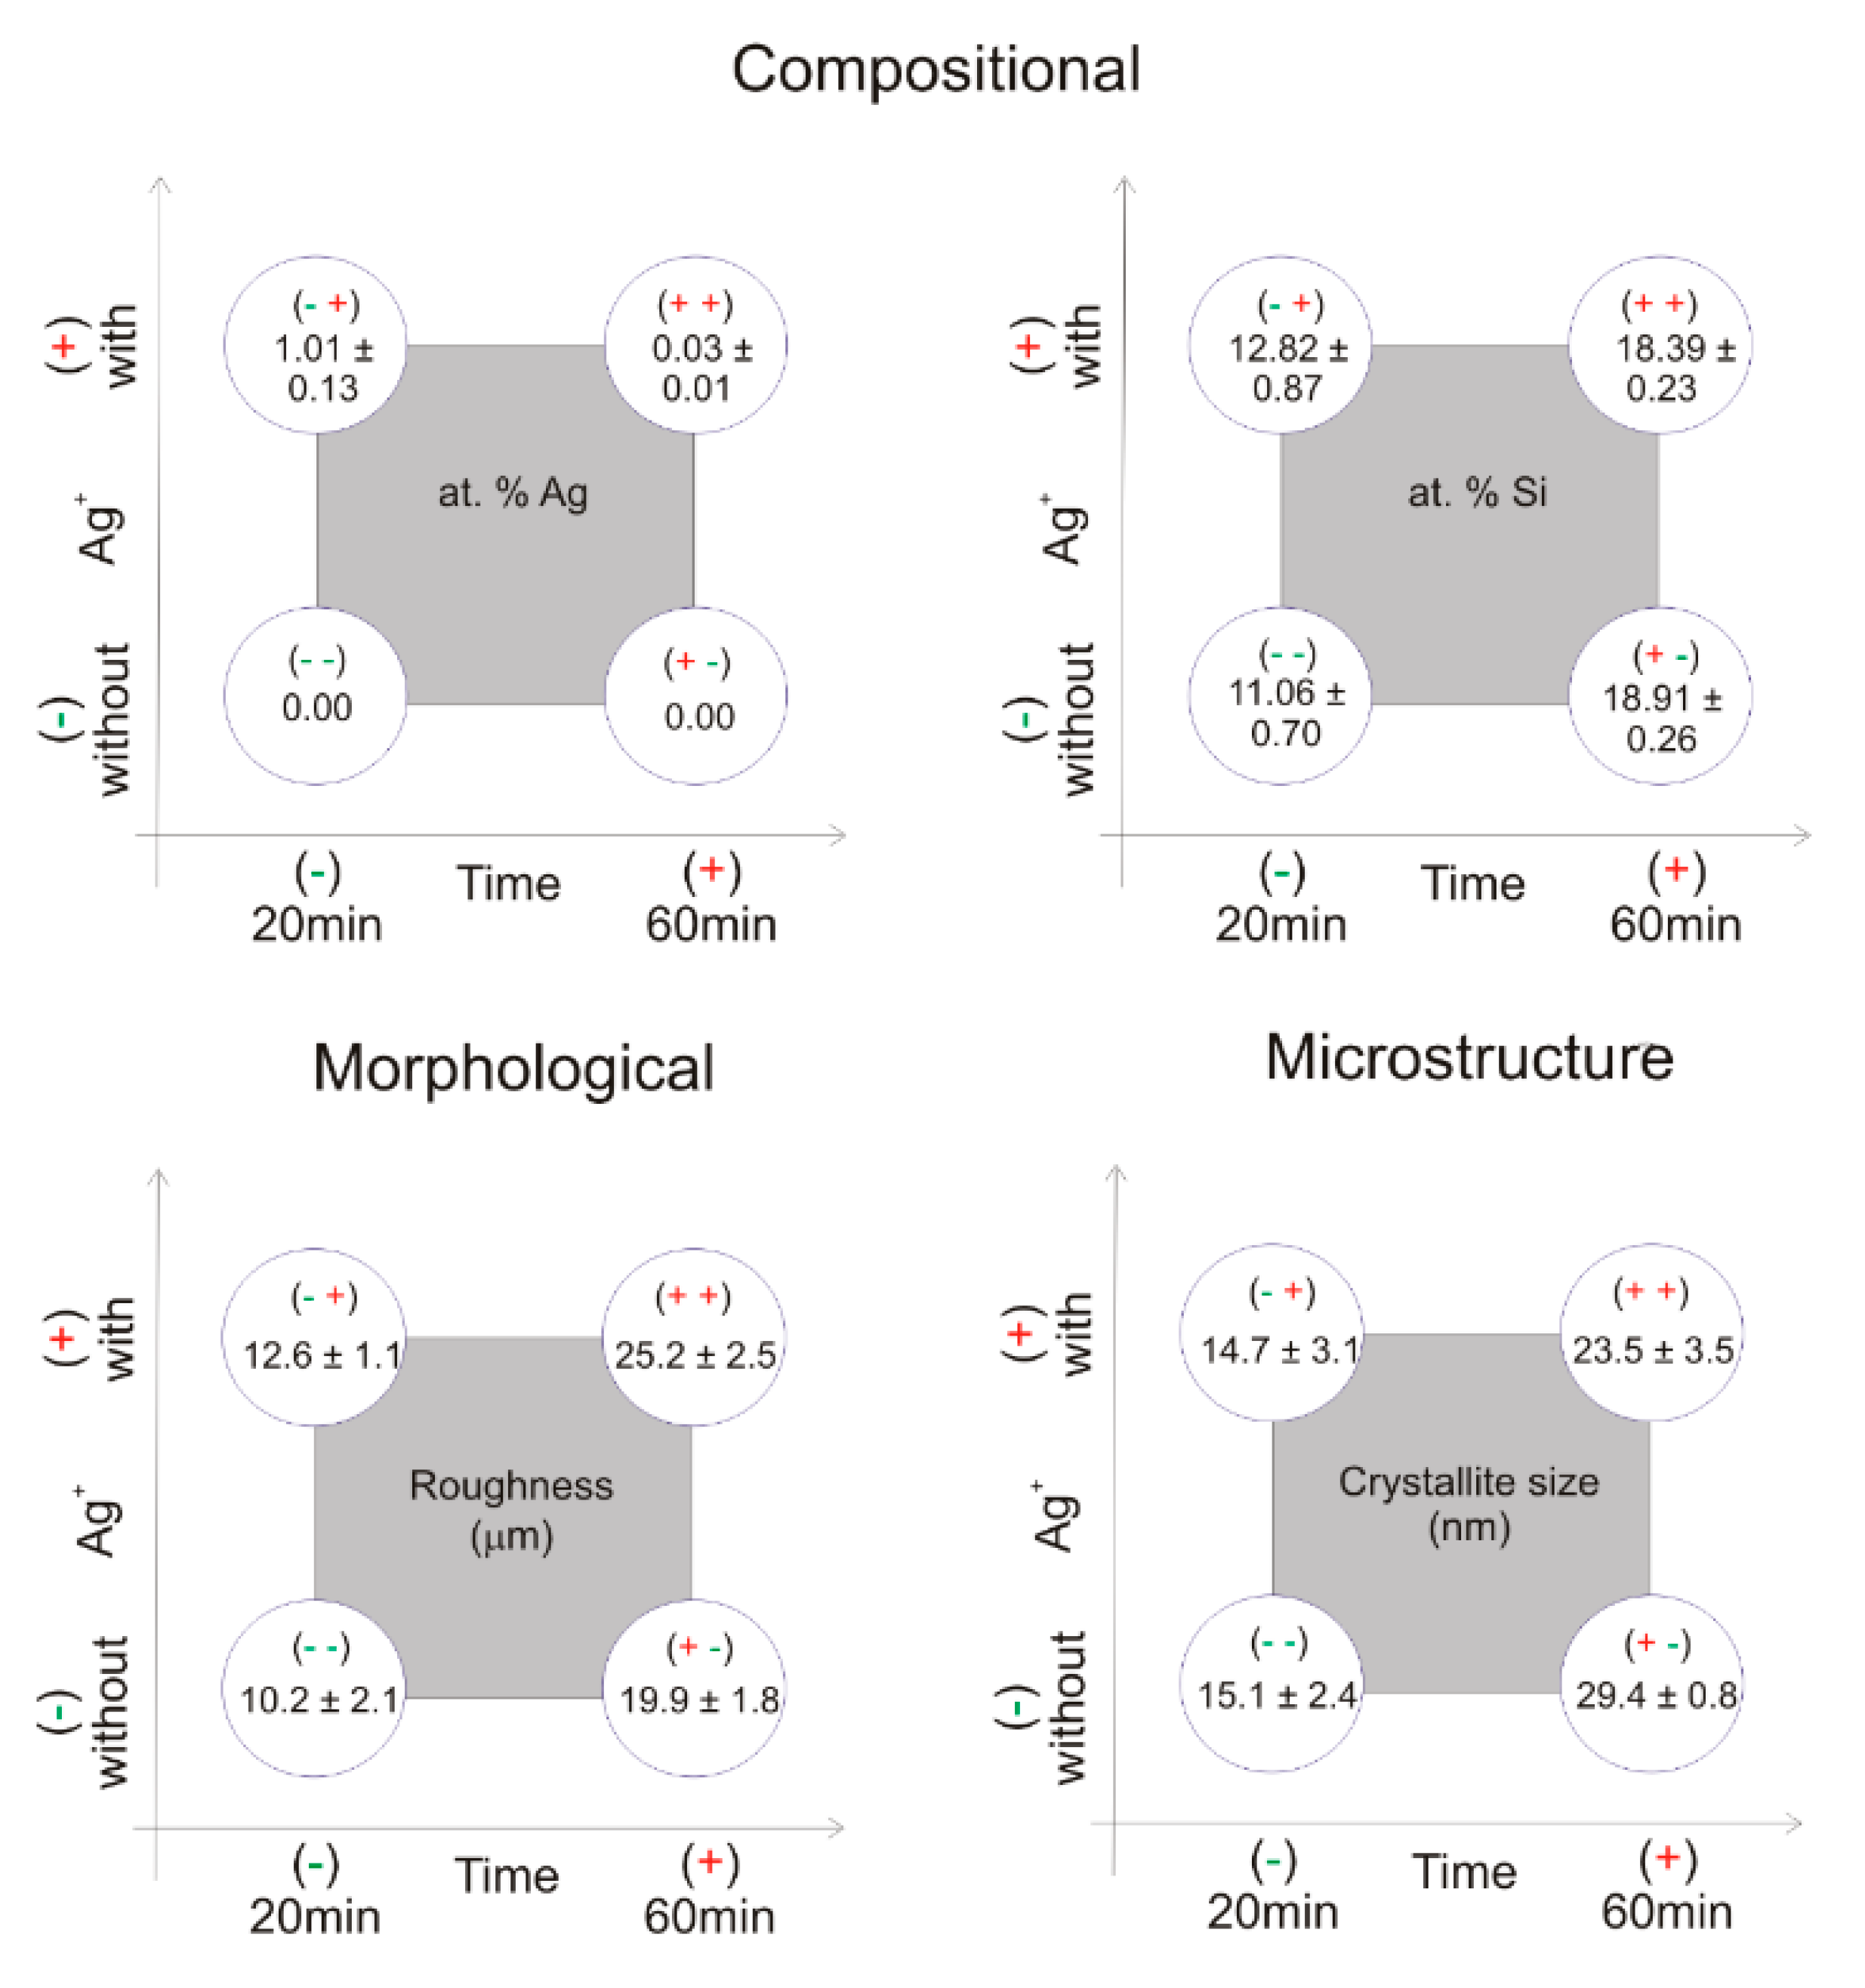
| Estimative of Variables Effects on Studied Responses | ||||
|---|---|---|---|---|
| Ag Content (at.%) | Si Content (at.%) | γ-Al2O3 Crystallite Size (nm) | %RMS | |
| Main Effects ± SD | ||||
| Anodizing Time (A) | −0.49 ± 0.14 | 6.71 ± 1.16 | 11.55 ± 5.28 | 11.16 ± 3.15 |
| Ag+ ion (B) | 0.52 ± 0.14 | 0.62 ± 1.16 | −3.15 ± 5.28 | 3.89 ± 3.15 |
| Interaction of two factors ± SD | ||||
| A × B | −0.49 ± 0.14 | −1.15 ± 1.16 | −2.75 ± 5.28 | 1.46 ± 3.15 |
Disclaimer/Publisher’s Note: The statements, opinions and data contained in all publications are solely those of the individual author(s) and contributor(s) and not of MDPI and/or the editor(s). MDPI and/or the editor(s) disclaim responsibility for any injury to people or property resulting from any ideas, methods, instructions or products referred to in the content. |
© 2023 by the authors. Licensee MDPI, Basel, Switzerland. This article is an open access article distributed under the terms and conditions of the Creative Commons Attribution (CC BY) license (https://creativecommons.org/licenses/by/4.0/).
Share and Cite
Trivinho-Strixino, F.; Delgado-Silva, A.O.; Santos, J.S.; Rodrigues, A.; Mambrini, G.P.; Sikora, M.S. Anodization Time Effect on Silver Particles Deposition on Anodic Oxide Coating over Al Produced by Plasma Electrolytic Oxidation. Plasma 2023, 6, 235-249. https://doi.org/10.3390/plasma6020018
Trivinho-Strixino F, Delgado-Silva AO, Santos JS, Rodrigues A, Mambrini GP, Sikora MS. Anodization Time Effect on Silver Particles Deposition on Anodic Oxide Coating over Al Produced by Plasma Electrolytic Oxidation. Plasma. 2023; 6(2):235-249. https://doi.org/10.3390/plasma6020018
Chicago/Turabian StyleTrivinho-Strixino, Francisco, Adriana O. Delgado-Silva, Janaina S. Santos, Andressa Rodrigues, Giovanni P. Mambrini, and Mariana S. Sikora. 2023. "Anodization Time Effect on Silver Particles Deposition on Anodic Oxide Coating over Al Produced by Plasma Electrolytic Oxidation" Plasma 6, no. 2: 235-249. https://doi.org/10.3390/plasma6020018