
A Cryptotephra Layer in Sediments of an Infilled Maar Lake from the Eifel (Germany): First Evidence of Campanian Ignimbrite Ash Airfall in Central Europe

Abstract
:1. Introduction


2. Materials and Methods
2.1. Samples
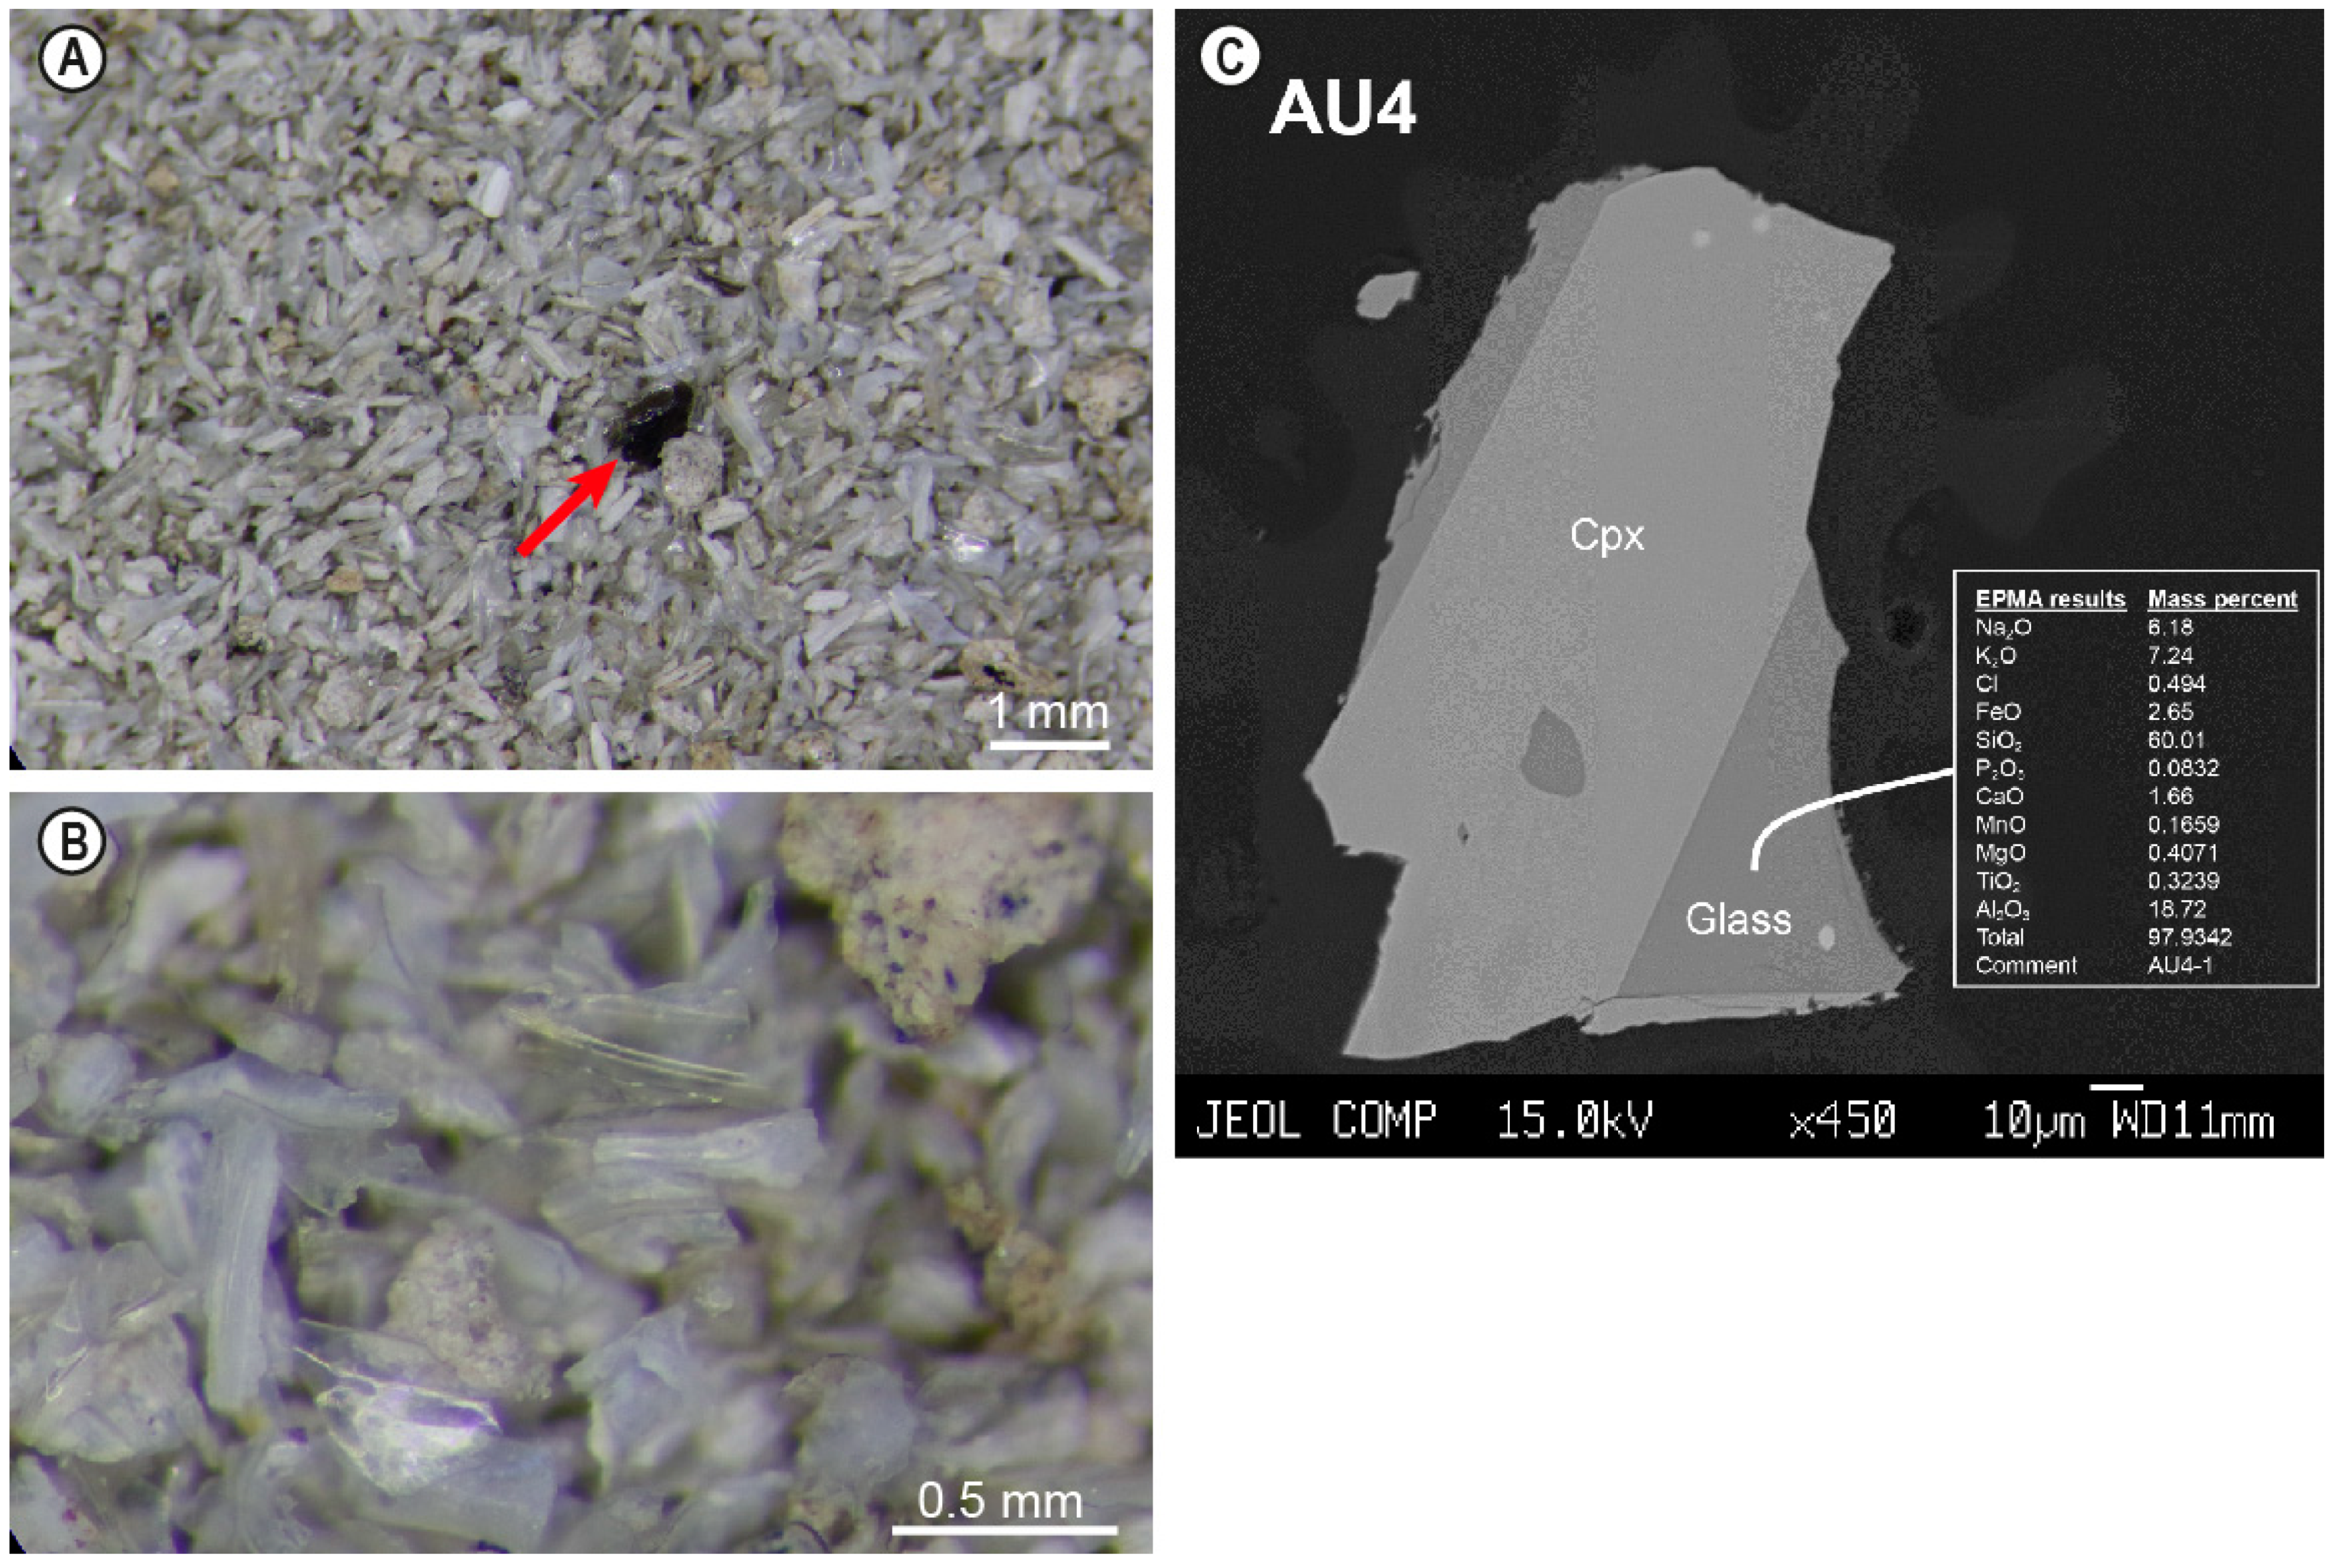
2.2. Optical Analysis
2.3. In Situ Reflectance Spectroscopy (ISRS, Corg(chlorins))
2.4. Geochemistry
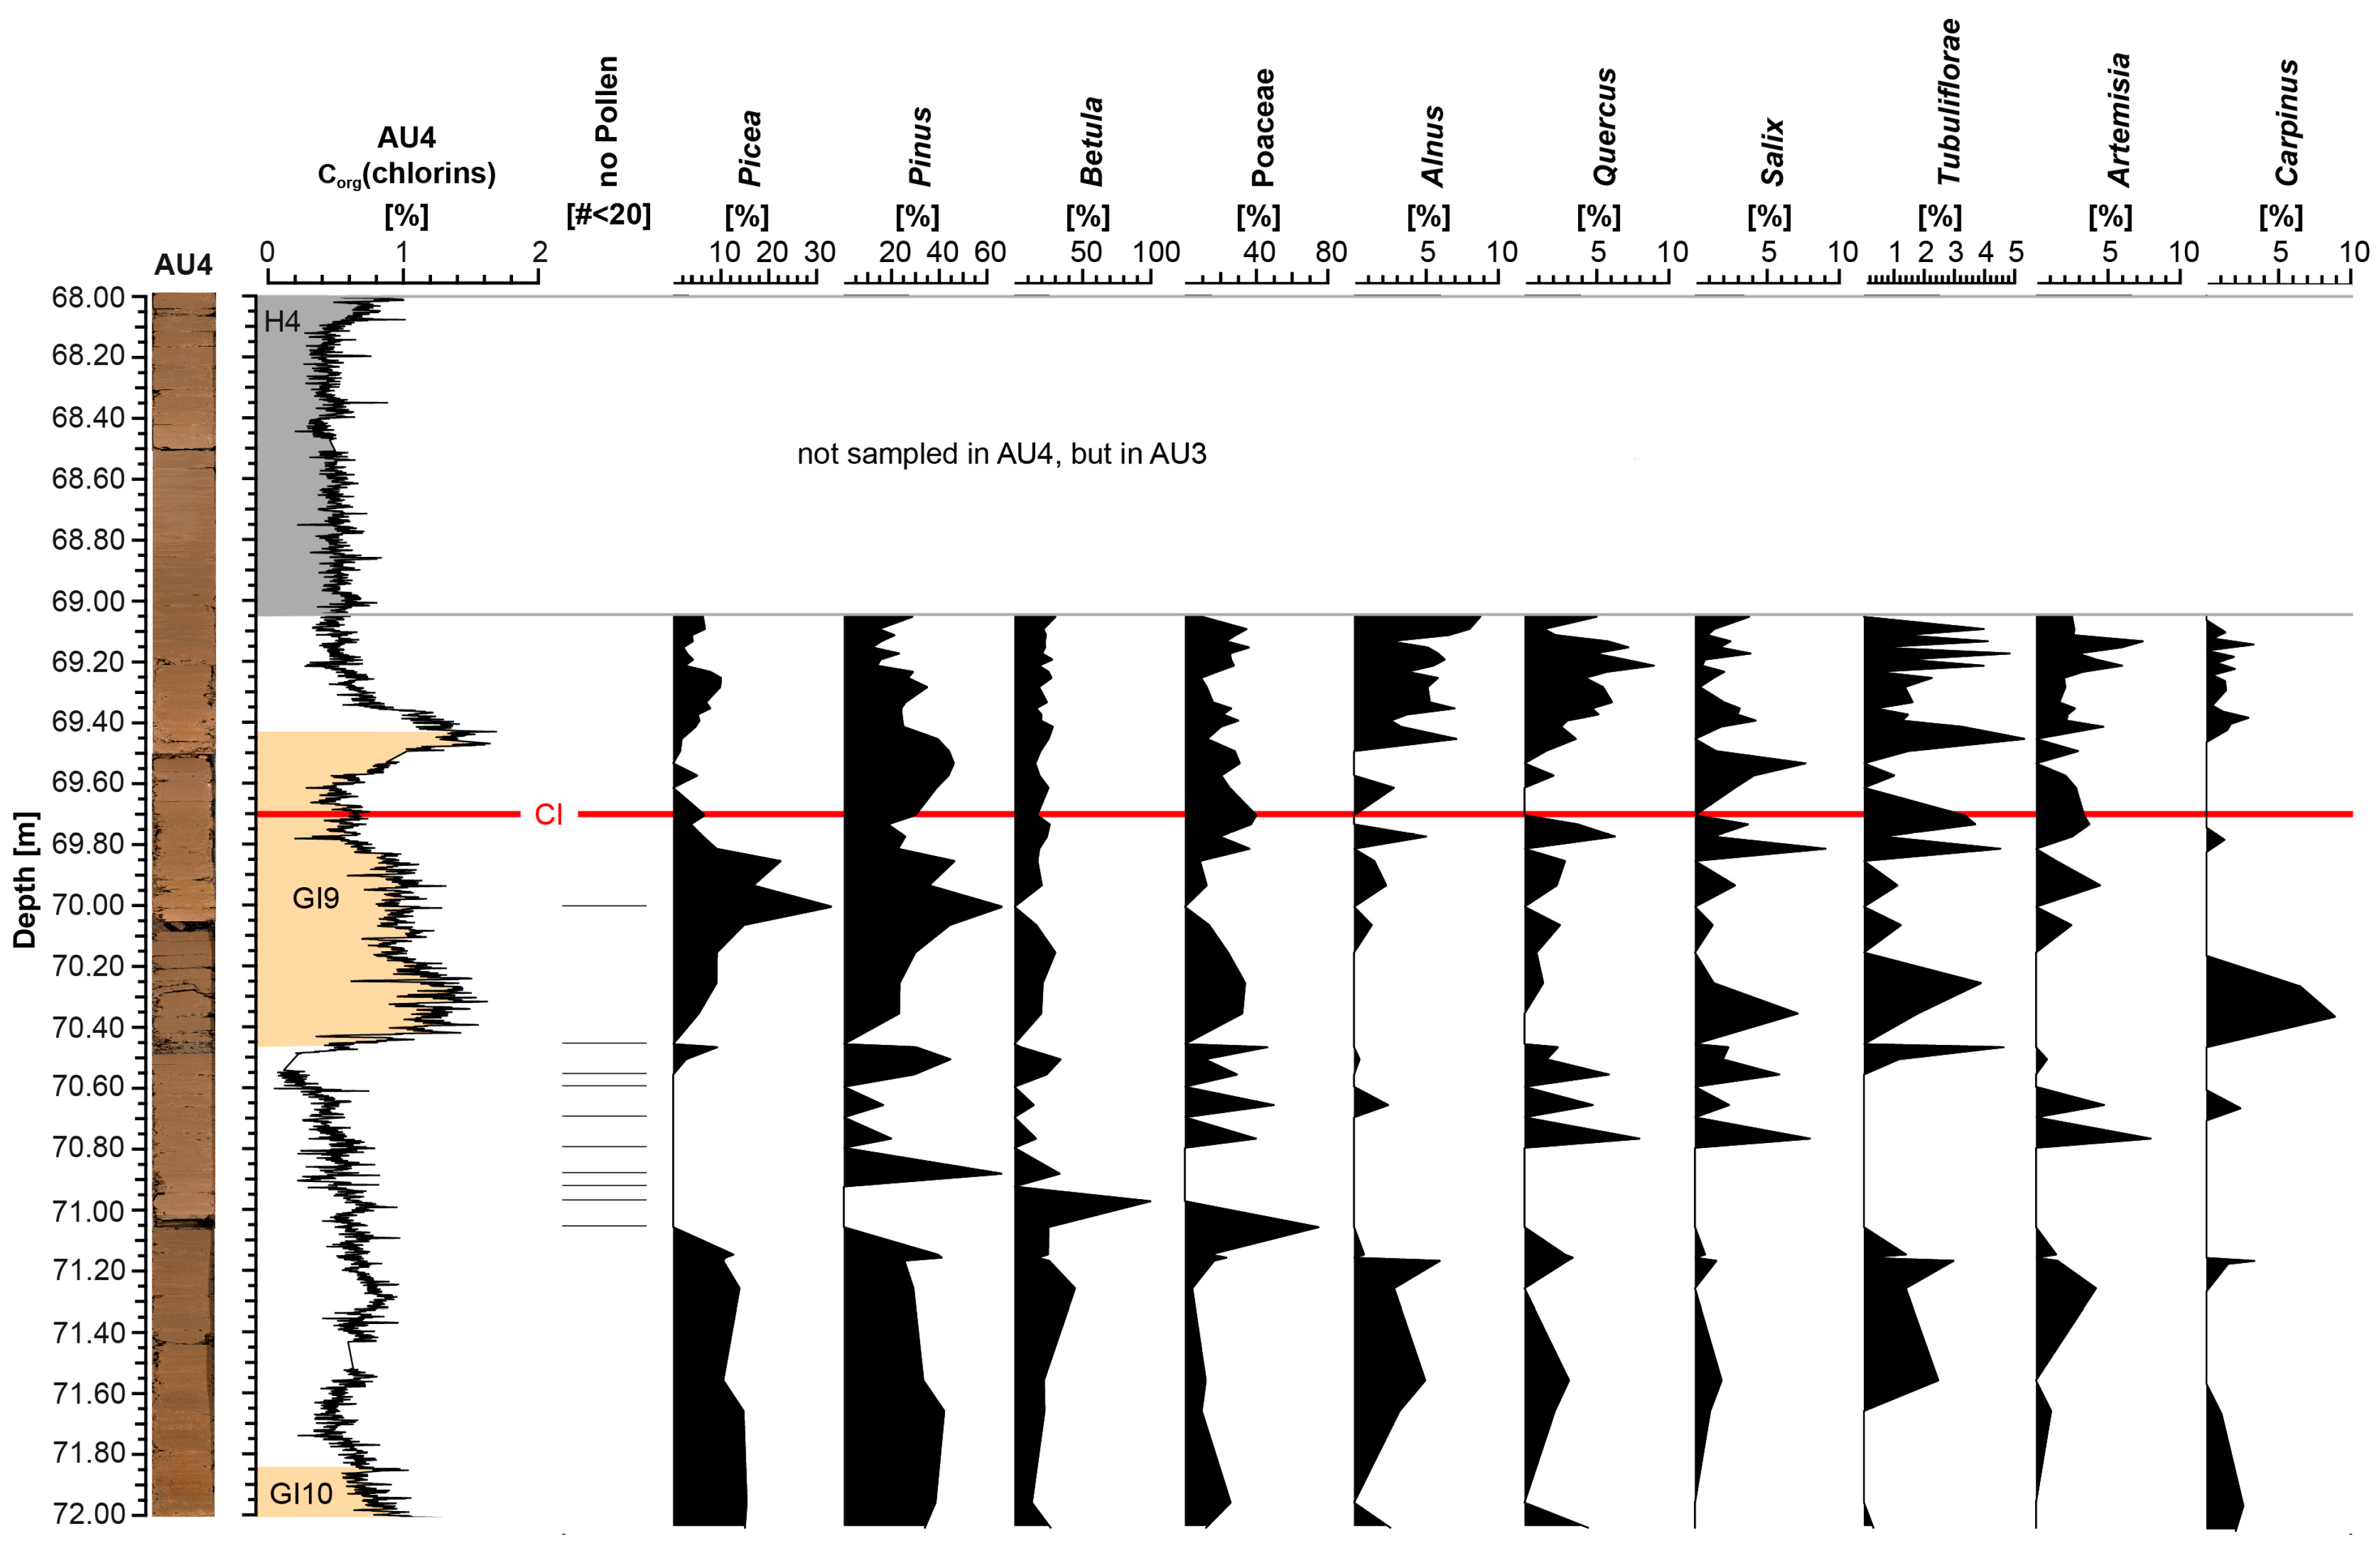
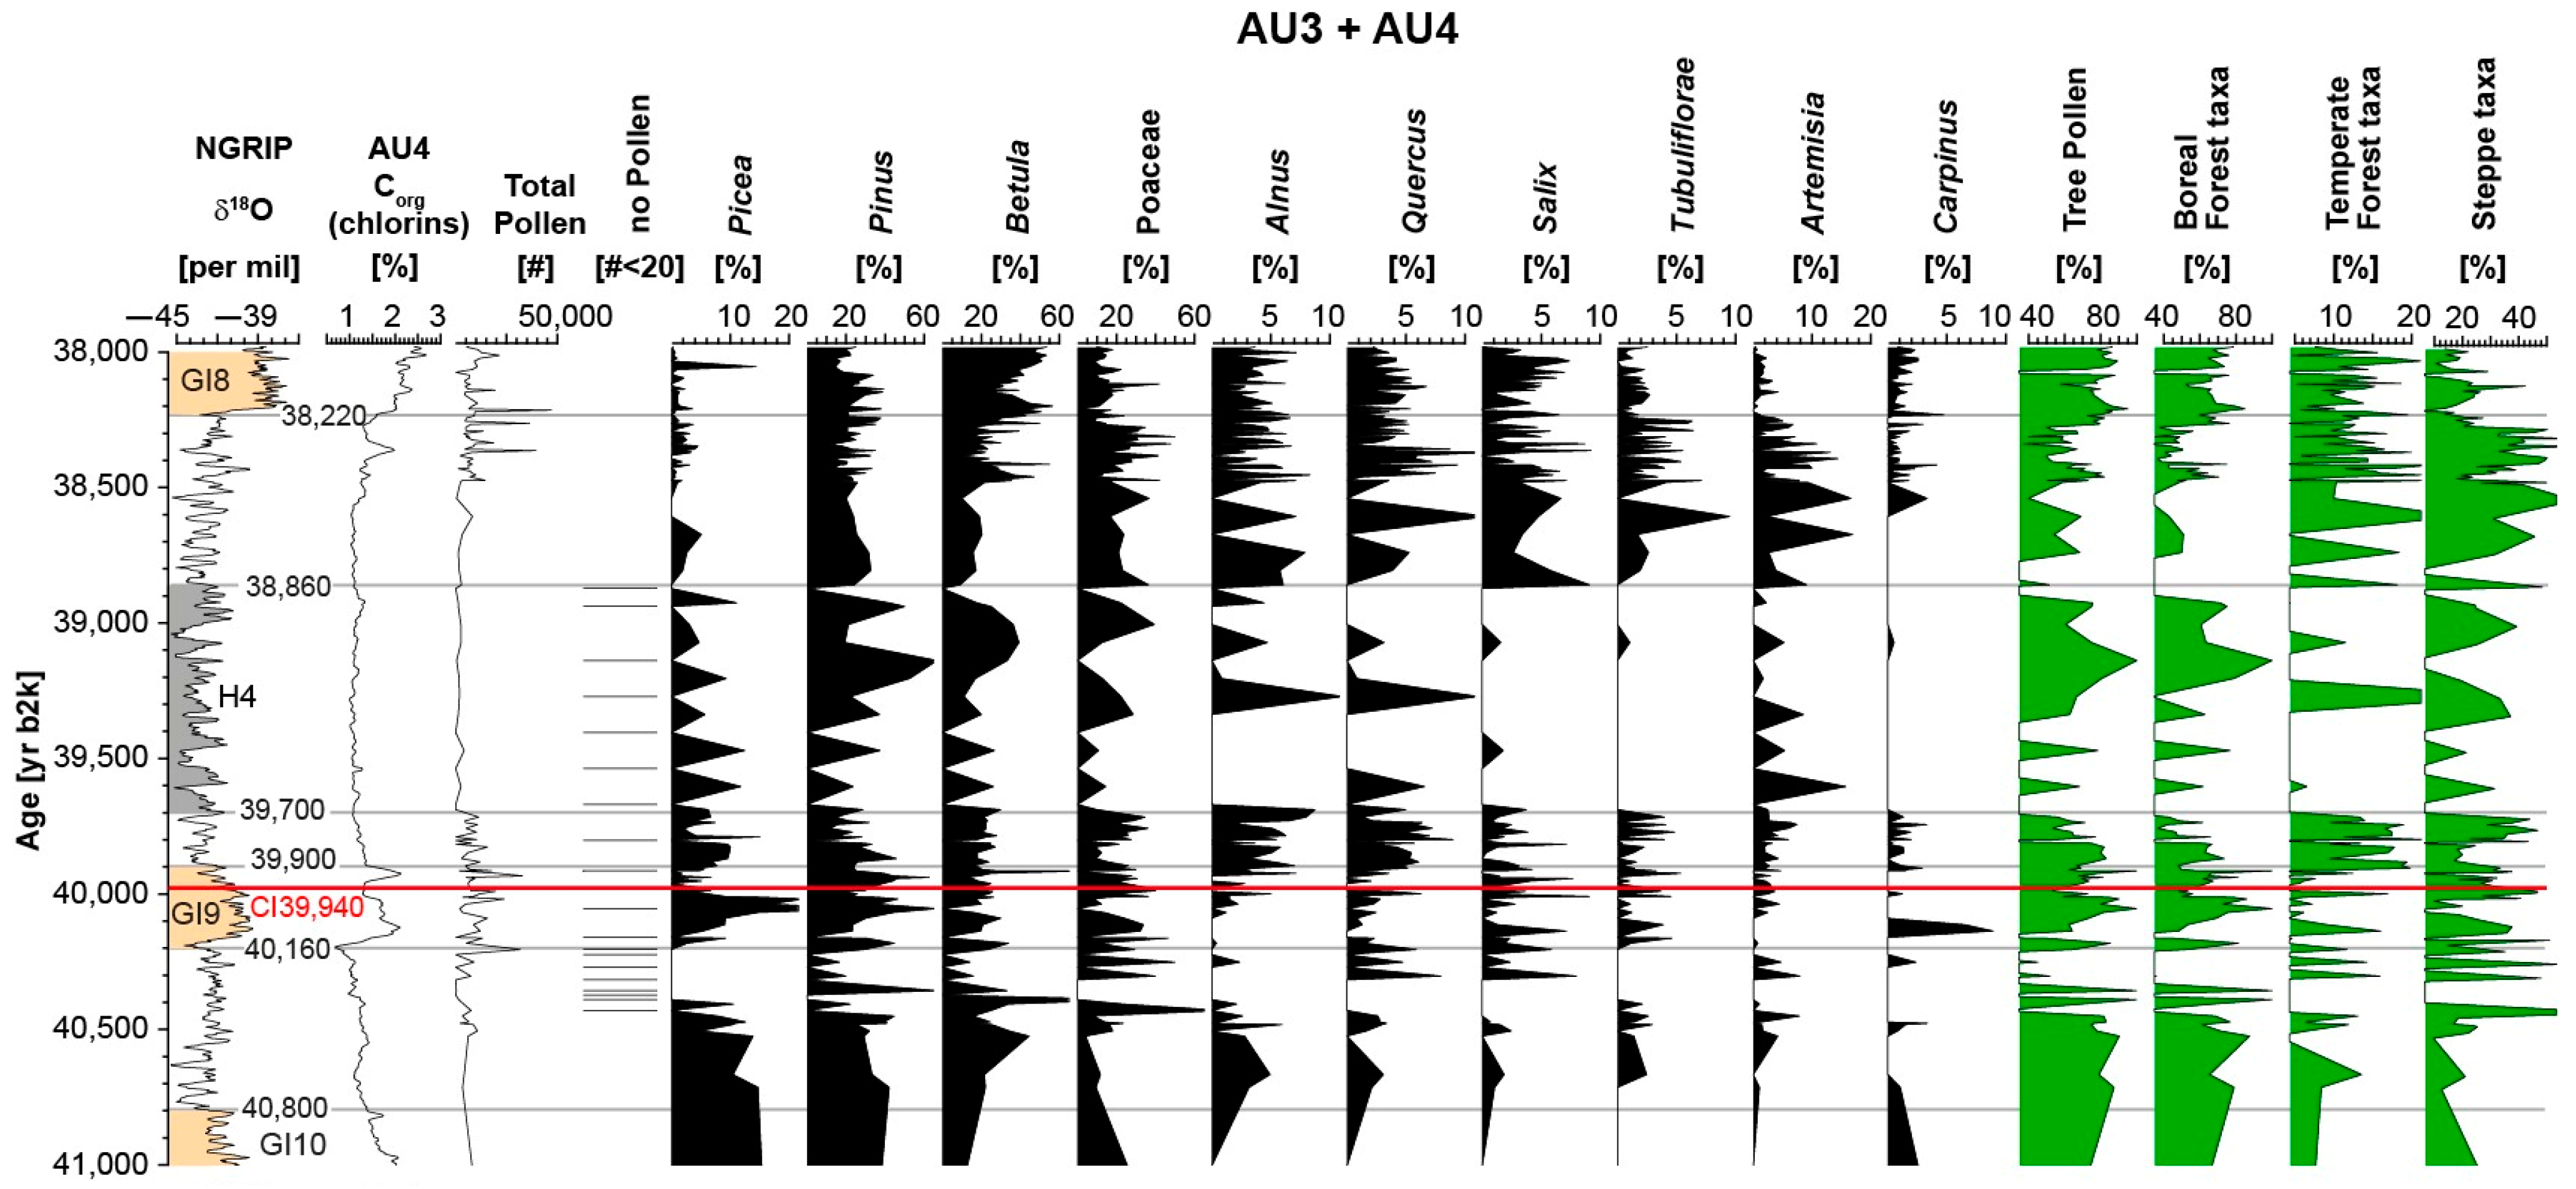
2.5. Pollen
3. Results
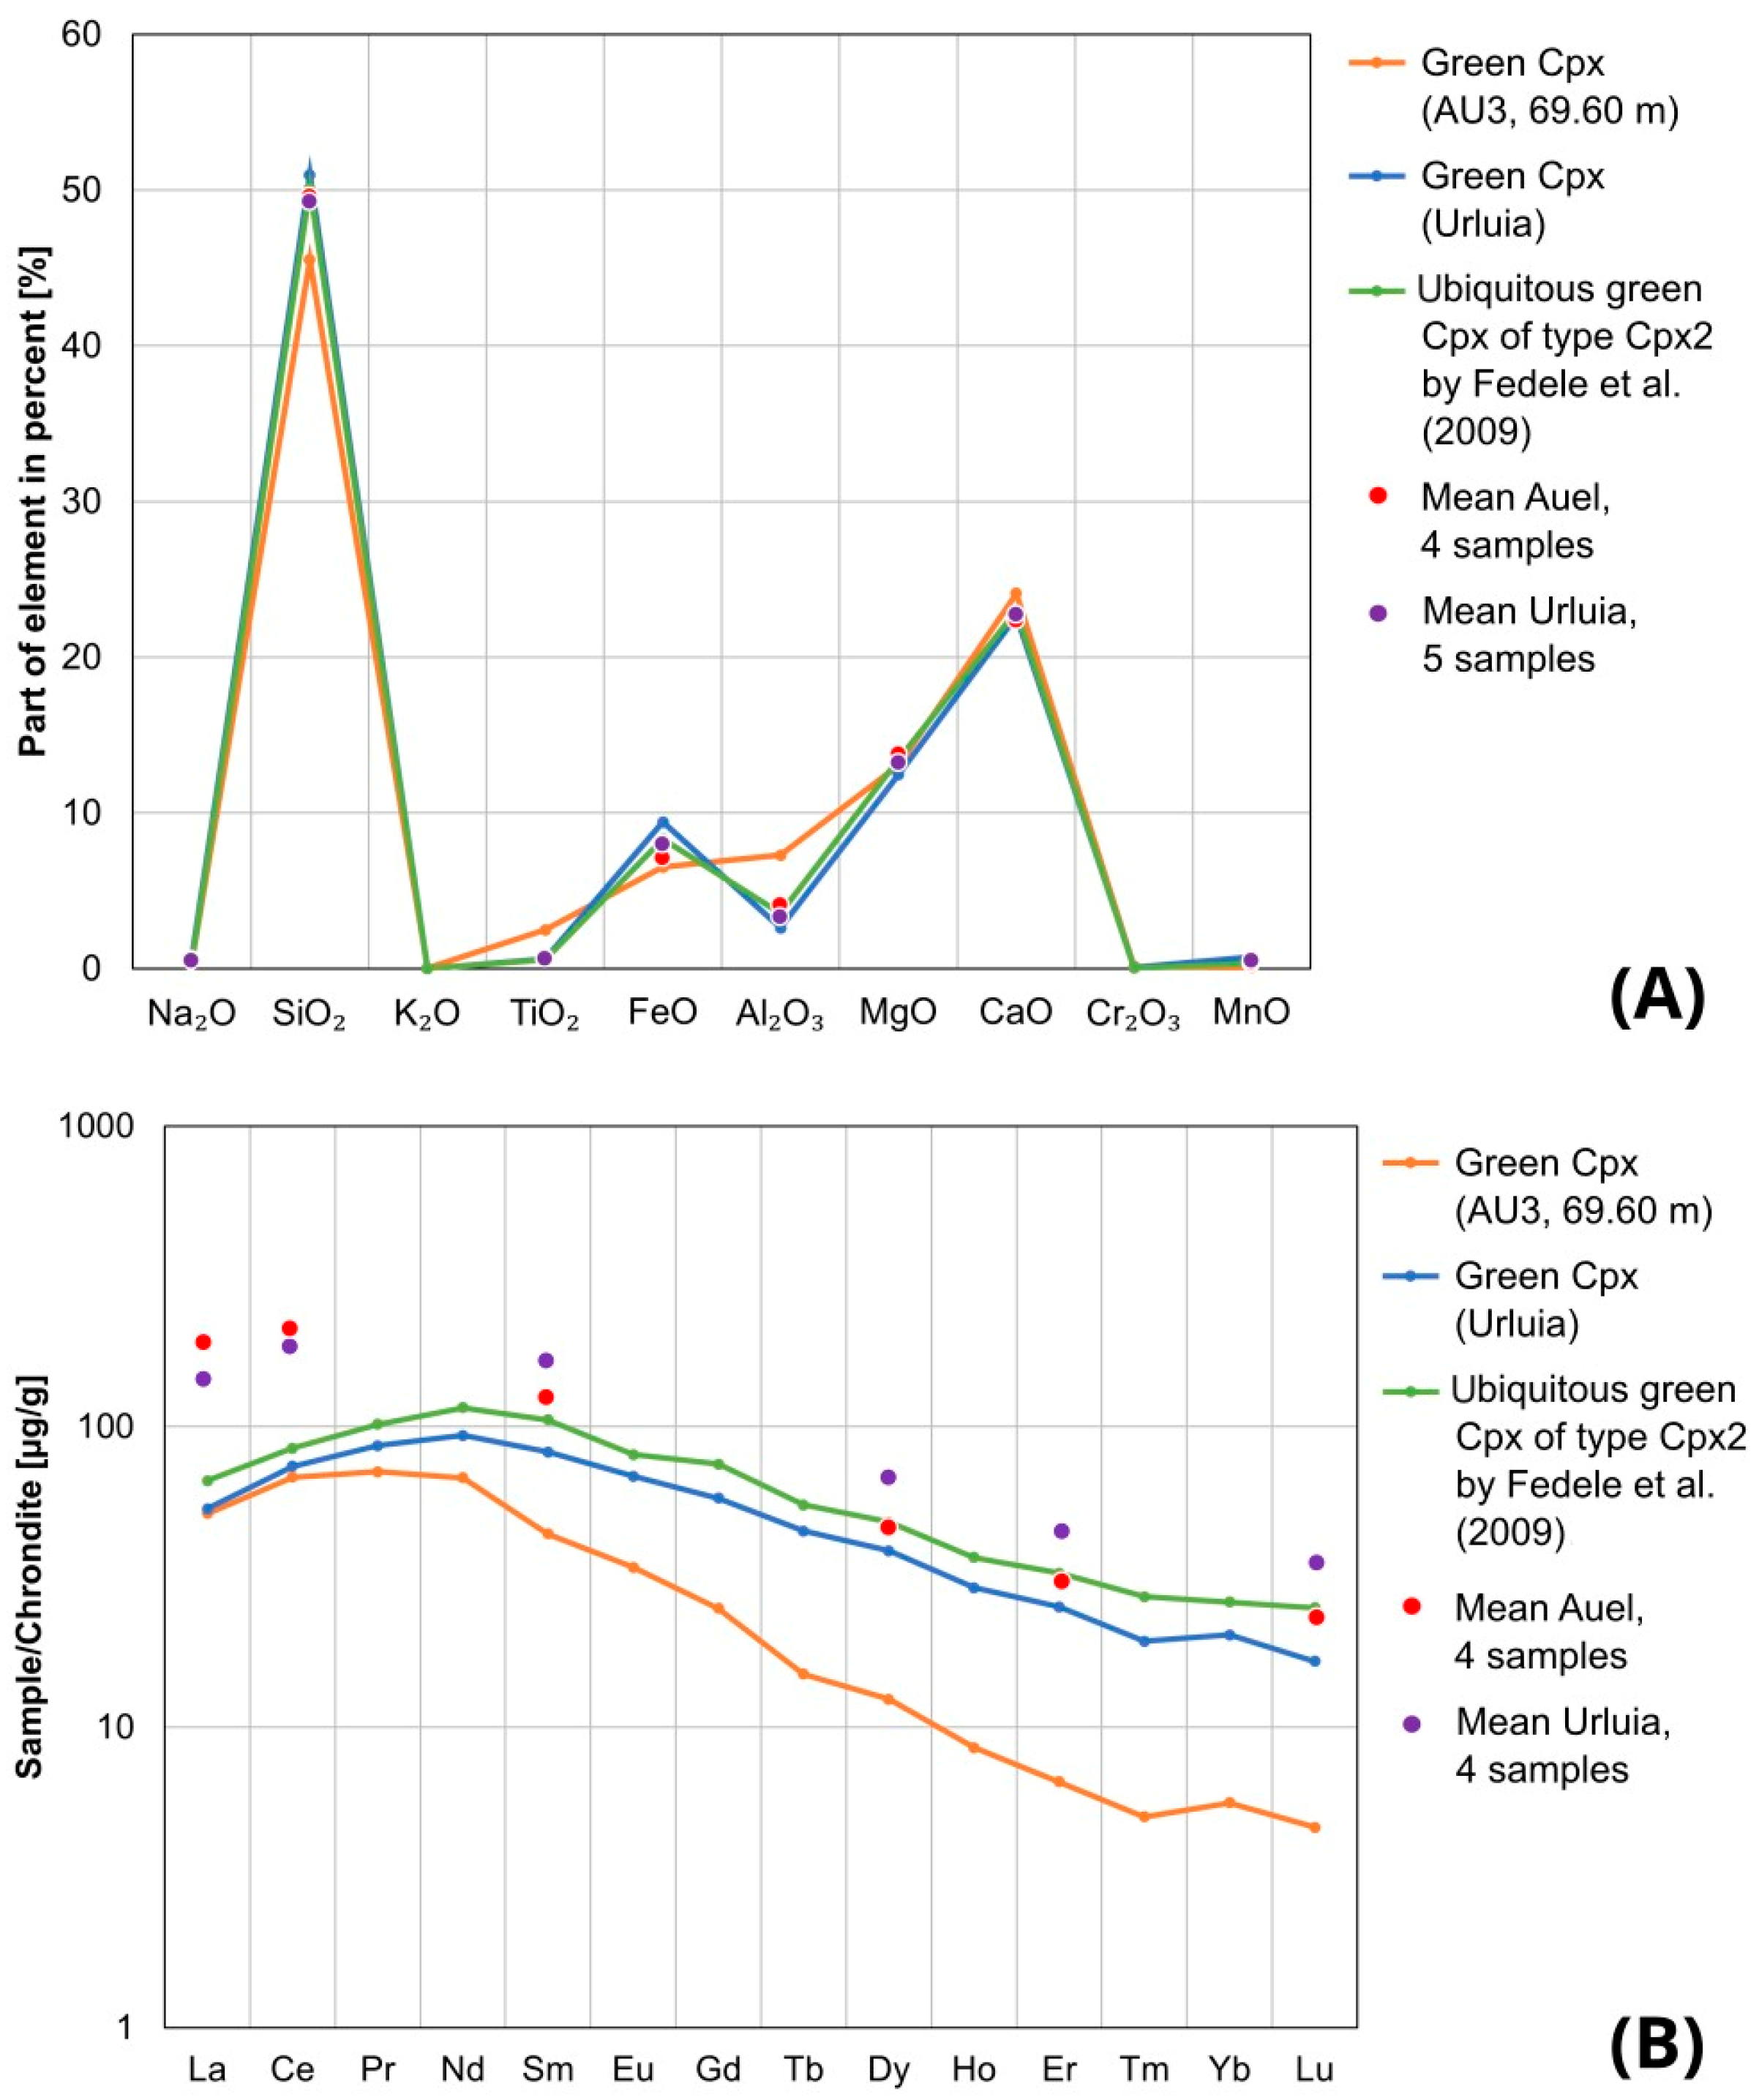
3.1. Geochemical Analysis
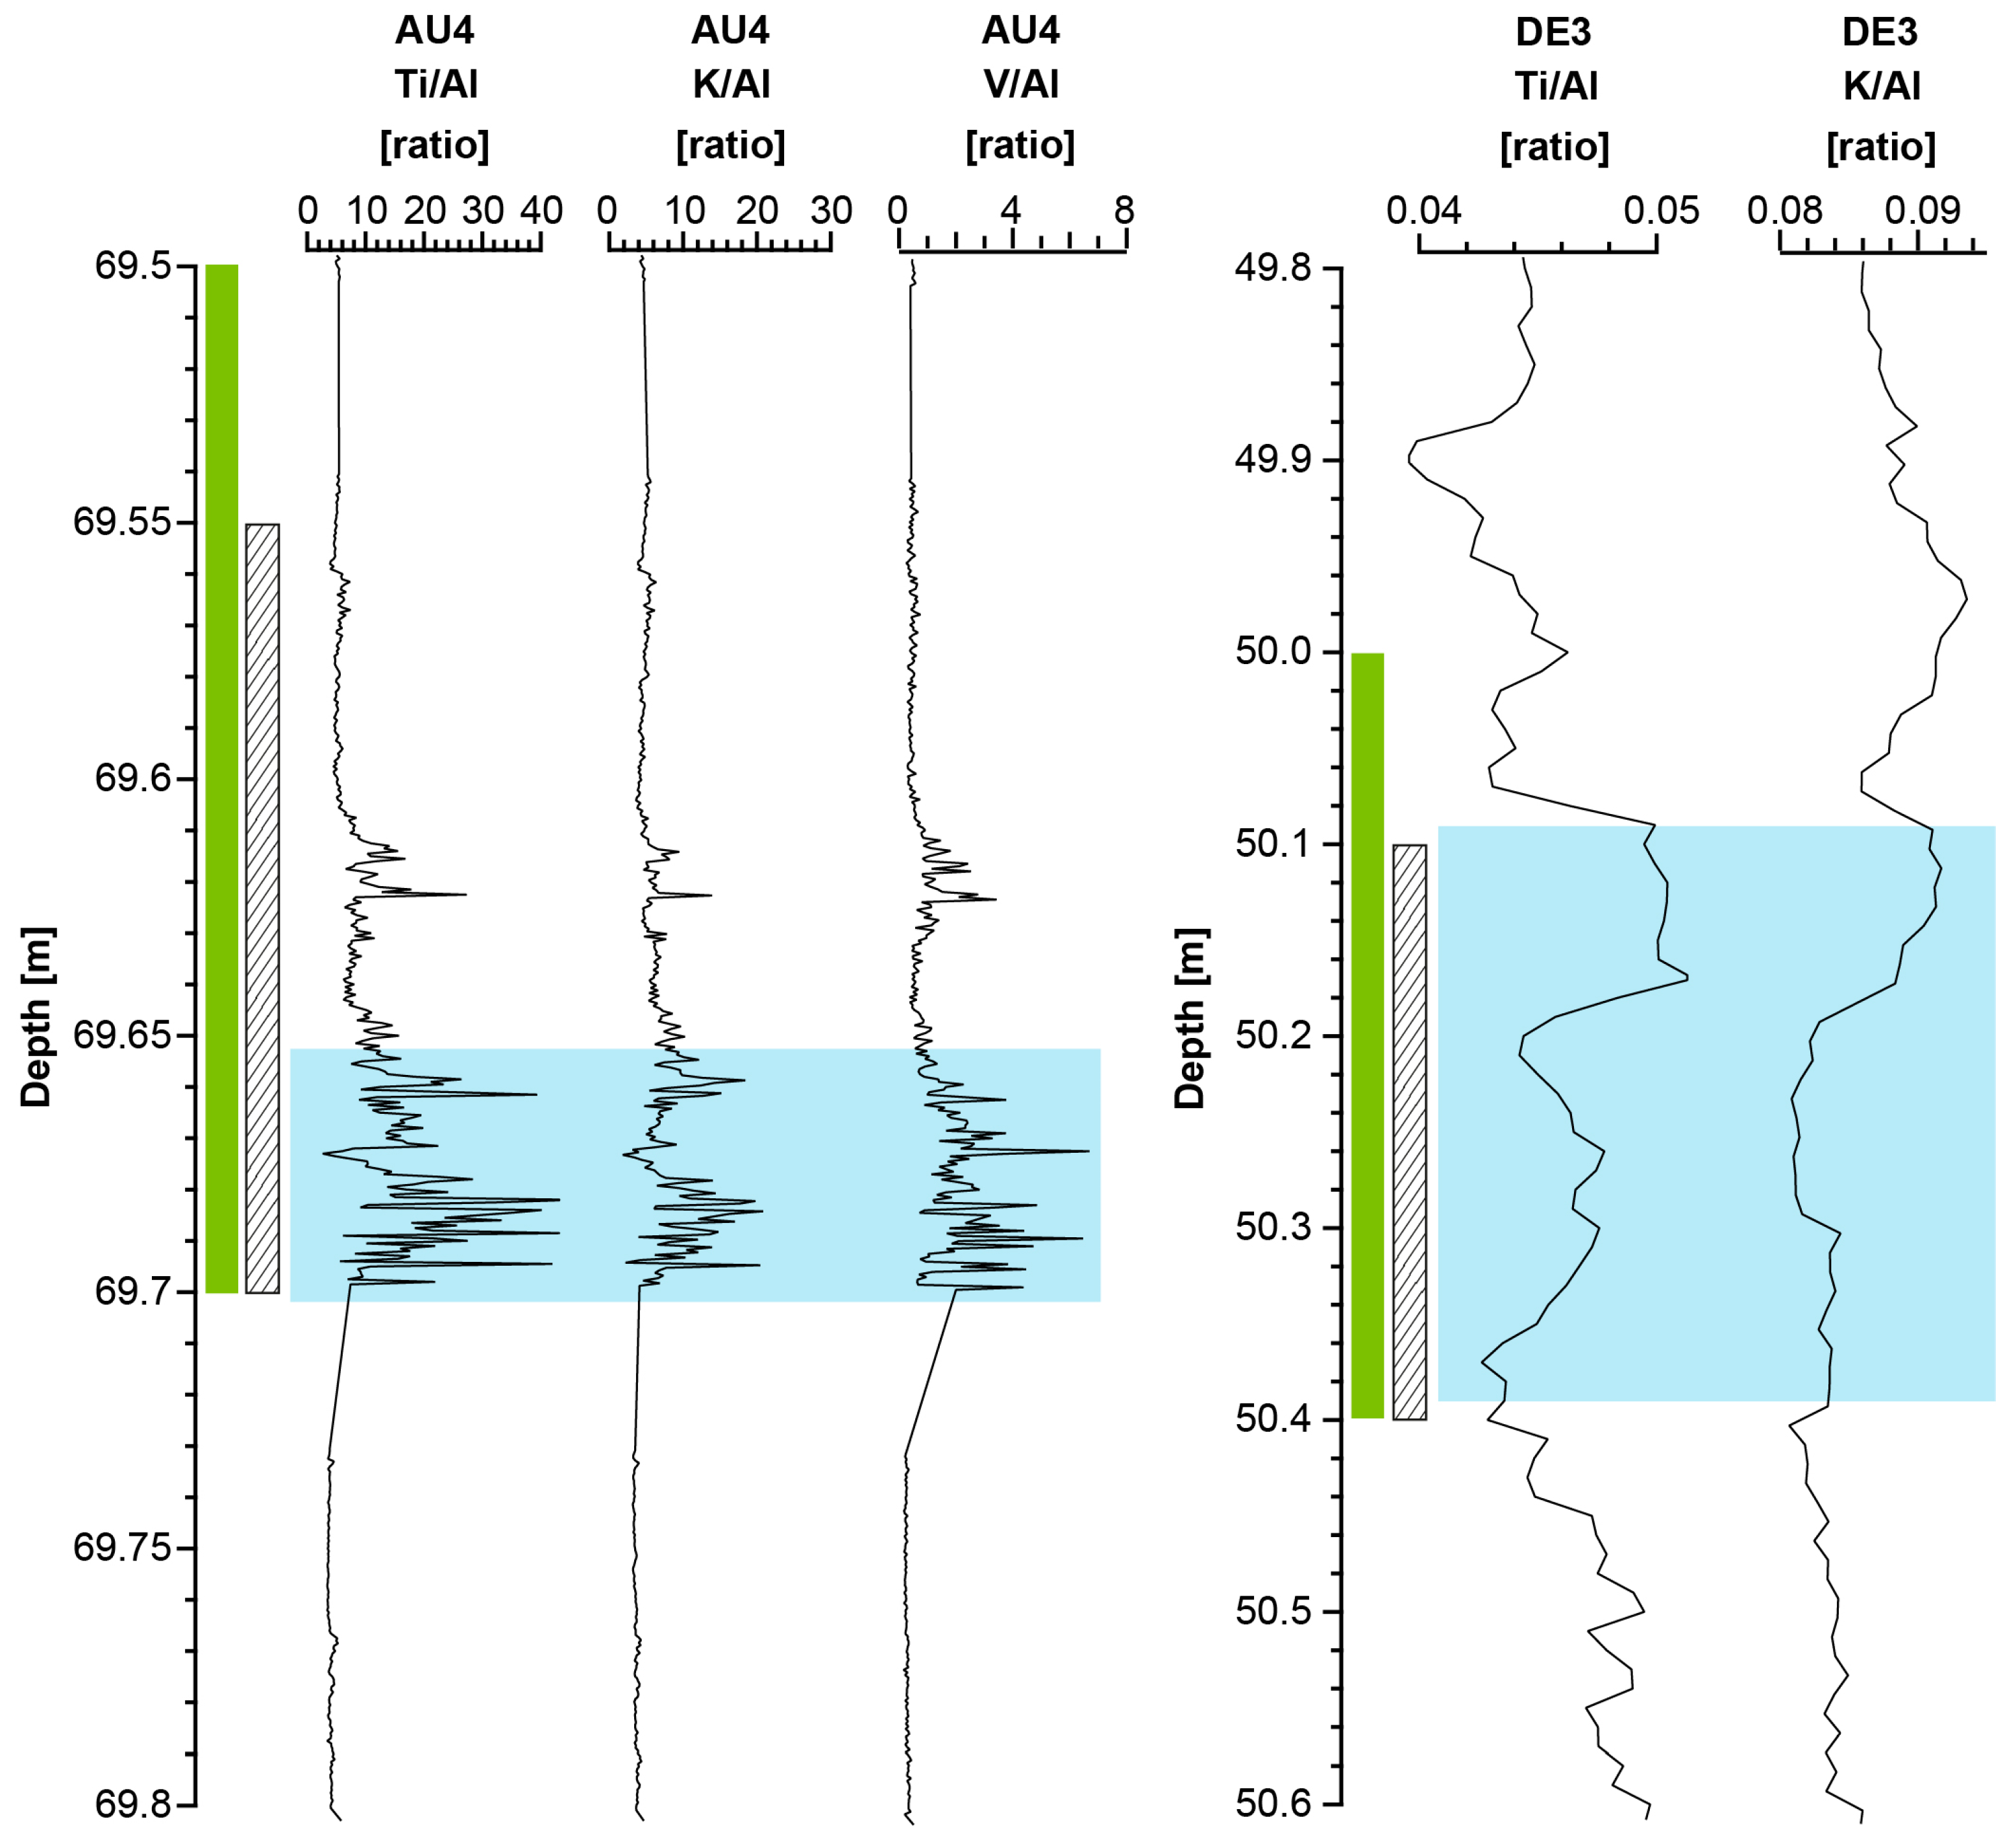
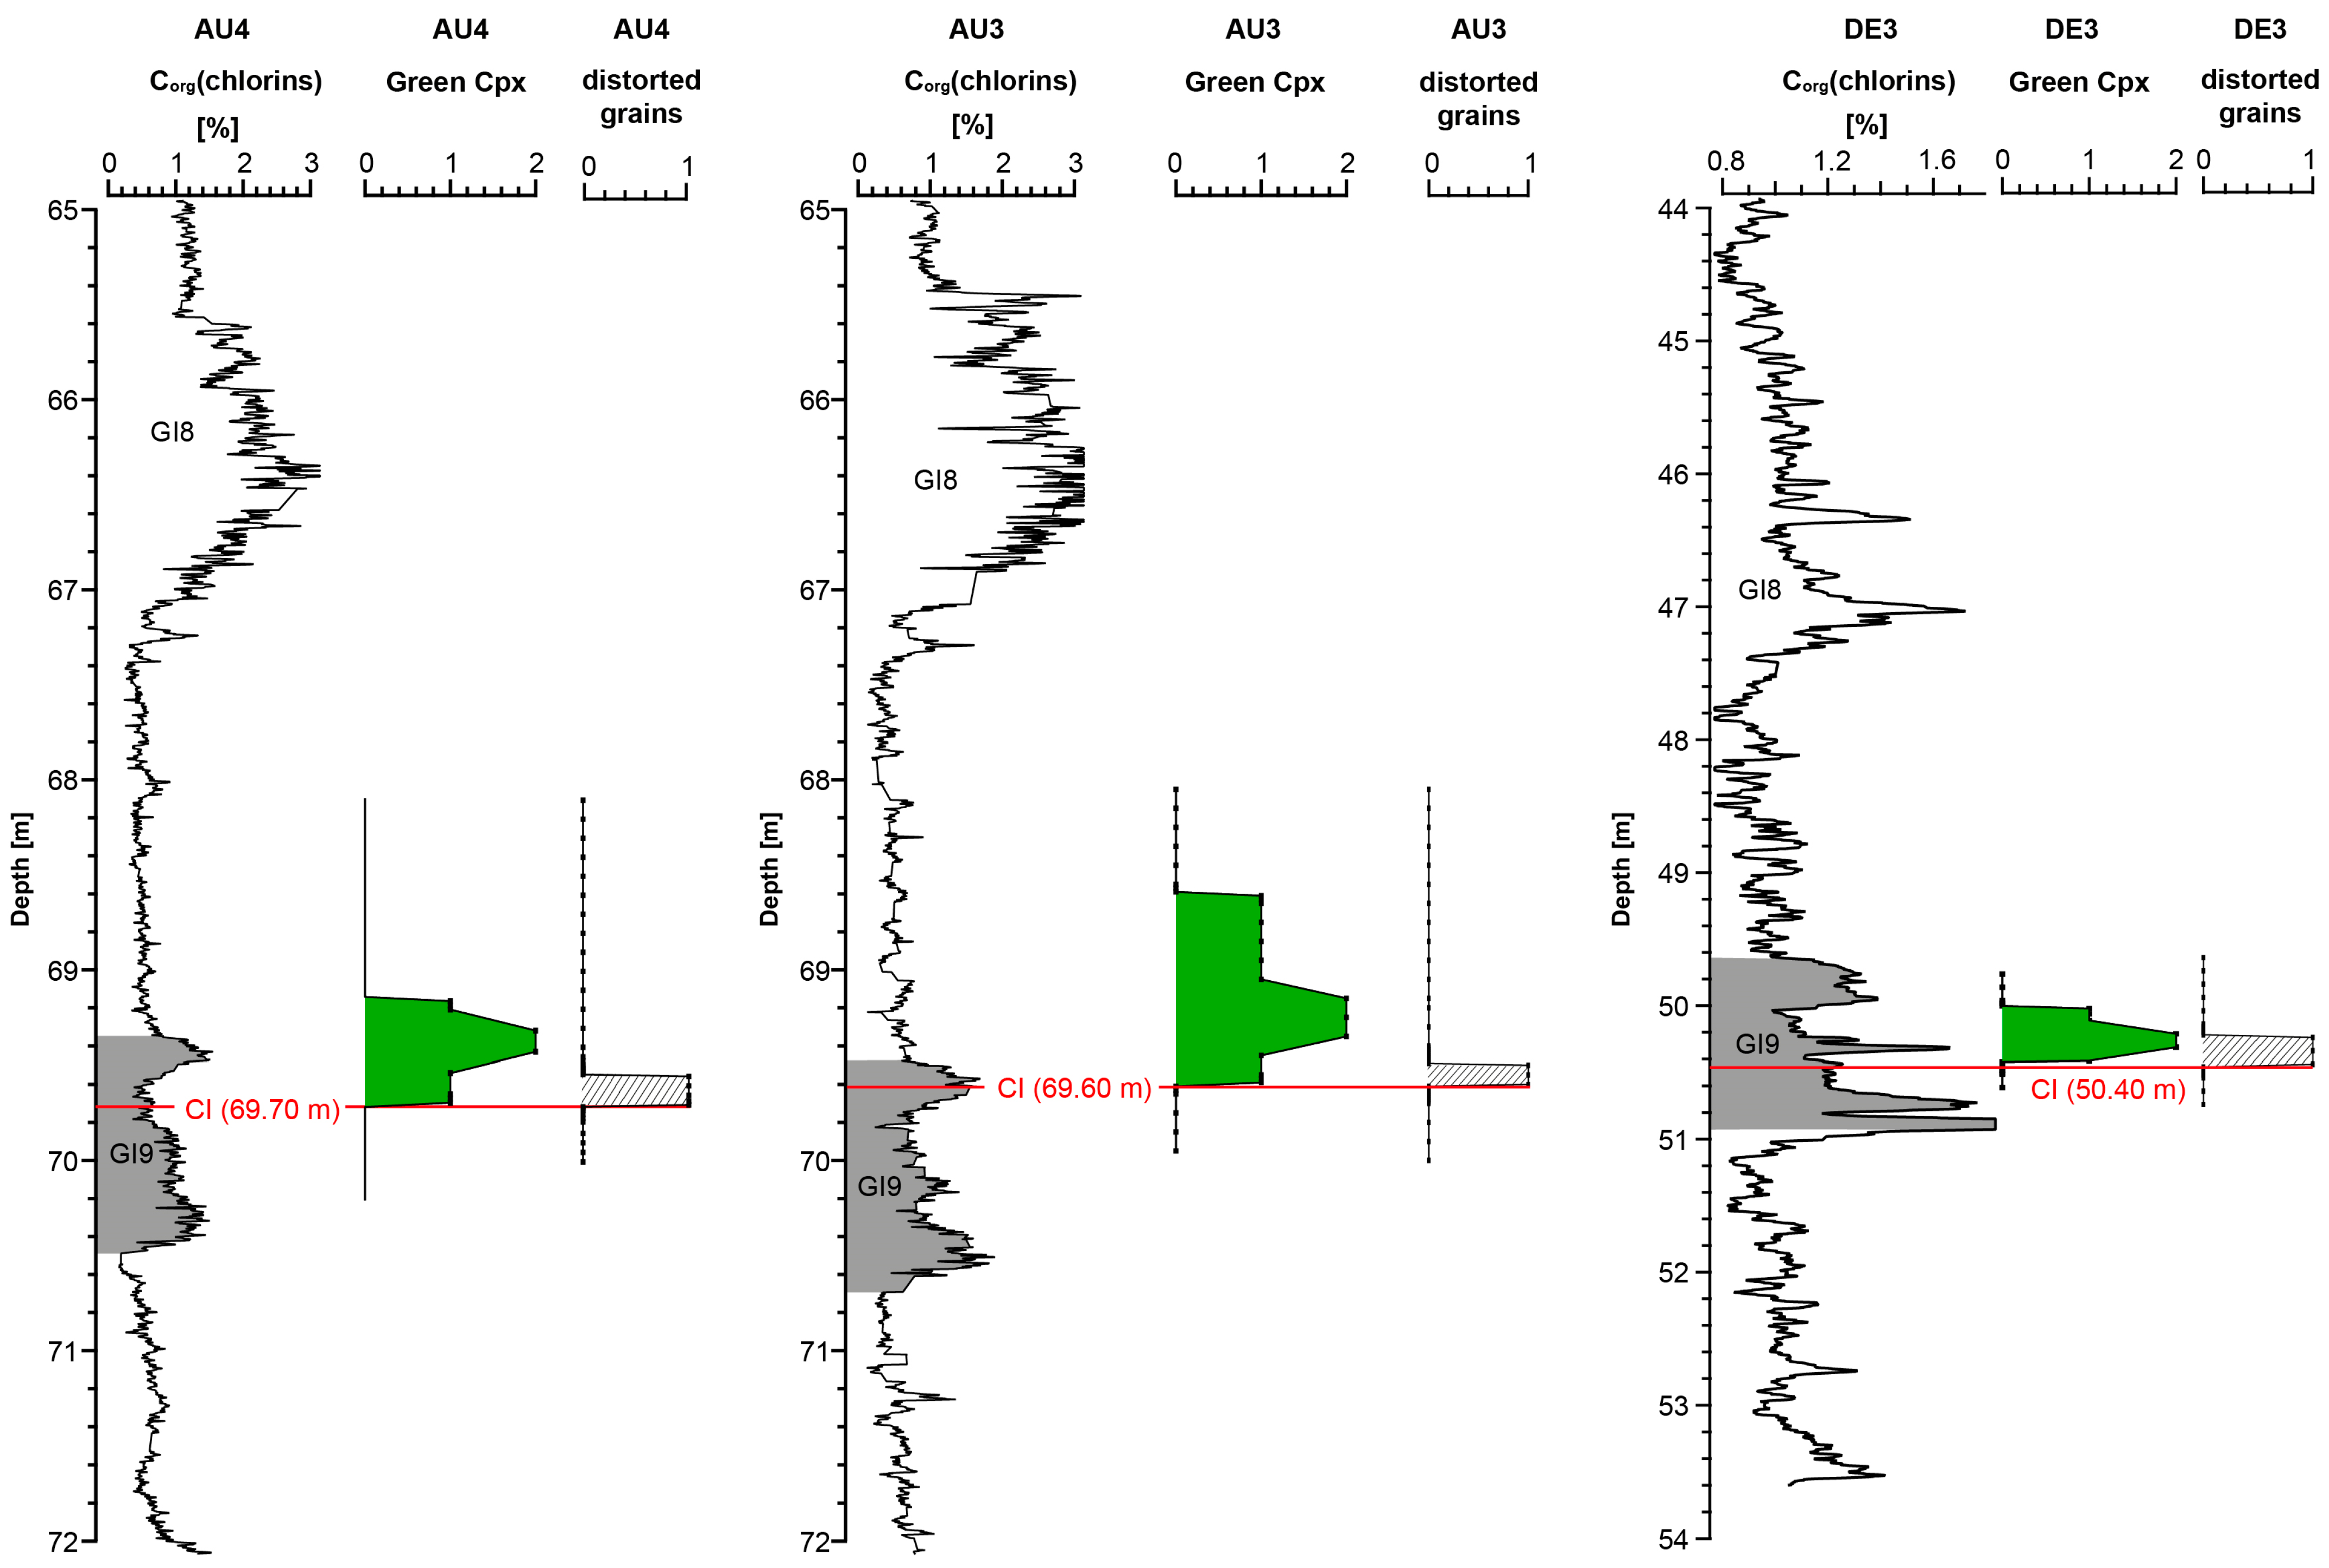
3.2. Stratigraphy
3.3. Result Summary
4. Discussion
4.1. Environmental Change Associated with the Campanian Ignimbrite/Y-5–tephra
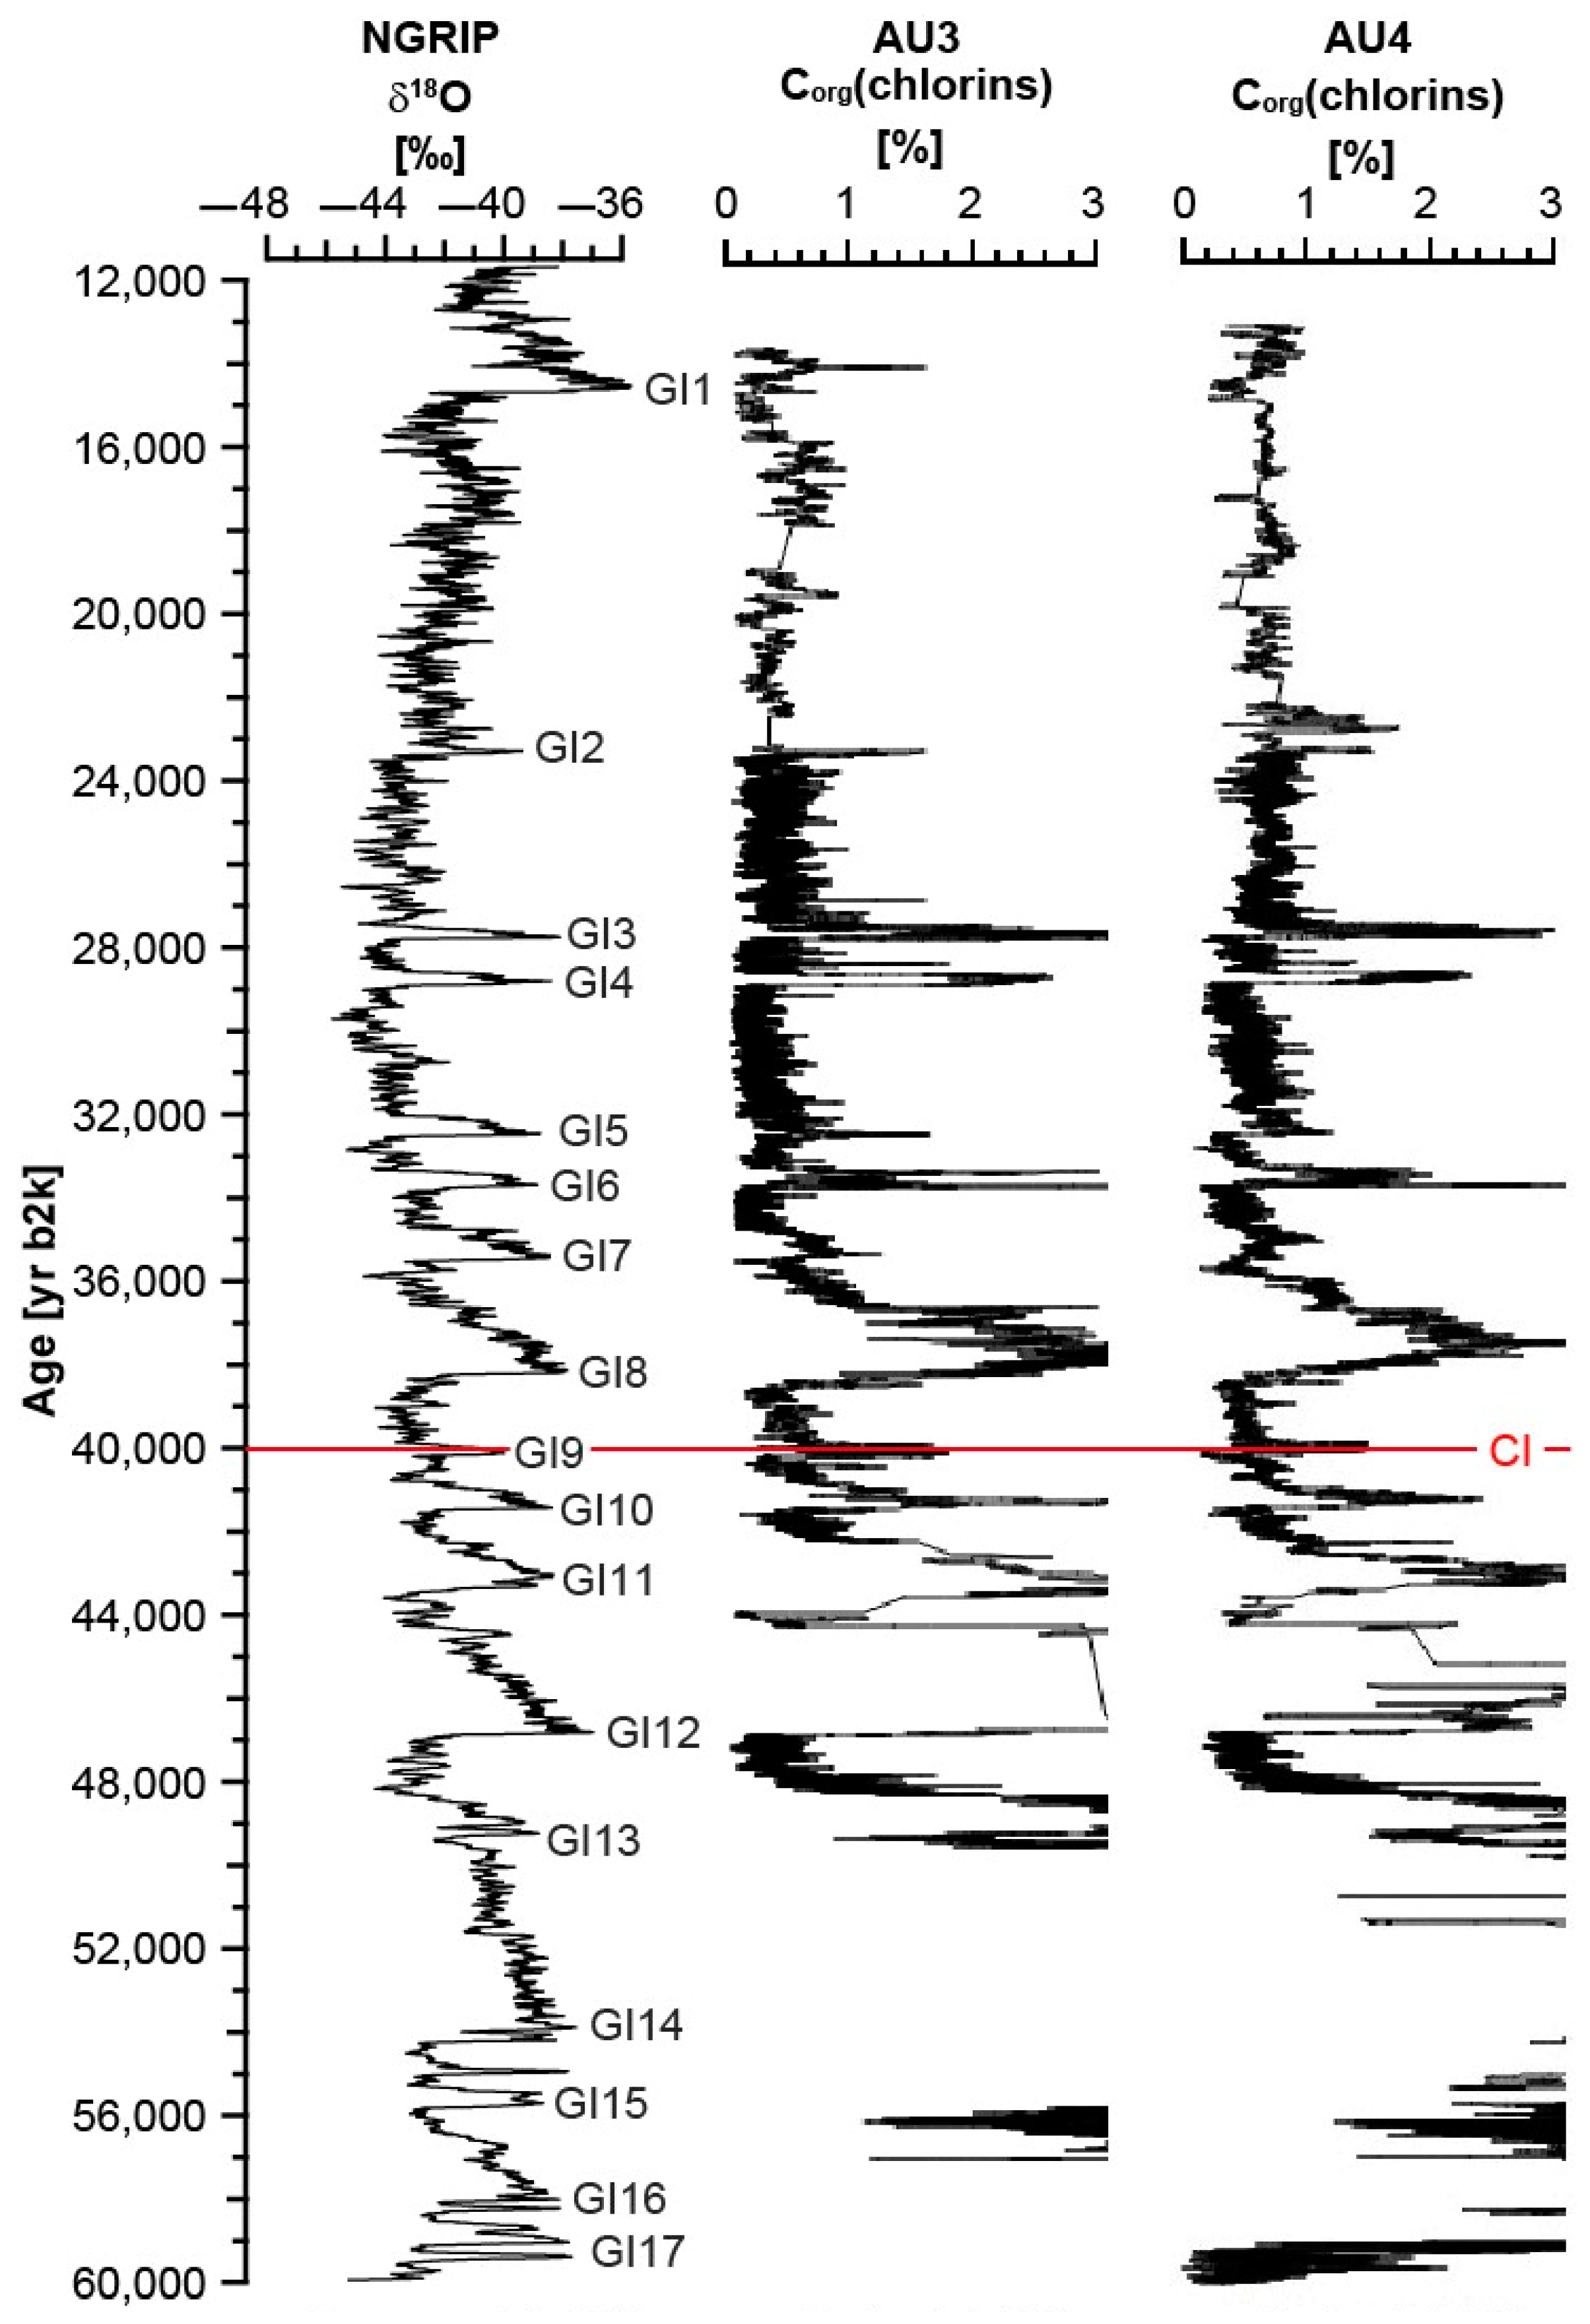
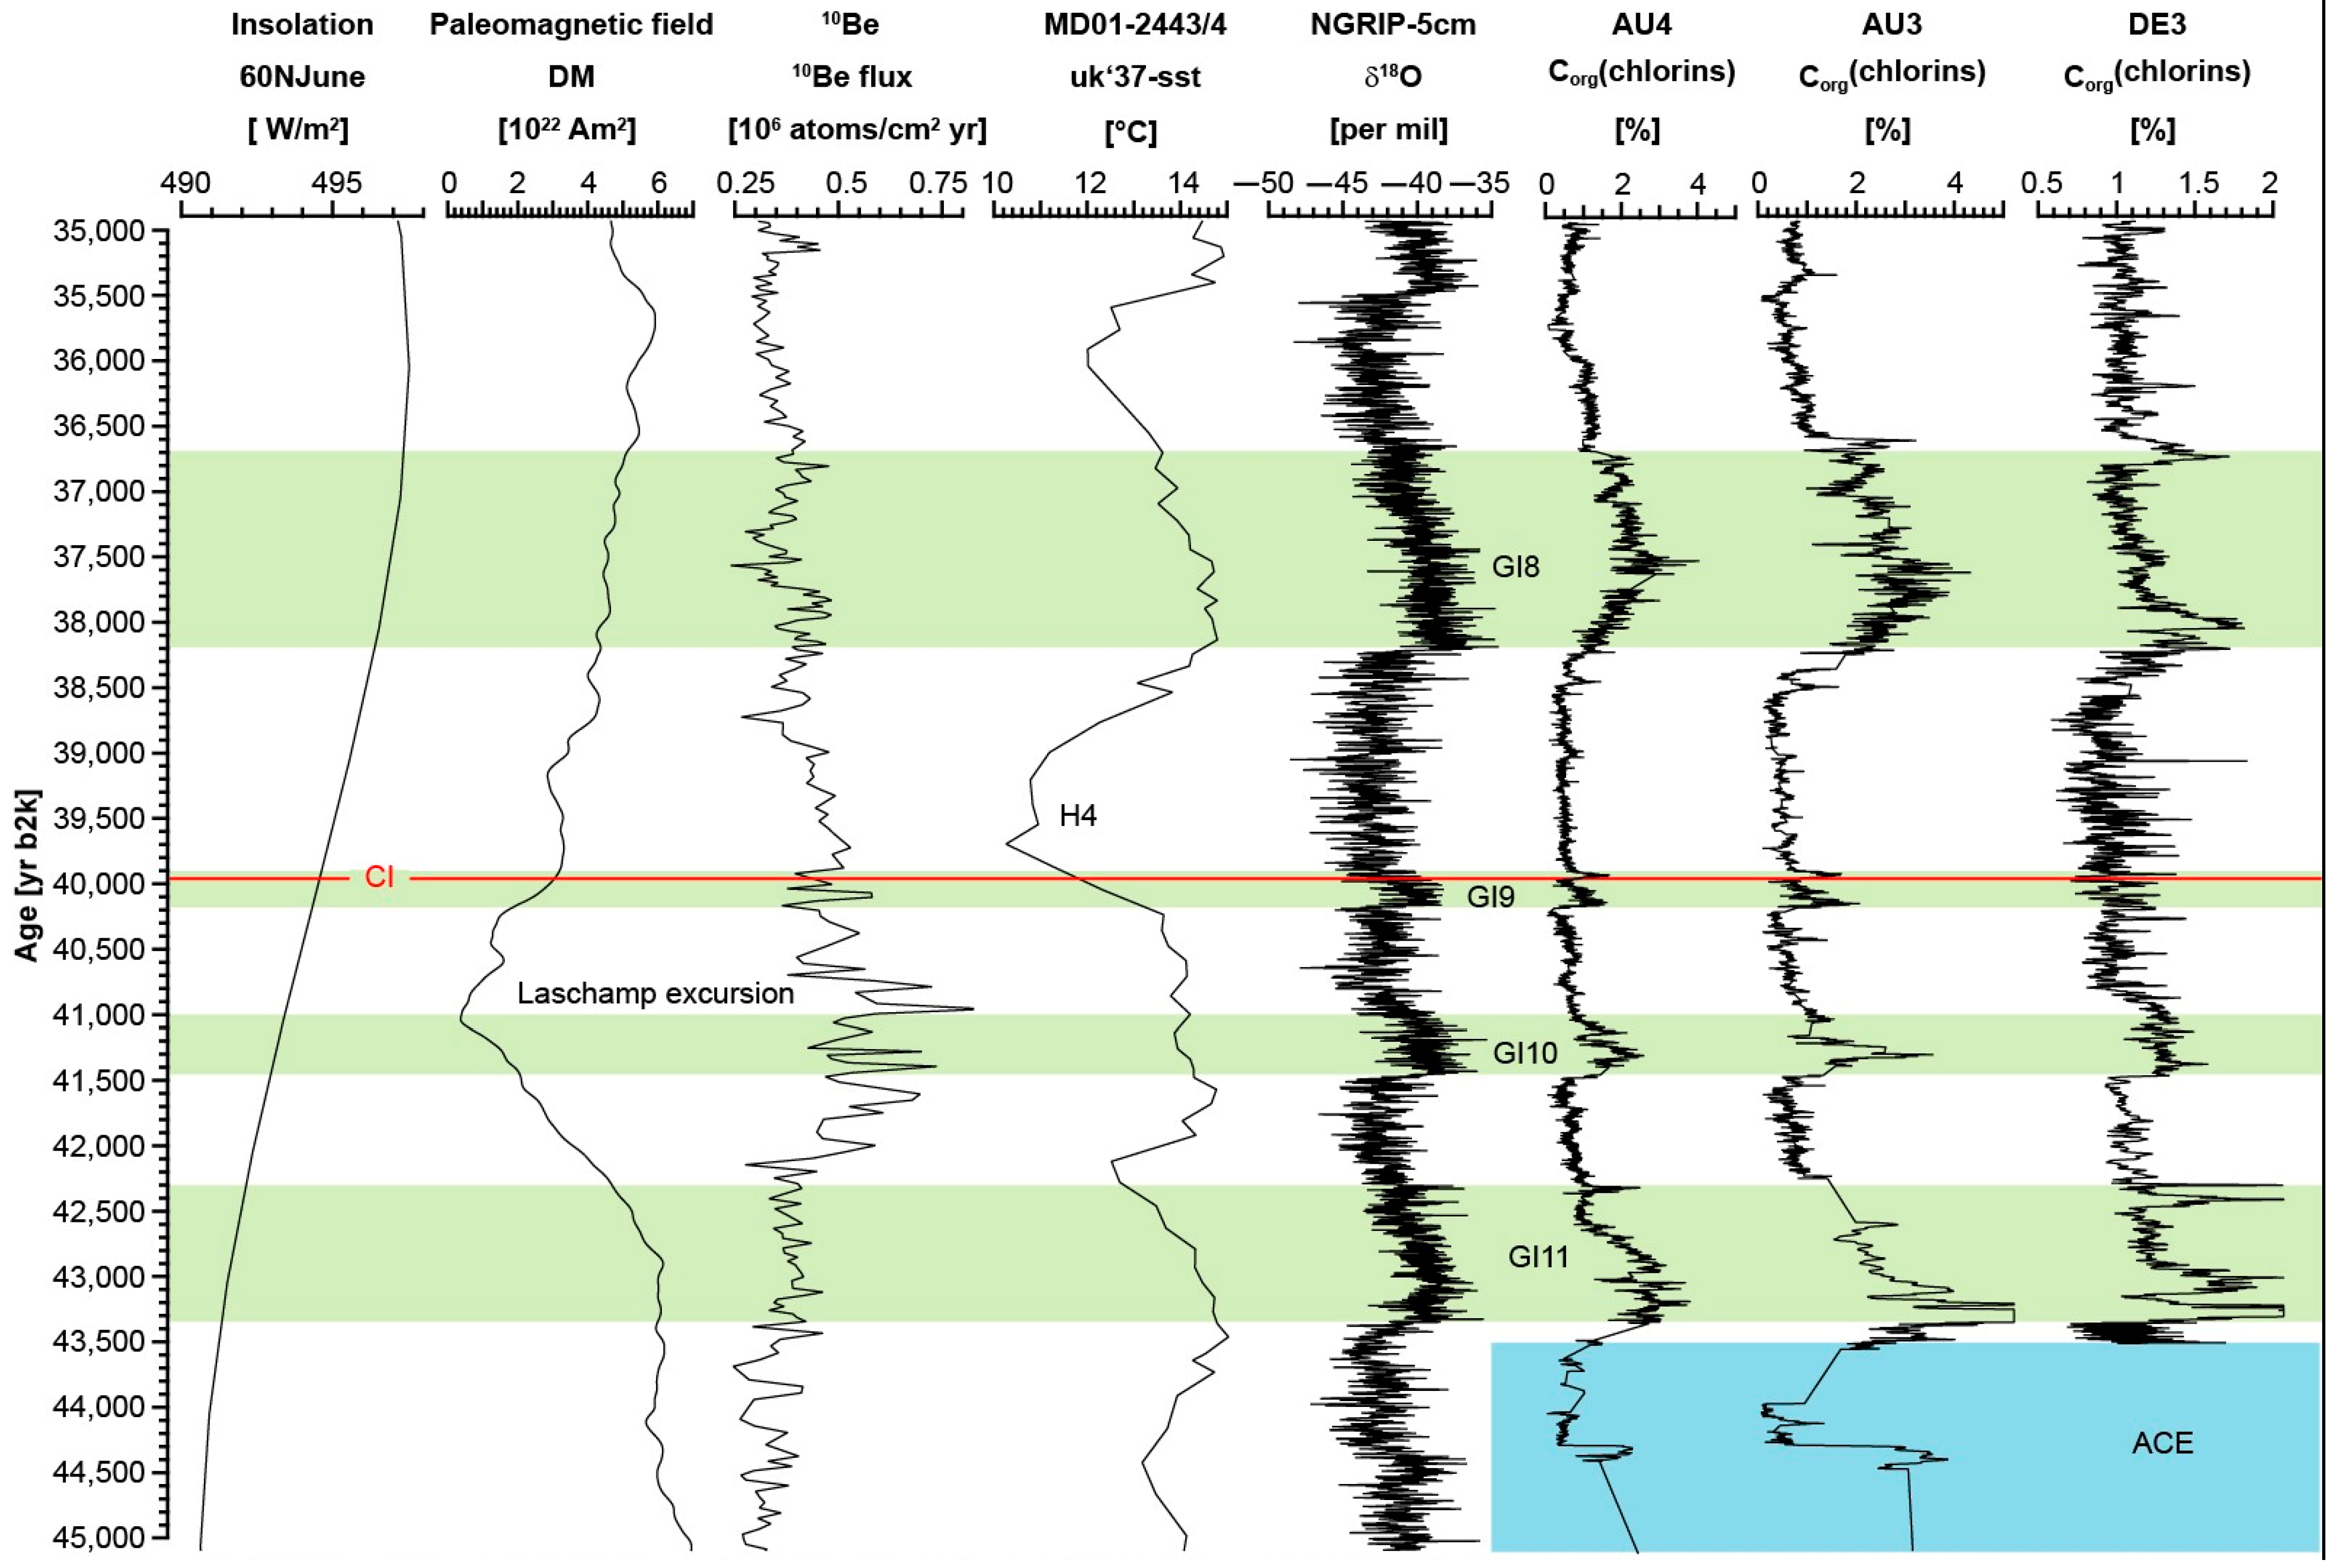
4.2. Comparison to the Global Climate between 45,000 and 35,000 yr b2k
5. Conclusions
Author Contributions
Funding
Data Availability Statement
Acknowledgments
Conflicts of Interest
Appendix A

| Sample ID | SiO2 | TiO2 | Al2O3 | FeO | MnO | MgO | CaO | Na2O |
|---|---|---|---|---|---|---|---|---|
| Auel (AU) | ||||||||
| AU-1 | 50.13 | 0.29 | 4.38 | 6.60 | 0.12 | 14.05 | 22.23 | 0.66 |
| AU-2 | 49.54 | 0.63 | 3.76 | 8.37 | 0.39 | 13.20 | 22.60 | 0.43 |
| AU-3 | 48.70 | 1.16 | 5.53 | 4.44 | 0.10 | 14.91 | 22.43 | 0.54 |
| AU-4.2 | 49.87 | 0.65 | 2.57 | 8.90 | 0.78 | 12.84 | 22.15 | 0.64 |
| Mean * | 49.56 | 0.68 | 4.06 | 7.08 | 0.35 | 13.75 | 22.35 | 0.57 |
| Urluia (URL) | ||||||||
| URL-1 | 49.10 | 0.54 | 3.47 | 8.11 | 0.44 | 13.23 | 22.55 | 0.43 |
| URL-2 | 49.95 | 0.40 | 2.68 | 7.52 | 0.42 | 13.61 | 23.06 | 0.49 |
| URL-4 | 48.17 | 0.71 | 4.05 | 8.51 | 0.41 | 12.80 | 22.69 | 0.48 |
| URL-6.2 | 49.39 | 0.65 | 2.39 | 9.24 | 0.83 | 12.11 | 22.87 | 0.60 |
| URL-6.3 | 49.53 | 0.82 | 3.98 | 6.33 | 0.36 | 14.31 | 22.36 | 0.45 |
| Mean ** | 49.23 | 0.63 | 3.31 | 8.00 | 0.49 | 13.21 | 22.71 | 0.49 |
| Phlegraean Fields, cf. Fedele et al. [35] | ||||||||
| Mean *** | 50.10 | 0.58 | 3.57 | 8.31 | 0.35 | 13.46 | 22.98 | 0.34 |
| (a) | ||||||
| Sample ID | Na2O | K2O | Cl | FeO | SiO2 | P2O5 |
| Urluia (URL) | ||||||
| URL-3.2 | 8.88 | 5.18 | 0.59 | 3.52 | 55.27 | 0.00 |
| URL-5 | 4.29 | 8.42 | 0.39 | 2.72 | 60.47 | 0.07 |
| URL-6.1 | 4.68 | 8.02 | 0.51 | 3.04 | 58.03 | 0.04 |
| URLb_4-3 | 6.04 | 7.60 | 0.64 | 2.76 | 59.26 | 0.06 |
| URL_1-1a | 4.18 | 8.47 | 0.35 | 2.99 | 60.12 | 0.10 |
| Mean * | 5.61 | 7.54 | 0.50 | 3.01 | 58.63 | 0.05 |
| Auel ** | 6.18 | 7.24 | 0.49 | 2.65 | 60.01 | 0.08 |
| Phlegraean Fields, cf. Fedele et al. [35] | ||||||
| Mean *** | 4.53 | 8.42 | 2.84 | 59.78 | 0.20 | |
| (b) | ||||||
| Sample ID | CaO | MnO | MgO | TiO2 | Al2O3 | Total |
| Urluia (URL) | ||||||
| URL-3.2 | 1.30 | 0.42 | 0.19 | 0.35 | 22.51 | 98.21 |
| URL-5 | 1.98 | 0.12 | 0.56 | 0.31 | 18.39 | 97.72 |
| URL-6.1 | 2.07 | 0.18 | 0.58 | 0.44 | 17.87 | 95.46 |
| URLb_4-3 | 1.73 | 0.24 | 0.33 | 0.42 | 18.43 | 97.50 |
| URL_1-1a | 2.12 | 0.10 | 0.52 | 0.35 | 18.03 | 97.33 |
| Mean * | 1.84 | 0.21 | 0.44 | 0.37 | 19.05 | 97.25 |
| Auel ** | 1.66 | 0.17 | 0.41 | 0.32 | 18.72 | 97.93 |
| Phlegraean Fields, cf. Fedele et al. [35] | ||||||
| Mean *** | 1.96 | 0.22 | 0.47 | 0.38 | 18.18 | |
| Element | Mean Phlegraean Fields 11 Samples | Chondrite Normalized Data [51] |
|---|---|---|
| La | 16.18 | 66.16 |
| Ce | 54.09 | 84.80 |
| Pr | 9.82 | 101.88 |
| Nd | 54.82 | 115.70 |
| Sm | 16.22 | 105.31 |
| Eu | 4.68 | 80.71 |
| Gd | 15.32 | 74.98 |
| Tb | 2.05 | 54.86 |
| Dy | 12.25 | 48.19 |
| Ho | 2.08 | 36.75 |
| Er | 5.40 | 32.55 |
| Tm | 0.70 | 27.23 |
| Yb | 4.31 | 26.10 |
| Lu | 0.63 | 24.99 |
| Oxides | Green Cpx (AU3, 69.60 m) | Green Cpx (Urluia) |
|---|---|---|
| Na2O | 0.33 | 0.65 |
| SiO2 | 45.52 | 50.98 |
| K2O | 0.02 | 0.02 |
| TiO2 | 2.50 | 0.64 |
| FeO | 6.52 | 9.41 |
| Al2O3 | 7.29 | 2.62 |
| MgO | 13.06 | 12.47 |
| CaO | 24.10 | 22.63 |
| Cr2O3 | 0.14 | 0.07 |
| MnO | 0.10 | 0.74 |
| Element | Green Cpx (AU3, 69.60 m) | Green Cpx (Urluia) |
|---|---|---|
| La | 51.39 | 53.31 |
| Ce | 67.97 | 73.85 |
| Pr | 70.77 | 86.54 |
| Nd | 67.60 | 93.42 |
| Sm | 43.96 | 82.34 |
| Eu | 34.06 | 68.42 |
| Gd | 24.87 | 57.81 |
| Tb | 15.03 | 44.94 |
| Dy | 12.40 | 38.65 |
| Ho | 8.55 | 29.10 |
| Er | 6.59 | 25.18 |
| Tm | 5.04 | 19.30 |
| Yb | 5.61 | 20.30 |
| Lu | 4.65 | 16.58 |
References
- Sirocko, F.; Krebsbach, F.; Albert, J.; Britzius, S.; Schenk, F.; Förster, M.W. Relation between the Central European Climate Change and the Eifel Volcanism during the Last 130,000 Years: The ELSA-23 Tephra Stack. Preprints 2023, 2023121783. Quaternary, 2023; submitted. [Google Scholar]
- Sirocko, F.; Martínez-García, A.; Mudelsee, M.; Albert, J.; Britzius, S.; Christl, M.; Diehl, D.; Diensberg, B.; Friedrich, R.; Fuhrmann, F.; et al. Muted Multidecadal Climate Variability in Central Europe during Cold Stadial Periods. Nat. Geosci. 2021, 14, 651–658. [Google Scholar] [CrossRef]
- Förster, M.W.; Zemlitskaya, A.; Otter, L.M.; Buhre, S.; Sirocko, F. Late Pleistocene Eifel Eruptions: Insights from Clinopyroxene and Glass Geochemistry of Tephra Layers from Eifel Laminated Sediment Archive Sediment Cores. J. Quat. Sci. 2020, 35, 186–198. [Google Scholar] [CrossRef]
- Silleni, A.; Giordano, G.; Isaia, R.; Ort, M.H. The Magnitude of the 39.8 ka Campanian Ignimbrite Eruption, Italy: Method, Uncertainties and Errors. Front. Earth Sci. 2020, 8, 543399. [Google Scholar] [CrossRef]
- Pabst, S.; Wörner, G.; Civetta, L.; Tesoro, R. Magma Chamber Evolution Prior to the Campanian Ignimbrite and Neapolitan Yellow Tuff Eruptions (Campi Flegrei, Italy). Bull. Volcanol. 2008, 70, 961–976. [Google Scholar] [CrossRef]
- Fisher, R.V.; Schmincke, H.-U. Pyroclastic Rocks; Springer: Berlin/Heidelberg, Germany, 1984; ISBN 978-3-540-12756-7. [Google Scholar]
- Fedele, F.G.; Giaccio, B.; Isaia, R.; Orsi, G. The Campanian Ignimbrite Eruption, Heinrich Event 4, and Palaeolithic Change in Europe: A High-Resolution Investigation. Geophys. Monogr. Ser. 2003, 139, 301–325. [Google Scholar] [CrossRef]
- Thunell, R.; Federman, A.; Sparks, S.; Williams, D. The Age, Origin, and Volcanological Significance of the Y-5 Ash Layer in the Mediterranean. Quat. Res. 1979, 12, 241–253. [Google Scholar] [CrossRef]
- De Vivo, B.; Rolandi, G.; Gans, P.B.; Calvert, A.; Bohrson, W.A.; Spera, F.J.; Belkin, H.E. New Constraints on the Pyroclastic Eruptive History of the Campanian Volcanic Plain (Italy). Mineral. Petrol. 2001, 73, 47–65. [Google Scholar] [CrossRef]
- Giaccio, B.; Hajdas, I.; Isaia, R.; Deino, A.; Nomade, S. High-Precision 14C and 40Ar/39Ar Dating of the Campanian Ignimbrite (Y-5) Reconciles the Time-Scales of Climatic-Cultural Processes at 40 ka. Sci. Rep. 2017, 7, 45940. [Google Scholar] [CrossRef]
- Lin, J.; Svensson, A.; Hvidberg, C.S.; Lohmann, J.; Kristiansen, S.; Dahl-Jensen, D.; Steffensen, J.P.; Rasmussen, S.O.; Cook, E.; Kjær, H.A.; et al. Magnitude, Frequency and Climate Forcing of Global Volcanism during the Last Glacial Period as Seen in Greenland and Antarctic Ice Cores (60–9 ka). Clim. Past 2022, 18, 485–506. [Google Scholar] [CrossRef]
- Paterne, M.; Kallel, N.; Labeyrie, L.; Vautravers, M.; Duplessy, J.; Rossignol-Strick, M.; Cortijo, E.; Arnold, M.; Fontugne, M. Hydrological Relationship between the North Atlantic Ocean and the Mediterranean Sea during the Past 15–75 kyr. Paleoceanography 1999, 14, 626–638. [Google Scholar] [CrossRef]
- Ton-That, T.; Singer, B.; Paterne, M. 40Ar/39Ar Dating of Latest Pleistocene (41 ka) Marine Tephra in the Mediterranean Sea: Implications for Global Climate Records. Earth Planet. Sci. Lett. 2001, 184, 645–658. [Google Scholar] [CrossRef]
- Veres, D.; Lane, C.S.; Timar-Gabor, A.; Hambach, U.; Constantin, D.; Szakács, A.; Fülling, A.; Onac, B.P. The Campanian Ignimbrite/Y5 Tephra Layer—A Regional Stratigraphic Marker for Isotope Stage 3 Deposits in the Lower Danube Region, Romania. Quat. Int. 2013, 293, 22–33. [Google Scholar] [CrossRef]
- Giaccio, B.; Isaia, R.; Fedele, F.G.; Di Canzio, E.; Hoffecker, J.; Ronchitelli, A.; Sinitsyn, A.A.; Anikovich, M.; Lisitsyn, S.N.; Popov, V.V. The Campanian Ignimbrite and Codola Tephra Layers: Two Temporal/Stratigraphic Markers for the Early Upper Palaeolithic in Southern Italy and Eastern Europe. J. Volcanol. Geotherm. Res. 2008, 177, 208–226. [Google Scholar] [CrossRef]
- Narcisi, B. Tephrochronology of a Late Quaternary Lacustrine Record from the Monticchio Maar (Vulture Volcano, Southern Italy). Quat. Sci. Rev. 1996, 15, 155–165. [Google Scholar] [CrossRef]
- Keller, J.; Ryan, W.B.F.; Ninkovich, D.; Altherr, R. Explosive Volcanic Activity in the Mediterranean over the Past 200,000 yr as Recorded in Deep-Sea Sediments. Geol. Soc. Am. Bull. 1978, 89, 591–604. [Google Scholar] [CrossRef]
- Fedele, L.; Scarpati, C.; Sparice, D.; Perrotta, A.; Laiena, F. A Chemostratigraphic Study of the Campanian Ignimbrite Eruption (Campi Flegrei, Italy): Insights on Magma Chamber Withdrawal and Deposit Accumulation as Revealed by Compositionally Zoned Stratigraphic and Facies Framework. J. Volcanol. Geotherm. Res. 2016, 324, 105–117. [Google Scholar] [CrossRef]
- Scarpati, C.; Perrotta, A. Stratigraphy and Physical Parameters of the Plinian Phase of the Campanian Ignimbrite Eruption. Geol. Soc. Am. Bull. 2016, 128, 1147–1159. [Google Scholar] [CrossRef]
- Smith, V.C.; Isaia, R.; Engwell, S.L.; Albert, P.G. Tephra Dispersal during the Campanian Ignimbrite (Italy) Eruption: Implications for Ultra-Distal Ash Transport during the Large Caldera-Forming Eruption. Bull. Volcanol. 2016, 78, 45. [Google Scholar] [CrossRef]
- Civetta, L.; Orsi, G.; Pappalardo, L.; Fisher, R.V.; Heiken, G.; Ort, M. Geochemical Zoning, Mingling, Eruptive Dynamics and Depositional Processes—The Campanian Ignimbrite, Campi Flegrei Caldera, Italy. J. Volcanol. Geotherm. Res. 1997, 75, 183–219. [Google Scholar] [CrossRef]
- Engwell, S.L.; Sparks, R.S.J.; Carey, S. Physical Characteristics of Tephra Layers in the Deep Sea Realm: The Campanian Ignimbrite Eruption. Geol. Soc. Lond. Spec. Publ. 2014, 398, 47–64. [Google Scholar] [CrossRef]
- Fedele, F.G.; Giaccio, B.; Hajdas, I. Timescales and Cultural Process at 40,000 BP in the Light of the Campanian Ignimbrite Eruption, Western Eurasia. J. Hum. Evol. 2008, 55, 834–857. [Google Scholar] [CrossRef] [PubMed]
- Fitzsimmons, K.E.; Hambach, U.; Veres, D.; Iovita, R. The Campanian Ignimbrite Eruption: New Data on Volcanic Ash Dispersal and Its Potential Impact on Human Evolution. PLoS ONE 2013, 8, e65839. [Google Scholar] [CrossRef] [PubMed]
- Nowaczyk, N.R.; Arz, H.W.; Frank, U.; Kind, J.; Plessen, B. Dynamics of the Laschamp Geomagnetic Excursion from Black Sea Sediments. Earth Planet. Sci. Lett. 2012, 351–352, 54–69. [Google Scholar] [CrossRef]
- Wacha, L.; Mikulčić Pavlaković, S.; Frechen, M.; Crnjaković, M. The loess chronology of the Island of Susak, Croatia. EG Quat. Sci. J. 2011, 60, 153–169. [Google Scholar] [CrossRef]
- Tsanova, T.; Veres, D.; Hambach, U.; Spasov, R.; Dimitrova, I.; Popov, P.; Talamo, S.; Sirakova, S. Upper Palaeolithic Layers and Campanian Ignimbrite/Y-5 Tephra in Toplitsa Cave, Northern Bulgaria. J. Archaeol. Sci. Rep. 2021, 37, 102912. [Google Scholar] [CrossRef]
- Masotta, M.; Mollo, S.; Freda, C.; Gaeta, M.; Moore, G. Clinopyroxene–Liquid Thermometers and Barometers Specific to Alkaline Differentiated Magmas. Contrib. Mineral. Petrol. 2013, 166, 1545–1561. [Google Scholar] [CrossRef]
- Tomlinson, E.L.; Smith, V.C.; Albert, P.G.; Aydar, E.; Civetta, L.; Cioni, R.; Çubukçu, E.; Gertisser, R.; Isaia, R.; Menzies, M.A.; et al. The Major and Trace Element Glass Compositions of the Productive Mediterranean Volcanic Sources: Tools for Correlating Distal Tephra Layers in and around Europe. Quat. Sci. Rev. 2015, 118, 48–66. [Google Scholar] [CrossRef]
- Obreht, I.; Hambach, U.; Veres, D.; Zeeden, C.; Bösken, J.; Stevens, T.; Marković, S.B.; Klasen, N.; Brill, D.; Burow, C.; et al. Shift of Large-Scale Atmospheric Systems over Europe during Late MIS 3 and Implications for Modern Human Dispersal. Sci. Rep. 2017, 7, 5848. [Google Scholar] [CrossRef] [PubMed]
- Marković, S.B.; Stevens, T.; Kukla, G.J.; Hambach, U.; Fitzsimmons, K.E.; Gibbard, P.; Buggle, B.; Zech, M.; Guo, Z.; Hao, Q.; et al. Danube Loess Stratigraphy—Towards a Pan-European Loess Stratigraphic Model. Earth Sci. Rev. 2015, 148, 228–258. [Google Scholar] [CrossRef]
- Deino, A.L.; Orsi, G.; De Vita, S.; Piochi, M. The Age of the Neapolitan Yellow Tuff Caldera-Forming Eruption (Campi Flegrei Caldera—Italy) Assessed by 40Ar/39Ar Dating Method. J. Volcanol. Geotherm. Res. 2004, 133, 157–170. [Google Scholar] [CrossRef]
- Schmidt, R.; Van Den Bogaard, C.; Merkt, J.; Müller, J. A New Lateglacial Chronostratigraphic Tephra Marker for the South-Eastern Alps: The Neapolitan Yellow Tuff (NYT) in Längsee (Austria) in the Context of a Regional Biostratigraphy and Palaeoclimate. Quat. Int. 2002, 88, 45–56. [Google Scholar] [CrossRef]
- Lenaz, D.; Marciano, R.; Veres, D.; Dietrich, S.; Sirocko, F. Mineralogy of the Dehner and Jungferweiher Maar Tephras (Eifel, Germany). Neues Jahrb. Geol. Paläontol. Abh. Band 2010, 257, 55–67. [Google Scholar] [CrossRef]
- Fedele, L.; Zanetti, A.; Morra, V.; Lustrino, M.; Melluso, L.; Vannucci, R. Clinopyroxene/Liquid Trace Element Partitioning in Natural Trachyte–Trachyphonolite Systems: Insights from Campi Flegrei (Southern Italy). Contrib. Mineral. Petrol. 2009, 158, 337–356. [Google Scholar] [CrossRef]
- Kendrick, J. Strain Localisation during Dome-Building Eruptions. Ph.D. Thesis, Ludwig-Maximilians-Universität (LMU), Munich, Germany, 2013. [Google Scholar]
- Reed, S.J.B. Electron Microprobe Analysis and Scanning Electron Microscopy in Geology, 2nd ed.; Camebridge University Press: Camebridge, UK, 2005; ISBN 978-0-511-61056-1. [Google Scholar]
- Prelević, D.; Akal, C.; Romer, R.L.; Mertz-Kraus, R.; Helvac, C. Magmatic Response to Slab Tearing: Constraints from the Afyon Alkaline Volcanic Complex, Western Turkey. J. Petrol. 2015, 56, 527–562. [Google Scholar] [CrossRef]
- Günther, D.; Frischknecht, R.; Heinrich, C.A.; Kahlert, H.-J. Capabilities of an Argon Fluoride 193 Nm Excimer Laser for Laser Ablation Inductively Coupled Plasma Mass Spectometry Microanalysis of Geological Materials. J. Anal. At. Spectrom. 1997, 12, 939–944. [Google Scholar] [CrossRef]
- Jochum, K.P.; Weis, U.; Stoll, B.; Kuzmin, D.; Yang, Q.; Raczek, I.; Jacob, D.E.; Stracke, A.; Birbaum, K.; Frick, D.A.; et al. Determination of Reference Values for NIST SRM 610–617 Glasses Following ISO Guidelines. Geostand. Geoanalyt. Res. 2011, 35, 397–429. [Google Scholar] [CrossRef]
- Longerich, H.P.; Jackson, S.E.; Günther, D. Inter-Laboratory Note. Laser Ablation Inductively Coupled Plasma Mass Spectrometric Transient Signal Data Acquisition and Analyte Concentration Calculation. J. Anal. At. Spectrom. 1996, 11, 899–904. [Google Scholar] [CrossRef]
- Richter, T.O.; Van Der Gaast, S.; Koster, B.; Vaars, A.; Gieles, R.; De Stigter, H.C.; De Haas, H.; Van Weering, T.C.E. The Avaatech XRF Core Scanner: Technical Description and Applications to NE Atlantic Sediments. Geol. Soc. Lond. Spec. Publ. 2006, 267, 39–50. [Google Scholar] [CrossRef]
- Berglund, B.E.; Ralska-Jasiewiczowa, M. Pollen Analysis and Pollen Diagrams. In Handbook of Holocene Palaeoecology and Palaeohydrology; Berglund, B.E., Ed.; John Wiley and Sons: Chichester, UK, 1986; Volume 19, pp. 455–484. ISBN 978-0-471-90691-9. [Google Scholar]
- Fægri, K.; Iversen, J. Textbook of Pollen Analysis, 4th ed.; Joahn Wiley & Sons: Chichester, UK, 1989; ISBN 978-0-471-92178-3. [Google Scholar]
- Britzius, S.; Dreher, F.; Maisel, P.; Sirocko, F. Vegetation Patterns during the Last 132,000 Years: A Synthesis from Twelve Eifel Maar Sediment Cores (Germany): The ELSA-23-Pollen-Stack. Quaternary 2024, 7, 8. [Google Scholar] [CrossRef]
- Kendrick, J.E.; Lavallée, Y.; Mariani, E.; Dingwell, D.B.; Wheeler, J.; Varley, N.R. Crystal Plasticity as an Indicator of the Viscous-Brittle Transition in Magmas. Nat. Commun. 2017, 8, 1926. [Google Scholar] [CrossRef]
- Okumura, S.; Kushnir, A.R.L.; Martel, C.; Champallier, R.; Thibault, Q.; Takeuchi, S. Rheology of Crystal-Bearing Natural Magmas: Torsional Deformation Experiments at 800 °C and 100 MPa. J. Volcanol. Geotherm. Res. 2016, 328, 237–246. [Google Scholar] [CrossRef]
- Holness, M.B.; Stock, M.J.; Geist, D. Magma Chambers versus Mush Zones: Constraining the Architecture of Sub-Volcanic Plumbing Systems from Microstructural Analysis of Crystalline Enclaves. Phil. Trans. R. Soc. A 2019, 377, 20180006. [Google Scholar] [CrossRef] [PubMed]
- Arbaret, L.; Bystricky, M.; Champallier, R. Microstructures and Rheology of Hydrous Synthetic Magmatic Suspensions Deformed in Torsion at High Pressure. J. Geophys. Res. 2007, 112, B10208. [Google Scholar] [CrossRef]
- Wulf, S.; Hardiman, M.J.; Staff, R.A.; Koutsodendris, A.; Appelt, O.; Blockley, S.P.E.; Lowe, J.J.; Manning, C.J.; Ottolini, L.; Schmitt, A.K.; et al. The Marine Isotope Stage 1–5 Cryptotephra Record of Tenaghi Philippon, Greece: Towards a Detailed Tephrostratigraphic Framework for the Eastern Mediterranean Region. Quat. Sci. Rev. 2018, 186, 236–262. [Google Scholar] [CrossRef]
- Evensen, N.M.; Hamilton, P.J.; O’Nions, R.K. Rare-Earth Abundances in Chondritic Meteorites. Geochim. Cosmochim. Acta 1978, 42, 1199–1212. [Google Scholar] [CrossRef]
- Fedele, L.; Scarpati, C.; Lanphere, M.; Melluso, L.; Morra, V.; Perrotta, A.; Ricci, G. The Breccia Museo Formation, Campi Flegrei, Southern Italy: Geochronology, Chemostratigraphy and Relationship with the Campanian Ignimbrite Eruption. Bull. Volcanol. 2008, 70, 1189–1219. [Google Scholar] [CrossRef]
- Rasmussen, S.O.; Bigler, M.; Blockley, S.P.; Blunier, T.; Buchardt, S.L.; Clausen, H.B.; Cvijanovic, I.; Dahl-Jensen, D.; Johnsen, S.J.; Fischer, H.; et al. A Stratigraphic Framework for Abrupt Climatic Changes during the Last Glacial Period Based on Three Synchronized Greenland Ice-Core Records: Refining and Extending the INTIMATE Event Stratigraphy. Quat. Sci. Rev. 2014, 106, 14–28. [Google Scholar] [CrossRef]
- Costa, A.; Folch, A.; Macedonio, G.; Giaccio, B.; Isaia, R.; Smith, V.C. Quantifying Volcanic Ash Dispersal and Impact of the Campanian Ignimbrite Super-eruption. Geophys. Res. Lett. 2012, 39, 2012GL051605. [Google Scholar] [CrossRef]
- Martrat, B.; Grimalt, J.O.; Shackleton, N.J.; de Abreu, L.; Hutterli, M.A.; Stocker, T.F. Four Climate Cycles of Recurring Deep and Surface Water Destabilizations on the Iberian Margin. Science 2007, 317, 502–507. [Google Scholar] [CrossRef]
- Berger, A.; Loutre, M.F. Insolation Values for the Climate of the Last 10 Million Years. Quat. Sci. Rev. 1991, 10, 297–317. [Google Scholar] [CrossRef]
- Korte, M.; Brown, M.C.; Panovska, S.; Wardinski, I. Robust Characteristics of the Laschamp and Mono Lake Geomagnetic Excursions: Results From Global Field Models. Front. Earth Sci. 2019, 7, 86. [Google Scholar] [CrossRef]
- Muscheler, R.; Beer, J.; Kubik, P.W.; Synal, H.-A. Geomagnetic Field Intensity during the Last 60,000 Years Based on 10Be and 36Cl from the Summit Ice Cores and 14C. Quat. Sci. Rev. 2005, 24, 1849–1860. [Google Scholar] [CrossRef]
- Albert, J.; Sirocko, F. Evidence for an Extreme Cooling Event Prior to the Laschamp Geomagnetic Excursion in Eifel Maar Sediments. Quaternary 2023, 6, 14. [Google Scholar] [CrossRef]


Disclaimer/Publisher’s Note: The statements, opinions and data contained in all publications are solely those of the individual author(s) and contributor(s) and not of MDPI and/or the editor(s). MDPI and/or the editor(s) disclaim responsibility for any injury to people or property resulting from any ideas, methods, instructions or products referred to in the content. |
© 2024 by the authors. Licensee MDPI, Basel, Switzerland. This article is an open access article distributed under the terms and conditions of the Creative Commons Attribution (CC BY) license (https://creativecommons.org/licenses/by/4.0/).
Share and Cite
Schenk, F.; Hambach, U.; Britzius, S.; Veres, D.; Sirocko, F. A Cryptotephra Layer in Sediments of an Infilled Maar Lake from the Eifel (Germany): First Evidence of Campanian Ignimbrite Ash Airfall in Central Europe. Quaternary 2024, 7, 17. https://doi.org/10.3390/quat7020017
Schenk F, Hambach U, Britzius S, Veres D, Sirocko F. A Cryptotephra Layer in Sediments of an Infilled Maar Lake from the Eifel (Germany): First Evidence of Campanian Ignimbrite Ash Airfall in Central Europe. Quaternary. 2024; 7(2):17. https://doi.org/10.3390/quat7020017
Chicago/Turabian StyleSchenk, Fiona, Ulrich Hambach, Sarah Britzius, Daniel Veres, and Frank Sirocko. 2024. "A Cryptotephra Layer in Sediments of an Infilled Maar Lake from the Eifel (Germany): First Evidence of Campanian Ignimbrite Ash Airfall in Central Europe" Quaternary 7, no. 2: 17. https://doi.org/10.3390/quat7020017