
Vegetation Patterns during the Last 132,000 Years: A Synthesis from Twelve Eifel Maar Sediment Cores (Germany): The ELSA-23-Pollen-Stack

Abstract
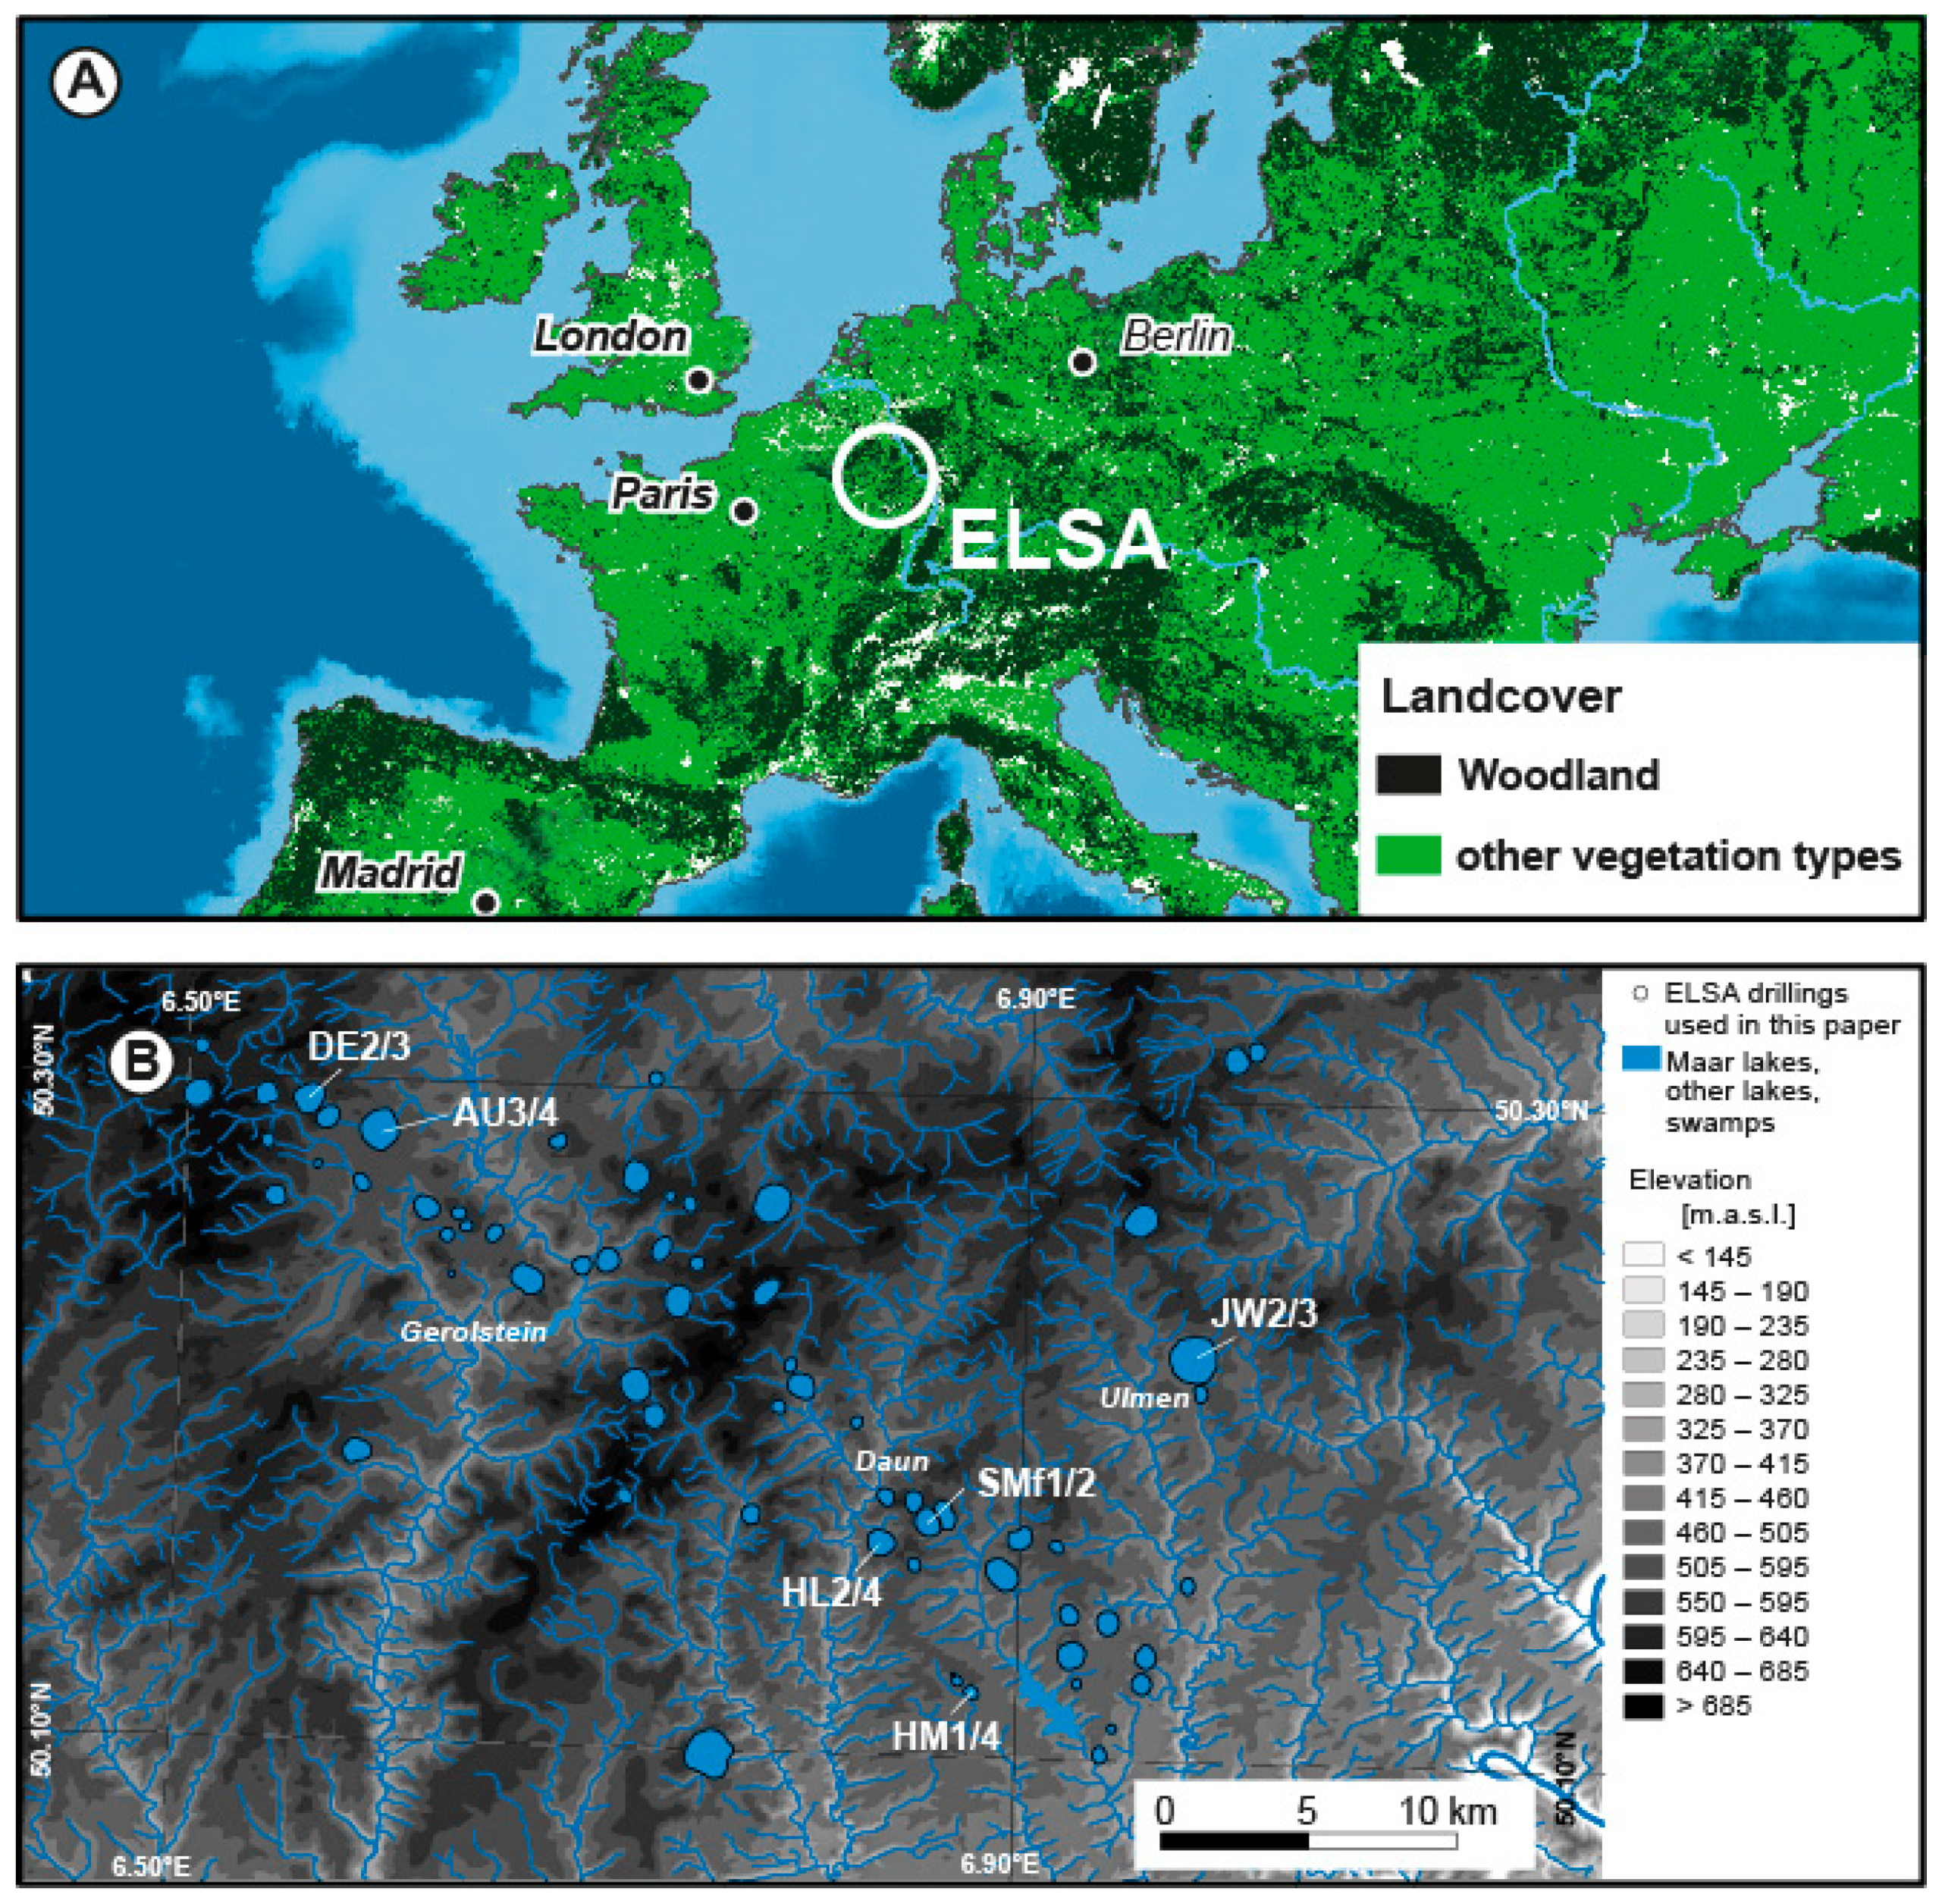
:1. Introduction
2. Materials and Methods
2.1. Pollen Sample Preparation
2.2. Alignment of the Cores
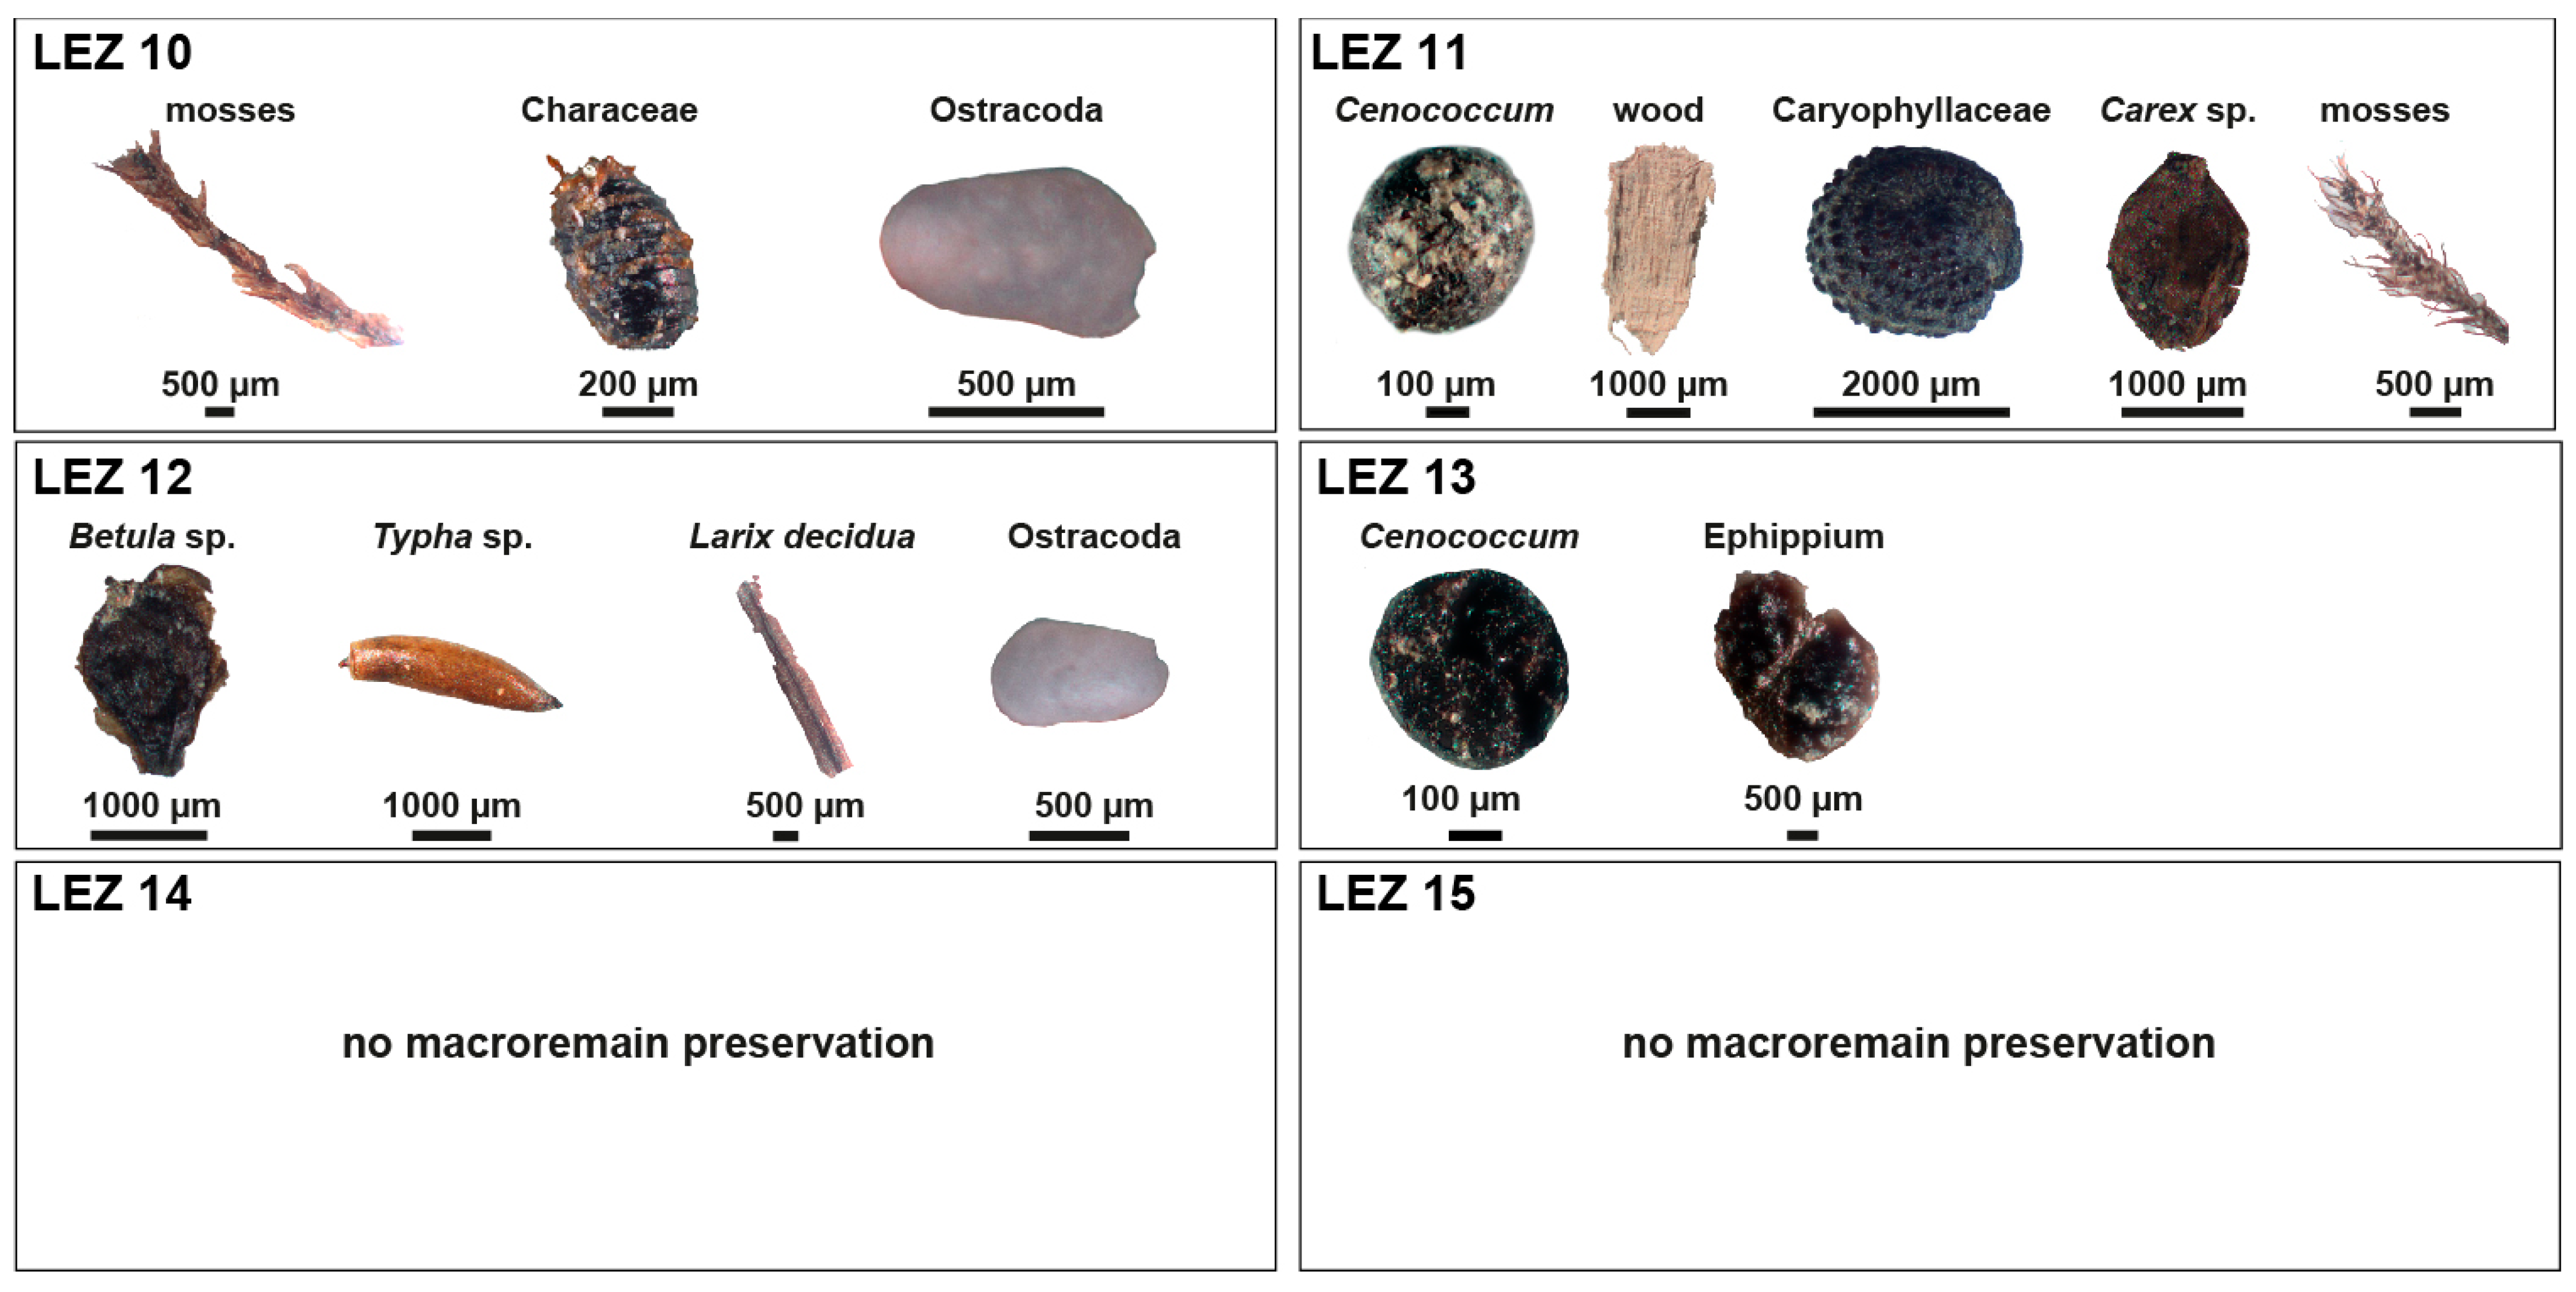
2.3. Macroremains
3. Results
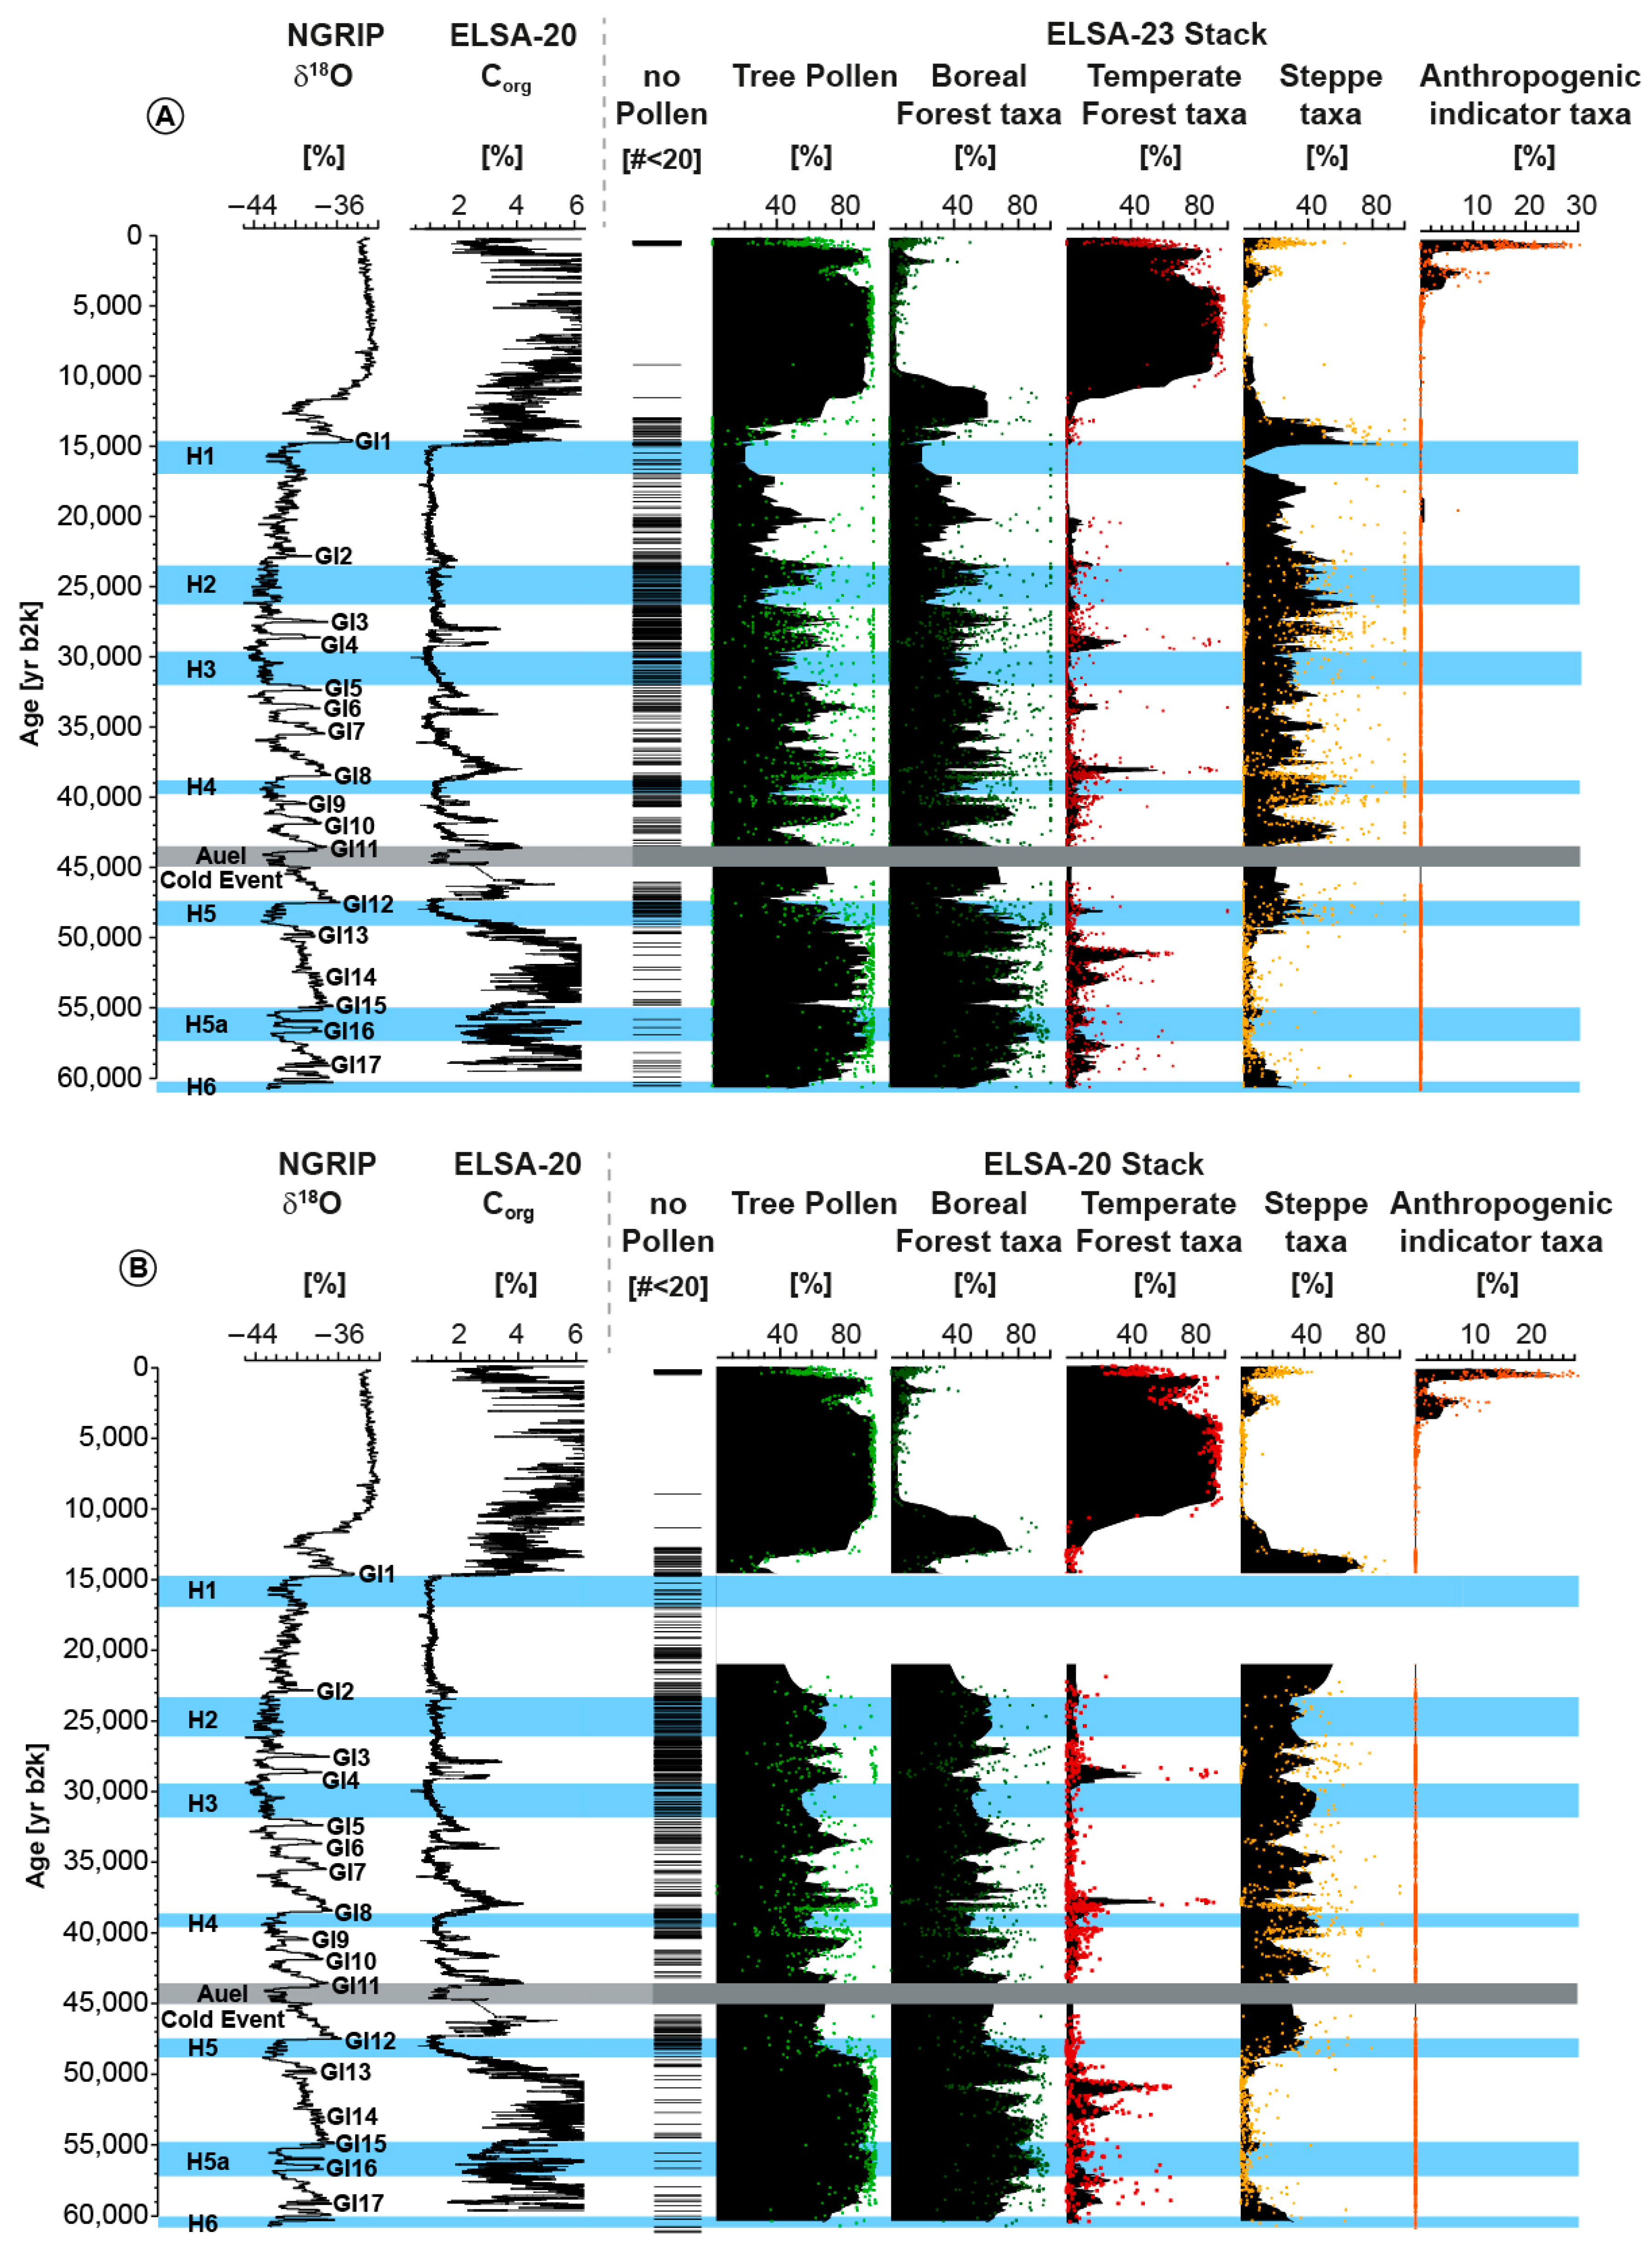
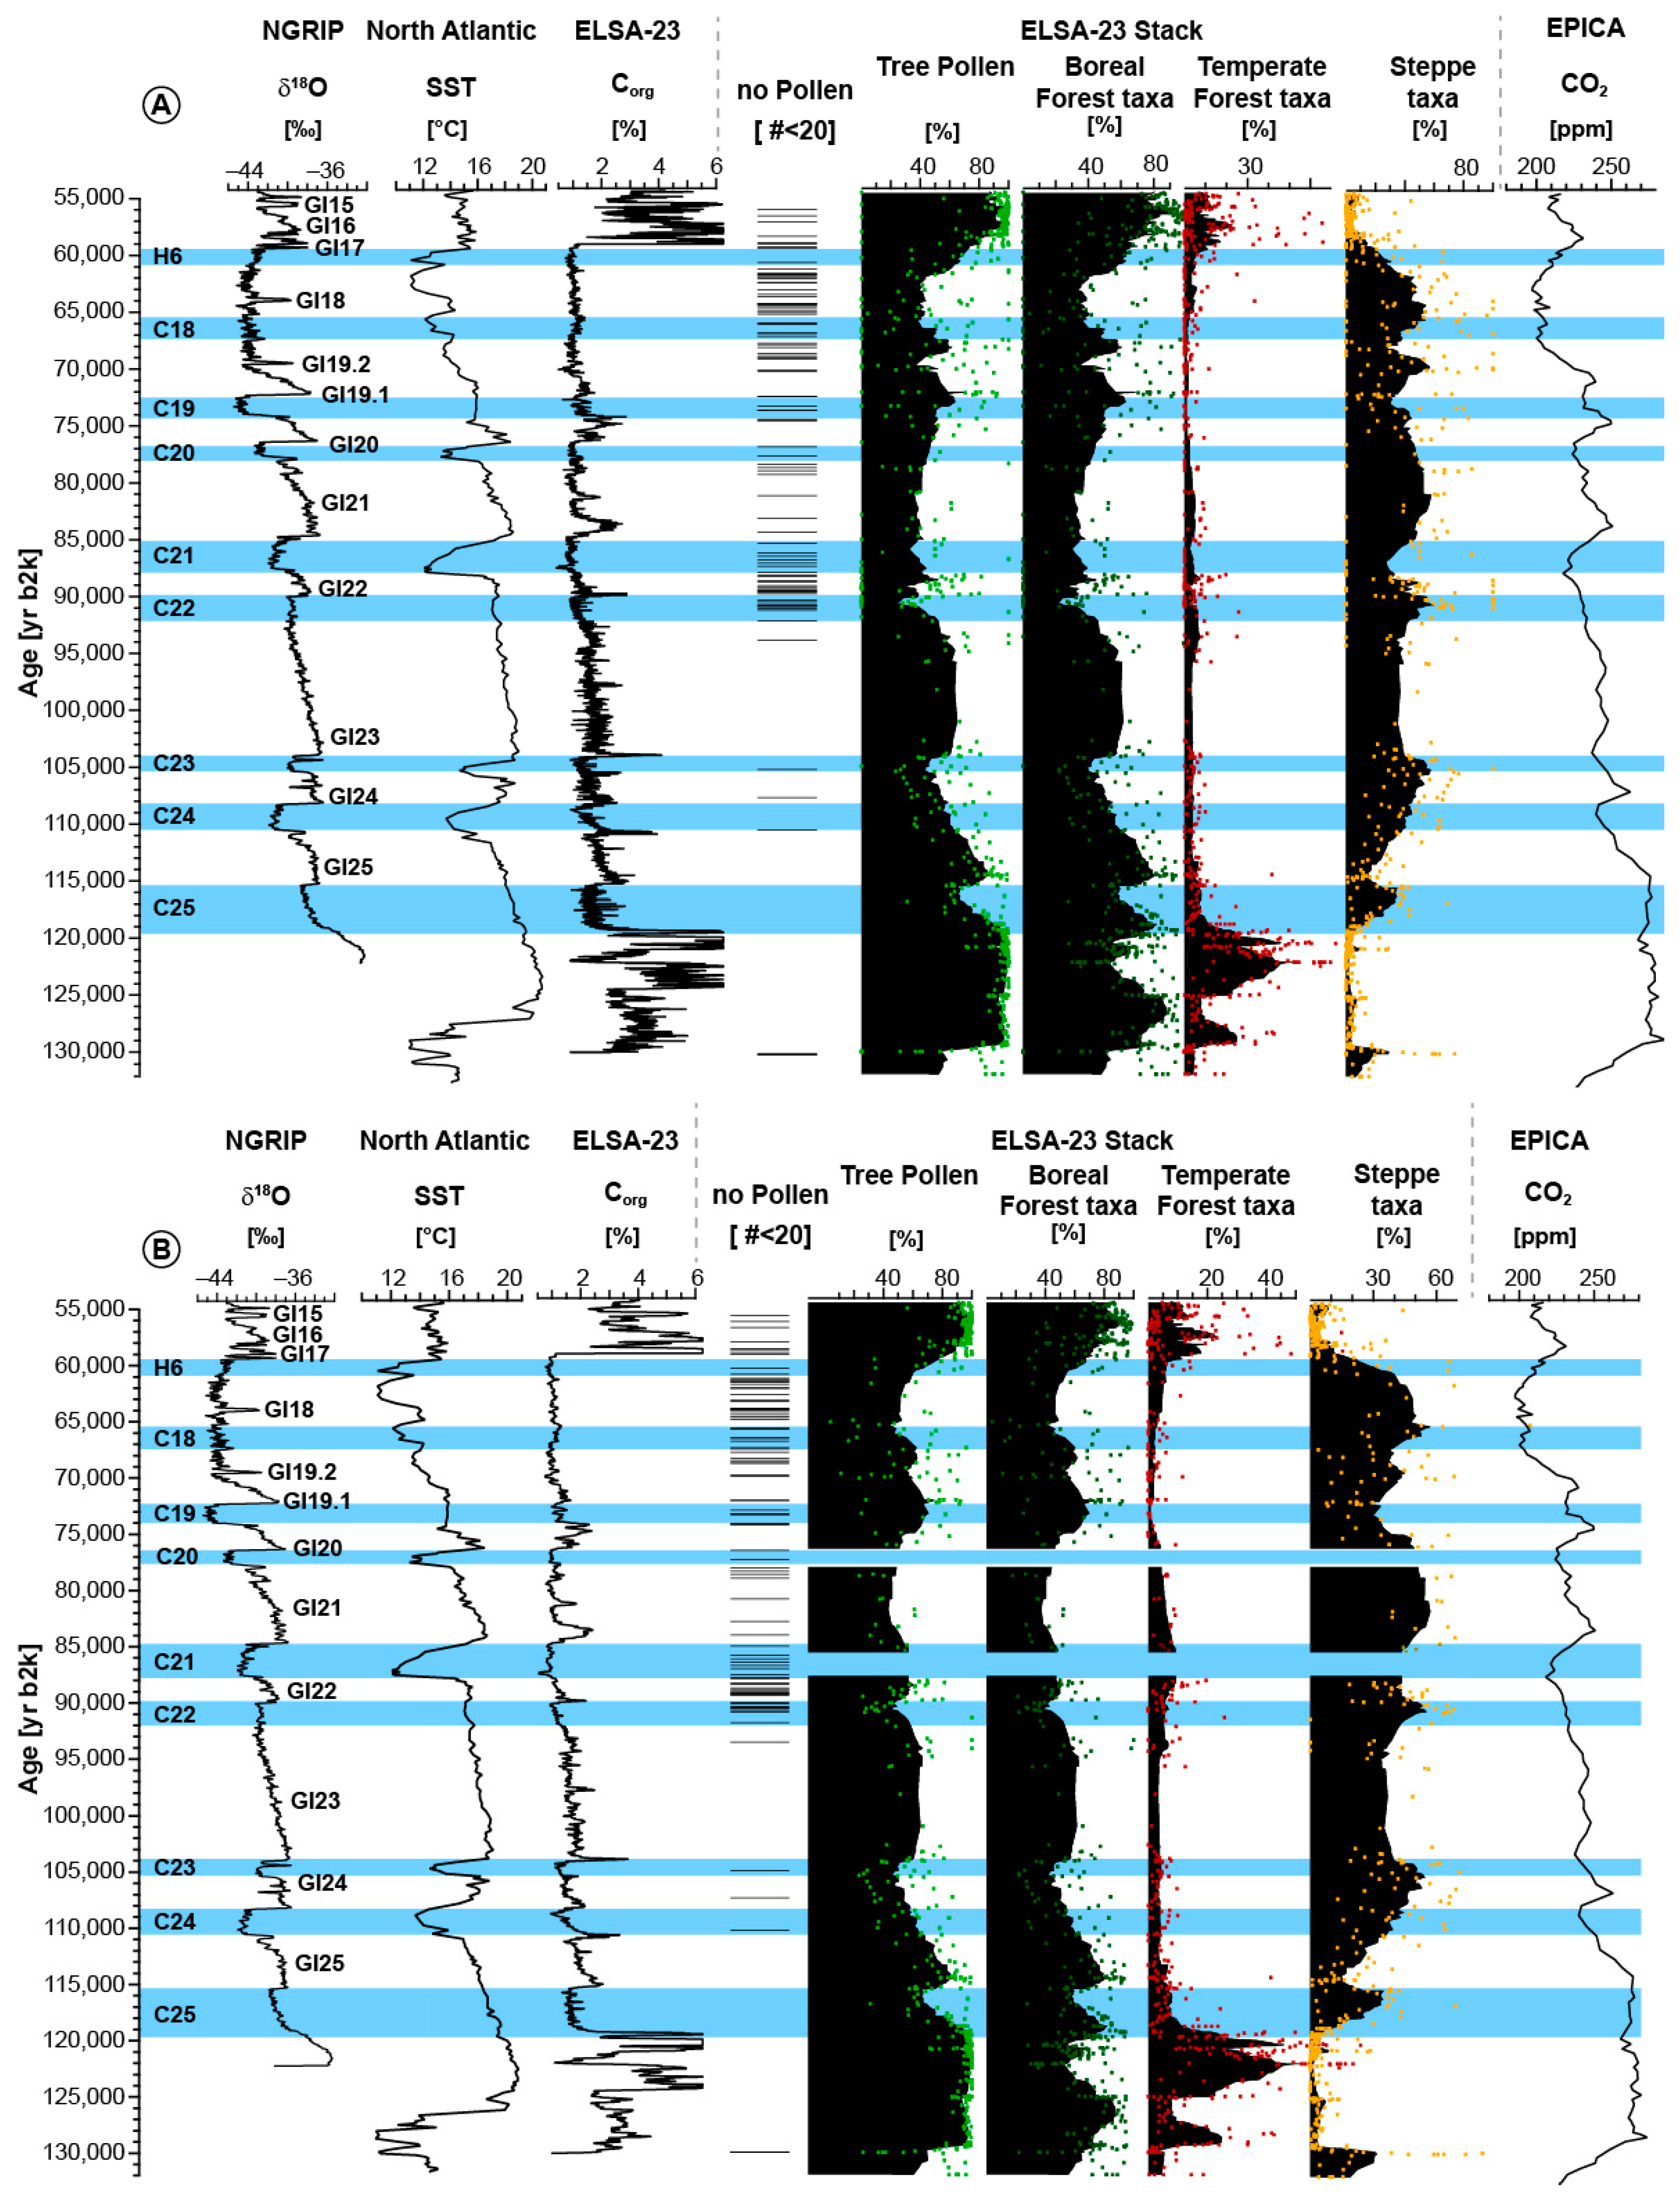
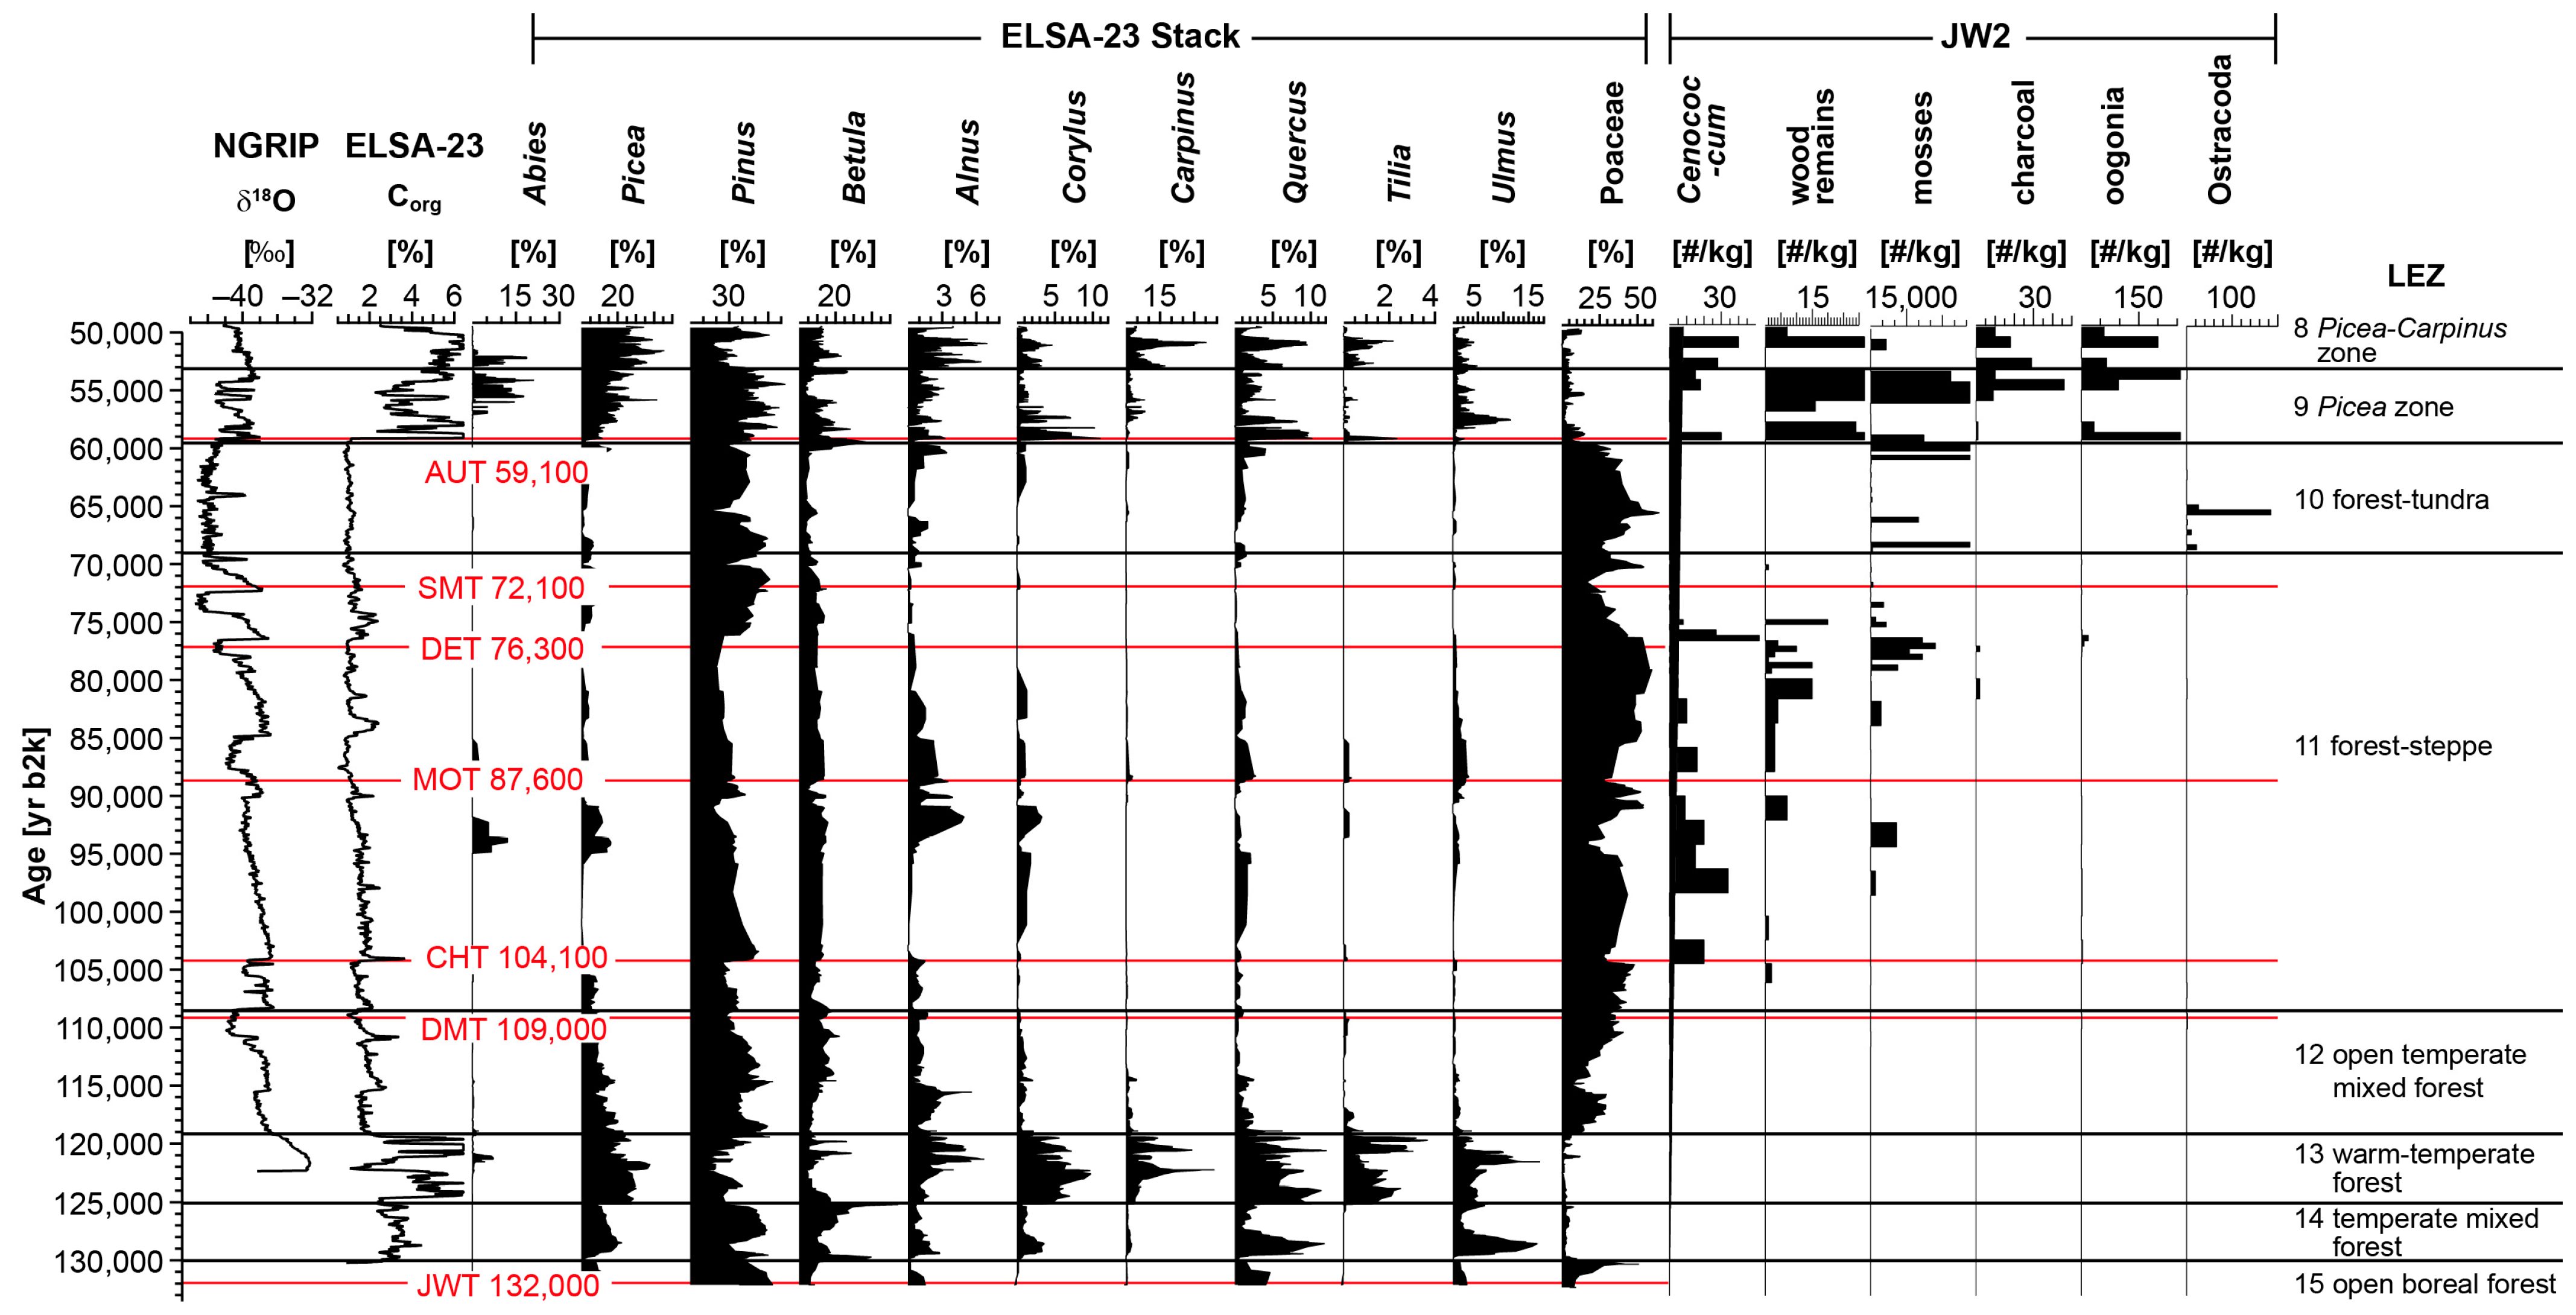
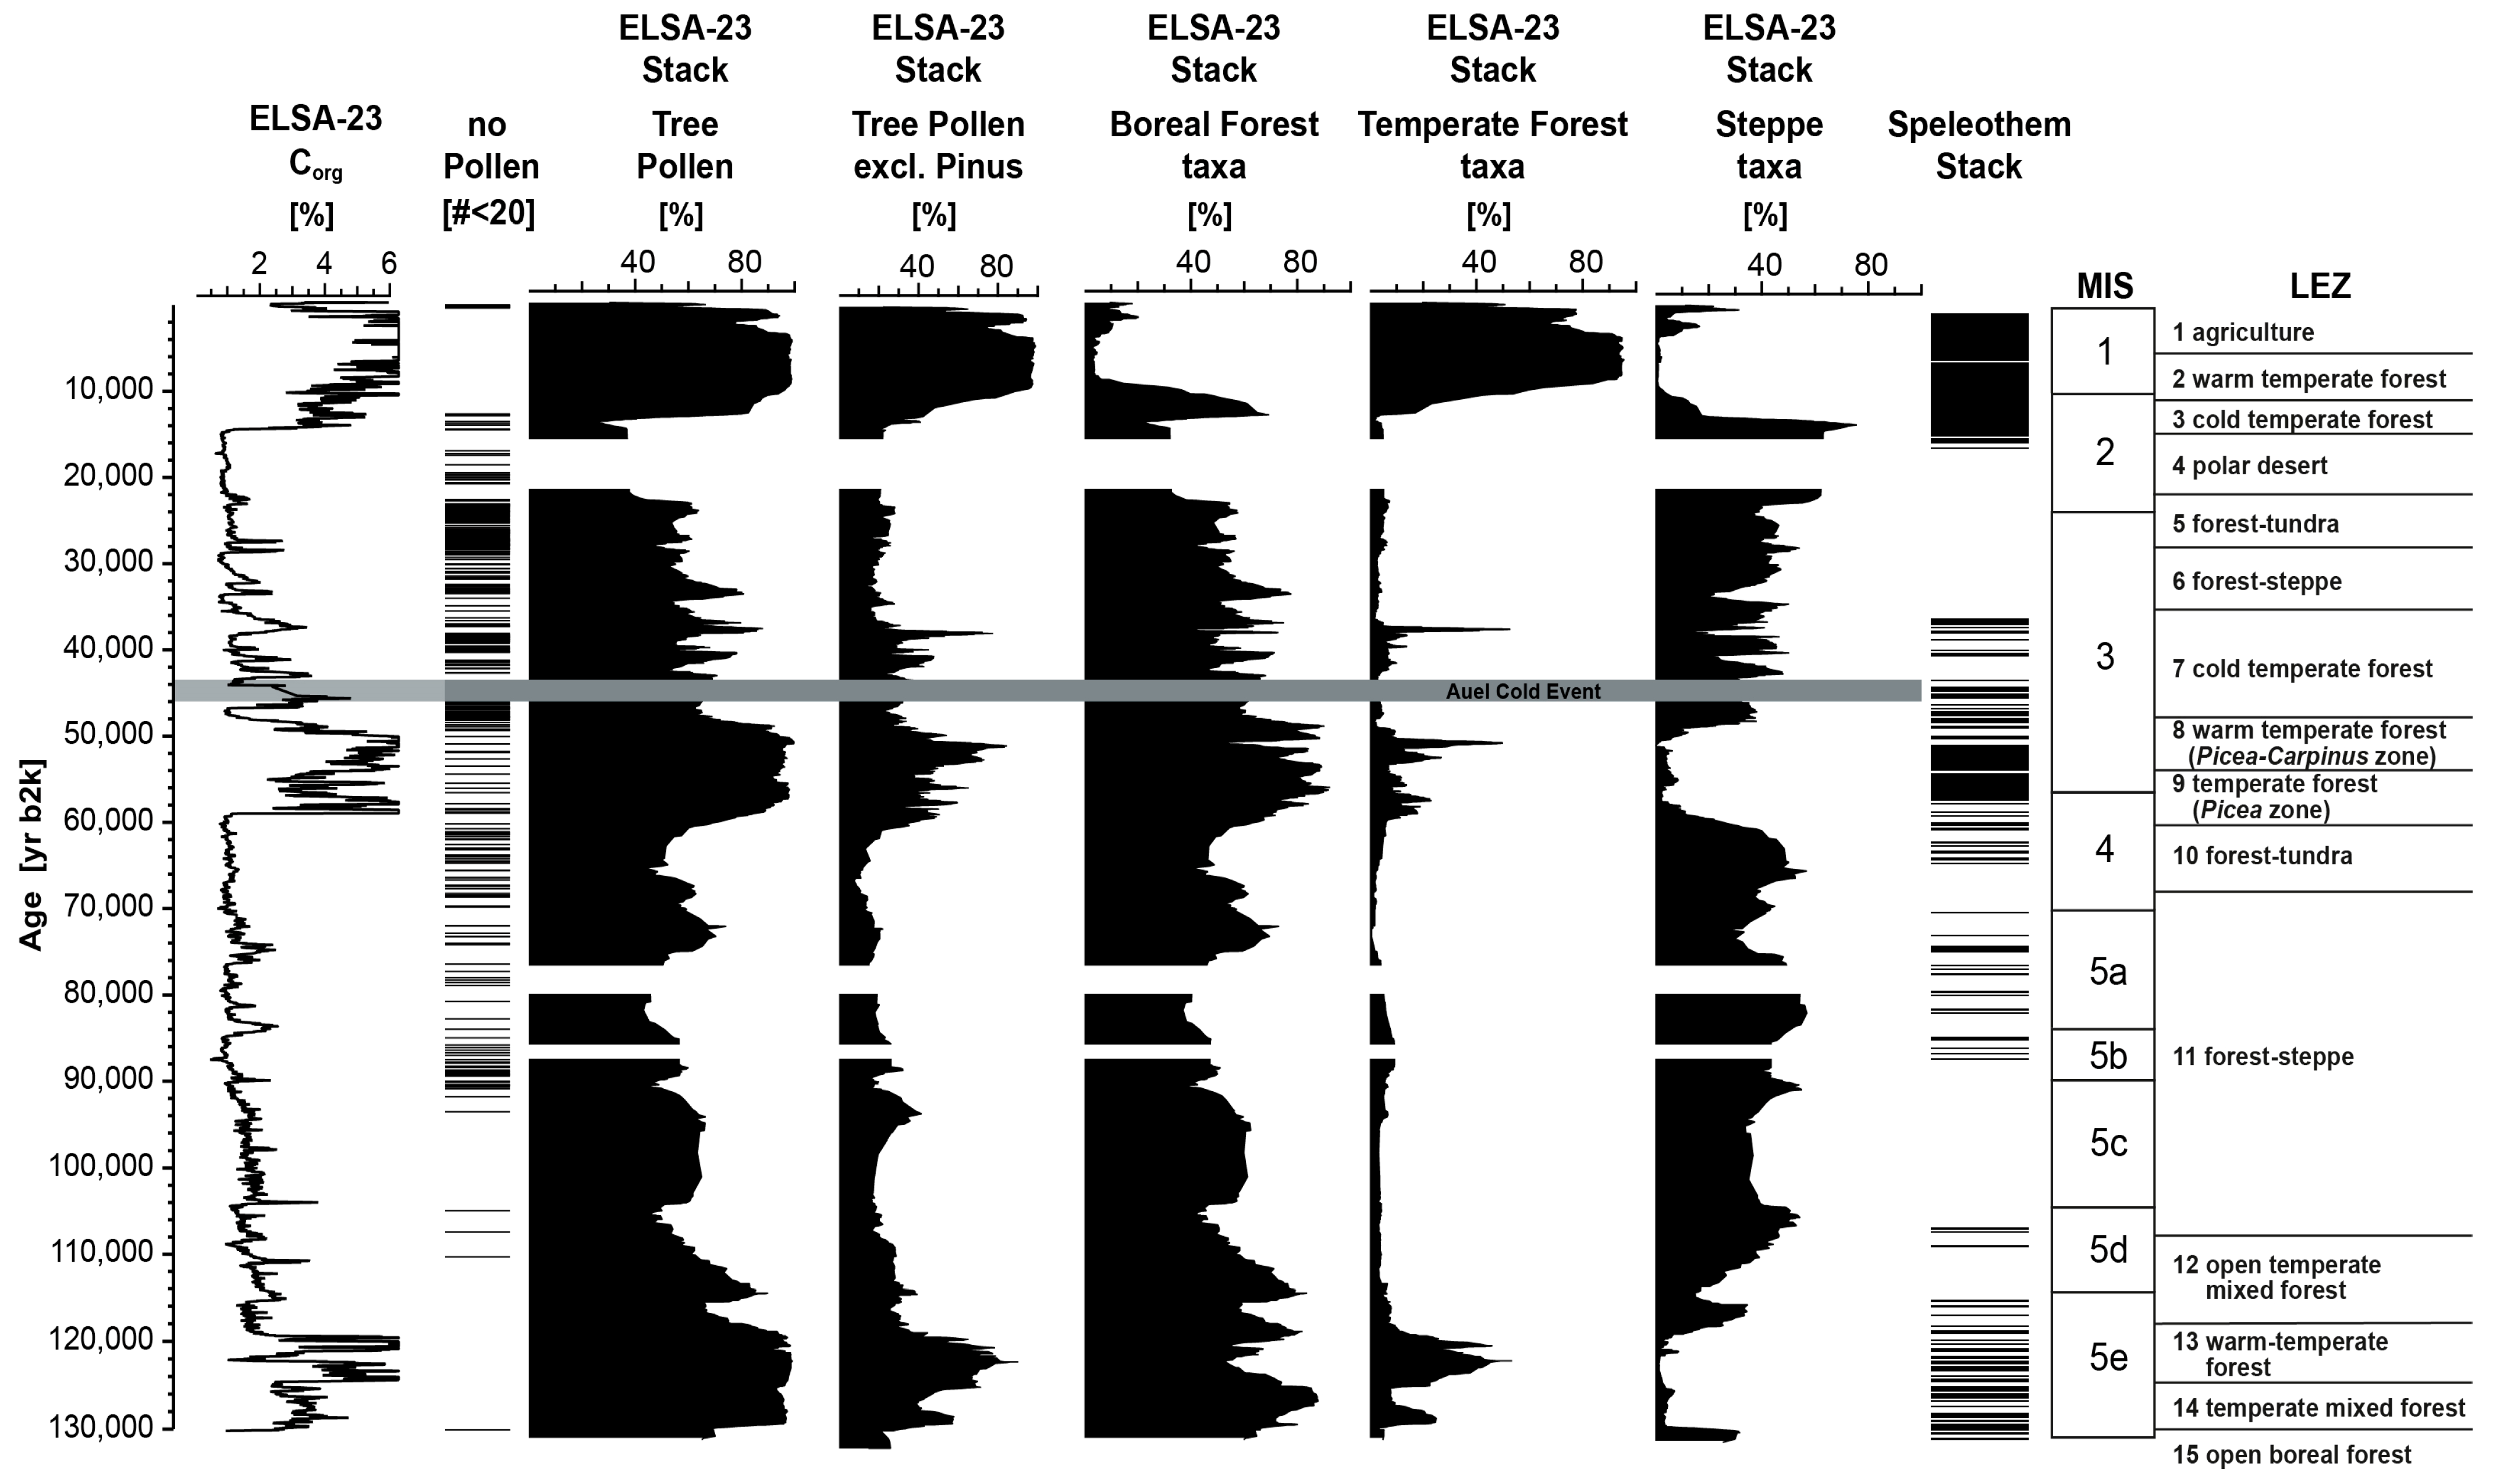
3.1. The ELSA-23-Pollen-Stack
3.2. Macroremains from Jungferweiher Core JW2
3.2.1. Zone 1 (156–145 m, 132,000–121,000 yr b2k)
3.2.2. Zone 2 (145–136 m, 121,000–108,000 yr b2k)
3.2.3. Zone 3 (136–97 m, 108,000–69,500 yr b2k)
3.2.4. Zone 4 (97–72 m, 69,500–59,500 yr b2k)
3.2.5. Zone 5 (72–68 m, 59,500 yr b2k–55,000 yr b2k, i.e., LEZ 9 after ref. [3])
4. Discussion
4.1. Landscape Evolution Zones (LEZ) of MIS 5 and 4
4.1.1. LEZ 15: Open Boreal Forest (132,000–130,000 yr b2k)
4.1.2. LEZ 14: Early Eemian Temperate Mixed Forest (130,000–125,000 yr b2k)
4.1.3. LEZ 13: Middle Eemian Warm-Temperate Forest (125,000–119,000 yr b2k)
4.1.4. LEZ 12: Open Temperate Mixed Forest (119,000–108,000 yr b2k)
4.1.5. LEZ 11: Forest–Steppe (108,000–69,500 yr b2k)
4.1.6. LEZ 10: Forest–Tundra of MIS 4 (69,500–59,500 yr b2k)
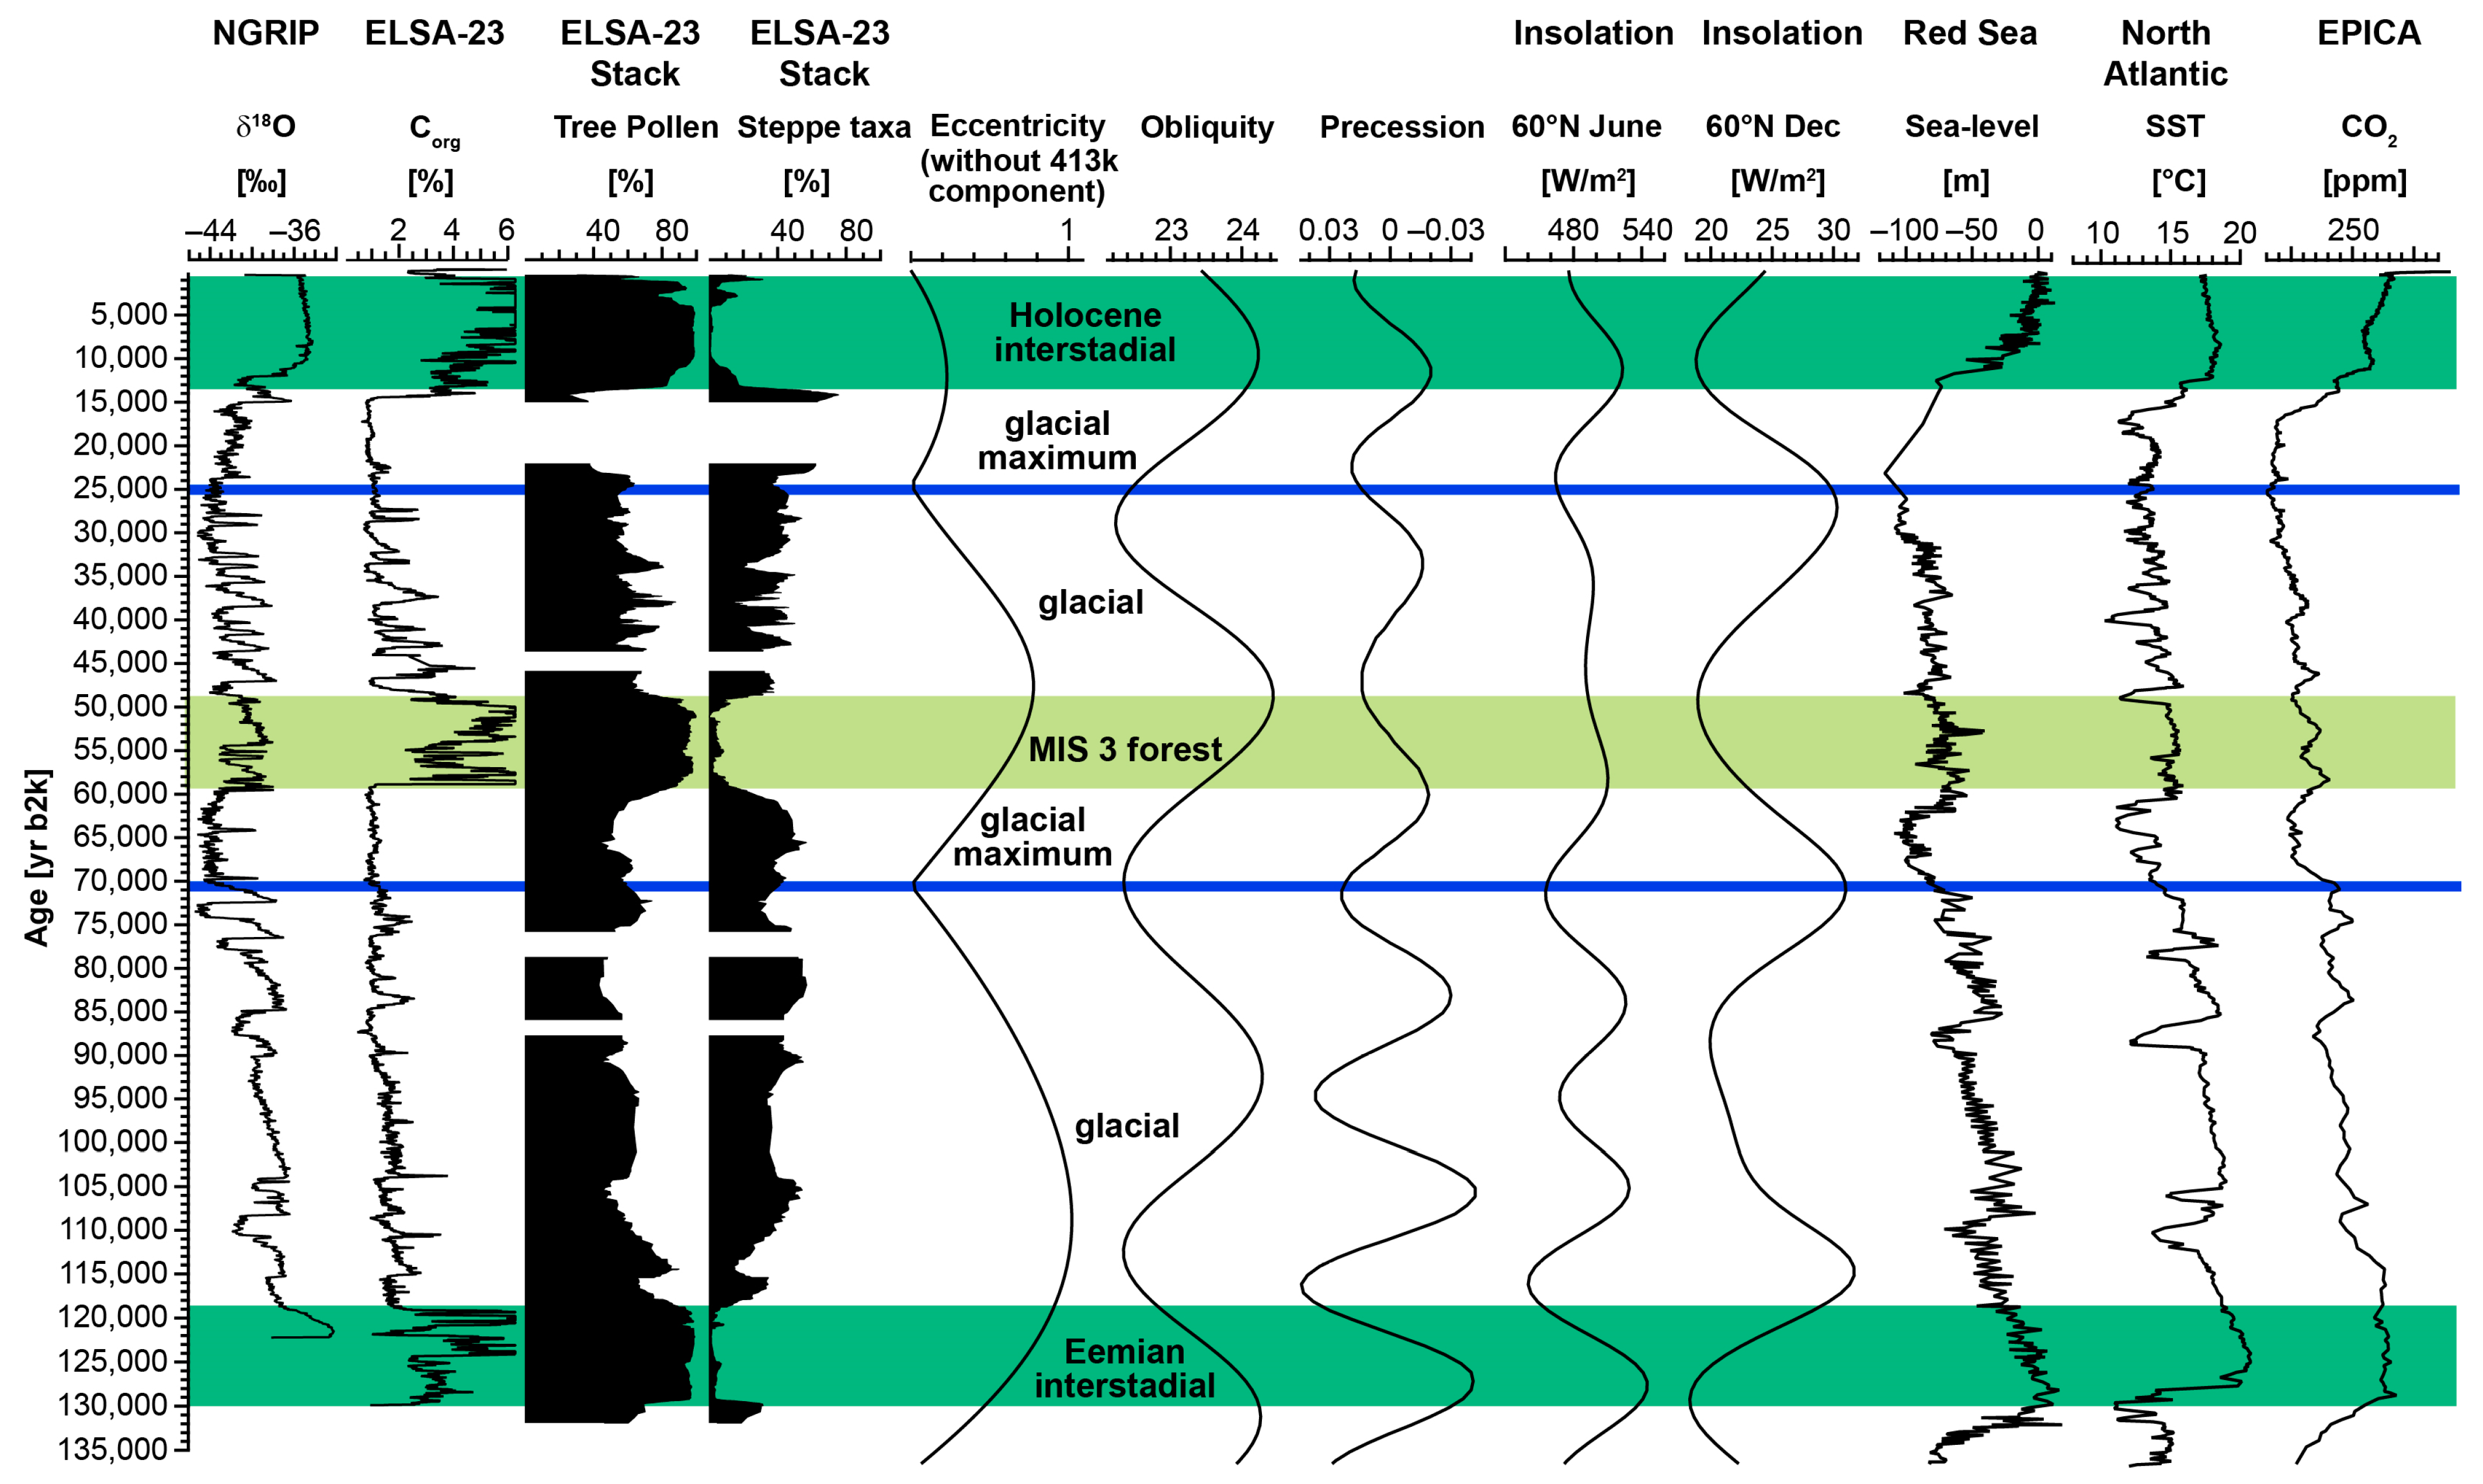
4.2. Eifel Vegetation Patterns from 132,000 yr b2k until Present: The Impact of North Atlantic Temperature Changes and Control of Orbital Parameters

5. Conclusions
- There were three forested phases during the past 132,000 years in the Eifel, i.e., the Eemian, the early MIS 3, and the Holocene. Early MIS 3 did not develop into full interglacial conditions, but pollen taxa and speleothem data hint at warm and humid conditions;
- During MIS 5c and 5a, i.e., the phases with long interstadials 23 and 21, the Eifel was also forested, but to a lesser extent than during the Eemian and early MIS 3;
- Pollen preservation is extremely poor during cold stadials and the two glacial maxima, MIS 4 and LGM/ MIS 2;
- Besides the general trend of cooling from the Eemian toward MIS 4 and early MIS 3 toward MIS 2, each was accompanied by the reduction in tree cover, forest declining and recovering following the climate fluctuations recorded in the Greenland ice [10,11,12], and the Corg(chlorins) from Eifel maar sediments [13];
- Pollen and macroremains were used to define six new Landscape Evolution Zones (LEZ 15 to10) between 132,000 and 60,000 yr b2k that extend the nine LEZ from 60,000 to present as presented by ref. [3].
Supplementary Materials
Author Contributions
Funding
Data Availability Statement
Acknowledgments
Conflicts of Interest
References
- Sirocko, F.; Dietrich, S.; Veres, D.; Grootes, P.M.; Schaber-Mohr, K.; Seelos, K.; Nadeau, M.-J.; Kromer, B.; Rothacker, L.; Röhner, M.; et al. Multi-Proxy Dating of Holocene Maar Lakes and Pleistocene Dry Maar Sediments in the Eifel, Germany. Quat. Sci. Rev. 2013, 62, 56–76. [Google Scholar] [CrossRef]
- Sirocko, F.; Seelos, K.; Schaber, K.; Rein, B.; Dreher, F.; Diehl, M.; Lehne, R.; Jäger, K.; Krbetschek, M.; Degering, D. A Late Eemian Aridity Pulse in Central Europe during the Last Glacial Inception. Nature 2005, 436, 833–836. [Google Scholar] [CrossRef] [PubMed]
- Sirocko, F.; Knapp, H.; Dreher, F.; Förster, M.W.; Albert, J.; Brunck, H.; Veres, D.; Dietrich, S.; Zech, M.; Hambach, U.; et al. The ELSA-Vegetation-Stack: Reconstruction of Landscape Evolution Zones (LEZ) from Laminated Eifel Maar Sediments of the Last 60,000 Years. Glob. Planet. Chang. 2016, 142, 108–135. [Google Scholar] [CrossRef]
- Sirocko, F.; Albert, J.; Britzius, S.; Dreher, F.; Martínez-García, A.; Dosseto, A.; Burger, J.; Terberger, T.; Haug, G. Thresholds for the Presence of Glacial Megafauna in Central Europe during the Last 60,000 Years. Sci. Rep. 2022, 12, 20055. [Google Scholar] [CrossRef] [PubMed]
- De Beaulieu, J.-L.; Andrieu-Ponel, V.; Reille, M.; Grüger, E.; Tzedakis, C.; Svobodova, H. An Attempt at Correlation between the Velay Pollen Sequence and the Middle Pleistocene Stratigraphy from Central Europe. Quat. Sci. Rev. 2001, 20, 1593–1602. [Google Scholar] [CrossRef]
- De Beaulieu, J.-L.; Reille, M. The Last Climatic Cycle at La Grande Pile (Vosges, France) a New Pollen Profile. Quat. Sci. Rev. 1992, 11, 431–438. [Google Scholar] [CrossRef]
- Kern, O.A.; Koutsodendris, A.; Allstädt, F.J.; Mächtle, B.; Peteet, D.M.; Kalaitzidis, S.; Christanis, K.; Pross, J. A Near-Continuous Record of Climate and Ecosystem Variability in Central Europe during the Past 130 Kyrs (Marine Isotope Stages 5–1) from Füramoos, Southern Germany. Quat. Sci. Rev. 2022, 284, 107505. [Google Scholar] [CrossRef]
- Riechelmann, D.F.C.; Albert, J.; Britzius, S.; Krebsbach, F.; Scholz, D.; Schenk, F.; Jochum, K.P.; Sirocko, F. Bioproductivity and Vegetation Changes Documented in Eifel Maar Lake Sediments (Western Germany) Compared with Speleothem Growth Indicating Three Warm Phases during the Last Glacial Cycle. Quat. Int. 2023, 673, 1–17. [Google Scholar] [CrossRef]
- Britzius, S.; Sirocko, F. Vegetation Dynamics and Megaherbivore Presence of MIS 3 Stadials and Interstadials 10–8 Obtained from a Sediment Core from Auel Infilled Maar, Eifel, Germany. Quaternary 2023, 6, 44. [Google Scholar] [CrossRef]
- Rasmussen, S.O.; Bigler, M.; Blockley, S.P.; Blunier, T.; Buchardt, S.L.; Clausen, H.B.; Cvijanovic, I.; Dahl-Jensen, D.; Johnsen, S.J.; Fischer, H.; et al. A Stratigraphic Framework for Abrupt Climatic Changes during the Last Glacial Period Based on Three Synchronized Greenland Ice-Core Records: Refining and Extending the INTIMATE Event Stratigraphy. Quat. Sci. Rev. 2014, 106, 14–28. [Google Scholar] [CrossRef]
- Svensson, A.; Andersen, K.K.; Bigler, M.; Clausen, H.B.; Dahl-Jensen, D.; Davies, S.M.; Johnsen, S.J.; Muscheler, R.; Parrenin, F.; Rasmussen, S.O.; et al. A 60,000 Year Greenland Stratigraphic Ice Core Chronology. Clim. Past. 2008, 4, 47–57. [Google Scholar] [CrossRef]
- North Greenland Ice Core Project Members. High-Resolution Record of Northern Hemisphere Climate Extending into the Last Interglacial Period. Nature 2004, 431, 147–151. [Google Scholar] [CrossRef] [PubMed]
- Sirocko, F.; Martínez-García, A.; Mudelsee, M.; Albert, J.; Britzius, S.; Christl, M.; Diehl, D.; Diensberg, B.; Friedrich, R.; Fuhrmann, F.; et al. Muted Multidecadal Climate Variability in Central Europe during Cold Stadial Periods. Nat. Geosci. 2021, 14, 651–658. [Google Scholar] [CrossRef]
- Sirocko, F.; Krebsbach, F.; Albert, J.; Britzius, S.; Schenk, F.; Förster, M.W. Relation between the Central European Climate Change and the Eifel Volcanism during the Last 130,000 Years: The ELSA-23 Tephra Stack. Preprints 2023, 2023121783. [Google Scholar] [CrossRef]
- Berglund, B.E.; Ralska-Jasiewiczowa, M. Pollen Analysis and Pollen Diagrams. In Handbook of Holocene Palaeoecology and Palaeohydrology; John Wiley and Sons Press: Chichester, UK, 1986; pp. 455–484. [Google Scholar]
- Faegri, K.; Iversen, J. Textbook of Pollen Analysis; John Wiley and Sons: Chichester, UK, 1989. [Google Scholar]
- Stockmarr, J. Tablets with Spores Used in Absolute Pollen Analysis. Pollen Spores 1971, XIII, 615–621. [Google Scholar]
- Appleby, P.G. Chronostratigraphic Techniques in Recent Sediments. In Tracking Environmental Change Using Lake Sediments; Last, W.M., Smol, J.P., Eds.; Developments in Paleoenvironmental Research; Kluwer Academic Publishers: Dordrecht, The Netherlands, 2001; Volume 1, pp. 171–203. ISBN 978-0-7923-6482-5. [Google Scholar]
- Rein, B.; Sirocko, F. In-Situ Reflectance Spectroscopy—Analysing Techniques for High-Resolution Pigment Logging in Sediment Cores. Int. J. Earth Sci. 2002, 91, 950–954. [Google Scholar] [CrossRef]
- Jacomet, S.; Kreuz, A. Archäobotanik; Ulmer: Stuttgart, Germany, 1999. [Google Scholar]
- Heinrich, H. Origin and Consequences of Cyclic Ice Rafting in the Northeast Atlantic Ocean during the Past 130,000 Years. Quat. Res. 1988, 29, 142–152. [Google Scholar] [CrossRef]
- Hemming, S.R. Heinrich Events: Massive Late Pleistocene Detritus Layers of the North Atlantic and Their Global Climate Imprint. Rev. Geophys. 2004, 42, RG1005. [Google Scholar] [CrossRef]
- Fuhrmann, F.; Seelos, K.; Sirocko, F. Eolian Sedimentation in Central European Auel Dry Maar from 60 to 13 Ka. Quat. Res. 2021, 101, 4–12. [Google Scholar] [CrossRef]
- Albert, J.; Sirocko, F. Evidence for an Extreme Cooling Event Prior to the Laschamp Geomagnetic Excursion in Eifel Maar Sediments. Quaternary 2023, 6, 14. [Google Scholar] [CrossRef]
- Bereiter, B.; Lüthi, D.; Siegrist, M.; Schüpbach, S.; Stocker, T.F.; Fischer, H. Mode Change of Millennial CO2 Variability during the Last Glacial Cycle Associated with a Bipolar Marine Carbon Seesaw. Proc. Natl. Acad. Sci. USA 2012, 109, 9755–9760. [Google Scholar] [CrossRef]
- McManus, J.F.; Bond, G.C.; Broecker, W.S.; Johnsen, S.; Labeyrie, L.; Higgins, S. High-Resolution Climate Records from the North Atlantic during the Last Interglacial. Nature 1994, 371, 326–329. [Google Scholar] [CrossRef]
- Chapman, M.R.; Shackleton, N.J. Global Ice-Volume Fluctuations, North Atlantic Ice-Rafting Events, and Deep-Ocean Circulation Changes between 130 and 70 Ka. Geology 1999, 27, 795. [Google Scholar] [CrossRef]
- Litt, T.; Schölzel, C.; Kühl, N.; Brauer, A. Vegetation and Climate History in the Westeifel Volcanic Field (Germany) during the Past 11,000 Years Based on Annually Laminated Lacustrine Maar Sediments. Boreas 2009, 38, 679–690. [Google Scholar] [CrossRef]
- Granoszewski, W. Late Pleistocene Vegetation History and Climatic Changes at Horoszki Duże, Eastern Poland: A Palaeobotanical Study. In Acta Palaeobotanica; Polish Academy of Sciences, W. Szafer Institute of Botany: Kraków, Poland, 2003; Volume Suppl. 4, p. 95. ISBN 83-89648-05-9. [Google Scholar]
- Kołaczek, P.; Karpińska-Kołaczek, M.; Petera-Zganiacz, J. Vegetation Patterns under Climate Changes in the Eemian and Early Weichselian in Central Europe Inferred from a Palynological Sequence from Ustków (Central Poland). Quat. Int. 2012, 268, 9–20. [Google Scholar] [CrossRef]
- Litt, T. Paläoökologie, Paläobotanik und Stratigraphie des Jungquartärs im Nordmitteleuropäischen Tiefland. Unter Besonderer Berücksichtigung des Elbe-Saale-Gebietes; Dissertationes Botanicae; Cramer: Berlin, Germany, 1994. [Google Scholar]
- Zagwijn, W.H. Vegetation, Climate and Radiocarbon Datings in the Late Pleistocene of the Netherlands: Eemian and Early Weichselian. Meded. Van. Geol. Sticht. Nieuwe Ser. 1961, 14, 15–45. [Google Scholar]
- Zagwijn, W. An Analysis of Eemian Climate in Western and Central Europe. Quat. Sci. Rev. 1996, 15, 451–469. [Google Scholar] [CrossRef]
- Kühl, N.; Litt, T. Quantitative Time Series Reconstruction of Eemian Temperature at Three European Sites Using Pollen Data. Veg. Hist. Archaeobotany 2003, 12, 205–214. [Google Scholar] [CrossRef]
- Tinner, W.; Bigler, C.; Gedye, S.; Gregory-Eaves, I.; Jones, R.T.; Kaltenrieder, P.; Krähenbühl, U.; Hu, F.S. A 700-year paleoecological record of boreal ecosystem responses to climatic variation from Alaska. Ecology 2008, 89, 729–743. [Google Scholar] [CrossRef]
- Wick, L.; Van Leeuwen, J.F.N.; Van Der Knaap, W.O.; Lotter, A.F. Holocene vegetation development in the catchment if Sägistalsee (1935 m asl), a small lake in the Swiss Alps. J. Paleolimnol. 2003, 30, 261–272. [Google Scholar] [CrossRef]
- Vansteenberge, S.; Verheyden, S.; Genty, D.; Blamart, D.; Goderis, S.; Van Malderen, S.J.M.; Vanhaecke, F.; Hodel, F.; Gillikin, D.; Ek, C.; et al. Characterizing the Eemian-Weichselian Transition in Northwestern Europe with Three Multiproxy Speleothem Archives from the Belgian Han-Sur-Lesse and Remouchamps Cave Systems. Quat. Sci. Rev. 2019, 208, 21–37. [Google Scholar] [CrossRef]
- Turner, C. Problems of the Duration of the Eemian Interglacial in Europe North of the Alps. Quat. Res. 2002, 58, 45–48. [Google Scholar] [CrossRef]
- Turner, C. Formal Status and Vegetational Development of the Eemian Interglacial in Northwestern and Southern Europe. Quat. Res. 2002, 58, 41–44. [Google Scholar] [CrossRef]
- Kukla, G.J.; Bender, M.L.; De Beaulieu, J.-L.; Bond, G.; Broecker, W.S.; Cleveringa, P.; Gavin, J.E.; Herbert, T.D.; Imbrie, J.; Jouzel, J.; et al. Last Interglacial Climates. Quat. Res. 2002, 58, 2–13. [Google Scholar] [CrossRef]
- Allen, J.R.M.; Watts, W.A.; Huntley, B. Weichselian Palynostratigraphy, Palaeovegetation and Palaeoenvironment; the Record from Lago Grande Di Monticchio, Southern Italy. Quat. Int. 2000, 73–74, 91–110. [Google Scholar] [CrossRef]
- Watts, W.A.; Allen, J.R.M.; Huntley, B. Vegetation history and palaeoclimate of the last glacial period at Lago Grande di Monticchio, southern Italy. Quat. Sci. Rev. 1996, 15, 133–153. [Google Scholar] [CrossRef]
- Magri, D. Late Quaternary Vegetation History at Lagaccione near Lago Di Bolsena (Central Italy). Rev. Palaeobot. Palynol. 1999, 106, 171–208. [Google Scholar] [CrossRef]
- Tzedakis, P.C.; Lawson, I.T.; Frogley, M.R.; Hewitt, G.M.; Preece, R.C. Buffered Tree Population Changes in a Quaternary Refugium: Evolutionary Implications. Science 2002, 297, 2044–2047. [Google Scholar] [CrossRef] [PubMed]
- Margari, V.; Gibbard, P.L.; Bryant, C.L.; Tzedakis, P.C. Character of Vegetational and Environmental Changes in Southern Europe during the Last Glacial Period; Evidence from Lesvos Island, Greece. Quat. Sci. Rev. 2009, 28, 1317–1339. [Google Scholar] [CrossRef]
- Müller, U.C.; Pross, J.; Bibus, E. Vegetation Response to Rapid Climate Change in Central Europe during the Past 140,000 Yr Based on Evidence from the Füramoos Pollen Record. Quat. Res. 2003, 59, 235–245. [Google Scholar] [CrossRef]
- Grant, K.M.; Rohling, E.J.; Ramsey, C.B.; Cheng, H.; Edwards, R.L.; Florindo, F.; Heslop, D.; Marra, F.; Roberts, A.P.; Tamisiea, M.E.; et al. Sea-Level Variability over Five Glacial Cycles. Nat. Commun. 2014, 5, 5076. [Google Scholar] [CrossRef]
- Martrat, B.; Grimalt, J.O.; Shackleton, N.J.; de Abreu, L.; Hutterli, M.A.; Stocker, T.F. Four Climate Cycles of Recurring Deep and Surface Water Destabilizations on the Iberian Margin. Science 2007, 317, 502–507. [Google Scholar] [CrossRef]
- Berger, A.; Loutre, M.F. Insolation Values for the Climate of the Last 10 Million Years. Quat. Sci. Rev. 1991, 10, 297–317. [Google Scholar] [CrossRef]
- Helmens, K.F.; Engels, S. Ice-free Conditions in Eastern Fennoscandia during Early Marine Isotope Stage 3: Lacustrine Records. Boreas 2010, 39, 399–409. [Google Scholar] [CrossRef]
- Kappenberg, A.; Amelung, W.; Conze, N.; Sirocko, F.; Lehndorff, E. Fire–Vegetation Relationships during the Last Glacial Cycle in a Low Mountain Range (Eifel, Germany). Palaeogeogr. Palaeoclimatol. Palaeoecol. 2021, 562, 110140. [Google Scholar] [CrossRef]
- Goñi, M.F.S. The Climatic and Environmental Context of the Late Pleistocene. In Updating Neanderthals; Elsevier: Amsterdam, The Netherlands, 2022; pp. 17–38. ISBN 978-0-12-821428-2. [Google Scholar]
- Goñi, M.F.S.; Landais, A.; Fletcher, W.J.; Naughton, F.; Desprat, S.; Duprat, J. Contrasting Impacts of Dansgaard–Oeschger Events over a Western European Latitudinal Transect Modulated by Orbital Parameters. Quat. Sci. Rev. 2008, 27, 1136–1151. [Google Scholar] [CrossRef]
- Helmens, K.F. The Last Interglacial–Glacial Cycle (MIS 5–2) Re-Examined Based on Long Proxy Records from Central and Northern Europe. Quat. Sci. Rev. 2014, 86, 115–143. [Google Scholar] [CrossRef]
- Woillard, G.M.; Mook, W.G. Carbon-14 Dates at Grande Pile: Correlation of Land and Sea Chronologies. Science 1982, 215, 159–161. [Google Scholar] [CrossRef] [PubMed]
- Hajdas, I.; Ascough, P.; Garnett, M.H.; Fallon, S.J.; Pearson, C.L.; Quarta, G.; Spalding, K.L.; Yamaguchi, H.; Yoneda, M. Radiocarbon Dating. Nat. Rev. Methods Primer 2021, 1, 62. [Google Scholar] [CrossRef]
- Behre, K.-E.; Hölzer, A.; Lemdahl, G. Botanical Macro-Remains and Insects from the Eemian and Weichselian Site of Oerel (Northwest Germany) and Their Evidence for the History of Climate. Veg. Hist. Archaeobotany 2005, 14, 31–53. [Google Scholar] [CrossRef]
- Lisiecki, L.E.; Raymo, M.E. A Pliocene-Pleistocene Stack of 57 Globally Distributed Benthic δ 18O Records. Paleoceanography 2005, 20, PA1003. [Google Scholar] [CrossRef]
- Menviel, L.C.; Skinner, L.C.; Tarasov, L.; Tzedakis, P.C. An Ice–Climate Oscillatory Framework for Dansgaard–Oeschger Cycles. Nat. Rev. Earth Environ. 2020, 1, 677–693. [Google Scholar] [CrossRef]
- Böhm, E.; Lippold, J.; Gutjahr, M.; Frank, M.; Blaser, P.; Antz, B.; Fohlmeister, J.; Frank, N.; Andersen, M.B.; Deininger, M. Strong and Deep Atlantic Meridional Overturning Circulation during the Last Glacial Cycle. Nature 2015, 517, 73–76. [Google Scholar] [CrossRef] [PubMed]
- Rahmstorf, S. Ocean Circulation and Climate during the Past 120,000 Years. Nature 2002, 419, 207–214. [Google Scholar] [CrossRef] [PubMed]
- Rahmstorf, S. Timing of Abrupt Climate Change: A Precise Clock. Geophys. Res. Lett. 2003, 30, pagination. [Google Scholar] [CrossRef]
- Grootes, P.M.; Stuiver, M. Oxygen 18/16 Variability in Greenland Snow and Ice with 10−3- to 105-year Time Resolution. J. Geophys. Res. Oceans 1997, 102, 26455–26470. [Google Scholar] [CrossRef]
- Schulz, M. On the 1470-year Pacing of Dansgaard-Oeschger Warm Events. Paleoceanography 2002, 17, 4-1–4-9. [Google Scholar] [CrossRef]
- Sirocko, F.; Garbe-Schönberg, D.; McIntyre, A.; Molfino, B. Teleconnections Between the Subtropical Monsoons and High-Latitude Climates During the Last Deglaciation. Science 1996, 272, 526–529. [Google Scholar] [CrossRef]
- Bond, G.; Kromer, B.; Beer, J.; Muscheler, R.; Evans, M.N.; Showers, W.; Hoffmann, S.; Lotti-Bond, R.; Hajdas, I.; Bonani, G. Persistent Solar Influence on North Atlantic Climate During the Holocene. Science 2001, 294, 2130–2136. [Google Scholar] [CrossRef]
- Debret, M.; Bout-Roumazeilles, V.; Grousset, F.; Desmet, M.; McManus, J.F.; Massei, N.; Sebag, D.; Copard, Y.; Trentesaux, A. The Origin of the 1500-Year Climate Cycles in Holocene North-Atlantic Records. Clim. Past 2007, 3, 569–575. [Google Scholar] [CrossRef]
- Kelsey, A.M.; Menk, F.W.; Moss, P.T. An Astronomical Correspondence to the 1470 Year Cycle of Abrupt Climate Change. Clim. Past Discuss. 2015, 11, 4895–4915. [Google Scholar]
- Braun, H.; Christl, M.; Rahmstorf, S.; Ganopolski, A.; Mangini, A.; Kubatzki, C.; Roth, K.; Kromer, B. Possible Solar Origin of the 1470-Year Glacial Climate Cycle Demonstrated in a Coupled Model. Nature 2005, 438, 208–211. [Google Scholar] [CrossRef] [PubMed]
- Ditlevsen, P.D.; Andersen, K.K.; Svensson, A. The DO-Climate Events Are Probably Noise Induced: Statistical Investigation of the Claimed 1470 Years Cycle. Clim. Past 2007, 3, 129–134. [Google Scholar] [CrossRef]


| Drilled Maar Structure | Core ID | Core Length [m] | Height above Sea Level [m] | Covered Time Span (This Study) [yr b2k] | WGS84 Coordinates | Publication |
|---|---|---|---|---|---|---|
| Schalkenmehrener Maar | SMf1 | 2.08 | 420.00 | 210–14 | 50.16995683, 6.85756763 | [3] |
| Schalkenmehrener Maar | SMf2 | 2.06 | 420.00 | 606–213 | 50.16950876, 6.857559607 | [3] |
| Holzmaar | HM1 | 10.00 | 448.00 | 13,200–686 | 50.11916019, 6.87881555 | [1] |
| Holzmaar | HM4 | 11.27 | 448.00 | 14,700–3500 | 50.11934408, 6.879159476 | [4], this study |
| Auel Maar | AU3 | 102.00 | 456.00 | 56,100–16,500 | 50.28246449, 6.595057816 | [4,9] |
| Auel Maar | AU4 | 104.50 | 457.00 | 58,400–17,500 | 50.28211298, 6.594933478 | [4,9] |
| Jungferweiher | JW2 | 155.50 | 432.00 | 114,600–9000 | 50.21897165, 6.974133842 | This study |
| Jungferweiher | JW3 | 156.00 | 432.00 | 132,000–22,600 | 50.21973162, 6.975028664 | This study |
| Dehner Maar | DE2 | 49.50 | 565.00 | 28,100–27,200 | 50.29328519, 6.506140092 | This study |
| Dehner Maar | DE3 | 88.00 | 565.37 | 75,300–12,800 | 50.29281306, 6.506597466 | [1] |
| Hoher List | HL2 | 104.00 | 402.50 | 130,100–74,800 | 50.16409175, 6.835669707 | [2] |
| Hoher List | HL4 | 62.00 | 400.00 | 116,800–46,300 | 50.16435909, 6.835054596 | This study |
| Trees and shrubs | Abies, Picea, Pinus, Betula, Alnus, Corylus, Carpinus, Quercus, Tilia, Ulmus, Fraxinus, Fagus, Taxus, Salix, Juniperus, Juglans |
| Boreal forest | Abies, Picea, Pinus, Betula sect. alba |
| Temperate forest | Alnus, Corylus, Carpinus, Quercus, Tilia, Ulmus, Fraxinus, Fagus, Taxus |
| Steppe | Poaceae, Ericaceae, Artemisia, Caryophyllaceae, Chenopodiaceae, Ranunculaceae, Apiaceae, Tubuliflorae, Liguliflorae |
| Anthropogenic indicators | Cerealia, Secale, Fagopyrum, Juglans, Plantaginaceae, Humulus, Urtica, Rumex |
Disclaimer/Publisher’s Note: The statements, opinions and data contained in all publications are solely those of the individual author(s) and contributor(s) and not of MDPI and/or the editor(s). MDPI and/or the editor(s) disclaim responsibility for any injury to people or property resulting from any ideas, methods, instructions or products referred to in the content. |
© 2024 by the authors. Licensee MDPI, Basel, Switzerland. This article is an open access article distributed under the terms and conditions of the Creative Commons Attribution (CC BY) license (https://creativecommons.org/licenses/by/4.0/).
Share and Cite
Britzius, S.; Dreher, F.; Maisel, P.; Sirocko, F. Vegetation Patterns during the Last 132,000 Years: A Synthesis from Twelve Eifel Maar Sediment Cores (Germany): The ELSA-23-Pollen-Stack. Quaternary 2024, 7, 8. https://doi.org/10.3390/quat7010008
Britzius S, Dreher F, Maisel P, Sirocko F. Vegetation Patterns during the Last 132,000 Years: A Synthesis from Twelve Eifel Maar Sediment Cores (Germany): The ELSA-23-Pollen-Stack. Quaternary. 2024; 7(1):8. https://doi.org/10.3390/quat7010008
Chicago/Turabian StyleBritzius, Sarah, Frank Dreher, Patricia Maisel, and Frank Sirocko. 2024. "Vegetation Patterns during the Last 132,000 Years: A Synthesis from Twelve Eifel Maar Sediment Cores (Germany): The ELSA-23-Pollen-Stack" Quaternary 7, no. 1: 8. https://doi.org/10.3390/quat7010008